Embed Size (px)
Citation preview
TrendsIn recent years, the global climate haschanged, resulting in drastic fluctua-tions in rainfall patterns and increasingtemperature. Sudden climate changescan cause [67_TD$DIFF]significant economic lossesto countries worldwide.
Genetic improvement of several eco-nomically important crops during the20th century using phenotypic, pedi-gree, and performance data was verysuccessful. However, signs of grainyield stagnation in some crops, espe-cially in drought-stressed and semi-arid regions, are evident.
Genomic selection offers the opportu-nity to increase grain production in lesstime. International Maize and WheatImprovement Center (CIMMYT) maizebreeding research in Sub-SaharanAfrica, India, and Mexico has shownthat genomic selection can reduce thebreeding interval cycle to at least halfthe conventional time and produceslines that, in hybrid combinations, sig-nificantly increase grain yield perfor-mance over that of commercialchecks.
Public and private investment in cropgenomic selection research shouldincrease to successfully develop in lesstime germplasm that is adapted tosudden climate change.
TRPLSC 1594 No. of Pages 15
Feature ReviewGenomic Selection in PlantBreeding: Methods, Models,and PerspectivesJosé Crossa,1,* Paulino Pérez-Rodríguez,2 Jaime Cuevas,3
Osval Montesinos-López,4 Diego Jarquín,5
Gustavo de los Campos,6 Juan Burgueño,1
Juan M. González-Camacho,2 Sergio Pérez-Elizalde,2
Yoseph Beyene,1 Susanne Dreisigacker,1 Ravi Singh,1
Xuecai Zhang,1 Manje Gowda,1 Manish Roorkiwal,7
Jessica Rutkoski,8 and Rajeev K. Varshney7,*
Genomic selection (GS) facilitates the rapid selection of superior genotypesand accelerates the breeding cycle. In this review, we discuss the history,principles, and basis of GS and genomic-enabled prediction (GP) as well as thegenetics and statistical complexities of GP models, including genomic geno-type � environment (G � E) interactions. We also examine the accuracy of GPmodels and methods for two cereal crops and two legume crops based onrandom cross-validation. GS applied to maize breeding has shown tangiblegenetic gains. Based on GP results, we speculate how GS in germplasmenhancement (i.e., prebreeding) programs could accelerate the flow of genesfrom gene bank accessions to elite lines. Recent advances in hyperspectralimage technology could be combinedwith GS and pedigree-assisted breeding [66_TD$DIFF].
The Role of Genomic-Enabled Prediction in Plant BreedingBeginning during the 1980s, the development of different molecular marker systems drasticallyincreased the total number of polymorphic markers available to plant breeders, and tomolecular biologists in general. The most notable high-throughput genotyping (HTG) systemis single nucleotide polymorphisms (SNPs), which have been used intensively in quantitativetrait locus (QTL; see Glossary) discovery. More than 10 000 QTLs using different markersystems have been reported in more than 120 studies covering 12 plant species [1] that aimedto improve quantitative traits of economic importance. Initially, molecular markers were inte-grated in traditional phenotypic selection (PS) by applyingmarker-assisted selection (MAS).For simple traits, MAS comprises selecting individuals with QTL-associated markers that havemajor effects; markers not significantly associated with a trait are not used. However, attemptsto improve complex quantitative traits by using QTL-associated marker detection have beenunsuccessful due to the difficulty of finding the same QTL across multiple environments (due toQTL � environment interactions) or in different genetic backgrounds [2].
Linkage analysis for QTL mapping is done on biparental populations, but has low power fordetecting marker–trait association due to chromosomes with low recombination rates. There-fore, association mapping started during the early 2000s with the objective of overcoming thelow power of linkage analysis, thus facilitating the detection of marker–trait associations in
Trends in Plant Science, Month Year, Vol. xx, No. yy http://dx.doi.org/10.1016/j.tplants.2017.08.011 1© 2017 Elsevier Ltd. All rights reserved.

TRPLSC 1594 No. of Pages 15
1International Maize and WheatImprovement Center (CIMMYT), Apdo.Postal 6-641, 06600, Mexico City,Mexico2Colegio de Postgraduados,Montecillo, Texcoco, 56230, Edo. deMexico, Mexico3Universidad de Quintana Roo,Quintana Roo, 77019, Mexico4Facultad de Telemática, Universidadde Colima, [61_TD$DIFF]Colima, 28040, Mexico5Department of Agronomy andHorticulture, University of Nebraska-Lincoln, 321 Keim Hall, Lincoln, NE68503-0915, USA6Department of Epidemiology &Biostatistics, Michigan StateUniversity, 909 Fee Road, RoomB601, East Lansing, MI 48824, USA7International [63_TD$DIFF]Crops Research Institutefor the Semi-Arid Tropics (ICRISAT),Patancheru 502 324, Telangana, India8International Rice Research Institute,Los Baños, [64_TD$DIFF]4030, Philippines
*Correspondence:[email protected] (J. Crossa) [email protected](R.K. Varshney).
nonbiparental populations and fine-mapping chromosome segments with high recombinationrates. However, the main problem of fine-association mapping is the low power for detectingrare variants that may be associated with economically important traits [2]. Thus, the challengeof association mapping and QTL detection resides in identifying and quantifying rare QTLs withsmall effects for economically important traits that are highly affected by the environment.However, because the cost of SNP assays has dramatically decreased, the possibility of usinghigh-density SNP arrays (tens of thousands) has resulted in the development of statisticalmodels to predict marker–trait association accurately, depending on the genetic architecture ofthe predicted trait.
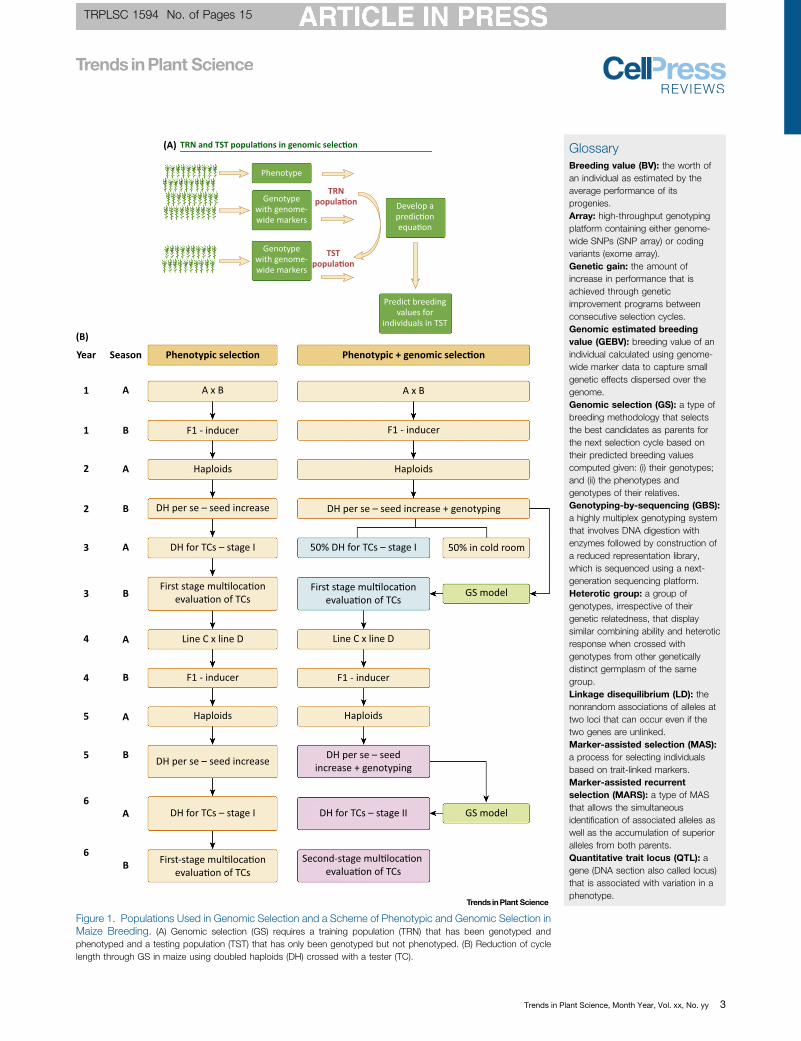
Contrary to QTL and association mapping, GS uses all molecular markers for GP of theperformance of the candidates for selection. Therefore, the aim of GS is to predict breedingand/or genetic values. GS combines molecular and phenotypic data in a training population(TRN) to obtain the genomic estimated breeding values ([69_TD$DIFF]GEBVs’) of individuals in a testingpopulation (TST) that have been genotyped but not phenotyped [3]. Figure 1A depicts the twobasic populations in a GS program: the TRN data, whose phenotype and genotype are known,and the TST data, whose genetic values are to be predicted. GS is used in place of phenotypingfor a few selection cycles. The main advantages of GS over phenotype-based selection inbreeding are that it reduces the cost per cycle and the time required for variety development. Interms of cost reduction in maize breeding, the breeder can testcross 50% of all available lines,evaluating them in first-stage multi-locational trials, and can then use the phenotypic data topredict the remaining 50% by GS. Figure 1B shows the advantage of GS over PS for: (i)reducing costs, up to 50%; and (ii) saving time by selecting lines directly for stage II insteadgoing through stage I (used in PS). This significantly reduces the cost of testcross formation andevaluation at each stage of multi-location evaluations. The time efficiency over PS could comefrom the second cycle of selection, which uses the TRN from the previous cycle to predict thenew doubled haploid (DH) lines, thus excluding testcross formation and first-stage multi-location evaluation trials. Based on GS, the best lines could go directly to the second stageof multi-location evaluations.
GS predicts the breeding values (BVs) of the candidates for selection. BVs have two compo-nents: the parental average (the mean BV of both parents) and the deviation of progenyperformance from this average that is due to Mendelian sampling. In conventional breeding, theparental average is quantified by pedigree information (if the genealogy is available), from whicha relationship matrix A between the individuals can be derived. Mendelian sampling assesseswithin-family variation that is quantified by testing the progeny in multienvironment field trials.GS takes advantage of dense markers to quantify Mendelian sampling, thus avoiding the needto extensively phenotype the progeny. This saves time by reducing the cycle length, whileenhancing the expected genetic gain and the selection response per unit time; it also [70_TD$DIFF]usesless resources compared with extensive phenotyping. GS has the potential to quickly improvecomplex traits with low heritability as well as to significantly reduce the cost of line and hybriddevelopment. GS can also be used for simple traits with higher heritability than complex traits,for which high GP accuracy is expected. The application of GS in plant breeding could belimited by two main factors: (i) genotyping costs; and (ii) unclear guidelines as to where GS canbe efficiently applied in a breeding program.
GS and GP have been applied using two different approaches. One focuses on predictingadditive effects in early generations of a breeding program (F2:3) to achieve a rapid selectioncycle with a short interval (i.e., GS at the F2 level of a biparental cross). In this case, researchersare interested in predicting the additive values (BVs) rather than the total genetic value;therefore, additive linear models that summarize the effects of the markers are sufficient.The other approach predicts the complete genetic values of individuals considering both
2 Trends in Plant Science, Month Year, Vol. xx, No. yy
TRPLSC 1594 No. of Pages 15
GlossaryBreeding value (BV): the worth ofan individual as estimated by theaverage performance of itsprogenies.Array: high-throughput genotypingplatform containing either genome-wide SNPs (SNP array) or codingvariants (exome array).Genetic gain: the amount ofincrease in performance that isachieved through geneticimprovement programs betweenconsecutive selection cycles.Genomic estimated breedingvalue (GEBV): breeding value of anindividual calculated using genome-wide marker data to capture smallgenetic effects dispersed over thegenome.Genomic selection (GS): a type ofbreeding methodology that selectsthe best candidates as parents forthe next selection cycle based ontheir predicted breeding valuescomputed given: (i) their genotypes;and (ii) the phenotypes andgenotypes of their relatives.Genotyping-by-sequencing (GBS):a highly multiplex genotyping systemthat involves DNA digestion withenzymes followed by construction ofa reduced representation library,which is sequenced using a next-generation sequencing platform.Heterotic group: a group ofgenotypes, irrespective of theirgenetic relatedness, that displaysimilar combining ability and heteroticresponse when crossed withgenotypes from other geneticallydistinct germplasm of the samegroup.Linkage disequilibrium (LD): thenonrandom associations of alleles attwo loci that can occur even if thetwo genes are unlinked.Marker-assisted selection (MAS):a process for selecting individualsbased on trait-linked markers.Marker-assisted recurrentselection (MARS): a type of MASthat allows the simultaneousidentification of associated alleles aswell as the accumulation of superioralleles from both parents.Quantitative trait locus (QTL): agene (DNA section also called locus)that is associated with variation in aphenotype.
(A)
Phenotype
TRNpopula�on
TSTpopula�on
Genotypewith genome-wide markers
Develop apredic�onequa�on
Predict breedingvalues for
individuals in TST
Genotypewith genome-wide markers
TRN and TST popula�ons in genomic selec�on
(B)
Phenotypic selec�on Phenotypic + genomic selec�onYear
1
1
2
2
3
3
4
4
5
5
6
6B
B
B
B
B
B
A
A
A
A
A
A A x B A x B
F1 - inducer F1 - inducer
Haploids Haploids
Haploids Haploids
DH per se – seed increase
DH per se – seed increase
DH per se – seed increase + genotyping
DH per se – seedincrease + genotyping
DH for TCs – stage I
DH for TCs – stage I DH for TCs – stage II GS model
GS model
50% in cold room50% DH for TCs – stage I
First stage mul�loca�onevalua�on of TCs
First stage mul�loca�onevalua�on of TCs
First-stage mul�loca�onevalua�on of TCs
Second-stage mul�loca�on evalua�on of TCs
Line C x line D Line C x line D
F1 - inducer F1 - inducer
Season
Figure 1. [58_TD$DIFF] Populations Used in Genomic Selection and a Scheme of Phenotypic and Genomic Selection inMaize Breeding. (A) Genomic selection (GS) requires a training population (TRN) that has been genotyped andphenotyped and a testing population (TST) that has only been genotyped but not phenotyped. (B) Reduction of cyclelength through GS in maize using doubled haploids (DH) crossed with a tester (TC).
Trends in Plant Science, Month Year, Vol. xx, No. yy 3
TRPLSC 1594 No. of Pages 15
additive and nonadditive (dominance and epistasis) effects, thereby estimating the perfor-mance (commercial value) of the cultivars. Genetic values of lines are predicted for someenvironments using an incomplete (sparse) multienvironment testing scheme.
Several genetic and statistical factors complicate the practical application of GP. Geneticdifficulties arise from the size and diversity of the TRN population and the heritability of the traitsto be predicted. Statistical challenges are related to the high dimensionality of marker data,where the number of markers (p) is much larger than the number of observations (n) (p>>n) andthe multicolinearity among markers (adjacent markers are highly correlated). For more details,see ‘The complexity of genomic selection and prediction’ and ‘Solution to an inverse problem’
in the supplementary information online.
Here, we review advances in GS and GP theory in light of the above considerations andevaluate recent examples from GP applied to cereal and legume breeding programs. Wedescribe the evolution and main features of GP models, including complexities, strengths, andweaknesses. We then illustrate the use of GP using examples from crop breeding programswith genomic G � E interactions, as well as results of genetic gains from rapid cycle GS inmaize. We also speculate on the prospects for GS and GP in plant breeding. Most of the resultspresented in this review include studies performed on maize and wheat from the InternationalMaize andWheat Improvement Center (CIMMYT), as well as on chickpea from the International[63_TD$DIFF]Crops Research Institute for the Semi-Arid Tropics (ICRISAT)
Genomic-Enabled Prediction Models and Applications: Coping withComplexityThe complexity of applying GP in breeding occurs at different levels and is influenced by severalfactors. When a trait is affected by a large number of loci, GP accuracy depends on severalgenetic factors: (i) the size and genetic diversity of the TRN population and its relationship withthe TST population [4]; that is, whether the cultivars in the TRN are relatives (close and/ordistant) of cultivars in the TST set; (ii) the heritability of the trait(s) under selection [complex traitswith low heritability and small marker effects are suitable for GS and GP, whereas less complextraits (with high heritability) can be predicted by a few markers with relatively large effects); and(iii) for complex traits with large numbers of markers that are not in linkage disequilibrium (LD)with the QTL, GP accuracy is lower [5] and increases when the heritability and TRN sizeincrease. Studies have shown the importance of selecting an appropriate TRN population thatoptimizes the accuracy of the predictions of the nonphenotyped cultivars in the TST set [6].Depending on the trait, the increase in GP accuracy reaches a plateau as the population sizeincreases. A similar trend was found for the number of markers [7,8].
One important genetic-statistical complexity of GP models arises when predicting nonphe-notyped individuals in specific environments (site–year combinations) by incorporating G � Einteractions into the statistical models. Equally important is the genomic complexity related toG � E interactions for multi-traits; these interactions create trait and environmental structuresthat should be dealt with by using statistical-genetic models that exploit multi-trait, multi-environment variance-covariance and genetic correlations between environments, betweentraits, and between traits and environments, simultaneously. Untangling the complexity ofmulti-trait genomics and multiple environments requires a theoretical framework that accountsfor these complex interactions [9] (see ‘Bayesian multi-trait multienvironment genomic modelfor normal phenotypes’ in the supplementary information online). Interestingly, the use of GP toimprove disease resistance has been challenging in wheat for two reasons: (i) selection formajor resistance genes can be ephemeral due to changes in pathogen races; and (ii) breedingfor minor resistance genes with small effects throughout GS (which provides durable resis-tance) may face the usual complexities encountered in GS [10].
4 Trends in Plant Science, Month Year, Vol. xx, No. yy

TRPLSC 1594 No. of Pages 15
Another level of complexity occurs in GS statistical prediction models because the number ofmarkers (p) is larger than the population size (n) and the predictors (markers) are highlycorrelated. This situation results in a matrix of predictors that is rank deficient, making itimpossible to compute least-square estimates for marker effects. The complexity arises fromfactors such as the course of dimensionality [11]; that is, under models with p>>n, which arenot likelihood identified and are prone to overfitting, spurious features and data structures maybe captured (see ‘The complexity of genomic selection and prediction’ and ‘Solution to aninverse problem’ in the supplementary information online). Solutions to these problems includethe use of: (i) penalized regression; (ii) variable selection; and (iii) dimensionality reduction (e.g.,principal components), such that a new set of predictors that are not correlated is generatedfrom the original one (markers), thus allowing the use of univariate distributions and decreasingthe computation time of the estimates and the prediction [12]. A fourth solution is to usestatistical models that assess GP complexities and high-density marker platforms with G � Einteractions, thereby adding power to the GP models (see the next section).
GP models based on basic quantitative genetics describe the phenotypic response as the sumof a genetic value (linear additive models) and a residual value. A large body of GP research hasfocused on developing efficient parametric and nonparametric statistical and computationalmodels with increased accuracy for predicting nonphenotyped genotypes [13]. In general,these theoretical studies show reasonably good prediction accuracies for complex traits suchas grain yield and other traits evaluated by means of independent random cross-validation datapartitioning. In contrast to the widespread use of GP to predict the performance of one trait inthe TST populations using data from the same trait observed in the TRN populations, thecomplexity of extending this to multi-trait GP indices has not received much attention, exceptfor a method proposed by Cerón-Rojas et al. [14] that is based on the multi-trait Genomic BestLinear Unbiased Estimator (GBLUP) selection index, which worked well when applied tosimulated and real data sets.
With advances in GS and GP, data volumes and complexity have increased dramatically,leading to novel interdisciplinary research efforts to integrate computer science, machinelearning, mathematics, physics, statistics, genetics and quantitative genetics, and bioinfor-matics. Such work has emerged as a new field of research (commonly known as ‘data science’or data-driven science) that aims to unify statistics with data analysis, data mining, and so on.The interdisciplinary researchers in data science focus on computing more accurate predictivevalues by using statistical models or machine-learning models (R. McDowell, MSc thesis[71_TD$DIFF], IowaState University, 2016). Neural network methods are common prediction tools in machinelearning. Neural networks comprise layers of interconnected neurons, where the output of eachneuron is expressed as the sum of a certain number of inputs to a neuron located in a specificnetwork layer, with a weight plus a bias; the sum of all inputs is weighted by an activationfunction.
When neural networks are applied to GP, the input layer is each marker with one neuron permarker; each of the neurons (markers) in the input layer is connected to all the neurons in thefirst hidden layer, and these are connected to all neurons in the second hidden layer, and so on,up to the output layer, which is one hidden neuron layer with the prediction of each of thephenotypes. Recent developments in neural networks and speedier computer processing haveallowed the addition of new layers to the neural network (deep machine learning) to capturesmall cryptic correlations between inputs [15], which in GP are interactions between markers.Initial applications of machine-learning and neural networks in GP were demonstrated byGianola et al. [16,17], González-Camacho et al. [18,19], Pérez-Rodríguez et al. [20], Ornellaet al., [21], and González-Recio et al. [22]. Recent results for deep machine learning applied toGP can be found elsewhere (R. McDowell, MSc thesis[71_TD$DIFF], Iowa State University, 2016).
Trends in Plant Science, Month Year, Vol. xx, No. yy 5
TRPLSC 1594 No. of Pages 15
The Accuracy of GP Models, and Genetic Gains Achieved by GSTheGPmodels assess different prediction problems that attempt tomimic what happenswhenpredictions are made in real situations. Different random cross-validation schemes have beendesigned to simulate the prediction problems that researchers may face when performing GS.There are four basic scenarios arising from combinations of tested (observed) lines (LT),untested (unobserved) lines (LU) with tested (observed) environment (ET), or untested (unob-served) environments (EU). Predicting newly developed lines (or cultivars) in environmentswhere they were not tested is a case of LU-ET (random cross-validation 1, CV1). Anotherproblem is to predict lines in some environments but not in others; this is LT-ET (random cross-validation 2, CV2), which attempts tomimic one of the objectives of GP: sparse testing. Anotherproblem comprises predicting lines in untested environments; that is, LT-EU (random cross-validation 0, CV0). Finally, there is the problem of predicting lines never observed in never-observed environments, LU-EU (cross-validation 00, CV00) [23–27].
Simulation and empirical results obtained by random cross-validation suggest that GS enhan-ces genetic gains by shortening the breeding cycle (rapid selection cycle) and/or enhancingtesting efficiency in field evaluations [3,28–31]. Results of using random cross-validation onmaize and wheat breeding data indicate that GS can significantly enhance prediction accuracyrelated to pedigree andMAS for low-heritability traits [13,18–20,32–43]. Results of applying GSin maize and wheat breeding indicate its effectiveness in selection [44–48].
Breeding programs worldwide have been studying and applying GS and GP in several crops. Inparallel, extensive research has resulted in novel statistical methods that incorporate pedigree,genomic, and environmental covariates (e.g., weather data) into statistical-genetic predictionmodels. GBLUP models [49,50] are widely used in GP, and the extension of GBLUP forincorporating G � E interactions has improved the accuracy of predicting unobserved cultivarsin environments [23,24,51–56]. New models for assessing the GP accuracy of discreteresponse variables (e.g., ordinal disease data, such as rates, count data, and so on) wereproposed [57–61] together with Bayesian genomic models for analyzing multiple traits andmultiple environments. A computationally efficient Markov Chain Monte Carlo (MCMC) methodthat produces full conditional distributions of the parameters, leading to exact Gibbs samplingfor the posterior distribution, has also been developed [9]. Results from simulated and (two)extensive data sets show that, when the correlation between the traits is high, a proposedmodel with an unstructured covariance matrix is preferred over the diagonal and standardmethods to help improve the prediction accuracy for grain yield. However, when correlationsare low, it is enough to use the standard model [9].
Depending on the complexity of the trait and the prediction scenario, more sophisticatedmodels result in moderate-to-high gains in prediction accuracy. In several studies, complexmodels increased prediction accuracy by >10% at no additional cost. The use of simplemodels may miss important data features and cause losses of prediction accuracy for complextraits, where nonlinear models usually give significantly higher prediction accuracy than linearmodels [20,36,55,56]. One of the first assessments of GP in wheat breeding was performed ona collection of 599 wheat lines evaluated in four environments using pedigree and genomicinformation with two different models [34]. Themodels were the standardGBLUPwith the lineargenomic matrix G and a nonparametric model, Reproducing Kernel Hilbert Spaces (RKHS)regression with a nonlinear genomic matrix, the Gaussian kernel (GK) [62]. The most complexmodel, RKHS using a GK nonlinear kernel, including pedigree andmarker information, gave thehighest prediction accuracy, ranging from 15% to 36%, with respect to the pedigree modelalone. The GP model RKHS with GK, pedigree, and markers has been used for predictingresistance to leaf, stem, and stripe rust, septoria, tan spot, and Stagonospora nodorum blotch
6 Trends in Plant Science, Month Year, Vol. xx, No. yy

TRPLSC 1594 No. of Pages 15
in wheat; compared with standard least-squares multiple regression methods, RKHS gaveincreases in accuracy of 42% and 48% in the two reported studies [63,64], respectively.
Based on the encouraging results obtained in somemajor cereals, preliminary steps have beentaken to deploy GS to develop superior lines more quickly and enhance the rate of genetic gainin a few legume crops, such as pea, soybean, chickpea, groundnut, and pigeon pea [65]. Therecent availability of cost-effective, high-throughput sequencing has facilitated the develop-ment of large-scale genomic resources in most legumes. Soybean was the first legume cropwhere GS was deployed for improving yield and agronomic traits using genotyping-by-sequencing (GBS) in a breeding program [25]. To assess the utility of GS in soybean breedingprograms and understand the effect of marker selection and genotype imputation, predictionaccuracies were calculated for two genomic prediction models, namely, the standard GBLUPmodel with additive effects and an extended GBLUP with additive-by-additive epistasis. Highprediction accuracy (0.64) indicated the potential of using GS to improve grain yield [25].
In the case of chickpea, a collection of 320 elite breeding lines was genotyped using DiversityArray technology (DArTseq) and phenotyped for yield-related traits in two environments withtwo different treatments (i.e., rainfed and irrigated) in two different seasons [65,66]. Variousstatistical models (RR-BLUP, Kinship GAUSS, Bayes Cp, Bayes B, Baysian LASSO, andrandom forest regression or RFR) resulted in high prediction accuracies for the traits of interest;however, not much variation in prediction accuracy among the different models was observed[65,66]. When population structure was included in the model, prediction accuracies improvedslightly for days to maturity (DM), days to flowering (DF), and seed dry weight (SDW), but not forseed yield (SY).
In general, early statistical models developed for GP in animal breeding were based on single-environment assessments. However, in plant breeding, G � E interactions are of paramountimportance. Just as G � E interactions are a fundamental challenge in plant breeding, they arealso increasingly recognized as a major complexity in GP models.
GP Incorporating Genotype � Environment InteractionIncluding high-density marker platforms with G � E interactions increases the accuracy of GPmodels; this has been extensively studied in bread wheat, maize, and legumes [23–27,55,56,67]. In all GP models that incorporate G � E interactions, accuracy with respectto single-environment analyses increased 10–40% on average in all three crop species. Themain models used to assess GP accuracy by incorporating G � E interactions and theirapplication to real data are described below.
Multienvironment trials for assessing G � E interactions have an important role in plant breedingfor selecting high-performing and stable lines across environments. Burgueño et al. [23] werethe first to use marker- and pedigree-based GBLUP models for assessing G � E interactionsunder genomic prediction, while Heslot et al. [52] incorporated crop-modeling data to studygenomic G � E interactions. A reaction norm model, where the main and interaction effects ofmarkers and environmental covariates are introduced using high-dimensional random vari-ance-covariance structures of markers and environmental covariates, was developed byJarquín et al. [24] as an extension of the well-known GBLUP model.
The baseline model for phenotypes evaluated in different environments (yij) can be describedusing Equation 1:yij ¼ mþ Ei þ Lj þ ELij þ eij ½1�;
Trends in Plant Science, Month Year, Vol. xx, No. yy 7

TRPLSC 1594 No. of Pages 15
where m is the overall mean, Ei (i=1, . . . ,I) is the random effect of the ith [59_TD$DIFF] environment, Lj is therandom effect of the jth line ( j=1, . . . ,J), ELij is the interaction between the ith environment andthe jth line, and eij is the random error term. The assumptions are as follows: Ei�iidN 0; s2
E
� �,
Lj�iidN 0; s2L
� �, ELij�iidN 0; s2
EL
� �, and eij�iidN 0; s2
e
� �, with N(.,.) denoting a normal distribution, and
‘iid’ standing for independent and identically distributed. However, when the number ofenvironments is small, it may be better to assume it as a fixed effect.
Markers can be introduced in Equation 1 such that the effect of the line (Lj) can be replaced by gjexpressed as a linear regression on marker covariates (it approximates the genetic value of thejth line). The vector containing the ‘genomic values’ is g � N 0;Gs2
g
� �, where s2
g is the genomicvariance, and G is a genomic relationship matrix. Also, the effect of the line (Lj) can be replacedby aj, with a � N 0;As2
a
� �, where A is the numerical additive relationship matrix derived from
pedigree, and s2a is the additive variance. The interaction covariance matrix is the Hadamard
product of two covariance structures, one describing relationships between lines based ongenetic information (pedigree or genomic) and the other relating environments by means ofenvironmental covariates. When the environmental effect is assumed as fixed, the interactionterm is the Hadamard product of the fixed effect of environments and the covariance matrix oflines that was built with the genetic information. When environmental covariables are used, thenamed reaction norm is justified because the genotypic effect is a reaction to those environ-mental covariables, whereas, when environmental covariables are not used, the reaction normmodels have unknown environmental deviations.
This reaction norm model [24] has been applied successfully using pedigree and molecularmarkers in multienvironments adding environmental covariates, for example, in cotton trialswith environmental covariates [68], in GP of extensive wheat gene bank accessions [69], in GPof Fe and Zn in wheat grain [70], in GP of bread wheat lines in sites located in diverseagroecological zones [27,25], in GP prediction of wheat lines evaluated inMexico and predictedin locations in South Asia [71], and in GP of extensive field trials in wheat on different continents[67]. The reaction norm model was also extended to G � E interactions with maize and wheatdisease ordinal and count data by Montesinos-López et al. [57–60] (see ‘Bayesian genomic-enabled prediction models for ordinal and count data incorporating genotype � environmentinteraction’ in the supplementary information online). The increase in GP accuracy of thereaction norm model with G � E interactions was on average 7–20% relative to the predictionaccuracy of the GBLUP without including G � E interactions.
In areas such as Kansas, USA, wheat production is impacted by yearly climate factors, such asextreme temperatures and erratic precipitation. Yearly effects are not repeatable and representthe dynamic part of the G � E interactions, whereas site effects represent the static repeatablecomponent. The accuracy of predicting unobserved historical sites in the wheat breedingprogram of Kansas State University reaches 0.54, but unobserved years can be predicted withonly 0.17 accuracy [26]. Results of using the reaction norm model with pedigree and genomicinformation for predicting 400–500 bread wheat lines in South Asian locations using approxi-mately 60 000 lines trained in different Mexican environments indicated that GP is moreaccurate (�0.35) than PS for predicting unobserved wheat lines in different South Asianlocations (�0.20) [71]; perhaps this last result is the simplest proof of the concept that GPworks better than PS.
GP Incorporating Marker � Environment Interaction ModelsThe G � E interaction model described by López-Cruz et al. [53] decomposes the markereffects into components that are common across environments (stability) and environment-specific deviations (interaction) [see ‘The G � E (or M � E) model with linear kernel’ in thesupplementary information online]. This model borrows information from across environments
8 Trends in Plant Science, Month Year, Vol. xx, No. yy

TRPLSC 1594 No. of Pages 15
while allowing marker effects to change in each environment. It can be implemented usingshrinkage methods as well as variable selection methods and, thus, can be used to identifygenomic regions whose effects are stable across environments and other regions that areresponsible for G � E interactions [54]. The G � E interaction model of López-Cruz et al. [53] isbest suited for the joint analysis of positively correlated environments and was used to analyzethree CIMMYT wheat data sets. The prediction accuracy of the G � E interaction model wasgreater than across-environment or single-environment analyses (5–29%when predicting eachof the environments). Recently, this genomic G � E interaction model was used to predictuntested durum wheat lines in environments, as well as a variable selection model to identifygenomic regions whose effects are stable across environments and others that are environ-ment specific [54].
In the models of Jarquín et al. [24] and López-Cruz et al. [53], the kernel used is the linear kernelGBLUP. In a new study, Cuevas et al. [55] proposed a G � E interaction model similar to that ofLópez-Cruz et al. [53] but with a nonlinear kernel, theGaussian kernel (GK),which is similar to thatused in the RKHS [62] [see ‘The G � E model of López-Cruz et al. (2015) with a non-linearGaussian kernelmethod’ in the supplementary informationonline]. Using twoextensive data sets,the authors found that, for the wheat data sets, the GK gave prediction accuracies up to 17%higher than theGBLUP linear kernel. For themaize data set, the GKwas on average 5–6%higherthan theGBLUP linear kernel. The advantage of theGKover theGBLUP is that it is amore flexiblekernel that accounts for small and complex marker main effects and specific interactions.
One weakness of both G � E interaction models with a linear [53] and nonlinear kernel [55] isthat positive correlations between environments are assumed. However, when the correlationbetween environments is low or negative, these models do not increase the predictionaccuracy of environments with negligible or negative correlations. The strength of the Bayesianmodels with G � E interactions used under the linear kernel GBLUP or under the nonlinearGaussian kernel (GK) is that they overcome the limitation of the previous models whenassociations between environments are negligible or negative, as shown by Cuevas et al.[56]. These authors proposed considering the genetic effects uð Þ described by the Kroneckerproduct of variance-covariance matrices of genetic correlations between environments andgenomic kernels through markers under two linear kernel methods: linear (GBLUP) andGaussian (GK). An extension includes the same genetic component as the first model uð Þ,plus an extra residual genetic component, f, which captures random effects between environ-ments that were not accounted for by the random effects u (see ‘Multienvironment genoty-pe � environment interaction model with linear and nonlinear kernels’ in the supplementaryinformation online). Results of the analyses of five data sets showed that: (i) G � E interactionmodels always had significantly higher prediction accuracy than single-environment models;and (ii) the prediction accuracy of G � E models with u and f over the multienvironment modelwith only u was higher 85% of the time with GBLUP and 45% of the time with GK across thefive data sets. Results indicated that including the random effect f was still beneficial forincreasing GP accuracy after adjusting for the random effect u. Prediction accuracy of theG � E interaction model methods (GBLUP or GK) increased up to 85% over the accuracy ofthe single-environment model.
Machine Learning for Genomic PredictionIn an applied GS context, the focus should not be on predicting all individuals, but rather onclassifying individuals into upper,middle, or lower classes, dependingon the trait under selection.Using classifiers in GS is attractive because they are trained to maximize the probability of anindividualbeingamemberof the targetclass, rather thansearching for itsoverallperformance [21].González-Camacho et al. [18] used a radial basis neural network on an extensive genomicmaizedata set comprising several traits in different environments and compared the results with RKHS
Trends in Plant Science, Month Year, Vol. xx, No. yy 9

TRPLSC 1594 No. of Pages 15
andwith a linear regressionmodel. The [72_TD$DIFF]accuracy of neural networkmethodswas similar to that ofRKHS and slightly higher than that of the linear regression.
In a recent study, two neural network classifiers (a multilayer perceptron, MLP, and a probabi-listic neural network, PNN) were compared for predicting the probability of an individualmember of a target phenotypic class, using 33 maize and wheat genomic and phenotypicdata sets [19]. The authors focused on the 15th and 30th percentiles of the upper and lowerclasses to select the best individuals, as commonly done in GS (for traits such as grain yield, theupper classes are the target; for diseases, the focus is on the lower classes). The criterion forassessing the prediction accuracy of MLP and PNN was the area under the receiveroperating characteristic curve (AUC). The parameters of both classifiers were estimatedby optimizing the [73_TD$DIFF]AUC for a specific target class. The PNN was found to be more accurate thanthe classifier MLP for assigning maize and wheat lines to the correct upper, middle, or lowerclass. Results for the wheat data set with continuous traits split into two and three classesshowed that the performance of PNN with three classes was better than PNN with two classeswhen classifying individuals into the upper and lower (15% or 30%) categories. Depending onthe maize trait–environment combination, [74_TD$DIFF]AUC for PNN30% or for PNN15% upper trait (grainyield) was higher than the [74_TD$DIFF]AUC of MLP. For the lower class, flowering (male and female) traits,PNN15% and PNN30% always had better [74_TD$DIFF]AUC than MLP15% and MLP30% [19].
Genetic Gains from Rapid Selection Cycle GS: CIMMYT Maize Biparental PopulationsThe fundamental goal of using GS in breeding is to achieve greater genetic gains at a lower costand in less time than with conventional pedigree breeding. To achieve a shorter interval cycle, afavorable use of GS is prediction within full-sib families, because biparental populations havehigh LD between marker alleles and trait alleles with no group structure.
There are few studies that measure the genetic gains achieved through use of a GS-basedrapid selection cycle. The first study confirming the promise of a rapid selection cycle in GP ofbiparental populations, as well as previous findings from random cross-validation studies, wasconducted by Massman et al. [44] and showed that GS improved maize genetic gains per unitof time. Genetic gains were also reported by Asoro et al. [45] in oat and by Rutkoski et al. [48] inwheat, which showed that GS and PS provided similar realized genetic gains per unit of time.
Genetic gain studies comparing GS cycles C0, C1, C2, and C3 with pedigree selection on eightCIMMYT tropical biparental maize populations in Sub-Saharan Africa were conducted byBeyene et al. [47] under drought conditions. The authors showed that: (i) the average gainper cycle (across all eight biparental populations) from GS was 0.086 t/ha under manageddrought conditions; (ii) the average grain yield of C3-derived hybrids was significantly higherthan that of hybrids derived from C0; and (iii) three GS cycles can be achieved in 1 year. Theauthors concluded that hybrids derived from C3 produced 7.3% higher grain yield than thosedeveloped through conventional pedigree breeding. By contrast, the average gain per cycleusing marker-assisted recurrent selection (MARS) across ten populations was 0.051 t/haper cycle under managed drought stress. Extensive field trials were conducted in severalmanaged drought environments in Sub-Saharan Africa to evaluate the grain yield performanceof maize hybrids derived fromGS-based lines selected from different populations. Lines derivedfrom cycle C3 GS in hybrid combination produced significantly higher average grain yield thanlines from C0 GS in hybrid combination ([75_TD$DIFF]Y. Beyene, 2017).
Another example of genetic gains from rapid-cycle GS on CIMMYT maize is two biparentalmaize populations (F2:3) from Asia (CAP1 and CAP2) that were developed and evaluated fortestcross performance under drought and optimal conditions [72]. The genetic gains per yearfor PS versus GS in drought environments were 0.067 t/ha versus 0.124 t/ha, respectively, for
10 Trends in Plant Science, Month Year, Vol. xx, No. yy

TRPLSC 1594 No. of Pages 15
CAP1, and 0.076 t/ha versus 0.104 t/ha, respectively, for CAP2. The corresponding geneticgains per year for PS versus GS in optimal environments were 0.084 t/ha versus 0.140 t/ha,respectively, for CAP1, and 0.123 t/ha versus 0.13 t/ha, respectively, for CAP2. Results of thisstudy confirmed that GS of superior plant phenotypes produced rapid genetic gains in droughttolerance in maize.
Genetic Gains from Rapid Selection Cycle GS: CIMMYT Multiparental PopulationsMost GS results in maize have been achieved by rapid cycling of biparental populations(e.g., F2:3 segregating populations crossed with a tester from the opposite heterotic group).Five years ago, the Global Maize Program of CIMMYT designed a GS rapid cycle of multi-parental crosses. Fifteen elite tropical maize lines were crossed in diallelic fashion to form cycle0 (C0), which was genotyped using GBS markers and phenotyped at two locations in Mexico;plants with the best phenotype were selected to form the parents for GS cycle 1 (C1). The C1
parents were intercrossed and the progeny genotyped with the same GBS markers used forthe C0 population [73].
Two cycles per year were completed and, at the end of the second year, seeds from cycles C0,C1, C2, C3, and C4 were collected, assembled, and sown at two locations in Mexico. Fiftyentries per genomic cycle were sown at each location, together with two widely usedcommercial tropical maize hybrids. Average genomic grain yield gains reached 0.134 t/ha,with C0 producing 6.653 t/ha. Grain yield of C1 was slightly lower (6.488), and cycles C2, C3,and C4 produced mean yields of 7.022, 6.879, and 7.126 t/ha, respectively. The realized grainyield from C1 to C4 reached 0.225 t/ha per cycle, which the authors considered equivalent to0.1 t/ha per year over a breeding period of 4.5 years. A slight decline in genetic diversity wasdetected at C4 compared with C0.
Prospects for Enhanced Use of GS in Plant BreedingTo accelerate the deployment of GS in crop breeding while reducing the cost of line and hybriddevelopment, here we examine the combined use of GS with [76_TD$DIFF]high throughput phenotype (HTP)for early-generation testing in plant breeding. In addition, we examine the application of GS ingermplasm enhancement and prebreeding using gene bank accessions[77_TD$DIFF].
Combining Multi-Trait Multienvironment GS with High-Throughput Phenotyping: TheCIMMYT CaseIn modern agriculture, high-resolution cameras are used to obtain hundreds of reflectance datameasured at discrete narrow bands (wavelengths) to cover the whole spectrum. This informa-tion is used to construct vegetation indices (e.g., Green Normalized Difference Vegetation Indexor NDVI) to predict primary traits (e.g., grain yield). However, these indices use only certainbands and are cultivar specific; thus, they fail to capture considerable information or performrobustly for all cultivars. The advantage of this imaging technology is that massive numbers ofphenotypes can be screened inexpensively during early-generation testing.
The main objective of GS is to [78_TD$DIFF]reduce phenotyping [79_TD$DIFF]costs by using markers and accelerategenetic gains, whereas the aim of HTP is to measure high-density phenotypes in very largenumbers of individuals or breeding lines across time and space using remote or proximalsensing. This can increase both the accuracy and intensity of selection and, subsequently, theselection response, while decreasing phenotyping costs. The main idea of HTP is to usesecondary traits related to grain yield, disease resistance, or end-use quality that may be usefulin early-generation testing of lines. A recent study [74] found that the highest accuracy whenpredicting grain yield is achieved by the use of broader selection of wavelengths (see ‘Predictinggrain yield using canopy hyperspectral reflectance in wheat breeding data’ in the supplemen-tary information online).
Trends in Plant Science, Month Year, Vol. xx, No. yy 11
TRPLSC 1594 No. of Pages 15
Using HTP platforms with vegetation indices as predictor traits in pedigree and GS models canincrease the prediction accuracy for grain yield [75]. Prediction during early-generation testing isimportant to enhance genetic gains during early stages of the breeding cycle, but GS iseconomically unfeasible at those stages due to the large number of plants in the field; thus,while assessing pedigree relationships has the advantage of not costing anything, their use failsto exploit Mendelian sampling, in contrast to GS. Therefore, using multivariate pedigree-basedprediction models that incorporate such predictor traits while using an HTP platform offers alow-cost solution for predicting grain yield among and within families in early-generation testing,as demonstrated by Rutkoski et al. [75]. These authors found that within-environment sec-ondary vegetative indices increased prediction accuracies for grain yield by 59%using pedigreerelationships and by 70% using genomic relationships. These results indicate that secondarytraits measured by HTP and usedwith pedigree can improve the prediction accuracy of primarytraits during the early stages of breeding. Reynolds and Langridge [76] found that HTPtechniques are effective for evaluating genetic resources for complex trait expression.
HTP platforms are useful to measure secondary traits that are genetically correlated with grainyield and that can be incorporated in multivariate pedigree and genomic prediction models,improving indirect selection for grain yield. Sun et al. [77] used a statistical model that estimatedBVs of secondary traits together with multivariate pedigree and genomic models; the authorsfound a 70% (on average) improvement in the accuracy of selection for grain yield, includingsecondary traits in both TRN and TST populations.
A recent study developed statistical models to assess hyperspectral wavelength � environ-ment interactions in HTP, incorporating genomic and pedigree G � E interactions [78].Although little GP accuracy was achieved, important hyperspectral wavelength � environmentinteractions were observed, demonstrating that GS coupled with HTP can be a powerful toolapplied to early-generation testing of a large number of selection candidates. The full condi-tional distributions for modeling the three-way trait � G � E interaction model of Montesinos-López et al. [9] can be adapted to include the hyperspectral bands in the functional regressionapproach recently described by Montesinos-López et al. [80_TD$DIFF][74,78].
Exploring the Application of GS to Gene Bank Accessions for Germplasm EnhancementAlthough the accessions stored in gene banks represent a rich resource for breeders, allelesneed to be extracted from the accessions for cultivar development, which is time-consumingand expensive [79,80]. Lengthy prebreeding programs are required to develop lines thatcombine favorable alleles from the germplasm bank with good agronomic performance andthat can be used as parents in a breeding program. Based on the simulation of variousprebreeding options, germplasm enhancement breeding programs can start directly fromlandraces or from landraces crossed with elite testers [81].
The GP accuracy of 8416 Mexican wheat landrace accessions and 2403 Iranian wheatlandrace accessions from the CIMMYT gene bank were examined by Crossa et al. [69].The authors measured two traits in two environments and several highly heritable traits in asingle optimum environment. The GP accuracy for several traits (maturity, quality traits, andgrain yield and yield components) under the different prediction scenarios was high, rangingfrom 0.5 to 0.7. In soybean, Jarquín et al. [25] analyzed the USDA soybean collection usingdifferent cross-validation schemes and grouping factors (trials, states, and genetic subpopu-lations); results showed relatively high prediction accuracies that should help breeders tointrogress useful genetic variation [81_TD$DIFF](Box 1).
These preliminary results of the accuracy of GP of gene bank accessions favor the idea ofapplying GS to introgress landrace accessions in elite germplasm and form gene pools and
12 Trends in Plant Science, Month Year, Vol. xx, No. yy
TRPLSC 1594 No. of Pages 15
Box 1. An Example of GS Deployment in Prebreeding
Results from using a large number of Mexican and Iranian landraces stored in the wheat gene bank of CIMMYT indicatedthat prediction accuracies for traits evaluated in one environment for TRN20-TST80 design ranged from 0.407 to 0.677for Mexican landraces and from 0.166 to 0.662 for Iranian landraces. Also, prediction accuracies of the 20% core setwere similar to those obtained for TRN20-TST80, ranging from 0.412 to 0.654 for Mexican landraces and from 0.182 to0.647 for Iranian landraces. Interestingly, the correlations for complex GYSM traits were approximately 0.4 for bothMexican and Iranian landraces. Results of correlations when incorporating G � E interactions for days to heading anddays to maturity for TRN20-TST80 were approximately 0.61 for Mexican landraces and 0.60 for Iranian landraces. The20% core set had correlations of approximately 0.58 for Mexican landraces and 0.50–0.59 for Iranian landraces.
Prediction accuracies of the 10% and 20% diversity and predictive core subsets were generally of a magnitude thatappeared useful for predicting the value of gene bank accessions and for breeding. The first application would be topredict the genetic value of all genotyped accessions in a gene bank and then phenotype only those that have thehighest predicted genetic values. Then, a breeder could begin prebreeding following several strategies. For example,one decision would be to initiate a prebreeding conversion approach by crossing the best accessions amongthemselves to improve the accessions per se until they become elite. Another strategy could be to start an introgressionapproach by crossing selected accessions to elite materials.
Nevertheless, application of GS for germplasm enhancement will have to be performed in combination with standardintrogression of exotic to elite germplasm and, possibly, a series of backcrosses to the elite material. Extracting the bestaccessions directly from the gene banks and forming productive gene pools may be the first stage before refining thegene pools and evaluating them under different environmental conditions.
Outstanding QuestionsHow can GS have an important role inenhancing the rate of genetic gain?
Are currently available GS modelscapable of providing the most accu-rate predictions?
How can GS accelerate the flow offavorable alleles directly from the genebank to breeding programs?
Are we ready to deploy GS in pre-breeding and germplasm-enhance-ment programs?
Is it possible to combine GS and pedi-gree selection with HTP to accelerategenetic gains and save resourceswhen developing lines during early-generation testing?
populations suitable for prebreeding and germplasm enhancement programs. However,further research is required in this area.
Concluding RemarksMany statistical methods have been developed to predict unobserved individuals in GS. Ingeneral, linear models (e.g., GBLUP) and machine-learning algorithms have been successful inrecognizing complex patterns and making correct decisions based on data. Kernel-basedmethods, such as the RKHS, have extensively delivered good genomic predictions in plants.Several statistical models based on the standard GBLUP that incorporate G � E interactions ingenomic and pedigree predictions have provided substantial increases in the accuracy ofpredicting unobserved individuals in environments. These GS prediction models can helpscientists in different disciplines to develop drought- and heat-tolerant plants by exploitingpositive G � E interactions. [82_TD$DIFF]Modeling multi-trait multi-environment is essential for improving theprediction accuracy of the performance of newly developed lines in future years.
The use of statistical models in extensive hyperspectral image technology for HTP, togetherwith genomic and pedigree information in early-generation testing, offers an opportunity toaccelerate genetic gains by increasing the intensity of selection. Deep machine-learningmethods using neural networking appear promising to increase the accuracy of genomic-enabled prediction. Genomic selection has a clear-cut advantage over pedigree breeding andMAS to enhance genetic gains for complex traits. The appropriate use of genotyping platformscombined with precise phenotyping platforms will also help enhance prediction accuracy andaccelerate genetic [83_TD$DIFF]gains by shortening the breeding cycle. Further research is required toincorporate GS with HTP as a routine component in plant breeding programs.
Developing GP models for gene bank accessions will be important to access unexploreddiversity and fast-track useful portions into breeding programs ( [84_TD$DIFF]also see Outstanding Ques-tions). Currently, GS is the most-promising breeding method to speed the development andrelease of new genotypes; therefore, the use of GS to form gene pools and populations fromrich gene bank accessions merits extensive and intensive study, especially given the vulnera-bility of elite lines and hybrids to severe climate change effects.
Trends in Plant Science, Month Year, Vol. xx, No. yy 13
TRPLSC 1594 No. of Pages 15
AcknowledgmentsThe authors are grateful to [85_TD$DIFF]their colleagues, collaborators, and by using field and lab technician [86_TD$DIFF]from CIMMYT and
ICRISAT, as well as scientists in National Programs who collected the valuable data used in the various studies. The
authors would like to thank Kevin Pixley, Daniel Gianola, and four anonymous reviewers for their positive, careful, and
detailed reviews of the manuscript; their comments, editing, and suggestions significantly improved the quality and
readability of the manuscript. The authors also thank Michael Listman for editing the revised version of the manuscript.
Supplemental InformationSupplemental information associated with this article can be found, in the online version, at http://dx.doi.org/10.1016/j.
tplants.2017.08.011.
References
1. Bernardo, R. (2008) Molecular markers and selection for complextraits in plants: learning from the last 20 years. Crop Sci. 48,1649–1664
2. Bernardo, R. (2016) Bandwagons I, too, have known. Theor.Appl. Genet. 129, 2323–2332
3. Meuwissen, T.H.E. et al. (2001) Prediction of total genetic valueusing genome-wide dense marker maps. Genetics 157,1819–1829
4. Pszczola, M. et al. (2012) Reliability of direct genomic values foranimals with different relationships within and to the referencepopulation. J. Dairy Sci. 95, 389–400
5. Daetwyler, H.D. et al. (2010) The impact of genetic architecture ongenome-wide evaluation methods. Genetics 185, 1021–1031
6. Isidro, J. et al. (2015) Training set optimization under populationstructure in genomic selection. Theor. Appl. Genet. 2015, 145–158
7. Lorenz, A.J. et al. (2012) Potential and optimization of genomicselection for Fusarium head blight resistance in six-row barley.Crop Sci. 52, 1609–1621
8. Arruda, M.P. et al. (2015) Genomic selection for predicting fusar-ium head blight resistance in a wheat breeding program. PlantGenome 8, 1–12
9. Montesinos-López, O.A. et al. (2016) A genomic Bayesian multi-trait and multi-environment model. G3 6, 2725–2744
10. Poland, J. and Rutkoski, J. (2016) Advances and challenges ingenomic selection for disease resistance. Annu. Rev. Phytopa-thol. 54, 79–98
11. Bellman, R.E. (1961) Adaptive Control Processes: A Guided Tour,Princeton University Press
12. Cuevas, J. et al. (2014) Bayesian genomic-enabled prediction asan inverse problem. G3 4, 1191–2001
13. de los Campos, G. et al. (2012) Whole genome regression andprediction methods applied to plant and animal breeding. Genet-ics 193, 327–345
14. Cerón-Rojas, J.J. et al. (2015) A genomic selection index appliedto simulated and real data. G3 5, 2155–2164
15. LeCun, Y. et al. (2015) Deep learning. Nature 521, 436–444
16. Gianola, D. et al. (2006) Genomic-assisted prediction of geneticvalues with a semi-parametric procedure. Genetics 173,1761–1776
17. Gianola, D. et al. (2011) Predicting complex quantitative traits withBayesian neural networks: a case study with Jersey cows andwheat. BMC Genet. 12, 87
18. González-Camacho, J.M. et al. (2012) Genome-enabled predic-tion of genetic values using Radial Basis Function Neural Net-works. Theor. Appl. Genet. 125, 759–771
19. González-Camacho, J.M. et al. (2016) Genome-enabled predic-tion using probabilistic neural network classifiers.BMCGenomics17, 208
20. Pérez-Rodríguez, P. et al. (2012) A comparison between linearand non-parametric regression models for genome-enabled pre-diction in wheat. G3: Genes|Genomes|Genetics 2, 1595–1605
21. Ornella, L. et al. (2014) Genomic-enabled prediction with classifi-cation algorithms. Heredity 112, 616–626
22. Gonzalez-Recio, O. et al. (2014) Machine learning methods andpredictive ability metrics for genome-wide prediction of complextraits. Livest. Sci. 166, 217–231
14 Trends in Plant Science, Month Year, Vol. xx, No. yy
23. Burgueño, J. et al. (2012) Genomic prediction of breeding valueswhen modeling genotype � environment interaction using pedi-gree and dense molecular markers. Crop Sci. 52, 707–719
24. Jarquín, D. et al. (2014) A reaction norm model for genomicselection using high-dimensional genomic and environmentaldata. Theor. Appl. Genet. 127, 595–607
25. Jarquín, D. et al. (2016) Genotyping by sequencing for genomicprediction in a soybean breeding population. BMC Genomics 15,740
26. Jarquín, D. et al. (2017) Increasing genomic-enabled predictionaccuracy by modeling genotype � environment interaction inKansas wheat. Plant Genome Published online June 8, 2017.http://dx.doi.org/10.3835/plantgenome2016.12.0130
27. Saint-Pierre, C. et al. (2016) Genomic prediction models for grainyield of spring bread wheat in diverse agro-ecological zones. Sci.Rep. 6, 27312
28. Bernardo, R. and Yu, J.M. (2007) Prospects for genome-wideselection for quantitative traits in maize.Crop Sci. 47, 1082–1090
29. Lorenzana, R.E. and Bernardo, R. (2009) Accuracy of genotypicvalue predictions for marker-based selection in biparental plantpopulations. Theor. Appl. Genet. 120, 151–161
30. Heffner, E.L. et al. (2009) Genomic selection for crop improve-ment. Crop Sci. 49, 1–12
31. Heffner, E.L. et al. (2010) Plant breeding with genomic selection:gain per unit time and cost. Crop Sci. 50, 1681–1690
32. de los Campos, G. et al. (2009) Predicting quantitative traits withregression models for dense molecular markers and pedigree.Genetics 182, 375–385
33. de los Campos, G. et al. (2010) Semi-parametric genomic-enabled prediction of genetic values using reproducing kernelHilbert spaces methods. Genet. Res. 92, 295–308
34. Crossa, J. et al. (2010) Prediction of genetic values of quantitativetraits in plant breeding using pedigree and molecular markers.Genetics 186, 713–724
35. Crossa, J. et al. (2011) Genomic selection and prediction in plantbreeding. J. Crop Improv. 25, 239–226
36. Crossa, J. et al. (2013) Genomic prediction in maize breedingpopulations with genotyping-by-sequencing. G3: Genes|Genomes|Genetics 3, 1903–1926
37. Crossa, J. et al. (2014) Genomic prediction in CIMMYTmaize andwheat breeding programs. Heredity 112, 48–60
38. Pérez-Rodríguez, P. and de los Campos, G. (2014) Genome-wide regression and prediction with the BGLR statistical pack-age. Genetics 198, 483–495
39. Hickey, J.M. et al. (2012) Factors affecting the accuracy of geno-type imputation in populations from several maize breeding pro-grams. Crop Sci. 52, 654–663
40. Riedelsheimer, C. et al. (2012) Genomic and metabolic predictionof complex heterotic traits in hybrid maize. Nat. Genet. 44,217–220
41. Zhao, Y. et al. (2012) Accuracy of genomic selection in Europeanmaize elite breeding populations. Theor. Appl. Genet. 124,769–776
42. Windhausen, V.S. et al. (2012) Effectiveness of genomic predic-tion of maize hybrid performance in different breeding populationsand environments. G3: Genes|Genomes|Genetics 2, 1427–1436
TRPLSC 1594 No. of Pages 15
43. Technow, F. et al. (2013) Genomic prediction of northern corn leafblight resistance in maize with combined or separated trainingsets for heterotic groups. G3: Genes|Genomes|Genetics 3,197–203
44. Massman, J.M. et al. (2013) Genome-wide selection versusmarker-assisted recurrent selection to improve grain yield andstover-quality traits for cellulosic ethanol in maize. Crop Sci. 53,58–66
45. Asoro, F.G. et al. (2013) Genomic, marker-assisted, and pedi-gree-BLUP selection methods for b-glucan concentration in eliteoat. Crop Sci. 53, 1894–1906
46. Combs, E. and Bernardo, R. (2013) Genome-wide selection tointrogress semidwarf corn germplasm into U.S. Corn Beltinbreds. Crop Sci. 53, 1427–1436
47. Beyene, Y. et al. (2015) Genetic gains in grain yield throughgenomic selection in eight bi-parental maize populations underdrought stress. Crop Sci. 55, 154c163
48. Rutkoski, J. et al. (2015) Genetic gain from phenotypic andgenomic selection for quantitative resistance to stem rust ofwheat. Plant Genome 8, 1–10
49. VanRaden, P.M. (2007) Genomic measures of relationship andinbreeding. Interbull Annu. Meet. Proc. 37, 33–36
50. VanRaden, P.M. (2008) Efficient methods to compute genomicpredictions. J. Dairy Sci. 91, 4414–4423
51. Heslot, N. et al. (2012) Genomic selection in plant breeding: acomparison of models. Crop Sci. 52, 146–160
52. Heslot, N. et al. (2014) Integrating environmental covariates andcrop modeling into the genomic selection framework to predictgenotype by environment interactions. Theor. Appl. Genet. 127,463–480
53. López-Cruz, M. et al. (2015) Increased prediction accuracy inwheat breeding trials using a marker � environment interactiongenomic selection model. G3: Genes|Genomes|Genetics 5,569–582
54. Crossa, J. et al. (2016) Extending the Marker � Environmentinteraction model for genomic-enabled prediction andgenome-wide association analyses in durum wheat. Crop Sci.56, 1–17
55. Cuevas, J. et al. (2016) Genomic prediction of genotype -� environment interaction kernel regression models. PlantGenome Published online September 22, 2016. http://dx.doi.org/10.3835/plantgenome2016.03.0024
56. Cuevas, J. et al. (2017) Bayesian genomic prediction with gen-otype � environment interaction kernel models. G3: Genes|Genomes|Genetics 7, 41–53
57. Montesinos-López, O.A. et al. (2015) Threshold models forgenome-enabled prediction of ordinal categorical traits in plantbreeding. G3: Genes|Genomes|Genetics 5, 291–300
58. Montesinos-López, O.A. et al. (2015) Genomic-enabled predic-tion of ordinal data with Bayesian logistic ordinal regression. G3:Genes|Genomes|Genetics 5, 2113–2126
59. Montesinos-López, O.A. et al. (2015) Genomic prediction modelsfor count data. J. Agric. Biol. Environ. Stat. 20, 533–554
60. Montesinos-López, O.A. et al. (2016) Genomic Bayesian predic-tion model for count data with genotype � environment interac-tion. G3: Genes|Genomes|Genetics 6, 1165–1177
61. Montesinos-López, O.A. et al. (2017) A Bayesian poisson-log-normal model for count data for multiple-trait multiple-environ-ment genomic-enabled prediction. G3: Genes|Genomes|Genetics 7, 1595–1606
62. Gianola, D. and van Kaam, J.B.C.H.M. (2008) Reproducing ker-nel hilbert space regression methods for genomic-assisted pre-diction of quantitative traits. Genetics 178, 2289–2303
63. Philomin, J. et al. (2017) Comparison of models and whole-genome profiling approaches for genomic-enabled predictionof Septoria tritici blotch, Stagonospora nodorum blotch, andtan spot resistance in wheat. Plant Genome 10, 1–16
64. Philomin, J. et al. (2017) Genomic and pedigree-based predictionfor leaf, stem, and stripe rust resistance in wheat. Theor. Appl.Genet. 130, 1415–1430
65. Varshney, R.K. (2016) Exciting journey of 10 years from genomesto fields and markets: some success stories of genomics-assisted breeding in chickpea, pigeonpea and groundnut. PlantSci. 242, 98–107
66. Roorkiwal, M. et al. (2016) Genome-enabled prediction modelsfor yield related traits in chickpea. Front. Plant Sci. 7, 1666
67. Sukumaran, S. et al. (2017) Genomic prediction with pedigreeand genotype � environment interaction in spring wheat grown inSouth and West Asia, North Africa, and Mexico. G3: Genes|Genomes|Genetics 7, 481–197
68. Pérez Rodríguez, P. et al. (2015) A pedigree reaction norm modelfor prediction of cotton (Gossypium sp.) yield in multi-environmenttrials. Crop Sci. 55, 1143–1151
69. Crossa, J. et al. (2016) Genomic prediction of gene bank wheatlandraces. G3: Genes|Genomes|Genetics 6, 1819–1834
70. Govidan, V. et al. (2016) Genomic prediction for grain zinc andiron concentrations in spring wheat. Theor. Appl. Genet. 129,1595–1605
71. Pérez-Rodríguez, P. et al. (2017) Single-step genomic and pedi-gree genotype � environment interaction models for predictingwheat lines in international environments. Plant Genome Pub-lished online May 5, 2017. http://dx.doi.org/10.3835/plantgenome2016.09.0089
72. Vivek, B.S. et al. (2017) Use of genomic estimated breedingvalues results in rapid genetic gains for drought tolerance inmaize. Plant Genome 10, 1–8
73. Zhang, X. et al. (2017) Rapid cycling genomic selection in amultiparental tropical maize population. G3: Genes|Genomes|Genetics 7, 1–12
74. Montesinos-López, O.A. et al. (2017) Predicting grain yield usingcanopy hyperspectral reflectance in wheat breeding data. PlantMethods 13, 4
75. Rutkoski, J. et al. (2016) Predictor traits from high-throughputphenotyping improve accuracy of pedigree and genomic selec-tion for grain yield in wheat. G3 6, 2799–2808
76. Reynolds, M. and Langridge, P. (2016) Physiological breeding.Curr. Opin. Plant Biol. 31, 162–171
77. Sun, J. et al. (2017) Multi-trait, random regression, or simplerepeatability model in high-throughput phenotyping data improvegenomic prediction for grain yield in wheat. Plant Genome Pub-lished online Mary 18, 2017. http://dx.doi.org/10.3835/plantgenome2016.11.011
78. Montesinos-López, A. et al. (2017) Genomic Bayesian functionalregression models with interactions for predicting wheat grainyield using hyper-spectral image data. Plant Methods 62, 13
79. McCouch, S. et al. (2012) Genomics of gene bank: a case studyfor rice. Am. J. Bot. 99, 407–423
80. Yu, X. et al. (2016) Genomic prediction contributing to a promisingglobal strategy to turbocharge gene banks. Nat. Plants 2, 16150
81. Gorjanc, G. et al. (2016) Initiating maize pre-breeding programsusing genomic selection to harness polygenic variation fromlandrace populations. BMC Genomics 17, 30
Trends in Plant Science, Month Year, Vol. xx, No. yy 15