Embed Size (px)
Citation preview
GEOGRAPHYHIGHER SECONDARY - SECOND YEAR
A publication under Government of Tamilnadu
Distribution of Free Textbook Programme(NOT FOR SALE)
Untouchability is a sin Untouchability is a crime Untouchability is inhuman
TAMILNADU TEXTBOOK AND EDUCATIONAL SERVICES CORPORATION College Road, Chennai - 600 006.
ii iii
© Government of Tamilnadu First Edition - 2005 Reprint - 2017
Chairperson
T. Vasantha KumaranProfessor of Geography
Department of GeographyUniversity of Madras,Chennai - 600 005.
Reviewers
N. SubramaniamLecturer in Geography
DIET, Namakkal,Namakkal District - 637 001.
Authors
T. Srinivasan E. KaliappanLecturer in Geography PG Teacher in GeographyDIET, Kotagiri Dr. GMTTV Hr. Sec. SchoolThe Nilgiris - 643 217 Sowkarpet, Chennai - 600 079.
Vanitha Vatchala MonicaP.G. Teacher in Geography
St. Paul’s Higher Secondary SchoolVepery, Chennai - 600 007.
This book has been prepared by the Directorate of School Education on behalf of the Government of Tamilnadu
This book has been printed on 60 G.S.M Paper
Printed by Offset at:
ii iii
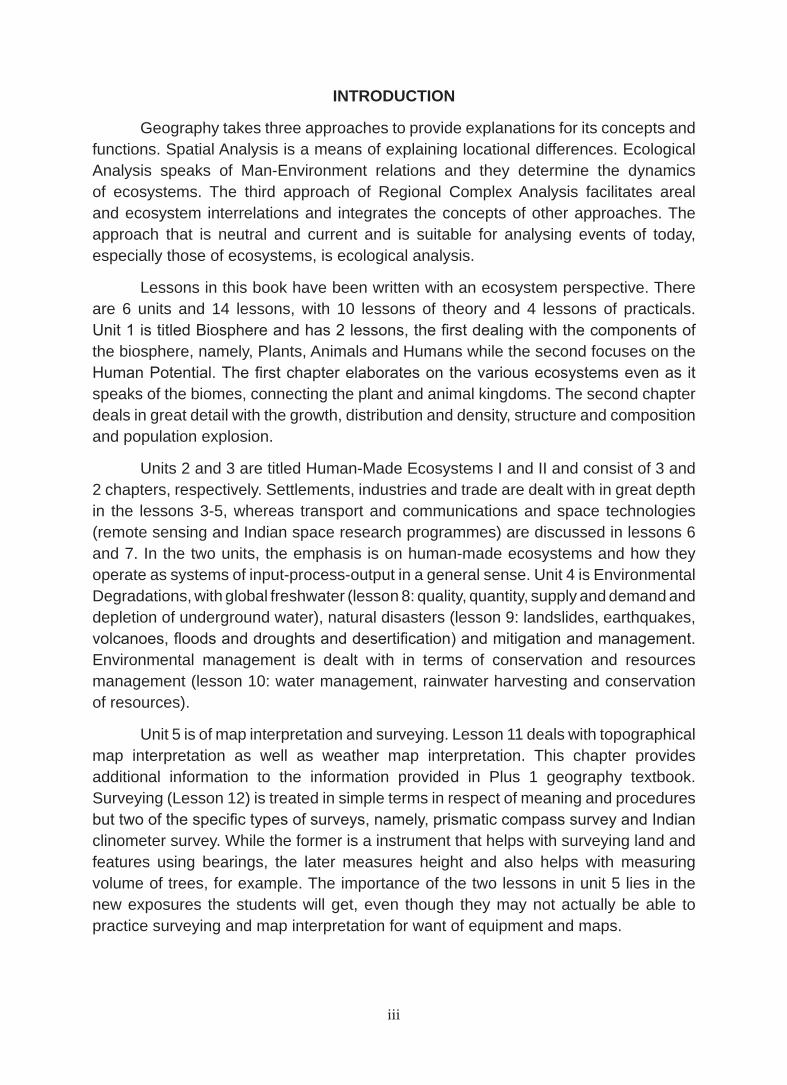
INTRODUCTION
Geography takes three approaches to provide explanations for its concepts and functions. Spatial Analysis is a means of explaining locational differences. Ecological Analysis speaks of Man-Environment relations and they determine the dynamics of ecosystems. The third approach of Regional Complex Analysis facilitates areal and ecosystem interrelations and integrates the concepts of other approaches. The approach that is neutral and current and is suitable for analysing events of today, especially those of ecosystems, is ecological analysis.
Lessons in this book have been written with an ecosystem perspective. There are 6 units and 14 lessons, with 10 lessons of theory and 4 lessons of practicals. Unit 1 is titled Biosphere and has 2 lessons, the first dealing with the components of the biosphere, namely, Plants, Animals and Humans while the second focuses on the Human Potential. The first chapter elaborates on the various ecosystems even as it speaks of the biomes, connecting the plant and animal kingdoms. The second chapter deals in great detail with the growth, distribution and density, structure and composition and population explosion.
Units 2 and 3 are titled Human-Made Ecosystems I and II and consist of 3 and 2 chapters, respectively. Settlements, industries and trade are dealt with in great depth in the lessons 3-5, whereas transport and communications and space technologies (remote sensing and Indian space research programmes) are discussed in lessons 6 and 7. In the two units, the emphasis is on human-made ecosystems and how they operate as systems of input-process-output in a general sense. Unit 4 is Environmental Degradations, with global freshwater (lesson 8: quality, quantity, supply and demand and depletion of underground water), natural disasters (lesson 9: landslides, earthquakes, volcanoes, floods and droughts and desertification) and mitigation and management. Environmental management is dealt with in terms of conservation and resources management (lesson 10: water management, rainwater harvesting and conservation of resources).
Unit 5 is of map interpretation and surveying. Lesson 11 deals with topographical map interpretation as well as weather map interpretation. This chapter provides additional information to the information provided in Plus 1 geography textbook. Surveying (Lesson 12) is treated in simple terms in respect of meaning and procedures but two of the specific types of surveys, namely, prismatic compass survey and Indian clinometer survey. While the former is a instrument that helps with surveying land and features using bearings, the later measures height and also helps with measuring volume of trees, for example. The importance of the two lessons in unit 5 lies in the new exposures the students will get, even though they may not actually be able to practice surveying and map interpretation for want of equipment and maps.
iv v
Unit 6 is of geographical information systems, what is generally abbreviated as GIS, and global positioning systems or GPS. The two lessons, 13 and 14, put the very latest of technological developments in the hands of the young students of Plus 2 and introduces them to a capability that geography possesses which no other social science is capable of, at the moment. The practical lessons are by way of improving the skills and capabilities of the students and hence teachers must take extra care to learn, understand and teach / impart with greater efficiency.
Happy reading and best wishes.
Chennai T. Vasantha KumaranSeptember 2004 Chairperson: Geography XII
Textbook Sub-Committee
iv v
CONTENT
PART - I : THEORY
UNIT - 1
BIOSPHERE
1. Plants, Animals and Humans 1
2. The Human Potential 16
UNIT - 2
HUMAN - MADE ECOSYSTEMS - I
3. Settlement Systems 31
4. Industrial Systems 42
5. Trade Systems 52
UNIT - 3
HUMAN - MADE ECOSYSTEMS - II
6. Transport and Communication Systems 61
7. Space Technologies 76
UNIT - 4
ENVIRONMENTAL DEGRADATIONS / MANAGEMENT
8. Global Freshwater 87
9. Natural Disasters 107
10. Conservation and Resource Management 132
PART - II : PRACTICALSUNIT - 5
MAP INTERPRETATION AND SURVEYING
11. Map Interpretation 150
12. Surveying 163
vi PB
UNIT - 6
GEOGRAPHICAL INFORMATION SYSTEMS
13. Database Management Systems and Geographical
Information systems 173
14. Global Positioning Systems 180
PB 1
UNIT 1BIOSPHERELESSON 1
PLANTS, ANIMALS AND HUMANSLearning objectives
Students recognize the importance of bio-spherical components, namely, plants, animals and humans.
Biogeography
Earth phenomena are of two types. They are the living and the non-living. In the two, there are several ecosystems. In the living, there are seven ecosystems and, in the non-living, there are four ecosystems. How an individual organism of the living organisms interacts with its environment can be understood through a study of biogeography.
It is almost 1000 million years since life forms appeared, on the surface of the earth. The first organisms began their lives in the seas. Land organisms appeared soon afterwards. In course of time, almost 3 million (3 x 10⁶) plants, animals and micro organisms came into existence. Presently, 1.0 million animals and 0.5 million plants have been identified and classified. There are as yet several organisms that have not been classified. These living organisms are unevenly distributed on the surface of the earth. Each of the ecosystems consists of its own flora and fauna. If these were not living on the earth, the earth would have been a sterile planet.
Biosphere
Land, water and winds are the three natural systems of spheres. They are of solid, liquid and gaseous forms. They may be called the non-living. Besides these, there is a fourth sphere consisting of the flora and fauna. This is called the biosphere. This may be alternatively called the living systems. Between the living and the non-living systems, there are various interactions. Several environmental changes occur on the earth in response to these interactions.
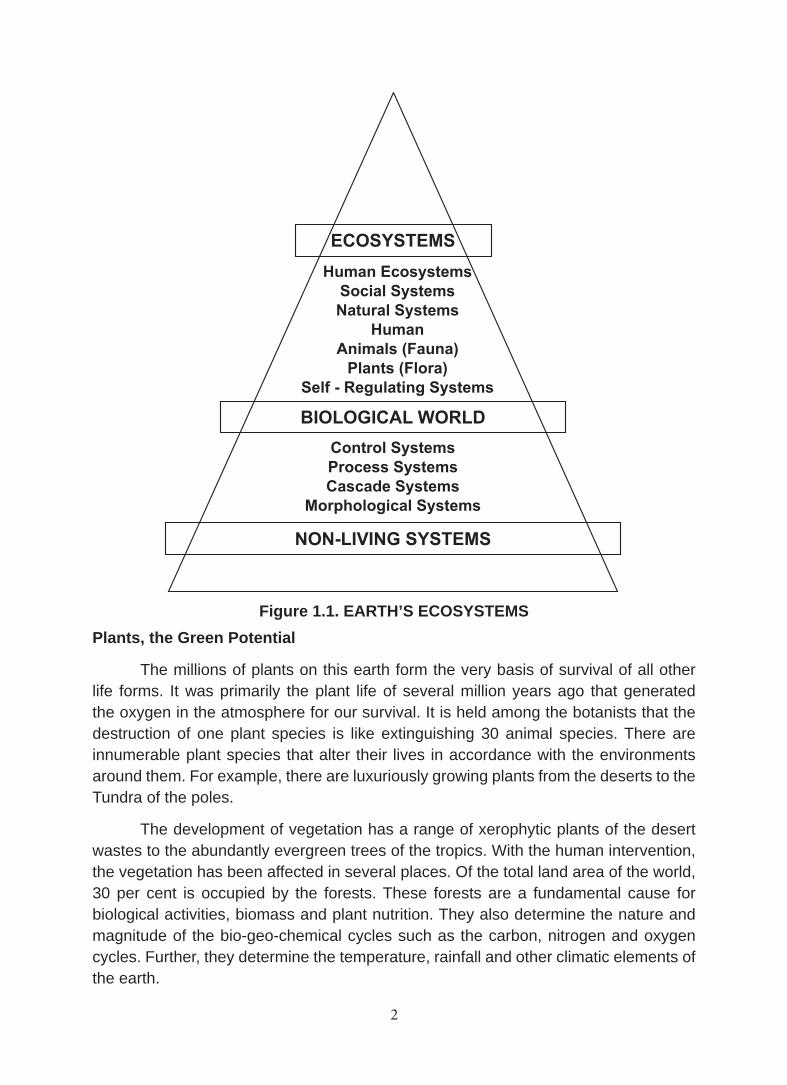
‘Place’ is an important concept in geography. ‘People’ are the most characteristic component of that place. Hence, of all ecosystems, human ecosystems have greater importance and value. It is for this reason this ecosystem is shown at the top of all the ecosystems (Figure 1.1). All the eleven ecosystems of the living things in a reverse order. The ecosystems 1-4 of the non-living things may be studied under physical geography.
2 3
ECOSYSTEMS
Human EcosystemsSocial SystemsNatural Systems
HumanAnimals (Fauna)
Plants (Flora)Self - Regulating Systems
BIOLOGICAL WORLD
Control SystemsProcess SystemsCascade Systems
Morphological Systems
NON-LIVING SYSTEMS
Figure 1.1. EARTH’S ECOSYSTEMSPlants, the Green Potential
The millions of plants on this earth form the very basis of survival of all other life forms. It was primarily the plant life of several million years ago that generated the oxygen in the atmosphere for our survival. It is held among the botanists that the destruction of one plant species is like extinguishing 30 animal species. There are innumerable plant species that alter their lives in accordance with the environments around them. For example, there are luxuriously growing plants from the deserts to the Tundra of the poles.
The development of vegetation has a range of xerophytic plants of the desert wastes to the abundantly evergreen trees of the tropics. With the human intervention, the vegetation has been affected in several places. Of the total land area of the world, 30 per cent is occupied by the forests. These forests are a fundamental cause for biological activities, biomass and plant nutrition. They also determine the nature and magnitude of the bio-geo-chemical cycles such as the carbon, nitrogen and oxygen cycles. Further, they determine the temperature, rainfall and other climatic elements of the earth.
2 3
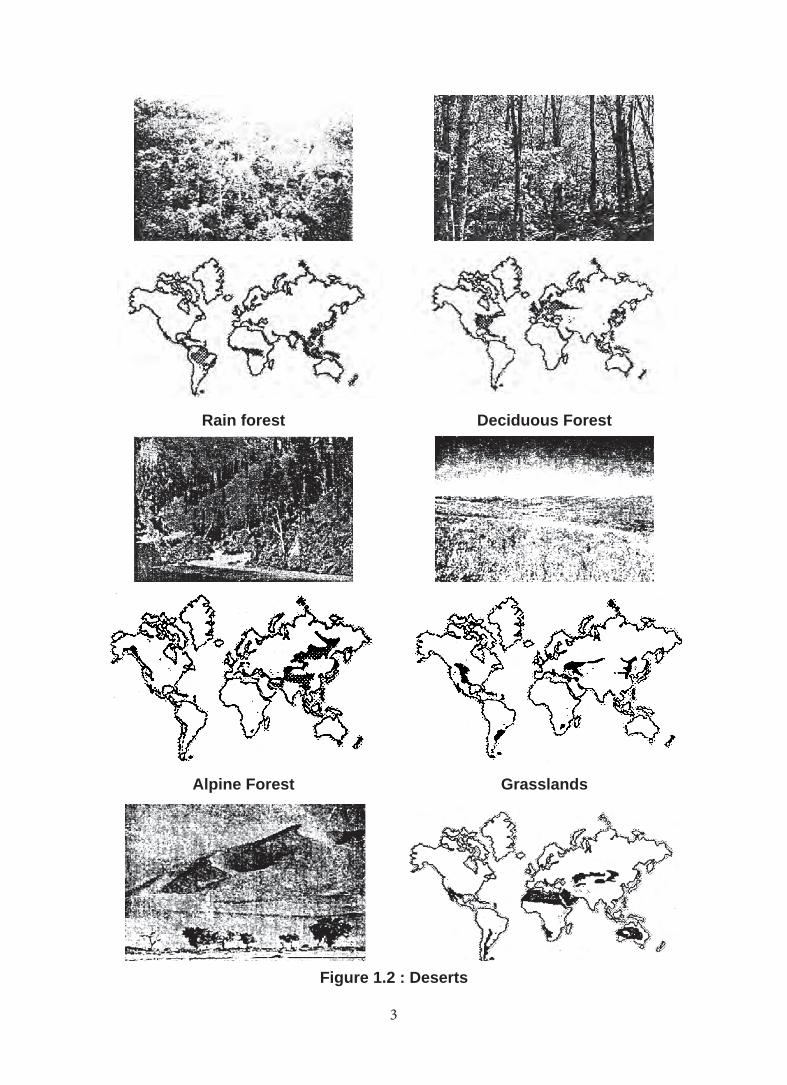
Rain forest Deciduous Forest
Alpine Forest Grasslands
Figure 1.2 : Deserts
4 5
Plants and Animals, The Biomes
The plant and animal communities of the biosphere living in a particular territory is called the ‘biomes’.These biomes adapt themselves to the prevailing environmental conditions of the surroundings.The biomes help us with a clear understanding that we require of the relationships among the ecosystems. Let us now see the interactions and relationships among the climate, soil, vegetation, animals and humankind. Based on their structural characteristics,the biomes can be classified, as follows(Figure.1.2 )
1. FOREST BIOMES
a. Coniferous forests
b. Temperate forests
c. Tropical forests
2. GRASSLAND BIOMES
a. Temperate grasslands
b. Tropical grasslands
3. DESERT BIOMES
a. Cold deserts
b. Tropical deserts
4. MOUNTAIN BIOMES
THE FOREST BIOMES
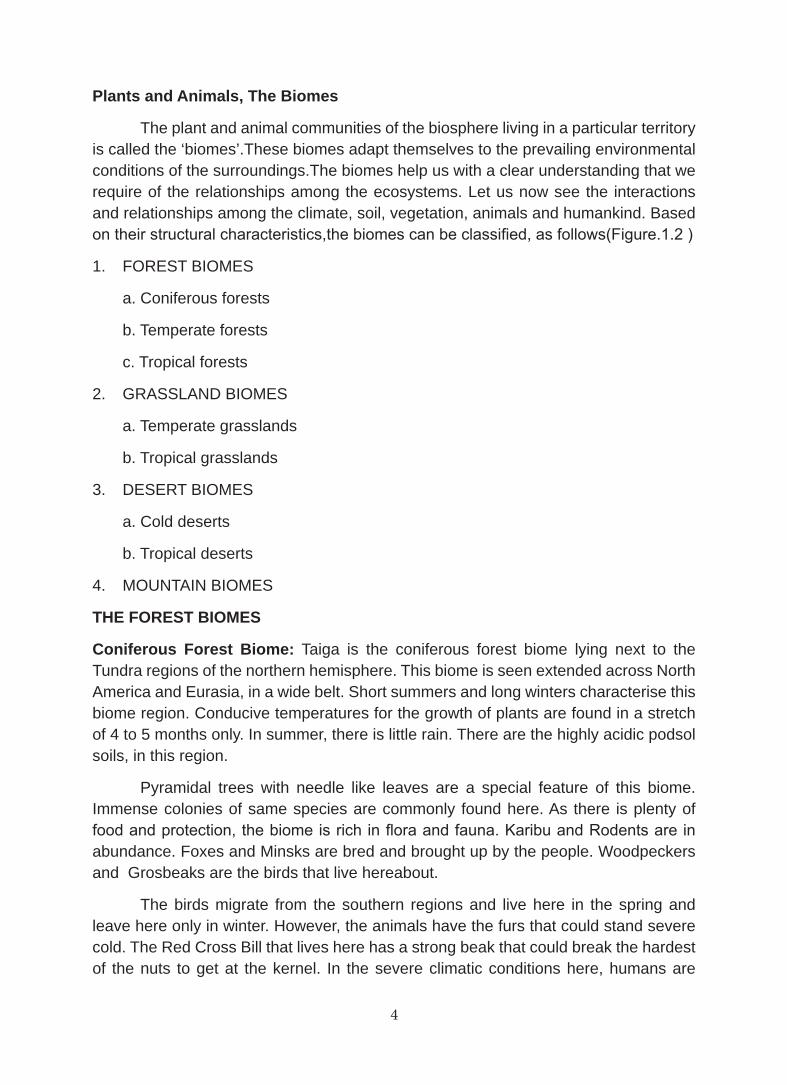
Coniferous Forest Biome: Taiga is the coniferous forest biome lying next to the Tundra regions of the northern hemisphere. This biome is seen extended across North America and Eurasia, in a wide belt. Short summers and long winters characterise this biome region. Conducive temperatures for the growth of plants are found in a stretch of 4 to 5 months only. In summer, there is little rain. There are the highly acidic podsol soils, in this region.
Pyramidal trees with needle like leaves are a special feature of this biome. Immense colonies of same species are commonly found here. As there is plenty of food and protection, the biome is rich in flora and fauna. Karibu and Rodents are in abundance. Foxes and Minsks are bred and brought up by the people. Woodpeckers and Grosbeaks are the birds that live hereabout.
The birds migrate from the southern regions and live here in the spring and leave here only in winter. However, the animals have the furs that could stand severe cold. The Red Cross Bill that lives here has a strong beak that could break the hardest of the nuts to get at the kernel. In the severe climatic conditions here, humans are
4 5
unable to live naturally. Further, this region is far away from the other regions of the world. Therefore, a vast expanse of several thousands of square kilometres remain uninhabited. The tribes here have hunting and fishing as the most important activities.
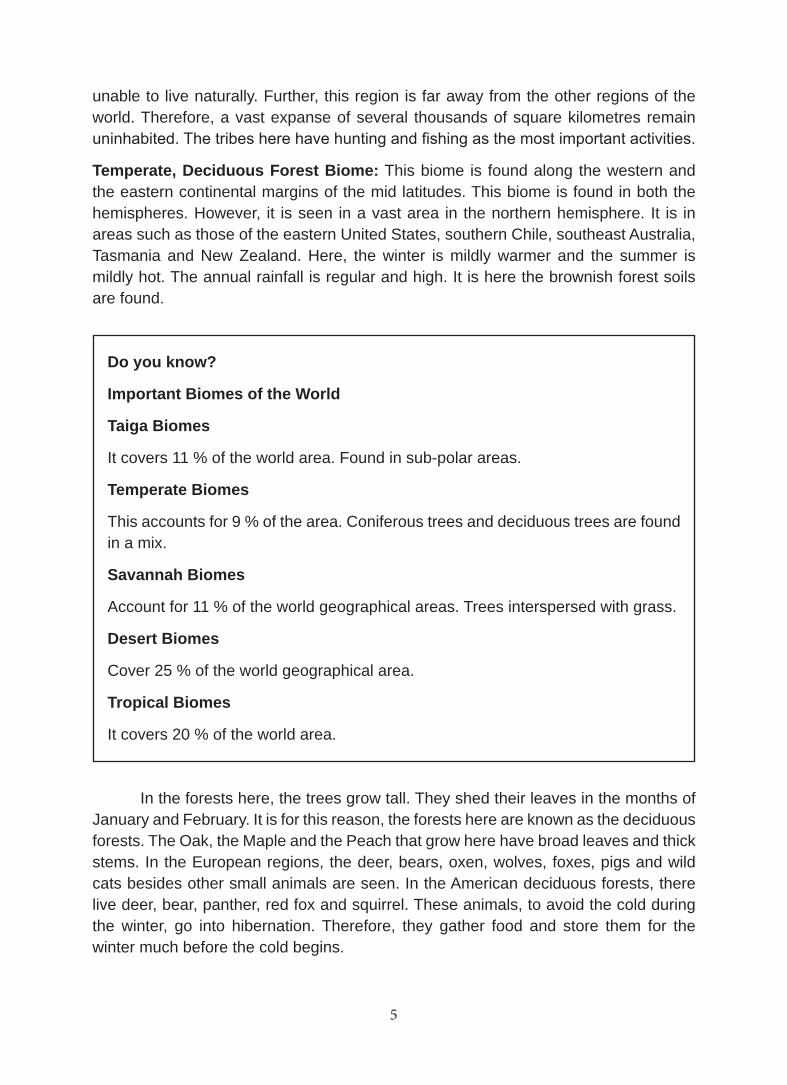
Temperate, Deciduous Forest Biome: This biome is found along the western and the eastern continental margins of the mid latitudes. This biome is found in both the hemispheres. However, it is seen in a vast area in the northern hemisphere. It is in areas such as those of the eastern United States, southern Chile, southeast Australia, Tasmania and New Zealand. Here, the winter is mildly warmer and the summer is mildly hot. The annual rainfall is regular and high. It is here the brownish forest soils are found.
Do you know?
Important Biomes of the World
Taiga Biomes
It covers 11 % of the world area. Found in sub-polar areas.
Temperate Biomes
This accounts for 9 % of the area. Coniferous trees and deciduous trees are found in a mix.
Savannah Biomes
Account for 11 % of the world geographical areas. Trees interspersed with grass.
Desert Biomes
Cover 25 % of the world geographical area.
Tropical Biomes
It covers 20 % of the world area.
In the forests here, the trees grow tall. They shed their leaves in the months of January and February. It is for this reason, the forests here are known as the deciduous forests. The Oak, the Maple and the Peach that grow here have broad leaves and thick stems. In the European regions, the deer, bears, oxen, wolves, foxes, pigs and wild cats besides other small animals are seen. In the American deciduous forests, there live deer, bear, panther, red fox and squirrel. These animals, to avoid the cold during the winter, go into hibernation. Therefore, they gather food and store them for the winter much before the cold begins.
6 7
The deciduous forests are not as widespread in the southern hemisphere as they are in the northern hemisphere. In the forests of Chile, the Peaches are the dominant. In Australia and New Zealand, there are unique plants and animals.
Except for the forests of the Mediterranean, the other forest biomes of this variety elsewhere are being changed much by the humans. In Eurasia, this biome is the target for human settlements. The prevalent environment here is conducive to human life and living. Therefore, a large number of people live here. They are engaged in fishing, mining, timbering and industrial activities. In recent times, these areas have been occupied by the humans and have been converted into settlements and dairy farms.
Tropical Biome: This includes the rain forests of the equatorial region and the tropical deciduous forests. The tropical rain forests are found in the Amazon and the Congo valleys, East Indies, India and Myanmar. In the equatorial regions of high temperature and high rains, there is profuse tree growth. These supply oxygen to the atmosphere in large quantities. In these forests, there are trees, bushy plants, creepers, parasites and epiphytes and hundreds of thousands of other species.
The vegetation is organised in ways suitable to high temperature and heavy rainfall of the region. To get at the sunshine, the trees grow tall. To help with high evapotranspiration, the leaves are broad and with wider pores. The stems of the trees are propped up by the aerial roots.
As the tropical rain forests are thick, there are marshes. The reptiles and the other animals show characteristics typical of the environments. And as it is difficult to move about through the thick forests, large animals live at the edges of these forests. In the thick forests, there are innumerable insects and furless animals. Further, they live on the leaves and fruits of the forests. For example, the gorillas and the monkeys and the leopard that live on these are found in the mangroves.
In the islands of Malaysia and the Philippines of the East Indies, these forests have been cleared and plantation crops are grown. Rubber in Malaysia and cocoa in Africa and South America are grown in these areas.
GRASSLAND BIOMES
Temperate Grassland Biomes: In mid latitudes, these biomes are in the continental interiors. These biomes include the plains of North America, Steppes of Eurasia, Manchuria plains, Argentina Pampas, African Velds and Australian Downs. In certain places in these areas, the temperature is below the dew point. It is extremely cold during the winter and high temperatures during the summer. In the southern hemisphere, there is mild cold. In Argentina, with the exception of the Pampas, in other areas the rainfall is light.
6 7
Mo
ha
ve
So
no
ran
Ch
iha
uh
ua
n D
ese
rt
Gre
at
Ba
sin
Co
lara
do
De
sert
Sa
ha
ra D
ese
rt
Ara
bia
n D
ese
rt
Ata
cam
a D
ese
rt
Pa
tag
on
ian
De
sert
Ka
lah
ari D
ese
rt
Na
mib
De
sert
Th
ar
De
sert
Ira
nia
n D
ese
rt
Kyz
yl -
Ku
m D
ese
rt
Ka
raK
um
De
sert
Go
bi D
ese
rt
Takl
ma
kan
De
sert
Gre
at
Sa
nd
y D
ese
rt
Gib
son
De
sert
Gre
at
Vic
toria
N
Su
b T
rop
ica
l De
sert
Co
ld W
inte
r
Co
ol C
oa
sta
l
De
sert
s o
f th
e
Wo
rld
Fig
ure
1.3
8 9
The soils and the grasslands have intimate relationships. There is a black soil with rich plant nutrients. There are numerous grazing animals. Squirrel and dog, wolves and foxes, and the forest animals like the leopard and very many insects are found here. The animals that require special mention are the kangaroos of Australia, zebras of South Africa, wild horses of Eurasia, bisons of North America and so on.
These grasslands are of economic importance. The natural biomes of the area have been changed and new ones have been developed by the humans. The tribes of the grasslands were engaged in a life of nomads. Later, the Europeans have changed these grasslands into cattle farms and grazing lands in a big way. They have followed crop cultivation in the fertile Chernozem. In course of time, the industrialisation of the cropped lands occurred.
Tropical Grassland Biome: This is also known as the Savannah. The African Savannahs, Australian Savannahs and the South American Campas are included in these grassland biomes. The climate is characterised by high temperatures throughout the year and summer rains. There are three seasons, namely, cold dry season, hot dry season and temperate rainy season. The sandy dry gravel soil is found here. In the African Savannah, there is a wide variety of wild animals. Particularly, African elephants, rhinoceroses, hippopotamuses and lions are the common elements.
The impact of human activities is high in this biome. The bushmen and the Kirkiz are big time hunters. As the hunting was followed by even the modern people, the big animals like the elephants have become nearly extinct. In these grasslands, shifting cultivation is still largely followed to grow millets, groundnut and pepper. In East Africa, the plantation crops were introduced by the Europeans. Examples: coffee, cotton, and tobacco.
DESERT BIOMES
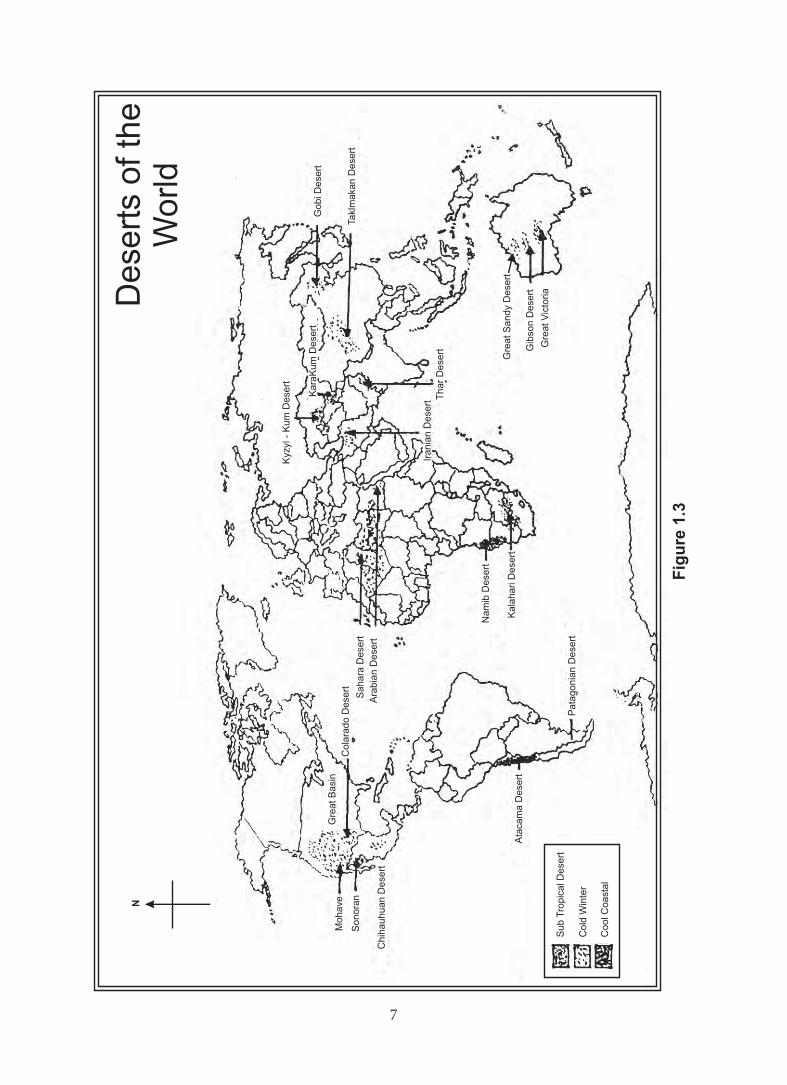
Desert has an intimate relation with the quantum of rainfall. They are rain deficient regions. They are found in areas with less than 250 mm of rainfall in a year. Deserts are of several types. Using moisture content, they may be classified as arid and semiarid deserts, hot and cold deserts. All deserts have similar basic characteristics; that is, they all have scanty rains throughout the year (Figure 1. 3).
Cold Desert Biomes: The cold deserts are in the northern hemisphere around the pole and in continuous stretches. In North America, they stretch from Alaska until Labrador and then until the edge of Greenland. In Eurasia, these are found from Scandinavia to the eastern fringe of Siberia. In the southern hemisphere however there are the seas instead of Tundra.
In Tundra, there are hills and highlands, together with gently undulating plains. In the long winters, it is covered with snow, for almost seven long months. For many weeks or months, the sun does not shine here. Due to this, there is a high pressure, characterised by extreme cold and dry winter conditions. The annual rainfall is highly
8 9
small. In winter, the soil is frozen. When the sun begins to shine, the snow begins to melt. The melting water does not infiltrate the soil, rather it forms the lakes.
The Tundra vegetation varies from place to place. In summer, there are grasses, lichens, mosses and short plants. Although the flora is few in number, there is a great variety of animals. Most animals are herbivores and migratory. Karibou, reindeer, musk oxen, polar rabbits and foxes are some of the cold desert animals. Lemmings live here through the year. The rabbits and foxes change their colour to pure white during the winter. The musk oxen have the skins with grey furs.
Lemmings have a strange life cycle. They breed fairly rapidly and multiply to a great number in about three years. This done, the armies of Lemmings travel towards the sea. They travel by night, until they reach the seas. Then they swim through the water until they die. In these parts, the conditions conducive for human living are but a few. In North America, Eskimos are a people of small numbers. They depend mostly on the sea biomes for their food. Lapps of the Eurasian lands move south during the winter, although their movements are increasingly being restricted to certain pockets.They get most of their food needs satisfied with the milk and meat and their clothing from the skin of the reindeer.
Hot Deserts. Most important of the hot deserts are the Sahara and its extensions. The Arabian desert, Thar, Kalahari, the West Australian deserts, Atacama and Californian deserts are the other hot deserts. The plants of these deserts are able to withstand the dryness. They are so structured as to adapt to these conditions. Narrow leaves, chlorophyll rich stems, deep and penetrating roots, protective spikes and small thorns are the characteristic features. The plants are spaced out because of the scarce groundwater sources.
In the deserts, like the plants, the animals are also limited in number. They are able to bear the drought and the heat of the deserts. Animals like the camel, mountain goats and other small animals live in the deserts. Camels drink as much water as they get when available and stay without water for long periods. Some rodents of the desert live on dry vegetables and fruits. Some small animals are nocturnal in their search for food and they stay holed up in their burrows to avoid the day temperatures. Smaller insects have wax coating to protect them from the heat.
People are sparsely distributed in the deserts. They do not stay permanently in a place but lead a nomadic life. We find some of the desert tribes in the deserts even today.
MOUNTAINOUS BIOMES Apart from the great biomes above, there are mountain biomes which differ in their characteristics in accordance with the changing temperature regimes. In the Rockies of North America, the Andes of South America, the Alps of Europe and the Himalayas of Asia consist of all biomes so far described in respective climatic zones of the mountains.
10 11
Harvesting Forests
As the forest products are commercial in nature, they have a global, commercial potential; they are on the increase, as well. Japan and the West European countries import timber products in very large quantities. Timber industry is likely to grow, according to the experts, to 6 billion trees from the present 3 billion trees. In the developed countries, 200 million tonnes of wood pulp is produced. As the literacy is increasing in the developing countries, there is greater use of newsprint. In countries like Brazil and India, the use of newsprint has already doubled.
As hard wood is required for industrial purposes, it is mostly obtained from the tropical forests. Wood is exported in great quantities from the Southeast Asian countries. In these countries, more than half the trees in the forests have been felled for this purpose. Only in recent times, the Governments of these countries have taken efforts towards preventing the destruction of the forests.
Shrinking Forests
Twelve million hectares of forests are being cut every year, for use by human beings. The area of annual forest destruction is estimated at an area which is as big as the United Kingdom. The fast declining forests have brought in changes in the functions of ecosystems. A forest being destroyed for meeting the needs of the humankind can be replaced in about 10 years. On the contrary, the areas of deforestation used by humans for agriculture and settlements usher in changes in the ecosystem configurations.
Problems. If the vegetation systems at the watershed areas are destroyed, they give rise to several problems. As long as the forests in these areas survive, the waters of the rivers could be pure and clear. But as we destroy the forests in these areas, there could be floods and droughts in the low reaches. Furthermore, as a result of soil erosion along the slopes, there is siltation in the floodplains. With the siltation, dams where hydroelectricity is produced and fishing are greatly affected.
With the destruction of tropical forests, the climate is also impacted upon. The forest ecosystems of the Amazon absorb most of the solar radiation. As it is destroyed, progressively, the area is heated up by the radiation which in turn heats the atmosphere; this affects the atmospheric equilibrium. This is thus a reason for global warming.
Forest Management. Tropical and temperate ecosystems consist of different biomes. As such, the managerial strategies must differ as well. To protect the ecosystems, the following strategies are being followed: Renewal of the watershed, social forestry and sustainable systems.
Renewal of the Watershed. Several countries of the world have come to realise the importance of the forests. In response, they have begun to renew the forests of the watersheds. But such efforts are a few and at small scales. It is expected that such strategies would become widespread.
10 11
Social Forestry. Internationally, such forests have been welcomed in several countries. The governments of these countries motivate their people to grow social forestry to meet the needs of fuelwood. In India, in the several states of the Union, school children grow trees under this programme.
Sustainable System. Agro-forests have become in many places sustaining systems. In these forests, crops and trees are grown side by side. Unutilised forest areas and the field edges have now become important resources for increasing crop productivity. Particular tree varieties help fix nitrogen in the soil. As a consequence, lands of low quality are turned into lands that could be utilised for cropping.
Sea Ecosystems
Of the planets of the solar system, the earth we live in alone has water in plenty. Nearly 97 per cent of all waters are in the seas. These seas and oceans are a reservoir of heat. Therefore, the seas are generally hot in summer and cold in winter. Of the solar heat reaching the earth, a fourth is used in evaporating the sea.
The sea surface temperatures vary from place to place. In the equatorial regions, it is high and it is progressively low as we go from the equator to the poles. In the sea water, there is a high concentration of mineral salts and salinity. Salinity also differs from place to place. The ratio of salinity depends upon the addition of freshwater in the seas and the rate of evaporation. Waves, tides and currents are the movements of the ocean waters. They influence the temperature, moisture and rainfall of the coastal areas they flow to. Cold currents bring with them the planktons from the poles and the sub-polar regions. The mixing of warm and cold currents helps with the proliferation of ocean /sea organisms along the continental shelves. You are already aware that the living organisms appeared first in the seas. The vegetation and animals of the seas are quite different from the flora and fauna of the land. They live in the continental margins, islands and in the deep seas.
Among the sea ecosystems, there are four major and very important ecosystems useful for humankind. They are: the wetlands, the marshes, the estuaries and the coral reefs.
Temperate tidal lands become wetlands and the tropical tidal lands become marshes. In these lands, the sea grasses and the flowering plants are abundantly seen. These plants are consumed as food by the shell fish and the shrimps. They are the food stored for the temperate geese and flamingos. Further, they are a filter for the wastes from land and prevent sea erosion along the coast. As the fresh and brackish waters meet at the estuaries, these waters are conducive environments for crabs, oysters, prawns and shell fish. Thus the estuaries are a suitable environment for sea organisms.
12 13
Of the sea ecosystems, one is of the coral reefs. There are several different organisms living with them. These are also the ancient of the ecosystems. Corals have existed from the very beginning of the sea life.
Before growing as colonies, they generate chemical products and expand their areas of colonisation. With the metamorphosis of the chemical products, other organisms are unable to colonise these areas. To provide resistance to the disease causing germs, the humans use them as raw materials for medicines.
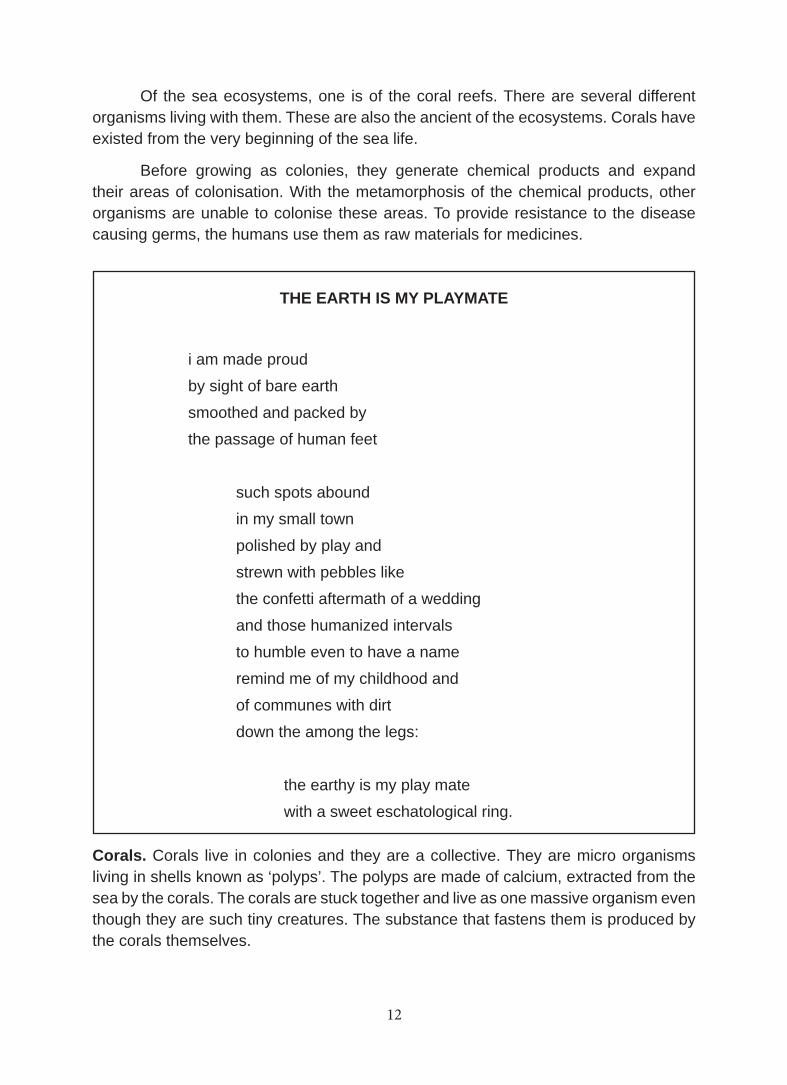
THE EARTH IS MY PLAYMATE
i am made proud
by sight of bare earth
smoothed and packed by
the passage of human feet
such spots abound
in my small town
polished by play and
strewn with pebbles like
the confetti aftermath of a wedding
and those humanized intervals
to humble even to have a name
remind me of my childhood and
of communes with dirt
down the among the legs:
the earthy is my play mate
with a sweet eschatological ring.
Corals. Corals live in colonies and they are a collective. They are micro organisms living in shells known as ‘polyps’. The polyps are made of calcium, extracted from the sea by the corals. The corals are stuck together and live as one massive organism even though they are such tiny creatures. The substance that fastens them is produced by the corals themselves.
12 13
Corals live only in the tropical seas. They cannot survive in waters with temperatures below 20o C. Hence, they are not found in areas of high latitude temperate regions. They are normally found between 30o N and 30o S. The food and the warmth they require are obtained from the ocean currents. Like the plants, they require sunshine as well. So they are found beneath the sea waters but only until where the sun’s rays penetrate and where the temperature is warm enough for their comforts. Waves however hamper their growth. It is for this reason, they are found growing along the coast, hanging on to the land. The wave-cut platforms provide for a place for the corals to attach to.
Corals are of three types. They are: Fringing reef, Barrier reef and Atoll.
In the southern seas of India, we have fringing reefs. Lakshadweep islands are entirely made of corals. In the Caribbean also, there are coral islands. Right along the east coast of Australia, there is great barrier reef stretching for thousands of kilometres. They are now tourist and recreation spots. Tourists flock these places in large numbers to see the colourful variety of sea animals around the reefs. There are therefore diving facilities in these regions.
Atolls are the complex coral features, raised around the islands by coral colonies over thousands of years. In between, there is a shallow lagoon. In these atolls, the corals get exposed as the water in the lagoon goes down. Atolls, it is said, have a fascinating origin.
Apart from these sea organisms, there are several others: plankton, necton and benthos.
The floating, micro organisms are normally known as the planktons. With the movements of the seas, the planktons migrate along with the currents and oceans. Diatom is a plankton with a single cell. Nectons are swimming organisms. Fish, whales, and seals are nectons. A majority of the sea animals migrate for food and breeding. The mammalian seals are a restless animal, moving hither and thither. Some of the whales migrate from cold waters into warm waters.
Algae are sea mosses seen on surface of the sea waters. On the contrary, those that are found beneath the sea surface are benthos. In these, there are moving and non-moving creatures. For example, large sea crabs, shells, star fish and worms are the moving creatures. Sea plants, sea weeds, mosses, corals, oysters and sea foams are non-moving varieties. Benthos live in areas where the sun penetrates deep into the waters. They are also found in deep oceans in certain areas.
The sea organisms described above are in some way useful to the humans. Consumer commodities such as cosmetics, shampoo, dyes and lubricants are all manufactured using sea organic raw materials. At the same time, the oceans and seas are being polluted by the human activities. The wastes from the cities, industries, atomic reactors and oil refineries are being dumped into the sea along the coast,
14 15
causing concern for pollution. The pollutants from these affect the sea organisms and also destroy them. If we do not control the pollution of the oceans now, the living seas may one day become the dead seas.
Learning Outcome
At the end of the lesson, the students have a great appreciation for the multitudes of life forms, of plants, animals and humans.
EXERCISES
I. Fill in the Blanks
1. Micro organisms that float in the seas _______________.
2. The organism that swims and belongs to the species of whales ____________
3. Coniferous forests are a _____________________ biome.
4. _____________________ is a temperate grassland biome.
5. _______________________ is the world’s ancient Ecosystem.
II. Choose the Correct Answer
6. The biospheric plant and animal communities that are con fined to a territory.
a) biomes b) ecosystem
c) ecology d) earth
7. The plant biomes that are found beneath the seas.
a) plankton b) necton
c) benthos d) corals
8. Equatorial rain forests, tropical deciduous forests.
a) forest biomes b) desert biomes
c) taiga biomes d) savannah biomes
9. A contiguous stretch of biome around the poles.
a) tropical seas b) cold desert
c) temperate regions d) grasslands
14 15
10. Temperate tidal lands.
a) wet lands b) grass lands
c) marshy lands d) waste lands
III. Brief Answers
11. Biomes.
12. Necton.
13. Benthos.
14. Coral reefs.
15. Estuary.
IV. Paragraph Answers
16. Wetlands.
17. Marshy lands.
18. Temperate grassland biome.
19. Cold desert biome.
20. Tropical biome.
V. Detailed Answers
21. Classify the types of Biomes? and Explain any one type in detail?
22. What are the forest products? Explain the strategies to be followed to protect forest?
23. What is meant by corals? What are its types?
VI. Practical Exercises
24. Discuss about the biomes in your area.
25. List the types of biomes and describe in short.
26. Prepare a scrap book with pictures of sea organisms.
27. Draw the biomes of grasslands on the world map and colour them.
28. Go on a fieldwork to the sea coast to collect materials for an exhibition.
16 17
UNIT 1BIOSPHERELESSON 2
THE HUMAN POTENTIALLearning Objectives
Students learn about the human potential available in the world and also understand and appreciate human evolution, civilisations, growth and distribution, densities of the world, structure and composition, what the age-sex pyramids foretell for the future and a gamut of other related things.
Human Evolution
There are some new insights into the human evolution that have come to light in recent years. One of them is that the humans appeared in the dense forests of Africa some 4 million years ago. The second of these is that all the human fossils we have until now located or found are of erect human beings. A research related to a recent find from Indonesia has suggested that the homo erectus of this find is far more different than those of the African species. The researchers believe that there were situations conducive for the emergence of two separate human-like beings. One may have evolved into an African homo sapiens and the other an Asian homo sapiens. A skull of the Asian homo-sapiens has been found in China. This has shown that the homo-sapiens must have lived here even 200,000 years ago.
It has also been discovered that the African homo-sapiens used tools made of stone whereas the Asians used tools made of bamboo. These findings support the view that humans may have moved out of the places of their origin immediately after their emergence. The African branch may have moved out of the tropical cradles and the Asian may have done the same. The two branches may have been responsible for the emergence of a strong homo-sapiens group which may then have evolved into the fittest of our ancestors, from whom all the present human beings must have descended.
In sum, the present day humans have evolved over a long time into the intelligent beings they are, by a process of evolution which facilitated their intelligent ancestors to develop into the one species and but different races they belong to.
Human Civilisations
In their 2 million-year history, the humans lived mostly in close relations with the Nature. For us, who are much different from what they were, their efforts and progress are not immediately apparent. We think the history of the last 10,000 years has no parallel. But we still appreciate, and what we do know about, is that when they
16 17
first began to stay at one appropriate place, they had already sowed the seeds of civilisations. Civilisations emerged some 5000 years ago. The villages significantly in the forefront were indeed the places where agriculture flourished. The small villages of those years were the beginning of the civilisations. When growth in production and therefore surplus occurred, trade and industrial development prospered. Cities and towns were built. Small towns and cities grew into big cities and towns. They became densely populated and congested. Science and technology developed. Revolutions happened. There were, side by side, hardships and suffering. In the midst of the civilised, some uncivilised behaviours lifted their heads. Economic and social discrimination became the order of the day. There was, and is, gender bias. And all these continue till this day, changing the lives of the people of world.
At the height of building civilisations, thousands of settlements came into being in the Indus Valley. In the cities of Mohanjodaro and Harappa, there were more than 30,000 population each. In the course of making the civilisations, the nomads moved out of their origins and travelled far and wide. The nomads who moved out of Central Asia transformed the Roman and the Chinese civilisations.
Then came the world religions. The religions which professed love and peace in the beginning ushered in widespread suppression and authoritarian tendencies. In the meantime, slave trade, forced displacement of people and population dispersal had occurred worldwide with far reaching consequences. Newer civilisations were built. The Greeks, the Romans, the Indian and the Chinese developed and enriched philosophy and sciences. The Arabs developed astronomy. In different eras of the historical times, knowledge, technologies and civilisations progressed with salutary effects.
Progress in Civilisations
In the sixteenth and seventeenth centuries, the sea navigational successes of the European continent have brought revolutionary changes in human knowledge. The discovery of sea routes through sea travels by Columbus, Vasco-de-Gama and Megallan was accomplished. It was made clear that the earth was a sphere. Soldiers, merchants, religious missionaries and administrative experts travelled the world with them. Several countries turned into empires and colonies. These developments made possible the development of a social and cultural geography. Then came the thirst for freedom. There were protests against the colonisers. Aggression became the order of the day. Non-violence has also become the political means. All countries of the Latin America, United States of America, Asian and African countries became independent, one after another. The World Wars were bought, in between. There came economic depression/recession and revival.
Even though the countries of the world today are all independent and free, there are invasions. Colonisation has not been completely eliminated. There are colour prejudices still. Famine and poverty still remain unresolved problems that are a result of political manoeuvres. There were discriminations in the name of East and
18 19
West and South and North and they have now become slightly subdued. Human brotherhood is realised once a while with ideologies such as those of ‘One World’ and ‘Our Common Future’. Even as we knew that ‘United, We prosper; Divided, We face destruction’, there emerged an unification (Germany) and disintegration (Soviet Union). With all round progress, poverty still haunts the majority. Terrorism or militancy and fundamentalism turn the civilised into the uncivilised. Health in an unhealthy life and peace in a tumultuous life become the much sought after. These are the painful characteristics of the civilisations today.
Growth, Distribution and Density
Evolutionary changes and growth of knowledge made human beings the ‘homo sapiens’ they are today. Cultural Development that occurred in course of time paved the way for multiplication of humankind. In recent years, the explosion in population numbers became a hurdle in the way of human progress. In the twentieth century, population growth has become a crisis. Humans are considered a world resource. If so, then what is the need to decrease its numbers? Let us see, in this lesson, how this growth, in fact unprecedented growth of population, is a hurdle in the path of social and economic development.
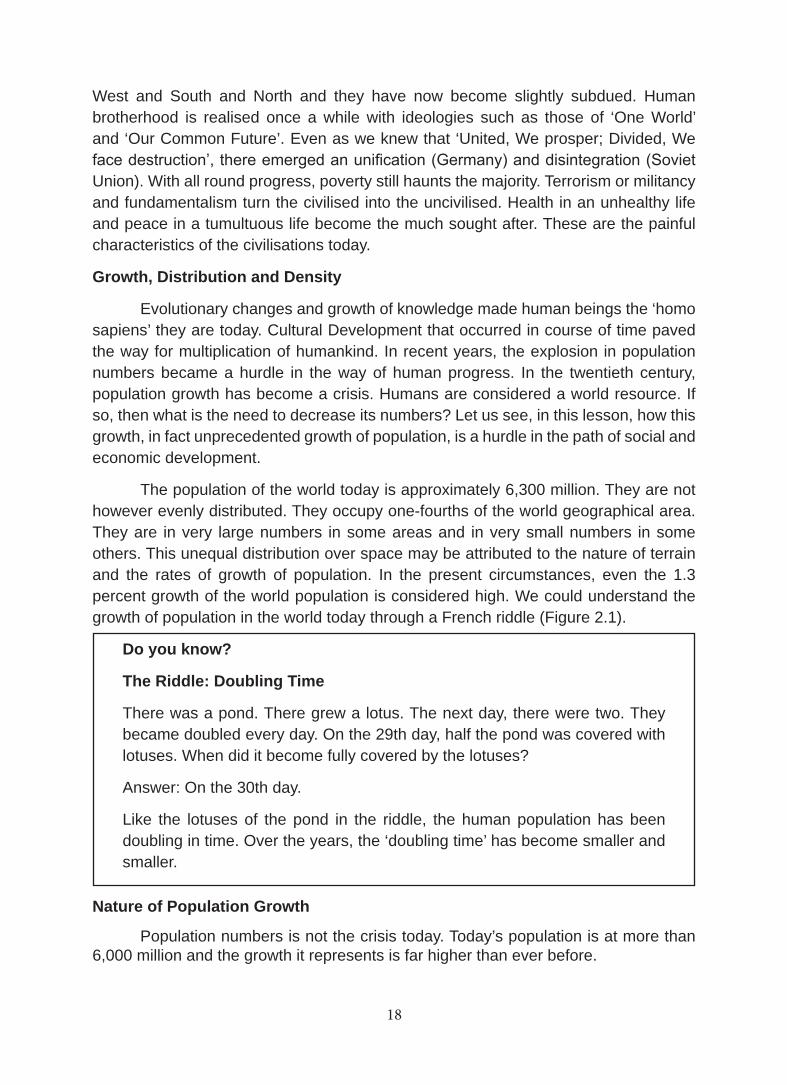
The population of the world today is approximately 6,300 million. They are not however evenly distributed. They occupy one-fourths of the world geographical area. They are in very large numbers in some areas and in very small numbers in some others. This unequal distribution over space may be attributed to the nature of terrain and the rates of growth of population. In the present circumstances, even the 1.3 percent growth of the world population is considered high. We could understand the growth of population in the world today through a French riddle (Figure 2.1).
Do you know?
The Riddle: Doubling Time
There was a pond. There grew a lotus. The next day, there were two. They became doubled every day. On the 29th day, half the pond was covered with lotuses. When did it become fully covered by the lotuses?
Answer: On the 30th day.
Like the lotuses of the pond in the riddle, the human population has been doubling in time. Over the years, the ‘doubling time’ has become smaller and smaller.
Nature of Population Growth
Population numbers is not the crisis today. Today’s population is at more than 6,000 million and the growth it represents is far higher than ever before.
18 19
20 21
At the time of Christ, the world population was estimated at less than 300 million. But this increased to 600 million in the 18th century. It crossed the 1,000 million mark by the year 1820 A.D. At the turn of the 20th century, it was 2,000 million. In 1960, it increased to 3,000 million. It was estimated that it might double itself by the turn of the 21st century. This growth through the ages indicates to the fact that what was doubling once in 1,700 years has acquired the capability to double in just about 30 years. It is in fact difficult to imagine the kind of growth the human population is capable of.
Do you know?
How fast is the world’s population growing?
The world’s current growth rate is about 1.3 per cent, representing a doubling time of 54 years. We can expect the world’s population of approximately 6 billion to become 12 billion by 2054 if the current rate of growth continues. The world’s growth rate peaked in the 1960s at 2% and a doubling time of 35 years.
The world’s average annual growth of population now is about 1.3 per cent. Even though it appears small, in real terms this increases the population numbers rapidly. This growth rate is again uneven the world over. There are now about 1,000 million people in the developed world and more than 4,000 million in the developing world. If the growth prospects continue in the same fashion, then the developed world will have less than 2,000 million while the developing world double the existing in about 30 years.
Determinants of Population Growth
In the early times, humans were either hunters or food gatherers. Later, humans came to depend on agriculture for their livelihood. He lived according to the tenets of nature, even in areas considered most developed today. There were then checks to population growth. Plaque, diseases, famine, floods, fire and wars acted as the controls for population growth. Only the fittest survived. There are still some areas of the world which show similar circumstances. There were fundamental changes in the growth of population, in the last 400 years. Agricultural and industrial revolutions began in England. As a consequence, there was economic, industrial and scientific progress in the world over. Increasing economic production supported the increasing population. The improvements in medical care, health, flood control and fire protection helped to control the natural loss in the population. Hence, there were increasing births. There were low death rates too. As the rates of birth were smaller than the rates of death, globally, the rates of growth increased.
Working Potential
Human numbers are indeed a great resource. But if it increases uncontrollably, then it cannot improve the quality of life. We need therefore a working potential, in any country, corresponding to the population numbers. Thus, human working potential is
20 21
an essential resource along with the natural resources potential. Every human being requires his working potential for his/her welfare. However, it is not easy to bring out this potential. Individuals acting alone cannot lead their country towards developmental success. This means that human beings acting in cooperation with others could lead to an appropriate understanding of development efforts and also to an increase in human knowledge. For example, estimates have it that if 2.6 million people of ages between 15 and 64 years work together in a collaborative effort, for an hour, their working potential would be equivalent to 200 million kilowatts of electrical energy.
22 23
While this is so, not only the collaborative efforts of human beings but also their indiv idual efforts are essential in the development of any country. Hence, it is necessary to extract the complete working potential of a country with an appropriate technological potential. Particularly, in the developing countries there is a large human resource. With the shortfall in their basic minimum needs, however, there are limited opportunities for extracting the working potential. Sometimes, social neglect, violent and antagonistic events make it even more difficult. In many countries of the world, the working potential of women and unemployed youth is not fully utilised. Therefore, where this working potential gets fully utilised, then that country leaps forward in development and quality of life.
22 23
Basic Necessities of a Healthy Life
Quality of life for human beings demand nutritious food, low infant mortality, high enrollment in primary education, literacy, housing, improvement in social security, right to live, political freedom, employment opportunity and long life. With increases in population numbers, there is a corresponding increase in these basic needs as well. Although the world’s most populous Chinese believe that ‘humankind is the most characteristic phenomenon on the earth’, they also recognise that ‘more the Chinese, the larger will be the poorer Chinese’. Hence, they began to control their numbers in a systematic way. Many believe that no country would equal the Chinese efforts at population control. But they also realise that the Chinese have lost their individual freedom because of these efforts. Countries like India have made, and are making, efforts towards decreasing their numbers.
Structure, Composition and Population Explosion
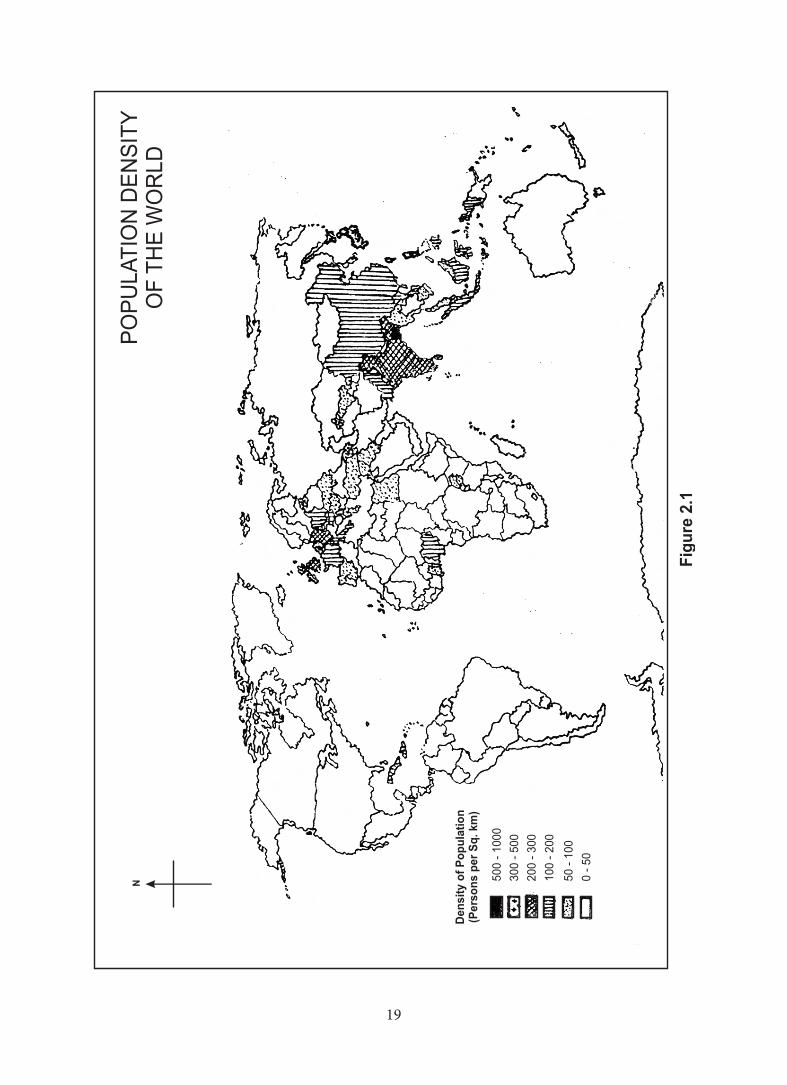
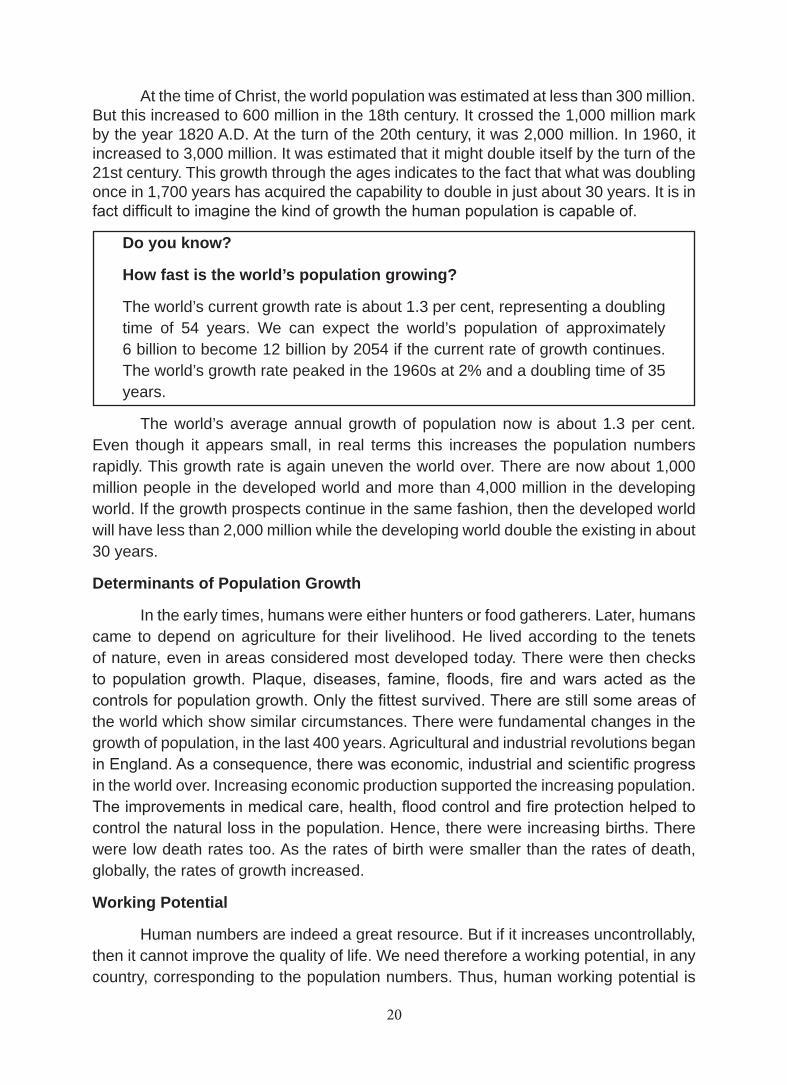
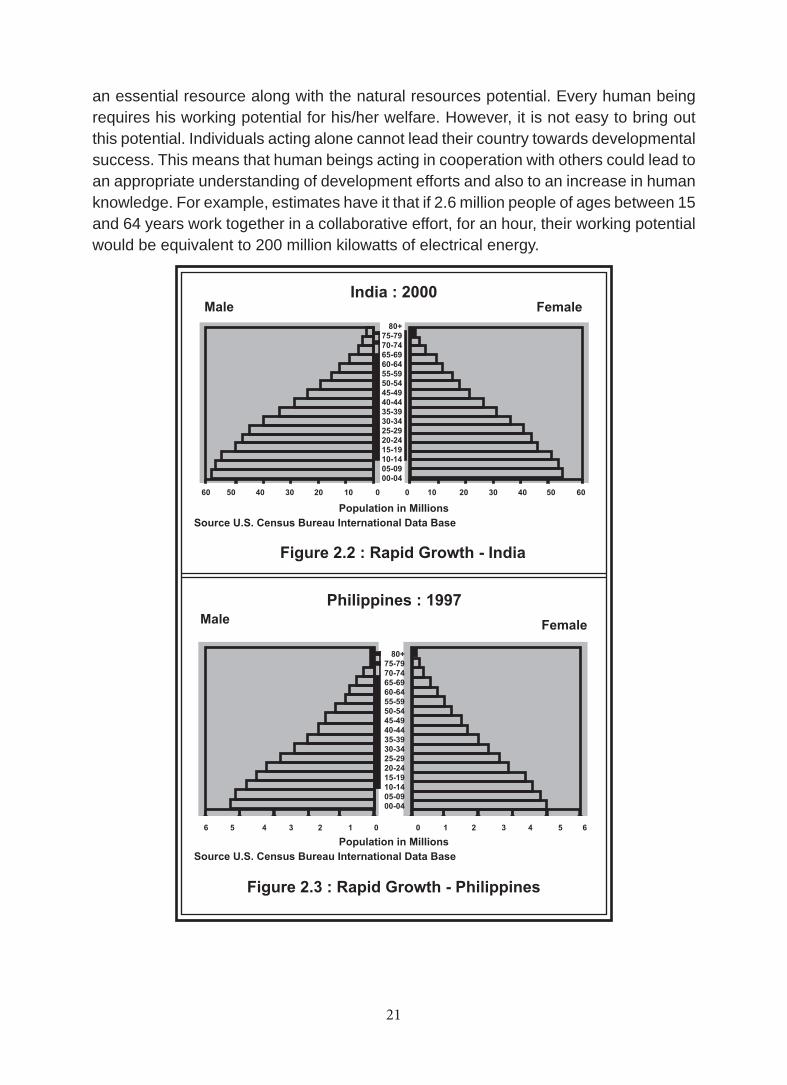
For improvement in life, people with working potential are far more important than the mere large number (size) of population. The age-sex pyramid gives us an understanding of the working potential available within a given population. In fact, the working potential of a country can be detected from the shape of the age-sex profile. On the basis of age, the human potential can be classified into three classes:
1. Children, non-productive age group (0-14 years)
2. Productive, adult population (15-64 years)
3. Non-productive, elders (more than 65 years)
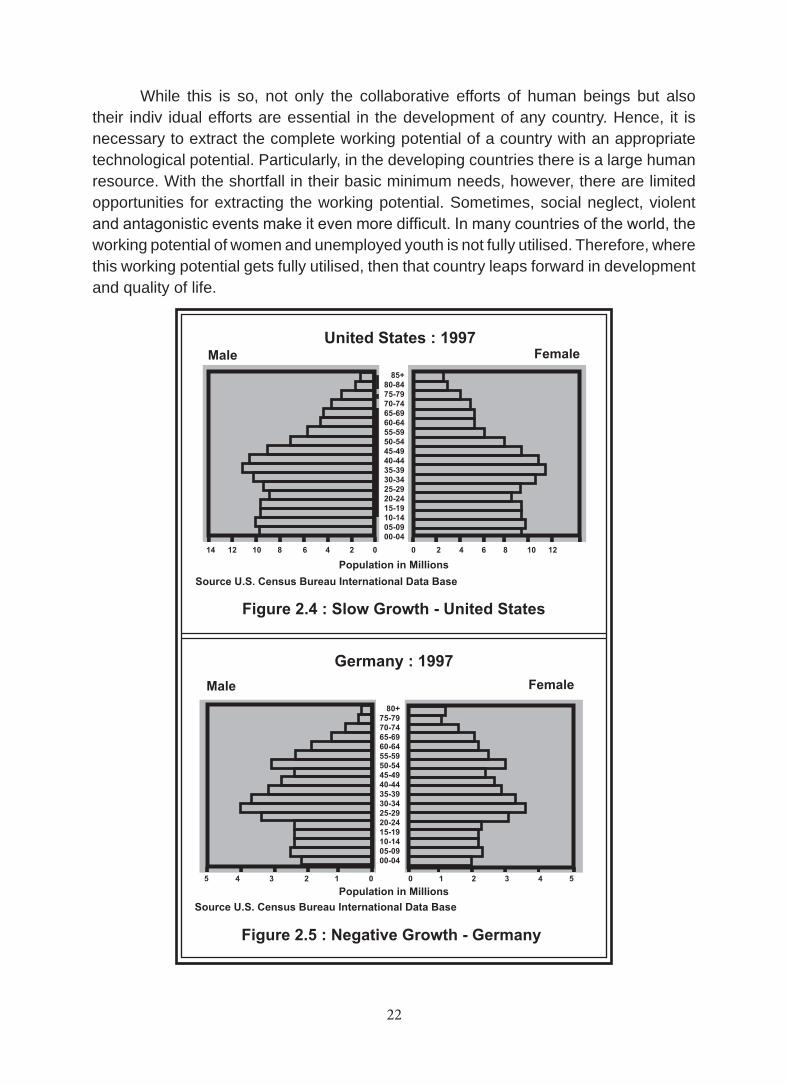
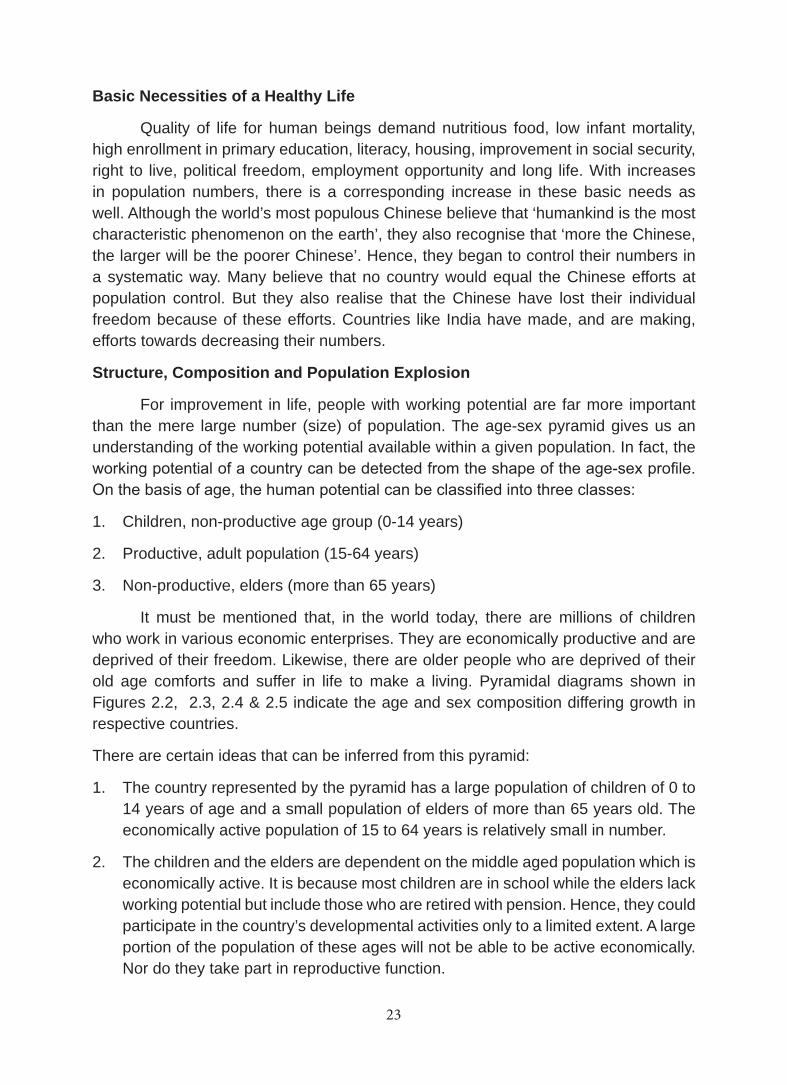
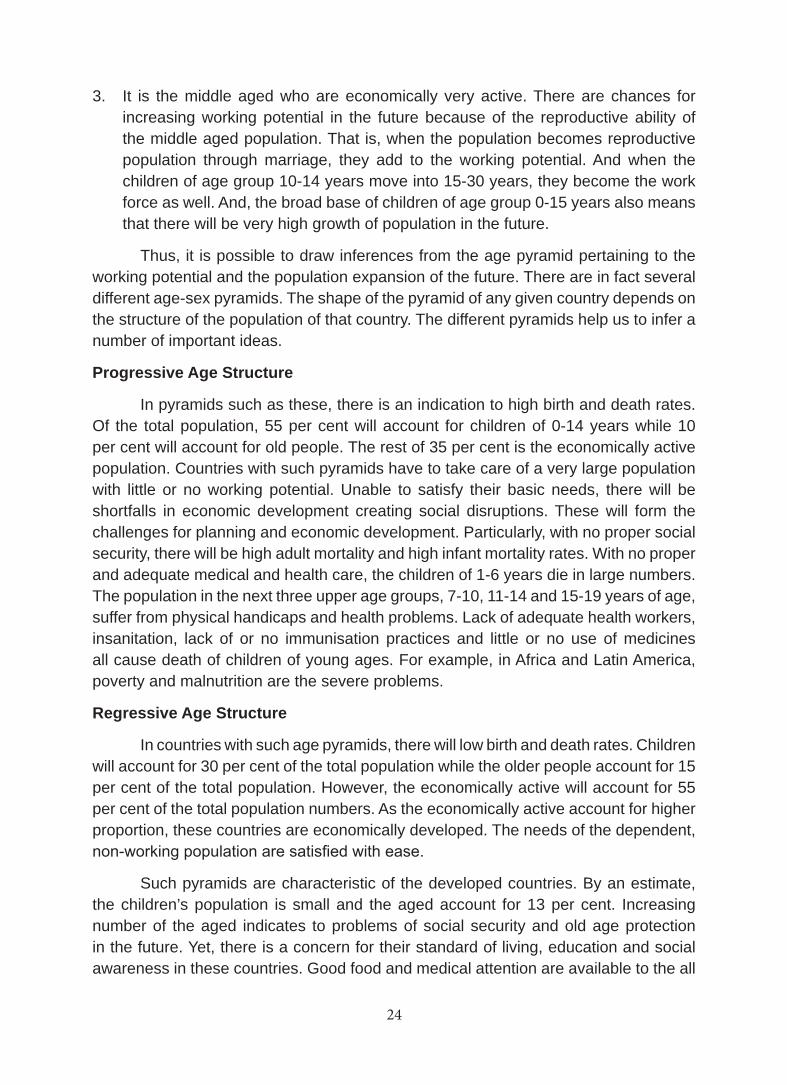
It must be mentioned that, in the world today, there are millions of children who work in various economic enterprises. They are economically productive and are deprived of their freedom. Likewise, there are older people who are deprived of their old age comforts and suffer in life to make a living. Pyramidal diagrams shown in Figures 2.2, 2.3, 2.4 & 2.5 indicate the age and sex composition differing growth in respective countries.
There are certain ideas that can be inferred from this pyramid:
1. The country represented by the pyramid has a large population of children of 0 to 14 years of age and a small population of elders of more than 65 years old. The economically active population of 15 to 64 years is relatively small in number.
2. The children and the elders are dependent on the middle aged population which is economically active. It is because most children are in school while the elders lack working potential but include those who are retired with pension. Hence, they could participate in the country’s developmental activities only to a limited extent. A large portion of the population of these ages will not be able to be active economically. Nor do they take part in reproductive function.
24 25
3. It is the middle aged who are economically very active. There are chances for increasing working potential in the future because of the reproductive ability of the middle aged population. That is, when the population becomes reproductive population through marriage, they add to the working potential. And when the children of age group 10-14 years move into 15-30 years, they become the work force as well. And, the broad base of children of age group 0-15 years also means that there will be very high growth of population in the future.
Thus, it is possible to draw inferences from the age pyramid pertaining to the working potential and the population expansion of the future. There are in fact several different age-sex pyramids. The shape of the pyramid of any given country depends on the structure of the population of that country. The different pyramids help us to infer a number of important ideas.
Progressive Age Structure
In pyramids such as these, there is an indication to high birth and death rates. Of the total population, 55 per cent will account for children of 0-14 years while 10 per cent will account for old people. The rest of 35 per cent is the economically active population. Countries with such pyramids have to take care of a very large population with little or no working potential. Unable to satisfy their basic needs, there will be shortfalls in economic development creating social disruptions. These will form the challenges for planning and economic development. Particularly, with no proper social security, there will be high adult mortality and high infant mortality rates. With no proper and adequate medical and health care, the children of 1-6 years die in large numbers. The population in the next three upper age groups, 7-10, 11-14 and 15-19 years of age, suffer from physical handicaps and health problems. Lack of adequate health workers, insanitation, lack of or no immunisation practices and little or no use of medicines all cause death of children of young ages. For example, in Africa and Latin America, poverty and malnutrition are the severe problems.
Regressive Age Structure
In countries with such age pyramids, there will low birth and death rates. Children will account for 30 per cent of the total population while the older people account for 15 per cent of the total population. However, the economically active will account for 55 per cent of the total population numbers. As the economically active account for higher proportion, these countries are economically developed. The needs of the dependent, non-working population are satisfied with ease.
Such pyramids are characteristic of the developed countries. By an estimate, the children’s population is small and the aged account for 13 per cent. Increasing number of the aged indicates to problems of social security and old age protection in the future. Yet, there is a concern for their standard of living, education and social awareness in these countries. Good food and medical attention are available to the all
24 25
ages. Hence, child birth is within limits. With industrial development, there is fast life and a corollary increase in the uncared for population of the elders as well. Therefore, despite social security provided by the governments in these countries, the elders are mentally affected. They are generally afflicted with cancer and heart diseases which cause what is known as the ‘new death’. There is a large number of psychologically affected as well, in these countries. There are reports indicating one million Europeans being locked up in the mental asylums.
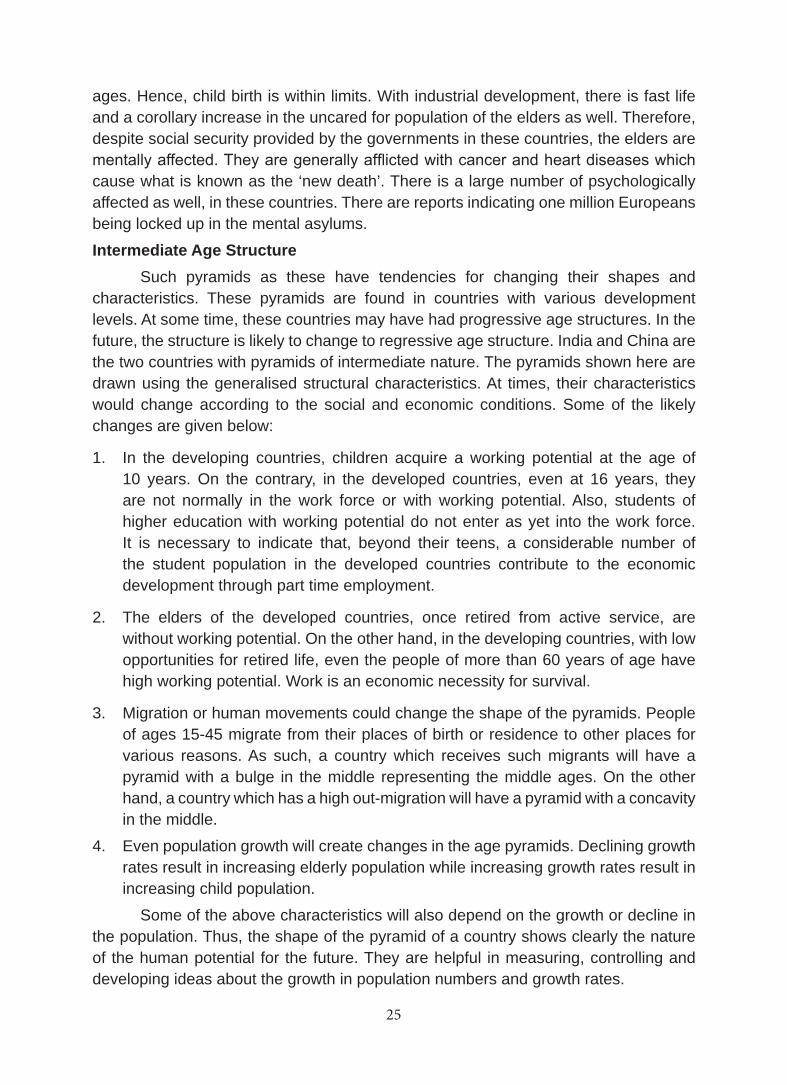
Intermediate Age Structure Such pyramids as these have tendencies for changing their shapes and characteristics. These pyramids are found in countries with various development levels. At some time, these countries may have had progressive age structures. In the future, the structure is likely to change to regressive age structure. India and China are the two countries with pyramids of intermediate nature. The pyramids shown here are drawn using the generalised structural characteristics. At times, their characteristics would change according to the social and economic conditions. Some of the likely changes are given below:
1. In the developing countries, children acquire a working potential at the age of 10 years. On the contrary, in the developed countries, even at 16 years, they are not normally in the work force or with working potential. Also, students of higher education with working potential do not enter as yet into the work force. It is necessary to indicate that, beyond their teens, a considerable number of the student population in the developed countries contribute to the economic development through part time employment.
2. The elders of the developed countries, once retired from active service, are without working potential. On the other hand, in the developing countries, with low opportunities for retired life, even the people of more than 60 years of age have high working potential. Work is an economic necessity for survival.
3. Migration or human movements could change the shape of the pyramids. People of ages 15-45 migrate from their places of birth or residence to other places for various reasons. As such, a country which receives such migrants will have a pyramid with a bulge in the middle representing the middle ages. On the other hand, a country which has a high out-migration will have a pyramid with a concavity in the middle.
4. Even population growth will create changes in the age pyramids. Declining growth rates result in increasing elderly population while increasing growth rates result in increasing child population.
Some of the above characteristics will also depend on the growth or decline in the population. Thus, the shape of the pyramid of a country shows clearly the nature of the human potential for the future. They are helpful in measuring, controlling and developing ideas about the growth in population numbers and growth rates.
26 27
We have now understood how population numbers and the social and economic declines have close relations. Even in the historical times, the need for optimal population existed as an idea. But there were differences in ideas as to the means of controlling population numbers. It was in such circumstances the Population Essay of Thomas Robert Malthus was published in the 18th/19th century.
Malthus’ Population Theory
Thomas Robert Malthus propounded a Population Theory. This was based on the growth of population in England. After the industrial revolution, the population of England began to grow. Malthus believed that this growth would become a prominent problem in the future. He also believed that the population growth would exert a pressure and the society would be discriminated by the poor and the rich. Increasing poverty, unemployment, ill-health would arise from the primary cause of increasing population numbers. The assumptions of his theory are:
1. Humankind has great potential for reproduction that is producing children.
2. In agriculture, the law of diminishing returns operates.
3. Food is important in the survival of human beings.
4. The intimacy between men and women cannot be avoided.
Malthus has elaborated these assumptions in his Essay on Population. According to him, births cannot be controlled in human life. There will be births and deaths at all times. If population growth is unchecked, Malthus believed that, it would require 25 years to double itself. He has said that the food production increases arithmetically as 1, 2, 3, 4 ... while population grows geometrically as 1, 2, 4, 8 and so on.
As such population growth occurs relatively easily than the required food production. According to Malthus’ estimate, the population grows 8-fold when the food grows only 4-fold. Therefore, he has believed that the controlling of births is the only means of solving the problems of the future. He has categorised the means of population control as the ‘positive checks’. These are of two types:
1. Natural Control and
2. Man-made Control.
Natural Control
Left to itself, Malthus believed that the nature will control population growth. Population growth will be checked by droughts and epidemics.
26 27
THE HANDICAPPED Only the past is never over
What you’ar today depends
On what you’ve seen
Felt and heard
Yesterday
Last month and
Past year
You’re vulnerable again
And handicapped
And what you now accept
Or reject
Would mould your tomorrow
After all
You’re
Because of what you were
Shall you be.... because of
What you are.
Man-Made Control
Poverty, food shortage, lack of child care, infectious diseases and world wars due to population growth will ultimately control population growth.
Malthus has categorically suggested that the population numbers will be considerably reduced through the two means of population control.
1. Increasing marriageable age will naturally decrease the birth rates.
2. Humans must encourage child births depending primarily upon their ability to provide and protect.
For these to occur, humans must exercise self control. There must be concerted efforts also on the part of the human beings towards decreasing population growth. Hence, Malthus has revealed the importance of ‘birth control’ as a measure of population check.
28 29
Do your know?
The Population Clock
Every second, on an average 4-5 children are born and 2 people die, Thus resulting in net gain of nearly 2.5 person every second.This means that every hour we are growing by about 9000 and everyday by about 2,14,000.
Marx’s Ideas on Population
The German social philosopher Marx is the father of modern communism. He has agreed to the idea of Malthus that population growth is behind the human problems. On the contrary, he believed that resources mismanagement is the cause of human problems. In his opinion, evils of capitalism create a social upheaval which causes the human problems.
His ideas revealed that capitalism fails in the equal distribution of work and this in turn causes poverty and unemployment. They do not happen because of the growth of population numbers. Further, the uneven distribution of wealth and employment opportunities for a few select people by the capitalist mode of production aggravates human suffering. The two population theories above emphasise how population growth results in economic disasters and social inequality. The inequality in economic production and human demand and uneven distribution of natural resources are some of the other reasons for population growth. Therefore, in some parts of the world people live without basic necessities while in others they live a fuller life of plenty and quality of life.
Learning Outcomes
Students have learnt about the human potential in terms of their evolution, growth, distribution and densities in the world.
They have also learnt about the possibilities for further growth and what needs to be done, besides learning about the population theories and various viewpoints on the human potential.
28 29
EXERCISES
I. Fill in the Blanks
1. The African Homo Sapiens used tools made of ________ whereas Asian used those made of ___________.
2. The nomade who moved out of Central Asia transformed the _________ and ___________ civilisations.
3. When working potential of a country is fully utilised, it would develop in ________________ and all other sectors.
4. _________ help us to understand working potential
5. In Africa and Latin America, ____________ and ___________ are the drastic problems.
6. The population numbers theory was first propounded by ____________.
II. Choose the Correct Answer
7. The area inhabited by the humankind in the world over accounts for:
a) One- fourths b) One- thirds
c) Half d) One- fifths
8. The growth rate of the world population is:
a) Low b) High
c) Moderate d) Very High
9. The reason why the developing countries are unable to exploit their entire working potential is:
a) Small population numbers b) Lack of essential services
c) Lack of resources d) Absence of hard work
10. The most populous country in the world today is:
a) India b) USA
c) China d) Japan
III. Match the Following
11. Progressive age structure - Developed economy
12. Regressive age structure - Declining economy
30 31
13. Intermediate age structure - Population explosion
14. Malthus’ theory - Capitalism and resources mismanagement
15. Marx’s idea - Developing economy
- No inequality
IV. Brief Answers
16. What are the reasons for uneven distribution of population?
17. What caused the unprecedented growth in population in the last 400 years?
18. What were the natural checks of population numbers in the earlier times?
19. What do humans need for a life of quality?
20. How many divisions there are of working potentials on the basis of age? What are they?
V. Paragraph Answers
21. How did the civilsations began and develop?
22. Trace the development of the cultures after the 16th century?
23. What are the new ideas emerging as the new lights on human evolution?
24. Describe the growth of world population.
25. What are the ideas conveyed by the general age-sex pyramid?
26. What is the meaning of Marx’s population theory?
VI. Detailed Answers
27. Discuss the progressive and regressive age structures.
28. Write in detail about Malthus population theory.
30 31
UNIT 2HUMAN-MADE ECOSYSTEMS I
LESSON 3SETTLEMENT SYSTEMS
Learning Objectives
Students learn to identify human settlements as those among the human-made ecosystems and understand their geographical characteristics, including theories about them.
When we observe a town from a high, vantage point at night, we see the lights from the houses and the streets reflecting a pattern of the settlement. The light from them gives an expression to the town form. When the light is wider, it is likely the town is large. Where we see a few lights and often dim light, it could be either a village or more open spaces and fields. Thus, the light at night in a town gives us an idea of the shape and form of the town. Such shapes and forms have been classified by the geographers. The forms of settlements have been ordered on the basis of their functions. A settlement’s morphology depends upon the mountains, water bodies and such physical features around it. We cannot see a specific type of settlements in all regions of the world. They differ from place to place. For the differences that we see among settlements, there are several causes. But before we analyse these causes, it is necessary to understand the reasons for the settlements’ forms.
Origin of Settlements
For the nomads to transform themselves into permanent settlers, religion, culture, army, politics and economics were the essential causes. First, to bury their dead and to perform the rituals connected with it, the nomads created some permanent locations. In course of time, these places had become places of religious or ritualistic importance. And when the men moved about from place to place in search for food, the aged, women and children stayed put in a locality and produced things that were needed to run the families. Such localities then became places of cultural importance. In order to protect the religious heads, teachers, women and children who were now settled almost permanently, the settlers built walls around such places. Army of soldiers were trained and separate settlements for them were built. Hence, settlements of political and military importance began to appear in the beginning of settlements.
It was necessary that a large number of settlers had to go in search of food for those who lived in permanent settlements. It was often difficult to gather adequate food for all settlers for all seasons. In consequence to such needs, godowns and storages were built to store food when it was available in good quantity. Such places over time
32 33
became economically important settlements. Over time, people had renounced the nomadic way of life to become permanent settlers in given places. It was thus the permanent settlements originated earlier.
Settlements
Places where humans live are called the settlements. Each of them is a reflection of the human intervention in, and impact on, the earth and its environment. All settlements have locations. It is the characteristics of such locations which provide for patterns of the settlements.
Site and Situation
The location of a settlement is defined by two factors. They are: the site and the situation.
The settlements with similar sites and situation are similar in characteristics, too. One of the purposes of settlement geography is to make possible an understanding of the locational characteristics and distribution of settlements. Hill slopes, summits, hillocks, river valleys, river beds , springs, ponds, road confluences and religious sites are some of the locations conducive for settlements.
Site. The location of a settlement is considered a site. If we understand the importance and amenities of a place, we could understand the cause behind the setttlement. Such causes are helpful in finding the origin of settlements. However, once the settlements are developed, they may lose their significance. For instance, because there is water at the site, a settlement could come about around a pond. A pond which was of some importance earlier may lose its importance, with the growth of population, in course of time. Nevertheless, such settlements do not relocate themselves, over time. They may develop other sources of water. For example, new wells and ponds may be created in response to developments.
Commercial Site. In subsistence agriculture, products were stored close to the fields. Hence, farmsteads were developed keeping the fields as the site. In mechanised agriculture, however, there arose a need to sell the surplus. Consequently, the bags of grains had to be taken to distant places. The surpluses from several villages were collected at a central village. Consequently, with an orderly commercial activity, the central village turned itself into a commercial site. In the commercial villages, transport lines were needed to transfer commodities to places far away. In response, several commercial villages had emerged in areas of surplus agricultural production. This was how settlements along the river banks, broad roads, at the confluence of several roads and railway lines had developed with commerce as their functional base.
Situation. Situation of settlements refers to the landscapes and the environments around them. Apart from the landscapes, sunshine, water, land hazards, social relations and the like are parts of the situation. As the European countries are in the high latitude,
32 33
temperate lands, the people of these countries require temperature. Therefore, they build their houses facing east, to take advantage of sunshine. In India, houses are mostly built facing south as it is a monsoon land.
Similarly, water bodies are a cause for the construction of houses. Several large cities of today have been in the vicinity of water bodies. London on the Thames River is a good example. Conversely, settlements are away and at high elevations in the riverine floodplains and alluvial fans prone to inundations. In India, settlements developed on the elevated lands in the midst of the valleys of the Yamuna and the Chambal floodplains.
It is recognised that due to the unique characteristics of the site and situation, settlements acquire special characteristics. Just as the natural landscapes of hills, valleys and rivers, the cultural features developed by human beings are also considered as significant among the landscapes.
Thus far, we have seen how site and situation determine the settlement pattern. Based on the functions of settlements, they may be divided into two basic types: rural settlement and urban settlement.
Classification of SettlementsRural Settlements: Village Types
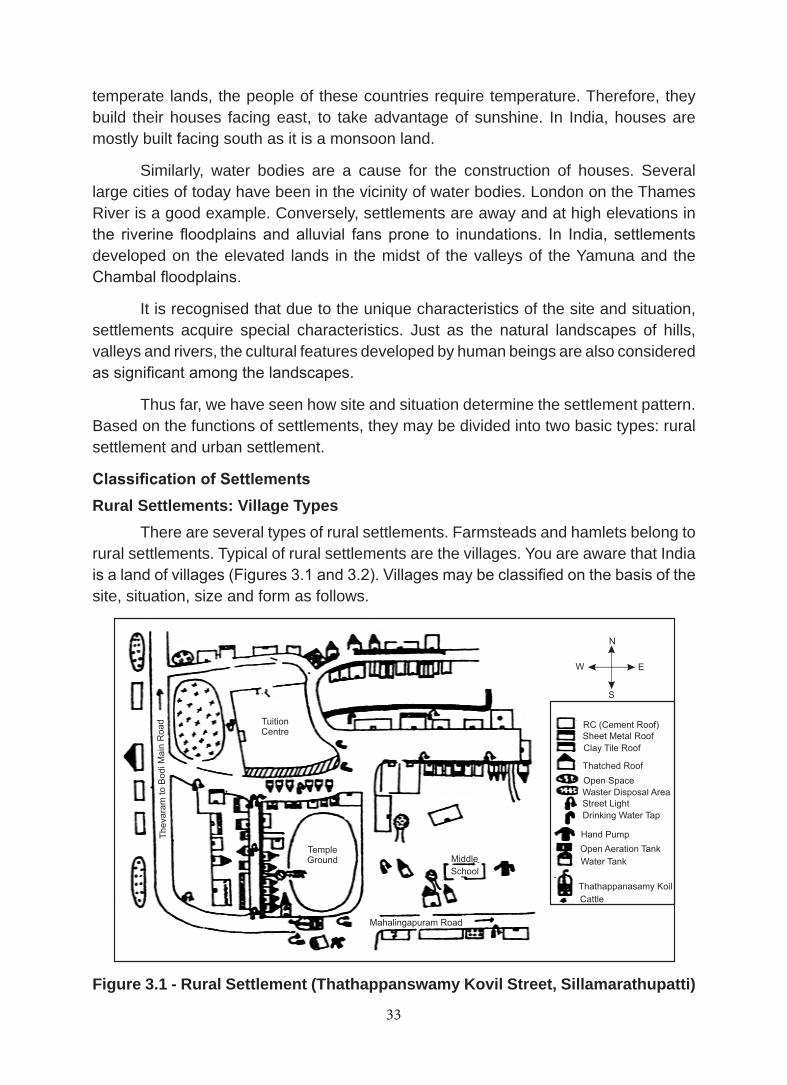
There are several types of rural settlements. Farmsteads and hamlets belong to rural settlements. Typical of rural settlements are the villages. You are aware that India is a land of villages (Figures 3.1 and 3.2). Villages may be classified on the basis of the site, situation, size and form as follows.
Theva
ram
to B
odi M
ain
Road Tuition
Centre
TempleGround Middle
School
Mahalingapuram Road
N
EW
S
RC (Cement Roof)Sheet Metal Roof
Clay Tile Roof
Thatched Roof
Open Space
Waster Disposal AreaStreet Light
Drinking Water Tap
Hand Pump
Open Aeration Tank
Water Tank
Thathappanasamy Koil
Cattle
Figure 3.1 - Rural Settlement (Thathappanswamy Kovil Street, Sillamarathupatti)
34 35
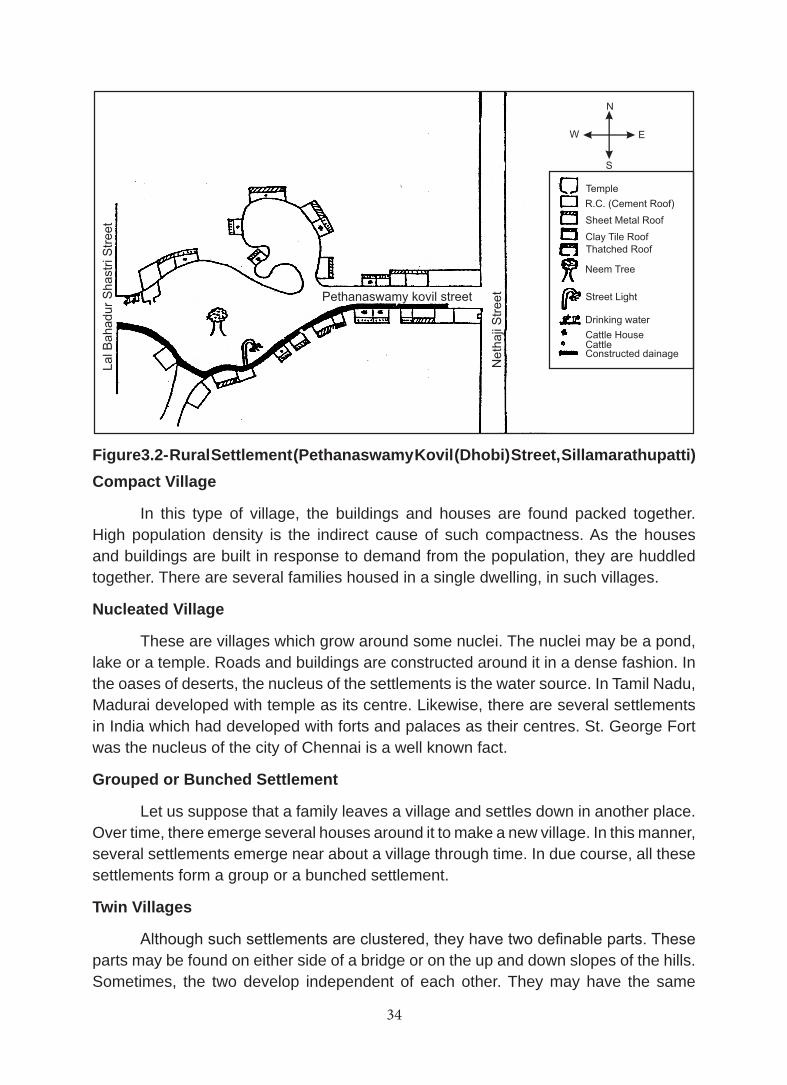
Figure3.2- Rural Settlement (Pethanaswamy Kovil (Dhobi) Street, Sillamarathupatti)Compact Village
In this type of village, the buildings and houses are found packed together. High population density is the indirect cause of such compactness. As the houses and buildings are built in response to demand from the population, they are huddled together. There are several families housed in a single dwelling, in such villages.
Nucleated Village
These are villages which grow around some nuclei. The nuclei may be a pond, lake or a temple. Roads and buildings are constructed around it in a dense fashion. In the oases of deserts, the nucleus of the settlements is the water source. In Tamil Nadu, Madurai developed with temple as its centre. Likewise, there are several settlements in India which had developed with forts and palaces as their centres. St. George Fort was the nucleus of the city of Chennai is a well known fact.
Grouped or Bunched Settlement
Let us suppose that a family leaves a village and settles down in another place. Over time, there emerge several houses around it to make a new village. In this manner, several settlements emerge near about a village through time. In due course, all these settlements form a group or a bunched settlement.
Twin Villages
Although such settlements are clustered, they have two definable parts. These parts may be found on either side of a bridge or on the up and down slopes of the hills. Sometimes, the two develop independent of each other. They may have the same
34 35
name with prefixes such as ‘Upper’, ‘Lower’, ‘East’ and ‘West’. At times, they may have two different names.
Urban Settlements
Urban settlements are far different from those of the rural settlements. There are nationally and internationally important cities and towns. Older cities developed amongst the agricultural regions. Modern cities developed as a consequence of the 20th century industrial development. Cities provide many different economic and social services. In fact, several cities emerged in response to the needs of the time. Examples are: commercial towns, mining towns, coastal cities, recreational towns and university towns. Most cities and towns are characterised by narrow streets and tall buildings. They are densely populated, with activities other than agriculture dominating the culture. Even though people here live in groups and in neighbourhoods, there are no closer social relations. Migrations,
social instabilities, class structures and people of differential wealth are the characteristic features of the towns and cities.
Classification of Towns
There are no universal criteria for classifying the towns of the world. Every country has its own and different method of classification. Some classify towns on the basis of their functions, while others on population size and administrative character. The towns of India, Israel and Italy are characterised by non-agricultural activities. They are also highly populated. On the other hand, towns of Denmark, Sweden and Finland have towns of population sizes not less than 250. In Africa and Europe, settlements are generally called as towns. Thus, the types of towns and their classification differ from place to place and in terms of their functions.
Million Cities
‘Million cities’ are those which hold a million or more population. London in 1800, Paris in 1850 and New York in 1870 were million cities. There were 129 million cities in 1970 and it is as many as 180 now. Most million cities are the capitals, ports and multi-functional. Some of these settlements were the earlier capitals. For example, Leningrad, Rio-de-Janeiro and Kolkata.
Urban Growth and Problems
The growth of an urban area relates to population increases as well as the expansion of its areal extent. Population growth of the urban areas occurs in two ways. First, they are growing by the natural increase. Second, they are expanding in population through rural migration. In consequence, the urban boundaries are expanding. Unemployment, traffic jams, air pollution are some of the problems that the urban areas face.
36 37
Rural Migration. People from rural areas migrate to cities in search of jobs. Their migration is not always in response to economic compulsions. People migrate also in response to educational and administrative needs. The present day generation has moved into towns and cities in an exodus for higher studies and employment opportunities. The population of Chennai increases day by day in this manner.
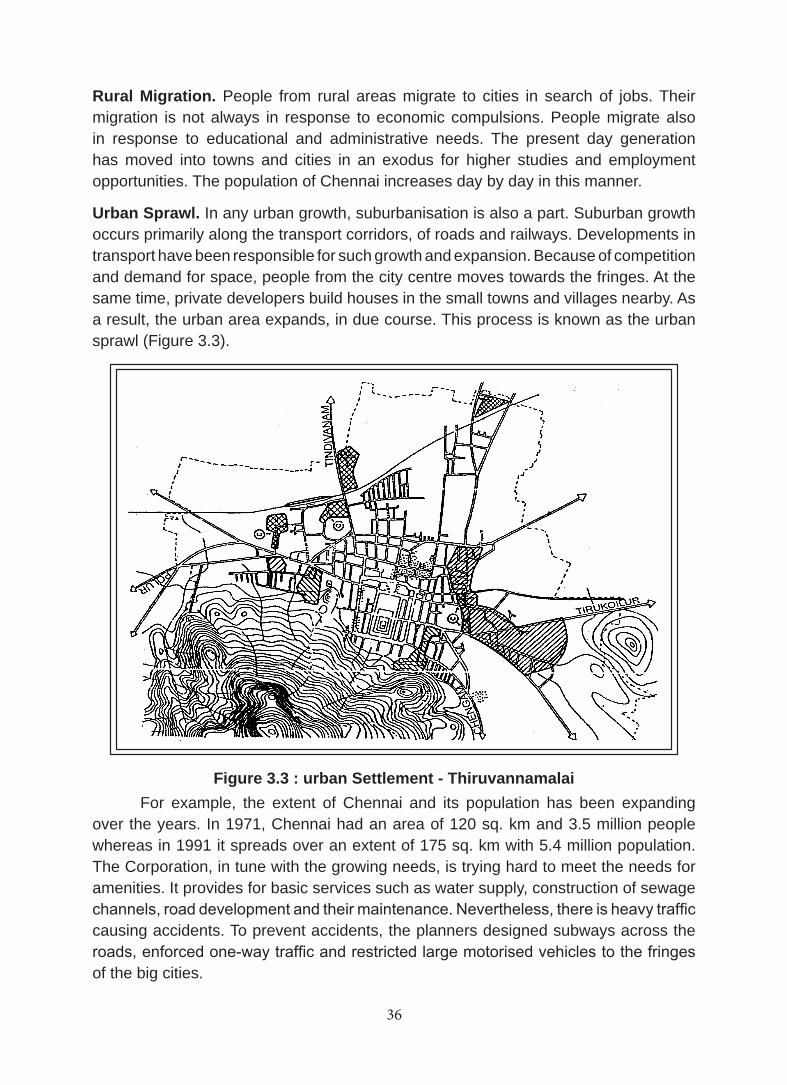
Urban Sprawl. In any urban growth, suburbanisation is also a part. Suburban growth occurs primarily along the transport corridors, of roads and railways. Developments in transport have been responsible for such growth and expansion. Because of competition and demand for space, people from the city centre moves towards the fringes. At the same time, private developers build houses in the small towns and villages nearby. As a result, the urban area expands, in due course. This process is known as the urban sprawl (Figure 3.3).
Figure 3.3 : urban Settlement - ThiruvannamalaiFor example, the extent of Chennai and its population has been expanding
over the years. In 1971, Chennai had an area of 120 sq. km and 3.5 million people whereas in 1991 it spreads over an extent of 175 sq. km with 5.4 million population. The Corporation, in tune with the growing needs, is trying hard to meet the needs for amenities. It provides for basic services such as water supply, construction of sewage channels, road development and their maintenance. Nevertheless, there is heavy traffic causing accidents. To prevent accidents, the planners designed subways across the roads, enforced one-way traffic and restricted large motorised vehicles to the fringes of the big cities.
36 37
Pollution. Yet another problem in city growth is the pollution. The surroundings of the cities, air and water are contaminated in several ways. The smoke from the industries and the automobiles and dust pollute the air. The effluents from industries and domestic wastes pollute the sea, rivers and other water bodies as they are drained into them. Similarly, the noise from the vehicles and industries pollute the silent environments. The different types of noise from the automobiles disturb the peace of mind of people. Deafness and hypertension occur because of noise. In the location of settlements, amenities and services play an important part. For this reason, the settlements acquire certain services and amenities. But they normally depend on the size of settlement, population, their needs, income and the purchasing power of the population. There is in fact a theory that relates the importance of amenities and services. That is what is known as the ‘central place theory’.
Central Place Theory
Settlement as a Central Place. According to central place theory, a central place provides services for its own population and the population around it. The services of the central place are the shops, markets, administrative units and recreation centres. Even though there is a difference in the services being offered by the towns, all big settlements are central places. For example, despite being cities of almost same size, Coimbatore and Bangalore are far different from each other. Bangalore is, by its services, far bigger a market centre than that of Coimbatore.
It is difficult to say that every settlement is a central place. Farmsteads, hamlets and villages do not offer any services to other places. Rather, they depend on the other central places for the services they need.
Settlements differ in their shapes and their importance. It is difficult to determine the differences among them. Population of a settlement may be used as a measure. Similarly, the types of services, their numbers, the employment opportunities and so on could be used as measures, too. These are very closely related to each other. In the settlements with a large population, there will be innumerable types of shops, amenities and job opportunities.
Using the size and significance of the settlements, they may be defined as a four-tier. At the top are the large towns and cities and at the bottom are the small settlements. This is known as the ‘hierarchy of settlements’. In the hierarchy, there is a large number of hamlets and villages at the lower (fourth) rung. There is a small number of towns and cities in the next higher level (third) of the hierarchy. A still smaller number of intermediate cities are found at the second level. At the top are the very big cities and metropolises. Chennai, Delhi, Mumbai and Kolkata are of the top level of the hierarchy.
It was Walter Christaller who had developed the central place theory. This theory explains the size and the interval between the settlements. It makes clear how
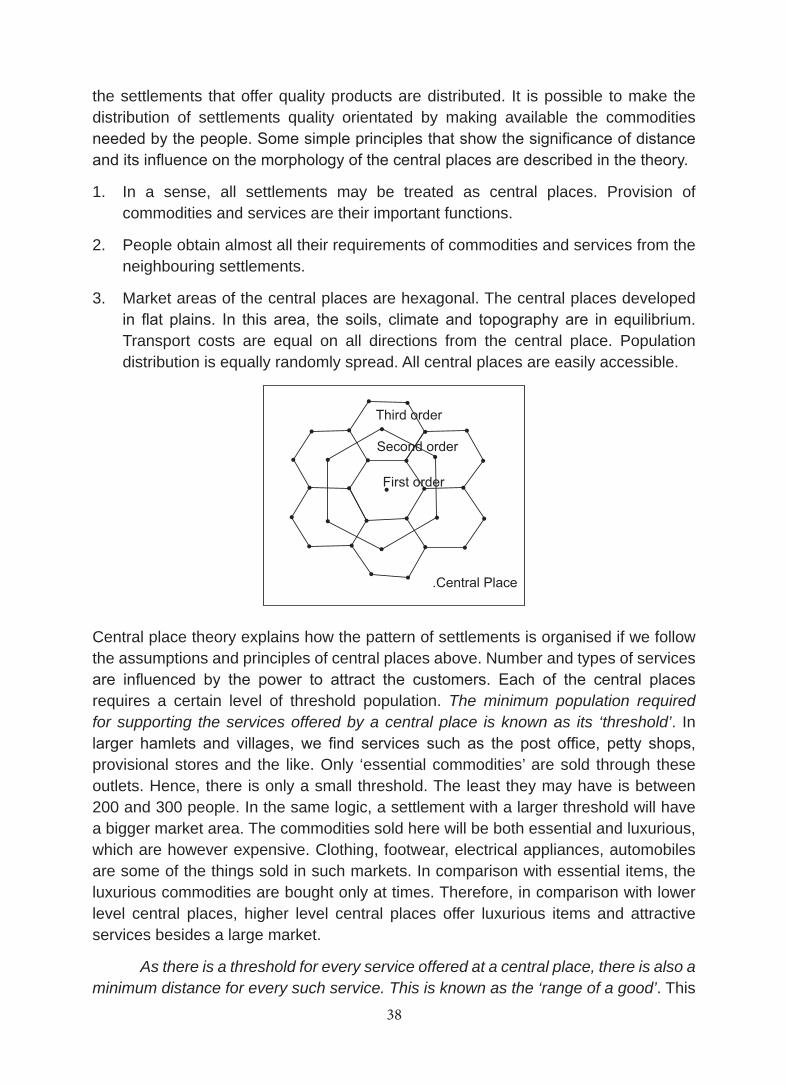
38 39
the settlements that offer quality products are distributed. It is possible to make the distribution of settlements quality orientated by making available the commodities needed by the people. Some simple principles that show the significance of distance and its influence on the morphology of the central places are described in the theory.
1. In a sense, all settlements may be treated as central places. Provision of commodities and services are their important functions.
2. People obtain almost all their requirements of commodities and services from the neighbouring settlements.
3. Market areas of the central places are hexagonal. The central places developed in flat plains. In this area, the soils, climate and topography are in equilibrium. Transport costs are equal on all directions from the central place. Population distribution is equally randomly spread. All central places are easily accessible.
Central place theory explains how the pattern of settlements is organised if we follow the assumptions and principles of central places above. Number and types of services are influenced by the power to attract the customers. Each of the central places requires a certain level of threshold population. The minimum population required for supporting the services offered by a central place is known as its ‘threshold’. In larger hamlets and villages, we find services such as the post office, petty shops, provisional stores and the like. Only ‘essential commodities’ are sold through these outlets. Hence, there is only a small threshold. The least they may have is between 200 and 300 people. In the same logic, a settlement with a larger threshold will have a bigger market area. The commodities sold here will be both essential and luxurious, which are however expensive. Clothing, footwear, electrical appliances, automobiles are some of the things sold in such markets. In comparison with essential items, the luxurious commodities are bought only at times. Therefore, in comparison with lower level central places, higher level central places offer luxurious items and attractive services besides a large market.
As there is a threshold for every service offered at a central place, there is also a minimum distance for every such service. This is known as the ‘range of a good’. This
38 39
means that every product, depending upon its characteristics, can only be sold within a specific radius. For example, a petty shop distributes a certain set of items within a certain distance. This distance may be called as the ‘inner range of a good’. Let us assume that a customer of the petty shop asks for a commodity from the shop keeper. But he says that it is out of stock. If the item is very essential, the customer would walk over to another shop, further from the earlier one, and get it. We may therefore conclude that the item in demand has an ‘outer range of good’. This forms an important idea of the central theory.
Further, Christaller’s central place classifies the settlements using the size of the ‘market area’. This theory cannot be entirely used to compare the state of the urban places, because there is no urban market with a hexagonal shape in reality. For instance, in river tracts and hill regions, the population is not evenly distributed. As such, the central place theory when tested against reality is at variance in natural regions. Even then, Christaller’s theory has been used in classifying settlements. For example, in Tamil Nadu, all district headquarters are the first level central places (Madurai, Tiruchy, Coimbatore, Salem and the like) whereas the centres around them may be considered as the second level central places. It is at the bottom of this hierarchy, the villages are found.
Learning Outcome
Students have become knowledgeable about the origin, site and situation and classification of settlements and have gained knowledge of geographical theories about them.
EXERCISES
I. Fill in the Blanks
1. Human habitats are called ____________.
2. Locational characteristics of a settlement give it____________.
3. The place where a settlement is located is ____________.
4. The city along the Thames River is __________.
5. The important feature of a rural settlement is known as_________.
6. The cities with more than a million population are called _________ cities.
7. The proponent of Central Place Theory is _____________.
8. The reason for suburban development is ____________.
40 41
9. Market settlements have the _________ shape.
10. The factors that determine the location of a settlement is ____________.
II. Choose a correct Answer
11. The minimum population required for a commodity to be sold in the market.
a) 0-50 b)50 -100
c) 100-200 d) 200-300
12. Rural population migrating to urban areas.
a) purchase things b) jobs
c) recreation c) Luxurious Life
13. The settlements situated in the flood plains and alluvial fans.
a) compact b) nucleated
c) grouped d) High land settlement
14. The villages with farmsteads and hamlets.
a) urban b) rural
c) compact d) nucleated
15. The theory based on markets.
a) market theory b) goods theory
c) Central place theroy d) Malthus theory
III. Brief Answers
16. Site.
17. Situation.
18. Bunched village.
19. Nucleated village.
20. Twin villages.
IV. Answers Paragraph
21. Migration of rural population.
22. Urban sprawl.
23. Central Place Theory.
40 41
24. Million cities.
25. Rural settlements.
V. Detailed Answers
26. Classify the settlements? Write about Rural and Urban settlements?
27. Explain Walter’s Christaller’s Central place theory?
VI. Practical Exercises
28. Make scrap book with pictures of different cities.
29. Using Christaller’s theory, define the nature of central places around your place.
30. Conduct a field work in a town and observe it from a vantage point and then describe it.
31. List the names of twin villages and twin towns or cities.
32. Discuss in the class about the locational character of your village.
42 43
UNIT 2HUMAN-MADE ECOSYSTEMS I
LESSON 4INDUSTRIAL SYSTEMS
Learning Objectives
Students learn about the industrial systems, including their nature, type and classification and appreciate them as part of the human-made ecosystems operating for the benefit of humans.
The basic needs of humankind are food, clothing and shelter. For food, humans cultivate several different crops and produce food. The cultivation of crop is generally referred to as agriculture. Humans process these agricultural products through flour mills and preserving industries into palatable food products. The industries involved here are food processing industries. For clothing, humans produce cotton, jute, silk and wool and manufacture clothing in the factories. This is called textile industry. They also manufacture building materials such as bricks, iron and steel products, cement and the like. Therefore, we may define ‘industry’ as that activity which produces what human beings need in their lives and living.
When humans were primitive, their needs were but a few. Industry was not extensive. With modernisation, the necessities were increasing. With population increases, consumption was on the rise. Humans could not meet their needs only by manual production. Hence, the need to discover machines arose. With the industrial changes in the eighteenth century, industrial activities grew rapidly. As a consequence, humans have developed a multitude of industries to satisfy their needs.
The industries so developed until now could be classified as the four following industries, on the basis of their state of production:
1. Primary industries.
2. Secondary industries.
3. Tertiary industries.
4. Quaternary industries.
Primary Industries
The industries that help extract resources directly from nature are collectively called ‘primary industries’. These are fundamental to other allied industries. Hunting, fishing, cultivation of crops and mining are ‘the primary industries’. It is the primary industries that provide the food the humans need. They also provide for the raw materials the secondary industries demand.
42 43
Secondary Industries
Industries which transform natural resources into products that humans could consume are called ‘the secondary industries’. For instance, cotton from agriculture is transformed into clothing in these industries. Likewise, resources obtained from mining industries are converted into products that humans need.
Tertiary Industries
The products of the primary and secondary industries reach the people in different parts of the world through transport, trade and allied institutions such as banks, telecommunications, recreation and tourism and such are then called ‘the tertiary industries’
Quaternary Industries
These are industrial activities that help the activities under the earlier three sectors. These are called ‘the quaternary industries’. These include education, research, administration, financial management, legal activities and medicine besides several others. The activities of this group of industries are not linked to commodities and products, rather these are linked to people. In these, high quality skills and training are especially needed.
All products that we consume are produced and provided by the four industries above. For example, the raw materials needed to manufacture bicycles that we use for transport are from the four industries: iron ore and sandstones that form the basis for glass come from mining industries and rubber comes from plantations. These are then transformed into steel pipes and glasses and tyres and tubes by the secondary industries. Bicyles are then manufactured to be sold in the market. It is in the sale of these bicycles that the tertiary industries are important. For performing activities related to the refinement, promotion and sale are aided by the quaternary industries. In fact, all consumer products that we consume are produced with the help of all the four industries.
Functional Linkage
These activities are all integrated by their functions and this is designated as the ‘functional linkage’(Figure 4.1)
The raw materials needed for an industry come from another industry. Similarly, the products manufactured by one industry is marketed by another industry. Thus, any industry has at the least two such linkages and they are termed: Input linkage and Output linkage.
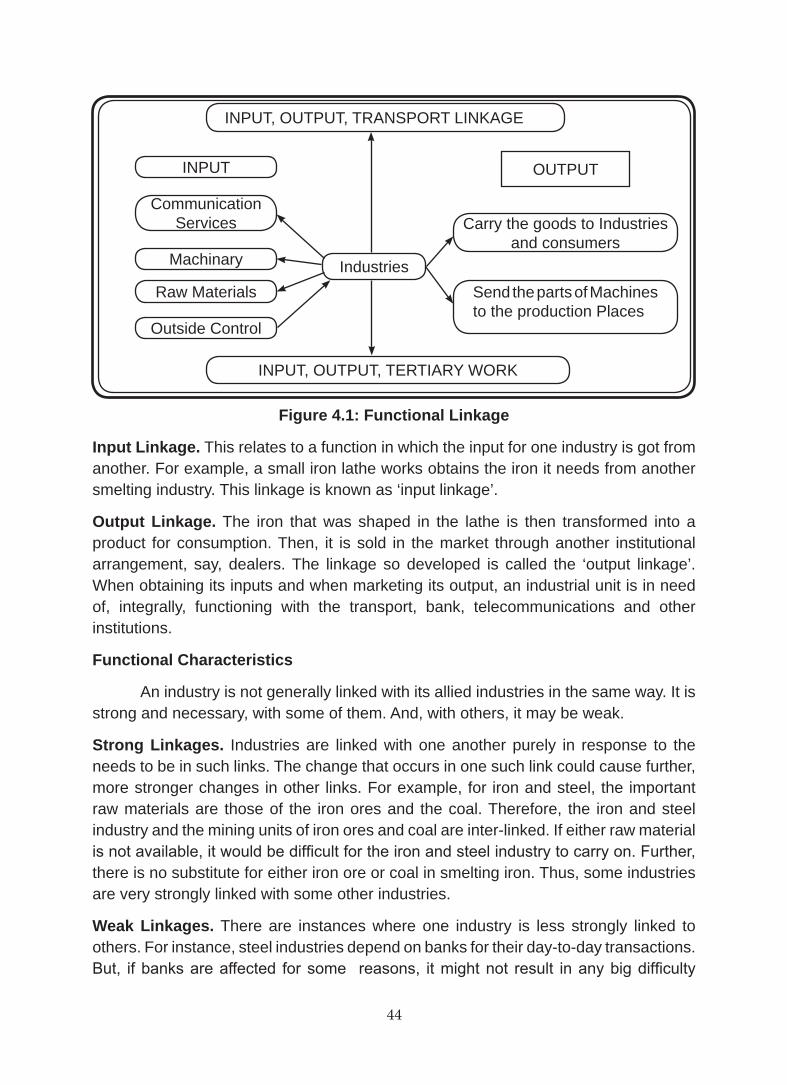
44 45
INPUT, OUTPUT, TRANSPORT LINKAGE
INPUT
CommunicationServices
Machinary
Raw Materials
Outside Control
Industries
OUTPUT
Carry the goods to Industriesand consumers
Send the parts of Machinesto the production Places
INPUT, OUTPUT, TERTIARY WORK
Figure 4.1: Functional Linkage
Input Linkage. This relates to a function in which the input for one industry is got from another. For example, a small iron lathe works obtains the iron it needs from another smelting industry. This linkage is known as ‘input linkage’.
Output Linkage. The iron that was shaped in the lathe is then transformed into a product for consumption. Then, it is sold in the market through another institutional arrangement, say, dealers. The linkage so developed is called the ‘output linkage’. When obtaining its inputs and when marketing its output, an industrial unit is in need of, integrally, functioning with the transport, bank, telecommunications and other institutions.
Functional Characteristics
An industry is not generally linked with its allied industries in the same way. It is strong and necessary, with some of them. And, with others, it may be weak.
Strong Linkages. Industries are linked with one another purely in response to the needs to be in such links. The change that occurs in one such link could cause further, more stronger changes in other links. For example, for iron and steel, the important raw materials are those of the iron ores and the coal. Therefore, the iron and steel industry and the mining units of iron ores and coal are inter-linked. If either raw material is not available, it would be difficult for the iron and steel industry to carry on. Further, there is no substitute for either iron ore or coal in smelting iron. Thus, some industries are very strongly linked with some other industries.
Weak Linkages. There are instances where one industry is less strongly linked to others. For instance, steel industries depend on banks for their day-to-day transactions. But, if banks are affected for some reasons, it might not result in any big difficulty
44 45
for the steel industry. The industry could make alternative arrangements for financial transactions.
As the industries are dependent on each other, their locations are structured in a certain way. As primary industries are dependent on natural resources, they are structured in accordance with their locations. For example, agriculture, mining and fishing can only operate in places appropriate to themselves. As the secondary industries are dependent on the primary industries, they are also located nearer to the locations of the primary industries. Industries separating the metals from their ores are generally located near about the locations of ore mines. Similarly, the textile industries are located in the midst of cotton growing areas. In recent times, however, secondary industries are located even away from industrial raw materials, as a consequence of rapid and cheap transport over long distances. For example, the iron ores mined in Indian mines are being used in the manufacture of steel in Japanese industries.
Tertiary and quaternary industries are located either in or near the urban centres. Thus, location of industries is influenced by raw material locations or transport facilities. In some places, industries are in a cluster. There are linkages between the industries that are found in a cluster. Such clustered areas are known as the ‘industrial regions’. The Chotanagpur plateau region of Bihar, Orissa and West Bengal is an example of such a region. There is a large number of iron and steel industrial units in this region. In Coimbatore and Madurai of Tamil Nadu, there is a concentration of textile units.
In several countries of the world, there are industrial systems and industrial regions. Examples are the Ruhr industrial region in Germany and the Great Lakes industrial regions of the United States of America. Let us now examine the reason why industries are found in certain regions.
Factors of Industrial Location
In order that the industries operate at maximum profit and optimal production, their locations can be important. The following are the basic factors of industrial location. Of these, either all of them or a combination of a few are important in locating the industries.
Raw Materials. Natural resources are generally raw materials. They are obtained through primary industries. Iron ore, timber, chemicals and skins, for example, are raw materials for some specific industries. Industrial productions depends upon the supply of raw materials. Industries depend on heavy raw materials or on bulk of the raw materials for production are located in the places of raw materials. Steel industries are found where iron ores are mined. Likewise, they are also located nearer ports to facilitate import of raw materials from elsewhere. Also industries such as those producing perishable items, food processing, forest products and mineral industries and also secondary industries are all located in the places of raw materials. These could be mineral resources, agricultural products, forest resources, animal or sea products.
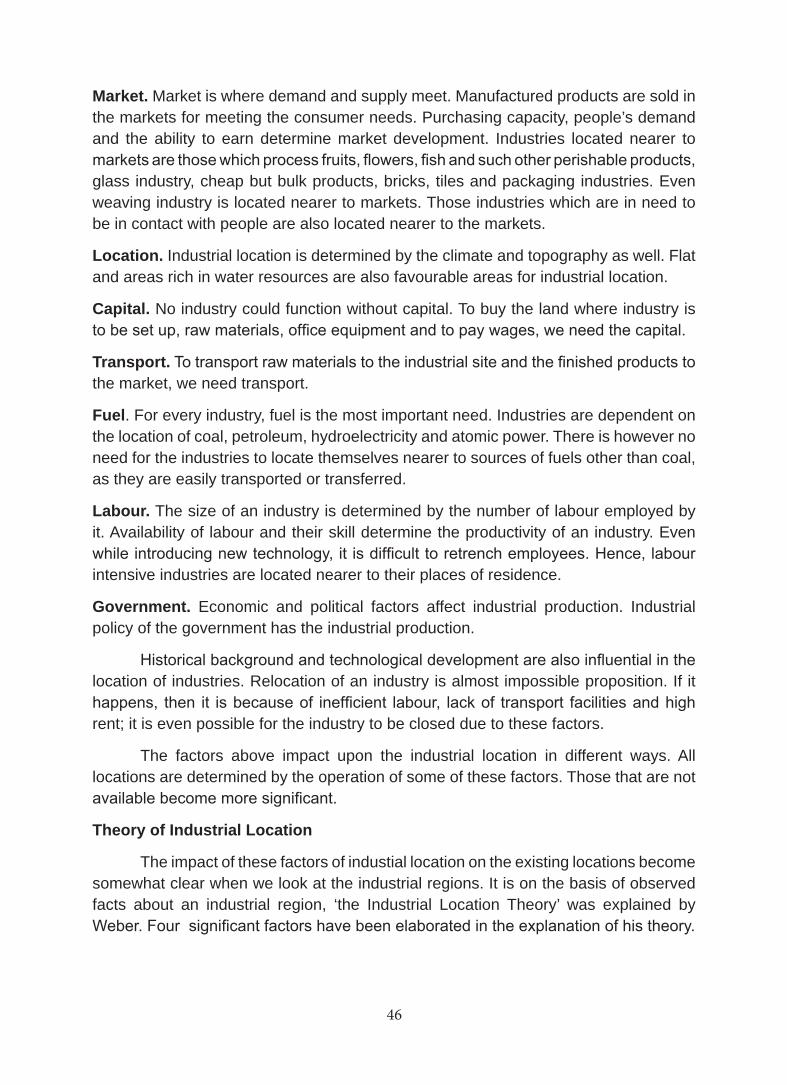
46 47
Market. Market is where demand and supply meet. Manufactured products are sold in the markets for meeting the consumer needs. Purchasing capacity, people’s demand and the ability to earn determine market development. Industries located nearer to markets are those which process fruits, flowers, fish and such other perishable products, glass industry, cheap but bulk products, bricks, tiles and packaging industries. Even weaving industry is located nearer to markets. Those industries which are in need to be in contact with people are also located nearer to the markets.
Location. Industrial location is determined by the climate and topography as well. Flat and areas rich in water resources are also favourable areas for industrial location.
Capital. No industry could function without capital. To buy the land where industry is to be set up, raw materials, office equipment and to pay wages, we need the capital.
Transport. To transport raw materials to the industrial site and the finished products to the market, we need transport.
Fuel. For every industry, fuel is the most important need. Industries are dependent on the location of coal, petroleum, hydroelectricity and atomic power. There is however no need for the industries to locate themselves nearer to sources of fuels other than coal, as they are easily transported or transferred.
Labour. The size of an industry is determined by the number of labour employed by it. Availability of labour and their skill determine the productivity of an industry. Even while introducing new technology, it is difficult to retrench employees. Hence, labour intensive industries are located nearer to their places of residence.
Government. Economic and political factors affect industrial production. Industrial policy of the government has the industrial production.
Historical background and technological development are also influential in the location of industries. Relocation of an industry is almost impossible proposition. If it happens, then it is because of inefficient labour, lack of transport facilities and high rent; it is even possible for the industry to be closed due to these factors.
The factors above impact upon the industrial location in different ways. All locations are determined by the operation of some of these factors. Those that are not available become more significant.
Theory of Industrial Location
The impact of these factors of industial location on the existing locations become somewhat clear when we look at the industrial regions. It is on the basis of observed facts about an industrial region, ‘the Industrial Location Theory’ was explained by Weber. Four significant factors have been elaborated in the explanation of his theory.
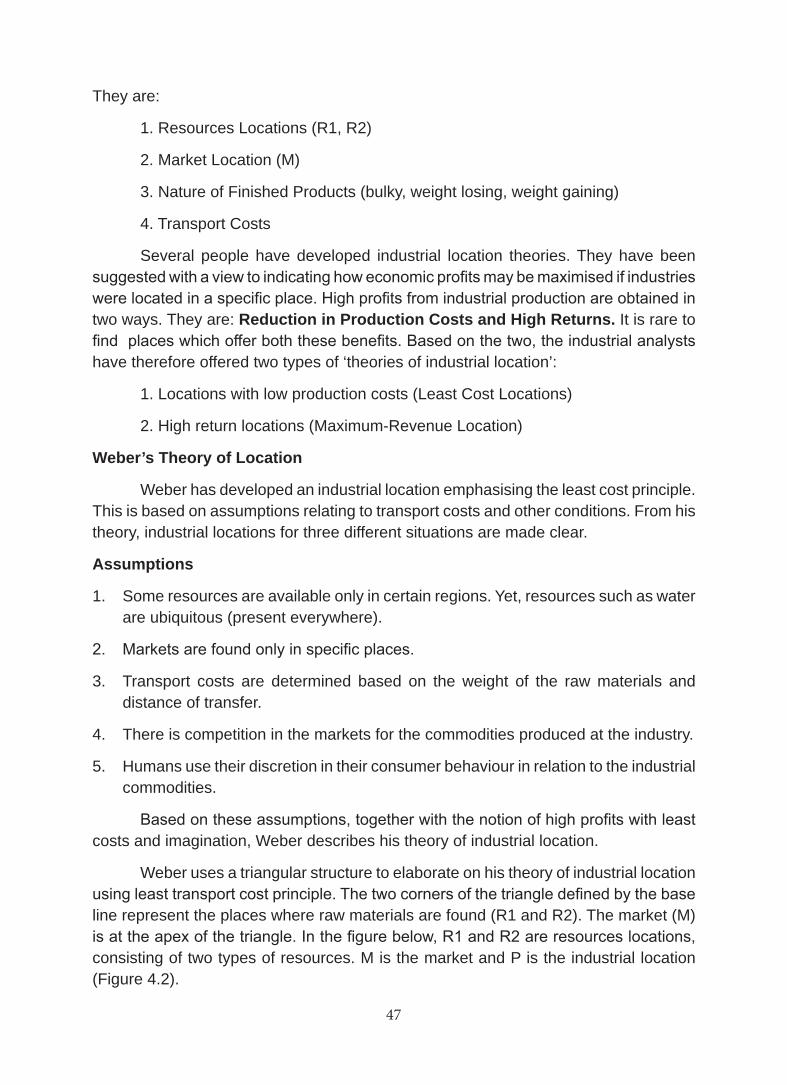
46 47
They are:
1. Resources Locations (R1, R2)
2. Market Location (M)
3. Nature of Finished Products (bulky, weight losing, weight gaining)
4. Transport Costs
Several people have developed industrial location theories. They have been suggested with a view to indicating how economic profits may be maximised if industries were located in a specific place. High profits from industrial production are obtained in two ways. They are: Reduction in Production Costs and High Returns. It is rare to find places which offer both these benefits. Based on the two, the industrial analysts have therefore offered two types of ‘theories of industrial location’:
1. Locations with low production costs (Least Cost Locations)
2. High return locations (Maximum-Revenue Location)
Weber’s Theory of Location
Weber has developed an industrial location emphasising the least cost principle. This is based on assumptions relating to transport costs and other conditions. From his theory, industrial locations for three different situations are made clear.
Assumptions
1. Some resources are available only in certain regions. Yet, resources such as water are ubiquitous (present everywhere).
2. Markets are found only in specific places.
3. Transport costs are determined based on the weight of the raw materials and distance of transfer.
4. There is competition in the markets for the commodities produced at the industry.
5. Humans use their discretion in their consumer behaviour in relation to the industrial commodities.
Based on these assumptions, together with the notion of high profits with least costs and imagination, Weber describes his theory of industrial location.
Weber uses a triangular structure to elaborate on his theory of industrial location using least transport cost principle. The two corners of the triangle defined by the base line represent the places where raw materials are found (R1 and R2). The market (M) is at the apex of the triangle. In the figure below, R1 and R2 are resources locations, consisting of two types of resources. M is the market and P is the industrial location (Figure 4.2).
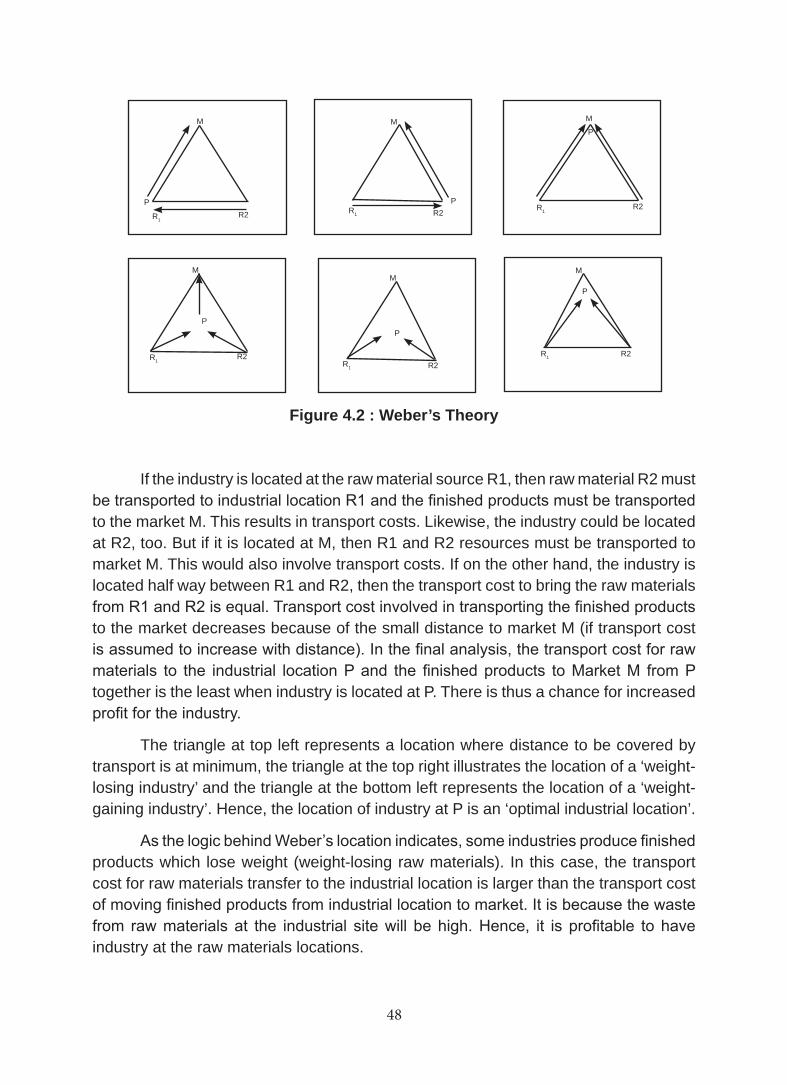
48 49
Figure 4.2 : Weber’s Theory
If the industry is located at the raw material source R1, then raw material R2 must be transported to industrial location R1 and the finished products must be transported to the market M. This results in transport costs. Likewise, the industry could be located at R2, too. But if it is located at M, then R1 and R2 resources must be transported to market M. This would also involve transport costs. If on the other hand, the industry is located half way between R1 and R2, then the transport cost to bring the raw materials from R1 and R2 is equal. Transport cost involved in transporting the finished products to the market decreases because of the small distance to market M (if transport cost is assumed to increase with distance). In the final analysis, the transport cost for raw materials to the industrial location P and the finished products to Market M from P together is the least when industry is located at P. There is thus a chance for increased profit for the industry.
The triangle at top left represents a location where distance to be covered by transport is at minimum, the triangle at the top right illustrates the location of a ‘weight-losing industry’ and the triangle at the bottom left represents the location of a ‘weight-gaining industry’. Hence, the location of industry at P is an ‘optimal industrial location’.
As the logic behind Weber’s location indicates, some industries produce finished products which lose weight (weight-losing raw materials). In this case, the transport cost for raw materials transfer to the industrial location is larger than the transport cost of moving finished products from industrial location to market. It is because the waste from raw materials at the industrial site will be high. Hence, it is profitable to have industry at the raw materials locations.
R1
R1R1
R1
R1
R1
R2R2
R2
R2 R2R2
P
PP
P
P
P
M MM
MMM
48 49
As the industry is located at a point between the raw materials locations, transport cost to transfer bulky raw materials is reduced considerably. The transport cost for transfering the finished products from the industry to the market is also small. In such a context, Weber believes that it is profitable to set up the industry at a location in between the industry.
There are some industries which manufacture finished products gaining weight in the process. The transport cost between raw materials location and industry is lower than the transport cost of finished products from industrial location to the market. It is logical therefore to locate the industry at the market. According to Weber, this location is more profitable to the industry than any other.
The lacuna in Weber’s location theory is that it is based on the transport cost. Nevertheless, this theory of industrial location is considered superior to other industrial location theories., for its logical conclusions.
Learning Outcome
Students have gained knowledge and understanding of the various industrial systems, their locational and production factors, including industrial location theories of geography.
EXERCISESI. Fill in the Blanks
1. An industry obtains its raw materials from another industry is referred to as __________________.
2. The place where demand and supply of a commodity meet is known as _____________.
3. Weber’s theory is known as ______________.
4. Transport cost is determined by the weight of materials and _______________
5. ‘Weight-gaining industry’ is seen located at ___________.
II. Choose the correct Answer
6. The activity that obtains its resources directly from the nature.
a) primary Industries b) secondary industries
c) tertiary industries c) quarternary industries
50 51
7. The links that are established for selling the consumer products.
a) input linkage b) output linkage
c) strong linkage d) weak linkage
8. Theory that explains the location of industry.
a) Weber’s Theory b) christaller Theory
c) Vonthunan Theory c) Malthus Theory
9. The state in which the four industries are inter-linked.
a) input linkage b) output linkage
c) functional linkage d) strong linkage
10. Regions with industrial concentrations.
a) desert regions b) forest regions
c) mountain regions d) raw material available region
III. Brief Answers
11. Weak linkage.
12. Location theory.
13. Weight-losing raw materials.
14. Fuels.
15. Tertiary industries.
IV. Paragraph Answers
16. Raw materials.
17. Quaternary industries.
18. Functional linkage.
19. Idustrial regions.
20. Labour.
V. Detailed Answers
21. Discuss the factors of industrial location?
22. Write in detailed about Weber’s Industrial location theory?

50 51
VI. Practical Exercises
23. Discuss the factors of industrial location.
24. Mark the industrial regions on the world map.
25. Make a list of primary, secondary, tertiary and quaternary industries in your locality.
26. Collect pictures showing different industries at different stages (scrap book).
52 53
UNIT 2HUMAN-MADE ECOSYSTEMS I
LESSON 5TRADE SYSTEMS
Learning Objectives
Students learn from this lesson about the trade systems operative in the world and learn also to appreciate factors that cause, influence and hinder trade development throughout the world.
Development of a country depends on the ability to satisfy its own needs. But due primarily to the geographical conditions existing in the country, it may not be possible for it to produce all its needs. Hence, it produces some goods in good measure and others in a large measure. The commodities produced in excess of demand is considered as the ‘surplus’ product while those produced in quantitites less than demanded is considered as the ‘deficit’ product. The process in which the surpluses are bartered for the deficits is called ‘trade’.
Development of Trade
In historical times, trade was in barter. Barter is a practice in which one commodity is exchanged for another. In international trade, it often happened that a country trading with another was unable to supply a commodity the other country required. In such circumstances, there is need for a commodity that could be bartered in its place. For this purpose, therefore, gold and silver coins were used. With modernisation and population growth, there was an increase in the number and size of trade commodities. As a consequence, there were some practical difficulties in using gold and silver coins as the transaction money. To avoid these, paper currency was used.
Role of Geographical Factors in Trade
It is likely that a region may not be in a position to produce what it needs or it is unable to meet all its requirements when it is produced. Therefore, there arises the need to buy the product from other regions that produce them. This is how trade begins. Geographical and cutlural factors are the bases of trade. Geology, climatic conditions, population, stage of technological development and culture are some of the important factors that determine the demand and quantity of trade.
Geology. The structures and characteristics of rocks of a region depend on the nature of geology of that region. As such the minerals and the fuels mined from beneath the surface differ from place to place. Some minerals are found in some countries alone.
52 53
For example, petroleum, coal, gold, silver and copper are produced in appreciable quantities only in some countries. Depending upon the nature of the land patterns, the agricultural products also vary. For example, the plantation crops such as coffee and tea are grown on the hill slopes.
Climate. Every agricultural product requires a certain set of climatic conditions. Hence, the agricultural products of a region vary with the climatic conditions obtaining there. For example, sugarcane in tropical areas and oats and barley in the temperate areas are grown in their respective climatic areas. It is thus clear that all crops do not grow in all climatic regions.
Population. The commodities produced in a country are exported only after they have satisfied the demands of the people of that country and a surplus is left over. That is why, whether a commodity is in excess of demand or in deficit, is based on the population number. For example, although India produces more rice than Myanmar, it is able to satisfy only its domestic need. On the contrary, Myanmar, because of its small population, has become a rice exporting country.
Stage of Technological Development. The quality and quantity of the commodities produced in a country depends on the technological development in that country. The developed countries of the world manufacture highly valued machineries and consumer products. As the technological development of the developing countries is not appreciable and it is difficult to convert the raw materials into consumer goods. They export therefore the raw materials. Hence, these countries have low incomes. On the other hand, the manufactured products increase for a country using its technological process. For example, rice production in Japan is 6,000 kg to a hectare. But in India, it is only 2,000 kg / hectare.
Culture. Some products are manufactured in accordance with the culture and heritage of an area. Some important handcrafts, for example, Thanjavur plates, brass vessels of Kumbakonam, silk of Kanchipuram and the like are produced in line with the culture and tradition of the areas. And they have their own value in the international markets.
In this way, the demand and supply for manufactured commodities differ from place to place. Trade transfers the surplus of one area to the area where it is in deficit. Thus, trade helps with all the required commodities being made available to all places. Transport supports this activity.
Trade Balance. The value of the currency of a country depends on its ‘trade balance’. It is the difference in money value between the commodities exported to and the commodities imported from any given country. When the value of the commdities imported by a country is smaller than the value of the commodities exported by it, then that country is said to have a ‘favourable trade balance’. If it is the reverse of it, then it is said to be an ‘unfavourable trade balance’. In the countries like Japan and the United States of America, export is far higher than the import and hence they have a favourable trade balance.
54 55
When there is demand in one country for a product produced in another country, then it has no option but to buy this product from that country. Conversely, the money currency of that country goes up in value. For example, for the products such as machinery and consumer goods manufactured in the developed countries such as Japan and the United States, there is market in most other countries of the world. Those countries which produce petroleum and export to all other countries have become the richest countries by themselves.
Trade Types
Trade may be classified, geographically, as follows.
Internal Trade. The trade that occurs with the limits of a country is called the internal trade. In this trade, the retail and wholesale traders buy the commodities from the producers and sell to the consumers. Internal trade may be further divided as local trade and rural trade.
Local Trade. It is a trade that occurs either on a daily basis or on some week days, within a place. For example, these include the daily markets of the towns and cities and the weekly markets of the rural areas. In these markets, the producers themselves sell their products to consumers, more often than not. Perishable commodities such as the flowers, fruits, vegetables and such commodities as those of the daily essentials are traded here.
Rural Trade. All commodities required by the parts of a country are not normally produced in all parts of that country. Also, there is a specific rural market for most of these commodities. Hence, trading is generally seen between different parts of that country. For example, the coffee that is grown in south India is sold in all parts of the country. Similarly, the wheat that is grown mostly in north India is sold in all parts of the country.
International Trade. It is a trade between the countries of the world. No country can exist in isolation. They have to import those commodities they themselves do not produce, but require nevertheless. Generally, agricultural and mineral products are exported from the developing to the developed countries. In return, scientific instruments, machineries and electronic equipments are imported by the developing from the developed. In international trade, there are two major types.
Bilateral Trade. In this trade, a country gives a commodity it has in surplus to another in return for an equally valuable commodity it requires and directly from that country.
Multilateral Trade. In this trade, a country exports commodities it produces to another and gets what it requires from a third using the money it receives from the importer of its commodities.
As each country has its own currency, it posed a problem in the multilateral trade as to which currency to be used in transactions. In the beginning, the trade was
54 55
conducted either with the American dollar or with the British sterling pounds. Later, however, the currencies of the developed countries such as Japan (Yen), Germany (Deutsch Marks) and France (Francs) were accepted. It was because there were not much of differences between the value of these currencies. International Monetary Fund (IMF) has been established under the auspices of the United Nations which permits the Special Drawing Rights (SDR) as the international currency. Every member country has its own SDRs depending on its share in the IMF. Each and every country could import commodities from other countries using these SDRs as the currency. The IMF thus provides loans for the member countries for the conduct of international trade.
We could understand a country’s level of economic development from the commodities it exports and the commodities it imports. For example, as we have seen, the developing countries largely export resources and agricultural products and import high cost machines and consumer products. On the other hand, the developed countries import more of the raw materials and agricultural products, convert them into machines and consumer products and then export them to the developing countries. Every country, in its efforts to achieve a favourable trade balance, tries harder with actions to decrease the imports and increase the exports. To discourage imports, it imposes customs duty. And to increase exports, it provides subsidies. As a result, international trade is affected. To avoid this difficulty, therefore, many countries have created trade blocs.
Trade Blocs Nowadays, the conditions conducive for free international trade are rare. Yet, in some regions, the trade is without external barriers. The basic reason for this is the concept of ‘trade blocs’. Such blocs are found mostly in Europe.
Eurpoean Economic Community (EEC). In 1948, Belgium, Netherlands and Luxembourg established an economic cooperation under the organisation known as the Benelux. Later, together with France, West Germany and Italy, an organisation known as the European Coal and Steel Association was established. In the beginning, it had very little authority to act but later it formed the basis for the creation of the European Economic Community. Although all blocs have almost similar objectives and goals, they differ in their functions and development.
It was established according to the 1957 Rome Agreement. As of now, there are 15 member countries in the EEC. These countries had not removed the customs and excise nor the import restrictions, immediately after the establishment. Rather, trade restrictions on industrial commodities were removed in 1966 and a common customs duty was brought in. In this bloc, most countries are still largely agricultural communities. There is protective and integrated agricultural development. Farmers receive high prices for their agricultural products. This community ranks third in the world trade. Forty five per cent of all commodities in the world trade is accounted for by the EEC.
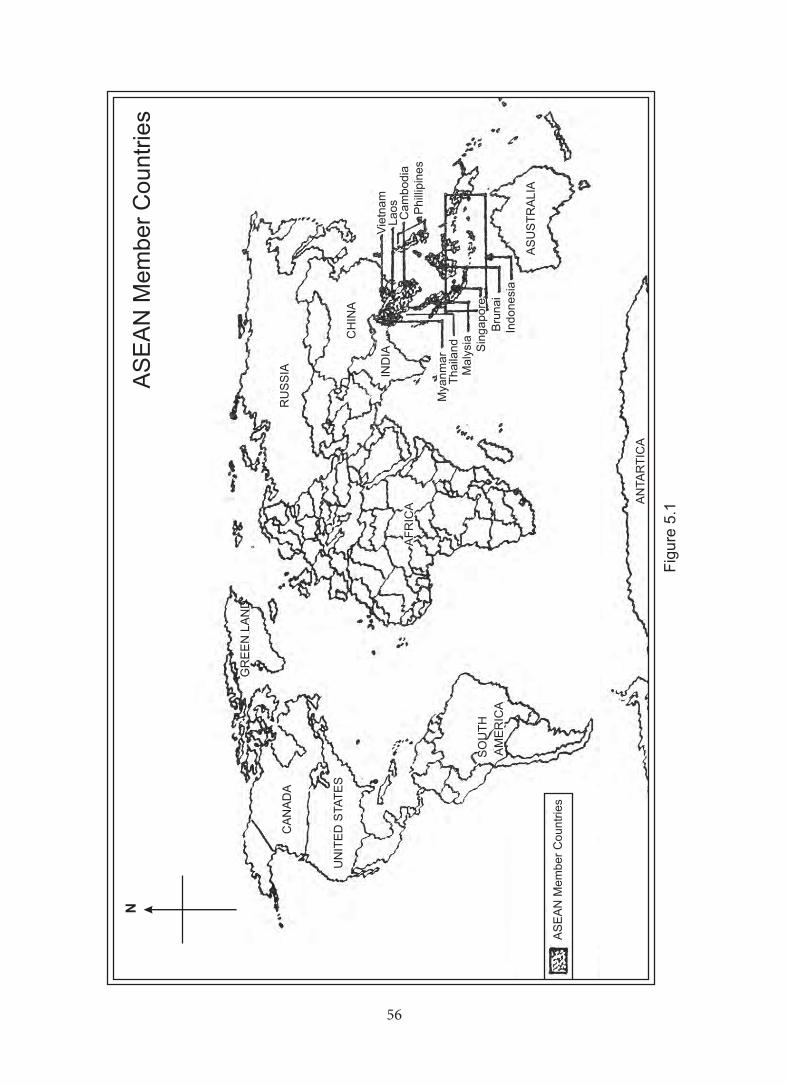
56 57
N
AS
EA
N M
em
ber
Countr
ies
GR
EE
N L
AN
D
CA
NA
DA
UN
ITE
D S
TA
TE
S
SO
UT
H
AM
ER
ICA
AN
TA
RT
ICA
RU
SS
IA
CH
INA
AF
RIC
A
IND
IA
Mya
nm
ar
Thaila
nd
Maly
sia
Sin
gapore
Bru
nai
Indonesi
a
AS
US
TR
ALIA
Phill
ipin
es
Cam
bodia
Laos
Vie
tnam
AS
EA
N M
em
be
r C
ou
ntr
ies
Fig
ure
5.1
56 57
ASEAN
This was established in 1967. This is an organisation of the southeast Asian countries. The fast growing countries such as Indonesia, Malaysia, Thailand, Philippines and Singapore are the members of this organisation.
Trade tariff among these countries have been reduced. As a result, the trade between this bloc and other regions of the world is rapidly increasing. With the exception of Singapore, all other countries export agricultural products and natural resources to Japan and the western countries (Figure 5.1).
Benefits from Trade Blocs
1. There are tariff reduction among the member countries and trade restrictions with other countries. Hence, trade between the member countries develop fast.
2. As the members are treated as one single bloc of countries, they all gain economic strength. They also achieve bargaining power.
3. When trade restrictions are relaxed, there is easy flow of commodities from one country to another. The producers have the benefit of a larger market and just not the internal market alone. So, they produce more and export to countries other than those of the bloc as well.
4. Where geographical and cultural conditions favour a certain commodity, there is preference given to such a commodity in production. As such, such commodities are produced at low costs and more efficiently.
5. Political unity can be achieved through establishing trading blocs. Avoiding wars, economic cooperation will prevail.
Trade Trap and the Fall of Markets
We have already seen that in the trade between the developed and the less developed countries, there is no equality. The less developed countries are dependent on resources and agricultural products for their trade. The proceeds from the sale of these are used in the purchase of manufactured products and development technologies. In these circumstances, the value of imported commodities and products is far higher than the value of the exported products. There is thus no demand-supply equilibrium. Trade balance, therefore, is favourable to the developed countries and unfavourable to the developing countries. This pushes the developing countries into a deprivation which acts as a trap. This trap is commonly referred to as the ‘Trade Trap’. The intensity of its effects depends upon the level of development of these countries.
Market Tremors
No country can achieve a stable position in the world trade. The economic change and the policy change that occur in a country may destabilise its position in the
58 59
world trade. Therefore, there are changes in trade in the global market. Japan and the newly industrialising countries are in competition with the developed countries. Sudden changes in the market result in the protective and restrictive actions. Therefore, there is a belief that the world trade is gradually sliding. In consequence, there are difficulties. The economic gap between countries is widening. Japan and Germany have grown considerably, particularly in world trade. They do not spend much on the national defence. Economic development is therefore the reason behind the market tremors.
To make the procedural changes in order to make world trade simple, an agreement known as GATT (General Agreement on Trade and Tariff) has been established. Under the auspices of GATT, several rounds of talks were held between the developed and the developing countries to develop free trade between them. The Uruguay round of talks which began in 1986 ended in 1994. The 100 odd countries which participated in these talks signed an agreement. This agreement is named after the head of the GATT by the name Dunkel - the Dunkel Agreement. As per the directions of the agreement, GATT was dissolved and the World Trade Organisation (WTO) was started in its place in January 1995. This organisation would act as an organisation controlling the world trade.
According to the Dunkel Agreement, the signatories must remove the restrictions and barriers on the foreign imports. Subsidies given to decrease the production costs in agriculture must be stopped. The organisations that have developed hybrid varieties through research will have the patent rights on the varieties they so developed. The farmers should not use the grains grown from such hybrids as seeds; rather they must buy the seeds from these organisations. Likewise, the patent rights have to be respected by all signatories in the case of medicines and medical discoveries.
When this agreement is fully implemented in all the countries that signed the agreement, these countries which were acting as individual economies would become an integrated economy. As such all the world would act as one economy. There are several ideas about the consequences of the Dunkel Agreement. There is good as well as bad. The Dunkel Agreement is considered as a restrictive agreement. But by Dunkel’s statement, the goods produced in one country could be sold anywhere in the world freely and without restrictions; and the world will be an integrated market, causing global management possible.
Learning Outcome
Students have gained knowledge and understanding of the trade systems operating in the world, their advantages and merits in today’s competitive world as partners or as competitors.
58 59
EXERCISES
I. Fill in the Blanks
1. In ancient times, trade was by _______________.
2. On the high hill slopes, ________________ crops such as coffee and tea are grown.
3. The value of a country’s currency depends on its __________.
4. The trade that occurs within the limits of a country is known as __________ ___________.
5. The process by which the less developed countries are pushed to poverty is known as __________ _________.
II. Choose a correct Answer
6. The trade between the countries of the world.
a) Rural Trade b) Bilateral Trade
c) International Trade d) Local Trade
7. The trade in which a country exports to another and buys the commodities it requires from the third with the money received from its exports.
a) Trade Bloc. b) Multilateral Trade
c) Bilateral of Trade d) Internal Trade
8. The trade in which one good is exchanged for another.
a) Barter b) Special Drawing Right
c) Balance of Trade d) Dunkel Agreement
9. The goods produced in excess of a country’s own needs.
a) Deficit b) Surplus
c) Excess d) Export
10. The trade that takes place daily or on a specific week day within a place.
a) Rural Trade b) Local Trade
c) Internal Trade d) Bilateral Trade
III. Brief Answer
11. Market tremors.
12. Trade bloc.
60 61
13. Bilateral trade.
14. International trade.
15. Rural trade.
IV. Answers Paragraph
16. European Economic Community.
17. ASEAN.
18. Benefits from trade blocs.
19. Trade balance.
20. Trade trap.
V. Detailed Answers
21. Explain the geographical factors on Trade.
22. Describe the types of Trade
VI. Practical Exercises
23. Prepare a report on finding what type of trade is being followed in your own place.
24. Discuss the merits of trade blocs in the classroom.
25. Show the countries of the ASEAN on the world map.
26. Make a list of things that show India is involved in inter national trade.
27. Visit the daily or weekly market in your place or neighbourhood and prepare a report on the activities of the market.
60 61
UNIT 3HUMAN-MADE ECOSYSTEMS I
LESSON 6TRANSPORT AND COMMUNICATION SYSTEMS
Learning Objectives
Students learn about the fundamental characteristics of the transport and communication systems and appreciate and understand the importance of the transport and communication systems in today’s life and living.
In our daily life, travel, movement and exchange have become significant aspects. When we travel on vacation, move commodities from one place to another and exchange information, and in all of these, there are certain basic ideas that emerge. These are determined based on the fundamental characteristics of transport such as the distance, time and cost of travel.
We can understand well the association between travel and movement through an explanation of transport. Through transport development, the vehicles and the modes have been shortening the travel distances in the last few years. The Concorde aircraft travelled at great speed to cover the 6,000 km between New York and London in 3 hours. The 462 km distance between Paris and Lyons is covered in 2 hours at a speed of 270 km/hour by the super speed train known as the TGV. The TGV has been in operation since 1983. Another milestone in the history of French Railways is a train being run by a computer and without driver. Such developments lessen the value of travel distance day by day.
Transport as an activity is being carried out mostly by roads, railways, sea routes, river ways, air routes and by the telecommunications. The landscape characteristics of a place determine the nature of vehicles and modes of travel. The travel costs vary with the types of vehicles and modes of travel. This cost may be divided into travel cost and freight cost. These charges are collected from us towards meeting the expenses of travel and transporting goods to places by the transport sector or agency. The agency expenditure is of three types:
1. Costs of administration and salaries to the personnel.
2. Costs incurred in the utilisation and management of transport vehicles and modes.
3. Fuel and other input costs.
The money paid towards travel is the travel cost (ticket cost). We pay some charges for the ‘luggage’ we take with us; but we do so when its weight exceeds a certain ceiling. The two costs differ with the travel distance. For short distances, these costs are low and for long distances, they are high. The rate of these costs decrease
62 63
with increasing distances. With the modes, they are differently charged. Freight charges collected by the railways are slightly smaller than those collected by other modes.
There are incidental (other than travel) expenses, incurred by the travellers when they are on trips. These incidental charges also differ with different modes of travel. In general, a part of this cost is collected as transport tax. At the sea ports and the airports, this is collected as taxes. The costs incurred while on travel are also included in such costs; for example, the expenditure incurred in getting to the railway station or the bus stand towards a travel.
Transport Systems
It is a practice amongst us to look at the information displayed at the bus and the railway stations. Normally, in the display are the route numbers, the time table for trips and the maps showing the routes and their distances. Such information display provides us with knowledge of the transport network of the region. Transport often operates between the demand and supply points. Transport development of an area depends very much on the social, economic and political infrastructures.
Transport Network. That pattern of roads or rail lines or any routes which facilitates travel, movement and information exchange besides connecting several places with one another is generally referred to as a ‘transport network’. In the network, the nodes and the edges (lines, routes) are fundamental.
Nodes and Routes: In the analysis of any transport work (road, rail), there are three primitive concepts:
1. The Junctions the origin.
2. Routes Connections.
3. The Junctions the destination.
These may be generally referred to as nodes and routes (Figure 6.1).
The transport network differs with different modes. Some transport networks (road and rail) can be seen and understood as such. For example, the network of roads, railways, communication links such as the post offices and the telephone exchanges may be seen and understood as regards their functions. Sea and air transport besides sound and light have specified routes, even if they cannot be seen completely. Depending upon the nature of the network, the national and international transport and exchange will occur.
Transport Types
Transport may be divided into three essential types. They are: passenger transport, commodity or cargo transport and information exchange.
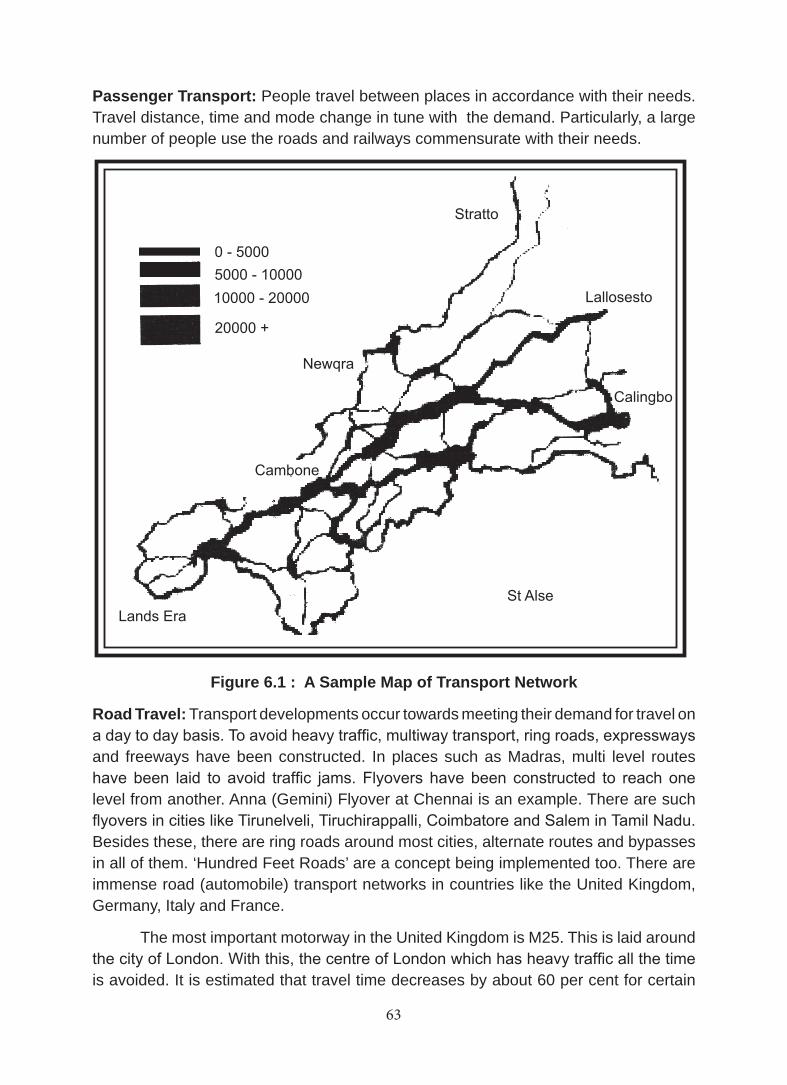
62 63
Passenger Transport: People travel between places in accordance with their needs. Travel distance, time and mode change in tune with the demand. Particularly, a large number of people use the roads and railways commensurate with their needs.
Figure 6.1 : A Sample Map of Transport Network
Road Travel: Transport developments occur towards meeting their demand for travel on a day to day basis. To avoid heavy traffic, multiway transport, ring roads, expressways and freeways have been constructed. In places such as Madras, multi level routes have been laid to avoid traffic jams. Flyovers have been constructed to reach one level from another. Anna (Gemini) Flyover at Chennai is an example. There are such flyovers in cities like Tirunelveli, Tiruchirappalli, Coimbatore and Salem in Tamil Nadu. Besides these, there are ring roads around most cities, alternate routes and bypasses in all of them. ‘Hundred Feet Roads’ are a concept being implemented too. There are immense road (automobile) transport networks in countries like the United Kingdom, Germany, Italy and France.
The most important motorway in the United Kingdom is M25. This is laid around the city of London. With this, the centre of London which has heavy traffic all the time is avoided. It is estimated that travel time decreases by about 60 per cent for certain
64 65
vital locations in London, primarily due to M25. This route connects the three important airports in the United Kingdom (Heathrow, Gadwick and Standstead). Likewise, there are several expressways connecting the European countries. Particularly, along the border between Italy and France, a tunnel for 15 km has been made to facilitate road transport.
Train Travel: Like the roads, the railways play a vital role in passenger transport. The railways have fast passenger and high speed trains, catering to the needs of the people. There are special and permanent trains, which are faster, between some towns or cities. The Vaigai and the Pandian Expresses between Chennai and Madurai and the Satabhthi between Chennai and Mysore are examples of fast and comfortable trains between these cities. There are some trains which operate between 36 and 50 hours and thus are long distance trains. The trains from Chennai to Mumbai and Chennai to Delhi are those that belong to this category.
The recent development in the rail traffic is the opening of the ‘sea tunnel ways’. The best example is the one between London and Paris beneath the English Channel, running for 40 km. This tunnel way, in fact, functions in three tunnels and not just one. In one, the trains are run at 300 km/hour while in the second there is the transport of vehicles crossing the channel. The third is the service tunnel for both. This rail transport began in 1994. This ‘beneath the sea rail transport’ is also an example of human ingenuity and technology. In the cities and mega cities, the railways offer yeomen services to the people. Metro rail transports are either trams services or electrical locomotive units. Trams are still in vogue in Kolkata. They are operating in cities like Toronto of Canada, too. They supplement the road transport. In most cities of India, the suburban railways connect the city centres with the suburban areas. In Chennai alone, the suburban trains carry as many as 2 million passengers a day. It is estimated that in a few years it would touch 3 million.
Air Travel: To travel long distances in short travel times, aircrafts are used. There are planes which could travel at the speed of 6,000 km per hour. There are ‘air buses’ and ‘jumbo jets’ which are carriers of a large number of people. They are ushered into certain special services for their versatility. They are being used in the transport of armies and medical supplies and experts to distant areas. They are useful in any kind of landscapes.
The airline traffic connects areas inaccessible to land (road and rail) transport. Aircrafts help in reaching such areas as the Amazon forests and the distant islands of Andamans and Nicobar. The very heavy air traffic in the world is that between the city of New York and Los Angeles. There is also heavy passenger traffic in the route of New York London Paris. In the same way, there is heavy passenger traffic between India and the Gulf countries, Singapore and Malaysia.
In recent times, there has been a change in the way people travel by air, with the introduction of cheap air travel. While there has been a competition among the
64 65
international airlines, it has also resulted in prices being cut drastically by some airlines to improve their performance. Some new airlines have sprung up offering ‘rock bottom’ prices for air travel, while slashing down on services, which now need to be bought. The new, cheap airlines do not for example hospitality services as part of the ticket fare but rather demand such services be paid for by the passengers making the travel by airlines.
Sea Travel: Some years in the past, there was little sea traffic. Yet, the long distance travel had to be done only through the sea. Only after the advent of the air traffic as a result of technological development along the way, the sea traffic of passengers has come down drastically. There are still some sea traffic, for recreation and relaxation by the rich individuals.
The ships involved in sea traffic have their importance determined by their volume and the structures. They are in effect floating hotels. There are swimming pools, dance halls and special rooms with high amenities and services. While there are ships that could carry as many as 2,000 passengers, there are also ferries and boats/yachts which could carry only a few passengers. Ships that travel at a speed of 50 km/hour to 100 km/hour are in use. As of today, most sea travel is for recreation and tourism. In North America and the island rich European continent, sea travel accounts still for large bulk of the passenger traffic. Otherwise, only the freight traffic and the cargo carriers are the most important of the sea traffic.
The Cargo Traffic: The commodity transport is dependent upon the world trade. The carriers differ with the size of cargoes, their weight and their volume. The light and perishable commodities are transported through the airways. For example, the jasmine flowers harvested in the districts of Erode and Dharmapuri are transported by the trucks to the nearby Bangalore. The flowers are then sent to the Gulf countries, immediately from there. Likewise, vegetables and meat are being sent to the Gulf countries from most parts of the country. Heavy commodities are sent through roadways and sea routes while the liquids and gases are being sent through the pipelines.
The vehicles or carriers are structured according to the nature of commodities. They are sent mostly through tankers (oil) and containers for safety.
In recent times, a new method of transport of cargoes has been in vogue. This is what is called the ‘containerisation’ of cargoes. In this method, all commodities are put into the containers and sent as contained cargoes. This is safe and more compact for transport. These containers are often transported by roadways to the ports. You may have seen the trucks and lorries that carry them. Finished products and consumer products are often sent through containers. Not only in the case of ports, but also in the transport of commodities in the interior of the country, the containers are very useful, in the export and import.
66 67
The commodities so transported are taxed at the origin of commodities traffic and then sent to the customers or consumers. In this method of cargo traffic, various products from several customers are placed into one and the same container and are then transported to the ports, after due precautions for safety by sealing and fastening. The containers are then exported to the overseas markets. Similarly, the containers are transported to the interior locations as they were received from the imports. They are mostly transported by land transports. The customs and excise officials levy taxes for some of these commodities before they are delivered to the addressees.
There are some merits to this form of transport:
1. Commodities are carried safely from the interior locations and cities to the ports.
2. Transport costs are reduced by sending the commodities from several exporters in the same containers.
3. The exporters and the importers could perform their exporting and importing functions from their own places of residences.
4. In loading the commodities onto the ships, containers help with large quantities being contained for export or import.
Liquid commodities such as milk, water and petrol are being transported in the cylindrical tankers. They are taken to many places on the roads and rails. Petroleum and natural gases are transported to the ports and refineries through the pipelines. Efforts are underway to transport grains through the pipelines using pressure as a force for moving.
We have grown to such an extent that we could be proud of our scientific knowledge and skill. In both scientific learning and corresponding technological gadgetry, we have forged ahead to a large extent. From the researches we have undertaken on the solar system and the planetary dynamics, we have been able to receive clear and intelligent information from the telecommunication equipment through technological advancements. As we have understood the import of telecommunication development, we have moved forward, step by careful step. We have thus developed new techniques. As the lilies multiply in a pond, quickly, so does our knowledge through the use of these techniques and equipment.
In the last few years, the diffusion of human knowledge has occurred as never before. This has been possible primarily because of the telecommunication links. With the technological development, books were published. These books helped with the education of most people. Newspapers, radios and television and such communication devices unite almost all the people in the world today.
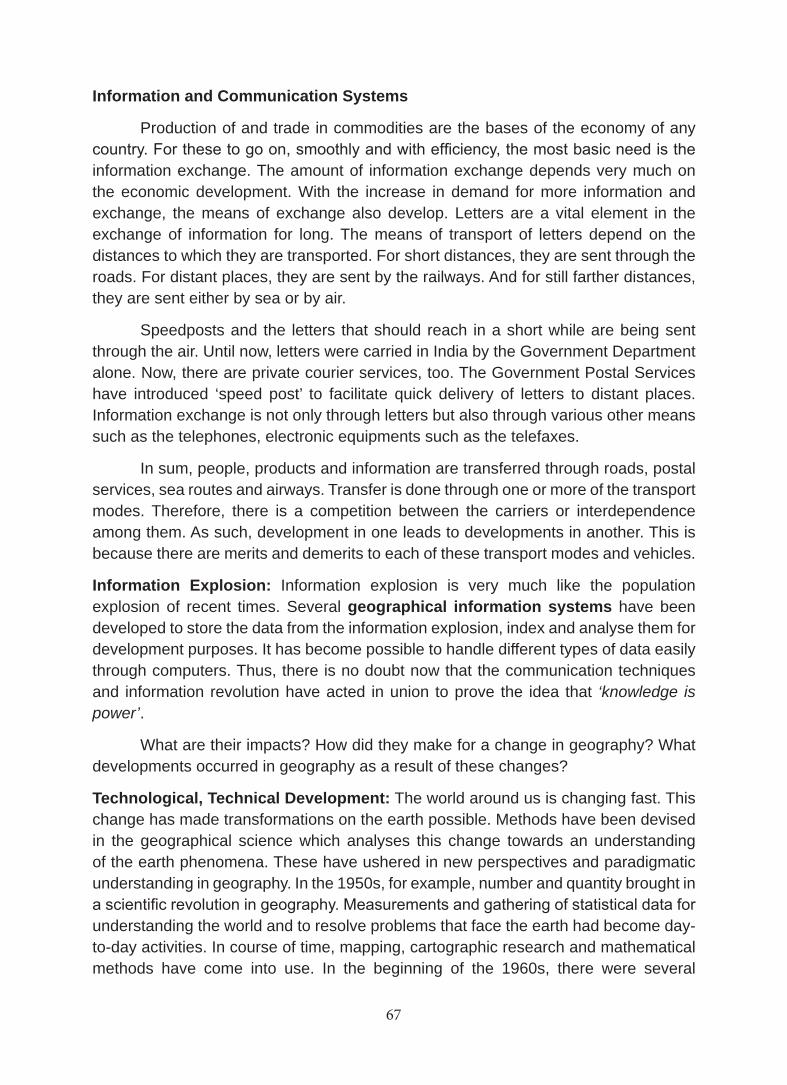
66 67
Information and Communication Systems
Production of and trade in commodities are the bases of the economy of any country. For these to go on, smoothly and with efficiency, the most basic need is the information exchange. The amount of information exchange depends very much on the economic development. With the increase in demand for more information and exchange, the means of exchange also develop. Letters are a vital element in the exchange of information for long. The means of transport of letters depend on the distances to which they are transported. For short distances, they are sent through the roads. For distant places, they are sent by the railways. And for still farther distances, they are sent either by sea or by air.
Speedposts and the letters that should reach in a short while are being sent through the air. Until now, letters were carried in India by the Government Department alone. Now, there are private courier services, too. The Government Postal Services have introduced ‘speed post’ to facilitate quick delivery of letters to distant places. Information exchange is not only through letters but also through various other means such as the telephones, electronic equipments such as the telefaxes.
In sum, people, products and information are transferred through roads, postal services, sea routes and airways. Transfer is done through one or more of the transport modes. Therefore, there is a competition between the carriers or interdependence among them. As such, development in one leads to developments in another. This is because there are merits and demerits to each of these transport modes and vehicles.
Information Explosion: Information explosion is very much like the population explosion of recent times. Several geographical information systems have been developed to store the data from the information explosion, index and analyse them for development purposes. It has become possible to handle different types of data easily through computers. Thus, there is no doubt now that the communication techniques and information revolution have acted in union to prove the idea that ‘knowledge is power’.
What are their impacts? How did they make for a change in geography? What developments occurred in geography as a result of these changes?
Technological, Technical Development: The world around us is changing fast. This change has made transformations on the earth possible. Methods have been devised in the geographical science which analyses this change towards an understanding of the earth phenomena. These have ushered in new perspectives and paradigmatic understanding in geography. In the 1950s, for example, number and quantity brought in a scientific revolution in geography. Measurements and gathering of statistical data for understanding the world and to resolve problems that face the earth had become day-to-day activities. In course of time, mapping, cartographic research and mathematical methods have come into use. In the beginning of the 1960s, there were several
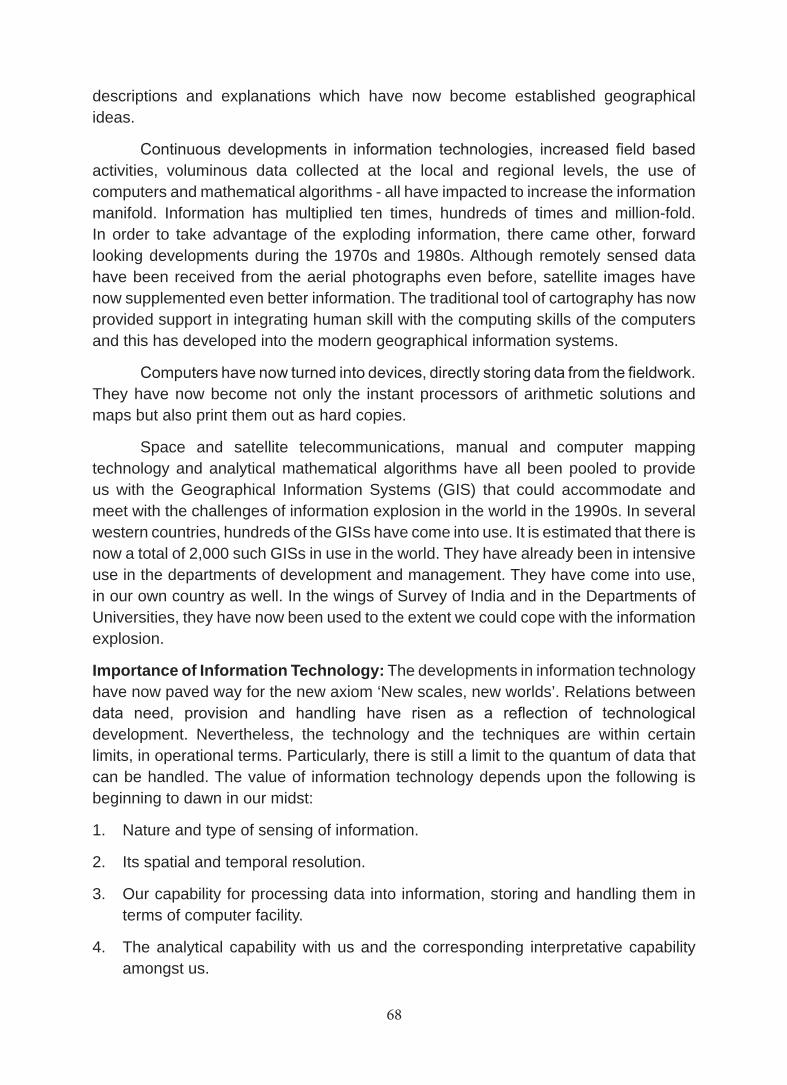
68 69
descriptions and explanations which have now become established geographical ideas.
Continuous developments in information technologies, increased field based activities, voluminous data collected at the local and regional levels, the use of computers and mathematical algorithms - all have impacted to increase the information manifold. Information has multiplied ten times, hundreds of times and million-fold. In order to take advantage of the exploding information, there came other, forward looking developments during the 1970s and 1980s. Although remotely sensed data have been received from the aerial photographs even before, satellite images have now supplemented even better information. The traditional tool of cartography has now provided support in integrating human skill with the computing skills of the computers and this has developed into the modern geographical information systems.
Computers have now turned into devices, directly storing data from the fieldwork. They have now become not only the instant processors of arithmetic solutions and maps but also print them out as hard copies.
Space and satellite telecommunications, manual and computer mapping technology and analytical mathematical algorithms have all been pooled to provide us with the Geographical Information Systems (GIS) that could accommodate and meet with the challenges of information explosion in the world in the 1990s. In several western countries, hundreds of the GISs have come into use. It is estimated that there is now a total of 2,000 such GISs in use in the world. They have already been in intensive use in the departments of development and management. They have come into use, in our own country as well. In the wings of Survey of India and in the Departments of Universities, they have now been used to the extent we could cope with the information explosion.
Importance of Information Technology: The developments in information technology have now paved way for the new axiom ‘New scales, new worlds’. Relations between data need, provision and handling have risen as a reflection of technological development. Nevertheless, the technology and the techniques are within certain limits, in operational terms. Particularly, there is still a limit to the quantum of data that can be handled. The value of information technology depends upon the following is beginning to dawn in our midst:
1. Nature and type of sensing of information.
2. Its spatial and temporal resolution.
3. Our capability for processing data into information, storing and handling them in terms of computer facility.
4. The analytical capability with us and the corresponding interpretative capability amongst us.
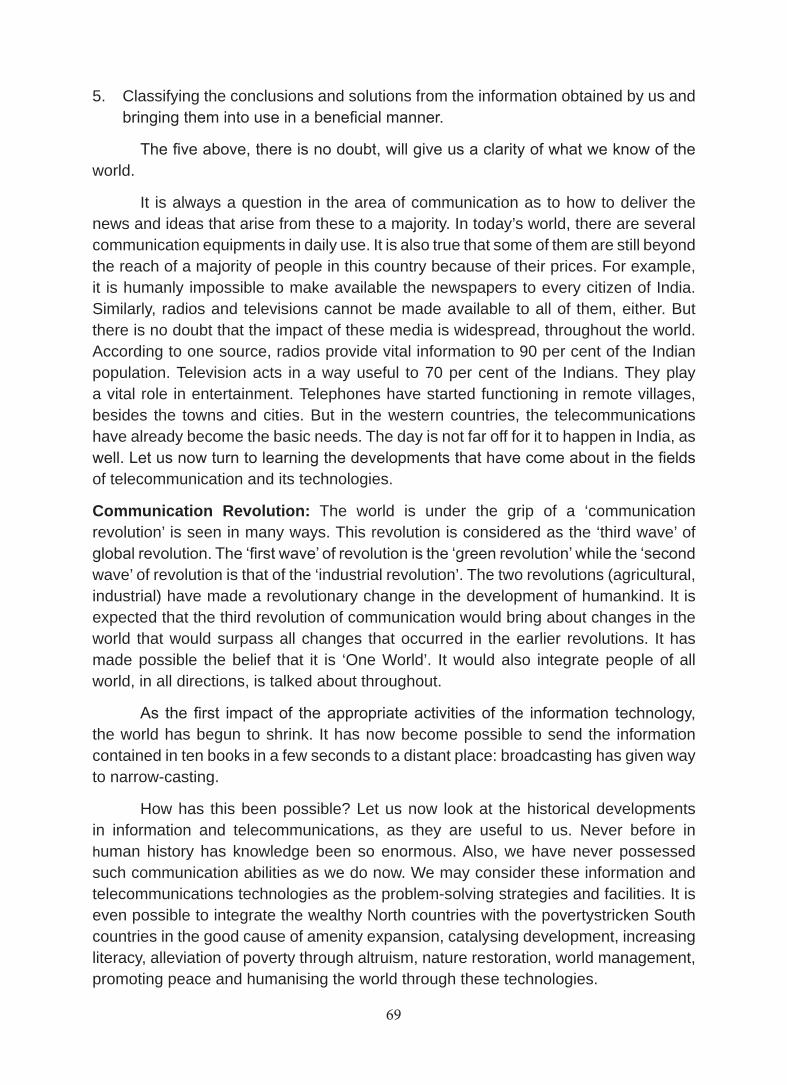
68 69
5. Classifying the conclusions and solutions from the information obtained by us and bringing them into use in a beneficial manner.
The five above, there is no doubt, will give us a clarity of what we know of the world.
It is always a question in the area of communication as to how to deliver the news and ideas that arise from these to a majority. In today’s world, there are several communication equipments in daily use. It is also true that some of them are still beyond the reach of a majority of people in this country because of their prices. For example, it is humanly impossible to make available the newspapers to every citizen of India. Similarly, radios and televisions cannot be made available to all of them, either. But there is no doubt that the impact of these media is widespread, throughout the world. According to one source, radios provide vital information to 90 per cent of the Indian population. Television acts in a way useful to 70 per cent of the Indians. They play a vital role in entertainment. Telephones have started functioning in remote villages, besides the towns and cities. But in the western countries, the telecommunications have already become the basic needs. The day is not far off for it to happen in India, as well. Let us now turn to learning the developments that have come about in the fields of telecommunication and its technologies.
Communication Revolution: The world is under the grip of a ‘communication revolution’ is seen in many ways. This revolution is considered as the ‘third wave’ of global revolution. The ‘first wave’ of revolution is the ‘green revolution’ while the ‘second wave’ of revolution is that of the ‘industrial revolution’. The two revolutions (agricultural, industrial) have made a revolutionary change in the development of humankind. It is expected that the third revolution of communication would bring about changes in the world that would surpass all changes that occurred in the earlier revolutions. It has made possible the belief that it is ‘One World’. It would also integrate people of all world, in all directions, is talked about throughout.
As the first impact of the appropriate activities of the information technology, the world has begun to shrink. It has now become possible to send the information contained in ten books in a few seconds to a distant place: broadcasting has given way to narrow-casting.
How has this been possible? Let us now look at the historical developments in information and telecommunications, as they are useful to us. Never before in human history has knowledge been so enormous. Also, we have never possessed such communication abilities as we do now. We may consider these information and telecommunications technologies as the problem-solving strategies and facilities. It is even possible to integrate the wealthy North countries with the povertystricken South countries in the good cause of amenity expansion, catalysing development, increasing literacy, alleviation of poverty through altruism, nature restoration, world management, promoting peace and humanising the world through these technologies.
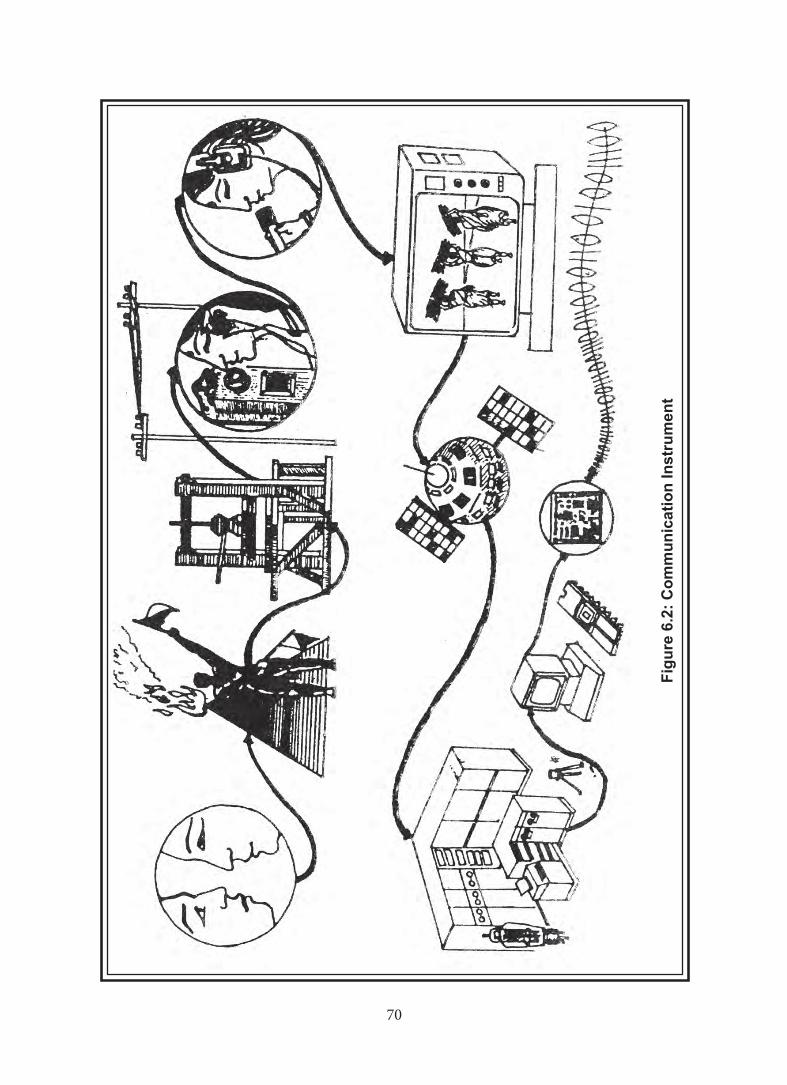
70 71
70 71
Language and New Technologies: In human history, the languages were split and developed as the populations spread and multiplied. Some cultures have gifted their cultures and languages to the outsiders and brought to themselves laurels. Language has alone become the vehicle of communication. Some of these languages have now become the languages of law, administration and the official use through speech, writing and printing.
Telecommunication Technologies In some cultures, the languages have been identified as the ‘human identities’. English, French, Spanish, Russian, Chinese and Arabic are being used by the multitude. Similarly, some of the regional and local dialects are being used as the languages of communication among the peoples. All of these languages offer information through the newspapers, radios and television. All new innovations in technology use languages as the interfaces in the information exchange. Some signal languages are used in the communication with the computers (Figure 6.2).
Ancient Telecommunications: In telecommunications, all information is conveyed through symbols. The African drummers communicated messages through sound. Smoke signals were in use among some tribes as a means of telecommunications. Flags and pictorials were used as auxiliaries to telecommunications.
Printing Revolution: Then came printing techniques. The machinepublished books became the primary sources of information besides reaching most of the world population. The 19th century steam driven printing press gave way to the machines which operated with the electricity and depended on composing. Next came lithopress. Photocopying created a revolution in copying. This is even now in use. In this computer age, printing has become simple through desktop publication. The book in your hands has been published using the computer publishing.
Telegraph and Telephones: The first ever electrically operated telegraphic equipment came into use in the year 1837. Subsequently, in 1867, the telephone was born. These have served humankind for more than a century in the exchange of information. Joining with the computers and satellites in telecommunications, the telephones have revolutionised the internal and international information exchanges. As a ‘two-way communication’ and a ‘communication without codes’, telephones have become a communication link with no match to its versatility.
Radio: Radio broadcasting - especially continuous one - came into vogue in the year 1922. Radio has acquired the epithet ‘the vehicle of social change’ in a few years’ time. It had a very distinctive role in the green revolution of the developing countries. It is also being used as the primary communication link in the population control. It is not only useful to the educated, but even more so to the uneducated. But this is under the Government control. In some western countries, it is also being used as the communication medium in the private sector radio broadcasting. With the telephone, this has made history in individual related communication, too.
72 73
Television: Sound and light based communication was first begun in 1936. This is the television era, which has made possible a ‘reception room revolution’, using the cinematographic techniques. Yet, in some countries it has earned the name ‘the idiot box’, which it does not deserve. This is now an instrument changing the perception of the world population. However, television has coverage of a mere 15 per cent of the population in the poor South countries which hold 75 per cent of the world population. In the North countries, it is rare to see a place or a home without television. In some countries, the telecast is through more than 100 channels. The necessary information they provide, recreational and entertainment fares they offer and the knowledge based telecasts are numerous. Yet, where the cinema impacts more readily on the population as in the developing countries, the hold of the television on the population is minimal.
Deep Sea Telegraphic Lines: These are a communication link among the many countries which have developed quite fast in both telegraphic and telephonic communication. A deep sea line in 1980 carried some 5,000 telephonic links. Now there have been several developments. Many countries are not only connected by the deep sea telegraphic lines but they use them in an important way, too.
The Satellite Power: The first ever satellite is Sputnik 1. This was launched in 1957. It is estimated that over 15,000 satellites have orbited the earth in space. Some have burnt themselves while returning to the earth, in the atmosphere. The 180 satellites sent up by the United States of America are all in use. The 100 satellites sent up by the former Soviet Union are still in operation. Among the 16 satellites launched by India, none failed. They have completed successfully their mission, besides helping with the resources appraisal and in international communication.
As for geography, the images received from these satellites play a vital role in the assessment of resources. They form the spatial database for mapping through the GIS. It is not only easy to analyse the problems that the country faces but also develop solutions using the products of maps and their interpretations. In the operation of satellites, computers have a significant role. It would be otherwise difficult to receive images from the satellites and process them in the lab, were it not for the development of computers. In resources appraisal, the images that we receive from the satellites have a large role to play.
Generations of Computers: Computers have been developed in a very rapid succession. Present day computers are considered the Fifth Generation computers. The first used simple valves. The second generation computers used the transistors. The third has been developed using integrated circuits. And the fourth uses microchips. The microchips are still being used in the fifth generation computers; there are also other technologies in the field of computers.
Computers are useful in telecommunications in two important ways.
1. They act as storages and retrieval media when required.
72 73
2. They have a major role in international information exchange through Electronic Mail (E-mail) and international telecommunications.
One World, One People
The world, the flora and fauna and humans are all intricately intertwined in a relationship. There is no gainsaying the fact that one depends on the other. Yet, strangely, it is a Divided World. It is divided and differentiated as the North and the South, Developed and Developing and the Rich and the Poor.
We have no appropriate allies for eliminating these differences than the very telecommunication media. In recent times, the idea that ‘We are a single people, All belong to this world, There is only One World and the People will be integrated’ is gradually taking roots in the world.
Learning Outcome
Students have learnt that transport and communciation systems have shrunk the world so much that the days are not far off when the world will become a single world and people will become a single people
EXERCISESI. Fill in the Blanks
1. Transport is between ________ and ________ centres.
2. In a transport network, there are ________ and ________.
3. The recent development in railway transport is the _______ traffic.
4. __________ is useful for travelling long distances in a short while.
5. The most intensive air passenger transport is between ________ and _______.
6. Broadcasting has given way to ______________.
7. _____________ are being used in the local and regional communications.
8. In telecommunication, the information is exchanged through ________________.
9. The first ever man-made satellite of the world is _________.
10. _______________ are used in telecommunications in two important ways.
74 75
II. Choose the Correct Answer
11. That which is carried on by the roads, rails, sea routes, river ways, air routes and telecommunications – People, goods and services / Vehicles.
12. The structure that not only connects the places on the earth but also helps in the travel, movement and information exchange – Infrastructures / Transport and Communication.
13. That which connects one level of road with another – Junctions / Nodes.
14. The carrier that transports armies and medical personnel, quickly to the needy – Air buses / Helicopters.
15. That which is taken in tankers and containers – Oils / Milk.
16. As it is a two-way as well as a communication without codes, it has no parallel – Wireless / Telephones.
17. A human designed, remote sensing equipment – Sensor / Camera.
18. It receives the sound waves from the air and converts them into the programmes we hear – Radio / Television.
19. It is a method of long distance communication using signal language - Telegraph / Telefax .
20. It is reception-room entertainment equipment which telecasts programmes in cinematic mode – Television / Video.
III. Brief Answers
21. Demand Supply centres.
22. Transport network.
23. Junctions.
24. Routes.
25. Modes.
26. Printing revolution.
27. Deep sea link.
28. Computer Generations.
29. Information Explosion.
30. Communication Revolution.
74 75
IV. Paragraph Answers
31. T.G.V. Train.
32. Transport cost.
33. Seabed Tunnel Way.
34. Container.
35. Information exchanges.
V. Detailed Answers
36. Language and New Technology.
37. Ancient Telecommunications.
38. Importance of Information Technology.
39. Radio.
40. Satellites.
VI. Practical Exercises
41. Conduct a discussion in the classroom on the importance of transport.
42. Draw a map of the transport network to show the road transport nearest to your place.
43. Looking at an international airline’s time table, draw the air routes on a map.
44. Draw the most important railways on a world map.
45. Visit the nearest railway station to look at the information display at the station for the trains plying several routes.
46. Classroom discussion on the development of communication.
47. Prepare a report of a discussion on the uses of information communication.48. Make a scrap book showing the stage-wise development of communication
media.49. Prepare a schedule of questions to be used in an interview of telegraph and
telephone personnel in your neighbourhood.50. Visit the nearest radio station to learn about its working and discuss your visit
with the class.
76 77
UNIT 3HUMAN-MADE ECOSYSTEMS II
LESSON 7SPACE TECHNOLOGIES
Learning Objective
Students learn about the use of space technologies and understand and appreciate the need for their use in geographical studies and analyses.
Remote Sensing Systems
It is essential for us to understand the properties and characteristics of the elements of the earth around us. While some of these elements can be sensed directly by naked eye, some others are at far off distances and cannot be sensed, directly by us. For example, how could we get to assess the natural resources hidden beneath the soil, bottom of the sea and beyond the mountains? The increasing population and fast depleting of natural resources strengthen the significance of such knowledge.
The science developed by humankind is useful in the appraisal of resources and to finding better means of utilisation of resources of the earth. As local area data are not available to the extent demanded, we need the remotely sensed data. Hence, the collection of statistical information through remote sensing techniques becomes inevitable. In the past, the information about the resources were collected from the maps and the toposheets. Later airborne photographs and the satellite images have come into wide use in resources appraisal.
The term ‘Remote Sensing’ is widely used by the space scientists. The terms came into use only in 1960. Remote sensing can be defined as the act of observation of earth’s features without having direct contact with the objects by sensors like the cameras to collect information and to interpret the information later.
Various platforms are being used for the collection of remote sensing data. The satellites fitted with sensors, cameras fitted in aircrafts, baloons and tall buildings are the most commonly used platforms in remote sensing activities. In general, remote sensing can be divided into two types: Aerial Remote Sensing and Satellite Remote Sensing.
Aerial Remote Sensing
Aerial remote sensing was carried out at first with balloons in 1858. With the discovery of aeroplanes in 1902, remote sensing was carried out through photographing from airplanes, right from 1909. Aerial photographs were very much in use during the First and Second World Wars. After the First World War, aerial photographs and their interpretations were much widely used for constructive purposes in forests appraisal and environmental management research.
76 77
Generally, the aerial photographs are made in order to analyse the prospects for developing resources and resolving problems in the context of a district or a river basin or an urban centre. When detailed information is needed, the aircraft flies at low altitude to get large scale aerial photographs. When special studies are conducted for town planning, crop planning and conservation, 1:20,000 or 1:10,000 scale aerial photographs are made.
To study the land uses, soil types, forests and water resources of a larger area like a district, the aircrafts fly at higher altitudes to take photographs to a scale of 1:50,000 or 1:63,360. Based on our requirements, black and white (panchromatic) photo films, colour films or any other special films can be used.
Satellite Remote Sensing
Based on the nature of remote sensing by satellites, it may be broadly classified into three types:
a) Geo - Stationary satellite
b) Sun - Synchronous satellite
c) Spy - Satellite
Geo Stationary-Satellite: Geo stationary satellites are launched to collect information about a larger area of the earth surface at a regular time interval. These satellites are placed in space at an average altitude of 36,000 km above the equator. These satellites advance in the same direction and speed as the rotation of the earth. Hence, these satellites observe the same portion of the earth at all times. For example, the INSAT satellite which is placed above the Indian subcontinent collects data and monitors the weather conditions of India. We see such imageries as those received from INSAT while the Doordarshan (Indian Television) telecasts the news bulletins. The announcement of weather forecasting is based on the information collected from such imageries regarding land, water and cloud cover and also information collected from the meteorological stations. Since these satellite imageries show large portions of the earth’s surface, minor elements of the earth cannot be seen.
Sun - Synchronous Satellite: These satellites are placed at an altitude of about 600 to 900 km in space. They move North South above the earth and collect information for use on the ground. These satellites take just about 50 minutes to traverse from north pole to south pole within. Since these satellites collect information with the help of sunlight and pass the equator at a specific day time, they are called sun synchronous satellites.
It was the USA that launched the first satellite in 1972. It was a sun synchronous satellite and was later known as LANDSAT. Later 6 satellites were launched, in a series and in collaboration with the European countries. The French Government launched SPOT 1 satellite in the year 1986. Later, SPOT 2 and SPOT 3 were also launched. As
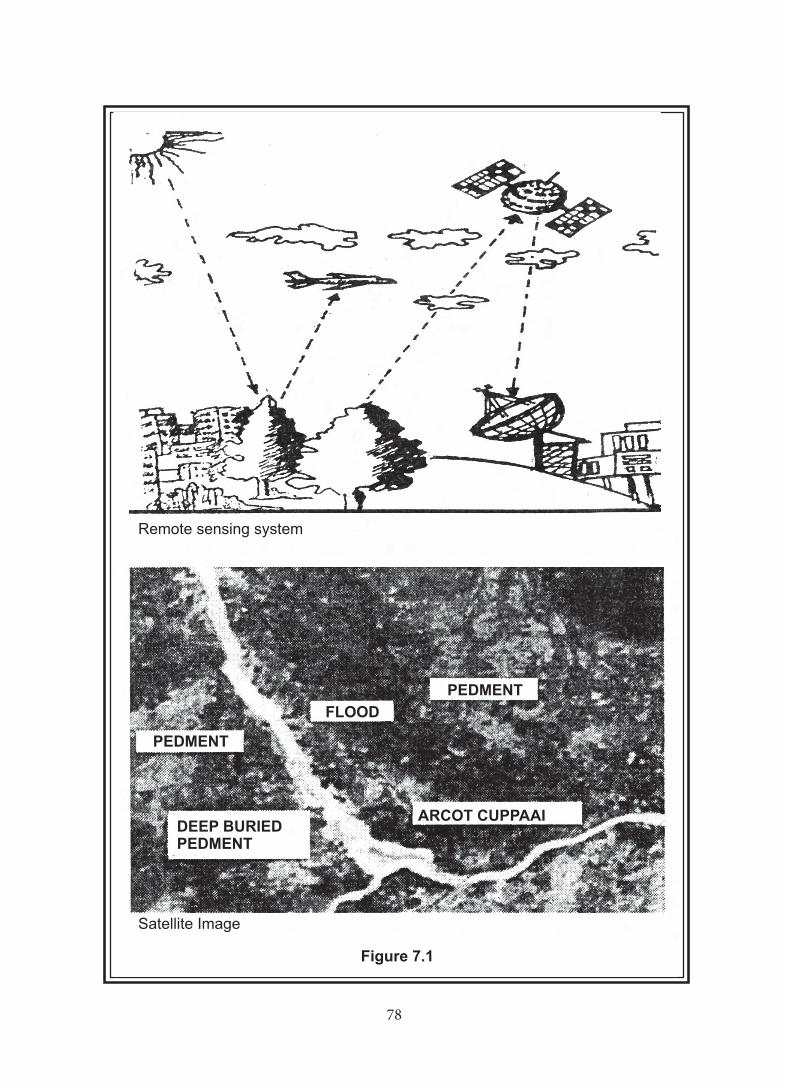
78 79
Remote sensing system
PEDMENT
FLOOD
PEDMENT
DEEP BURIEDPEDMENT
ARCOT CUPPAAI
Satellite Image
Figure 7.1
78 79
a parallel venture, the Indian Government launched IRS 1A in 1988 and later IRS 1B. Likewise, other satellites such as ERS (European Remote Sensing Satellite) and JRS (Japanese Remote Sensing Satellite) series currently revolve round the earth. Images from such satellites can give accurate information just as the topographic maps. These imageries give important information on land uses, water resources, roads and settlements.
Spy Satellites: To collect secret information such as the movement of army troops and locations of atomic power stations, the spy satellites are put to use, with sophisticated gadgetry. Manufacturing of these satellites are expensive and complex. Besides, these satellites operate only for a limited time period. Also, only a few countries in the world have such satellites. Israel is said to be one of those countries specialising in this remote sensing.
Remote Sensing Systems: These systems consist of a number of elements. The elements range from solar radiation to the application of imageries for public problems, through various stages.
1. Sun as a Source of Energy: Sun is the prime source of energy to the world. It is the resource for all activities of the life forms.
2. Emission of Sun’s Energy: Solar energy is emitted into the space. The emission is in the form of various electromagnetic waves. It consists of gamma rays to radio waves (short wave length). This band of rays is called the ‘electromagnetic radiation’ (EMR).
3. Interaction of Solar Energy with Atmospheric Elements: When the solar energy passes through the atmosphere, many elements await to meet the energy. A portion of the ‘electromagnetic radiation’ is absorbed by carbon di oxide, ozone, moisture and dust and reflected back. So, the balance of electromagnetic radiation reaches the earth’s surface as sunlight.
4. Interaction of Sunlight with Terrestrial Features: Electromagnetic waves in sunlight have different wave lengths. A number of bands can be identified based on the wave lengths. These bands of radiation fall on the objects of the earth and get reflected, differently by different objects. The reflectance varies according to the wave length. Through such reflectance, various wave lengths help in remote sensing to identify various elements over the earth. Thus, the spectral reflectances from the earth, in fact earth objects, are of many thousand types.
5. Terrestrial Radiation of the Earth’s Element: The solar energy, along with the energy already stored in the elements on the earth, are radiated back into the atmoshpere. Any object, with a temperature of about 0o K (273o C) will emit energy. Thus, all objects over the earth have temperatures above 0o K and therefore emit energy at varying levels.
80 81
6. Collection of Information/Data: The energy thus reflected and emitted by the earth’s features are recorded by cameras and sensors fitted onto the various platforms. The cameras record the energy in films and the sensors convert the energy into electrical signals and send them to the earth’s receiving stations.
7. Data Acquisition by the Earth Station: The electrical pulses from the remote sensors are converted into ‘digital’ numbers. Each point or picture element gets different (pixel) digital numbers. Thus, a satellite image is composed different digital values or pixels.
8. Remotely Sensed Data Supply: Satellite images and the aerial photographs can be obtained from three organisations or places in India as indicated below:
1) National Remote Sensing Agency, Hyderabad
2) Indian Air Force, New Delhi
3) Air Survey Company, Calcutta.
Uses of Remote Sensing
Remote sensing has been and is being used very widely, to obtain information accurately, with speed and ease, about the vast stretch of land features and water bodies of the earth. The important fields in which remotely-sensed data are used are given below for an appreciation of the technique of remote sensing.
1. Geology. To identify rock types, earth lineaments (fault lines) and landslides, remote sensing is being used.
2. Meteorological Research. To study various components of meteorology such as cloud cover, intensities and variations in weather elements, global climate change and so on.
3. Oceanography. To study various elements of oceanography such as surface temperatures, ocean currents, sea erosion, wave patterns and marine resources.
4. Water and Land Resources. Remote sensing is highly useful in identifying water bodies such as lakes, ponds and rivers, their aerial extent and quality, snowmelt, runoff, surface flow, irrigation, land suitability, soil type and moisture capacity of soil.
5. Land Use, Agriculture and Forestry. Remote sensing is useful also in the field of urban and regional land use studies. Urban development, crop identification and estimation, crop diseases detection, forest cover mapping and deforestation are other uses of remote sensing.
6. Hazard Control. To measure the natural and man made hazards like storms, landslides, floods and pollution and to control such hazards.
80 81
7. Land Survey and Cartography. Aerial photagraphs are widely used for updating the existing maps and to measure heights. Both aerial and satellite data products are used to renew the existing transportation routes and planning.
Indian Space Programme
The Indian Space Programme has a number of activities but the ones that are of some interest to geographers are those of the ones discussed below. India Space Research Organisation (ISRO) has an ambitious programme of remote sensing applications, some of which are reflected here in the chapter.
Regional Remote Sensing Services Centres (RRSSCs)
Recognizing the need and importance of natural resources management in the country, Government of India has set-up the National Natural Resources Management System (NNRMS). NNRMS is an integrated approach for management of natural resources, optimally utilizing the advantages of conventional systems and the information derived through remote sensing. Department of Space (DOS) is the nodal department in Government of India for evolution, establishment of NNRMS and all remote sensing related activities. With a view to have optimum use of space technology for national development it was felt necessary to create facilities for analysing remote sensing data to derive planning related inputs on natural resources of our country. Towards this, DOS has established five Regional Remote Sensing Service Centres (RRSSCs) in the country for speedy operationalization of remote sensing as an integral component of natural resources inventory, monitoring and management. RRSSCs enable the use of remote sensing technology at a reasonable cost to derive necessary information on various aspects related to natural resources. These centres are located at Jodhpur (Western Region), Dehradun (Northern Region), Kharagpur (Eastern Region), Nagpur (Central Region) and Bangalore (Southern Region) function under RRSSC, Central Management Office, ISRO Headquarters, Antariksh Bhawan, Bangalore.
Objectives and Functions
Provide facilities for digital image analysis and Geographic Information System(GIS) to the users
Guide / assist users in application of digital image analysis techniques and GIS
Develop and demonstrate techniques in the new area of applications
Train scientists of user agencies in Remote Sensing Application, digital techniques GIS and theme based applications
Area of Activities
National Missions related to natural resource management
User application projects
82 83
Application validation projects and Technology Development Projects under Remote Sensing Application Missions (RSAM)
Software development and customization
Training and education
Expert advice / Consultancy towards promotion of technology in the country
Integrated Mission for Sustainable Development (IMSD)
Under IMSD, locale-specific action plans for sustainable development of land and water resources are generated on watershed basis, integrating thematic information generated using satellite data with collateral/conventional information and socioeconomic inputs. The action plans are basically recommendations towards improved soil and water conservation for ensuring enhanced productivity, while maintaining ecological/ environmental integrity of the area/region. The action plans, to illustrate, address identification of sites/areas for surface water harvesting, groundwater recharge, soil conservation measures - through check dams, vegetation bunding; sites/recommendations for improved/ diversified farming systems with fodder, fuel wood plantations, agroforestry, and agro-horticulture. These action plans are generated by the joint involvement with the respective Governments departments, State Remote Sensing Centres, universities, private entrepreneurs and NGOs.
National (Natural) Resources Information System (NRIS)
NRIS forms the core information system for the NNRMS and is oriented to aid decision-makers at national, regional, state and district levels to plan various developmental activities in a scientific, systematic, timely and optimum manner. The NRIS provides spatial data-bases of spatial (thematic) and non-spatial data with GIS solutions for decision making. It is organised in interlinked/networked hierarchy so as to cater to free flow of resources information. This venture has set a new trend amongst State-level missionary to have organised natural resources databases at district level.
Bio-Diversity Characterisation
A major project has been taken up for Biodiversity Characterisation at Landscape Level to prepare Biological zone maps and establishment of disturbance gradient for important bio-diversity rich areas of the country using remote sensing and GIS. RRSSCs are actively involved in the project both in database creation and providing software solutions under image processing and GIS domain. The project is aimed at prioritising areas for bio-prospecting and conservation.
Agro-Climatic Planning and Information Bank (APIB)
A pilot project on APIB in Karnataka State has been on-going for consolidating the large amount of statistical and spatial information generated by various organisations and to create a single-window knowledge base for agricultural development. The
82 83
purpose is to provide area specific information on all aspects of farm management that can be implemented by the farmer himself. This bank is not only an information or data bank but also a facilitator by providing the users with tools required for preparing developmental plans.
Rajiv Gandhi National Drinking Water Mission
This is a national mission with an objective of creating scientific database for ground water using remote sensing technology. RRSSCs are involved in the generation of precision products and ground water prospect maps at 1:50,000 scale for the states of Kerala, Karnataka, Andhra Pradesh, Madhya Pradesh and Rajasthan.
Crop Acreage and Production Estimation
This is a important national mission wherein remote sensing techniques are used in providing pre-harvest estimates on crop acreage for major crops in various states in the country. RRSSCs have been actively involved with Space Application Centre, Ahmedabad in providing software solutions through a package “CAPEWORKS”. The package is operationally being used in all ISRO work centres and various State remote sensing centres regularly during the cropping seasons to derive the necessary information related to crops acreage.
Watershed Related Studies
RRSSCs are actively involved in watershed development related studies in the country. IMSD project has paved the way for scientific approach for planning and implementation of certain action plans to improve the land productivity and water resources in a given watershed. RRSSCs are actively involved at national level in monitoring/evaluation of watersheds treated under NWDPRA scheme using multi-temporal remote sensing data. Methodology for operationally executing such a project was developed within RRSSCs on a pilot mode and the same has been operationally utilised for the project.
Disaster Management System – Flood Damage Assessment
RRSSC Kharagpur, one of the regional centres, is well located to provide quick information related to flood and cyclone related disasters. The centre is actively involved in generating such information using remote sensing and GIS techniques. RRSSCs are actively involved in creating digital databases for the flood-prone region of Assam and developing information system for decision making for effective management of disaster. The methodology can be replicated for other flood affected areas in due course of time.
Study of potential and actual area under sericulture through Remote Sensing
Remote sensing techniques have been proved to be useful in studies related to sericulture which basically refers to identification of mulberry growing areas. The
84 85
technique has proved to be very successful and cost effective in the country. RRSSCs are currently involved in a national mission on the project.
Image Processing Solutions
RRSSCs have expertise to deal with variety of image processing solutions. State of the art packages are available for processing remotely sensed data. Many applications have been provided with turn-key solutions by customising the application for smooth implementation. Some of the basic functionalities available under image processing are: Data Input, Geometric and Radiometric corrections; Digital Classification and Advanced Classification Techniques; Multi-layer modeling and multi-spectral analysis; Value added products and services; Terrain analysis and fly simulation; DEM generation and ortho - rectification; Raster and vector utilities; Digital cartography and map production; Data import / export facilities and Soft copy photo - grammetry solutions.
Software Solutions
Software development and turn-key solutions are important services rendered by RRSSCs. The centres are equipped for taking up varieties of developmental activities related to national missions, State and Central government projects, user-specific needs and projects for NGOs and Private industries. The centres also carry out specific software development projects with Academic interface in newer areas of image processing / algorithm development / GIS solutions.
RRSSCs have developed number of software packages in the area of image processing and GIS. The application specific and project specific softwares are now gaining the popularity amongst various user agencies. Hence, the emphasis is now being given on generating tailor - made packages to solve application needs.
GIS Solutions
RRSSCs provide turn key solutions under varieties of situations. The centres not only provide quality training but also involve in providing GIS solutions in majors national missions and user specific projects. Customized GIS solutions, Database Design and Development are the key areas of specialisation. Some of the highlights of the projects executed by our centres are: Resources Mapping/Inventory, management & monitoring; Land and water resources development planning; Urban and regional planning Infrastructure planning; Command area management; Multimedia solutions under GIS for Tourism Information System; Seamless use of image processing and GIS for total solutions; Disaster management; Integrated studies; Environmental Impact Analysis; Change detection; Digital cartographic database; Site suitability assessment; Value added services; Facility management solutions; Consultancy / customized turn key solutions and Customized software solutions.
84 85
Learning Outcome
Students have learnt to apprecitate the usefulness of the remote sensing technology, inclusive of image processing, and then the relevance of the Indian Space Research Programmes in natural resources management.
EXERCISESI. Fill in the Blanks
1. The two types of remote sensing are __________ and _________.
2. First of the aerial photographs were taken from ___________.
3. The source of world’s energy is ____________.
4. The terrestrial energy is recorded by __________ and ________ platforms, in remote sensing.
5. The electrical signals from the satellites are converted as ___________ numbers.
6. The RRSSCs provide software solutions through a package called _____________.
7. NRIS forms the core information system for the ______________.
8. ______________ is the nodal department in the Government of India for evolution and establishment of Natural Resources Management System.
9. ______________ are involved in the generation of precision products and groundwater prospect maps.
10. The national mission wherein remote sensing techniques are used to provide pre-harvest estimates on crop is ______________.
II. Choose the correct answer
11. An organization which has an ambitious programme of remote sensing applications – ISRO / FAO.
12. Packages for processing remotely sensed data – image processing software / state of the art package.
13. This system has been set up by the India Government for the management of natural resources – NNRMS / RRSSC
86 87
14. Sensors and instruments are used from a distance to collect the information about the earth objects – remote sensing / observation.
15. In collecting information regarding the movements of army troops and location of atomic power stations satellites are used - Resource satellites / Spy satellites.
16. The band of rays, from the emission of solar energy, which consists of Gamma rays to radio waves – Electromagnetic spectrum / Albedo.
III. Brief Answers
17. Sensors.
18. Sun-synchorous satellite.
19. Earth station.
20. Digital numbers.
21. Remote sensing platform.
IV. Paragraph Answers
22. Regional Remote Sensing Service Centres and their functions.
23. Activities of the National Resources Information System.
24. Basic functionalities available under image processing.
25. GIS Solutions
V. Detailed Answers
26. Aerial remote sensing.
27. Terrestrial radiation.
28. Geo satellite.
29. Objectives and functions of Regional Remote Sensing Service Centres.
30. Software solutions
31. Disaster Management System – Flood Damage Assessment
VI. Practical Exercises
32. Discuss in the classroom about the uses of remote sensing.
33. Collect and paste satellite pictures from newspapers onto a scrap book.
34. Write a report on satellite pictures for particular days.
35. Visit a remote sensing unit and find out the activities towards preparing a report on the performance of the unit.
86 87
UNIT 4ENVIRONMENTAL DEGRADATIONS
LESSON 8GLOBAL FRESHWATER
Learning Objectives
1. Students learn about the importance of water sources, water demand and water scarcity.
2. Students learn about the quality, quantity and ethics concerning water.
3. Students learn about appropriate methods in relation to water needs, irrigation and water management.
4. Students learn about water pollution, land degradation, difficulties arising out of lack of water quality and the relationships between them.
5. Students learn to appreciate social and economic solutions for problems of water supply, sanitation and health.
Water is Life
Earth is rich in resources. Ups and downs in human life depend on the knowledgeable ways in which the resources are used. Of all the resources, water is the most significant. The Tamil Poet Thiruvalluvar tells us that ‘World cannot exist without water’. As we use a good amount of water in our day-to-day life, what do we think of this? How do we think?
For our ancestors, water was sacred. They believed and treated water better than their mothers. ‘Do not abuse water, even if you do so your mother’ is an old saying, manifesting this belief. But, in today’s society, awareness of the importance of water and the need to manage it have been on the decline. In the circumstances of today, our needs are based on the prevalent economies. In satisfying these compelling needs, there emerge amongst us certain ideas which are alien to human nature. Hence, every one acts in accordance with the needs of the self and in the development interest of the self. The deeper meaning of life, values and uses are discarded and we act exclusively in the interest of economic gains that can be made. It is for this reason we are generally referred to as the ‘homo economicus’.
What is the relation between water and whatever is said above? As for water, there is a widespread ‘economic thinking’ amongst us. It is because the water is inexpensive and/or free. As such, there is a tendency amongst us to use it in the ways we think best or fit.
88 89
The world and the users value water in as much as it is an economic commodity that must be taken the best advantage of. We act in greed and in the interest of improving the economic well-being of the self / individuals. There is a selfish attitude in the use of available waters and with a lethargy that does not speak well of us. As such, the water is contaminated and is wasted by pollution. Consequently, the quantity and the quality of water have been declining fast.
Water, a Valuable Resource
Water is not just an economic commodity. It is our life. In the use of it, we must not act in the self interest, and with a narrow objective of satisfying the need of the self alone. We must safeguard the water resources in a way it will be useful for the posterity and others in a sustained manner. Its quality has to be protected. If we act keeping in view the twin focus of water quality protection and use by the generations of the future, then it would be in line with the sustainable use of the resource. It is in fact in this sense that water is considered the lifeblood of the earth.
Hence, in the use of the liquid named water, we should keep in mind the following:
1. Water is valuable resource.
2. Although it is obtained inexpensively or as a free resource, it has high economic value.
3. In its use, there is no place for selfishness, greed and the narrowminded approach of ‘self development’.
4. As it is increasingly becoming scarce, there is need for greater attention in its use.
5. Water quality must be protected. The individuals and the people have an equal responsibility.
6. It is good to understand others’ thinking and act in an integrated manner in the management of water resources.
It is therefore important that we act in the knowledge that water is a valuable and significant resource. It is in keeping with the ideas presented above that the three following lessons have been written under the broad title ‘Water is Life’. In the first lesson we shall learn about the source, quantity and quality of water. In the second, we shall turn to understanding the implications of the scarcity and pollution. In the third, we shall focus on the water ethics and management.
Water: Quantity and Quality
Sources of Water: Earth scientists speak of two ideas for the appearance of water on the surface of the earth.
1. There was volcanic activity on the earth several million years ago. Hydrogen and oxygen escaped from the volcanic activity. The two then joined to give rise to water.
88 89
2. Comets had been entering the earth’s atmosphere over several million years. The ice carried by the comets evaporated and became water vapour. This water vapour had then condensed to fall as rains to the surface.
The two activities go on in the other planets as well. Yet, there are no water bodies in these planets. Why? It is because the atmosphere that envelopes the earth is not found in these planets. The earth’s atmosphere captures the water vapour. The temperature regime of the atmosphere helps to keep most of the water vapour in the liquid form. Hence, there is opportunity for the development of water on the surface of the earth. It is primarily for this reason, our planet earth is known as the ‘water planet’.
Quantity of Water
Water is the earth’s foremost problem. Of the earth’s water, 99 per cent is not available for direct use by humans. Salinity and the form in which it is available and location, (glaciers, ice caps) are the primary reasons for such a state of affairs. For 1.0 per cent of the world’s water, the entire humanity is in competition. Table 8.1 gives the relative share of water by the sources.
More than 97 per cent of the water on the earth is salt water. This is not directly used by the humankind. The remaining 3 per cent is freshwater. The quantity of water directly available for human consumption is 0.014 per cent to the total. The rest is found in some seas, lakes, rivers, glaciers and icecaps as well as underground.
Surface water is about 230,250 ckm, of which freshwater lakes hold 125,000 ckm, saline lakes and backwaters 104,000 ckm and rivers and fountains 1,250 ckm. Groundwater is about 8.41 million ckm, of which soil humidity is 67,000 ckm, sub-groundwater and deep water 417,000 ckm. While the groundwater accounts for less than one per cent of the total water (in fact, 0.625 per cent), the surface water accounts for a negligible proportion only (0.0171 per cent). Ice and glaciers account for 2.15 per cent of the total waters (or 29.18 million ckm) while atmosphere for 0.001 per cent (13,000 ckm).
Freshwater Sources: Most freshwater is locked up in ice. It is stored also as the groundwater in great quantities. Only the remaining fraction of freshwater is directly available to us as the useful part of the freshwater from the lakes and the rivers. These water bodies are discussed in great detail in the following pages.
1. Icecaps and Glaciers: Of the world’s freshwater, 77 per cent is in solid form in the icecaps. The poles are covered by the icecaps. Antarctica and Greenland are entirely covered by ice. A portion of these flow as the glaciers. Thus, the freshwater is found locked up for a thickness of several thousand metres in the ice covering the polar regions. In these regions, the precipitation is also in the form of snow. As the ice does not melt even during the summer in these parts, the ice becomes solid and becomes the rocks of ice and icebergs. About 29 million cubic kilometre of water is in the form of ice.
90 91
2. River Flows: The surface waters flowing in the rivers are the most useful for us. The waters of the rivers are received primarily from precipitation. Sometimes, the rains gather as snow or ice and turn into surface waters in summer or spring seasons. About 60 percent of the total geographical area of the world is made of river basins. There are several large rivers such as the Amazon and Congo draining the equatorial region. In the South and Southeast Asian regions, there are equally large rivers as those of the Indus, Ganges, Hwango and Irrawady. There are no large rivers in the temperate region as are found in the tropical areas. Yet, because of the special climatic features of this region, the rivers here are perennial. Examples are the Thames, Rhine and Volga. Due primarily to local conditions, streams that run once in several years are formed in the tropical deserts.
A majority of the people live depending on the river waters. But, the quantum of water in the rivers changes with the seasons. As a result, for some months in a year, there may be water scarcities. Groundwater comes in useful during these months.
3. Underground Water: In dense forest areas, much groundwater is gathered. The forests of the tropics, temperate areas and also Taiga regions possess much groundwater. In semi-arid regions also the groundwater is gathered due to rains. Such groundwater aquifers are found in Australia, in the provinces of Queensland, New South Wales and Victoria. Water emerges from the rocks beneath the surface as artesian springs. Groundwater is also found in abundance in the coastal areas. During the times of scarcities, the groundwater of the coastal area is greatly used by the people living along the coast. At times, the groundwater is so very highly exploited that the sea water intrudes down below. As a result, the wells along the coast yield salt water. In most areas of the city of Chennai, there is such a situation.
4. Water Recharge: All the freshwaters mentioned above can be recharged. Yet, the water withdrawn is much more than what is recharged and hence over the years these sources become dried up. When the quantum of water declines in the water bodies, there generally arises a scarcity. With scarcity, the quality also goes down. Particularly, the freshwater loses its quality through contamination and pollution.
Quality of Water
How does the quality of freshwater decline? What are the causes of such declines? Let us look at these questions.
When the humans began to settle down permanently in some areas, the waters in those areas declined in quality through their economic activity. Increasing population, agriculture, industrial activities and urban needs make a large demand on the freshwater sources. With the changing climate, there is a general decline in rainfall as well. Besides these, bio-degradation, salination through irrigation and such other events cause declines in quality. Nowadays, the wastes or effluents disposed from the
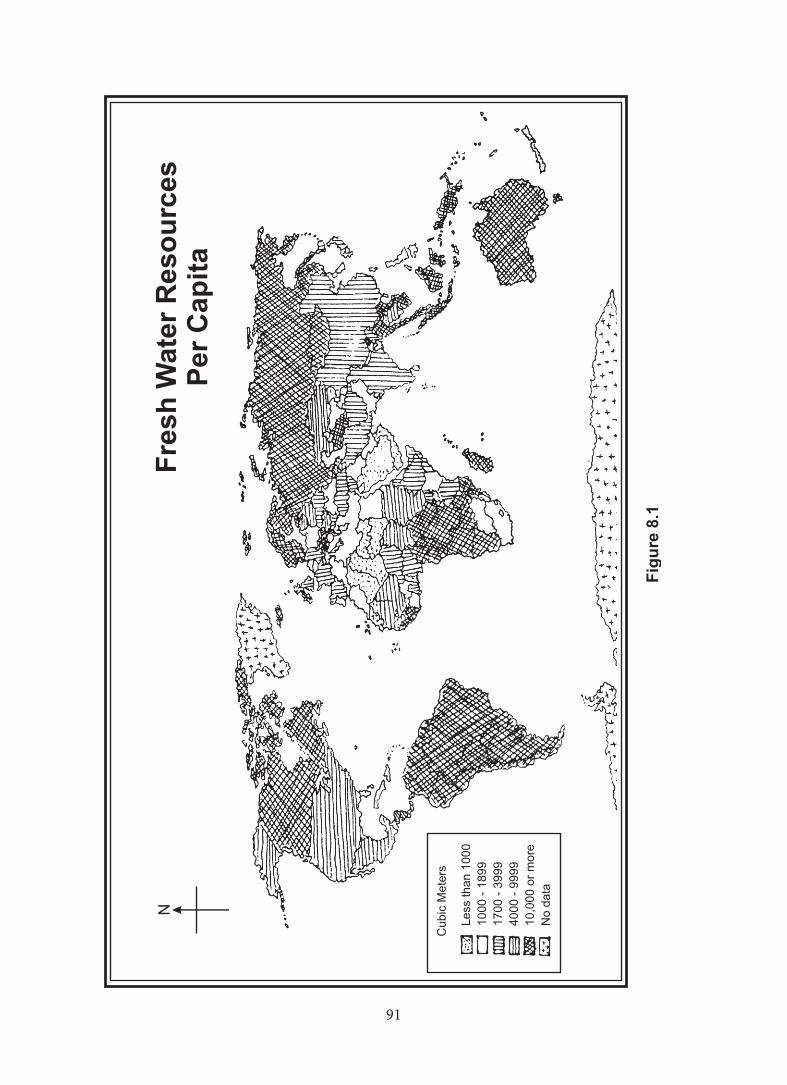
90 91
92 93
industries such as the solid wastes, heavy metals, radioactive materials, nitrates and minute carbon pollutants create problems in water quality. Acidification of the waters of the lakes and streams and declines in oxygen content in the coastal waters are expected to create major problems in water quality in the near future.
We have now seen how the water quality declines due to various reasons. Our life is intertwined with the protection of the water resources. A quality assessment of the freshwaters made by the World Watch Institute has indicated to the declining quality worldwide. This assessment has also indicated to improving quality of the freshwater in some of the industrialised countries. It is pointed out that the quality of freshwater and the protection to it are still not adequate worldwide. The controls remain weaknesses. Just as quality, quantity has also become a worldwide problem. Increasing population further compounds this problem. Water scarcity is likely to become a Crisis of the Future (Figure 8.1).
Problems and Prospects
In the developing countries, water scarcity and indiscriminate disposal of industrial wastes together account for a general crisis. Freshwater sources such as the lakes, rivers and ponds have been disposal sites for domestic wastes, industrial solid and chemical wastes. Bathing, washing clothes and open defecation all go to make these sources highly polluted and these have become daily occurrences as well. These sources are indeed the sources of drinking water for several communities. Hence, 80 per cent of all diseases spread through water. Particularly, diarrhea is the most dangerous disease of the developing countries. This disease afflicts a large number of children below five years of age.
Water Based, Related and Waterborne Diseases
Health of humans is affected because of water pollution, quality deterioration, scarcities and water caused diseases. Diseases that affect human may be conveniently classified as five types, following the World Health Organisation, as shown below.
1. Water-breeding insects such as mosquitoes carry malaria, filariasis and yellow fever. Blackflies transmit river blindness via a parasitic worm. Water-breeding diseases: malaria, filariasis, yellow fever, blackflies and river blindness. Malaria carried by mosquitoes, affects perhaps 160 million people at any one time. There are an estimated 800 million infections each year.
2. Water-washed Diseases such as scabies, trachoma and leprosy and conjunctivitis attack the skin and eyes. All are spread by insufficient water for personal hygiene. Water-washed diseases are scabies, leprosy, conjunctivitis and trachoma
3. Water-based Diseases carried by invertebrates. Schistosomiasis is transmitted by snails; guinea worm is a parasite of a crustacean water flea. Schistosomiasis has been linked to spread of irrigation canals and reservoirs, a veritable habitat for snails. 600-1000 working days are lost per case.
92 93
4. Waterborne Diseases are spread by drinking or washing in contaminated water. Diseases include typhoid, cholera,dysentery and diarrhoea. Diarrhoea kills 6 million children every year. Repeated attacks exacerbate malnutrition, reducing food intake and impairing absorption.
5. Defective Sanitation aids the spread intestinal worms. Eggs are excreted in human faeces. The infection cycle begins on swallowing the eggs. Hookworm larvae usually enter humans by burrowing through the soles of the feet. Heavy infestations can cause death in children.
Trachoma is a contagious inflammation of the inner lining of the eyelids. This often causes blindness. Some 500 million people in the world suffer due to the severity of these diseases.
In the countries of the North (developed), 9 out of 10 people have ample clean, piped water and sanitation. In the South (developing and underdeveloped), only 2 out of 5 people have easy access to safe water and 1 in 4 to proper sanitation. The provision of clean and adequate supplies of water is one of the major problems of humanity in the developing world today. Rivers, lakes and ponds serve both as a source of clean water and as a sink for all wastes generated by humans. Dirty water is believed to be the principal transmission agent for at least 80 per cent of the diseases which afflict the developing countries. The rural poor, who lack access to standpipes, have little choice but to collect their water from rivers, streams, ponds, mud holes and wells. Millions of women and children often spend 6 hours a day walking long distances to bring home a few litres of dirty water. Water scarcities thus call for a concern for water supply and overcoming scarcities of any type.
Water Supply and Demand
Demand for water has been increasing at the global level due to population increases and climate change. Although the world is known as the ‘water planet’, the water that the humankind could use is limited. The scarcity that grew over thousands of years has now turned into a crisis. It appears that the primary cause for the scarcity of water is not only the population growth but also the distribution of water bodies.
Water Distribution and its Demand
Human activities, and in fact life, depend on the availability of freshwater. Like other natural resources, water is unevenly distributed on the earth, leading to scarcities. Its availability in a given region and the need for water do not coincide with each other. Hence, in some areas, people fight floods all their lives while in others they suffer drought throughout.
In the urban areas, when the water from the tap dries up, the day -to- day life comes to a standstill. There is a definite decline in the health. In industries, the production comes to a stop. Agriculture faces crisis, too, specially in the tailend (downstream) areas.
94 95
In some sectors of our economy, water is an input. Irrigation leads the sectors in its demand for water. There are great possibilities for increases in water demand in the domestic and industrial sectors due to population increases. Particularly, in the industrially developed countries, the per capita demand for domestic water is 100 litres per day. When combined with the industrial needs, this per capita increases to 500 litres. In reality, however, 5 to 15 litres of water per day should suffice for an average human being. The modern living is thus based on freshwater and at higher levels of demand.
The largest supply is found in the United States of America. In this country, a large part of the water supplied gets used in the industries. In comparison, the water supply in India is just a quarter of what is being supplied in the United States. Of this water supply in India, a large part is used in agriculture.
Drinking Water Scarcity
Scarcity in drinking water indicates not only to the per capita water availability but also to the difficulties in obtaining the water.
In the developed and industrialised countries, water is supplied largely through taps. But in most developing countries people have to walk to a source for a minimum of 2 km. In figure 2.2 above, the water needs of three different states/countries of varying economic development are shown. It seems that the drinking water scarcity is seen as a consequence of increasing population numbers. This is however true only to a certain extent. There are indeed several reasons for the drinking water scarcity. Most important of these are urbanisation and industrialisation.
Urbanisation
Villages turn into towns, towns into cities and cities into metropolises, in course of time. Towns develop industries and generate employment. As a result of this, people from villages go into town, in search of jobs. Thus rural to urban migration occurs. The basic needs of the urban population increase not only as a result of natural increases in population but also due to migration of people from one place to another, especially to the towns and cities. In particular, scarcities are created in the fundamental infrastructures. It is because there has not been any concerted effort at improving supply of water. Water scarcity is thus compounded by other problems, importantly by not improving the supply position. Drinking water scarcity becomes acute because of this.
In the world today, only in a small number of cities, water sources and distribution are found commensurate with the growth of the city. When plans are made and implemented, the population overshoots the development. For example, in the metropolitan cities of New Delhi, Mumbai, Calcutta and Chennai, scarcities of water are high due to the population growth. The inability to store water at the required levels is yet another reason for scarcity in the drinking water. Drinking water for Chennai has
94 95
been stored in the suburban lakes such as the Chembarapakkam, Puzhal (Redhills) and other sources. These storages are not adequate enough for storing water needed to the city of Chennai. It is because there has been a high siltation in these sources. This has considerably reduced the quantum that could be stored at any given time. As a consequence, the surface runoff as a result of rainfall flows very quickly into the sea. It is because of this reason that water has been transported over large distances, from such places as Neyveli, using the trucks and railways. The expenditure incurred in recent years in the transport of water from far off places has mounted to Rs. 1,000 million a year.
People from rural areas continuously migrate to the cities in large number in search of employment, education and other reasons. The streams that migrate to the cities find their housing in the slums because there is a general shortage of housing. This further aggravates the shortages in water supply and pressures on existing amenities, causing suffering to the people. With congestion in cities, even the most carefully planned water supply programmes are unable to provide sufficient water supply. Almost every city, in the country, has water scarcities in some months of the year that the drinking water scarcities remain a permanent crisis. Only in a small number of villages, there are quality water sources. In many Asian countries, there is no domestic or drinking water supply by individual households. In the rainy seasons, the water that flows in the rivers becomes the source for both. When the river goes dry, the wells, ponds and lakes also go dry. Hence, scarcity exists until the next rainy season. Most peninsular rivers of India are of non-perennial nature. It is for this reason that the water is impounded in dams built across the major rivers. In dry periods, water is let into the rivers from the dam. In times of monsoon failures, the dams also go dry. Industrialisation and other related developments lead to contamination of the freshwater sources.
Industrialisation
Whether town or village, the main cause of water scarcity is industry. In the towns, the water supply has to satisfy both drinking and industrial uses of water. The increasing industrial units have always, for reasons of solvent, coolant and as a source resource for production, increased the demands. With the industrial demands increasing, there has been a short supply in the residential areas of the cities and towns. A particular reason for urban water deficits is that there is a limited opportunity for storing water in them. This is so because the cities are becoming entirely built-up areas, with no provision made for adequate storage construction. Where such constructions exist, the sources of supply have either become dry or brackish, necessitating the fetching of water from far off places. Such external sources are not protected and hence the water is not good quality.
At the global level, there is an increasing decline in water quality. It is difficult at the same time to make measurements and gather quality related data. This causes problem for determining the quantum of freshwater required for a given population.
96 97
The national governments of the world countries have made efforts towards regulatory procedures and protection. Let us now turn to see how the water becomes contaminated and what are its causes.
Land and Water Pollution
Water resources are polluted by the wastes generated by the humans. Water in ponds, lakes, tanks, rivers, seas and oceans and in all other forms gets polluted by the human activities. On the one hand, there is a scarcity of water while, on the other, there is pollution of it. Polluted water affects land and degrades it. Now let us look at how and why water pollution and land degradation occur.
Water Pollution: Water pollution in the world is becoming a serious crisis. There are multiple causes for water pollution. They are:
1. Water draining from agricultural lands, carrying chemical pollutants;
2. Wastewater disposal in urban areas;
3. Industrial wastewater disposal;
4. Wastes disposed of and temperatures of wastes from industrial units such as atomic and other energy production units; and
5. Pollutants of oceans.
Wastes from human activities are the prime causes of water pollution. The indiscriminate dumping of wastes and the natural drainage of the water cause pollution to a greater extent.
Agricultural Wastewaters
Modern agriculture uses chemical fertilisers, insecticides and pesticides. Fertilisers broadcast in the cropped fields, insecticides and weedicides dusted on to the plants dissolve in the water - from rains and irrigation water - and are drained into canals and rivers. They finally reach the sea. It has been estimated that 83 per cent of the sea and ocean pollutants have human activity origins.
Urban Wastewaters
With urbanisation, scarcities in basic amenities have become the order of the day. There appears to be no plan for proper disposing of wastewaters from urban activities. Due to this shortcoming, wastewaters find their way to water bodies. In Chennai city, for example, the rivers such as the Cooum and Adyar carry domestic wastewater. Industrial waste also reach these and create a foul smell in the air. The rivers which were once the quality freshwater bodies have now become urban sewers. On the contrary, rivers such as the Thames of London and the Seine of Paris which were once much polluted and have now been cleaned up. The Ganges was also a heavily polluted river not long ago and has now been cleaned under the Clean Ganga
96 97
Project. Yet, there are several water bodies in the cities and towns of the country which carry wastewaters. The hazardous chemicals which are carried in solution and suspension finally end up in the seas, causing water pollution there too.
Industrial Wastewaters
Hazardous wastewaters from industries are also drained into the rivers and reach the oceans. As a consequence, the recycled water from the hydrological cycle is also a pollutant and contains contaminant traces. Food wastes, metal wastes and chemical wastes are not easily degradable. Hence, their traces are amplified over the years. Equally disturbing is the fact that radioactive wastes and high temperatures from it are transferred to the water bodies.
Atomic Wastes, Oil Spills and Water Pollution
The countries which produce atomic energy claim that the production is for peaceful purposes but they dump the radioactive ashes along the coast, marsh lands and estuaries. This causes the temperature of the sea waters to rise. Consequently, its quality declines.
An estimate has it that nearly 200,000 tonnes of oil is lost as leaks from the industries into the water bodies. Oil spills in the oceans greatly affect the sea organisms, fish and sea animals. Human beings are affected when they consume sea food, including fish.
Another industrial by-product that pollutes water bodies greatly is the tannery effluent. It is often indiscriminately disposed of. In the tanneries, every 100 kg of skins and hides processed requires 3,000 litres of water. This water is used for soaking and is used in almost all processes of tanning. Almost the entire quantity of water used in tanning is disposed of as wastewaters. In places such as Vaniyambadi, Ambur and Ranipettai in North Arcot-Ambedkar, there are hundreds of tanning industries. Wastewaters are not treated before disposal. They are disposed of in the open and into the river Palar. The Palar irrigates lands in its command and thus pollutes the land as well. Even the few wastewater treatment plants in operation in the district are not functioning properly for reasons of power shortage and excessive flow of water.
Land Degradation
Water pollution often leads to land degradation. Water infiltrating from the wastewater sources reaches the underground aquifers and contaminates the underground water. Land is degraded wherever surface waters and drainage and sewage channels carry wastewaters and wherever the sewers are either clogged or broken. Land resources of the urban areas are degraded due to indiscriminate solid wastes and wastewaters dumping in the open. In cities such as Chennai, Salem and Tiruchirappalli in Tamil Nadu, visual blight is appreciable. In the rural areas, however, such blight is hidden and thus are not immediately apparent, except where it is
98 99
widespread. There are of course other types of land degradation. In the Kambam valley of Madurai and/or Theni districts, there is a stretch of land along the Western Ghats fully covered with sand dunes and sand encroached areas, known popularly as the ‘theri sands’. This stretch is 120 sq. km in extent and therefore land degradation is over a vast area.
Although the irrigation water from the wells, rivers and canals is contaminated by solid wastes and wastewaters, chemicals such as fertilisers, pesticides and insecticides, there is only limited awareness of the degradation it causes in the rural areas. Worse, the farmers and the people are not even aware of it. Researches have shown the levels of pollution in such areas through careful measurements. For example, it has been found that the lands irrigated with polluted waters have declining yields. It has also been found that its impact would much depend on the levels of traces.
As a consequence of the events described above, negative impacts have now surfaced. These impacts have pushed us to the options of land and water conservation and management, and importantly earth’s resources and its environment. There is a need therefore to work towards a sustainable future. This future has to be achieved through appropriate environmental and resources management. In regard to land and water, there has to be an integrated management, with an ethical framework. Towards this end, the following chapter speaks of water ethics and management.
Water Ethics and Management
Water resources are being used in several ways towards world development. Water scarcity and decline in water quality have been the end result of economic activities which use water. We have understood the reasons behind the scarcity and decline in quality as those of a high demand for water, improper water utilisation and the progressively increasing population. It is the turn now to know and understand the ethics behind the use of water and water resources management.
Water Ethics
What is water ethics?
Much as we use water for our daily activities, there is a certain moral responsibility on our part to use it and this is the water ethics. How should we assume and take the responsibility for the ethical use? There are in fact two ways in which water ethics could be assumed and taken care of.
1. It is a moral responsibility for all of us to use the water resources without much waste and contamination and realising them in the light of the fact water is available free and in plenty. There is a need to use it in quantities absolutely necessary than waste it. It is important also to be concerned with the needs of others who have the compulsion to use it just as we do. Distribution with justice is in effect good water ethics.
98 99
2. We should not be the perpetrators of water contamination nor should we be the silent spectators to the acts of violation of water ethics by others.
It follows from above that, in short, all our water related actions should always be such that everybody benefits from its use, in an ethical way. This way we all should be able to take an appropriate role in the water management.
Do you know?
More than half the world’s hospital beds are filled with people suffering from WATER RELATED diseases.
Increasing Water Demand
Water is a renewable resource. But in the next 15 years, water scarcity will be very high in 30 countries of the world. It has also been estimated that, by the end of the century, the water need would either double or triple the quantum of need in 1980. It is possible to satisfy the needs of the world population, if only we could follow a careful water management strategy. There are opportunities also for satisfying the need in excess of demand.
Water Ethics and Irrigation
Irrigation Department is a major user of water. Of the global water use, 70 per cent is accounted for by irrigation. With irrigation, 12 per cent of the world’s crop lands obtain benefits. There are chances for the crop lands to double by the year 2000 A.D. This means that irrigation might demand greater water use in the near future.
Do your know?
Water containers typically hold 20 litres of water and weigh 20kgs. Carrying such loads, commonly on the head or back for long distances each day, can result in headaches, fatigue and pain or even serious injury to the head, back, neck and spine. Women are responsible for carrying water and spiral injuries can cause problems during pregnancy and child births; reducing water portage burdens can reduce maternal mortality risks.
Water use in a country depends very much on its efficiency in water use. Even in most technologically advanced country, the efficiency of irrigation is only 30 per cent. As the people of California, in the United States of America, and Israel use water ethically and with enormous care, the efficiency in use is high. They are also good in water management activities. For example, drip irrigation has been used in Israel as well as California to best effect. The farmers and horticulturists make the water drip drop-by-drop at the roots of the crop plants. This system of irrigation has now come into use in India too. With this method of irrigation, a high output of crops is being harvested with small amount of water. In this way, salination of the lands is also averted to a great extent.
100 101
Israel is an exemplary example of water use. In this country, 95 per cent of the water resources has been brought under use. Desert has become a flourishing agricultural land. A fifth of the industrial and domestic waters are treated and then used in irrigation. In 1962, 20 cubic metres of water was required to produce US $ 100 worth of goods. In 1975, it took only 8 cubic metres of water for the same level of production. And today, Israel uses much less water than 8 cubic metres to produce goods worth more than US $ 100.
Do you know?
Seventy three million working days are lost each year in India to water-borne diseases at a cost of $600 million is terms of medical treatment and lost production.
Forty billion working hours are lost each year in Africa to the need to carry water.
Water Ethics and Political Dimension
The one area we have to tread carefully in water ethics is that of the political dimension of water use. Today’s political climate is such that water use is opposed to ethical uses. More than 75 per cent of the World’s 200 major rivers are shared by two countries each. India and Bangladesh are entangled in a dispute involving the Gangetic waters while Brazil and Argentina are at dispute involving the La Plata. In the world, there have been constant and continuing disputes between countries in respect of 6 major inter-national rivers. It will be beneficial to approach these disputes through mediation and cooperation.
A river basin is a natural region. The basin does not place importance on the national boundaries. But ‘the basin is a resource’ is an important value. In the countries the Nile and the Danube flow, water is considered a valuable resource. As for the Nile, Egypt and Sudan reap enormous benefits. Egypt carries out its agricultural and industrial activities in an integrated manner.
Do you know?
Delivering water in the right amount and at the right time can reduce water stress and improve yields. Increasing agricultural output per drop of water depleted will allow more food to be grown with less water.
Water Management
In today’s circumstances, we need a global management of water. World water demand is of course less than world water supply. Yet, water demand from sectors such as agriculture and other industries has been increasing very rapidly. The problems that emerge from the situation therefore indicate to the nature of water demand. As suggested earlier, there will be water scarcity at least in 30 countries the world over by
100 101
the year 2000. Hence, to improve the availability of water and also the quality of water, proper management is a necessity. There are at least two significant means in water management that need to be looked into. They are:
1. Investing on the activities that help store water from the hydrological cycle and related activities such as dams; and
2. Demand management is making efforts to get water supplied where it is needed.
Building dams across the rivers try to satisfy multiple demands at the same time. Flood control, improving hydroelectricity generation and other uses of water including of irrigation are all included in this activity. The dams are also useful as multipurpose resources, freshwater fish, prawn cultivation and recreation resources. For example, the Aswan Dam in Egypt has been a good effort at national development. It provides for 50 per cent of the national demand for electricity and also gives protection from the floods. There are also negative impacts. There have been, for example, heavier clayey and sandy sediments, amounting as much as 100 million tonnes, deposited in the command area. The dam which once made the lands of the command very fertile causes sediments in the Nasar Lake.
As a result, to provide nutrients to make the lands fertile enough for production, the import of fertilisers has been on the increase. Besides, the brick kiln operators of Cairo do not get adequate raw materials for their brick production. It has also been found that the nutrients that were supplied to the sea from the Nile have now become scarce or even rare. The delta has gradually been receding over the years. Land salination and water-logging have increased, causing a degardation of land. The Food and Agricultural Organisation (FAO) of the United Nations has estimated that 35 per cent of the land in Egypt has been affected by salination while 90 per cent of the land in that country has been water-logged. This brings us to the fact that in water management, basin management is the foremost in importance.
Basin Management
In half the countries of the world, the demand for water would double by the year 2000 due to population growth. The pressures emanating from this fact would hasten the problems of the basins. This impinges on other resource problems in our lives. It is therefore important that the river water is a significant part of the water management efforts, too. This is also important for the reason that a problem affecting one part of the basin would automatically affect other parts of the system: an event occurring at one end of the river would impact upon the other end of the river.
River basin, like other resources, should be shared. Hence, water management through participatory approach would provide benefits for all people in the basin. Just as there are conflicts in 148 of the 200 major river basins, there are opportunities in all of these for integrated efforts at management. As of now, however, several countries have transformed their problems into crises. At the global level, there are
102 103
only a few countries which cooperatively and understandingly approach the problem for solutions. From the experiences and successes of these countries, participatory approach emerges as the most effective for resolving the problems.
Water Supply and Sanitation
By an authentic estimate for the year 2000 A.D., agriculture will have the largest use for water, in fact 54 per cent of all waters demanded by irrigation. There are also indications that in the years ahead industrial uses of water will also increase. It is also commonplace that the agricultural uses will be far different than the industrial uses.
Considering the future demands for water in the world, the United Nations has declared the decade 1981-90 as the ‘Water Supply and Sanitation Decade’. Plans and strategies were implemented during the decade with a view to satisfying the basic needs of 1000 million people in the Developing Countries. Water supply and environmental sanitation remained the important focus of the decade. Through an integrated approach to water management and sanitation, there have been improvements in health. Health and welfare have indeed been the emphasis of the decade.
Through the efforts in the Water Supply and Sanitation Decade, some Governments of the Third World have drawn up solid plans having closely looked at the demands and opportunities. In some countries, clear ideas of water supply and environmental sanitation have led the Governments to concerted efforts. In some other countries, the efforts were by way of correcting health and welfare activities. Only Malawi has become a country which has achieved potable water supply for its population.
Some pertinent conclusions emerged as a consequence of researches towards the end of the 1980s. Of these, the four below are very important.
1. Environmental and protection of human well-being must depend upon integrated water resources, liquid and solid waste management.
2. Institutional rehabilitation must occur through an integration of changes in practices, ideas and behaviour and fuller participation of women.
3. Management of social services is required in respect of the use of national (internal) institutions and implementing water and sanitation programmes.
4. Use of appropriate technology and protection and management of national wealth are essential for development with social welfare.
In the first, there is an integrated approach while in the rest the solutions are found through socio-economic approaches.
102 103
Water Crisis and World View
In 1977, the water crisis became a full blown crisis and led to an United Nations’ Conference. At the conclusion of the Conference, A Plan of Action encompassing all features of water crisis was released. Recently, the activities that were taken up under this plan were evaluated and a methodology appropriate for the 1990s has been evolved.
Even though progress has been achieved through these activities, it has come to light that there is yet a lot more needed to be taken up. There is not even an iota of doubt that water resources must be treated as an appropriate resource in human development. And the through the efforts of the Stockholm team of researchers, generally referred to as the Natural Resources Management Researches, it has been conclusively realised that water is an important resource in sustainable development. In an International Symposium held in January 1992 in Dublin, relationships between water resources and development were deeply looked into keeping in view the 21st century. Overexploitation of water, pollution and its impacts, floods, droughts and their impacts were all inquired into at the regional, national and international levels. The four important conclusions that emerged from them are:
1. Freshwater is a useful but limited resource. There are important relations between water resources, environment and development.
2. There is an urgent need to bring together the water users, water planners and water policy makers towards developing a participatory approach to water resources and its management.
3. Women have a responsible role in water supply, its management and protection.
4. Water is economic commodity. Hence, it must be construed as an economic commodity in all its uses. It is within this context that the supply of clean water to all humans within a reasonable limit of a price must be realised.
Thus, a holistic approach to water as an appropriate socioeconomic approach has now emerged.
Learning Outcomes
1. At the end of the lesson, the boys and girls have clearly understood water quantity, water quality and sources of water.
2. Likewise they have learned about the causes of decline of water quality and the diseases resulting from that decline.
3. Students have researched into water demand, water supply and water management methods.
104 105
EXERCISES
I. Fill in the Blanks
1. Water is formed with the combination of hydrogen and __________.
2. Water is perceived as earth’s _____________.
3. Most of the freshwater of the world is locked up in _______.
4. Globally, demand for water is increasing primarily due to ____________ and ____________.
5. Freshwater sources are greatly polluted by ____________ and related developments.
6. In Madurai district, the foothills of the __________ in __________ valley are buried under sand dunes.
7. Water ethics is a _________ responsibility in terms of its utilisation.
8. Water efficiency has been high in countries such as ____________ and _____________ due to the careful use of water and with respect for ethical values.
9. That part of the United States which uses drip irrigation with high efficiency is __________________.
10. The countries that benefit from the Niles are __________ and ___________.
II. Choose the Correct Answer
11. The region where groundwater is most efficiently recharged is
a) Dense forest b) Grasslands
c) Deserts d) Agricultural lands
12. The region where the Amazon and the Congo traverse is
a) Temperate region b) Polar region
c) Equatorial region d) Subtropical region
13. Per capita domestic water in developed countries is:
a) 100 litres b) 200 litres
c) 300 litres d) 400 litres
104 105
14. The river in dispute between Brazil and Argentina is
a) La Plata b) Orinaco
c) Mississippi d) Missouri
15. The country which has achieved potable water supply for all her people is:
a) Malaysia b) Sudan
c) Niger d) Malawi
III. Match the Following
16. River blindness - Multi-purpose resource
17. Drinking water scarcity - Radioactive ash
18. Nuclear reactors - Black flies
19. Tanning industry - Population growth
20. Dams - Ambur
IV. Brief Answers
21. What is the nature of water consumption in the world?
22. What are the two important crises of freshwater in the developing countries?
23. What are the problems caused by water scarcities in rural and urban areas?
24. What is land degradation?
25. What are the two means of improving the water quantity and quality?
V. Paragraph Answers
26. Describe the distribution of water in the world.
27. What are the causes for the declining quality of water?
28. What does the World Environment Monitoring Council say about water quality in the world?
29. Write about the world’s water demand.
30. In what ways ‘water ethics’ could be practised?
106 107
VI. Detailed Answers
31. Water is valuable resource - Explain.
32. Describe the World Health Organisation’s list of waterborne and water related diseases.
33. Describe the means of water pollution.
34. Describe Water Management.
VII. Practical Exercises
35. Make a report on the quality of freshwater by the sources of freshwater.
36. Learn about the cropped area under irrigation and the use of chemical fertilisers and insecticides in wet cultivation.
106 107
UNIT 4ENVIRONMENTAL DEGRADATIONS
LESSON 9NATURAL DISASTERS
Learning Objectives
Students learn to understand basic natural processes, natural hazards and disasters, that control the Earth’s environment and in particular how their actions can be disastrous for human beings. Students examine global warming, floods and droughts and desertification as well as human processes that impact the Earth.
Disaster, Hazard and Vulnerability, the Meaning
What makes a disaster? Are hazards disasters, too? How do we define vulnerability?
A state of extreme (usually irremediable) ruin and misfortune is a disaster. It is also an event resulting in great loss and misfortune. It is an act that has disastrous consequences. But people say that hazard plus vulnerability make a disaster. Classification of disasters is in fact a classification of hazards. There are events, agents, which have the potentiality of doing harm, that is, hazards. Hazard is a source of danger. It is an unknown and unpredictable phenomenon that causes an event to result one way rather than another. For example, it is an obstacle on a golf course.
Even if these hazards materialize one has not a disaster if the community is not vulnerable; that is, if it has the capacity to respond or adjust. Hazards have the potential to cause disasters. Hazards cause disasters only when they meet with vulnerable people: when affecting (a) human life, (b) property, and (c) human activities. What is the main vulnerability? It is poverty. Population growth is a major factor of vulnerability.
One can combine any vulnerability factor, add a hazard and understand that a disaster is created. For example, poverty + landslide = a disaster for poor people whose house is destroyed and who have no means to build it again. The poorer one is, the more one is predisposed to suffer damage when an event occurs. But the more one spends on development, the less people die because of disasters. On the other hand, if countries give more money for warfare and neglect development, when disasters strike these countries cannot respond; if countries invest in disaster prevention, they will cope better when an emergency happens and their susceptibility will be higher.
It is often said that people are susceptible to natural hazards and disasters. Susceptibility is the fact of being exposed. We must know the difference between
108 109
susceptibility and vulnerability. You can be susceptible but not vulnerable. For example, a landslide threatens a house but the owners can build a wall to protect and divert the landslide.
Resilience and Emergency
There is yet another word, as well. It is resilience. Resilience is the higher capacity to recover and adapt to a new situation. For example, the owners of the house threatened by a landslide have a second house in town. One can be susceptible but if one’s resilience is high, one is not necessarily vulnerable. Yet again, more and more people seem to be affected by disasters, partly because the population is increasing, people live more and more in urban settings with over-crowding and poor living conditions. There are actually three conditions to have a disaster:
1. Disrupting the normal condition;
2. Exceeding the local capacity; and
3. Affecting people (and people matter most).
Without people, there would be no disaster. It may just be a physical phenomenon. An earthquake in the middle of the desert where no people are involved is not a disaster but only a geological incident.
Emergency: Disasters often lead to emergencies. The definition of ‘Emergency’ has administrative implications: normal procedures are suspended and other measures are put into place to control a situation, avert a disaster, and respond to a crisis. The emergency is declared caution: another definition of emergency is ‘ a sudden and usually unforeseen event that must be countered immediately to minimize the consequences’, but (a) not all emergencies are ‘sudden’ and (b) there are ways to ensure that they are not ‘unforeseen’.
The Disaster-Development Continuum (DDC)
There is a disaster-development continuum. It is called so (disaster-development continuum) because disasters disrupt development, and the way to get out of this vicious circle is development. The DDC forms the basis for any analysis, and it can be developed for any type of disaster.
Disaster Management
“Disaster management” is better split up in two: ‘disaster prevention’ and ‘emergency management’. By definition, disasters cannot ‘be managed’. One prevents a disaster and manages an emergency. Emergency management (EM) deals with all activities from preparedness to rehabilitation. Recovery goes from impact to reconstruction. Risk reduction goes from reconstruction to preparedness. Relief is all what is on the right side of the cycle while development is all what is on the left side.
108 109
Mitigation and Prevention
Mitigation and Prevention are used as synonymous. Some expert prefers to drop the term Mitigation and use only Prevention. Mitigation means to reduce the severity of the human and material damage caused by the disaster. Prevention is to ensure that human action or natural phenomena do not result in disaster or emergency. Primary prevention is to reduce - avert - avoid the risk of the event occurring, by getting rid of the hazard or vulnerability. For example, primary prevention is to avoid overcrowding, deforestation and to provide services: healthier people in a healthy environment will be less vulnerable to most hazards; immunizing people against smallpox made them less vulnerable to the virus, and slowly eradicated the disease. Secondary prevention means to recognize promptly the event and to reduce its effects, that is, by staying alert to possible displacements of population; by being ready to provide immunization, food, clean water, sanitation and health care to refugees: healthier people in a healthy environment will also be more capable to overcome the emergency.
Preparedness and Response
Preparedness includes all the measures that can ensure an effective relief. It stresses a safe environment: relief must not cause secondary risks to others and to oneself. “Don’t Make Things Worse” must be the guiding principle in preparedness for disasters. Response includes on the other hand all activities that can tackle an emergency. Other terms that are widely used are relief and humanitarian assistance, but they have slightly different meanings. Response means more than relief, which usually targets immediate and short-term needs. Humanitarian assistance includes certain aspects of protection and promoting, disseminating humanitarian laws and aspects.
Rehabilitation and Reconstruction
Rehabilitation is restoring the basic function; and reconstruction is restoring to full resumption. In disaster management, the two are important, especially for people who cannot afford either.
Disaster Prediction and Warning
Although predictions are quite possible as to the nature of weather and climate, and even to a certain extent, hazards and disasters, it is rather difficult to predict accurately the disasters that occur periodically on the surface of the earth. Hence, the people and communities vulnerable to disasters must helped and the first ever help we may render is the warning. The warnings must be comprehensive as to include the following activities:
Identify location where a hazardous event will likely occur.
Determine probability that an event of a given magnitude will occur.
Mitigate, Anticipate, Prepare.
110 111
Observe precursor events.
Forecast the event.
Warn the public.
There is a gap in the knowledge gained by hazards researchers and that of emergency planners and the general public. Why? It is because:
Public are largely uneducated scientifically;
Difficulty in communicating in a language, the general public can comprehend;
Economic issues (lack of tourism if volcano expected to blow); and
Liability.
Risk Assessment
Towards determining human response to disasters, it is necessary to assess risk and, once assessed, use the understanding arising out of it to develop strategies for averting the disaster. As we have seen before, if people are prepared, know how to respond to it, then half the risk is eliminated. The other half can be eliminated by being prepared for meeting the risk headlong. Rehabilitation and reconstruction will entail the risk assessment. Risk assessment is made using / considering the following logic.
Risk determination = probability event occurs x consequences should it occur (risk = hazard + exposure).
Acceptable risk assessment.
Problems and opportunities for risk assessment in a community context.
Human Response to Hazards
Emergency Management: Emergency management actually deals with hazards in four phases:
Mitigation - Minimizing the damage hazards can cause.
Preparation - Tasks performed immediately before disaster occurs.
Response - Actions taken after the disaster has occurred.
Recovery - Repairing the damage, leads into mitigation, and makes a cycle.
A few days before a disaster, a Columbian geology student, José Luis Restrepo, had come to Armero on a field trip. After playing billiards, he was returning to his hotel at about 10:50 p.m., when the lahar arrived. His recollection of events was recorded as follows by Dr. Barry Voight: (Figure 9.1a)
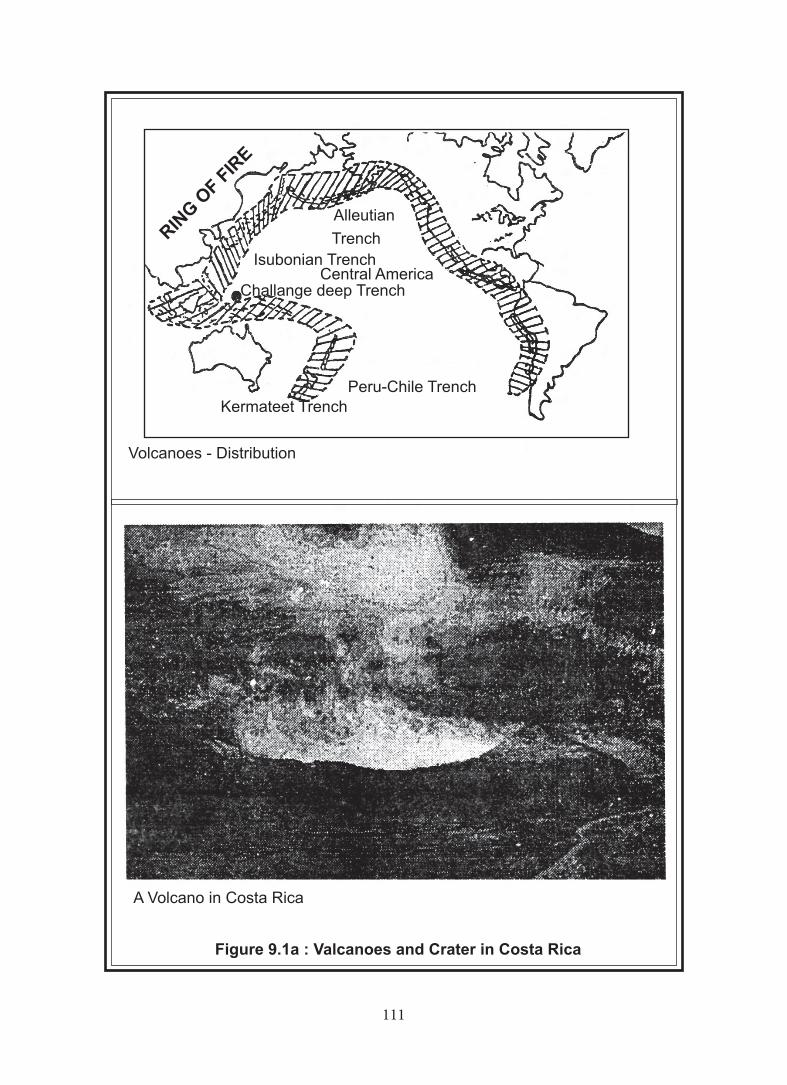
110 111
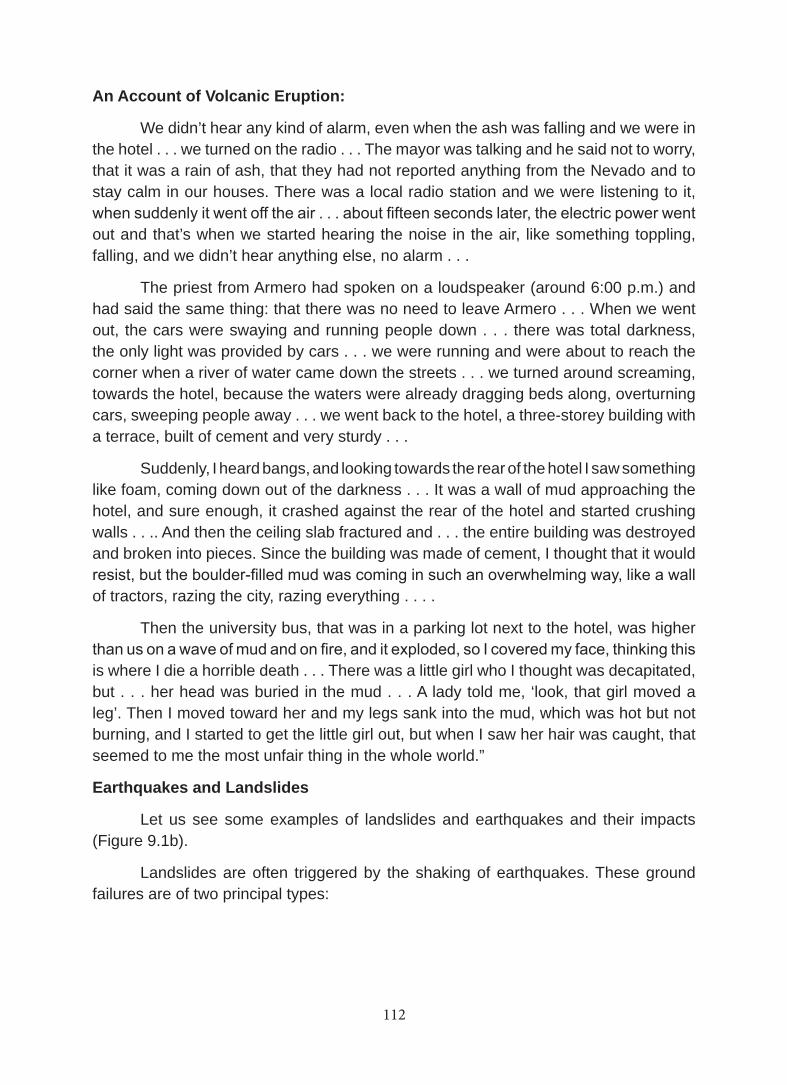
112 113
An Account of Volcanic Eruption:
We didn’t hear any kind of alarm, even when the ash was falling and we were in the hotel . . . we turned on the radio . . . The mayor was talking and he said not to worry, that it was a rain of ash, that they had not reported anything from the Nevado and to stay calm in our houses. There was a local radio station and we were listening to it, when suddenly it went off the air . . . about fifteen seconds later, the electric power went out and that’s when we started hearing the noise in the air, like something toppling, falling, and we didn’t hear anything else, no alarm . . .
The priest from Armero had spoken on a loudspeaker (around 6:00 p.m.) and had said the same thing: that there was no need to leave Armero . . . When we went out, the cars were swaying and running people down . . . there was total darkness, the only light was provided by cars . . . we were running and were about to reach the corner when a river of water came down the streets . . . we turned around screaming, towards the hotel, because the waters were already dragging beds along, overturning cars, sweeping people away . . . we went back to the hotel, a three-storey building with a terrace, built of cement and very sturdy . . .
Suddenly, I heard bangs, and looking towards the rear of the hotel I saw something like foam, coming down out of the darkness . . . It was a wall of mud approaching the hotel, and sure enough, it crashed against the rear of the hotel and started crushing walls . . .. And then the ceiling slab fractured and . . . the entire building was destroyed and broken into pieces. Since the building was made of cement, I thought that it would resist, but the boulder-filled mud was coming in such an overwhelming way, like a wall of tractors, razing the city, razing everything . . . .
Then the university bus, that was in a parking lot next to the hotel, was higher than us on a wave of mud and on fire, and it exploded, so I covered my face, thinking this is where I die a horrible death . . . There was a little girl who I thought was decapitated, but . . . her head was buried in the mud . . . A lady told me, ‘look, that girl moved a leg’. Then I moved toward her and my legs sank into the mud, which was hot but not burning, and I started to get the little girl out, but when I saw her hair was caught, that seemed to me the most unfair thing in the whole world.”
Earthquakes and Landslides
Let us see some examples of landslides and earthquakes and their impacts (Figure 9.1b).
Landslides are often triggered by the shaking of earthquakes. These ground failures are of two principal types:
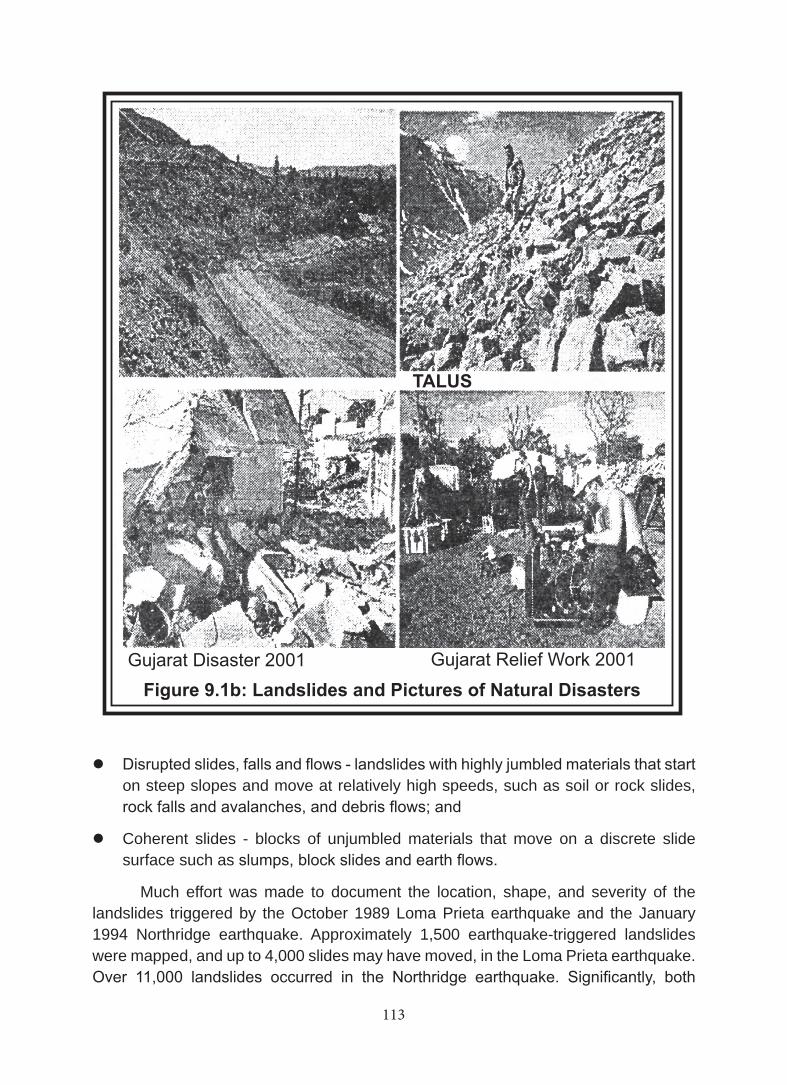
112 113
TALUS
Gujarat Disaster 2001 Gujarat Relief Work 2001
Figure 9.1b: Landslides and Pictures of Natural Disasters
Disrupted slides, falls and flows - landslides with highly jumbled materials that start on steep slopes and move at relatively high speeds, such as soil or rock slides, rock falls and avalanches, and debris flows; and
Coherent slides - blocks of unjumbled materials that move on a discrete slide surface such as slumps, block slides and earth flows.
Much effort was made to document the location, shape, and severity of the landslides triggered by the October 1989 Loma Prieta earthquake and the January 1994 Northridge earthquake. Approximately 1,500 earthquake-triggered landslides were mapped, and up to 4,000 slides may have moved, in the Loma Prieta earthquake. Over 11,000 landslides occurred in the Northridge earthquake. Significantly, both
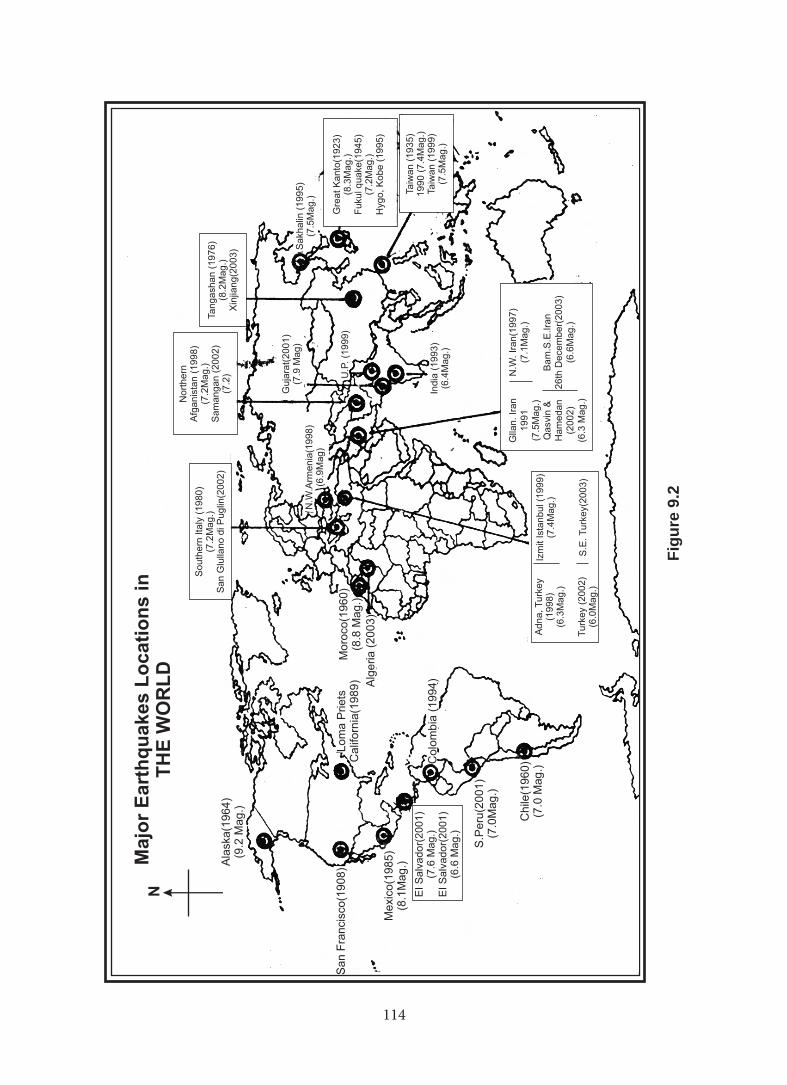
114 115
Figu
re 9
.2
114 115
earthquakes occurred when the ground was exceptionally dry. Extensive research on the distribution and causes of these slides shows that failure rates can be correlated with (1) shaking severity; (2) slope steepness; (3) strength and engineering properties of geological materials; (4) water saturation (which varies with precipitation and by season); (5) existing landslide areas; and (6) vegetative cover.
Shaking Intensity and Building Damage
How does ground shaking intensity relate to damage to various types of building construction?
The likelihood of building damage is radically different for different types of buildings. After the Northridge earthquake, the Superior Apartments were heavily damaged. However, a group of single family homes behind the apartments experienced little damage. These apartments were constructed to comply with modern building codes. The damage to buildings can be depicted using two separate measures of damage:
1. The percentage of buildings of a particular construction type, defined by use, construction materials, height and age, “red-tagged” by the local government building inspector as “unsafe for human occupancy,” that is, uninhabitable, or
2. The average money loss, expressed as a percentage of the replacement value, for each construction type.
It is relatively easy to generate data on the percentage of housing units and commercial buildings typically “red tagged” for several construction types.
The Turkey Earthquake 1999
The 1999 Turkey earthquakes resulted in far more extensive damage and casualties than occurred in California’s 1989 Loma Prieta or 1994 Northridge earthquakes. They provide several lessons for local governments that should not be ignored.
Principal Lessons of Turkey’s Earthquake
LESSON 1 - Mitigation guidelines may be developed centrally, but implementation of building codes and land use planning for new construction are the responsibility of local governments.
LESSON 2 - Human needs services are delivered in the context of other damage.
LESSON 3 - Local government staff are first to respond to disasters, not social service agencies or the central government.
LESSON 4 - Local governments need to plan to distribute data initially after the disaster, as well as for weeks and months as data are compiled.
116 117
Several themes emerge from the lessons of the 1999 Turkey earthquakes.
They are:
Training of local government employees is essential.
Local governments are the first to respond and must lead recovery.
The key local government role, and the need for leadership of local elected officials, is not unique to earthquakes, as the recent tragedies on September 11, 2001, illustrated.
Disasters and Health Epidemic
Major health epidemics are rare in the aftermath of natural disasters, but some disasters are so great that large numbers of the population are displaced, creating perfect conditions for the spread of disease. Lack of clean water and the suspension of public health programmes all help illnesses, such as cholera to multiply. Often these illnesses can be more deadly than the original disaster.
Population movement, poor sanitation, water contamination and the interruption of public health programmes are the main reasons for the spread of disease after natural and humanitarian disasters. Displaced populations are often forced to gather in confined spaces, further enabling the spread of epidemics, such as cholera, malaria and dengue fever. In Central America, which was hit by Hurricane Mitch in 1998, for example, cholera was already epidemic. Another problem is the number of injured people who need to be treated. According to the World Health Organisation (WHO), the presence of dead bodies is not a major factor in the spread of communicable diseases.
Cholera: The spread of cholera is one of the main dangers following a natural disaster. Cholera is an acute infection of the gut which causes chronic diarrhea and vomiting. This can lead to severe dehydration and, in some extreme cases, death. However, most people who are infected by the bug do not become ill and 90 per cent of those who do are only mildly or moderately ill. Cholera is spread by contaminated water and food. Sudden outbreaks, such as those which follow a disaster, are usually caused by a contaminated water supply.
The bug is most deadly when it arrives unexpectedly - as in times of disaster - because there are often no facilities for treatment or because people cannot get treatment in time. In communities which are unprepared for cholera outbreak, up to 50 per cent of people who become seriously ill may die. Cholera can be effectively treated with oral rehydration salts and antibiotics. Containing a cholera outbreak involves ensuring there are proper sanitation methods for disposing of sewage, an adequate drinking water supply and good food hygiene. Food should be cooked thoroughly and should not be contaminated by contact with raw foods, flies or dirty surfaces.
116 117
Emergency Response to Disasters
The WHO has an Emergency and Humanitarian Action Programme that is responsible for coordinating the international response to emergencies and natural disasters in the health field. Set up in 1993, it works with other UN agencies and the national health ministries. Its first task in an emergency is to conduct a rapid health assessment in the affected areas within 48 hours of a disaster. It is then likely to set up an early epidemic warning system, measures to control communicable diseases, a programme for repairing key hospitals and primary care agencies which may have been hit by the disaster, water and sanitation measures and programmes for ensuring necessary medical supplies are available. This may mean an appeal to international donors for supplies, but the WHO tries to avoid importing medical supplies. It says it does not want to duplicate resources supplied by international non-governmental organisations or create a dependence on foreign aid “which may overkill the long-term efforts WHO has successfully invested in emergency preparedness in the region”.
The WHO policy is to work within the emergency measures set out in the country affected. One of the main health aims is to ensure hospitals and health centres are kept open in the most affected areas.
Global Warming
The scientific consensus on global warming is becoming clearer every day. Changes in our climate are real and they are underway. There is no question that the Earth is getting hotter and fast. The real questions are: How much of the warming is our fault, and are we willing to slow the meltdown by curbing our insatiable appetite for fossil fuels?
Human activities also can induce hazards through resource acquisition, urban growth, land use decisions and waste disposal. Such activities can accelerate many natural changes.
Human beings live within the world’s ecosystems. Increasingly, humans modify ecosystems as a result of population growth, technology, and consumption. Human destruction of habitats through direct harvesting, pollution, atmospheric changes and other factors is threatening current global stability, and if not addressed, ecosystems will be irreversibly affected.
The global average surface temperature has increased over the 20th century by about 0.6° C.
The global average surface temperature (the average of near surface air temperature over land, and sea surface temperature) has increased since 1861. Over the 20th century the increase has been 0.6 ± 0.2°C. This value is about 0.15° C larger than that estimated for the period up to 1994, owing to the relatively high temperatures of the additional years (1995 to 2000) and improved methods
118 119
of processing the data. These numbers take into account various adjustments, including urban heat island effects. The record shows a great deal of variability; for example, most of the warming occurred during the 20th century, during two periods, 1910 to 1945 and 1976 to 2000.
Globally, it is very likely that the 1990s was the warmest decade and 1998 the warmest year in the instrumental record, since 1861.
New analyses of proxy data for the Northern Hemisphere indicate that the increase in temperature in the 20th century is likely to have been the largest of any century during the past 1,000 years. It is also likely that, in the Northern Hemisphere, the 1990s was the warmest decade and 1998 the warmest year. Because less data are available, less is known about annual averages prior to 1,000 years before present and for conditions prevailing in most of the Southern Hemisphere prior to 1861.
On average, between 1950 and 1993, night-time daily minimum air temperatures over land increased by about 0.2° C per decade. This is about twice the rate of increase in daytime daily maximum air temperatures (0.1° C per decade). This has lengthened the freeze-free season in many mid- and high latitude regions. The increase in sea surface temperature over this period is about half tha of the mean land surface air temperature.
Temperatures have risen during the past four decades in the lowest 8 km of the atmosphere.
Since the late 1950s (the period of adequate observations from weather balloons), the overall global temperature increases in the lowest 8 km of the atmosphere and in surface temperatures have been similar at 0.1° C per decade.
Since the start of the satellite record in 1979, both satellite and weather balloon measurements show that the global average temperature of the lowest 8 km of the atmosphere has changed by + 0.05 ± 0.10° C per decade, but the global average surface temperature has increased significantly by + 0.15 ± 0.05° C per decade. The difference in the warming rates is statistically significant. This difference occurs primarily over the tropical and sub-tropical regions.
The lowest 8 km of the atmosphere and the surface are influenced differently by factors such as stratospheric ozone depletion, atmospheric aerosols, and the El Niño phenomenon. Hence, it is physically plausible to expect that over a short time period (for example, 20 years) there may be differences in temperature trends. In addition, spatial sampling techniques can also explain some of the differences in trends, but these differences are not fully resolved.
Also, snow cover and ice extent have decreased.
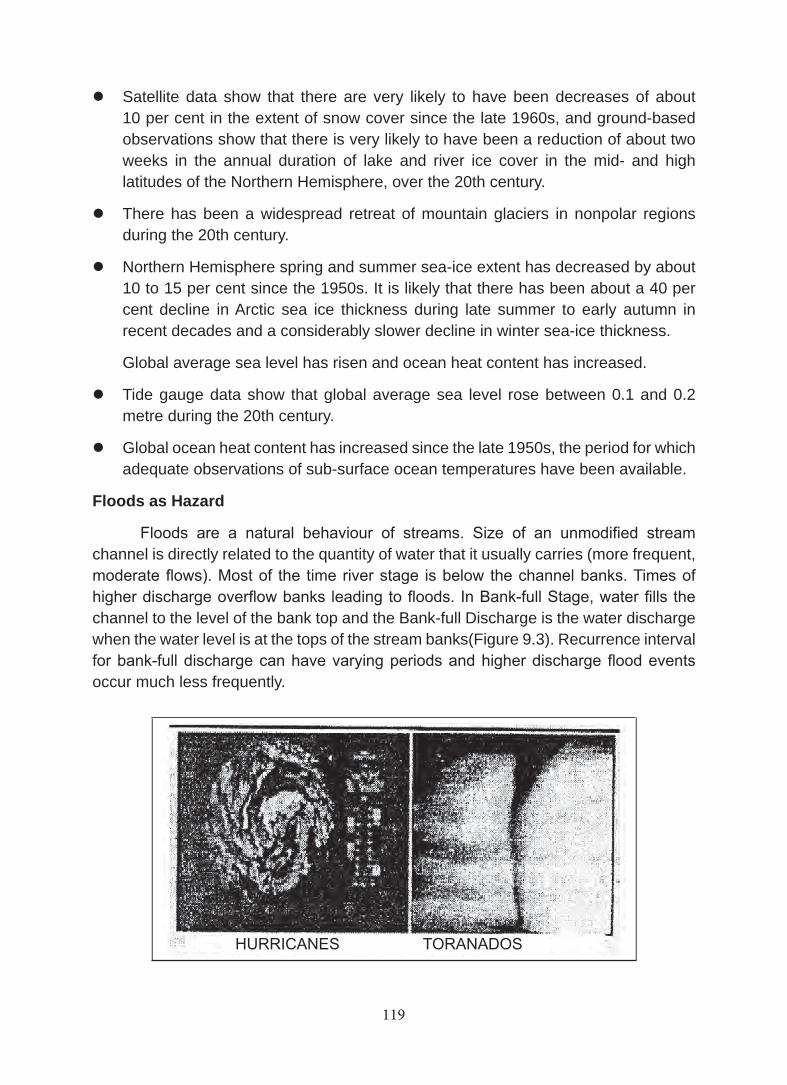
118 119
Satellite data show that there are very likely to have been decreases of about 10 per cent in the extent of snow cover since the late 1960s, and ground-based observations show that there is very likely to have been a reduction of about two weeks in the annual duration of lake and river ice cover in the mid- and high latitudes of the Northern Hemisphere, over the 20th century.
There has been a widespread retreat of mountain glaciers in nonpolar regions during the 20th century.
Northern Hemisphere spring and summer sea-ice extent has decreased by about 10 to 15 per cent since the 1950s. It is likely that there has been about a 40 per cent decline in Arctic sea ice thickness during late summer to early autumn in recent decades and a considerably slower decline in winter sea-ice thickness.
Global average sea level has risen and ocean heat content has increased.
Tide gauge data show that global average sea level rose between 0.1 and 0.2 metre during the 20th century.
Global ocean heat content has increased since the late 1950s, the period for which adequate observations of sub-surface ocean temperatures have been available.
Floods as Hazard
Floods are a natural behaviour of streams. Size of an unmodified stream channel is directly related to the quantity of water that it usually carries (more frequent, moderate flows). Most of the time river stage is below the channel banks. Times of higher discharge overflow banks leading to floods. In Bank-full Stage, water fills the channel to the level of the bank top and the Bank-full Discharge is the water discharge when the water level is at the tops of the stream banks(Figure 9.3). Recurrence interval for bank-full discharge can have varying periods and higher discharge flood events occur much less frequently.
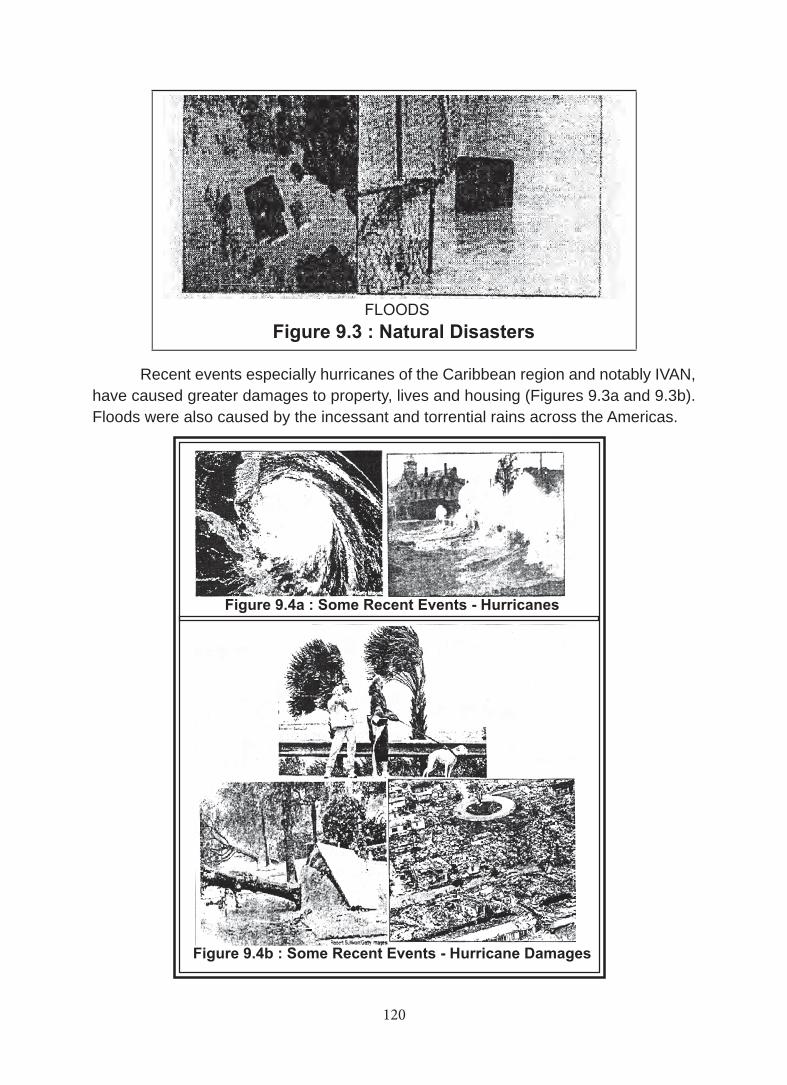
120 121
Recent events especially hurricanes of the Caribbean region and notably IVAN, have caused greater damages to property, lives and housing (Figures 9.3a and 9.3b). Floods were also caused by the incessant and torrential rains across the Americas.
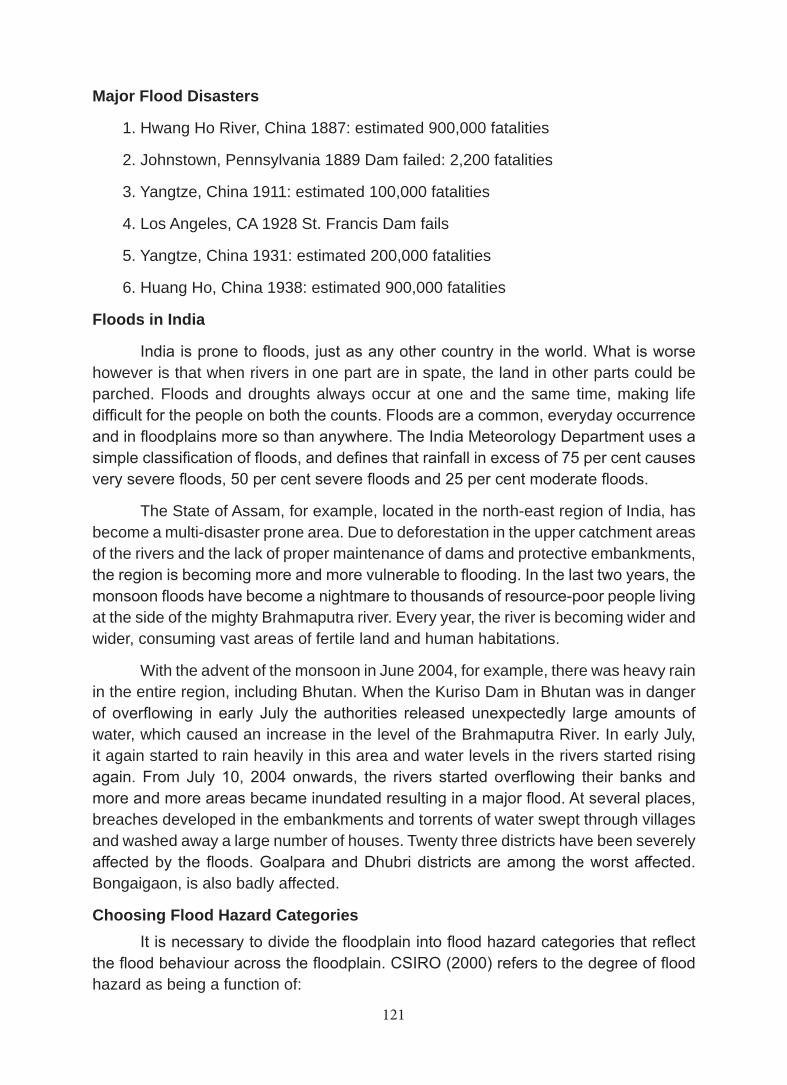
120 121
Major Flood Disasters
1. Hwang Ho River, China 1887: estimated 900,000 fatalities
2. Johnstown, Pennsylvania 1889 Dam failed: 2,200 fatalities
3. Yangtze, China 1911: estimated 100,000 fatalities
4. Los Angeles, CA 1928 St. Francis Dam fails
5. Yangtze, China 1931: estimated 200,000 fatalities
6. Huang Ho, China 1938: estimated 900,000 fatalities
Floods in India
India is prone to floods, just as any other country in the world. What is worse however is that when rivers in one part are in spate, the land in other parts could be parched. Floods and droughts always occur at one and the same time, making life difficult for the people on both the counts. Floods are a common, everyday occurrence and in floodplains more so than anywhere. The India Meteorology Department uses a simple classification of floods, and defines that rainfall in excess of 75 per cent causes very severe floods, 50 per cent severe floods and 25 per cent moderate floods.
The State of Assam, for example, located in the north-east region of India, has become a multi-disaster prone area. Due to deforestation in the upper catchment areas of the rivers and the lack of proper maintenance of dams and protective embankments, the region is becoming more and more vulnerable to flooding. In the last two years, the monsoon floods have become a nightmare to thousands of resource-poor people living at the side of the mighty Brahmaputra river. Every year, the river is becoming wider and wider, consuming vast areas of fertile land and human habitations.
With the advent of the monsoon in June 2004, for example, there was heavy rain in the entire region, including Bhutan. When the Kuriso Dam in Bhutan was in danger of overflowing in early July the authorities released unexpectedly large amounts of water, which caused an increase in the level of the Brahmaputra River. In early July, it again started to rain heavily in this area and water levels in the rivers started rising again. From July 10, 2004 onwards, the rivers started overflowing their banks and more and more areas became inundated resulting in a major flood. At several places, breaches developed in the embankments and torrents of water swept through villages and washed away a large number of houses. Twenty three districts have been severely affected by the floods. Goalpara and Dhubri districts are among the worst affected. Bongaigaon, is also badly affected.
Choosing Flood Hazard Categories It is necessary to divide the floodplain into flood hazard categories that reflect the flood behaviour across the floodplain. CSIRO (2000) refers to the degree of flood hazard as being a function of:
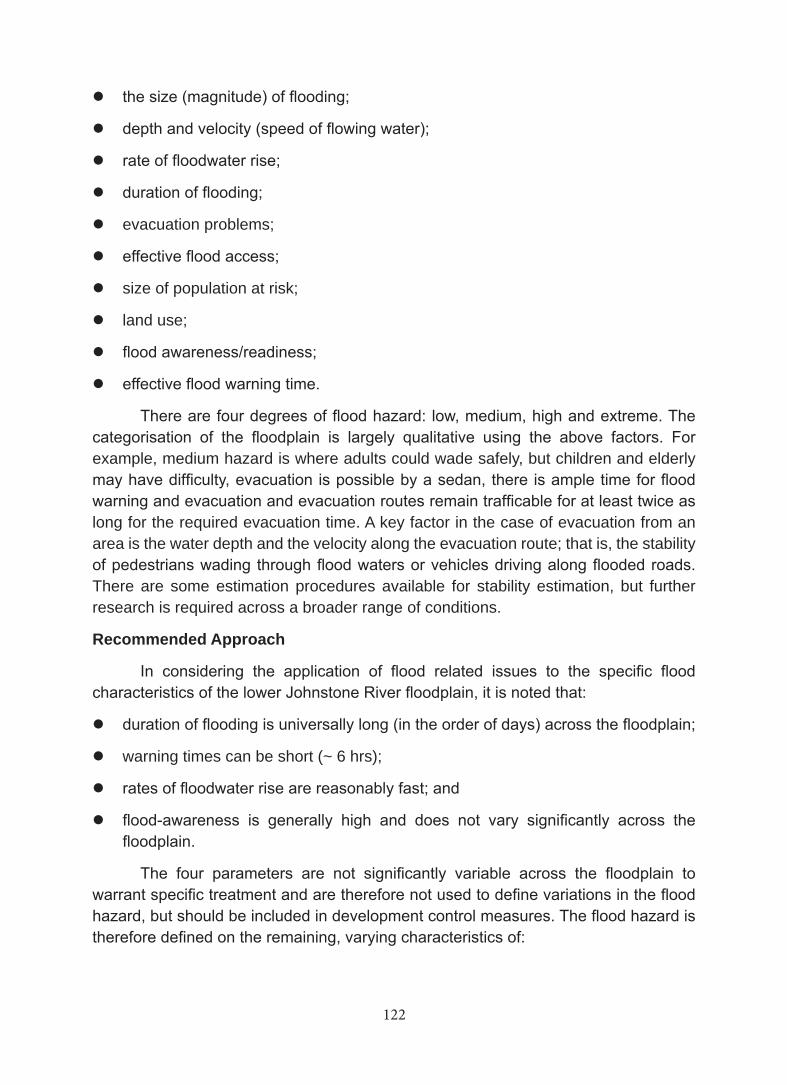
122 123
the size (magnitude) of flooding;
depth and velocity (speed of flowing water);
rate of floodwater rise;
duration of flooding;
evacuation problems;
effective flood access;
size of population at risk;
land use;
flood awareness/readiness;
effective flood warning time.
There are four degrees of flood hazard: low, medium, high and extreme. The categorisation of the floodplain is largely qualitative using the above factors. For example, medium hazard is where adults could wade safely, but children and elderly may have difficulty, evacuation is possible by a sedan, there is ample time for flood warning and evacuation and evacuation routes remain trafficable for at least twice as long for the required evacuation time. A key factor in the case of evacuation from an area is the water depth and the velocity along the evacuation route; that is, the stability of pedestrians wading through flood waters or vehicles driving along flooded roads. There are some estimation procedures available for stability estimation, but further research is required across a broader range of conditions.
Recommended Approach
In considering the application of flood related issues to the specific flood characteristics of the lower Johnstone River floodplain, it is noted that:
duration of flooding is universally long (in the order of days) across the floodplain;
warning times can be short (~ 6 hrs);
rates of floodwater rise are reasonably fast; and
flood-awareness is generally high and does not vary significantly across the floodplain.
The four parameters are not significantly variable across the floodplain to warrant specific treatment and are therefore not used to define variations in the flood hazard, but should be included in development control measures. The flood hazard is therefore defined on the remaining, varying characteristics of:
122 123
the size of the flood;
depth and velocity of floodwaters; and
evacuation and access.
Flood Warning and Emergency Planning
In the Johnstone region, for example, many people come from families that have resided in the area for several generations. In most cases, these people have either experienced a flood or have heard first hand accounts of floods from family members or friends. Therefore, they are likely to have a high level of flood awareness. However, these people may not be aware that there may be larger floods than those events that they have experienced or heard of. In addition, there are a significant number of new rural and urban residents in the region who may not have the same level of flood awareness. In some instances, these people:
have not experienced a flood in the area;
have not heard first hand accounts of previous floods;
live in houses that are not near the river, but are actually in the floodplain and are subject to flooding; and/or
are not likely to take flood warnings seriously.
Both groups of people, those who have a low level of flood awareness and those who may not believe that there will be a larger flood than the biggest historical flood, that should be the target of a flood information campaign.
Kenyan Floods 2004
Flood waters in Dadaab area refugee camps in north-eastern Kenya have begun receding, several days after heavy rains destroyed more than 650 refugee shelters in the camp, leaving more than 3,000 refugees homeless. A significant number of refugees’ livestock was also killed in the torrential rains. Large sections of the two most affected camps - Ifo and Dagahaley - are still under water impeding access within and around the two camps which together host more than 80,000 refugees, mainly from Somalia. Many of the affected refugee families in Dagahaley camp have now been moved to safer places. Others have sought refuge among friends or relatives. By Sunday, field staff who had visited half the Dagahaley camp to assess the flood damage noted that 550 refugee shelters had either collapsed or had been washed away. In Ifo camp, some 10 km away, nearly 80 structures had been destroyed. Some five of the 11 schools in Ifo camp were still under water, disrupting the re-opening of schools after the April school holidays. Latrines in three schools in Dagahaley camp had also collapsed.
124 125
Haiti Flood 2004 Takes Huge Toll
The International Red Cross said the recent floods in Haiti and the Dominican Republic (2004) killed hundreds of people and left thousands homeless, destroyed fields and houses, and killed cattle, the Haitian news agency AHP reported. Eyewitness accounts indicate over 2,000 people died, including 1,500 in the southeast region. The Red Cross, which has been aiding the flood victims, said restoring the heavily damaged drinking water distribution network was a priority to avoid infectious diseases, and added that problems in gaining access to disaster-stricken areas made evaluating the situation difficult.
The UN’s World Food Program said humanitarian aid to flood victims should last two to three months. WFP representative deplored the decision by the U.S. military to end helicopter flights that facilitated distribution of aid. He said senior U.S. officials had told him such flights were not part of their mission.
Desertification
Desertification is a process where the productive potential of arid and semi-arid land is reduced by the activities of humans. It is a serious and growing problem in many regions of the world including: sub- Saharan Africa, the Middle East, western Asia, northern Mexico and south-eastern South America, western United States, prairies of Canada, and eastern Australia. Scientists estimate that 60,000 square kilometers of new desert are now annually created worldwide.
Desertification occurs when the natural vegetation cover is reduced in its cover and the topsoil becomes susceptible to erosion. The removal of the vegetation and topsoil then initiates a number of other problems including:
Increase surface runoff and stream discharge;
Reduction of water infiltration and groundwater recharge;
Development of erosional gullies and sand dunes;
Change in the surface microclimate that enhances aridity;
Drying up of wells and springs; and
Reduction in seed germination of native plants.
The effects of desertification can be reversed in many cases. Reversal begins by halting the activities that created the desertification. In many parts of the world, overgrazing and deforestation are the primary factors causing this form of soil degradation. Two other remedies for repairing the effects of desertification are the re-vegetation of the soil surface and the planting of windbreaks.
124 125
Do you know?
Desertification in hilly regions of the Himalayas
Deforestation in Himalayas, involving clearance of natural forests, have upset the ecosystem by changing various soil, Nutrient cycling has become poor, and the area is invaded by exotic weeds. The entire west Khasi hill district of Mehalaya and Ladakh are now facing the serious problem of desertification.
Advancing Deserts of the World
There is a controversy about the advance of deserts in the world. There is a widespread belief that the Sahara desert is advancing into the Sahel region, for instance. The Sahel is a narrow band of West Africa between 150 N and 180 N, between the Sahara to the north and savannah (grass and open forest) and equatorial forest to the south. It extends from Senegal at the coast at about 150 W, across Mali and Niger, to about 150 E. It receives rainfall during a short but active wet season, from late June to mid September. It is covered by grassland and supports a pasture-based society which traditionally moved meridianally following the rains. Its northern limit may be defined by the 200 mm/a isohyet.
Do you know?
Water Rich vs Water Poor Countries.
The top ten water rich countries are Iseland, Surinam, Guyana, Papua, New Guinea, Gabon, Solomon Islands, Canada, Norway Panama and Brazil lying in the far north and have low evaporation losses.
The water poor countries include Kuwait, Egypt, United Arab Emirates, Malta, Jordon, Saudi Arabia, Singapore, Maldovia, Israel and Oman, lying in the desert belt at about 150 to 250 latitude and some of them like Malta and Singapore and density populated area resulting in low per capita water.
Is the Sahara extending into the Sahel? And if so, is this because of fluctuations of rainfall (total amount, rainfall intensity, duration of wet season) or is it largely the result of human activities, such as overgrazing or the removal of trees for firewood? There are also the questions: Do deserts create droughts? Do droughts create deserts? In other words, is there a positive climate feedback, which accelerates land degradation? A new idea by a researcher in 1975 speculated that overgrazing in the Sahel leads to less vegetation, which raises the ground’s albedo, so that less solar radiation is absorbed and the Earth’s surface becomes cooler. It should be noted that the atmosphere above the Sahara experiences continuous radiative cooling, because the dry air, free of clouds, absorbs very little of the long wave radiation upwelling from the ground. This radiative cooling is naturally compensated by subsidence heating
126 127
and the subsidence sustains the dry air, cloudlessness, and arid surface conditions. According to a study, overgrazing would enhance the radiative loss, which would foster subsidence within the troposphere, leading to drier conditions in the Sahel and therefore less plant growth during the wet season. Less vegetation means a higher albedo. So we have positive feedback and a self-aggravating process, culminating in desertification, a process of land degradation that destroys its productivity.
The problem of overgrazing in the Sahel is as acute now as it was in the 1960s, yet there is no clear rainfall trend in the Sahel. The period 1930-60 was slightly wetter than 1960-90 in most parts of the Sahel. More significant than any trend is the occurrence of dry and wet periods, each lasting several years. The Sahel enjoyed a notably wet decade in the 1950s, which was followed by a drought in the 1970s and 1980s. However, land productivity was fully recovered around 1990.
Satellite-estimated albedo of the Sahel between 1983-88 was about 35 per cent in (dry) January and 31 per cent in (wet) July, a difference of about 4 per cent. The seasonal variation greatly exceeded any overall change during the period. This points to there being no irreversible change towards desert. It is concluded that the formation of desert is not a single self-aggravating process, but is complex, reflecting changes of both climate and human activities.
Normalised Difference Vegetation Index (NDVI)
Desertification trends are evaluated by means of the ‘normalised difference vegetation index’ (NDVI). This index, based on satellite data, quantifies the amount of vegetation. It is a figure for the ‘green-ness’ of the surface, the ratio of the measured reflectances of red light (that is, 0.55-0.68 micron wavelength) and near-infra-red (0.73-1.1) in solar radiation. NDVI is strongly correlated with the biological productivity of an area. In the Sahel there is close agreement of the shifts of NDVI and rainfall boundaries during 1980 - 1995, that is, the NDVI/rainfall relationship remained about constant. In other words, there was no progressive ‘march’ of desert over more fertile areas, no one-way ratchet effect due to deserts causing droughts.
Desertification and Drought in India
In the National Conservation Strategy particular attention has been paid to arid and semi-arid areas. The strategy includes classification, zoning, and apportionment of land for designated uses; enactment of laws for appropriate land uses to protect the soil from erosion; pollution and degradation measures for runoff and wind erosion; development of suitable agro-silvipastoral techniques; measures for water conservation, recycling and optimal conjunctive use of surface and groundwater; and encouragement for and improvement in traditional methods of rain water harvesting.
126 127
Programmes and Projects
The Desert Development Programme (DDP) was initiated in 1977- 78. It covers both the hot desert regions of Gujarat, Rajasthan and Haryana and the cold desert areas in Jammu Kashmir, and Himachal Pradesh. It is functional in 131 blocks of 21 districts in 5 States covering an area of about 0.362 million km2 and a population of 15 million. The objectives of the programme include controlling the process of desertification, mitigating the effects of drought, restoring the ecological balance, and raising the productivity of land, water, livestock, and human resources. At least 75 percent of the allocation is earmarked for activities which would contribute towards combating the process of desertification. The programme is implemented with 100 percent central assistance. The Programme Evaluation Organization of the Planning Commission has the task of evaluating this programme in order to assess its impact on the control of desertification, and on improvements in productivity and income for the people living in these areas. From 1990 to 1993, Rs. 1,485 million has been spent under the scheme, developing an area of 90,412 ha.
The Drought Prone Area Programme (DPAP) was launched in 1973 in arid and semi-arid areas with poor natural resource endowments. The objective is to promote more productive dryland agriculture by better soil and moisture conservation, more scientific use of water resources, afforestation, and livestock development through development of fodder and pasture resource, and in the long run to restore the ecological balance.
The DPAP covers 615 blocks of 91 districts in 13 States. This is a centrally sponsored scheme where the allocations are shared between the Centre and States on a 50:50 basis. Preparation of development plans on a watershed basis, participation of people in planning and implementation of the programme and developing effective liaison between research agencies and implementing agencies are some of the priority areas of the programme, implemented since the Eighth Five Year Plan with renewed thrust.
In order to integrate and intensify the activities aimed at combating desertification, a comprehensive plan for control of desertification under the National Forestry Action Programme has been proposed. The plan would evaluate the present status of deserts in the country, assess the implementation of ongoing programmes for development of deserts and desert prone areas, formulate broad policy guidelines and action plans for implementation aimed at control of desertification, develop strategies involving people in desert control through various means, and include appropriate measures related to research and training in desert control.
The basic objective of the integrated Wastelands Development Project is to facilitate pilot projects using an integrated approach to wasteland development by initiating area-specific projects taking into account land capabilities, site condition and local needs, and ultimately aiming to promote optimal land use for both ecological
128 129
and socioeconomic needs. The different types of problem lands for which projects are prepared include saline/alkaline lands, arid/ sandy areas, ravine areas, and Aravallis. The activities covert soil and water conservation, afforestation, silvi-pasture development and grazing management.
The main objective of the Afforestation Project for the Aravalli (Rajasthan) is to check desertification and restore ecological status by re-afforestation and also to increase the production of fuel wood, fodder, timber, and non-wood forest products to meet local needs. The project started in April 1992 and the project period was 5 years.
Rehabilitation of common lands in Aravallis (Haryana) is being implemented in the four southern districts of Haryana, that is Bhiwani, Mahendragarh, Gurgaon, and Faridabad since 1990. The project outlay is Rs. 480 million and covers environmental protection, restoration of green cover in the semi-arid Aravalli Hills, and improvement in the living conditions of the local people through meeting their biomass needs.
India has been participating regularly in the Inter-governmental Negotiating Committee to Combat Desertification (INCD) process. In collaboration with the Interim Secretariat of the United Nations Convention to Combat Desertification, the Government of India hosted a Regional Conference on the Implementation of the UN Convention to Combat Desertification and Drought during August 21-23, 1996 at New Delhi. At the meeting, the countries resolved to initiate consultations among themselves to identify specific programmes for regional cooperation.
Learning Outcomes
Students have gained (a) a general understanding of the terms connected with disasters and hazards, (b) an appreciation of the nature, extent and characteristics of select disasters such as landslides, earthquakes, floods and droughts, and global warming and desertification, (c) besides learning something about what should be done to overcome these disasters and hazards.
128 129
EXERCISESI. Fill in the Blanks
1. Hazard plus vulnerability make a ________.
2. The DPAP is a ___________ sponsored scheme.
3. In a disaster, if people are prepared, know how to respond to it, then ________ is eliminated.
4. Desertification trends are evaluated by means of ____________.
5. Disasters disrupt __________ development.
6. Hazards cause disasters only when they meet with __________ people.
7. ___________ is the higher capacity to recover and adapt to a new situation.
8. Emergency is declared ______________.
9. “Don’t Make Things Worse” is the guiding principle in _____________ for disasters.
10. The Sahel is a narrow band of ____________ in West Africa.
II. Choose the Correct Answer
11. Poverty is:
a) Disaster b) Vulnerability
c) Hazard d) Emergency
12. The warmest decade of the 20th century:
a) 1990s b) 1920s
c) 1970s d) 1950s
13. NDVI is based on:
a) Field level data b) Secondary data
c) Interview data d) Satellite data
14. The Sahel enjoyed a notably wet decade in:
a) 1930s b) 1940s
c) 1950s d) 1960s
130 131
15. New analyses of proxy data for the Northern Hemisphere indicate that the increase in temperature in the 20th century is likely to have been:
a) The largest of any century
b) The lowest of the last 100 years
c) The smallest of the past 1,000 years.
d) The largest of 19th century
III. Match the Following
16. Hazard - Capacity to recover
17. Resilience - Hot desert
18. Cholera - Disaster
19. Rajasthan - Flood
20. Haiti - Acute infection of the gut
IV. Brief Answers
Give meaning of:
21. Natural disaster
22. Hazard
23. Landslide
24. Earthquake
25. Global warming
26. Sea level change
27. Desertification
28. Resilience
29. Vulnerability
30. Human response
V. Paragraph Answers
31. What is meant by disaster prediction?
32. What is meant by disaster-development continuum?
33. Write about the impact of landslides on buildings?
34. What is the importance of warnings of disasters?
130 131
35. How do we assess risk in regard to a disaster?
36. Four phases of emergency management for hazards – discuss.
37. NDVI – elaborate its importance.
38. How is desertification caused?
39. Write a paragraph on temperature changes.
40. Discuss causes of desertification or floods.
VI. Detailed Answers
41. Write a note on the natural disasters.
42. Write a reasonable account of desertification in Sahel.
43. Write about the principal lessons of Turkey 1999 earthquake.
44. Relate disasters and health epidemic.
45. Write an essay on the desertification and droughts in India.
46. How should we be prepared for facing a disaster – say, flood?
47. Describe the impacts of earthquakes or floods.
48. Write about international efforts in regard to disaster mitigation.
VII. Practical Exercises
49. Teachers and students visit an institute of research concerned with disaster studies.
50. Teachers guide students to debate on the community roles in disaster mitigation and students bring to the debate lists of disastrous or hazardous events in India.
132 133
UNIT 4ENVIRONMENTAL MANAGEMENT
LESSON 10CONSERVATION AND RESOURCE
MANAGEMENTLearning Objectives
Students learn, understand and appreciate the need for conservation of natural resources and managing them in the best way we could, given the circumstances in which resources are exploited, used and misused, and even wasted.
‘Wild nature is in deep distress, and whatever their occasional protestations, the international institutions charged with Earth’s care are not managing it with an eye on ‘sustainability’. Rising that challenge will test the limits of diplomacy and development’, wrote Steven Sanderson, President and Chief Executive Officer of the Wildlife Conservation Society. These words are not only true for wildlife but also for natural resources and their management. Global losses in biodiversity and wild places are not the stuff of ‘environmental alarmism’; rather they describe our world today. This is detailed in volumes of scientific evidence. Although long term impact can be computed in economic terms, the results of such computation will not be the truth: it would represent much more.
As for wildlife, conservation science falls into two basic categories: (a) threat assessment and (b) the analysis of small populations of animals. The two basic categories can as well be applied to natural resources, for there is a threat to these resources which (the threat) has to be assessed and there is need to analyse the small, limited amounts of resources available for use and to examine the possibilities for conservation. One of the results of the two activities above was the creation of various kinds of protected areas. The focus of the conservation community has been on setting aside ecologically important marine and terrestrial areas, reducing the over-harvesting of wildlife, lessening the pollution of fragile lands and waters, and protecting long term ecological processes.
Also fitful cooperation between scientists and inter-governmental organizations have resulted in some important conservation achievements over the years, namely, the Ramsar Convention on Wetlands, the Atmospheric Nuclear Test Ban, Bio-safety Protocol, the Convention on International Trade in Endangered Species of Wild Fauna and Flora and the Creation of World Heritage Sites. But these have not added up to great successes, rather a tenuous grip on the global political agenda.
132 133
The blame for little success must rest with the developing as well as the developed countries. The former have shied away from their post-Rio de Janeiro (Brazil) obligations but they do contribute to much future growth in fossil-fuel consumption and natural resources use. The latter have been going out of their to capture and use world’s natural resources for their own economic ends, knowing that diminishing returns have been operative for long. Besides, they use natural resources far in excess of their needs and in the bargain deprive the developing countries their right to use their own. Having said these words, let us now turn to conservation and preservation and look at them in a historical way.
Conservation and PreservationHistory of Conservation and Resource Management: The idea that humans have abused the planet’s natural resources and environment is not modern in origin. The earliest writings suggesting concern for the environment date back to the time of the ancient Greeks, when Plato described the effects of soil degradation and deforestation on the peninsula of Attica. This brief account was followed by the accounts of many others as they documented the negative effects of agriculture, land use change, urbanization, and industrialization. In the first century, Columella and Pliny the Elder warned that poor land management in the croplands around Rome could have a negative effect on crop yields and may cause soil erosion.
Throughout the middle ages, countless accounts describe the effects of pollution and degradation on the environment. Overpopulation and the subsequent resource depletion are believed to be the cause of the collapse of the Mayan Civilization in the tenth century. During the middle ages, large tracts of forests were removed for their wood or converted into pasture and cropland in much of Europe and Asia. One of the first examples of deliberate preservation of wildlife occurred during this period when noblemen in Britain and Europe put aside areas of land for the purpose of hunting.
In the mid-1700s, the Industrial Revolution began in England. During this period most of the forests had been cut down, and coal was used to replace wood as source of energy. Burning coal produced atmospheric pollution on a local and regional scale. John Evelyn, a naturalist, complained in 1661 of the effects of atmospheric pollution on the air quality in London.
The Environmental Movement in Britain during the sixteenth, seventeenth and eighteenth centuries was primarily influenced by three major forces. Scientific discovery by naturalists provided a general understanding of how nature works. It also allowed for the recognition that human degradation of the environment influenced the survival of living organisms. By the 1880s, field and naturalist clubs had a combined membership of over 100,000 people. At this time, many of the members of these organizations were active in building collections of native birds, eggs and plants. However, the combined effort of the collectors was having a drastic effect on species numbers. As a result of the declining numbers of collected species, a wildlife protection movement developed. The last major force was the growing reaction to the environmental degradation caused by
134 135
urbanization. Urbanization resulted in air pollution, water pollution, and the conversion of natural space into built environments.
The first significant developments in environmentalism and conservation took place in the 19th century. In 1847, George Perkins Marsh gave a speech to the Agricultural Society of Rutland County, Vermont. The subject of this speech was that human activity was having a destructive impact on land, especially through deforestation and land conversion. The speech also became the foundation for his book Man and Nature or The Earth as Modified by Human Action, first published in 1864. In this book, Marsh warned of the ecological consequences of the continued development of the frontier (Also see Library of Congress - The Evolution of the Conservation Movement 1850-1920 home page).
Henry David Thoreau wrote the famous book about conservation and the environment called Walden in 1854. In the book Walden expressed the idea that human civilization was becoming too complex and removed from its foundations in the natural world. Thoreau suggested that humanity should simplify its economic and societal systems so that they are more in harmony with nature. He also suggested that humans should strive for environmental wisdom - which is the ability to make correct decisions and long-term planning by sorting through natural and human created facts and information.
In 1892, the Sierra Club was incorporated in the United States with John Muir as President. John Muir suggested that the utilitarian approach to resource management did not go far enough to protect nature. He suggested that certain resources should be permanently preserved and protected. As a result of his views, some areas in the United States were put aside as National Parks.
Influenced by Marsh’s book, President Theodore Roosevelt decided to change the way the United States Government managed natural resources. With the help of Gifford Pinchot, his main conservation advisor, policies were developed and laws were passed to insure that resources would be managed using utilitarian principles. Utilitarian conservation suggests that renewable resources should be managed so that they will never be exhausted. President Theodore Roosevelt creates first national wildlife refuge, on Pelican Island, Florida. By 1909, the Roosevelt Government creates 200,000 square kilometres of national forests, 51 national wildlife refuges and 18 areas of special interest, including the Grand Canyon.
In the mid-20th century, the Environmental Movement began growing at an accelerating rate as human misuse of the Earth’s environment increased and became more visible to the public. Some of the more important conservation and environmental advocacy related events during the 20th century are shown in a timeline below:
Beginning in the 1940s the United Nations and its agencies became concerned about the global environment.
134 135
1951, The Nature Conservancy founded.
1950s/60s, in Minamata, Japan, mercury pollution from industrial chemical production contaminates humans and other organisms.
1960s, laundry detergents were causing many streams to become covered with foam.
1960s/70s, number of bald eagles declined significantly in the United States due to loss of habitat, poaching, and the effects of pesticides.
1961, World Wildlife Fund established.
1962, Rachel Carson published the book Silent Spring. This book alerted the general public to the dangers of pesticides, particularly the dangers to humans.
1963, atmospheric pollution in New York City kills about 300 and injured thousands.
1967, people of the world witnessed through television the environmental effects of an oil spill with the wreck of the Torrey Canyon.
Late 1960s scientists begin to express their concerns about the state of the environment (for example, Paul Ehrlich, Barry Commoner, LaMont Cole, Eugene Odum, Kenneth Watt, Garrett Hardin).
1967, Environmental Defense Fund established.
1968, Biosphere Conference in Paris examined the condition of the global environment.
1968 Garrett Hardin publishes his article The Tragedy of the Commons in the journal Science.
Early 1970s, scientific evidence suggests that acid precipitation is killing lakes in North America and Europe.
1970, first Earth Day was held in the United States on April 22 (also see John McConnell’s Earth Site home page).
1970, Natural Resources Defense Council founded.
1971, Environment Canada established.
1971, Founding of Greenpeace.
1972, the book Limits to Growth was published. In this book computer models were used to predict the exhaustion of resources and the future state of the Earth’s environment. This book suggested that if growth trends in world population, industrialization, pollution, food production, and resource depletion remained as they are, the limits to growth on the Earth will be reached sometime within the next one hundred years.
136 137
1972, Nixon creates the Environmental Protection Agency in the United States.
1972, the United Nations held a conference on the Human Environment in Stockholm. This conference examined the problems associated with growth and development. It produced a number of important global policies.
1972, the United Nations created the United Nations Environment Programme.
1972, DDT banned in the USA because of its toxic effects of living organisms.
1973, OPEC oil embargo demonstrated the necessity for conservation of finite resources such as oil.
1973, Cousteau Society established.
1977, Love Canal incident taught the public about the dangers of hazardous waste.
1979, Three Mile Island nuclear power plant almost had a meltdown.
1980, The Global 2000 Report to the President, was submitted in the US.
1980, James Lovelock writes Gaia: A New Look at Life on Earth. In this book, Lovelock theorizes that the Earth is a self-regulating entity that maintains optimal conditions for the life that inhabits it. This theory is commonly known as the Gaia Hypothesis. Several scientists have suggested that humans may be changing the state of planet to an extent where life may not be able to return these conditions to their optimum.
1980s to 1990s, atmospheric monitoring at Antarctica documented seasonal reductions in stratospheric ozone.
1981, Citizen’s Clearinghouse for Hazardous Waste founded by Lois Gibbs in response to the problems at Love Canal (now called Centre for Health, Environment and Justice).
1983, Julian Simon and Herman Kahn publish The Resourceful Earth: A Response to Global 2000. This book took opposition to the environmental need for reducing population growth and resource use.
Beginning in 1983, Green Parties are elected in several European Nations.
1985, Rainforest Action Network set up to reduce tropical deforestation.
1986, Chernobyl Nuclear Power Plant explosion released large amounts of radioactivity into the atmosphere.
1986, Rainforest Alliance founded.
1987, World Commission on Environment and Development published Our Common Future. This publication introduced the world to the concept of sustainable development.
136 137
1987, Montreal Protocol was signed by 24 nations to protect the stratospheric ozone layer by cutting back on the emission of CFC’s into the atmosphere. This agreement has been amended three times, in London in 1990, in Copenhagen in 1992 and recently, in Montreal in 1997.
1988, James Hansen, from NASA, explains to the United States Congress that global warming due to an enhancement of the Earth’s greenhouse effect could disrupt water and food supplies and raise sea levels.
1988, Earth Share founded.
1989, Exxon Valdez released 11 million gallons of oil into Prince William Sound, Alaska.
1990s, closure of numerous fisheries demonstrated the problems associated with resource management.
1990, twentieth annual Earth Day was held in 141 countries by an estimated 200 million people.
1991, Envirolink is created on the Internet.
1992, United Nations Rio Conference held in Brazil.
1992, United Nations Framework Convention on Climate Change established agreements between countries dealing with greenhouse gas emissions and the threat of climate change.
1998, Kyoto Protocol was signed by 67 countries. This agreement created a framework for reducing the emission of greenhouse gases into the atmosphere.
2002, Johannesburg United National Conference on Sustainable Development. It was here Agenda 21 to Action 21 was discussed in much greater detail.
Water Resources Management and Conservation
Human demand for water has been growing for two reasons. Firstly, it is primarily because of the growth of the human population. Secondly, as the human standards of living improve in the various countries of the world, the demand for water also increases to meet new needs in industry, agriculture and domestic use. However, there is a limited quantity of fresh water on Earth and for many nations this resource is scarce in its availability. People in Canada and the United States, for example, believe that clean water is available to them in an unlimited supply. Nevertheless, supplies are not unlimited but finite and increasing demand for this resource will soon create problems that can only be corrected by management and conservation. People are also beginning to recognize that water is important for things other than domestic, agricultural and industrial purposes. Water is important for maintaining fish and wildlife populations, for recreation and for aesthetics. Governments in many countries have now established
138 139
water resource management programmes that aim to provide a sustainable supply of high quality water in an efficient and environmentally sound manner.
Water Conservation Techniques
A number of techniques and technologies can be used to make agricultural, industrial and domestic water use more efficient. Reductions can easily occur in the following areas:
Reducing Agricultural Waste: Irrigation accounts for 70 per cent of the world’s water use. Most irrigation systems deliver water to crops by flooding the land surface, diverting water to fields via open channels, or by sprinkler systems that apply water to the field surface. In general, these methods are very inefficient as only 50 per cent of the water applied is absorbed by the plants. The rest is lost to the atmosphere by evaporation. Micro-irrigation techniques can reduce the amount of water applied to crops by 40 to 60 per cent. Other strategies that can be used to reduce agricultural water use include:
The cultivation of food crops that require less water for growth.
The use of lined or covered irrigation canals to reduce infiltration and evaporation losses.
Irrigating crops at night or early morning when evaporation potentials are low.
Reduce water subsidies and encourage the proper pricing of this resource.
Reducing Industrial Waste: Industry is the second largest user of water supplies. Reducing the amount of water used in industry not only makes more water available for other purposes but it can also reduce the volume of pollution. Industry reductions can be achieved by:
Designing industrial processes to recycle water: For example, water used for industrial cooling purposes can be cooled down in a cooling tower and then reused.
Increasing the cost of water to industries to encourage water recycling.
Recycling materials themselves can also greatly reduce water demand. For example, manufacturing a ton of aluminum from scrap rather than from virgin ore can reduce the volume of water used by 97 per cent.
Reducing Domestic Waste - Some strategies for reducing domestic consumption include:
Replace lawns in semiarid and arid urban areas with xeriscaped surfaces.
Encourage the use of efficient irrigation systems for home garden and lawn use.
Manufacture and legislate the use of more efficient dishwashers, washing machines, and bathroom showers and toilets.
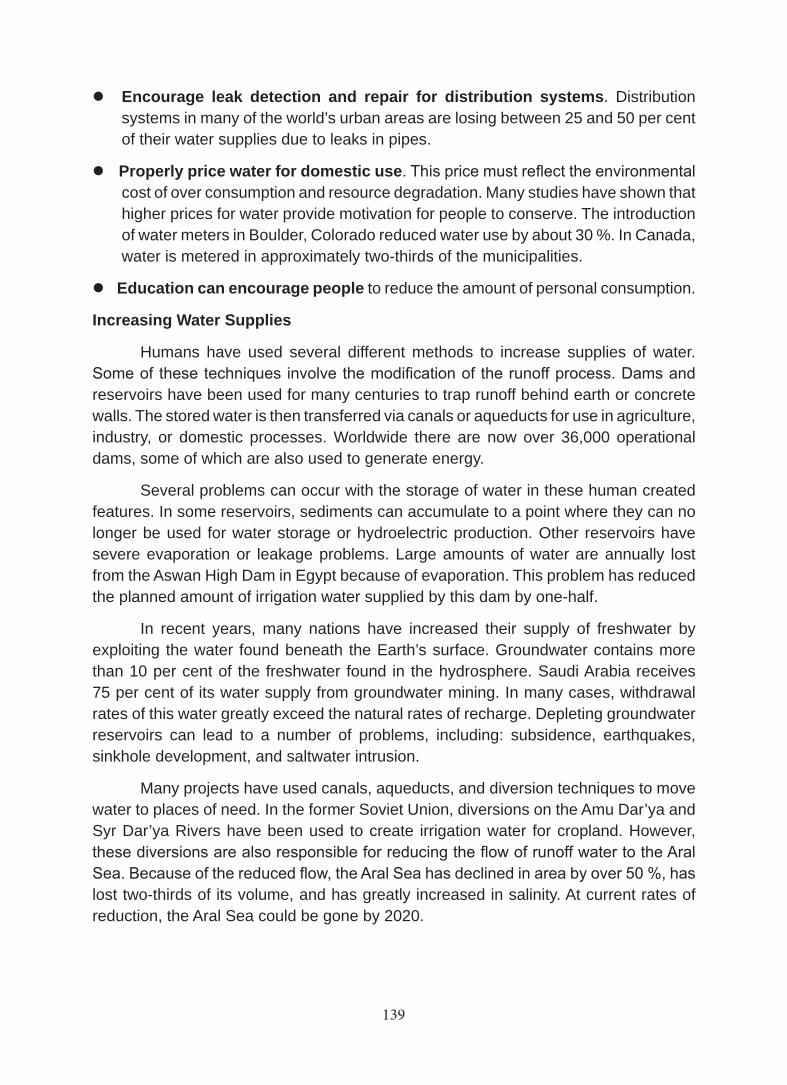
138 139
Encourage leak detection and repair for distribution systems. Distribution systems in many of the world’s urban areas are losing between 25 and 50 per cent of their water supplies due to leaks in pipes.
Properly price water for domestic use. This price must reflect the environmental cost of over consumption and resource degradation. Many studies have shown that higher prices for water provide motivation for people to conserve. The introduction of water meters in Boulder, Colorado reduced water use by about 30 %. In Canada, water is metered in approximately two-thirds of the municipalities.
Education can encourage people to reduce the amount of personal consumption.
Increasing Water Supplies
Humans have used several different methods to increase supplies of water. Some of these techniques involve the modification of the runoff process. Dams and reservoirs have been used for many centuries to trap runoff behind earth or concrete walls. The stored water is then transferred via canals or aqueducts for use in agriculture, industry, or domestic processes. Worldwide there are now over 36,000 operational dams, some of which are also used to generate energy.
Several problems can occur with the storage of water in these human created features. In some reservoirs, sediments can accumulate to a point where they can no longer be used for water storage or hydroelectric production. Other reservoirs have severe evaporation or leakage problems. Large amounts of water are annually lost from the Aswan High Dam in Egypt because of evaporation. This problem has reduced the planned amount of irrigation water supplied by this dam by one-half.
In recent years, many nations have increased their supply of freshwater by exploiting the water found beneath the Earth’s surface. Groundwater contains more than 10 per cent of the freshwater found in the hydrosphere. Saudi Arabia receives 75 per cent of its water supply from groundwater mining. In many cases, withdrawal rates of this water greatly exceed the natural rates of recharge. Depleting groundwater reservoirs can lead to a number of problems, including: subsidence, earthquakes, sinkhole development, and saltwater intrusion.
Many projects have used canals, aqueducts, and diversion techniques to move water to places of need. In the former Soviet Union, diversions on the Amu Dar’ya and Syr Dar’ya Rivers have been used to create irrigation water for cropland. However, these diversions are also responsible for reducing the flow of runoff water to the Aral Sea. Because of the reduced flow, the Aral Sea has declined in area by over 50 %, has lost two-thirds of its volume, and has greatly increased in salinity. At current rates of reduction, the Aral Sea could be gone by 2020.
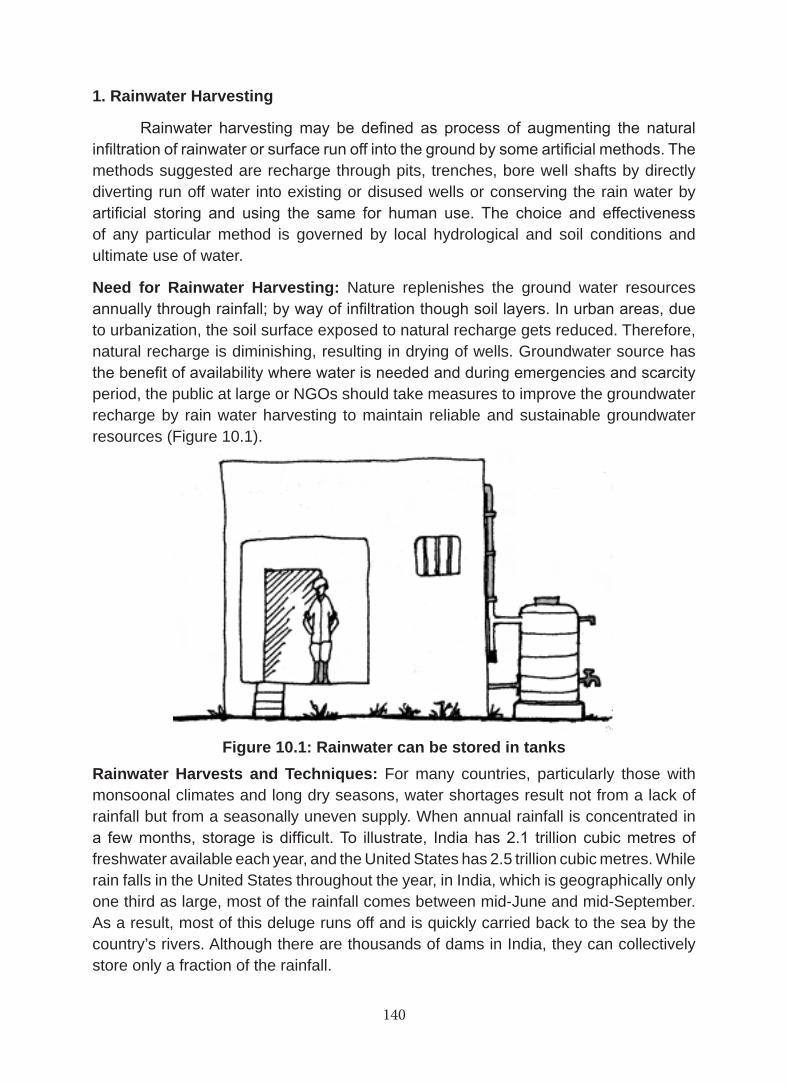
140 141
1. Rainwater Harvesting
Rainwater harvesting may be defined as process of augmenting the natural infiltration of rainwater or surface run off into the ground by some artificial methods. The methods suggested are recharge through pits, trenches, bore well shafts by directly diverting run off water into existing or disused wells or conserving the rain water by artificial storing and using the same for human use. The choice and effectiveness of any particular method is governed by local hydrological and soil conditions and ultimate use of water.
Need for Rainwater Harvesting: Nature replenishes the ground water resources annually through rainfall; by way of infiltration though soil layers. In urban areas, due to urbanization, the soil surface exposed to natural recharge gets reduced. Therefore, natural recharge is diminishing, resulting in drying of wells. Groundwater source has the benefit of availability where water is needed and during emergencies and scarcity period, the public at large or NGOs should take measures to improve the groundwater recharge by rain water harvesting to maintain reliable and sustainable groundwater resources (Figure 10.1).
Figure 10.1: Rainwater can be stored in tanksRainwater Harvests and Techniques: For many countries, particularly those with monsoonal climates and long dry seasons, water shortages result not from a lack of rainfall but from a seasonally uneven supply. When annual rainfall is concentrated in a few months, storage is difficult. To illustrate, India has 2.1 trillion cubic metres of freshwater available each year, and the United States has 2.5 trillion cubic metres. While rain falls in the United States throughout the year, in India, which is geographically only one third as large, most of the rainfall comes between mid-June and mid-September. As a result, most of this deluge runs off and is quickly carried back to the sea by the country’s rivers. Although there are thousands of dams in India, they can collectively store only a fraction of the rainfall.
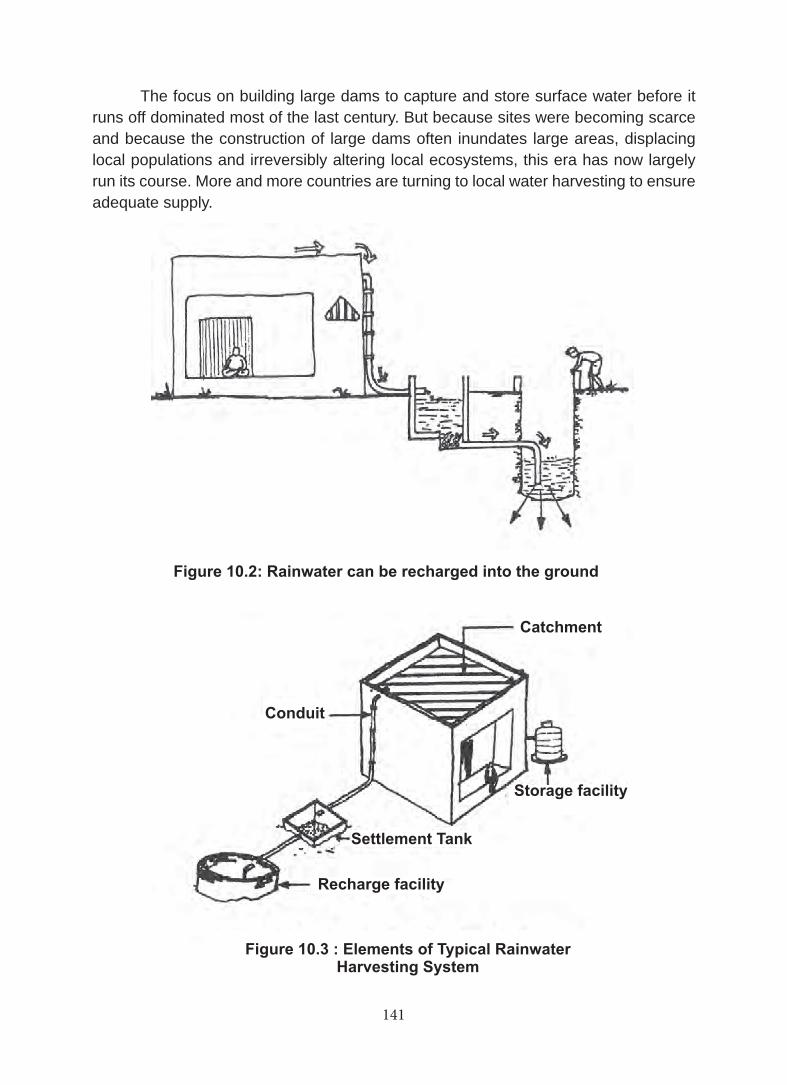
140 141
The focus on building large dams to capture and store surface water before it runs off dominated most of the last century. But because sites were becoming scarce and because the construction of large dams often inundates large areas, displacing local populations and irreversibly altering local ecosystems, this era has now largely run its course. More and more countries are turning to local water harvesting to ensure adequate supply.
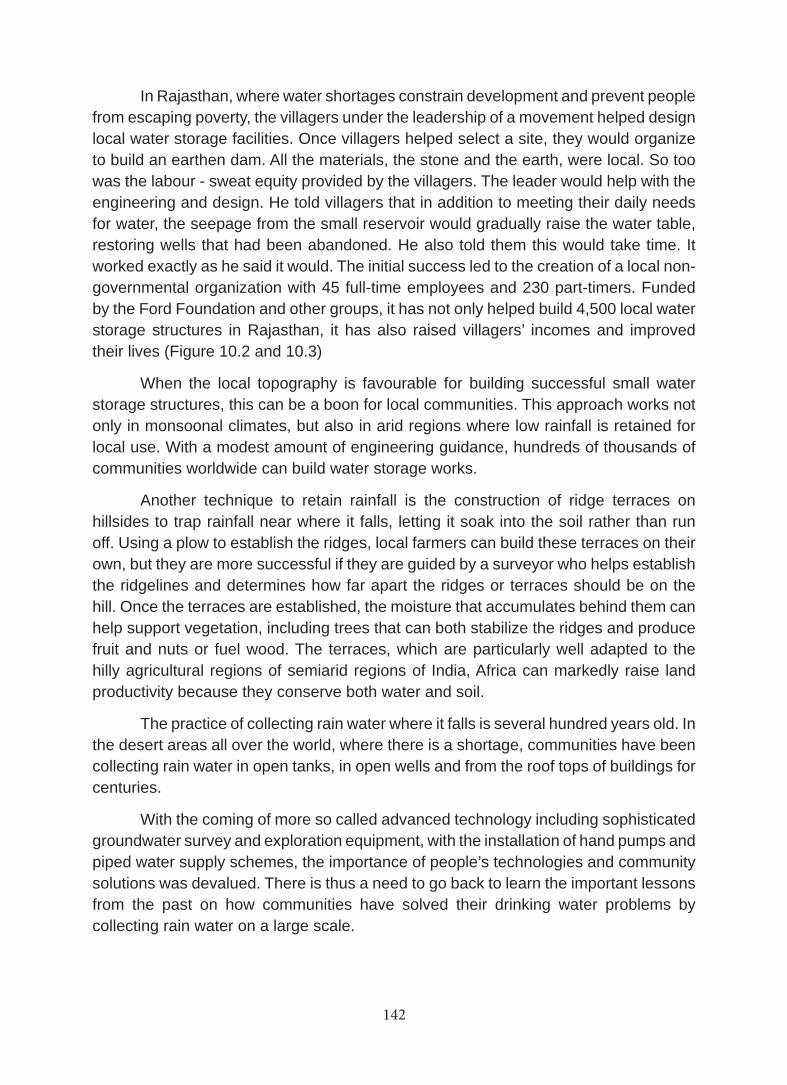
142 143
In Rajasthan, where water shortages constrain development and prevent people from escaping poverty, the villagers under the leadership of a movement helped design local water storage facilities. Once villagers helped select a site, they would organize to build an earthen dam. All the materials, the stone and the earth, were local. So too was the labour - sweat equity provided by the villagers. The leader would help with the engineering and design. He told villagers that in addition to meeting their daily needs for water, the seepage from the small reservoir would gradually raise the water table, restoring wells that had been abandoned. He also told them this would take time. It worked exactly as he said it would. The initial success led to the creation of a local non-governmental organization with 45 full-time employees and 230 part-timers. Funded by the Ford Foundation and other groups, it has not only helped build 4,500 local water storage structures in Rajasthan, it has also raised villagers’ incomes and improved their lives (Figure 10.2 and 10.3)
When the local topography is favourable for building successful small water storage structures, this can be a boon for local communities. This approach works not only in monsoonal climates, but also in arid regions where low rainfall is retained for local use. With a modest amount of engineering guidance, hundreds of thousands of communities worldwide can build water storage works.
Another technique to retain rainfall is the construction of ridge terraces on hillsides to trap rainfall near where it falls, letting it soak into the soil rather than run off. Using a plow to establish the ridges, local farmers can build these terraces on their own, but they are more successful if they are guided by a surveyor who helps establish the ridgelines and determines how far apart the ridges or terraces should be on the hill. Once the terraces are established, the moisture that accumulates behind them can help support vegetation, including trees that can both stabilize the ridges and produce fruit and nuts or fuel wood. The terraces, which are particularly well adapted to the hilly agricultural regions of semiarid regions of India, Africa can markedly raise land productivity because they conserve both water and soil.
The practice of collecting rain water where it falls is several hundred years old. In the desert areas all over the world, where there is a shortage, communities have been collecting rain water in open tanks, in open wells and from the roof tops of buildings for centuries.
With the coming of more so called advanced technology including sophisticated groundwater survey and exploration equipment, with the installation of hand pumps and piped water supply schemes, the importance of people’s technologies and community solutions was devalued. There is thus a need to go back to learn the important lessons from the past on how communities have solved their drinking water problems by collecting rain water on a large scale.
142 143
Methods of Rainwater Harvesting in Cities: Broadly the rain water can be harvested by two methods:
Store the rainwater in containers above or above grounds or below grounds; and
Recharge into soil for withdrawal later by groundwater recharging basis.
Elements of typical water harvesting system: Any rain water harvesting will have four elements:
Catchment area;
Conduits;
Settlement Tank; and
Recharge facility or storage facility.
Figures 10.1 to 10.3 show rainwater harvesting techniques and their elements. Rainwater harvesting techniques are simple, labour-intensive and cost effective. By collecting water where it falls (a) in underground tanks in rural primary schools,
(b) in artificial ponds deepened to collect more water and (c) in unused and disused open wells where surface water is channeled for faster percolation into the ground, rainwater could be usefully harvested and at much lower costs.
What will this achieve?
it will be a long term solution to drought proof villages
it will allow for faster percolation into the ground which will revitalise dry hand pumps for drinking water and open wells for irrigation. It is a far more inexpensive and economic way of providing drinking water than drilling for new sources.
it will allow for the community of users to manage and control the water and reduce dependency on government.
With the barefoot architects constructing the rainwater harvesting tanks using local materials, traditional knowledge and skills, it demonstrates how there is no need to bring urban skills from outside.
2. Inter-State River Linkages
Inter-State River Linkages are a topic of interest for India, especially for the southern States of the Indian Union where the rivers are largely non-perennial and the water shortages are alarming in the off-season and summer. There are similar contexts elsewhere in the world, in almost all continents. It is in India, the topic is hot and is being talked about intensely in the last few months.
144 145
Do you know?
Biodiversity value of some selected organization in monetary terms.
A male lion living upto an age of 7 years can general upto $515,000 due to its aesthetic value as paid by tourists, whereas if killed for the lion skin a market price upto $1,000 can be fetched.
The mountain gorillas in Rwanda are fetching $ 4 million annually through eco-tourism.
A typpical tree provides $196,2150 worth of ecological services an oxygen, clean air fertile soil, erosion control, water recycling, wildlife habitat, toxic gas moderation etc., Whereas its worth in only about $590 if sold in the market as timbers.
The present scenario in the country’s water resources sector is alarmingly dismal. While floods are wreaking havoc in the Northeast and Eastern regions and drought is looming large in many parts of the Indian landmass, many States continue opposing the inter-basin transfer of waters from surplus to deficit basins. Punjab has gone one step ahead by passing unilaterally a Bill terminating all previous agreements and accords on river waters thereby vitally affecting irrigation and drinking water supply in the neighbouring States. Punjab’s action has triggered a whirlwind of protest and has raised a core issue of national importance,the solution to which would determine the future course of action on such issues.
Conflict of interest is the normal state of affairs in a reality where river flows physically link upstream and downstream users and uses. The issues are complex and linkages are many. But instead of sorting out the differences, of late, water endowed States have been resorting to legal gimmickry while playing to the political galleries, in their bid to prevent use of waters flowing through their territories by their water deficit neighbours. Kerala has passed a Bill in this regard recently and Karnataka had issued an ordinance on the Cauvery waters some time back. In all these cases, reference has been made to the sovereign rights of the States as enshrined in the Constitution. If other water surplus States take the cue from these instances and act as arbitrarily, the consequences of such developments in terms of India’s unity and integrity would be disastrous. Hence the demand has been gaining momentum in the last few years for the Central government to transfer the subject of “Water” from the “State List” to the “Union List” or “Concurrent List” to arrest further deterioration in water related issues.
144 145
Do you know?
Disappearing Tea garden in Chota Nagpur.
This hilly region used to be a good forested area towards the turn of the century and used to receive fairly frequent afternoon showers favouring tea plantations. Following the destruction of forests, rainfall declined in Chota Nagpur to such an extent that tea-gardens also disappeared from the region.
In the Constitution, “Water, that is to say, water supplies, irrigation and canals, drainage and embankments, water storage and water power,” is a matter contained in Entry 17, List II (State List). Hence the State legislatures have full powers to legislate under this provision on all water related matters including their regulation and development. However, this Entry is subject to the provision of Entry 56, List I (Union List) which authorises Parliament to enact laws for the regulation and development of interstate rivers and river valleys
Entry 56 under Union List reads as under: Regulation and development of interstate rivers and river valleys to the extent to which such regulation and development under the control of the Union is declared by Parliament by law to be expedient in public interest.
In the past, the Centre had enacted over-riding laws using constitutional powers on many subjects such as industry and business, which are included in the State List. However, at present any constitutional amendment particularly in the emotive issue of water does not seem possible. Another view which has gained currency is that without any constitutional amendment, the Centre can deal with interstate rivers by empowering itself under the available provisions (Entry 56, List I).
Against the above background, any change in the scheme of the Constitution has to be ruled out and instead the Centre has to pass laws to deal with interstate rivers more effectively as they contribute more than 85 per cent of the water resources of the country. The National Commission for Integrated Water Resources Development Plan had also recommended such an approach (September, 1999).
Consultative Mechanism: Apart from enacting laws to empower itself for the control and regulation of interstate rivers, there is also a need for the Centre to set up Centre-State consultative mechanisms for effectively sorting out of water related concerns. The purpose is to secure a proper tie between problems and their main causes on the one hand and technology and governance perspectives of problem- solving on the other. Further, a National Water Authority (NWA) as an apex body to concern itself with the development and management of interstate rivers supported by a River Basin Organisation for each interstate river needs to be set up on similar lines as in Australia and France. The River Boards Act (1956) has to be suitably amended to create these institutions.
146 147
It must be remembered that the development of effective solutions to water problems depends more on governance. Hence it is essential for the Centre to empower itself to take over the interstate rivers for providing better regulation and management of the water resources available in the country and put a stop to the fissiparous tendencies recently demonstrated.
Leave Me Where I am
Leave me where I am
Deep in the earth
Comfort in the darkness
Do not touch me
If you do,
You die.
I know the rules
You don’t
Please, for God’s sake
Approaches to Resource Management
Over the last 200 years, resource managers and scientists have recognized four different approaches to resource management:
1. Exploitation - given resource should be used as intensively as possible to provide the greatest profit to the user (early loggers).
2. Preservation - resources should be preserved, set aside, and protected. This was founded in the 1880s when John Muir (Sierra Club) proposed that some lands should be converted into National Parks (that is, Yosemite and Sequoia National Parks).
3. Utilitarian Approach - this concept suggests that renewable resources should be managed so that they will never be exhausted.
4. Ecological Approach - embraces the concept of multiple uses. A forest is not only a source of timber, but has many other values as well (see The Tragedy of the Commons).
146 147
Chaos and Resource Management
In a 1993 publication (Science 260: 17: 36), Ludwig, Hilborn and Walters noted the general failure of natural resource managers in managing biological resources. They suggest that the reasons for this failure are rooted in a poor scientific understanding of how resource systems work. They also suggest that resource systems are inherently chaotic and uncertain, while most management systems are based on linear dynamics and principles. In conclusion, they recommend that resource managers must confront the uncertainty of natural systems.
Learning Ourtcomes
Students have learnt the techniques of rainwater harvesting and conservation of natural resources, and also understood the essentials of conservation of natural resources and their management.
EXERCISESI. Fill in the Blanks
1. Global loss in biodiversity and wild places are not the stuff of ____________.
2. The two basic categories of wildlife conservation science are ____________ and ___________.
3. Overpopulation and the subsequent resource depletion are believed to be the cause of the collapse of the _____________ in the tenth century.
4. The first significant development in environment and conservation took place in __________ century.
5. __________ suggested that humans should strive for environmental wisdom.
6. Irrigation accounts for ____________ percent of the world’s water use.
7. In _________ (country), water is metered in approximately two-thirds of the municipalities.
8. India has _________ trillion cubic metres of freshwater every year.
9. ___________ River Linkages is the present talk of India.
10. The general failure of natural resource managers in managing biological resources noted by __________ and _____________.
148 149
II. Choose the Correct Answer
11. The President of Sierra Club:
(a) John Muir (b) Theodore Roosevelt
(c) George Bush (d) Indira Gandhi
12. World wildlife fund was established in:
(a) 1965 (b) 1961
(c) 1978 (d) 1254
13. The First Earth Day was celebrated in:
(a) United Kingdom (b) United States
(c) Israel (d) Sierra Leone
14. Johannesburg 2002 United Nations’ Conference was on:
(a) Software development (b) Transport development
(c) Sustainable development (d) Community development
15. The techniques that reduce the amount of water applied to crops:
(a) Hydroponics (b) Automated irrigation
(c) Macro irrigation (d) Micro irrigation
III. Match the Following
16. Kyoto Protocol - 1988
17. Earth Share - 67 countries
18. Unlimited supply of water - 25 to 50 per cent
19. Leakage of water in urban areas - Former SovietUnion
20. Amu Darya River - Canada
- 1987
IV. Brief Answers
21. Biodiversity
22. Conservation of wildlife
23. Rainwater harvesting
24. Inter-State River Linkages
25. Entry 17, List II (State List)
148 149
V. Paragraph Answers
Write a note on:
26. Management of natural resources in the United States
27. Uses of dams and reservoirs
28. Four different approaches recognized by the Scientists for resource management.
VI. Detailed Answers
29. Describe the history of conservation and resources management.
30. Write about the important conservation and environmental advocacy related events of the 20th century.
31. Discuss the water conservation techniques.
VII. Practical Exercises
32. Students visit a National Parks or a Conservation / Protected Area to learn about their functions.
33. Teacher guides the students in debating the needs, objectives and solutions for resources management problems of the local area.
150 151
UNIT VMAP INTERPRETATION AND SURVEYING
LESSON 11MAP INTERPRETATION
Learning Objectives
Students will learn such that they will (a) understand the basic principles of map reading, (b) use and understand the symbols and draw symbols on their own and even develop their own scheme of symbols, and (c) develop the skill of understanding the relief features of the earth.
In developing map reading abilities and skills, certain basic principles must be applied. Every map symbol must be visualized by the student as he/she learns to read a map. The symbols introduced to the student should be those, which refer to landscape features of which he/she already has an image. The teacher of geography must be equally careful in seeing that the student associates the map symbols with the actual landscape features.
In most schools, and in textbooks, the conventional map is introduced in the fourth standard. At this age, the child begins to use maps for locating places and tracing trips beyond his/her own local area. The children should therefore know the cardinal directions. One of the basic functions of maps is to help us to orient ourselves to and to locate places on the earth. Unless a child knows the cardinal directions, he/she cannot use a map effectively.
At higher levels of education, say Plus 2 or Standard XII, the basic rules of map interpretation is still the same. At this level of education, students must learn more about not just maps but (a) the topographical sheets (toposheets, for short) and (b) the weather maps and images. Constant practice, frequent re-teaching, and the review are necessary as in the development of reading and arithmetic skills.
The Maps
What is a map? There are many definitions, and this is only one: In the words of Harley and Woodward (The History of Cartography, 1987), maps are graphic representations that facilitate a spatial understanding of things, concepts, conditions, processes, or events in the human world. The maps are flat representations of the earth (Figure 11.1).
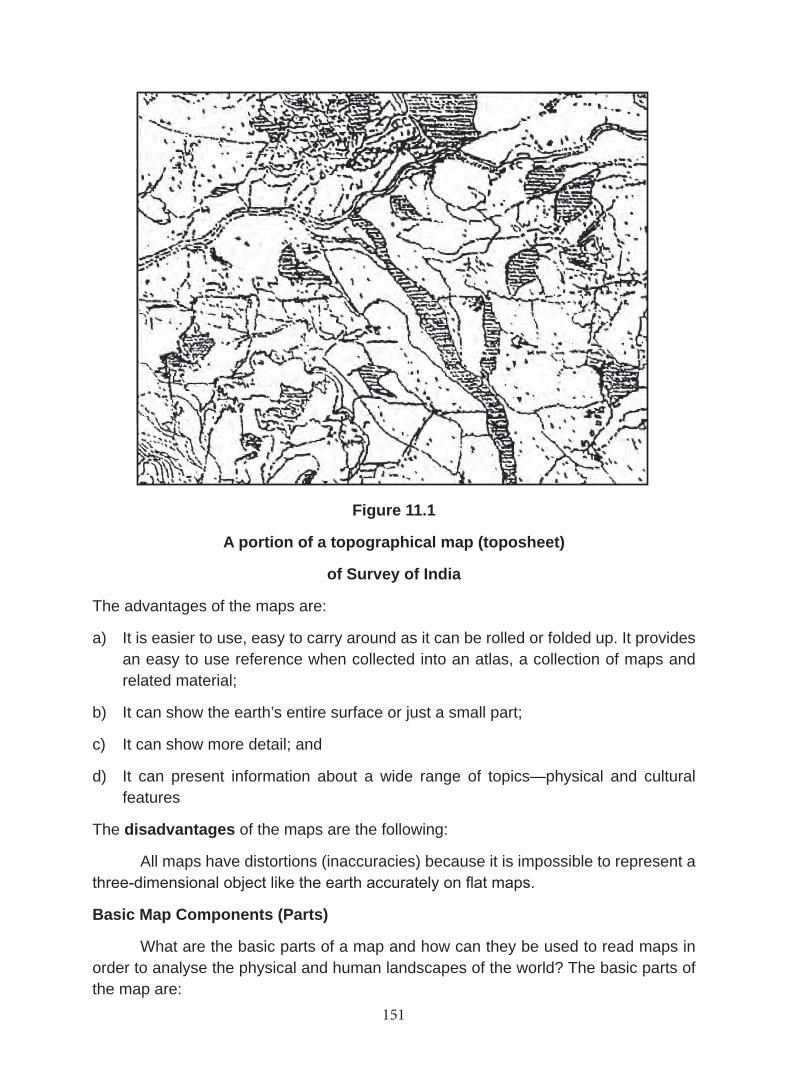
150 151
Figure 11.1
A portion of a topographical map (toposheet)
of Survey of India
The advantages of the maps are:
a) It is easier to use, easy to carry around as it can be rolled or folded up. It provides an easy to use reference when collected into an atlas, a collection of maps and related material;
b) It can show the earth’s entire surface or just a small part;
c) It can show more detail; and
d) It can present information about a wide range of topics—physical and cultural features
The disadvantages of the maps are the following:
All maps have distortions (inaccuracies) because it is impossible to represent a three-dimensional object like the earth accurately on flat maps.
Basic Map Components (Parts)
What are the basic parts of a map and how can they be used to read maps in order to analyse the physical and human landscapes of the world? The basic parts of the map are:
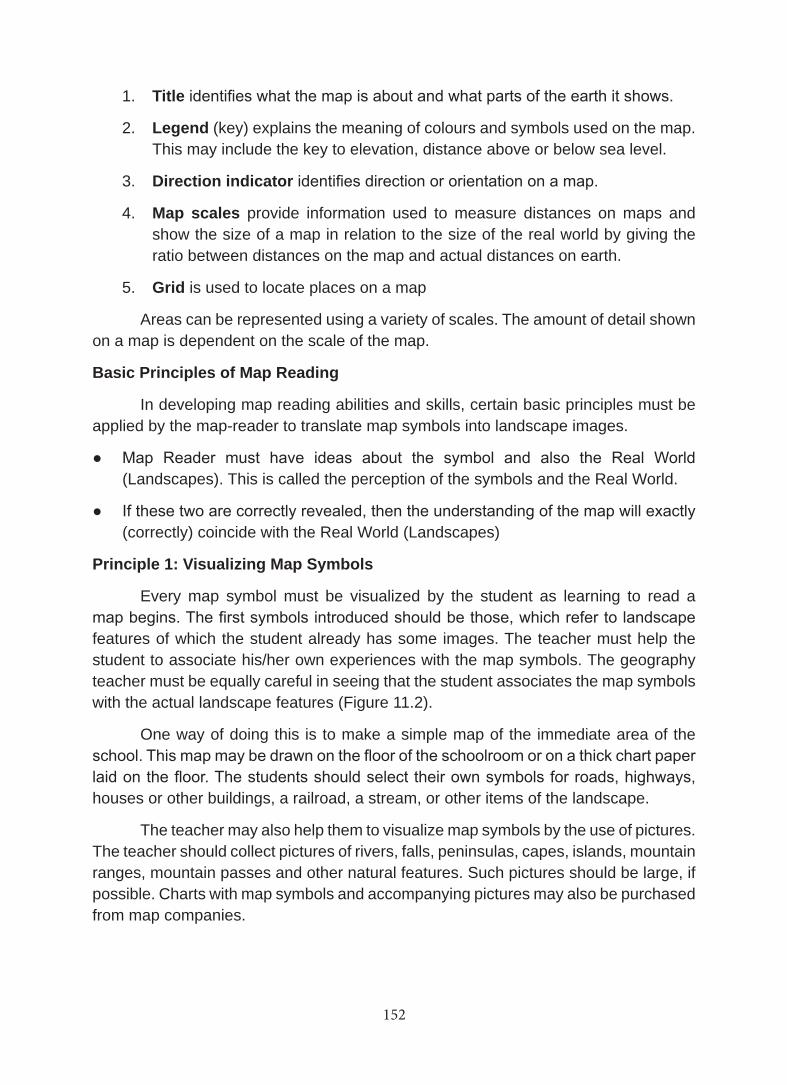
152 153
1. Title identifies what the map is about and what parts of the earth it shows.
2. Legend (key) explains the meaning of colours and symbols used on the map. This may include the key to elevation, distance above or below sea level.
3. Direction indicator identifies direction or orientation on a map.
4. Map scales provide information used to measure distances on maps and show the size of a map in relation to the size of the real world by giving the ratio between distances on the map and actual distances on earth.
5. Grid is used to locate places on a map
Areas can be represented using a variety of scales. The amount of detail shown on a map is dependent on the scale of the map.
Basic Principles of Map Reading
In developing map reading abilities and skills, certain basic principles must be applied by the map-reader to translate map symbols into landscape images.
● Map Reader must have ideas about the symbol and also the Real World (Landscapes). This is called the perception of the symbols and the Real World.
● If these two are correctly revealed, then the understanding of the map will exactly (correctly) coincide with the Real World (Landscapes)
Principle 1: Visualizing Map Symbols
Every map symbol must be visualized by the student as learning to read a map begins. The first symbols introduced should be those, which refer to landscape features of which the student already has some images. The teacher must help the student to associate his/her own experiences with the map symbols. The geography teacher must be equally careful in seeing that the student associates the map symbols with the actual landscape features (Figure 11.2).
One way of doing this is to make a simple map of the immediate area of the school. This map may be drawn on the floor of the schoolroom or on a thick chart paper laid on the floor. The students should select their own symbols for roads, highways, houses or other buildings, a railroad, a stream, or other items of the landscape.
The teacher may also help them to visualize map symbols by the use of pictures. The teacher should collect pictures of rivers, falls, peninsulas, capes, islands, mountain ranges, mountain passes and other natural features. Such pictures should be large, if possible. Charts with map symbols and accompanying pictures may also be purchased from map companies.
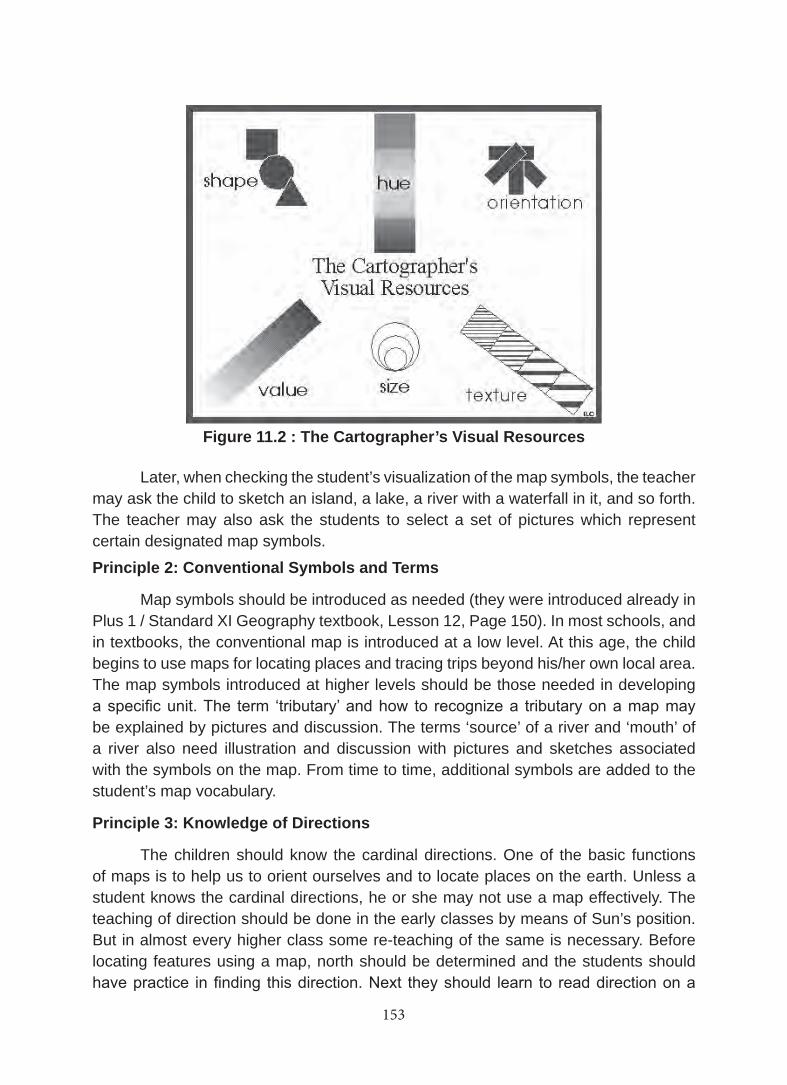
152 153
Figure 11.2 : The Cartographer’s Visual Resources
Later, when checking the student’s visualization of the map symbols, the teacher may ask the child to sketch an island, a lake, a river with a waterfall in it, and so forth. The teacher may also ask the students to select a set of pictures which represent certain designated map symbols.
Principle 2: Conventional Symbols and Terms
Map symbols should be introduced as needed (they were introduced already in Plus 1 / Standard XI Geography textbook, Lesson 12, Page 150). In most schools, and in textbooks, the conventional map is introduced at a low level. At this age, the child begins to use maps for locating places and tracing trips beyond his/her own local area. The map symbols introduced at higher levels should be those needed in developing a specific unit. The term ‘tributary’ and how to recognize a tributary on a map may be explained by pictures and discussion. The terms ‘source’ of a river and ‘mouth’ of a river also need illustration and discussion with pictures and sketches associated with the symbols on the map. From time to time, additional symbols are added to the student’s map vocabulary.
Principle 3: Knowledge of Directions
The children should know the cardinal directions. One of the basic functions of maps is to help us to orient ourselves and to locate places on the earth. Unless a student knows the cardinal directions, he or she may not use a map effectively. The teaching of direction should be done in the early classes by means of Sun’s position. But in almost every higher class some re-teaching of the same is necessary. Before locating features using a map, north should be determined and the students should have practice in finding this direction. Next they should learn to read direction on a
154 155
specific map and the location of the features shown on the map in relation to one another.
If a teacher follows the three basic principles above for teaching map symbols, and gives constant and varied exercises in reading maps, the students will really learn to effectively read maps.
Suggested, Sequential Learning of Map Skills
1. In the early classes, there should be a geography programme that includes map-reading activities. Such activities are needed to give the child background and experience before the conventional map is introduced. By the end of their primary education, the children should know and be able to use the cardinal directions.
2. In the later classes, the use of shadows to indicate direction may be introduced. The best time to observe shadows is as near noon-time as possible.
3. By the end of the high school, most of the students should know the cardinal and the intermediate directions and be able to use them. They should know that they can use shadows to determine directions. They should know that a map represents the features of the landscape in a certain area by means of symbols.
4. In the higher secondary, the maps used should be simple, with relatively few symbols. The colours should be clear, blue for water bodies, and grey, yellow or green for land.
5. In these classes, they should be able to understand the scale (different types of scales: representative fraction, graphical scale and scale of map in statement) on every map they use and to compare maps of different scales. They should use the scale of kilometres to find approximate distances between places, for example, from their home to a large city or the length of a state’s boundary.
6. During the higher secondary years the students should show considerable facility in map-reading. They should now have a large map vocabulary and have had enough practice in reading descriptive facts, visualizing the landscape, and making inferences that they should be able to use maps with less dependence on the teacher. No doubt, some re-teaching will be necessary and practice in certain skills should be continued.
Map-reading skills and abilities are developed gradually. Constant practice, frequent re-teaching, and review are necessary for the development of reading. The development of map skills should begin in the primary classes, and be carried on consistently throughout the intermediate classes and the junior and senior high schools. Only through such cumulative, long-term learning will maps become useful tools “for grasping not only spatial relationships of places on the face of the earth but
154 155
also for understanding the significance of geography in the development of the various cultures of the world.
Weather Maps and Images Interpretation
Weather and climate of a place depend on the following factors: latitude, longitude, altitude, proximity to large water bodies, distribution of land and water bodies, structure and nature of the soil, anthropogenic activities, incoming solar radiation, and the tilt of the earth’s axis. The basic elements of weather and climate are the same. The most important of these are: temperature, humidity, precipitation, cloudiness, sunshine, pressure, wind speed and direction. These elements are determined by the complex interplay of a number of factors: pressure, winds and upper air circulation, distance from the sea, relief, soil type and vegetation.
There is no aspect of life on earth, where weather and climate can be kept out of consideration. Food, clothing, housing, transport, communication, games and sports, recreation, religious practices, whatever it is, weather and climate have a role to play in that field whether it is major or minor. A sensible approach to identify the significance of it and adequately meeting demands would put the managers in the forefront among the competitors.
Weather and climate on the one hand and the physical environment of the earth together with the biosphere on the other have mutual interactions with one another. The impacts of weather and climate differ essentially on time scales. Knowledge of weather is essential for short-term planning. Knowledge of climate is essential for long-term planning.
Evidently, faded out cities, monuments and settlements are the reminiscences that speak about the changes that have occurred over ages. Climate change and variability are the terms, which are heard frequently and are acquiring increasing importance. It can also be seen that they find berth in unsolved mysteries pertaining to ecological or other sociological phenomena.
Variability of climate affects all the sections of the society; most affected being the agricultural sector. This tells upon the supporting and related sectors such as fertilisers, food grains, transport industries and other various underground sectors, particularly in developing countries.
Weather Maps
The weather map, analysis chart or synoptic chart, shows isobars (contours of constant pressure), highs and lows (centres of maximum or minimum pressure), fronts (boundaries of air masses) and station data (wind, weather, cloud cover, cloud type, barometric pressure, temperature and precipitation). The amount of detail included depends on the scale of the map, but even a simple map contains a large amount of data. It needs considerable practice to understand a weather map, but the knowledge
156 157
will come easily and will be very satisfying. By all means look out-of-doors at your own location and analyse what you see in terms of your map study. Particularly interesting is correlating the cloud forms with weather conditions. The kind of map that mainly concerns us gives actual measurements at some definite time in the past, not a prediction of future events, and is called an analysis chart.
Map Symbols for Weather and Clouds
The most often seen weather symbols are already given in Plus 1 / Standard XI Geography textbook (Lesson 13, Pages 158, 160 and 161). A large S for sand or dust has a thicker arrow cutting across it for a strong dust storm, no arrow if the dust is suspended in the air without a wind, a vertical arrow if the dust is raised by the wind at the time of observation. The haze symbol, looking like infinity, is for a thin dry haze. The fog symbol is for a fog obscuring the sky. Two lines represent a light fog, and if the lines are broken the fog is patchy. The smoke symbol is used when visibility is restricted due to smoke. The drizzle, rain and snow symbols are used in multiple to indicate intensity. One is light, intermittent while four is heavy, continuous. A curved line beneath the symbol means that the precipitation is not reaching the ground (virga). The shower symbol is combined with a precipitation symbol to indicate rain or snow shower. The hail symbol may be combined with the thunderstorm symbol, for example, and a dot in the triangle represents sleet. Everywhere except in the U.S., sleet is hail or snow with rain; in the U.S., it is freezing rain with clear crystals (ice pellets).
A rain dot or snow asterisk can be used above a thunderstorm symbol to indicate a slight or moderate storm with rain or snow. If the lightning is given an extra zigzag, a heavy thunderstorm is indicated. The sandstorm symbol can be used if the thunderstorm is kicking up dust. Slight, moderate and heavy intensities are distinguished, as are intermittent or continuous precipitation. Drizzle is rain in tiny drops that cannot easily be visually distinguished, while rain is in visually evident drops. Water is also deposited from colloidal suspension in fogs, but this is reported under fogs.
Snow includes any kind of falling ice crystals, except for hail, which is specially distinguished and originates in thunderstorms. The symbol for hail is an equilateral triangle. Frozen raindrops are represented by the hail triangle with a dot in it. Freezing rain and freezing drizzle have their special symbols with the “lazy S.” This precipitation falls as water, but freezes on contact with the earth surface.
Cloud cover at a station is represented inside the circle from which the wind speed arrow projects. Cloud cover is estimated in tenths of the sky covered from cloudless, 0/10 to overcast, 10/10. “Sky obscured” means that the sky cannot be seen due to smoke, fog or other obstruction. A ceiling is quoted as the height of the cloud base when 6/10 or more of the sky is covered. Visibility is a “hazy” concept; it is the greatest distance at which you can see what you need to see. It can be more precisely defined as the distance at which a specified black shape can be seen against the horizon by day. Visibility can be measured by some instrument over a fixed range,
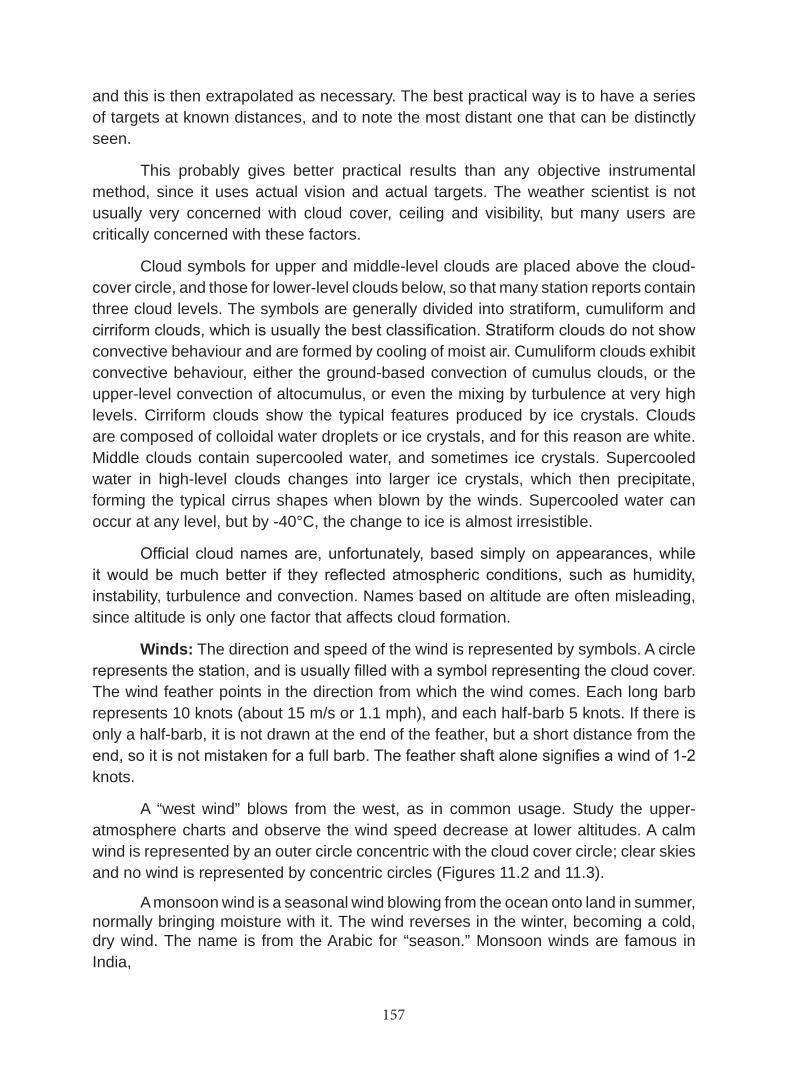
156 157
and this is then extrapolated as necessary. The best practical way is to have a series of targets at known distances, and to note the most distant one that can be distinctly seen.
This probably gives better practical results than any objective instrumental method, since it uses actual vision and actual targets. The weather scientist is not usually very concerned with cloud cover, ceiling and visibility, but many users are critically concerned with these factors.
Cloud symbols for upper and middle-level clouds are placed above the cloud-cover circle, and those for lower-level clouds below, so that many station reports contain three cloud levels. The symbols are generally divided into stratiform, cumuliform and cirriform clouds, which is usually the best classification. Stratiform clouds do not show convective behaviour and are formed by cooling of moist air. Cumuliform clouds exhibit convective behaviour, either the ground-based convection of cumulus clouds, or the upper-level convection of altocumulus, or even the mixing by turbulence at very high levels. Cirriform clouds show the typical features produced by ice crystals. Clouds are composed of colloidal water droplets or ice crystals, and for this reason are white. Middle clouds contain supercooled water, and sometimes ice crystals. Supercooled water in high-level clouds changes into larger ice crystals, which then precipitate, forming the typical cirrus shapes when blown by the winds. Supercooled water can occur at any level, but by -40°C, the change to ice is almost irresistible.
Official cloud names are, unfortunately, based simply on appearances, while it would be much better if they reflected atmospheric conditions, such as humidity, instability, turbulence and convection. Names based on altitude are often misleading, since altitude is only one factor that affects cloud formation.
Winds: The direction and speed of the wind is represented by symbols. A circle represents the station, and is usually filled with a symbol representing the cloud cover. The wind feather points in the direction from which the wind comes. Each long barb represents 10 knots (about 15 m/s or 1.1 mph), and each half-barb 5 knots. If there is only a half-barb, it is not drawn at the end of the feather, but a short distance from the end, so it is not mistaken for a full barb. The feather shaft alone signifies a wind of 1-2 knots.
A “west wind” blows from the west, as in common usage. Study the upper-atmosphere charts and observe the wind speed decrease at lower altitudes. A calm wind is represented by an outer circle concentric with the cloud cover circle; clear skies and no wind is represented by concentric circles (Figures 11.2 and 11.3).
A monsoon wind is a seasonal wind blowing from the ocean onto land in summer, normally bringing moisture with it. The wind reverses in the winter, becoming a cold, dry wind. The name is from the Arabic for “season.” Monsoon winds are famous in India,
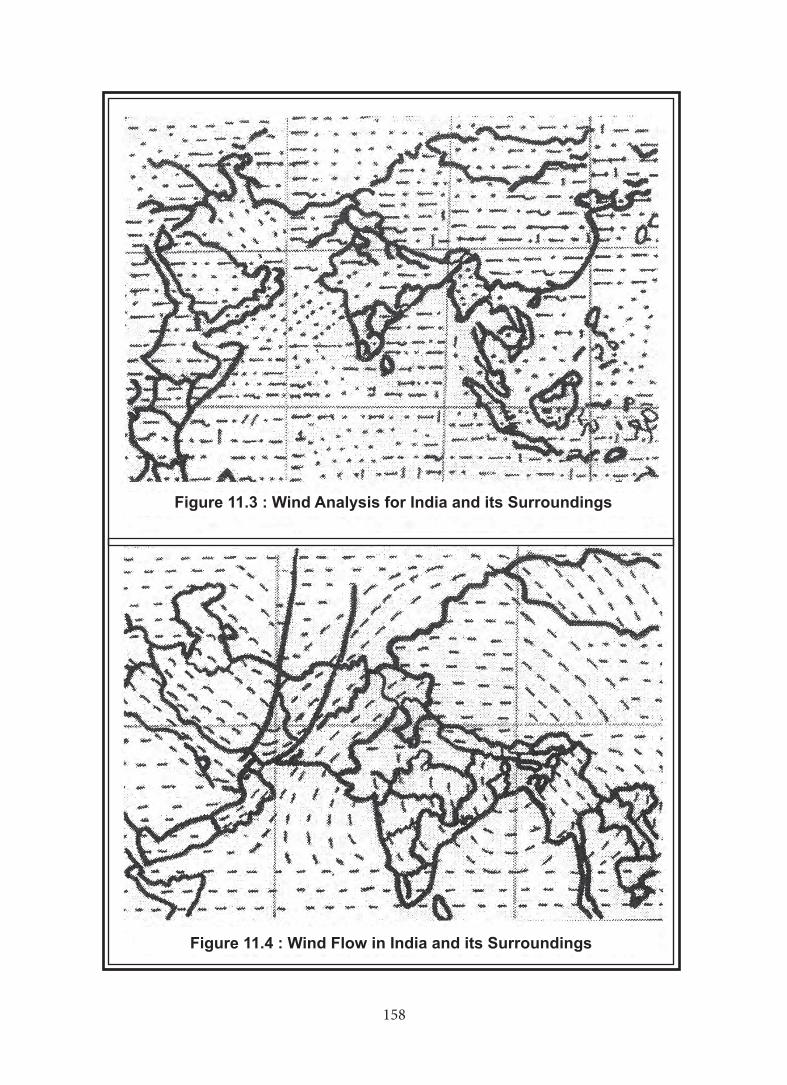
158 159
158 159
where they bring lifegiving rains. Monsoons also occur in the United States. Monsoon winds are probably driven by a continental high in the winter and a continental low in the summer, which explains the seasonal reversal in direction. The southern hemisphere does not have monsoons, since there are no continents in high mid-latitudes to heat and cool strongly with the seasons, only the constant ocean.
Highs and Lows: The next thing to notice on the weather maps are the highs and lows, marked by large L’s and H’s, with their centres marked by circles containing a cross, and their central pressures given. There are local highs and lows; the pressure of a low in one part of the chart may be higher than the pressure of a high in another part. The winds will circle anticlockwise around a low, and clockwise around a high. The winds around lows are usually much more intense than those around highs. In some cases, the winds will seem to disregard the isobars, but these will be only light winds. The lows, or cyclones, will be accompanied by considerable cloud (look for black station circles), while the highs, or anticyclones, will generally be associated with clear skies.
Air does not take the short path and simply flow on the surface from a high to a low. There are two reasons why this happens: pressure gradient and Coriolis force. If we start at the North Pole, no matter which way we head the earth will be moving anticlockwise (eastwardly) beneath us, and again our path will deviate to the right. If, in mid-latitudes, we move directly eastward, the parallel of latitude will curve away to the north, and we will appear to be deflected to the right. The Coriolis force in every case gives the right answer. A special kind of low is the tropical depression, tropical storm, or hurricane, which derives its energy from the moisture provided by warm sea surfaces.
Weather Map Interpretation
Weather maps are issued everyday, providing a synoptic report. The weather report has a number of maps, each relating to a theme or two. The maps are full of symbols, indicating the weather conditions of the day. The maps are easy enough to interpret if you know what the symbols on them mean. The most important map is the map showing the distribution of pressure, by means of isobars, and letter symbols. Wind flow, wind speed and wind direction are all shown as well. Cloud cover - clear, fully covered or partially covered - is also shown. There are maps shown the distribution of temperature by means of isotherms. Rainfall or isohyetal map is also given indicating the distribution of rain and precipitation types.
In weather interpretation these maps are used to write a summary of weather conditions existing on a given day. It is possible to speak of weather changes over a short duration, two or three days, from the report given along with the weather maps.
Weather forecasting is a difficult activity. In tropical weather conditions, the prediction becomes even more difficult because of fast changing weather. Interpretation comes easy with practice and first interpretations are often not very good ones.
160 161
Weather Forecasting
Atmosphere is the gaseous envelope of the earth in which all its flora and fauna survive. As weather is the statement of its physical conditions at an instant, its forecasting is of concern to one and all living over the earth. As such, since time immemorial weather forecasting was a subject of grave concern for the geographers and meteorologists. But, due to extremely complex nature of various physical processes of the atmosphere, which lead to weather, these endeavours have always been met with limited success.
Various methods were developed and used by meteorologists for weather forecasting. The most important methods in vogue currently are the conventional Synoptic, and Numerical Weather Prediction (NWP) methods. The former method is human subjective and the latter is objective and deterministic. Skill of these forecasts can be enhanced through use of GIS today by relating different features of the atmosphere and their proper visualization.
Conventional Synoptic Method:
In this subjective method, conventional forecasting tools like, trend, persistence, climatology and analogue of weather systems are popularly employed. Each of these methods makes use of some basic assumptions for extrapolating the weather into the future. The forecaster blends these extrapolations with his own experience and the location specific weather quirks like topography and land-sea distributions.
None of these methods seems perfect, as the weather sometimes manifest differently, deviating considerably from the basic concepts on which these methods are founded. The inadequate human understanding of the various complex atmospheric processes leading to the weather development itself is one of the major problems associated with this method.
Numerical Weather Prediction (NWP) Method:
To forecast weather, the NWP method makes use of numerical solutions (high speed super computers are generally required for this task) of complex system of mathematical equations or models representing both the physical and dynamical processes occurring in the atmosphere. These models are commonly known as Global Circulation Models (GCMs). In order to integrate the GCM forward in time, the model equations need initialization with precise knowledge of the current state or initial conditions of the atmosphere. To achieve this task, global observations of various atmospheric parameters, for example, temperature, wind speed and direction and humidity, made routinely at standard synoptic hours are usually assimilated into the model using a process known as Variation Analysis. The forecaster interprets these charts for weather forecasting at the locations of interest.
160 161
The National Centre for Medium Range Weather Forecasting (NCMRWF) was established in India under the Department of Science and Technology for issuing weather forecasts in the medium range of. 3 to 10 days in advance.
Learning outcome
Students have learnt the basic principles of map reading and developed skills in understanding the symbols. They have also learnt how to interpret weather maps and forcasting as well.
EXERCISESI. Fill in the Blanks
1. All maps have ______________.
2. Maps are graphic representations that facilitate a _________ understanding of things.
3. Monsoon winds bring ___________ rains.
4. Weather maps are issued everyday, providing a _________ report.
5. In weather interpretation, maps are used to write a __________ of weather conditions existing on a given day.
II. Choose the Correct Answer
6. Monsoons also occur in:
(a) United States (b) Russia
(c) Nigeria (d) Chile
7. Numerical weather predictions use complex systems of mathematical equations known as:
(a) Global circulation models (b) Weather models
(c) Medium range forecasts (d) Climate change models
III. Match the Following8. GCM - Rainfall
9. Isohyets - Pressure systems
10. Isotherms - Weather prediction method
11. Isobars - Temperatures
12. NWP - Complex systems of
mathematical equations
162 163
IV. Brief Answers
13. Name the three basic principles of map interpretation.
14. What is weather?
15. Name the factors that weather and climate depend on?
16. What is a weather map?
17. What is map symbol?
18. What are highs and lows?
19. What is Variation Analysis?
20. What is NCMRWF?
V. Paragraph Answers
21. Write note on the three principles of map reading.
22. Write a note on the map symbols for weather and clouds.
23. What does Coriolis force do to the winds?
24. Write a note on the Conventional Synoptic Weather Fore casting.
25. Describe Numerical Weather Prediction method of weather forecasting.
VI. Detailed Answers
26. Write an essay on the three basic principles of map interpretation.
27. Write in detail about the sequence of learning of map skills.
28. Write an essay on weather maps and their interpretation.
VII. Practical Exercises
29. Using an Indian toposheet, interpret the land use characteristics of the area depicted on the map.
30. Using a weather map, discuss the elements of weather in some detail.
162 163
UNIT VMAP INTERPRETATION AND SURVEYING
LESSON 12SURVEYING
Learning Objectives
Students learn about the process and procedures of surveying and acquire ability to handle survey instruments and develop drawing skills.
Definition of Surveying
In general terms, surveying is to inspect, view, scrutinize or examine that phenomenon that needs to be surveyed. This is done in order to determine the condition of the object surveyed or to assess the situation and learn about the ‘value’ of that which is surveyed. This could be a piece of land, a stretch of road or even a legal parcel of land.
In our context here, survey is a science and art of determining the relative positions of points (locations) above, on or beneath the earth surface. The basic concerns regarding a survey are spaces and locations within them. Survey essentially take note of specific point locations for later reference.
Uses and Importance of Surveying
There are several uses of surveying, notably those given below:
Locating or mapping resources
Engineering design
Layout construction or engineering projects
Verify performance
Acquiring reliable data
Providing control
Usually for location
Surveying Methods and Procedures
There are several surveying methods and procedures. It is inappropriate to write about all specific types of surveying, for they are several and their procedures are complex. Hence, only a list of specific types of surveying is given below.
164 165
Specific Types of Surveying
Property (cadastral) surveying
Control surveying
Mapping surveying (planimetric or topographic)
Photogrammetric surveying
Construction (engineering) surveying
Route surveying
Hydrographic surveying
Prismatic Compass
Prismatic compass survey is one that is used in land surveying. It is also one of the easiest of survey techniques.
The Compass: A compass can be used for:
Measuring the angles in a traverse used for navigation or control purposes. As compasses have relatively poor direction accuracy, they are typically used for reconnaissance surveys.
Factors which Influence Use of Compasses
A linear line of sight between the user and the measured point is needed. A well defined object is required to obtain the maximum precision. The accuracy is highly dependent on other magnetic influences such as electric motors and natural anomalies caused by local geology.
Survey Methods Used
Compasses are used for the measurement of angles.
Traversing
The Compass (Figure 12.1) is an instrument which indicates the whole circle bearing from the magnetic meridian to a particular line of sight. It consists of a needle or disc magnetised so that it will align itself with the direction of the Earth’s magnetic flux, and some type of index scale so that numeric values for the bearing can be determined.
Because the Prismatic Compass is held in the hand for use, and are therefore subject to poor centring and an unstable platform. The effects of this are reduced over long sight lines, which, when combined with the vagaries of the magnetic meridian, combine to make the compass a reconnaissance or inventory tool only. Neither the instruments nor the basis upon which they work are sufficiently stable for any sort of precision work.
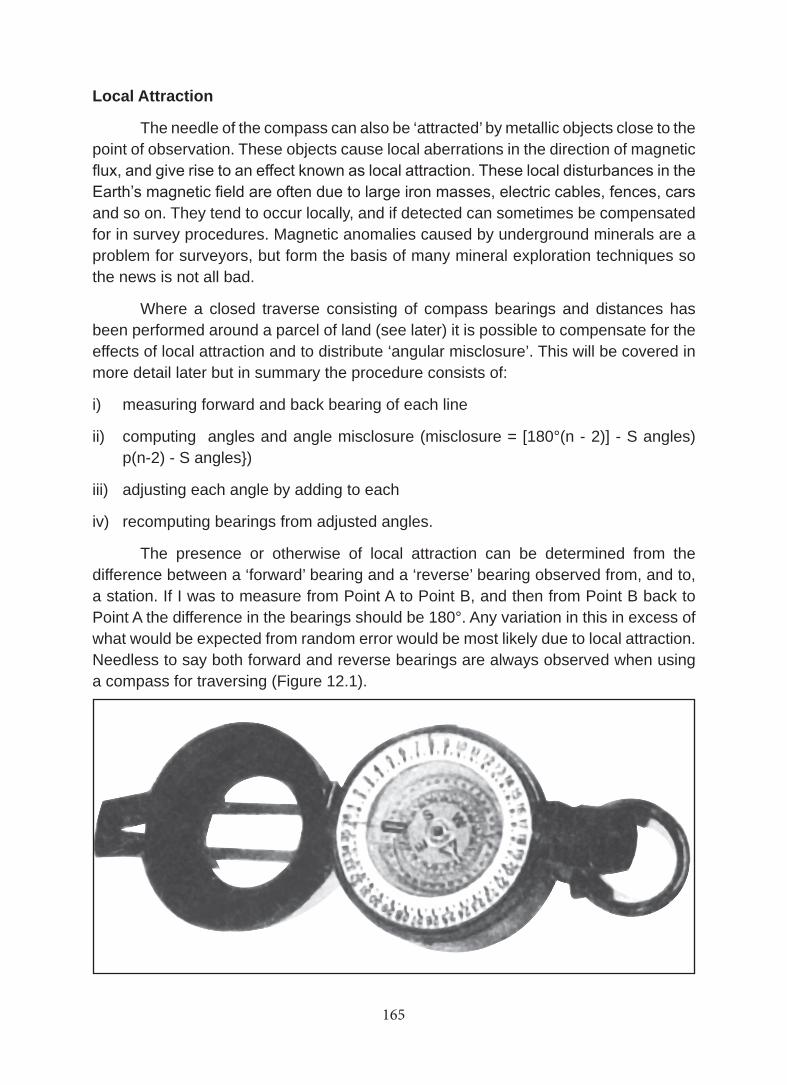
164 165
Local Attraction
The needle of the compass can also be ‘attracted’ by metallic objects close to the point of observation. These objects cause local aberrations in the direction of magnetic flux, and give rise to an effect known as local attraction. These local disturbances in the Earth’s magnetic field are often due to large iron masses, electric cables, fences, cars and so on. They tend to occur locally, and if detected can sometimes be compensated for in survey procedures. Magnetic anomalies caused by underground minerals are a problem for surveyors, but form the basis of many mineral exploration techniques so the news is not all bad.
Where a closed traverse consisting of compass bearings and distances has been performed around a parcel of land (see later) it is possible to compensate for the effects of local attraction and to distribute ‘angular misclosure’. This will be covered in more detail later but in summary the procedure consists of:
i) measuring forward and back bearing of each line
ii) computing angles and angle misclosure (misclosure = [180°(n - 2)] - S angles) p(n-2) - S angles})
iii) adjusting each angle by adding to each
iv) recomputing bearings from adjusted angles.
The presence or otherwise of local attraction can be determined from the difference between a ‘forward’ bearing and a ‘reverse’ bearing observed from, and to, a station. If I was to measure from Point A to Point B, and then from Point B back to Point A the difference in the bearings should be 180°. Any variation in this in excess of what would be expected from random error would be most likely due to local attraction. Needless to say both forward and reverse bearings are always observed when using a compass for traversing (Figure 12.1).
166 167
Conducting a Compass Survey
Equipments required are:
1. 1 Prismatic Compass
2. 4 Ranging Poles.
3. 1 Engineer’s Chain (100 ft or 30 m)
4. 10 Small pegs or arrows for use with chain.
5. 1 Survey field book
6. Pencil
7. Eraser
8. Tripod
9. Linen Tape (50m)
10. Plumb line
11. Optical Square
12. Spirit Level
Pre-Survey Checks
1. Check for compass error.
2. Check for true length of the Chain as this can introduce cumulative errors in measurements.
3. Ensure that you know the current magnetic declination of the area to be surveyed. This is particularly important when going to the field with a forest boundary schedule; as there will always be the need to add to each bearing, the Magnetic Variation or Declination of the area
4. Ensure that the survey is tied to a point or landmark, the co-ordinates of which can be obtained.
If the survey is to be tied to a pre-existing pillar, a tripod is placed above the pillar and a plumb line made to fall vertically above the pinpoint of the pillar. In the absence of a plumb line; (a piece of lead with a tapering end hung to the base of the tripod with a thin piece of thread), a piece of stone is placed at the point of convergence of the legs of the tripod just below the compass, and made to drop freely onto the top of the pillar. If the stone falls right on top of the central pin of the pillar, the tripod may be considered as being vertically above the pillar. The Compass is then fitted to the tripod and balanced horizontally with the aid of the spirit level. A ranging pole is then placed as far from the starting point as is convenient and visible, for the bearing of this pole to be taken from the starting point.
166 167
Never conduct a survey holding the compass in your hand. In the absence of a tripod, a wooden “peg” (monopod) may be cut for use. The length of the monopod is best at breast height of the compass reader. The top of this monopod should be about the size of the base of the compass and made flat for ease of placing the compass on it. Since the monopod cannot be placed conveniently on top the survey pillar, it is fixed directly behind the pillar, with the line of sight passing over the centre of the pillar, usually indicated by a pin. The bearing to the ranging pole is then taken after the compass, resting on the monopod, is levelled. In this case, measurement of the distance should be from the top of the pillar to the ranging pole and not from where the monopod (with compass on it) is positioned.
The tripod or monopod is then moved to the location of the ranging pole and the process repeated. The compass must always shifted to and be placed directly above the location of the ranging pole whose bearing has just been taken, for the next bearing to be taken.
The Magnetic North (MN):
Our Earth has a magnetic axis inclined to the line of longitude, which divides the earth into two equal parts. This magnetic axis is the property that influences the needle of a compass. When a compass needle is allowed to swing freely and settle, it points to the northern pole of this axis, and the direction so indicated is referred to as the Magnetic North. The Magnetic North therefore is the direction of the pole of the earth’s magnetic axis from any point on the earth’s surface as indicated by the freely suspended needle of a compass. It is important to note that the Magnetic North forms the basis for all angular measurements with surveying instruments. Without it, surveying with theodolite and compass would not be possible.
True North (TN)
The direction indicating the pole of the earth’s geographic axis in the Northern Hemisphere is the True North. All other lines referenced to this are referred to as true north bearings (Figure 12.2). The figure below shows the Magnetic North (MN), the True North (TN), the True South, (TS) and the Magnetic South (MS).
The Azimuth
The Azimuth is the smallest bearing to a point measured Eastward or Westward from a particular reference North. Azimuths may be measured either with reference to the Magnetic North or to the True North and referred to as Magnetic North and True North Azimuths respectively. The azimuth begins from 0° or 360° representing North and runs through 90° East, 180° South, 270° West and back to 360° North.
Forward Bearing and Back Bearing
When the bearing of a line is stated in a direction from an original point to a terminal point, it is known as a forward bearing. The back bearing is opposite in
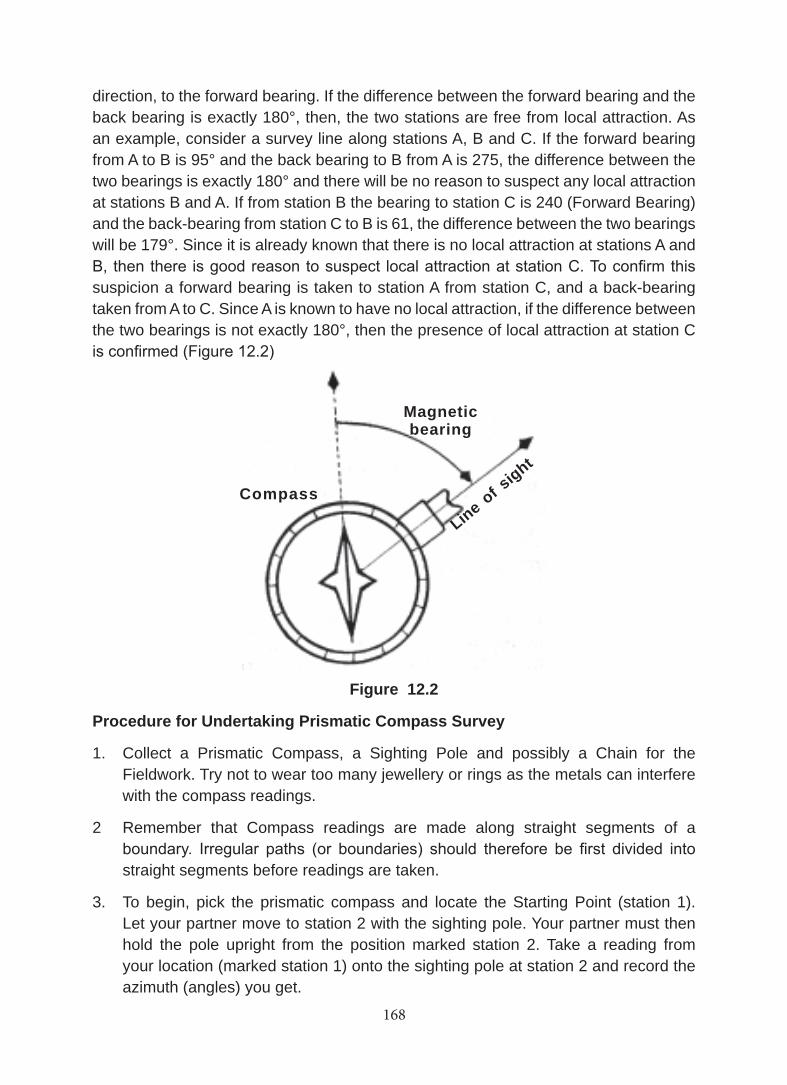
168 169
direction, to the forward bearing. If the difference between the forward bearing and the back bearing is exactly 180°, then, the two stations are free from local attraction. As an example, consider a survey line along stations A, B and C. If the forward bearing from A to B is 95° and the back bearing to B from A is 275, the difference between the two bearings is exactly 180° and there will be no reason to suspect any local attraction at stations B and A. If from station B the bearing to station C is 240 (Forward Bearing) and the back-bearing from station C to B is 61, the difference between the two bearings will be 179°. Since it is already known that there is no local attraction at stations A and B, then there is good reason to suspect local attraction at station C. To confirm this suspicion a forward bearing is taken to station A from station C, and a back-bearing taken from A to C. Since A is known to have no local attraction, if the difference between the two bearings is not exactly 180°, then the presence of local attraction at station C is confirmed (Figure 12.2)
Magneticbearing
Line of sight
Compass
Figure 12.2
Procedure for Undertaking Prismatic Compass Survey
1. Collect a Prismatic Compass, a Sighting Pole and possibly a Chain for the Fieldwork. Try not to wear too many jewellery or rings as the metals can interfere with the compass readings.
2 Remember that Compass readings are made along straight segments of a boundary. Irregular paths (or boundaries) should therefore be first divided into straight segments before readings are taken.
3. To begin, pick the prismatic compass and locate the Starting Point (station 1). Let your partner move to station 2 with the sighting pole. Your partner must then hold the pole upright from the position marked station 2. Take a reading from your location (marked station 1) onto the sighting pole at station 2 and record the azimuth (angles) you get.
168 169
4. To verify whether the forward azimuth reading you made is correct, exchange positions with your partner (or preferably let your partner take a back azimuth onto the sighting pole now located at station 1). As a rule, if the forward azimuth is greater than 180o, you should subtract 180 from the forward azimuth to get the back azimuth but if the forward azimuth is less than 180o you should add 180 to it to get the back azimuth. With the rule, make a quick check of the forward azimuth you made and record it if it is right. If it is wrong, redo the reading all over.
5. Record the forward azimuth you read earlier.
6. Measure the segment of the boundary between station 1 and station 2 and record your answer beside the azimuth reading for this segment. You may use a chain or a tape and remember to take the measurement in feet. In the absence of a chain or a tape, you may take the measurements by pacing along the boundary and counting the number of paces you make. Generally, a pace taken in a relaxed mood (not running) is about a yard (three feet) for many people. If you will use this method, you should first determine the length of your pace by marking three feet segments on the floor and walk along them for some time.
7. Walk along the boundary segment between station 1 and station 2 and make any other required readings such as resection or intersection then record such measurements on the page you have already opened. Make some sketches if necessary, to portray the features and positions you find in the field.
8. Now go to station 2 and let your partner move with the sighting pole to station 3. Take the forward and backward azimuths as explained above and record only the forward azimuth in your survey book. Check to make any required chain and compass readings along the segment between stations 2 and 3 and then move on to the next segment. Continue with the process in the same manner as described until all stations (or segments) are measured and the measurements recorded in your notebook.
9. Keep your note book entries for you shall use it to plot the shape of land you measure in the field. You will also hand in your note book entries for grading.
Booking of the Field Data
Traversing involves taking bearings and distances from one station to the other until the last station is encountered. The survey book has two parallel lines running through the centre of each page. Booking is usually started from the last page of the book and from the bottom to the top of each page. The stations are represented as triangles enclosing serial numbers or letters specific to each station.
The bearing from A to B is recorded at the top of the triangle enclosing A. The distance from A to B is recorded at the base of the Triangle enclosing B. Any feature encountered, such as the footpath or the stream, is sketched at the point it crosses the survey line. Its distance from the previous station is recorded just below the sketch.
170 171
The Magnetic Declination; (MD), of the area of the survey is recorded at the bottom right hand corner, together with the date of completion of the survey and the names of the persons conducting the survey.
Indian Clinometer Survey
This is a simple instrument to measure the height of an object. Briefly explained, if you know the distance ab and the angle A, you can determine the length of side bc (or X). *Tangent is determined from a tangent chart.
Formula: ab x Tangent A = X
Example: If ab = 36 feet
A = 35o x* Tan A = 0.7002
36 feet x 0.7002 = X
X = 25.2072 feet + Height of the man or height of the stole.
*The height is approximately 25 feet.
An Example: Foresters Measure Trees the Smart Way
Calculating how much wood there might be in a forest is a bit like comparison shopping. Foresters do not count and measure every tree in the forest. That would simply take too long. Instead, they sample.
“We use sampling principles every day in our own lives,” says a Forester. If we’re shopping for a stereo, he explains, we can’t always check every price in every store. Instead, we sample a few brands and stores to get an estimate of what’s available.
Similarly, foresters measure a few bits of the forest and, on the basis of those bits, estimate what the whole forest contains. Many of the techniques they use involve little more than careful measuring and some high-school mathematics. The first step is to choose which bits to sample. It is important to avoid picking samples that will give a false picture of the forest. The solution is to choose the sample plots randomly.
You could just throw darts at a map and sample where the darts land but affordable access is important. If your darts land well beyond the reach of roads, costs will soon eat up the sampling budget. Personal bias can be avoided by selecting locations on a map before going out in the field, rather than just walking through the forest and choosing goodlooking trees. But once the locations are chosen, you have to stick with them, no matter what you find when you actually visit them.
“If one of your plots is in a clearing with very few trees, it is tempting to move it to an area with more trees. But you have to remember, that clearing represents lots of other clearings in the forest.” For biological studies, the most common approach to estimating the amount of wood is called a fixed area plot. The plots can be any shape,
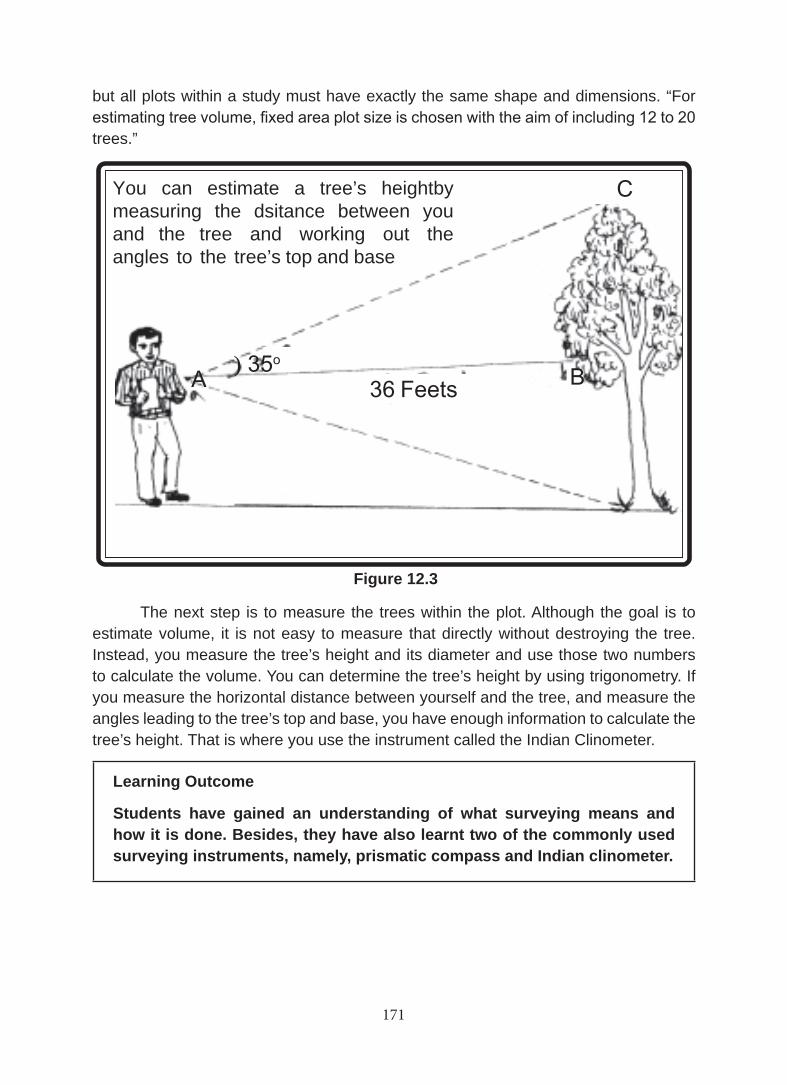
170 171
but all plots within a study must have exactly the same shape and dimensions. “For estimating tree volume, fixed area plot size is chosen with the aim of including 12 to 20 trees.”
You can estimate a tree’s heightby measuring the dsitance between you and the tree and working out the angles to the tree’s top and base
A B36 Feets) 35o
C
The next step is to measure the trees within the plot. Although the goal is to estimate volume, it is not easy to measure that directly without destroying the tree. Instead, you measure the tree’s height and its diameter and use those two numbers to calculate the volume. You can determine the tree’s height by using trigonometry. If you measure the horizontal distance between yourself and the tree, and measure the angles leading to the tree’s top and base, you have enough information to calculate the tree’s height. That is where you use the instrument called the Indian Clinometer.
Learning Outcome
Students have gained an understanding of what surveying means and how it is done. Besides, they have also learnt two of the commonly used surveying instruments, namely, prismatic compass and Indian clinometer.
Figure 12.3
172 173
EXERCISESI. Brief Answers
1. What is surveying?
2. Name three specific types of surveying?
3. What is a compass?
4. What is an Indian Clinometer?
5. What is traversing?
II. Paragraph Answers
6. Write a note on the uses and importance of surveying.
7. What is meant by local attractions? What do they do?
8. List the equipments required for conducting prismatic compass survey.
9. What are pre-survey checks?
10. What is Magnetic North?
11. What is True North?
12. What is Azimuth?
13. What are forward and back bearings and how are they measured?
14. How is height measured using Indian Clinometer?
III. Detailed Answers
15. Write the step-wise procedure for undertaking prismatic compass survey.
16. Write about booking of the field data.
17. How do foresters measure volume of trees the smart way?
IV. Practical Exercises
18. Visit a surveyors’ office nearby. If not possible, visit a local surveyor to discuss with him about surveying and survey instruments.
19. Teachers find a surveyor or an engineer who is knowledgeable about surveying for a talk with the students.
172 173
UNIT 6GEOGRAPHICAL INFORMATION SYSTEMS
LESSON 13DATABASE MANAGEMENT SYSTEMS
AND GEOGRAPHICAL INFORMATION SYSTEMS
Learning Objectives
Students learn to be able and understand technological capabilities within geography through database management systems and geographical information systems
In the 1980s, Geographical Information Systems have been at the forefront of geographical innovations. GIS, for short, the geographical information systems have operationalised spatial analysis, especially mapping, with the help of the computers. There are efforts in very many countries towards extension of the GIS. Although we are unaware of the significance of the GIS in the school geographical studies, there is a quite revolution in the making as for GISs are concerned, at the higher levels.
Geographical Information Systems have come into use in research centres and the universities in India. Using them as the basic approach to research, a number of good projects have already begun. Similarly, there are efforts underway to make the GIS simple and easy to handle while at the same time improve the existing ones in terms of applications. Let us see what these GISs are and to what use they could be put to.
What is Geographical Information System?
You need an elaborate answer for this question. Geographers, practitioners and students alike, have the ability and skill to map the landscapes in simple and aesthetic formats for use and applications. Maps, which have been in use for centuries, are now being constructed by instruments with the same simplicity but much more aesthetics. With the developments in computers and computer science (graphics), it has become possible to draw maps with great accuracy (figure 13.1)
Today, there are more than 3,000 geographical software packages in use. They are generally called ‘Geographical Information Systems’. They have been implemented in different platforms. There are two operational systems in computers. One is called DOS (Disk Operating System) and the other is called UNIX. There is a third operating system known as the WINDOWS, which is very popular in India. These are indeed approaches to keeping computers operational. Geographical Information Systems
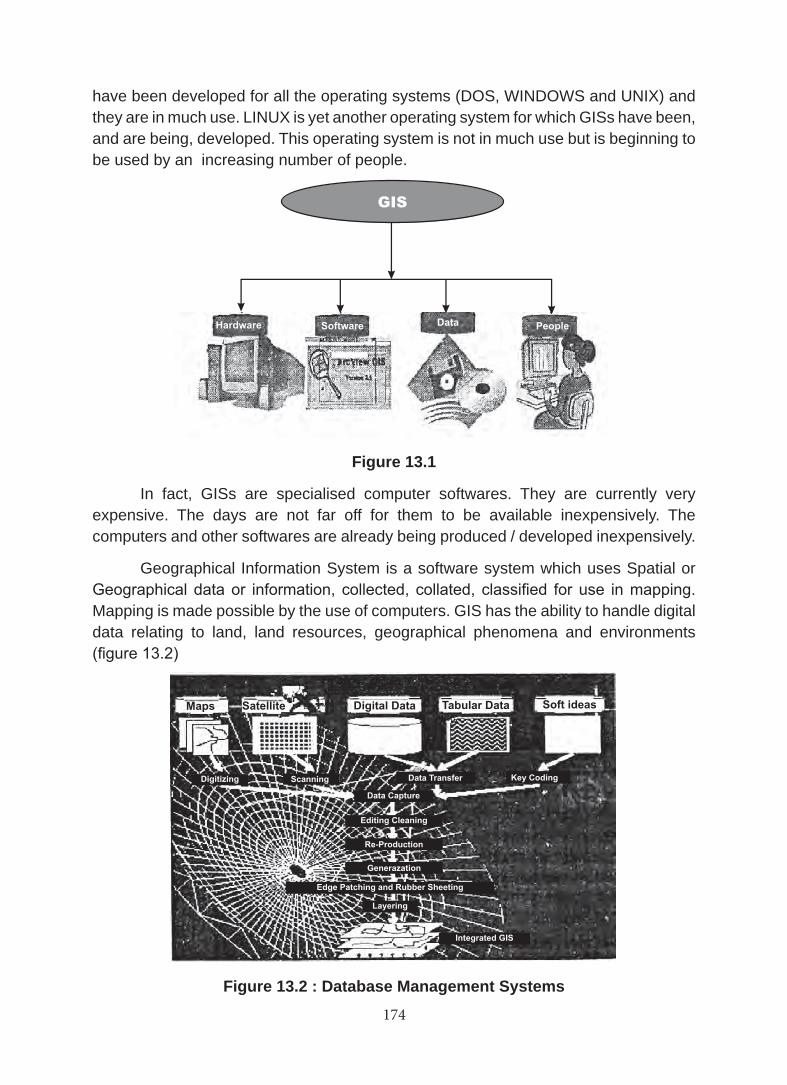
174 175
have been developed for all the operating systems (DOS, WINDOWS and UNIX) and they are in much use. LINUX is yet another operating system for which GISs have been, and are being, developed. This operating system is not in much use but is beginning to be used by an increasing number of people.
Figure 13.1
In fact, GISs are specialised computer softwares. They are currently very expensive. The days are not far off for them to be available inexpensively. The computers and other softwares are already being produced / developed inexpensively.
Geographical Information System is a software system which uses Spatial or Geographical data or information, collected, collated, classified for use in mapping. Mapping is made possible by the use of computers. GIS has the ability to handle digital data relating to land, land resources, geographical phenomena and environments (figure 13.2)
Figure 13.2 : Database Management Systems
174 175
Database Management Systems
Databases
Software package is a programme, which is used in a computer to carry out a specific task. For such softwares as the GISs, computer is most basic. In the same vein, statistics is also one of the important basics. In geographical information system, boundaries, places and attribute data are all important. It is on their basis that mapping is done using computers.
Spatial Databases
Let us consider, for example, that we need a population density map. To map it, we should learn to use three basic aspects:
1. Area and boundaries of the map,
2. Data on densities by areas or (by the basic unit of organisation), and
3. Scale of the map.
The map to be drawn with the assistance of computer must first be converted into a computer database. In this database, the boundaries are very important. These boundaries have to be filled into the database as lines or arcs and polygons. The digital data (of places and boundaries) must be given their identities known simply as ‘labels’ and entered into the database. Let us suppose the map we wish to draw relates to a district. The district map will have district boundaries, taluk boundaries and names of the taluks as fundamental data. If we fill these details into the databases, we create a spatially referenced database.
Digitizer
The database so created is known as the spatial database. This may be created in two ways:
1. by generating a database using a computer or
2. by generating a digital database from the boundaries and areas or places using an equipment.
This equipment which can convert points, lines and polygons into a digital database is known as a ‘digitizing table’.
Once a computerised spatial database consisting of points, lines and polygons data is created, the next step is to create an attribute database for the same area. The one important activity we must keep in mind is that labels for polygons must be filled in both the databases (digital and attribute) so that the two databases could be linked. Labels help with the relations to be established while mapping. In some cases, the two databases can be created using a relational database management system (RDBMS).
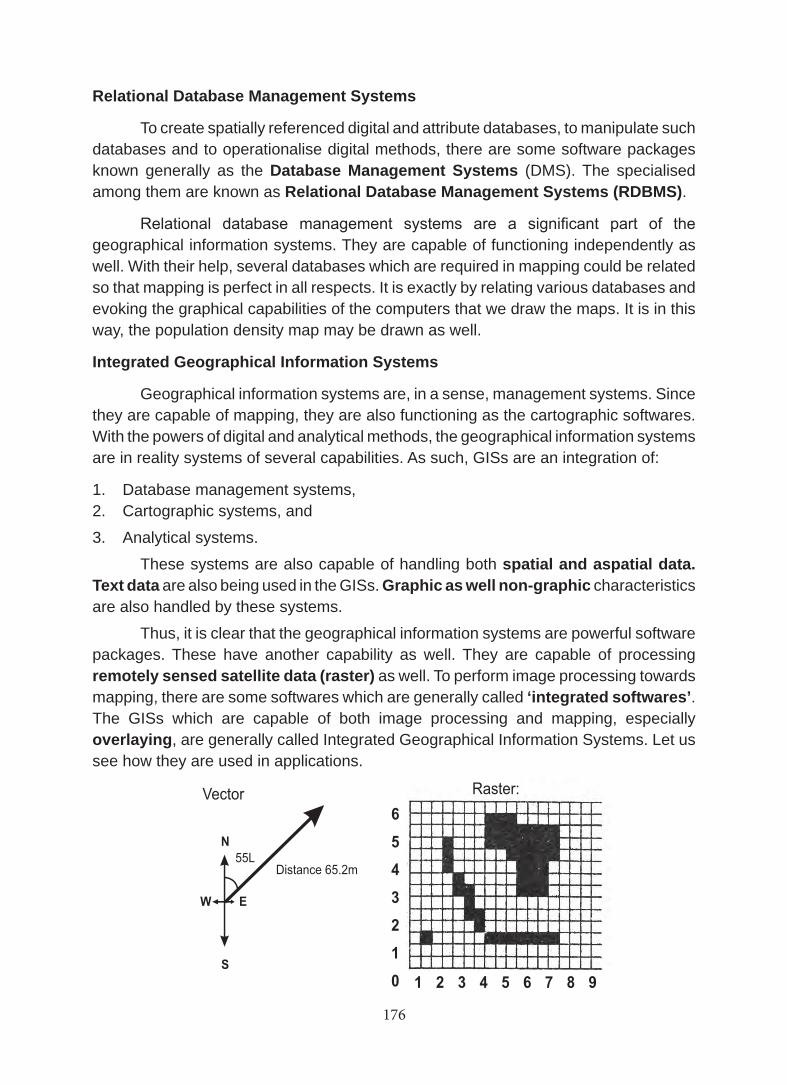
176 177
Relational Database Management Systems
To create spatially referenced digital and attribute databases, to manipulate such databases and to operationalise digital methods, there are some software packages known generally as the Database Management Systems (DMS). The specialised among them are known as Relational Database Management Systems (RDBMS).
Relational database management systems are a significant part of the geographical information systems. They are capable of functioning independently as well. With their help, several databases which are required in mapping could be related so that mapping is perfect in all respects. It is exactly by relating various databases and evoking the graphical capabilities of the computers that we draw the maps. It is in this way, the population density map may be drawn as well.
Integrated Geographical Information Systems
Geographical information systems are, in a sense, management systems. Since they are capable of mapping, they are also functioning as the cartographic softwares. With the powers of digital and analytical methods, the geographical information systems are in reality systems of several capabilities. As such, GISs are an integration of:
1. Database management systems,2. Cartographic systems, and
3. Analytical systems.
These systems are also capable of handling both spatial and aspatial data. Text data are also being used in the GISs. Graphic as well non-graphic characteristics are also handled by these systems.
Thus, it is clear that the geographical information systems are powerful software packages. These have another capability as well. They are capable of processing remotely sensed satellite data (raster) as well. To perform image processing towards mapping, there are some softwares which are generally called ‘integrated softwares’. The GISs which are capable of both image processing and mapping, especially overlaying, are generally called Integrated Geographical Information Systems. Let us see how they are used in applications.
Vector Raster:
Distance 65.2m
N
S
W E
55L
6
5
4
3
2
1
0 1 2 3 4 5 6 7 8 9
Customer
Buildings
Streets
Reality
Figure 13.3 : Vector and Raster Data and Overlay
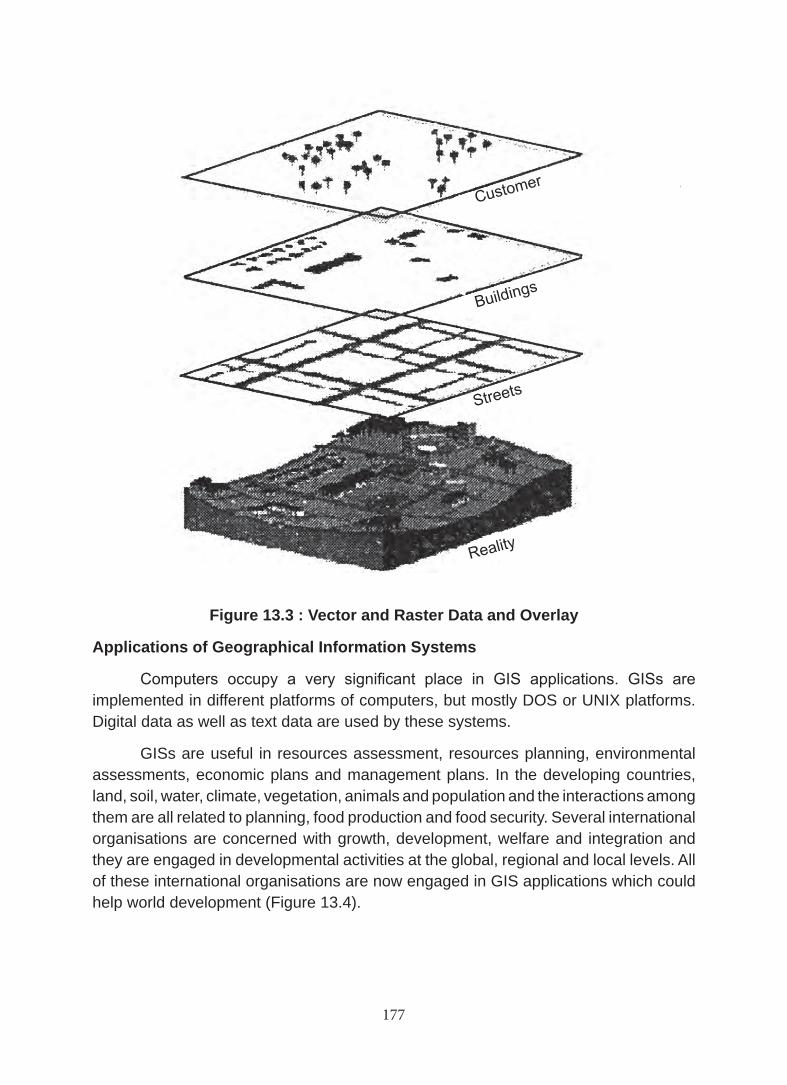
176 177
Vector Raster:
Distance 65.2m
N
S
W E
55L
6
5
4
3
2
1
0 1 2 3 4 5 6 7 8 9
Customer
Buildings
Streets
Reality
Figure 13.3 : Vector and Raster Data and OverlayFigure 13.3 : Vector and Raster Data and Overlay
Applications of Geographical Information Systems
Computers occupy a very significant place in GIS applications. GISs are implemented in different platforms of computers, but mostly DOS or UNIX platforms. Digital data as well as text data are used by these systems.
GISs are useful in resources assessment, resources planning, environmental assessments, economic plans and management plans. In the developing countries, land, soil, water, climate, vegetation, animals and population and the interactions among them are all related to planning, food production and food security. Several international organisations are concerned with growth, development, welfare and integration and they are engaged in developmental activities at the global, regional and local levels. All of these international organisations are now engaged in GIS applications which could help world development (Figure 13.4).
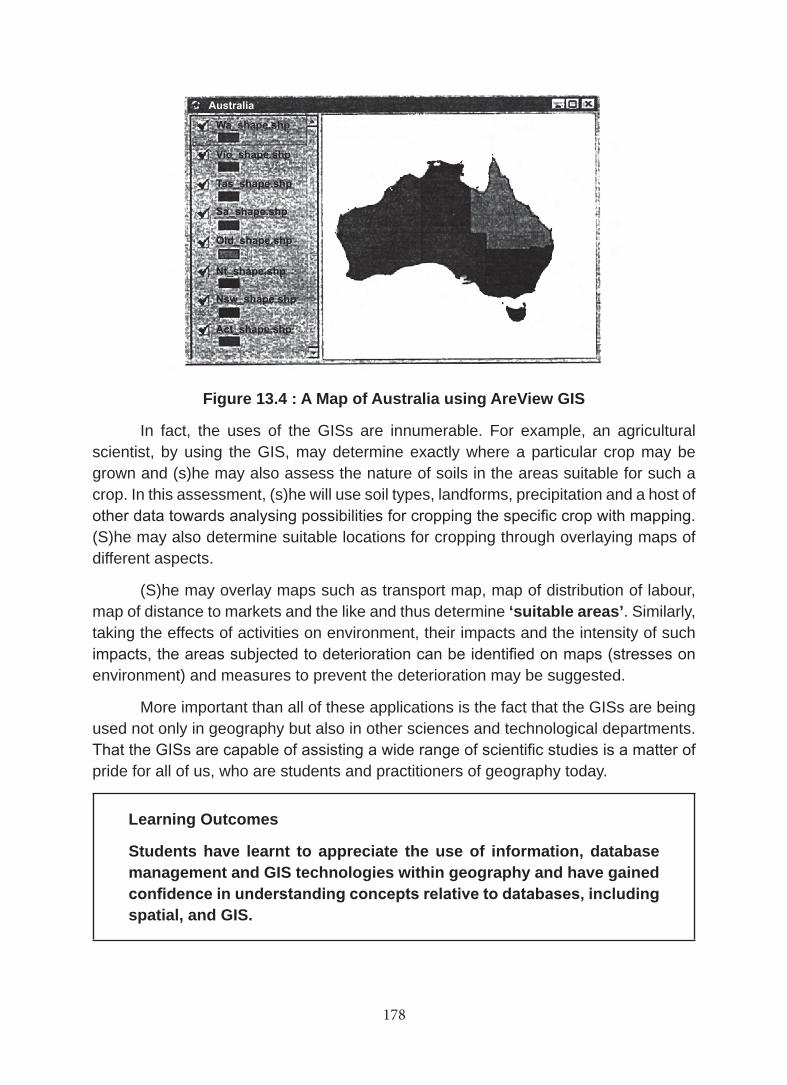
178 179
Figure 13.4 : A Map of Australia using AreView GIS
In fact, the uses of the GISs are innumerable. For example, an agricultural scientist, by using the GIS, may determine exactly where a particular crop may be grown and (s)he may also assess the nature of soils in the areas suitable for such a crop. In this assessment, (s)he will use soil types, landforms, precipitation and a host of other data towards analysing possibilities for cropping the specific crop with mapping. (S)he may also determine suitable locations for cropping through overlaying maps of different aspects.
(S)he may overlay maps such as transport map, map of distribution of labour, map of distance to markets and the like and thus determine ‘suitable areas’. Similarly, taking the effects of activities on environment, their impacts and the intensity of such impacts, the areas subjected to deterioration can be identified on maps (stresses on environment) and measures to prevent the deterioration may be suggested.
More important than all of these applications is the fact that the GISs are being used not only in geography but also in other sciences and technological departments. That the GISs are capable of assisting a wide range of scientific studies is a matter of pride for all of us, who are students and practitioners of geography today.
Learning Outcomes
Students have learnt to appreciate the use of information, database management and GIS technologies within geography and have gained confidence in understanding concepts relative to databases, including spatial, and GIS.
178 179
EXERCISESI. Brief Answers
1. What are the two important approaches to keeping the computers in use?
2. What are the two ways in which spatially referenced data bases could be generated?
3. Describe the usefulness of relational database management systems (RDBMS)?
4. What are Geographical Information Systems?
II. Paragraph Answers
5. Explain the methods of mapping using spatially referenced databases?
6. Describe the uses of GIS.
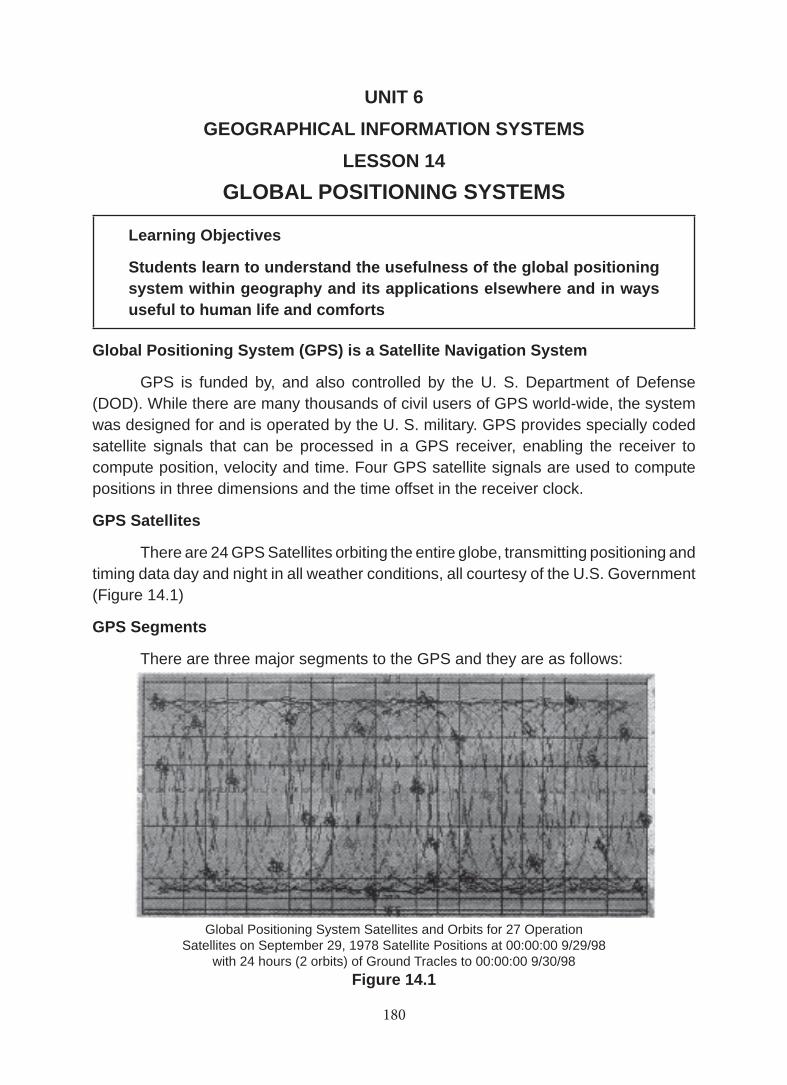
180 181
UNIT 6GEOGRAPHICAL INFORMATION SYSTEMS
LESSON 14GLOBAL POSITIONING SYSTEMS
Learning Objectives
Students learn to understand the usefulness of the global positioning system within geography and its applications elsewhere and in ways useful to human life and comforts
Global Positioning System (GPS) is a Satellite Navigation System
GPS is funded by, and also controlled by the U. S. Department of Defense (DOD). While there are many thousands of civil users of GPS world-wide, the system was designed for and is operated by the U. S. military. GPS provides specially coded satellite signals that can be processed in a GPS receiver, enabling the receiver to compute position, velocity and time. Four GPS satellite signals are used to compute positions in three dimensions and the time offset in the receiver clock.
GPS Satellites
There are 24 GPS Satellites orbiting the entire globe, transmitting positioning and timing data day and night in all weather conditions, all courtesy of the U.S. Government (Figure 14.1)
GPS Segments
There are three major segments to the GPS and they are as follows:
Global Positioning System Satellites and Orbits for 27 OperationSatellites on September 29, 1978 Satellite Positions at 00:00:00 9/29/98
with 24 hours (2 orbits) of Ground Tracles to 00:00:00 9/30/98Figure 14.1
180 181
1. Space Segment: The Space Segment of the system consists of the GPS satellites. These space vehicles (SVs) send radio signals from space
2. Control Segment: The Control Segment consists of a system of tracking stations located around the world. Master Control Facility is located at Schriever Air Force Base (formerly Falcon AFB) in Colorado. These monitor stations measure signals from the SVs which are incorporated into orbital models for each satellite. The models compute precise orbital data (ephemeris) and SV clock corrections for each satellite. The Master Control Station uploads ephemeris and clock data to the SVs. The SVs then send subsets of the orbital ephemeris data to GPS receivers over radio signals.
3. User Segment: The GPS User Segment consists of the GPS receivers and the user community. GPS receivers convert SV signals into position, velocity, and time estimates. Four satellites are required to compute the four dimensions of X, Y, Z (position) and T (time). GPS receivers are used for navigation, positioning, time dissemination, and other research. Navigation in three dimensions is the primary function of GPS. Navigation receivers are made for aircraft, ships, ground vehicles, and for hand carrying by individuals. Precise positioning is possible using GPS receivers at reference locations providing corrections and relative positioning data for remote receivers. Surveying, geodetic control, and plate tectonic studies are examples.
Time and frequency dissemination, based on the precise clocks on board the SVs and controlled by the monitor stations, is another use for GPS. Astronomical observatories, telecommunications facilities, and laboratory standards can be set to precise time signals or controlled to accurate frequencies by special purpose GPS receivers. Research projects have used GPS signals to measure atmospheric parameters.
GPS Error Sources
GPS errors are a combination of noise, bias and blunders.
Noise, Bias, and Blunders
Noise errors are the combined effect of PRN code noise (around 1 metre) and noise within the receiver noise (around 1 metre). Bias errors result from Selective Availability and other factors.
Selective Availability (SA)
SA is the intentional degradation of the SPS signals by a time varying bias. SA is controlled by the DOD to limit accuracy for non-U. S. military and government users. The potential accuracy of the C/A code of around 30 metres is reduced to 100 metres (two standard deviations). The SA bias on each satellite signal is different, and so the resulting position solution is a function of the combined SA bias from each SV used
182 183
in the navigation solution. Because SA is a changing bias with low frequency terms in excess of a few hours, position solutions or individual SV pseudo-ranges cannot be effectively averaged over periods shorter than a few hours. Differential corrections must be updated at a rate less than the correlation time of SA (and other bias errors).
Other Bias Error Sources: SV clock errors uncorrected by Control Segment can result in one meter errors: Ephemeris data errors: 1 metre and Tropospheric delays: 1 metre. The troposphere is the lower part (ground level to from 8 to 13 km) of the atmosphere that experiences the changes in temperature, pressure, and humidity associated with weather changes. Complex models of tropospheric delay require estimates or measurements of these parameters.
Unmodelled ionospheric delays: 10 metres. The ionosphere is the layer of the atmosphere from 50 to 500 km that consists of ionized air. The transmitted model can only remove about half of the possible 70 ions of delay leaving a ten metre un-modelled residual.
Multipath: 0.5 metres. Multipath is caused by reflected signals from surfaces near the receiver that can either interfere with or be mistaken for the signal that follows the straight line path from the satellite. Multipath is difficult to detect and sometime hard to avoid.
Blunders: They can result in errors of hundred of kilometres. Control segment mistakes due to computer or human error can cause errors from one meter to hundreds of kilometres. User mistakes, including incorrect geodetic datum selection, can cause errors from 1 to hundreds of metres.
Receiver errors from software or hardware failures can cause blunder errors of any size. Noise and bias errors combine, resulting in typical ranging errors of around fifteen metres for each satellite used in the position solution.
Carrier Phase Tracking (Surveying): An Application of GPS
Carrier-phase tracking of GPS signals has resulted in a revolution in land surveying. A line of sight along the ground is no longer necessary for precise positioning. Positions can be measured up to 30 km from reference point without intermediate points. This use of GPS requires specially equipped carrier tracking receivers.
The L1 and/or L2 carrier signals are used in carrier phase surveying. L1 carrier cycles have a wavelength of 19 centimetres. If tracked and measured these carrier signals can provide ranging measurements with relative accuracies of millimetres under special circumstances.
Tracking carrier phase signals provides no time for transmission information. The carrier signals, while modulated with time tagged binary codes, carry no time-tags that distinguish one cycle from another. The measurements used in carrier phase tracking are differences in carrier phase cycles and fractions of cycles over time. At
182 183
least two receivers track carrier signals at the same time. Ionospheric delay differences at the two receivers must be small enough to insure that carrier phase cycles are properly accounted for. This usually requires that the two receivers be within about 30 km of each other.
Carrier phase is tracked at both receivers and the changes in tracked phase are recorded over time in both receivers. All carrierphase tracking is differential, requiring both a reference and remote receiver tracking carrier phases at the same time. Unless the reference and remote receivers use L1-L2 differences to measure the ionospheric delay, they must be close enough to insure that the ionospheric delay difference is less than a carrier wavelength. Using L1-L2 ionospheric measurements and long measurement averaging periods, relative positions of fixed sites can be determined over baselines of hundreds of kilometres.
Phase difference changes in the two receivers are reduced using software to differences in three position dimensions between the reference station and the remote receiver. High accuracy range difference measurements with sub-centimetre accuracy are possible. Problems result from the difficulty of tracking carrier signals in noise or while the receiver moves. Two receivers and one SV over time result in single difference.
Automatic Vehicle Location, A Tracking Technology Example
Automatic Vehicle Location (AVL) is a technology used for tracking vehicles, vessels, and mobile assets such as trailers, containers, and equipment. Each mobile unit has a GPS receiver that reports its position to the base station over a communications network. This allows the base station to monitor the entire fleet and manage the mobile assets.
Mobile GPS Unit
In each vehicle you need a GPS receiver to track the satellites and calculate your position. But actually Trimble’s mobile GPS units do a lot more than just that. Altogether they:
Receive GPS satellite signals.
Calculate your position, speed, heading and altitude.
Make adjustments for Differential GPS and/or Dead Reckoning.
Communicate with the base station - using either built-in communications or interfacing with an external radio.
Use the IQ Event Engine to decide when to report.
Log data.
Receive the precise time (the satellites use atomic clocks).
184 185
Communications Network
You need some sort of communications network so that the vehicle can transmit its position and other information to the base station. The communication goes both ways so that the base station can check the status of its vehicles and perhaps send new instructions for the IQ Event Engine.
Base Station Software
The base station needs a computer system and software to handle all the position reports and communications. Altogether it:
Manages communications over the communications network.
Processes position & status reports from all the vehicles.
Displays the vehicles on a map in real time.
Logs data, which can later be replayed and analyzed.
Sends instructions to vehicles for the IQ Event Engine.
Interfaces with 3rd party software for extended functionality.
Learning Outcome
Students have learned through this lesson that GPS can be an effective tool in geographical surveys and have also learned to appreciate how it can be used in certain useful applications.
EXERCISESI. Brief Answers
1. What is GPS and what is its purpose?
2. Name the GPS Segments and write briefly about each one of them.
3. What is the use of a mobile GPS unit?
4. What do we mean by a Base Station Software?
5. What are GPS errors and what do we understand by noise, bias and blunder?
II. Detailed Answers
6. Discuss Automatic Vehicle Location (AVL) and tell us about the technology.
7. How do we use GPS for determining position and time?
8. Write in detail about one of the applications of GPS.
9. What are the ways in which GPS could be made to function?
10. What are the GPS Error Sources?

184 185

186 PB