Embed Size (px)
Citation preview

Geologic model for the giant Hugoton and Panoma Fields
upscale porosity
Martin K. DuboisAlan P. Byrnes Geoffrey C. Bohling
Midcontinent AAPG, Oklahoma City September 13, 2005
Objectives of modeling project
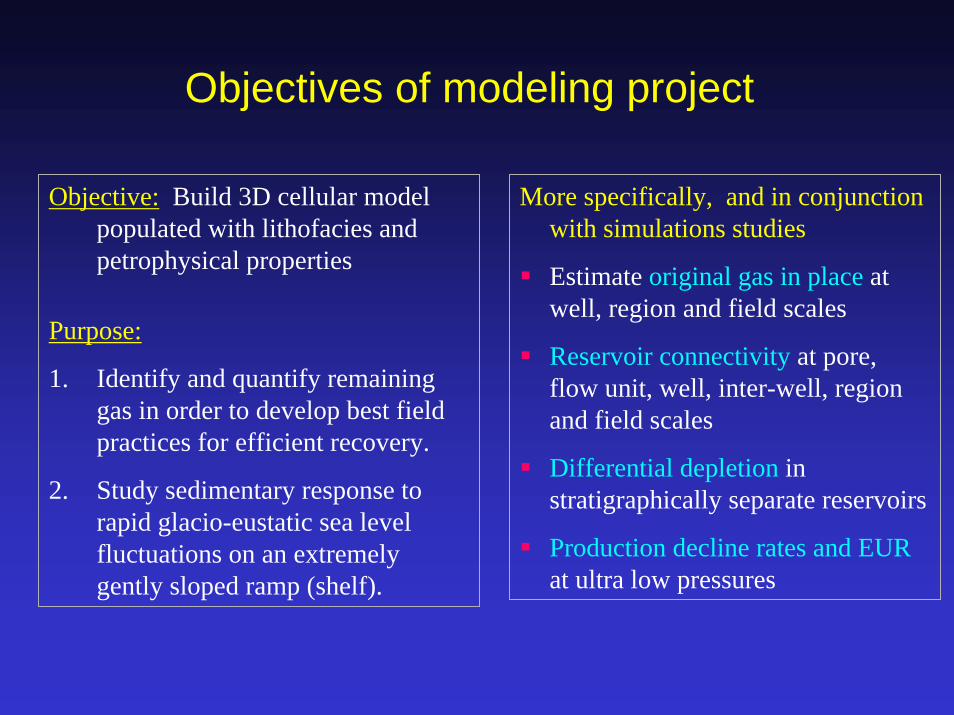
Objective: Build 3D cellular model populated with lithofacies and petrophysical properties
Purpose:
1. Identify and quantify remaining gas in order to develop best field practices for efficient recovery.
2. Study sedimentary response to rapid glacio-eustatic sea level fluctuations on an extremely gently sloped ramp (shelf).
More specifically, and in conjunction with simulations studies
Estimate original gas in place at well, region and field scales
Reservoir connectivity at pore, flow unit, well, inter-well, region and field scales
Differential depletion in stratigraphically separate reservoirs
Production decline rates and EURat ultra low pressures
Status and outline
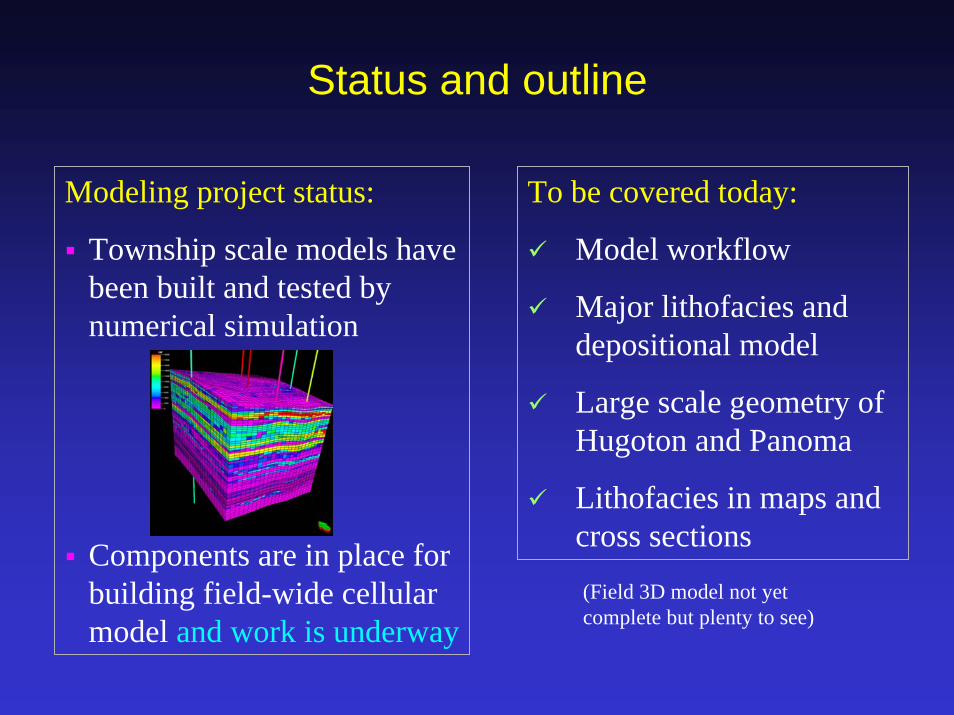
Modeling project status:
Township scale models have been built and tested by numerical simulation
Components are in place for building field-wide cellular model and work is underway
To be covered today:
Model workflow
Major lithofacies and depositional model
Large scale geometry of Hugoton and Panoma
Lithofacies in maps and cross sections(Field 3D model not yet complete but plenty to see)

Hugoton and Panoma Stratigraphy
130
Mile
s
Ch a
se G
r oup
(Hug
o ton
)C
ounc
il G
rove
Gp.
(Pan
oma)
Thinly layered, alternating carbonate and siltstone reservoir in 13 marine-nonmarinesedimentary cycles
HerringtonKrider
Winfield
Towanda
Ft Riley
FlorenceWreford
FunstonCrouseMiddleburgEissMorrillCottonwoodNeva
550
ft
Wol
fcam
pian
L. Permian
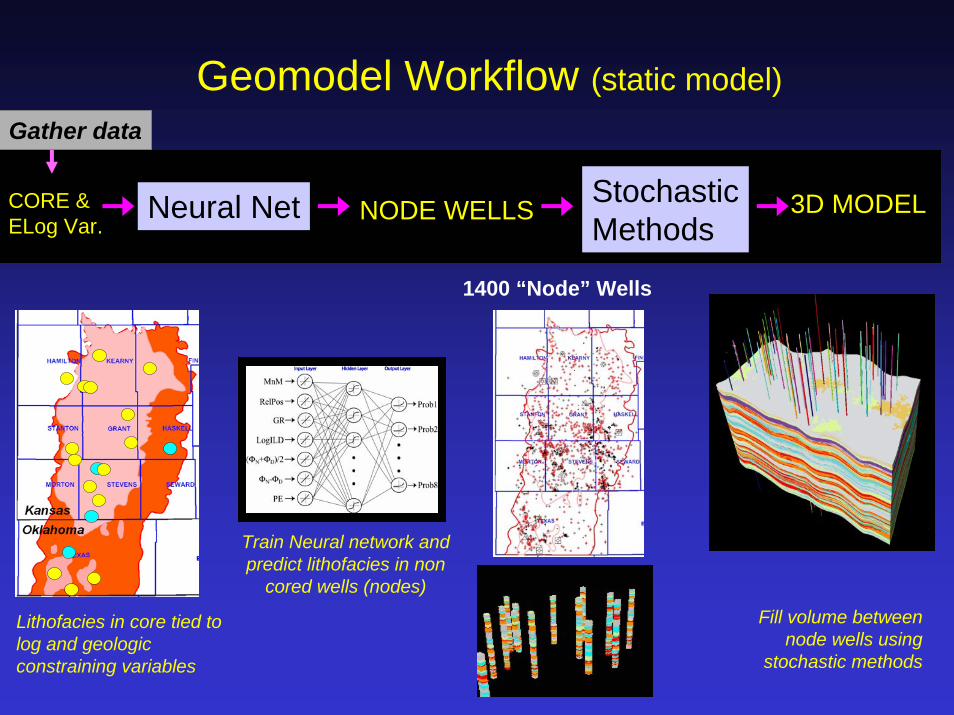
Geomodel Workflow (static model)
CORE & ELog Var.
Neural Net NODE WELLS StochasticMethods
3D MODEL
Gather data
1400 “Node” Wells
Train Neural network and predict lithofacies in non
cored wells (nodes)Fill volume between
node wells using stochastic methods
Lithofacies in core tied to log and geologic constraining variables
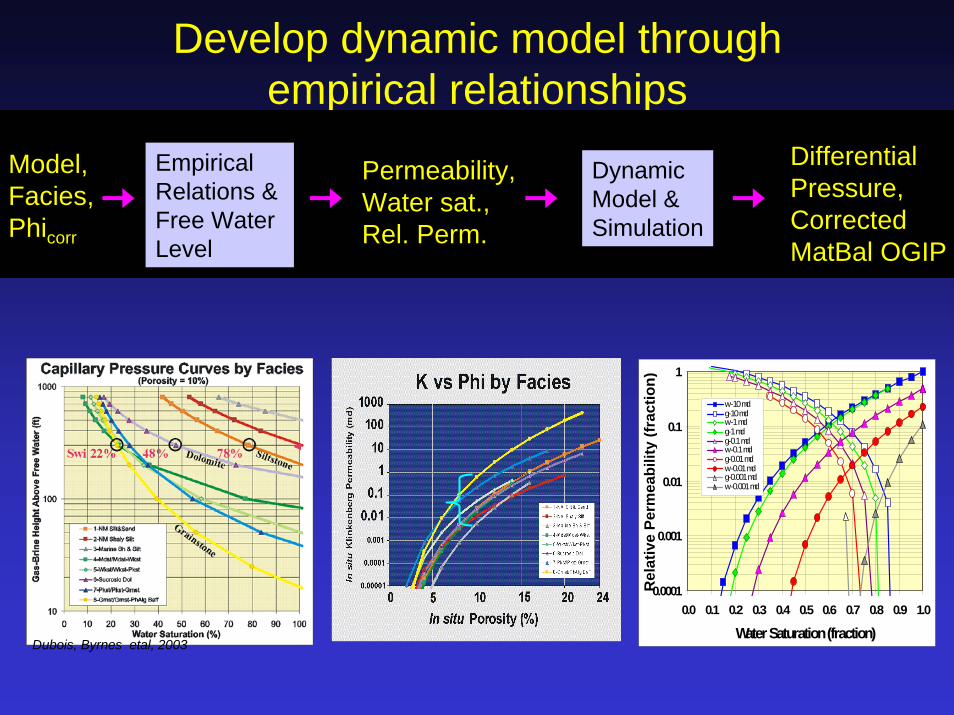
Develop dynamic model through empirical relationships
Model,Facies,Phicorr
EmpiricalRelations & Free WaterLevel
Permeability,Water sat.,Rel. Perm.
Dynamic Model &Simulation
Differential Pressure,CorrectedMatBal OGIP
Dubois, Byrnes etal, 2003
0.0001
0.001
0.01
0.1
1
0.0 0.1 0.2 0.3 0.4 0.5 0.6 0.7 0.8 0.9 1.0
Water Saturation (fraction)R
elat
ive
Perm
eabi
lity
(frac
tion)
w-10 mdg-10 mdw-1 mdg-1 mdg-0.1 mdw-0.1 mdg-0.01 mdw-0.01 mdg-0.001 mdw-0.001 md

Lithofacies from Core to “Node” Wells
Well count
1/2 foot intervals
Chase8 3952
CouncilGrove
10 4593
Training set for neural network lithofacies prediction
Current training setOther
Some wells have both Chase and Council Grove core
80 mi130 km
130 mi
210 km
27 m
i43
km
8545 ½-foot intervals with lithofacies tied to log and core properties
Lithofacies predicted at 1369 “node wells”
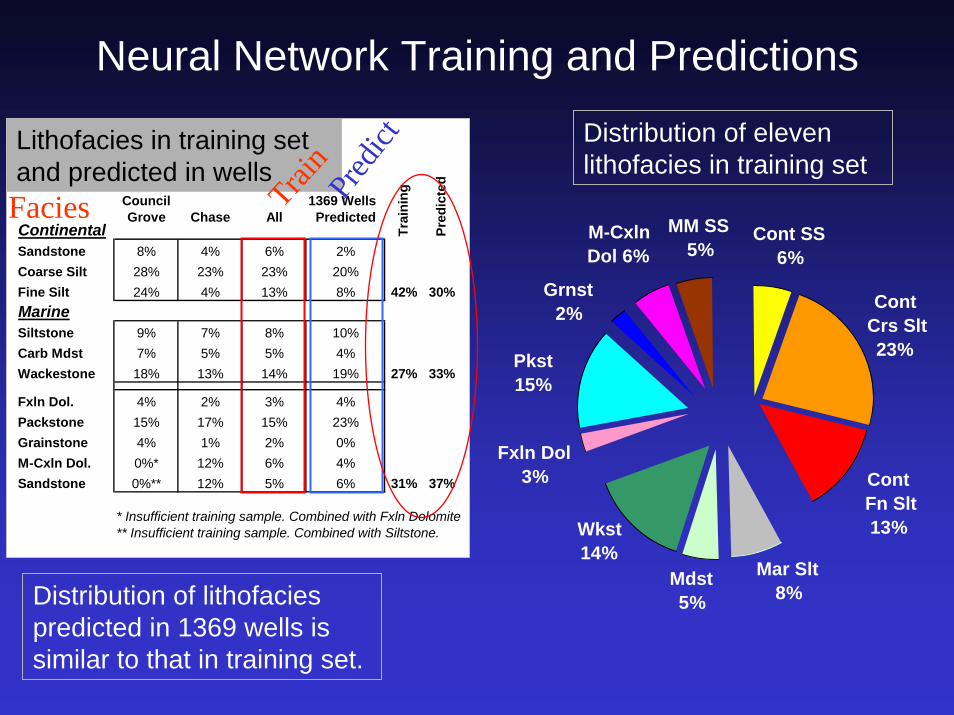
Neural Network Training and Predictions
Mar Slt8%
Mdst5%
Wkst14%
Cont Crs Slt23%
Cont Fn Slt13%
Cont SS6%
Fxln Dol3%
Pkst15%
Grnst2%
M-CxlnDol 6%
MM SS5%
Distribution of eleven lithofacies in training set
Council 1369 Wells
ContinentalGrove Chase All Predicted
Sandstone 8% 4% 6% 2%Coarse Silt 28% 23% 23% 20%Fine Silt 24% 4% 13% 8% 42% 30%MarineSiltstone 9% 7% 8% 10%Carb Mdst 7% 5% 5% 4%Wackestone 18% 13% 14% 19% 27% 33%
Fxln Dol. 4% 2% 3% 4%Packstone 15% 17% 15% 23%Grainstone 4% 1% 2% 0%M-Cxln Dol. 0%* 12% 6% 4%Sandstone 0%** 12% 5% 6% 31% 37%
* Insufficient training sample. Combined with Fxln Dolomite** Insufficient training sample. Combined with Siltstone.
Trai
ning
Pred
icte
d
Lithofacies in training set and predicted in wells
Train
Pred
ict
Facies
Distribution of lithofacies predicted in 1369 wells is similar to that in training set.

Council Grove
Lithofacies
Tidal Flat
Co astal Pl ain
Lagoo
n
Ph yl. Algal M ound
Ide aliz ed De pos ition al Mo del (Mo dified a fter Rese rvoirs, I nc.)
100’s KM (1 00’s M iles)
(time slice)
Close-up Core Slab
0.5 mm
Thin Section Photomicrograph
M-CG Oncoid-PeloidPackstone
Cm21.2%32.3 md
L7
0.5 mm
Thin Section Photomicrograph
Close-up Core Slab
Dolomite13.9%1.1 md
Cm
L6
Thin Section Photomicrograph
0.5 mm L8
Pellet Grainstone
Close-up Core Slab
13.0%2.53 md
Phyloid Algal Bafflestone
20.6%1141 md
Core Slab
L8 0.5 mm
Thin Section Photomicrograph
Nonmarine Crs Siltstone-vfg SS
10.8%0.30 md
Close-up Core Slab
L0
Nonmarine Shaly Siltstone
Core Slab
Cm
0.5 mm
T h i n S e c t i o n Photomicrograph
4.6%0.000024 md
L1-2
0.5 mm Close-up Core Slab
Thin Section Photomicrograph Skeletal Wackestone
2.1%0.11 md
L5
10.4 %0.01 md
Core Slab
Marine Siltstone
0.5 mm
Thin Section Photomicrograph
L3
0.5 mm
Thin Section Photomicrograph
L4
Silty WackestoneCore Slab
3.4%0.0024 md
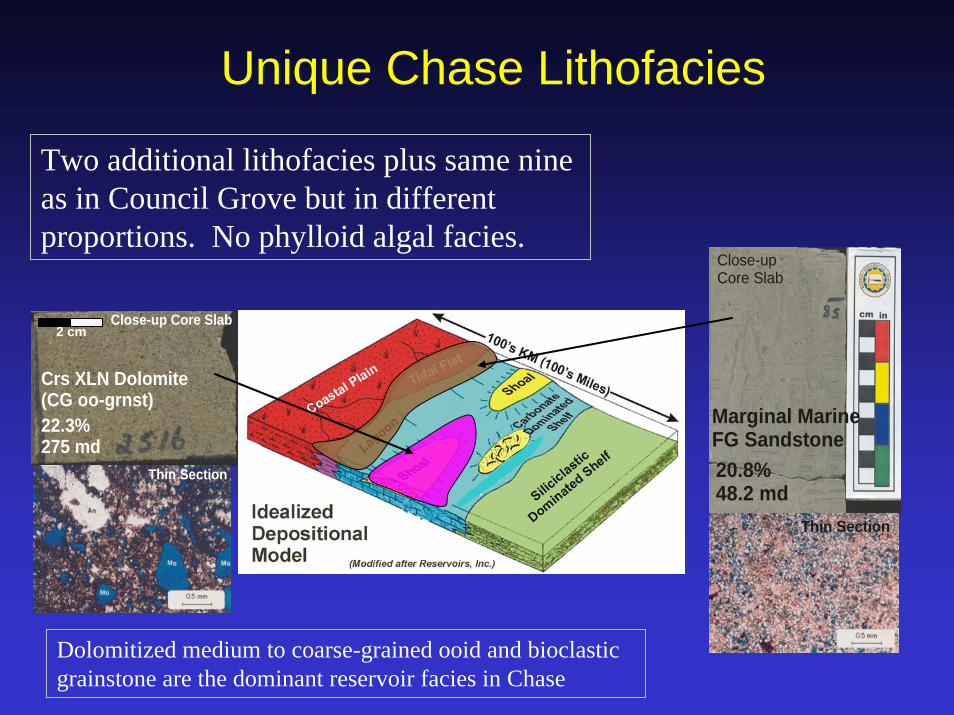
Unique Chase Lithofacies
Two additional lithofacies plus same nine as in Council Grove but in different proportions. No phylloid algal facies.
Crs XLN Dolomite(CG oo-grnst)
Close-up Core Slab
22.3%275 md
Thin Section
2 cm
(time slice)
Close-up Core Slab
Marginal Marine FG Sandstone20.8%48.2 md
Thin Section
Dolomitized medium to coarse-grained ooid and bioclasticgrainstone are the dominant reservoir facies in Chase

Present Day Structure
Hugoton
KEYE
S DO
ME
Panoma
VE = 200X
Chase
Base of Council Grove
100 mi (160 km)
Reservoirs of Hugoton and Panoma Fields were deposited on a very gently dipping shelf. Relief was much less than it is today.
Top Council Grove
VE = 100X
Shelf Margin
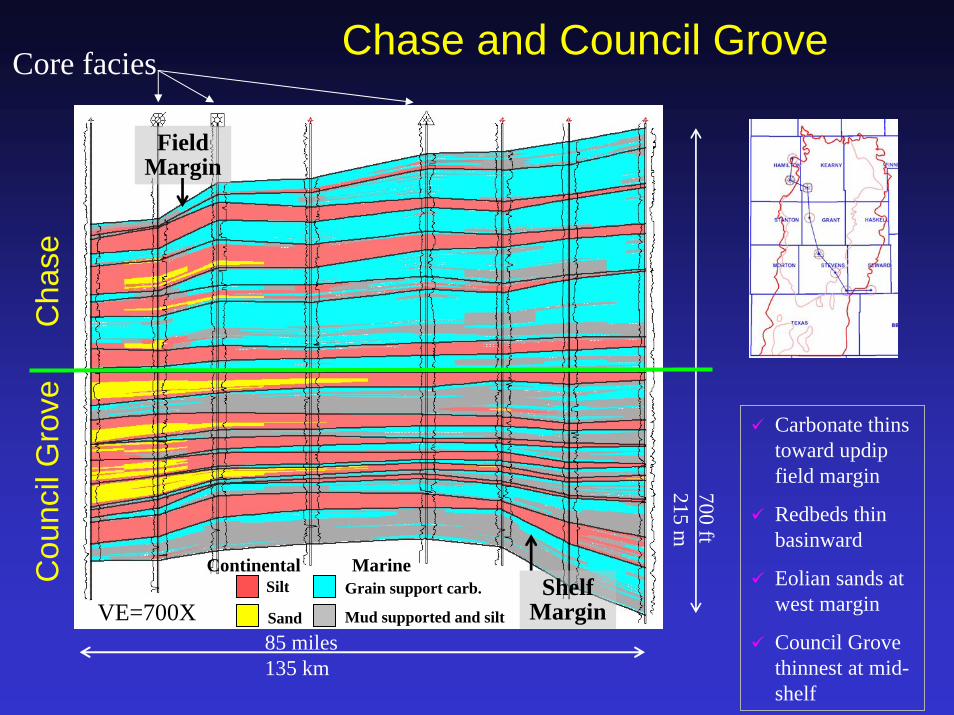
Chase and Council Grove
Silt
Sand Mud supported and silt
Grain support carb.Continental Marine
VE=700X85 miles135 km
700 ft215 m
Cou
ncil
Gro
ve
C
hase
FieldMargin
ShelfMargin
Carbonate thins toward updipfield margin
Redbeds thin basinward
Eolian sands at west margin
Council Grove thinnest at mid-shelf
Core facies

Similar sedimentation patterns in Chase and Council Grove
Net“Continental”
Net Marine
Gross interval
220’
400’
150’
30’
70’
370’
Chase
Council Grove(thru B5_LM) 21
0’
250’
Thin
nest
Midsh
elf17
0’
30’
220’
40’
Series of slides based on facies predicted by Nnet in 1369 wells
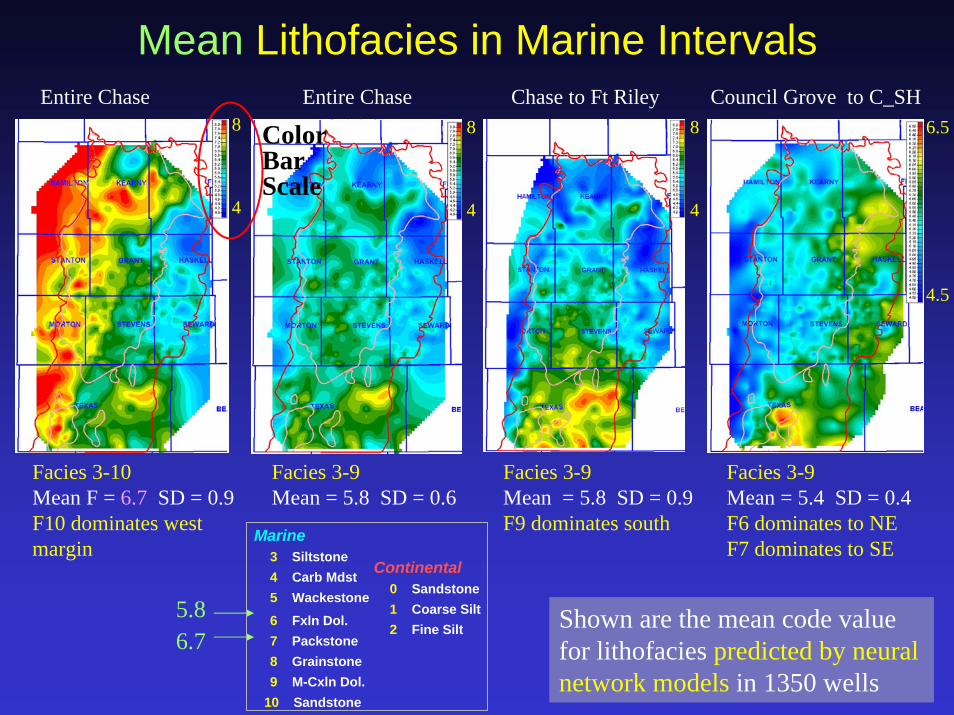
Mean Lithofacies in Marine IntervalsEntire Chase Entire Chase Chase to Ft Riley Council Grove to C_SH
Facies 3-10Mean F = 6.7 SD = 0.9F10 dominates west margin
Facies 3-9Mean = 5.8 SD = 0.6
Facies 3-9Mean = 5.8 SD = 0.9F9 dominates south
Facies 3-9Mean = 5.4 SD = 0.4F6 dominates to NEF7 dominates to SE
8
4
8
4
8
4
6.5
4.5
5.86.7
Continental0 Sandstone1 Coarse Silt2 Fine Silt
Marine3 Siltstone4 Carb Mdst5 Wackestone6 Fxln Dol.7 Packstone8 Grainstone9 M-Cxln Dol.
10 Sandstone
Shown are the mean code value for lithofacies predicted by neural network models in 1350 wells
Color Bar Scale
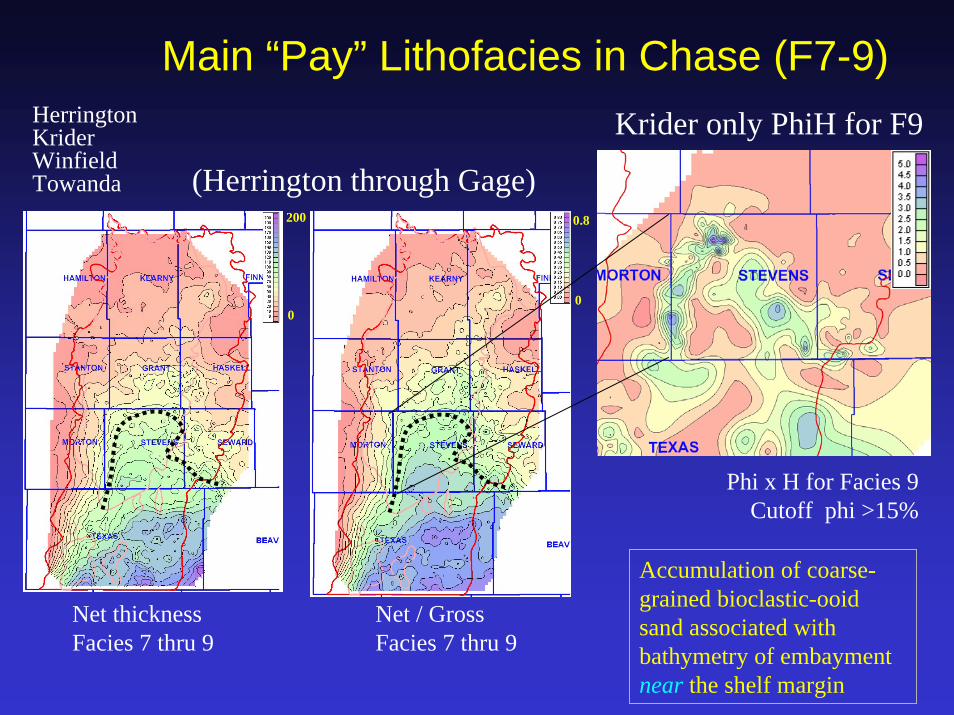
Main “Pay” Lithofacies in Chase (F7-9)HerringtonKriderWinfieldTowanda
Krider only PhiH for F9
(Herrington through Gage)
Phi x H for Facies 9Cutoff phi >15%
Accumulation of coarse-grained bioclastic-ooidsand associated with bathymetry of embayment near the shelf margin
200
00
0.8
Net thickness Facies 7 thru 9
Net / Gross Facies 7 thru 9

Krider Ooid shoal facies in Stevens County
Crs XLN Dolomite(CG oo-grnst)
Close-up Core Slab
22.3%275 md
2 cmThin Section 1 Coarse Silt
3 Siltstone4-5 Mdst-Wackestone
7 Pack-Grainstone
9 M-Cxln Dol.
10 Sandstone
A A’
AA’
Core10 foot divisions

Cottonwood (B5_LM) Phylloid Algal Mounds
Phyloid Algal Bafflestone
20.6%1141 md
Core Slab
L8
0 Sandstone
2 Fine Silt
6 Fxln Dol.
1 Coarse Silt
3 Siltstone4-5 Mdst-Wackestone
7-8 Pack-Grainstone
Net H, F7-8, Phi >10%
A
A’
A A’Core
0
20

Crouse (B1_LM) fine-crystalline dolomite lithofacies
0.5 mm
Thin Section Photomicrograph
Close-up Core Slab
Dolomite13.9%1.1 md
Cm
L6
A
B
F6-8, phi > 8%, Net/Gross0.8
0
B
A
0 Sandstone
2 Fine Silt
6 Fxln Dol.
1 Coarse Silt
3 Siltstone4-5 Mdst-Wackestone
7-8 Pack-Grainstone
Core
Core
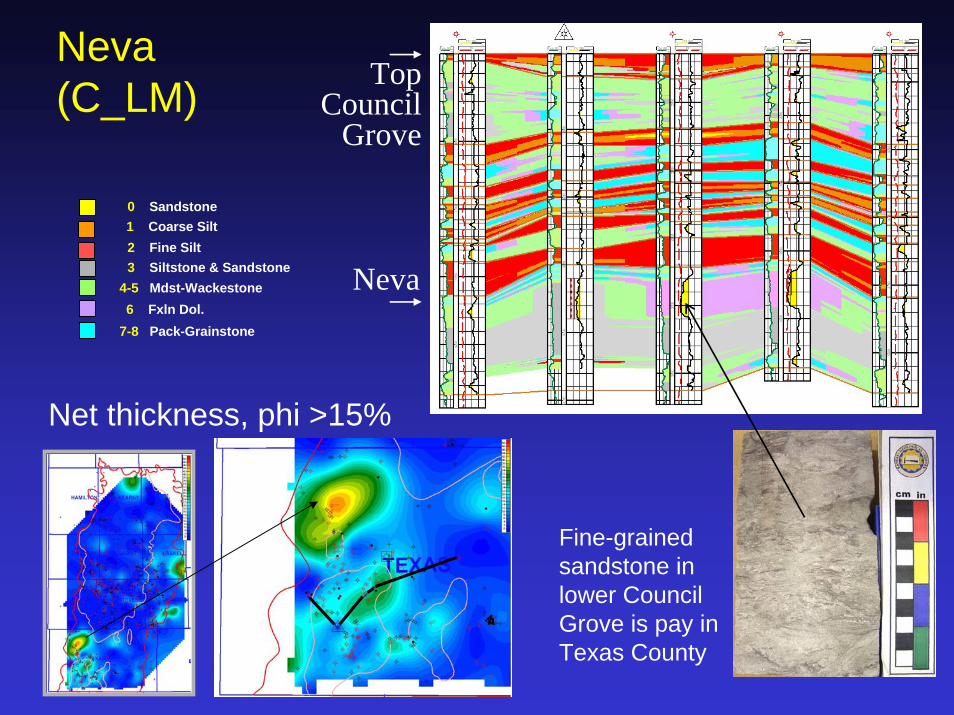
Neva (C_LM)
0 Sandstone
2 Fine Silt
6 Fxln Dol.
1 Coarse Silt
3 Siltstone & Sandstone4-5 Mdst-Wackestone
7-8 Pack-Grainstone
Top Council
Grove
Neva
Net thickness, phi >15%
Fine-grained sandstone in lower Council Grove is pay in Texas County

Eolian sandstoneCouncil Grove
Cum. Prod. 1.5 BCF
Dubois and Goldstein, 2005
Continental sandstone thickness
20
120
SummaryTownship scale models have been built and tested by numerical simulation
Components are in place for building field-wide cellular model (underway)
Neural network models are proving effective in facies predictions and building an accurate geomodel
We anticipate being able to successfully delineate remaining gas in place in the Hugoton and Panoma Fields
Acknowledgements
We thank our industry partners for their support of the Hugoton Asset Management Project and theirpermission to share the results of the study.
Anadarko Petroleum CorporationBP America Production Company
Cimarex Energy Co.ConocoPhillips Company
E.O.G. Resources Inc.Medicine Bow Energy Corporation
Osborn Heirs CompanyOXY USA, Inc.
Pioneer Natural Resources USA, Inc.
also geoPlus (Petra) and Schlumberger (Petrel)