Embed Size (px)
Citation preview
REPAIR, EVALUATION, MAINTENANCE, ANDlet REHABILITATION RESEARCH PROGRAM
TECHNICAL REPORT REMR-GT-3
GEOTECHNICAL ASPECT& OF ROCK EROSION'IN EMERGENCY SPILLWAY CHANNELS
Report 4
GEOLOGIC AND HYDRODYNAMIC CONTROLS ON~II THE MECHANICS OF KNICKPOINT MIGRATION
James H. May
r Geotechnical Laboratory
DEPARTMENT OF THE'ARMYWaterways Experiment Station, Corps of Engineers
3909 Halls Ferry Road, Vicksb~irg, Mississippi 39180-6199
ELEC1E
December 1989Report 4 of a Series
Approved For Public Releae, Distilbution Unlimited
Prepared for DEPARTMENT OF THE ARMYUS Army Corps of EngineersWashington, DC 20314-1000
Under Civil Works Work Unit 32317
90 0.1 16 0 7 C
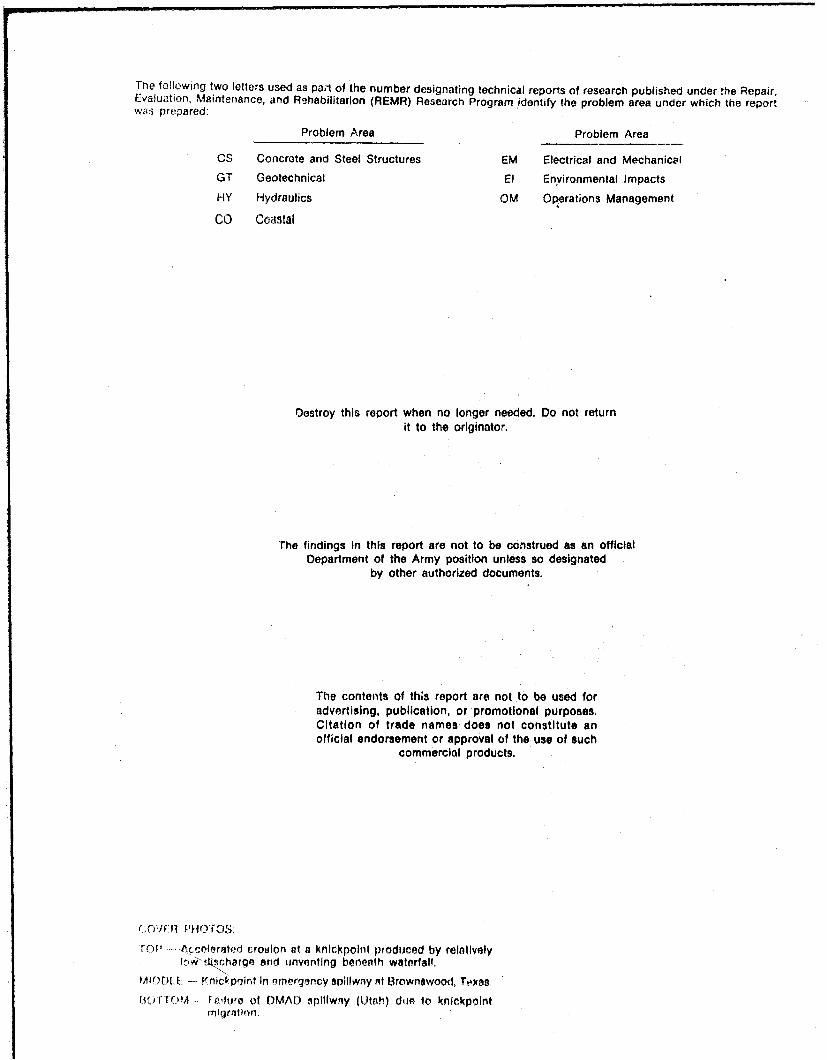
The following two letters used as parl of the number designating technical reports of research published under the Repair,Evaluation, Maintenance, and Rhabilitation (REMR) Research Program identify the problem area under which the reportwa,; prepared:
Problem Area Problem Area
CS Concrete and Steel Structures EM Electrical and MechanicalGT Geotechnical El Environmental ImpactsFlIy Hydraulics OM Operations Management
CO Coastal
Destroy this report when no longer needed. Do not returnit to the originator.
The findings in this report are not to be construed as an officialDepartment of the Army position unless so designated
by other authorized documents.
The contents of th~s report are not to be used foradvertising, publication, or promotional purposes.Citation of trade names does not constitute anofficial endorsement or approval of the use of such
commercial products.
rrf .A'cierated croulon at a knickpoint produced by relativelyI'vi sch argi slid unventing beneath waterfall.
W~DOLE- Knicpolit In Prnergency spitiwny at lBrownswood, Toes.WTI(A-~ F n'iura of OMAt) spillwily (Utsh) don to knickpoint
Unclassified
SECURITY CLASSIFICATION OF THIS PAGE
Form ApprovedREPORT DOCUMENTATION PAGE OMB No 0704-0188
la. REPORT SECURITY CLASSIFICATION lb RESTRICTIVE MARKINGSUnclassified
2a. SECURITY CLASSIFICATION AUTHORIT'f 3 DISTRIBUTION/AVAILABILITY OF REPORTApproved for public release; distribution
2b. DECLASSIFICATION / DOWNGRADING SCHEDULE unlimited
4 PERFORMING ORGANIZATION REPORT NUMBER(S) 5 MONITORING ORGANIZATION REPORT NUMBER(S)
Technical Report REMR-GT-3
6a. NAME OF PERFORMING ORGANIZATION 6b. OFFICE SYMBOL 7a. NAME OF MONITORING ORGANIZATIONUSAEWES (If applicable)Geotechnical Laboratory I
6c. ADDRESS (City, State, and ZIP Code) 7b. ADDRESS (City, State, and ZIP Code)
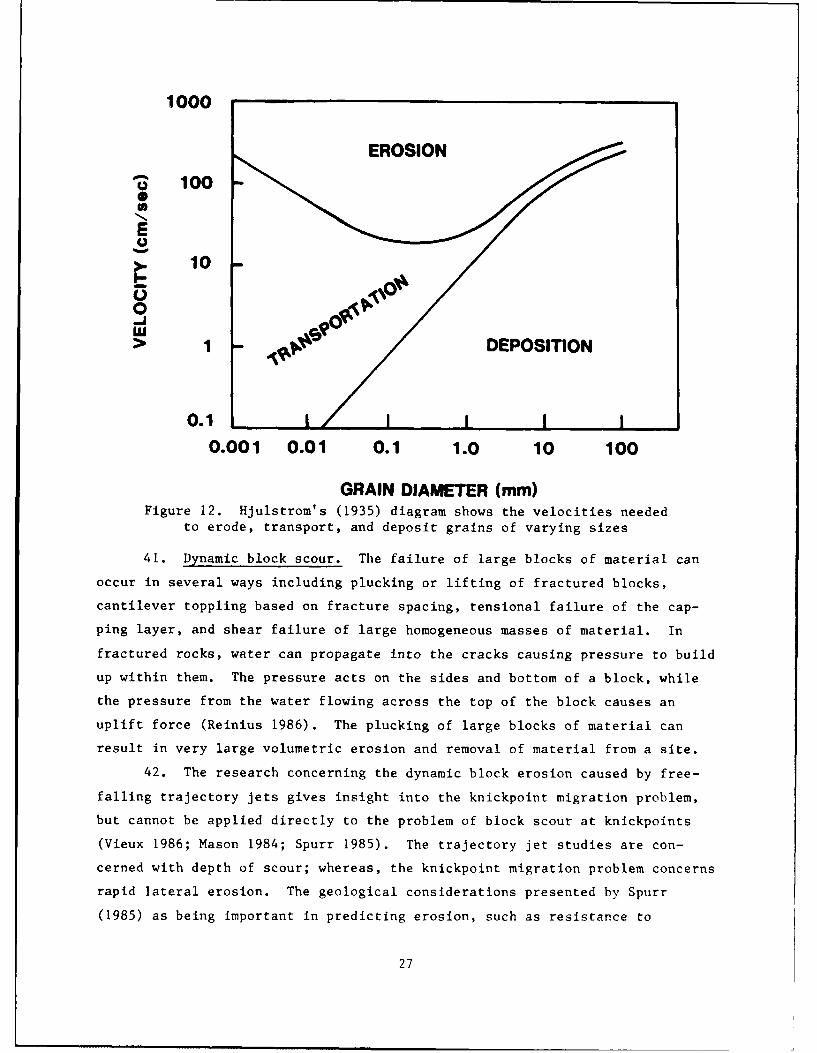
3909 Halls Ferry Road
Vicksburg, MS 39180-6199
Sa. NAME OF FUNDING/SPONSORING Bb. OFFICE SYMBOL 9. PROCUREMENT INSTRUMENT IDENTIFICATION NUMBERORGANIZATION (If applicable)
US Army Corps of Engineers
8c. ADDRESS (City, State, and ZIP Code) 10 SOURCE OF FUNDING NUMBERSPROGRAM PROJECT TASK WORK UNITELEMENT NO NO NO. ACCESSION NO
Washington, DC 20314-1000 II11. TITLE (Include Security Classification)Geotechnical Aspects of Rock Erosion in Emergency Spillway Channels; Report 4: Geologicand Hydrodynamic Controls on the Mechanics of Knickpoint Migrgio
12. PERSONAL AUTHOR(S)May, James H.
13a. TYPE OF REPORT 13b. TIME COVERED 14. DATE OF REPORT (Year, Month, Day) 15 PAGE COUNTFinal report FROM _ TO December 1989 138
16. SUPPLEMENTARY NOTATION
See reverse17. COSATI CODES 18. SUBJECT TERMS (Continue on reverse if necessary and identify by block number)
FIELD GROUP SUB-GROUP Rock Knickpoint Hydraulic structures
Rock mass HeadcuttingErosion Spillways
19. ABSTRACT (Continue on reverse if necessary and identify by block number)
During the last decade, occurrences of emergency spillway discharges at Soil Conser-vation Service, Corps of Engineers, and private reservoirs have increased and, in certaincircumstances, resulted in erosional damages to the spillways. Rapid headward erosion inunlined emergency spillways at Corps of Engineers reservoirs including Grapevine, Saylor-Ville, and Black Butte caused the Corps to take a serious look at the available methodsused to predict erosion damage in unlined emergency spillways. The catastrophic loss ofprivate and Soil Conservation Service reservoirs because of knickpoint migration in emer-gency spillway channels was additional evidence that the mechanics of knickpoint erosionwere not clearly understood. Severe erosion was documented at several Corps spillwayswhere the flow was less than one-tenth of the designed capacity.
(Contimntid20 DISTRIBUTION /AVAILABILITY OF ABSTRACT 21 ABSTRACT SECURITY CLASSIFICATION
[0 UNCLASSIFIED/UNLIMITED 0 SAME AS RPT C[ OTIC USERS Unclassified22a NAME OF RESPONSIBLE INDIViDUAL 22b IELEPHONE(!nclude AreaCode) 22c OFFICE SYMBOL
DO Form 1473, JUN 86 Previous editions are obsolete SECURITY CLASSIFICATION OF THIS PAGE
Unclassified
UnclassifiedISCURITY CLASSIFICATION OF TNIS PA4
16. SUPPLEMENTARY NOTATION (Continued).
A report of the Geotechnical problem area of the Repair, Evaluation, Maintenance, andRehabilitation (REMR) Research Program. This report is available from the NationalTechnical Information Service, 5285 Port Royal Road, Springfield, VA 22161.
19. ABSTRACT (Continued).
Preliminary research revealed that the severe cases of knickpoint erosion were usu-ally caused by the mass failure of large blocks of material and not by the tractive forcescour of individual grains. The details of the mechanisms which actually caused the massfailures were largely unknown. Without an understanding of these mechanisms it would notbe possible to develop scale hydraulic models or computer models.
The purpose of this research was to study knickpoint erosion phenomena with respectto the combined effects of the geologic and hydrodynamic controls. In order to study themechanisms working at the knickpoint, several obstacles had to be overcome. First amaterial had to be developed which would erode like rock but would keep the eroding waterclear so that the failure mechanisms could be observed. Sodium silicate and gelatin-cemented gravel in combination with Plexiglass were used to simulate knickpoints inlayered rock. Next, a hydraulic flume had to be modified to accommodate layered samples.
The designed drop structure, which is constructed in streams or channels to dissi-pate erosive energy, was used as an analog to study the knickpoint phenomena. Theresearch revealed that the potential for headward knickpoint erosion is controlled by thegeometry of the knickpoint, the velocity of eroding water, and the pressurc underneath thenappe. The geometry of the knickpoint is in turn controlled by the site-specific geology.The erosion rate was found to increase significantly when the thickness of the erodiblelower layer in a two-layer model exceeded the diameter of the back roller at the toe of
the knickpoint.
It was found that headward erosion in the flume could be controlled or completelystopped by controlling the pressure underneath the nappe. Headward erosion was orders ofmagnitude greater when the area underneath the nappe was not vented to the atmosphere.The development of an unvented condition was found to cause rapid headward erosion at flowconditions well below the maximum discharge.
UnclassfieidSECURITY CLASSIFICATION OF TMIS PAGE
PREFACE
This study addresses rock erosion in emergency spillway channels, a
problem area of the Repair, Evaluation, Maintenance, and Rehabilitation (REMR)
Research Program being conducted by the US Army Engineer Waterways Experiment
Station (WES).
This fourth report of a series summarizes work performed during FY 88.
Results of work currently in progress and ongoing research programs will be
topics of a final report to be completed during FY 89. This study was under
the direct supervision of Mr. J. S. Huie, the Problem Area Leader, and
Dr. James H. May, the Principal Investigator, Engineering Geology and Rock
Mechanics Division (EGRMD), Geotechnical Laboratory (GL). General supervision
was provided by Dr. Lawson M. Smith, Chief, Engineering Geology Applications
Group (EGAG), EGRMD; Dr. D. C. Banks, Chief, EGRMD; and Dr. W. F.
Marcuson III, Chief, GL. The REMR Program Manager was William F. McCleese,
Structures Laboratory.
This report was written by Dr. May and represents a portion of the
writer's doctoral dissertation at the Center for Engineering Geosciences,
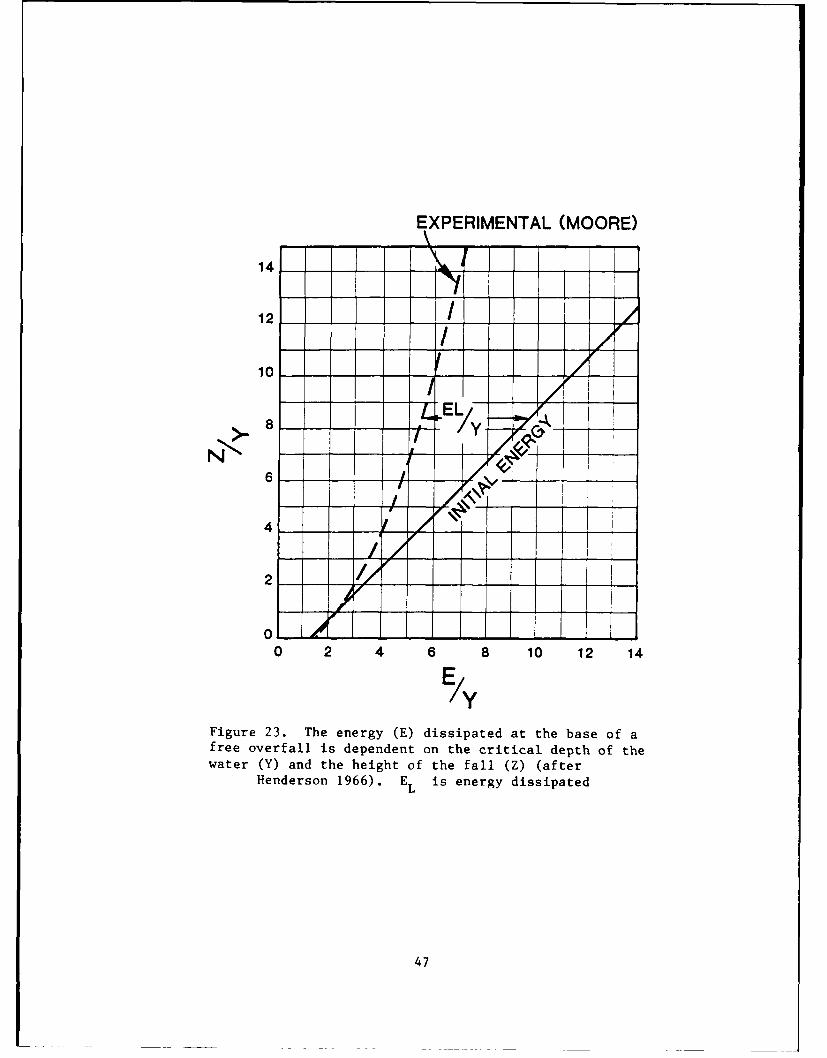
Texas A&M University (TAMU). Appreciation is extended to the doctoral commit-
tee chairman, Dr. Christopher C. Mathewson; and to the committee members,
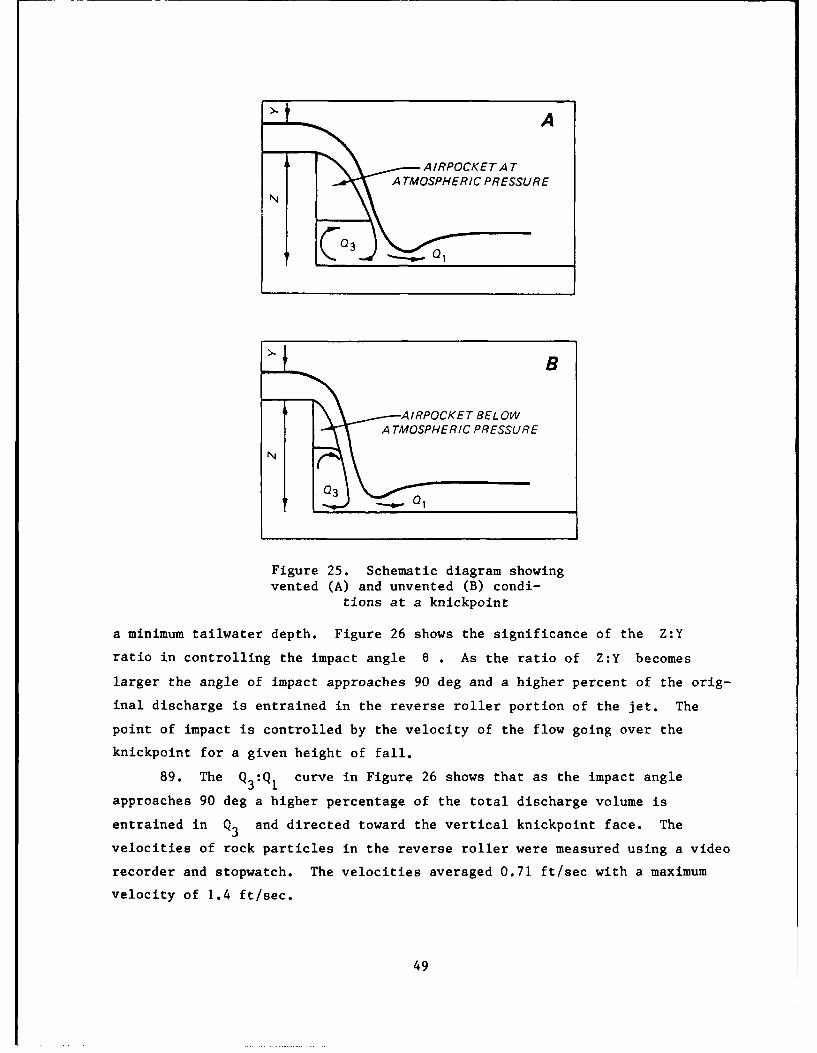
Drs. Robert R. Berg, Patrick A. Domenico, Earl R. Hoskins, Wayne A. Dunlap,
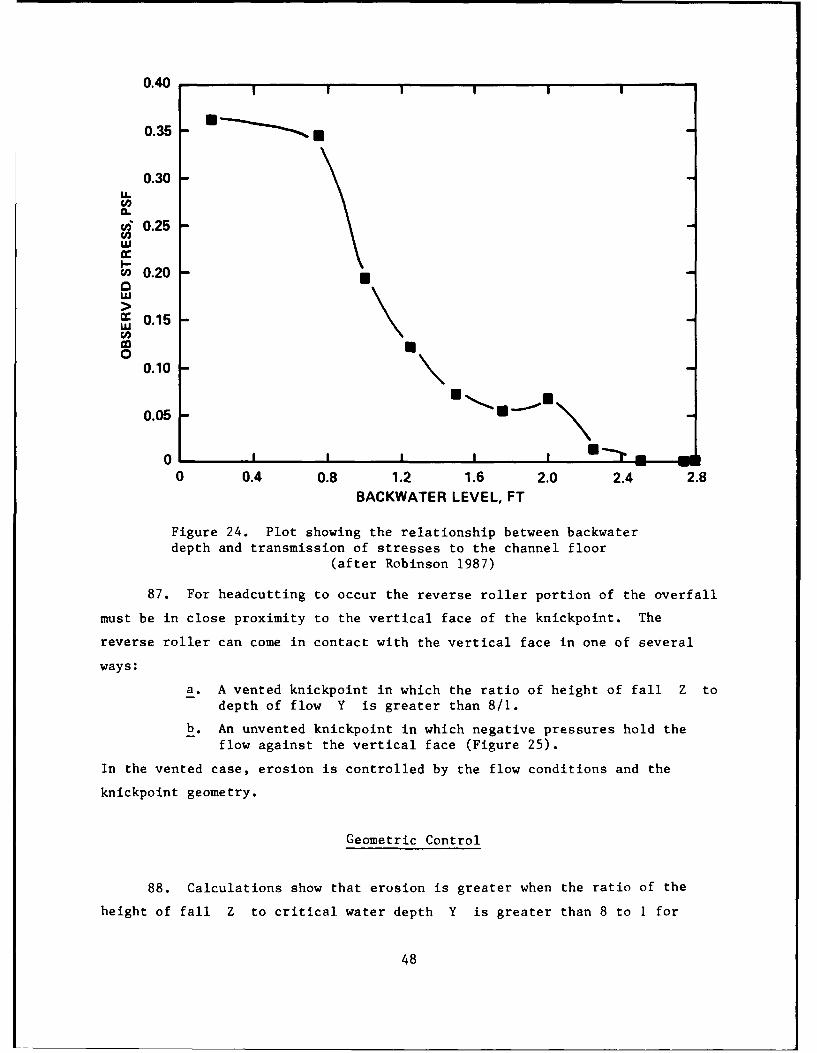
and Thomas N. Adair. Recognition is given to Mr. Garrett Jackson, University
of Arizona, who served as laboratory assistant during much of the testing.
The technical contributions of Mr. John B. Palmerton and Mr. Dale Barefoot,
GL, Mr. Kerry D. Cato, TAMU, and Drs. David M. Patrick and Christopher P.
Cameron, University of Southern Mississippi, are also acknowledged. Mr. Randy
Oswalt and Mr. Bobby Fletcher of the Hydraulics Laboratory; and Dr. Robert H.
Denson, Mr. John Boa, Mr. Ken Loyd, and Mr. Donald Walley of the Structures
Laboratory helped develop the materials used to simulate rock and provided
technical assistance for the flume tests. This report was edited b,
Mrs. J. Walker, Information Technology Laboratory.
WES gratefully acknowledges the helpful suggestions, constructive criti-
cisms, and information provided by the Soil Conservation Service, US Depart-
ment of Agriculture, and the Corps of Engineers Districtp dnd Divisions.
1
Commander and Director of WES during preparation of this report was
COL Larry B. Fulton, EN. Dr. Robert W. Whalin was the Technical Director
during this study.
-A
'. 2
' (S)
@2
CONTENT S
Page
PREFACE.....................................................................1I
CONVERSION FACTORS, NON-SI TO SI (METRIC)UNITS OF MEASUREMENT................................................. 5
PART I: INTRODUCTION................. ......... ........................ 6
Background ...... o................................ .................... 6Work Unit Objective.......................... ....................... 6Scope ........................................... ..... .......... ..... 7Objectives of Laboratory Research.................... ...... ......... 7
PART II: KNICKPOINT EROSION............................................. 9
Review of Related Research........................................... 9Theoretical Considerations................................ ........ . 20Geologic Controls.................................................... 28
PART III: EXPERIMENTAL DESIGN AND PROCEDURES.................... ....... 35
Flume Design..................... ..... ........ ..................... 35Data Acquisition and Documentation................. ................. 41Procedures......................................... .... ...... ....... 41
PART IV: DESIGN OF SIMULATED ROCK FOR FLUJME TESTS. ...................... 43
PART V: HYDRODYNAMIC MECHANISMS .................................... 45
Drop Structure as a Knickpoint Analog.......................45Geometric Control..................................... ...... 48Unvented Control ............................................ 51Hydraulic Similitude .................................. ............... 53Effect of Key Geological Variables.................................. 53
PART VI: CONTROLS AND MECHANISMS IN THE FIELD.......................... 59
Undercutting and Toppling of Fractured Caprock:Saylorville Spillway ............................................... 59
Undercutting and Tensile Failure: Lake Brownwood Spillway .......... 63Influence of Rounded Lip at Knickpoint: Saylorville Spillway ....... 63Undercutting and Shear Failure of Large Blocks:
B lack Creek Spillway............................................. ................ 67
Uplift and Rafting of Large Jointed Blocks:SCS Virginia Site 81............................................. . 69
PART VII: KNICKPOINT MIGRATION ............................ 73
Geometric Factors.................................................... 73Geological Factors................................................... 77Hydrologic Factors................ ................. ....... ......... 77Remedial Considerations .................... ......................... 79
PART VIII: CONCLUSIONS AND RECOMMENDATIONS.......... ... ................. 81
Conclusions........................................ ................ 81Recommendations .... o................................................ 82
3
Page
REFERENCES................................................................. 84
APPENDIX A: LABORATORY DATA SHEETS....................................... Al
APPENDIX B: METHOD OF ESTIMATING PARTICLE VELOCITY INTURBULENT FLOW............................................. B
APPENDIX C: MIX DESIGNS AND) PROCEDURES................................... Cl
APPENDIX D: SUMMARY OF FLUME TESTS DATA................................. Dl
4
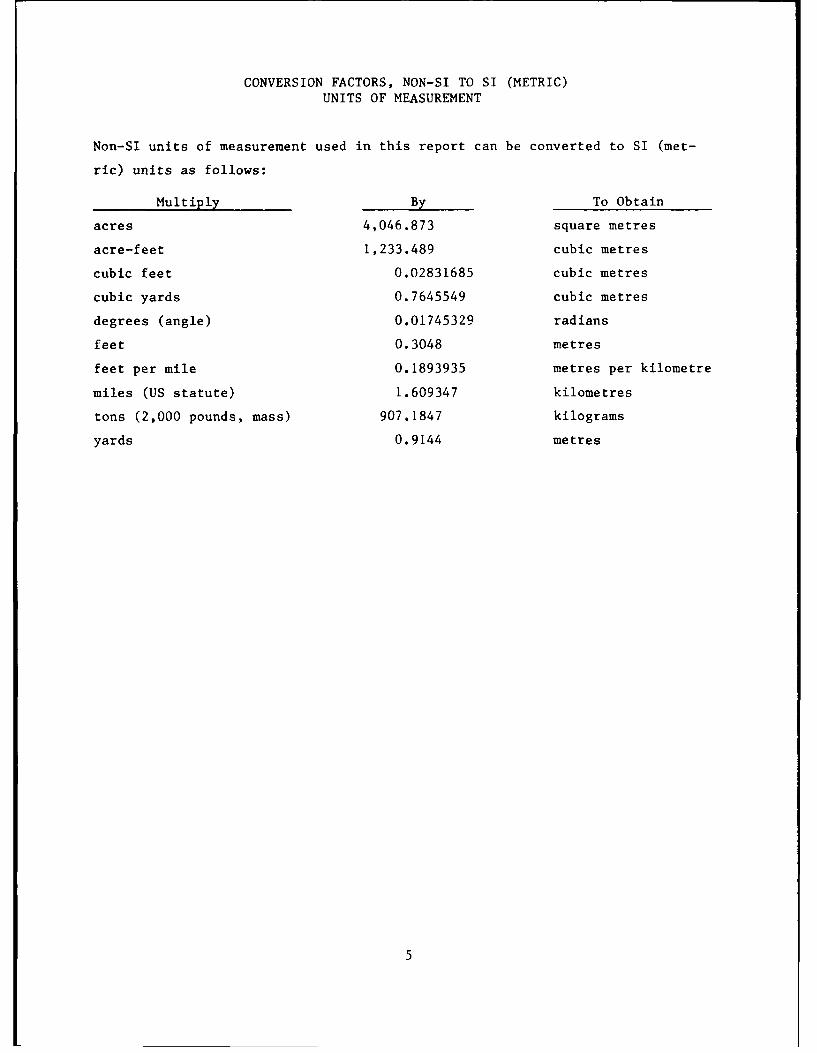
CONVERSION FACTORS, NON-SI TO SI (METRIC)UNITS OF MEASUREMENT
Non-SI units of measurement used in this report can be converted to SI (met-
ric) units as follows:
Multiply By To Obtain
acres 4,046.873 square metres
acre-feet 1,233.489 cubic metres
cubic feet 0.02831685 cubic metres
cubic yards 0.7645549 cubic metres
degrees (angle) 0.01745329 radians
feet 0.3048 metres
feet per mile 0.1893935 metres per kilometre
miles (US statute) 1.609347 kilometres
tons (2,000 pounds, mass) 907.1847 kilograms
yards 0.9144 metres
5
GEOTECHNICAL ASPECTS OF ROCK EROSION IN EMERGENCY
SPILLWAY CHANNELS
GEOLOGIC AND HYDRODYNAMIC CONTROLS ON THEMECHANICS OF KNICKPOINT MIGRATION
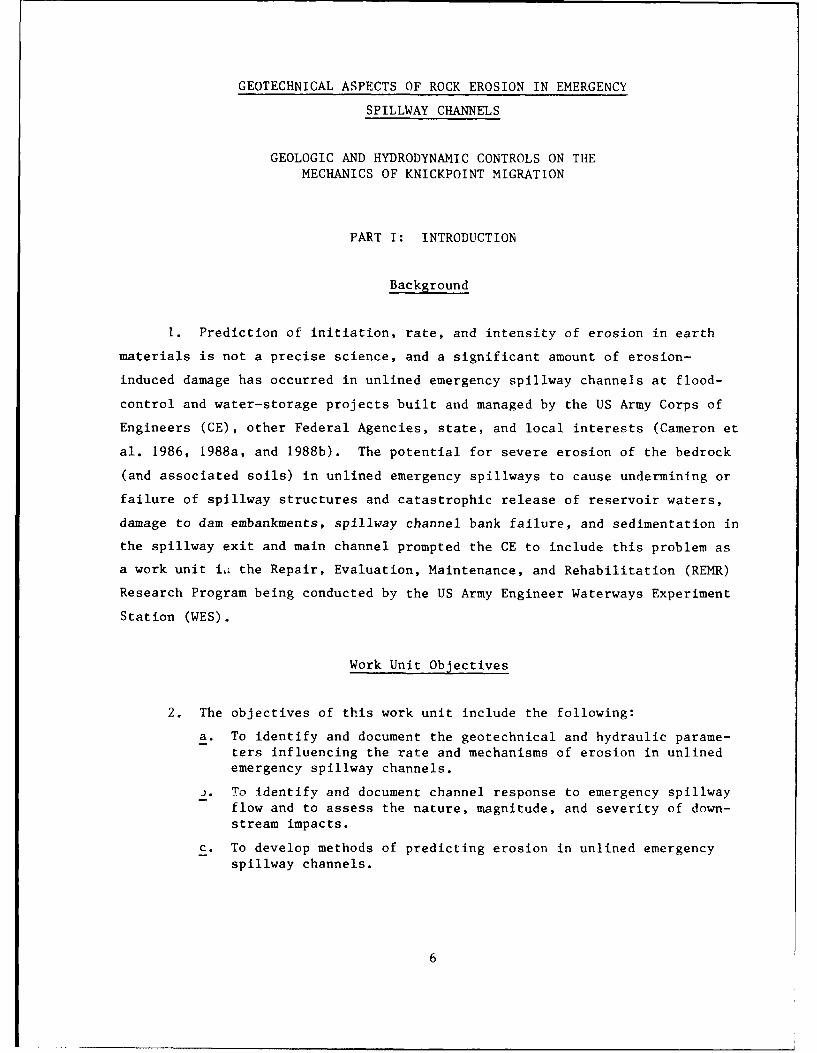
PART I: INTRODUCTION
Background
1. Prediction of initiation, rate, and intensity of erosion in earth
materials is not a precise science, and a significant amount of erosion-
induced damage has occurred in unlined emergency spillway channels at flood-
control and water-storage projects built and managed by the US Army Corps of
Engineers (CE), other Federal Agencies, state, and local interests (Cameron et
al. 1986, 1988a, and 1988b). The potential for severe erosion of the bedrock
(and associated soils) in unlined emergency spillways to cause undermining or
failure of spillway structures and catastrophic release of reservoir waters,
damage to dam embankments, spillway channel bank failure, and sedimentation in
the spillway exit and main channel prompted the CE to include this problem as
a work unit iai the Repair, Evaluation, Maintenance, and Rehabilitation (REMR)
Research Program being conducted by the US Army Engineer Waterways Experiment
Station (WES).
Work Unit Objectives
2. The objectives of this work unit include the following:
a. To identify and document the geotechnical and hydraulic parame-
ters influencing the rate and mechanisms of erosion in unlinedemergency spillway channels.
J. T. identify and document channel response to emergency spillwayflow and to assess the nature, magnitude, and severity of down-
stream impacts.
C. To develop methods of predicting erosion in unlined emergency
spillway channels.
6
d. To develop cost-effective remedial and preventive measures tominimize the problem of severe erosion in unlined emergencyspillway channels.
e. To maintain and continually up-date an observational data basewhich documents important erosive spillway overflow events at CEprojects.
f. To provide timely technology transfer in this problem area to CEpersonnel and other interested parties in Federal, state, andlocal agencies.
Scope
3. This report, the fourth in a series, provides further documentation
of the causes-and-effects of bedrock erosion in emergency spillway channels,
the relationship between spillway channel erosion and erosion in natural
stream channels, provides detailed analyses, and attempts to quantify the phe-
nomena and processes identified and discussed in earlier reports, (see Cameron
et al. 1986, 1988a, and 1988b). These phenomena and processes encompass the
geotechnical and hydraulic factors which control spillway channel response to
overflow events.
4. These reports are intended to serve as a mechanism for communicating
research results, ideas, and concepts to interested CE personnel and their
counterparts in other Federal, state, and local agencies. CE District experi-
ence, case histories, and site visits, as well as technical input from other
concerned agencies, continue to provide vital elements of the working observa-
tional data base and serve as the foundation for development and refining of
research tasks.
Objectives of Laboratory Research
5. The primary objective of this research is to determine the signifi-
cance of geologic and hydrodynamic controls on the mechanics of headward or
knickpoint erosion. This was accomplished by:
a. Viewing the spillway erosion problem as a "continuum" from trac-tive force scour of individual grains to turbulent dynamic blockscour and contending that block failure mechanisms are most cri-tical in determining the rate of headward erosion.
7
b. Showing that knickpoints cannot develop very easily in a homo-geneous media, but ideally need a harder more resistant layeroverlying a softer more erodible layer.
c. Breaking the complex headward erosion phenomenon into a basictwo-layered system for analyses.
d. Designing mixes to simulate rock of various strengths for physi-cal modeling tests.
e. Modifying a hydraulic, tilting, recirculating flume to accommo-date layered samples.
f. Laboratory testing of a simulated two-layer rock system in thehydraulic flume under controlled flow conditions.
f. Using a designed hydraulic drop structure as an analog fordetermining the influence of venting on knickpoint migration.
h. Comparing laboratory results with observations made in thefield.
i. Documenting block failure mechanisms in laboratory tests by useof video recorder.
2. Calculating critical turbulent flow particle velocities.
PART II: KNICKPOINT EROSION
6. Knickpoint migration or headcutting is the most severe form of
structure-threatening erosion in emergency spillway channels. The term
"knickpoint" refers to a point along the longitudinal profile of a stream
channel at which there is an abrupt change in gradient. It is also the most
unpredictable form of erosion because it is controlled mainly by the geology
at a particular site. Ongoing complimentary erosion studies, carried out at
WES, analyzed geometric and hydraulic parameters in respect to severity of
erosion (Cameron et al. 1988a). The absence of a statistical correlation
among the variable parameters is ascribed to different geological conditions
at the data base sites. Structural and stratigraphic discontinuities were not
included in the regression analyses.
Review of Related Research
7. Numerous research efforts have dealt with the subject of erosion,
but only a few of these can be applied directly to the problem of violent,
turbulent knickpoint erosion which is associated with short-lived emergency
spillway flow events. Spillway erosion is controlled by a variety of complex
geological and hydraulic factors including:
a. Flood frequency, magnitude, and duration.
b. Channel design.
c. Channel gradient.
d. Rock discontinuity.
e. Rock erodibility.
8. The preceding factors are interrelated and often act in concert
(Cameron et al. 1986, 1988a, and 1988b). The processes associated with turbu-
lent block scour are not as well understood as those dealing with tractive
force scour. Guy, Simons, and Richardson (1966) used flumes to determine the
effects of the size of the bed material, temperature, and fine sediment on the
hydraulic and transport variables in alluvial channels.
9. Schumm (1985) states that an understanding of the geomorphic con-
trols on erosion processes in fluvial systems is critical. The natural ero-
sion susceptibility of a stream system can be increased by human-related
9
activities such as channelization, overgrazing, blasting, and road construc-
tion (Smith 1979; Whitten and Patrick 1981).
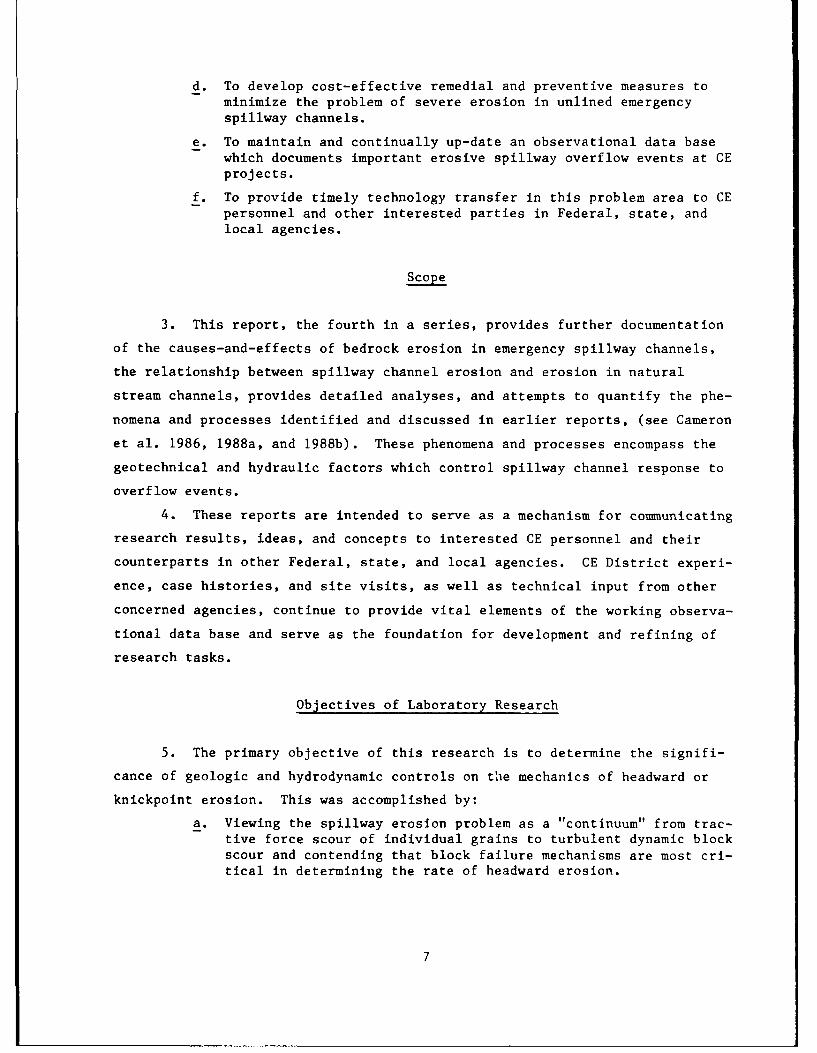
10. The US Department of Agriculture is conducting hydraulic model
testing for the design of vegetated channels at its Stillwater, Oklahoma,
laboratory (Figure 1). Methods have been derived for applying tractive force
Figure 1. One of the grass-lined hydraulic modelsused for erosion studies at the USDA Research Lab-oratory at Stillwater, Oklahoma (WES photo file)
concepts to the design of grass-lined spillways (Temple 1980, 1982, 1983,
1984, 1986). Studies at the US Department of Agriculture Sedimentation Labor-
atory at Oxford, Mississippi, have related local channel instability to an
early-Holocene silt unit with well developed polygonal structures that cause
near-vertical bank angles which result in bank instability (Grissinger and
Bowie 1984). The hydraulic parameters associated with an overfall were
studied by Robinson at the Soil Conservation Service (SCS) Laboratory at
Stillwater, Oklahoma (Robinson 1987). The US Department of Agriculture has an
ongoing study that is designed to determine the critical factors causing
erosion in emergency spillway channels (Soil Conservation Service 1973, 1984a,
1985b). WES has been working closely with the US Department of Agriculture
Emergency Spillway Flow Study Task Group which has published four spillway
performance reports documenting emergency spillway flows which took place in
Mississippi, Kentucky, and Arkansas in 1982, 1983, and 1984 (Soil Conservation
10
Service 1984b, 1985c, 1986). The major factors influencing spillway erosion
according to these reports are:
a. Major channel slope changes.
b. A road or trail in the spillway paralleling the flow.
c. A thin layer of soil over hard rock that may be "rafted" away.
d. Overshooting during construction blasting.
11. The Bureau of Reclamation used fuse-plug embankment models to study
the erosion process. A fuse plug is an embankment designed to wash out in a
controlled and predictable manner when the flow capacity exceeds the normal
capacity of the service spillway. The fuse plug flow is primarily determined
by gravity and inertia forces (Pugh and Gray 1984).
12. The ratio between the model and the prototype is determined from
the Froude Law. The Froude Number is the velocity divided by the square root
of the acceleration due to gravity times the depth of flow. Bureau of Recla-
mation studies obtained a high degree of both geometric and kinematic similar-
ity. Geometric similarity occurs when the ratios of all homologus dimensions,
between the model and the prototype, are the same. Kinematic similarity, or
similarity of motion, means that the ratios of velocities and accelerations
between the model and the prototype are equal (Pugh and Gray 1984).
13. A series of tests for relative erodibility of undisturbed sedimen-
tary rock samples was conducted by Perry (1982) at the Waterways Experiment
Station Geotechnical Laboratory. Perry used a self-contained, recirculating,
tilting flume. Water was accelerated across a rock sample mounted flush in
the floor of the flume and the rate of erosion was measured.
14. Numerous hydraulic modeling studies have been conducted at the
Hydraulics Laboratory at the Waterways Experiment Station. An example is an
investigation conducted on the Los Esteros Spillway in Guadalupe County, New
Mex-co, to investigate the feasibility of increasing the capacity of the
spillway from 175,000 to 430,000 cu ft/sec* (Fletcher 1982). The model was
constructed to a linear scale ratio of 1:80. Hydraulic similitude was
achieved by using Froudian criteria to express the mathematical relations
between the dimensions and hydraulic quantities of the model and prototype.
The modeling proved that flows as high as 430,000 cu ft/sec would not
* A table of factors for converting non-SI to SI (metric) units of
measurement is presented on page 5.
1I
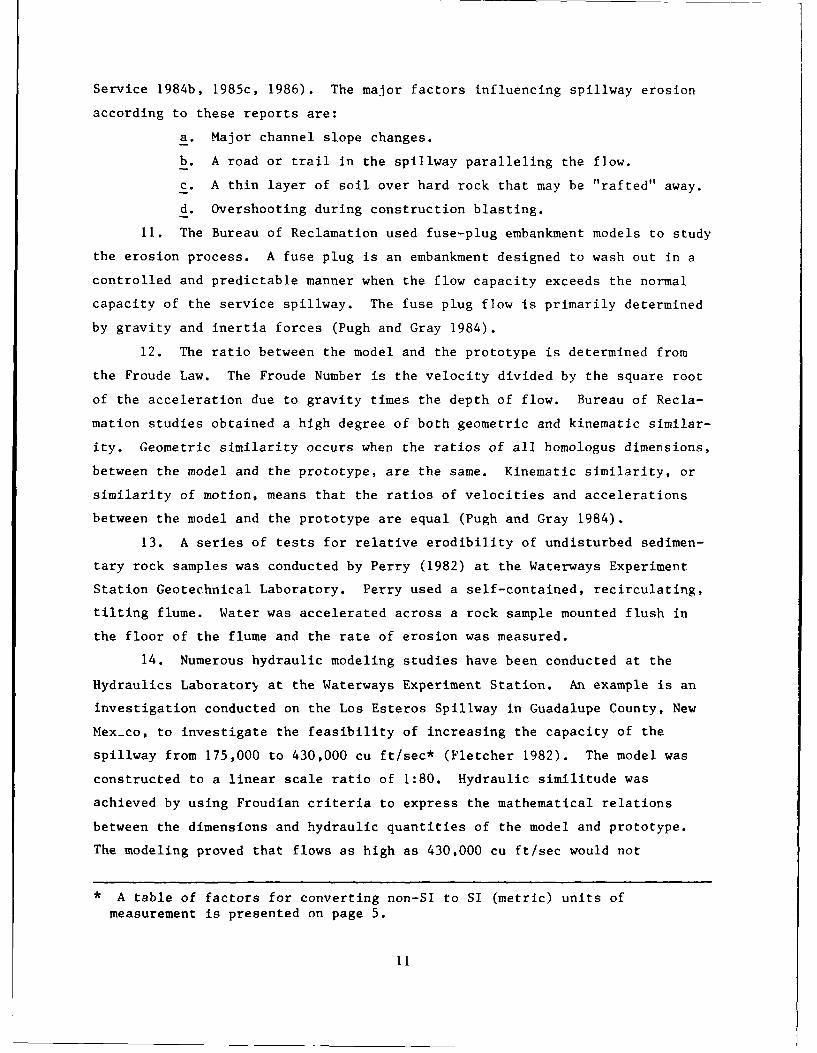
jeopardize the dam. The Grapevine Spillway was also modeled by the Hydraulics
Laboratory (Figure 2). Useful hydraulics data were obtained from the Grape-
vine modeling; however, a noncohesive sand was used in the modeling effort and
many geotechnical questions were not addressed.
Figure 2. Hydraulic model of the Grapevine Spillwayand emergency spillway. The unlined portion of thespillway was modeled with noncohesive sand
(WES photo file)
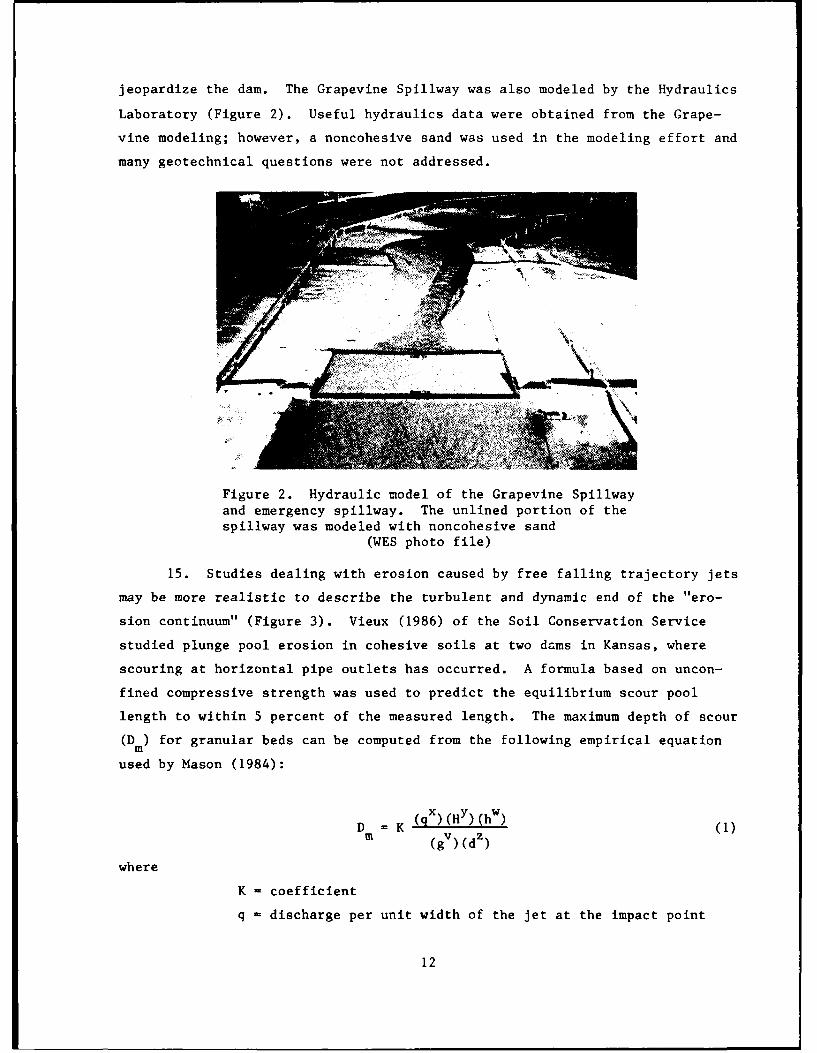
15. Studies dealing with erosion caused by free falling trajectory jets
may be more realistic to describe the turbulent and dynamic end of the "ero-
sion continuum" (Figure 3). Vieux (1986) of the Soil Conservation Service
studied plunge pool erosion in cohesive soils at two dams in Kansas, where
scouring at horizontal pipe outlets has occurred. A formula based on uncon-
fined compressive strength was used to predict the equilibrium scour pool
length to within 5 percent of the measured length. The maximum depth of scour
(D m ) for granular beds can be computed from the following empirical equation
used by Mason (1984):
D = K (qX)(HY)(hw) (1)(gV)(d')
where
K = coefficient
q - discharge per unit width of the jet at the impact point
12
H = head drop from reservoir level to tail-water level
h = tailwater depth downstream of the scour hole
g = acceleration due to gravity
d = mean particle size of the eroded bed material
v,w,x,y,z = exxpotentials for g , h , q , H , and d , respectively
Figure 3. Turbulent overfall at the Delta, Melville,Abraham, and Deseret Irrigation (DMAD) spillway in
Utah (WES photo file)
16. Mason (1984) reviewed the case histories of scour development on
selected prototypes including: the Tarbela Dam in Pakistan; Alder Dam and
Nacimiento Dam in the United States; Picote Dam in Portugal; Grand Rapids Dam
in Canada; and Kariba Dam in Zimbabwe. Mason pointed out the difficulties in
quantitatively predicting the erosive characteristics of free-trajectory jets.
Unacceptable scour is by no means limited to soft rocks such as shales, sand-
stones, and limestones but occurred in competent igneous and metamorphic rocks
such as andesite, granite, and gneiss. He also discussed hydraulic model
testing and said that in every case he had studied the Froude law was used as
the scaling law.
17. Mason developed formulae for calculating the depths of erosion
under free jets for both models and prototypes. He noted that the most common
problem in modeling scour is representing the geology of the site at a model
13
scale. A common approach is to examine the rock onsite and to estimate the
size of the blocks that will result from the joint and fissure patterns. The
rock in the model is then represented by an equivalent size of gravel. The
gravel can be left as noncohesive for a worst case condition or mixed with
various percentages of clay, cement, chalk powder, and water to add cohesion.
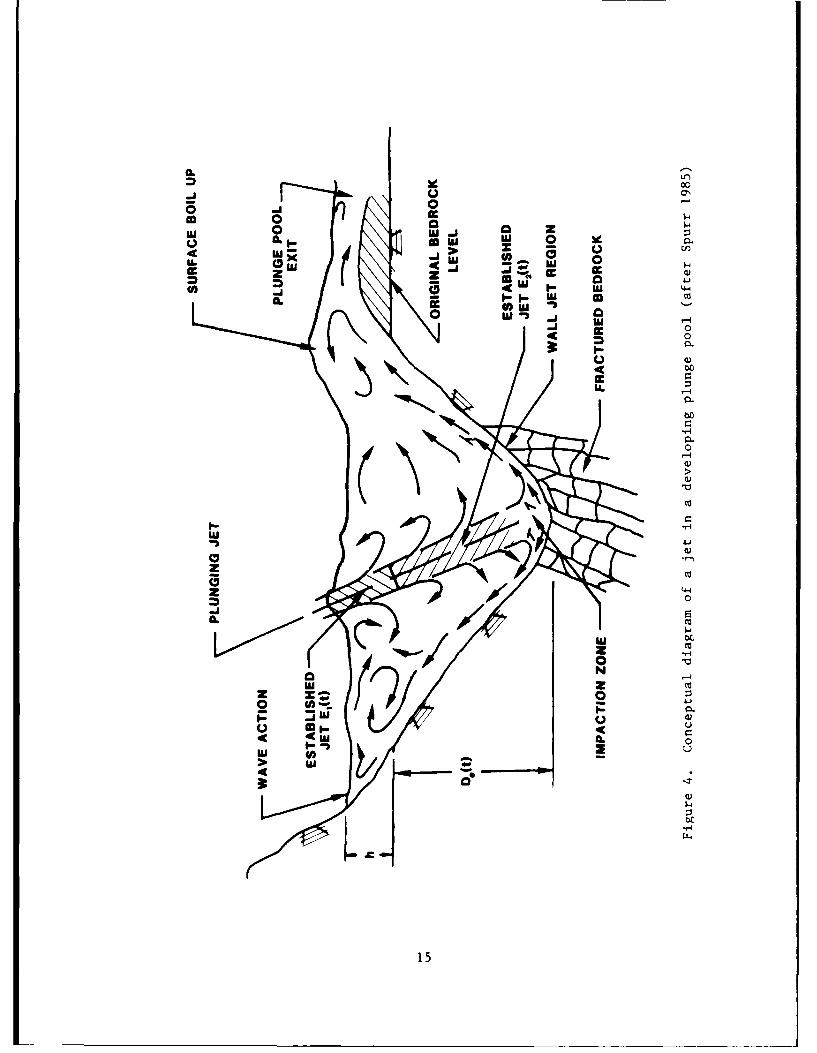
18. A rational approach was presented by Spurr (1985) for estimating
the scour downstream of large dams by taking into account the mean surplus jet
energy in relation to the geology and estimated flow durations. According to
Spurr, the scour depth Dt , at any time t , resulting from a submerged jet
eroding bedrock is a function of the jet energy E , available at the surfaceaof the bedrock and the rock's capacity Eb , to absorb or deflect the erosive
forces, such that:
Dt = f(E a - Eb E x) (2)
where E is the jet energy deflected by the bedrock at time t (Figure 4).
Spurr presented the most important geological considerations as:
a. The rock mass's resistance to hydrofracture, as governed by itstensile properties, its degree of fracturing, faulting, andbedding plane spacings.
b. The bedrock's resistance to the erosive shear forces exerted onits surface by the action of the jet, as governed by its cohe-sive strength.
Spurr applied the empirical formula for scour depth (Equation 1) developed by
Mason (1984). This formula reproduced the known scour depth at the prototype
reference sites and effectively calibrated Spurr's model.
19. Blaisdell (1983) and Blaisdell and Anderson (1984) also studied
ways to predict scour at cantilevered pipe outlets. Analyses of laboratory
and field data indicated that the maximum depth of scour Z , in terms of the
pipe diameter D , occurs when the ratio Z/D , approximately equals 5.
20. Reinius (1986) measured the water pressures around simulated rock
blocks in a hydraulic flume. His study was based on the assumption that the
rock has cracks in several directions and that water can enter the cracks
causing pressure to build within them. The pressure forces act on the sides
and bottom of the rock block and the pressure from the flowing water acts on
the top surface of the block. If the uplift force is not offset by the weight
of the block, and no other forces in the joints stop movement, the block will
14
.
* 0U 0 Z
-A 0 AW0 MA 0j Il
LL - 0
0 Ul 0
0
00
0-- 4
a
0
r=4b
co.
15w
be lifted and carried away. He also discusses remedial measures, such as
dental concrete to seal and waterproof fractures, and the use of rock bolts
and pressure relief holes.
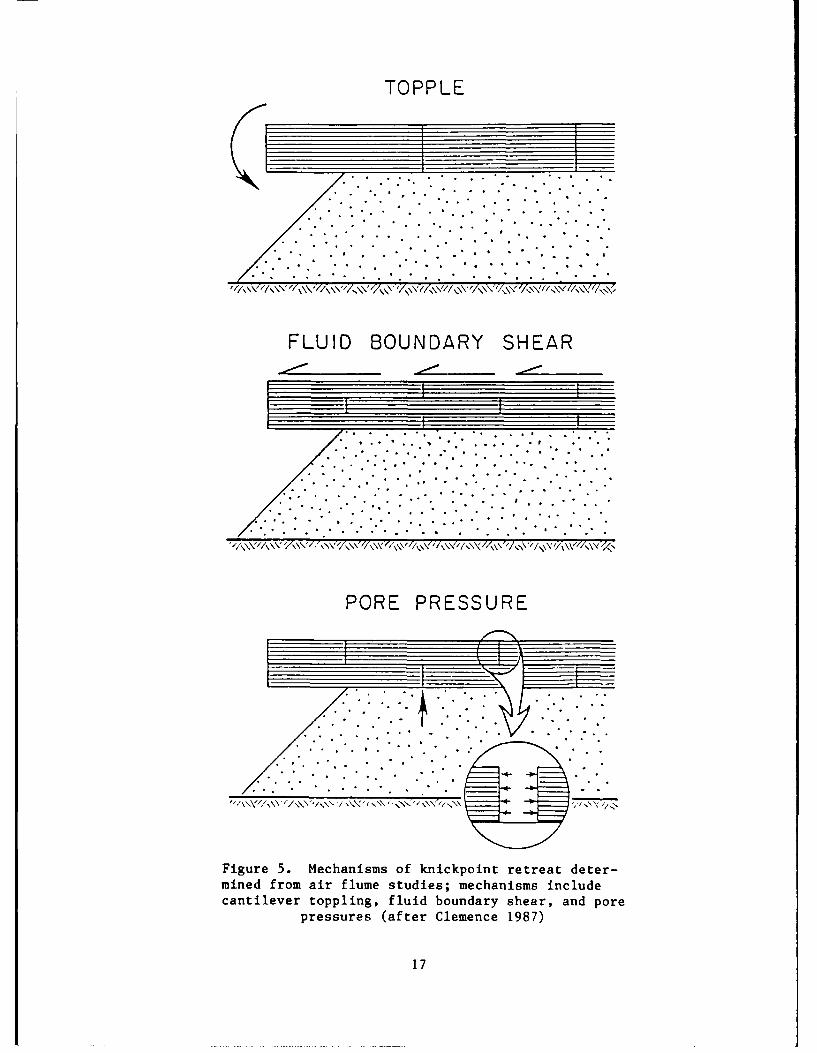
21. Clemence (1987) used an air flume to determine the influence of
stratigraphy and structure on knickpoint erosion. She hypothesized that the
mechanisms of knickpoint retreat involved not only cantilever toppling but
also horizontal fluid boundary shear and pore pressure (Figure 5). The air
flume studies showed that a caprock failing by cantilever toppling remains
stable as long as the caprock's undercut length is less than one-half the
fracture length and the caprock is strong enough to resist cantilever failure.
The thickness and angle of the erodible unit to the overlying caprock control
the amount of undercut. The development of significant fluid pressures in a
permeable erodible unit decreases resistance to shear. An impermeable erodi-
ble unit may also concentrate the force of the water on the undercut slab and
cause tension fractures in the caprock. Thin discontinuous caprock units were
rapidly eroded by fluid boundary shear. As bedding thickness increases, the
knickpoint erosion is controlled by fracture spacing and cantilever toppling.
The flume study by Clemence indicates that fracture spacing and rock tensile
strength are the most significant factors in knickpoint erosion at sites where
unerodible caprock overlies an erodible unit.
22. An analysis was made of spillway erosion at a private lake near
Waco, Texas (Pettigrew 1986). A knickpoint was migrating up the spillway of
Badger Ranch Lake at a rate which would threaten the spillway in a few years.
An estimated 100,000 cu ft of material was removed by the erosion process.
The investigation indicated two possible causes for the structure-threatening
erosion:
a. Excessive velocities at the end of the exit channel may have
initiated the gully.
b. A knickpoint migrating from downstream could have been thecause.
23. One of the main areas of the investigation was the analyses of the
erosion occurring at the knickpoint. A model was presented which showed a
cycle of headwall collapse and debris removal controlling the headward migra-
tion of the gully. The headward migration was accelerated by erosion of the
fissile chale underlying a resistant clay. The mechanics of the collapse were
worked out and described as a wedge failure occurring at a critical height of
16
TOPPLE
.. : .." . . ... .:.: .. . .
FLUID BOUNDARY SHEAR
b .
PORE PRESSURE
Figure 5. Mechanisms of knickpoint retreat deter-mined from air flume studies; mechanisms includecantilever toppling, fluid boundary shear, and pore
pressures (after Clemence 1987)
17
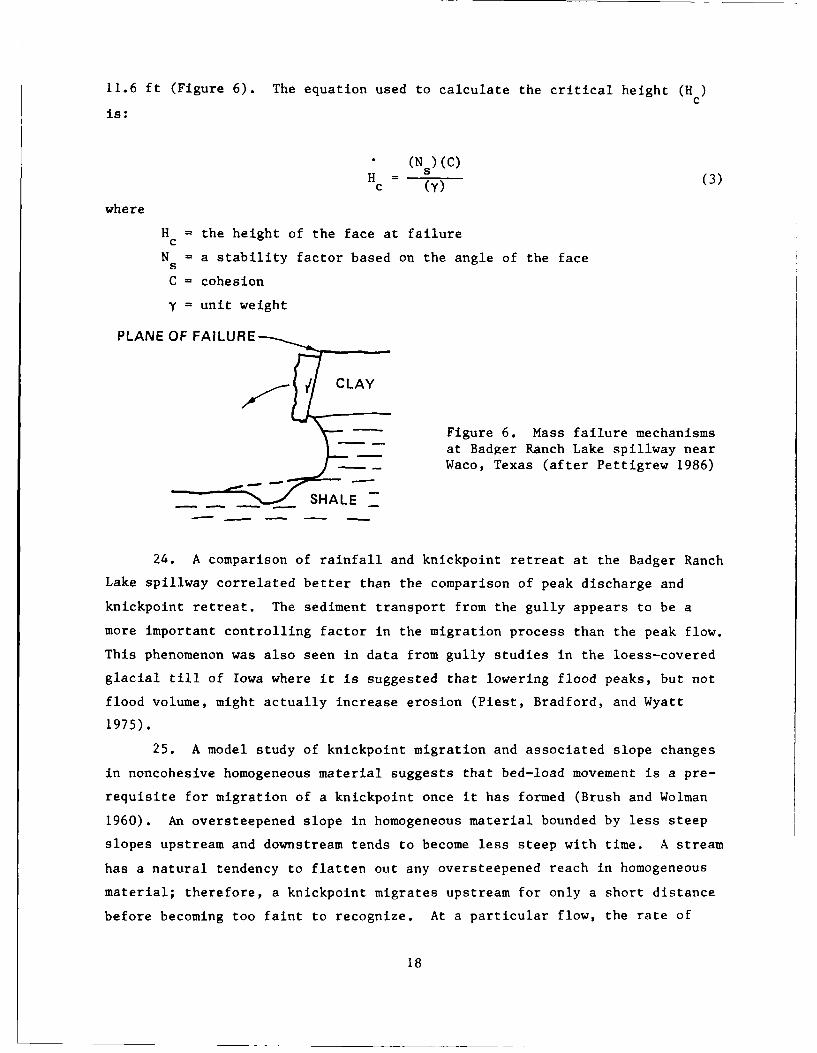
11.6 ft (Figure 6). The equation used to calculate the critical height (H )c
is:
(N s ) (C)H - (3)c (y)
where
H = the height of the face at failurec
N = a stability factor based on the angle of the facesC = cohesion
y = unit weight
PLANE OF FAILURE
CLAY
Figure 6. Mass failure mechanismsat Badger Ranch Lake spillway nearWaco, Texas (after Pettigrew 1986)
SH-IALE_
24. A comparison of rainfall and knickpoint retreat at the Badger Ranch
Lake spillway correlated better than the comparison of peak discharge and
knickpoint retreat. The sediment transport from the gully appears to be a
more important controlling factor in the migration process than the peak flow.
This phenomenon was also seen in data from gully studies in the loess-covered
glacial till of Iowa where it is suggested that lowering flood peaks, but not
flood volume, might actually increase erosion (Piest, Bradford, and Wyatt
1975).
25. A model study of knickpoint migration and associated slope changes
in noncohesive homogeneous material suggests that bed-load movement is a pre-
requisite for migration of a knickpoint once it has formed (Brush and Wolman
1960). An oversteepened slope in homogeneous material bounded by less steep
slopes upstream and downstream tends to become less steep with time. A stream
has a natural tendency to flatten out any oversteepened reach in homogeneous
material; therefore, a knickpoint migrates upstream for only a short distance
before becoming too faint to recognize. At a particular flow, the rate of
18
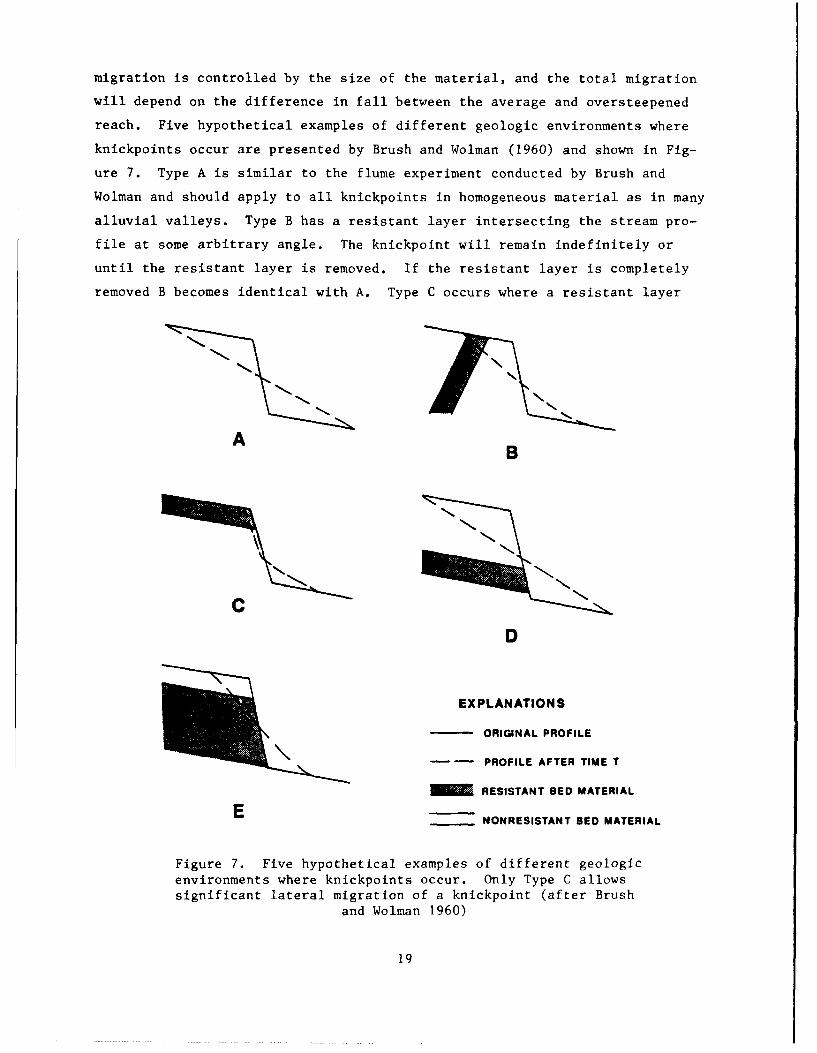
migration is controlled by the size of the material, and the total migration
will depend on the difference in fall between the average and oversteepened
reach. Five hypothetical examples of different geologic environments where
knickpoints occur are presented by Brush and Wolman (1960) and shown in Fig-
ure 7. Type A is similar to the flume experiment conducted by Brush and
Wolman and should apply to all knickpoints in homogeneous material as in many
alluvial valleys. Type B has a resistant layer intersecting the stream pro-
file at some arbitrary angle. The knickpoint will remain indefinitely or
until the resistant layer is removed. If the resistant layer is completely
removed B becomes identical with A. Type C occurs where a resistant layer
IBMB
D
EXPLANATIONS
ORIGINAL PROFILE
--- PROFILE AFTER TIME T
RESISTANT BED MATERIAL
E -NONRESISTANT BED MATERIAL
Figure 7. Five hypothetical examples of different geologicenvironments where knickpoints occur. Only Type C allowssignificant lateral migration of a knickpoint (after Brush
and Wolman 1960)
19
caps an underlying nonresistant bed. In the case of Type C, the slope below
the knickpoint may be vertical depending on the relative differences in resis-
tance to erosion of the two kinds of material. Types D and E are special
cases of the preceding types.
26. Falls are a special case of Type C where the vertical slope is
caused by undermining. A knickpoint cannot easily bypass a resistant layer
and in some cases a series of knickpoints caused by various base level or cli-
matic changes will merge at one point along a stream profile. Headcut devel-
opment and migration in alluvium or colluvium may involve seepage or underflow
as well as differential resistance.
27. The maximum distance a knickpoint may travel given unlimited time
is controlled by the ratio of the slope of the oversteepened reach to the
average slope of the channel. The greater the ratio, the farther the knick-
point will migrate given unlimited time.
Theoretical Considerations
General statement
28. Studies by Schumm (1973) point out that the concepts of complex
response and geomorphic thresholds in stream systems are related to erosion
phenomena such as rapid mass movement and tributary rejuvenation. These geo-
morphic thresholds imply that morphogenetic processes are episodic in nature.
The triggering mechanisms for these episodic events can be external forces
such as rainstorms or seismic activity or internal forces such as oversteepen-
ing of reaches. Aggradation and degradation at different loci within a stream
system cause episodic sediment yields which move downstream and result in
major changes in channel morphology with time.
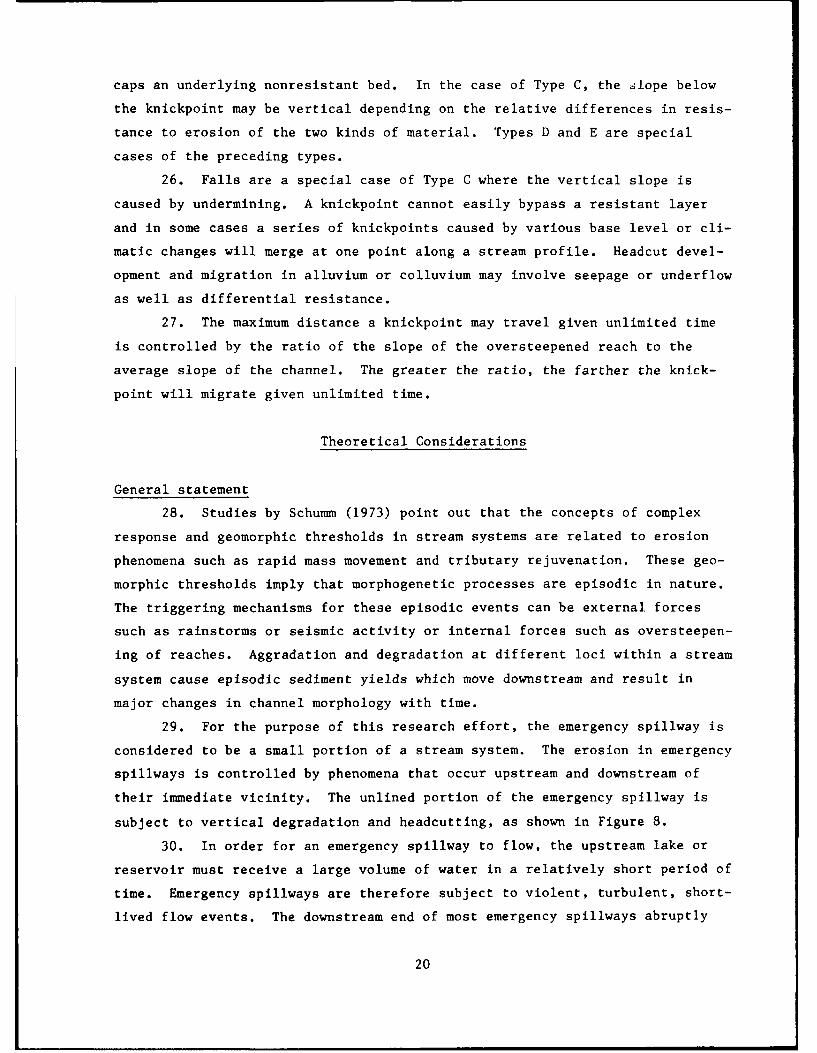
29. For the purpose of this research effort, the emergency spillway is
considered to be a small portion of a stream system. The erosion in emergency
spillways is controlled by phenomena that occur upstream and downstream of
their immediate vicinity. The unlined portion of the emergency spillway is
subject to vertical degradation and headcutting, as shown in Figure 8.
30. In order for an emergency spillway to flow, the upstream lake or
reservoir must receive a large volume of water in a relatively short period of
time. Emergency spillways are therefore subject to violent, turbulent, short-
lived flow events. The downstream end of most emergency spillways abruptly
20
60
CL
00
o
Q ::3iii !i!! !~ii:i:!.i
00
0)Q
C E ". o
0~0
u >0
c:::: QJ- -4,
0
cli
0
.4.'
C21
:::::::::::::::::::::::::C:::o' I i:: :::::::::::::::::::::0) :-:
C u Ci)::::::::::::::::::::::::
• ..h..: ':w:::: !!0 ) 0):::::::: :::: .
o C :::::::::::::::::::o:::::::::::::::::::::::0::,:: ============== ======:U U:::::::::::::::::::::::::: 0
:::::::::::::::C.)::::::::: : .-:o H C.:U':::!:::i:::
V
' :::::'::::::': " "" :""CU .i.
: -:..: .: ..::. ::::::.:: ::.:::.::: - .... C )
... :!i :: ? .::::!:ii~i:i;:i : ..:.? ::: b.!).:C"" :.;'.:::.....::::::::..Z::!: :.21::. C:% :-.. .:::::: .*..-..Ci)
Ci
°i
U ~ C2)
drops into a natural stream valley, thus producing a severe oversteepened
reach or knickpoint.
31. The hypothesis of this research is that during these violent flow
events severe erosion is governed by certain erosion thresholds, which are in
turn primarily controlled by the flow velocities and the site geology. The
site geology is important because it is responsible for the geometry of the
knickpoint. The erosion thresholds pertaining to emergency spillways are also
present in certain reaches of natural streams and could explain, in part, the
episodic erosion phenomena that have been reported so often by other research-
ers such as Piest, Bradford, and Wyatt (1975).
Spillway erosion as a continuum
32. Because of the numerous complex factors which contribute to the
spillway erosion problem, it was viewed as a "continuum' with tractive force
scour of individual grains on one end and turbulent flow dynamic block scour
on the other end. During the study of numerous case histories, it was noted
that various types of erosion could occur at the same location within a given
spillway during a single flood event. Tractive force scour is usually taken
into consideration in the design of emergency spillways. The SCS has devel-
oped excellent criteria for the design of grass-lined spillways (Temple 1980,
1982, 1983, 1984, 1986). However, the significant erosion problems which
occurred at most of the sites visited during this research were not caused by
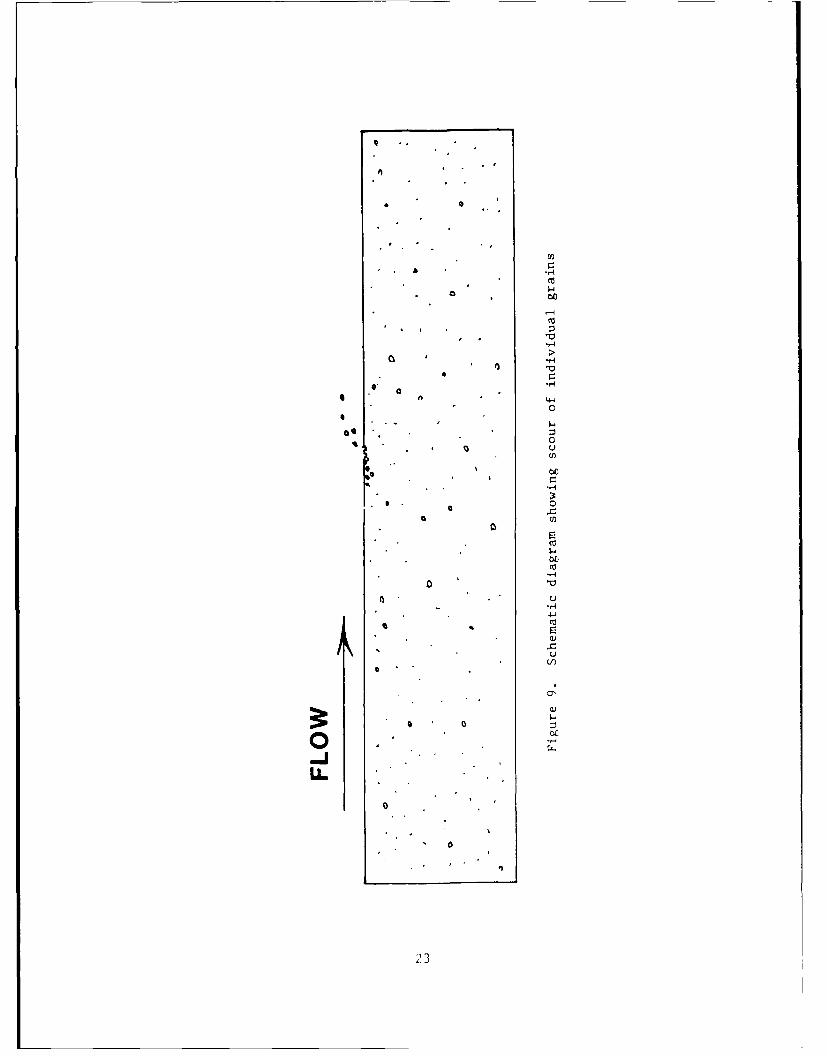
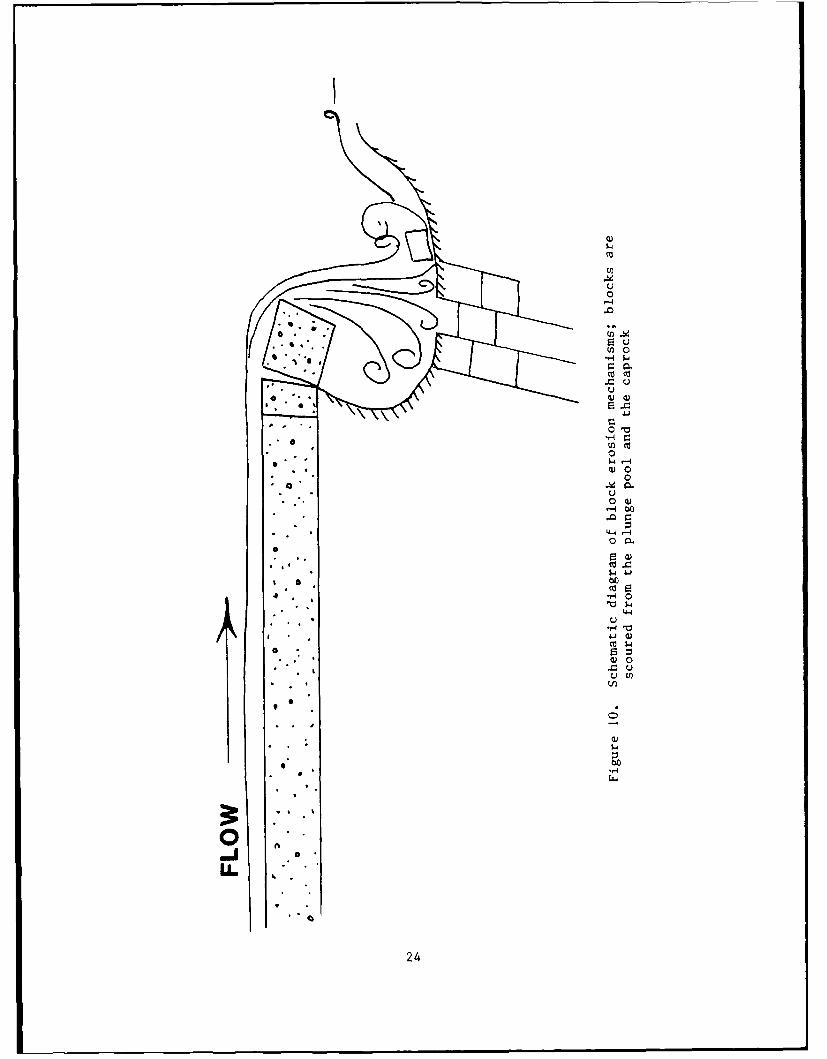
the scour of individual grains (Figure 9) but by the mass wasting of large
blocks of material (Figure 10). Tractive force scour is often the first phase
in the emergency spillway erosion "continuum" and may lead to the more
severe block erosion.
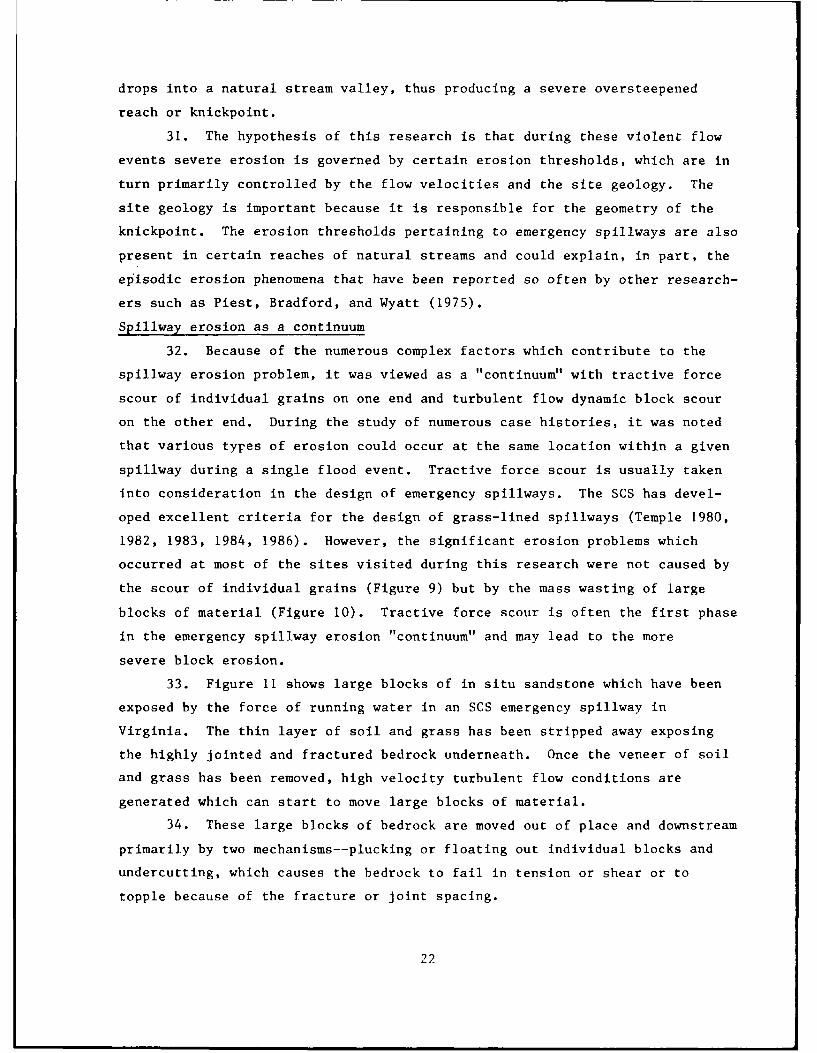
33. Figure 11 shows large blocks of in situ sandstone which have been
exposed by the force of running water in an SCS emergency spillway in
Virginia. The thin layer of soil and grass has been stripped away exposing
the highly jointed and fractured bedrock underneath. Once the veneer of soil
and grass has been removed, high velocity turbulent flow conditions are
generated which can start to move large blocks of material.
34. These large blocks of bedrock are moved out of place and downstream
primarily by two mechanisms--plucking or floating out individual blocks and
undercutting, which causes the bedrock to fail in tension or shear or to
topple because of the fracture or joint spacing.
22
* 0
06
-i 0
LL- -
0* * 23
Cc
U)
U)0
U0
4,4 r-4
-4 4J
0
O)
4) 0
4 24
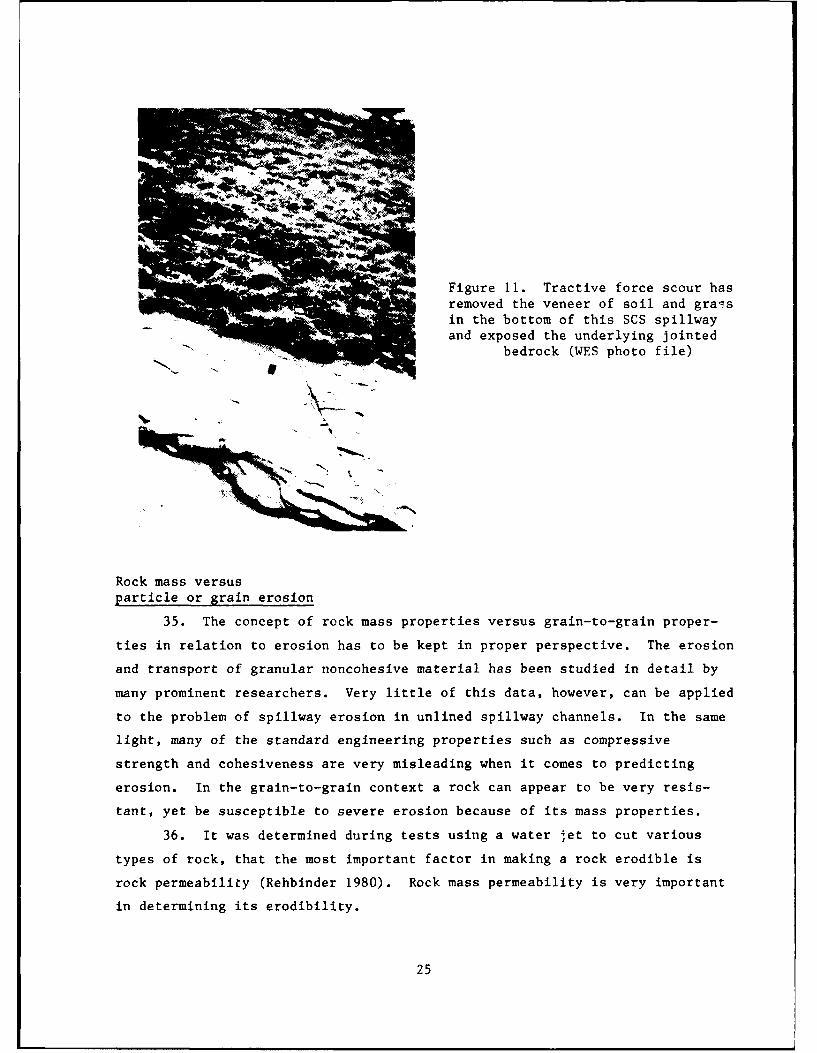
Figure 11. Tractive force scour hasremoved the veneer of soil and graqsin the bottom of this SCS spillwayand exposed the underlying jointed
bedrock (WES photo file)
Rock mass versus
particle or grain erosion
35. The concept of rock mass properties versus grain-to-grain proper-
ties in relation to erosion has to be kept in proper perspective. The erosion
and transport of granular noncohesive material has been studied in detail by
many prominent researchers. Very little of this data, however, can be applied
to the problem of spillway erosion in unlined spillway channels. In the same
light, many of the standard engineering properties such as compressive
strength and cohesiveness are very misleading when it comes to predicting
erosion. In the grain-to-grain context a rock can appear to be very resis-
tant, yet be susceptible to severe erosion because of its mass properties.
36. It was determined during tests using a water jet to cut various
types of rock, that the most important factor in making a rock erodible is
rock permeability (Rehbinder 1980). Rock mass permeability is very important
in determining its erodibility.
25
37. Tractive force scour. Tractive force scour of grains and particles
must be discussed as an end member in the erosion "continuum" concept. Berg
(1986) discussed the complex processes that influence the erosion, transport,
and deposition of material by considering the forces that act on individual
particles. He found that grain size and shape along with adhesion tension are
important variables in calculating erosion velocities for sediments. If the
orientation of the grains relative to the water flow is known, the drag force
needed to cause movement can be expressed by the equation:
Fd = F (tan) (4)
whereFd = drag force
F = the gravitational forceg* = the angle of repose
38. It is also important to consider the orientation of the grains in
relation to the flow of water. Berg (1986) estimated erosion velocities for
differing grain orientations. For example, using the angle of repose * , the
surface area exposed to drag, and grain size, he determined the threshold
velocity for material with a grain diameter of I mm would be approximately
19 cm/sec. Sediments that have been partially dried may contain small amounts
of water at points of grain contact. The adhesion of water gives the material
more erosion resistance. Berg's velocities agreed closely with those pre-
sented by Hjulstrom (1939) and shown in Figure 12.
39. If grains or particles are cemented they become even more resistant
to the forces of moving water. Regardless of how cemented the grains of a
material may be, if the velocity of the water is high enough, scour will take
place. According to CE guidance on the design of channels, even competent
igneous and metamorphic rocks will be scoured at a mean channel velocity of
20 ft/sec (US Army Corps of Engineers 1970). The velocities needed to scour
various materials are presented in Table 1.
40. Simonson (1979) indicates that material with compressive strengths
of 14,000 psi can be scoured by velocities of 29 ft/sec. Tractive force scour
of grains or particles was not dealt with in this study except as an end
member in the erosion "continuum" concept.
26
1000
EROSION
'g 100
E
10
LU,
1 Ole DEPOSITION
0.1 1 1 1
0.001 0.01 0.1 1.0 10 100
GRAIN DIAMETER (mm)Figure 12. Hjulstrom's (1935) diagram shows the velocities needed
to erode, transport, and deposit grains of varying sizes
41. Dynamic block scour. The failure of large blocks of material can
occur in several ways including plucking or lifting of fractured blocks,
cantilever toppling based on fracture spacing, tensional failure of the cap-
ping layer, and shear failure of large homogeneous masses of material. In
fractured rocks, water can propagate into the cracks causing pressure to build
up within them. The pressure acts on the sides and bottom of a block, while
the pressure from the water flowing across the top of the block causes an
uplift force (Reinius 1986). The plucking of large blocks of material can
result in very large volumetric erosion and removal of material from a site.
42. The research concerning the dynamic block erosion caused by free-
falling trajectory jets gives insight into the knickpoint migration problem,
but cannot be applied directly to the problem of block scour at knickpolnts
(Vieux 1986; Mason 1984; Spurr 1985). The trajectory jet studies are con-
cerned with depth of scour; whereas, the knickpoint migration problem concerns
rapid lateral erosion. The geological considerations presented by Spurr
(1985) as being important in predicting erosion, such as resistance to
27
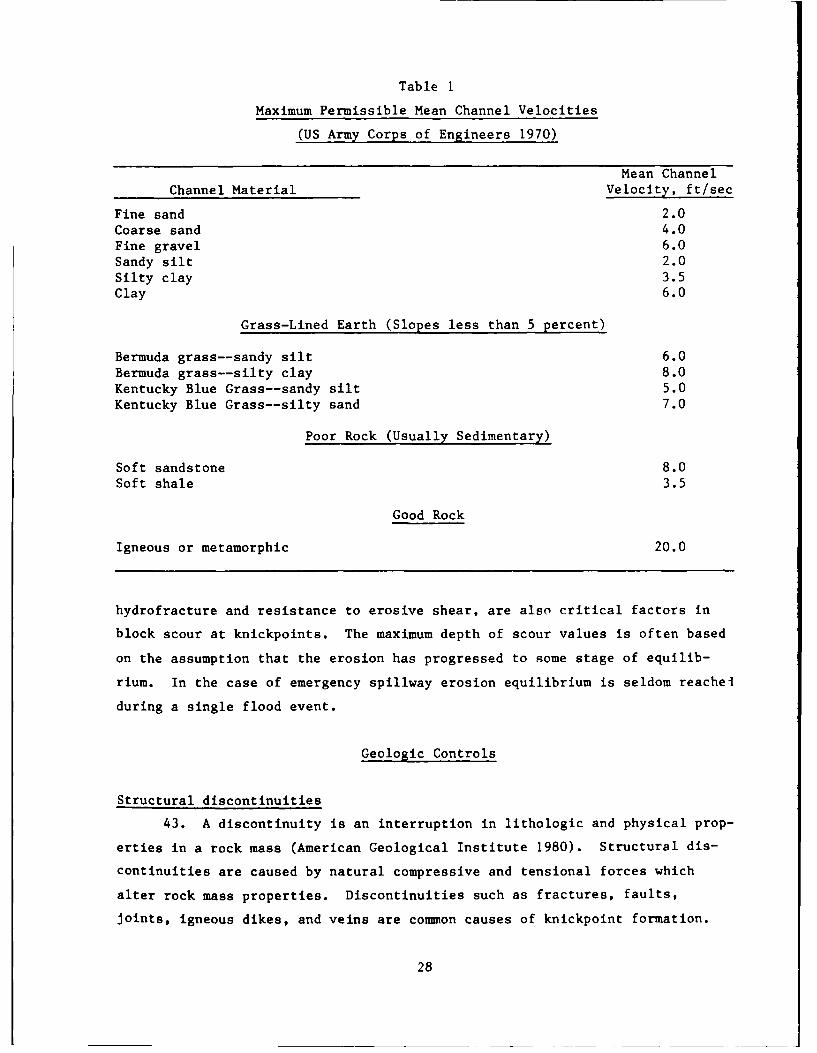
Table 1
Maximum Permissible Mean Channel Velocities
(US Army Corps of Engineers 1970)
Mean ChannelChannel Material Velocity, ft/sec
Fine sand 2.0Coarse sand 4.0Fine gravel 6.0Sandy silt 2.0Silty clay 3.5Clay 6.0
Grass-Lined Earth (Slopes less than 5 percent)
Bermuda grass--sandy silt 6.0Bermuda grass--silty clay 8.0Kentucky Blue Grass--sandy silt 5.0Kentucky Blue Grass--silty sand 7.0
Poor Rock (Usually Sedimentary)
Soft sandstone 8.0Soft shale 3.5
Good Rock
Igneous or metamorphic 20.0
hydrofracture and resistance to erosive shear, are also critical factors in
block scour at knickpoints. The maximum depth of scour values is often based
on the assumption that the erosion has progressed to some stage of equilib-
rium. In the case of emergency spillway erosion equilibrium is seldom reachei
during a single flood event.
Geologic Controls
Structural discontinuities
43. A discontinuity is an interruption in lithologic and physical prop-
erties in a rock mass (American Geological Institute 1980). Structural dis-
continuities are caused by natural compressive and tensional forces which
alter rock mass properties. Discontinuities such as fractures, faults,
Joints, igneous dikes, and veins are common causes of knickpoint formation.
28
Fractures are due to mechanical failure by stress and include erosion in gen-
eral and knickpoint initiation in particular. The shearing and brecciation
associated with faulting can also result in enhanced chemical and physical
weathering of affected rock.
44. Joints, which usually occur in sets, are planar surfaces along
which no displacement has occurred. Joint fissures, which are the fractures
which separate the rock, may be filled with clay, calcite, gypsum, crushed
rock fragments, or other material at depth, or they may be open near the sur-
face. The tendency of joint sets to divide rock into blocks is important in
predicting erosion potential. Reinius (1986) demonstrated that blocks of rock
can be easily plucked by the forces of moving water and transported down-
stream. For example, open-joint fissures segmented the hard sandstone ledges,
forming the floor of the Saylorville spillway, and contributed to the severe
erosion.
Stratigraphic discontinuities
45. The majority of the erosion case histories studied for this
research was associated with stratigraphic discontinuities. Stratigraphic
discontinuities include stratified sedimentary rock sequences including those
interbedded with volcanic and volcano-clastic rocks. These discontinuities
include bedding planes, bed contacts, stratigraphic contacts, unconformities,
pinchouts, facies changes, and sedimentary structures and textures (Cameron
et al. 1988b).
46. Bedding planes are surfaces of deposition that visibly separate
successive layers of stratified material (American Geological Institute 1980).
These bedding planes separate lamina (less than I cm thick), stratum (greater
than 1 cm thick), and beds (thicker units composed of several strata or lam-
ina). Bedding planes often mark distinct boundaries between materials depos-
ited in various environments of deposition. Coarse grained basal alluvial
sand and gravel can have an abrupt contact with an underlying shallow marine
clay. Bedding planes play an important role in erosion, especially in the
propagation of a head cut where a resistant layer overlies a more erodible
unit. Bedding planes are also important in conjunction with Joints because at
the intersections the strata are divided into blocks which are susceptible to
plucking during flood events. Thinly bedded shales are easily weathered and
subsequently eroded by tractive force shear.
29
47. Sedimentary structures are described by Berg (1986) as being the
most characteristic features of sedimentary rocks and resulting from either
primary stratification caused by sedimentary processes or secondary stratifi-
cation produced by biological or physical changes shortly after deposition.
Critically located sedimentary structures can initiate and influence the rate
of erosion.
48. Unconformities represent erosional or nondepositional surfaces in
the geologic record that can bring rocks of vastly different ages and composi-
tions into abrupt contact. An unconformity which places a nonerodible mate-
rial over an erodible one forms the same stratigraphic discontinuity as
bedding contacts between materials of different erodibilities. Pinch-outs and
facies changes can cause abrupt lateral lithologic changes which are important
factors in initiating a headcut. The rate of migration is often dependent on
lateral facies changes and can increase or decrease dramatically as a result
of these changes. Lithostratigraphic control is the "key" factor which con-
trols the initiation and rate of erosion in stratified rock sequences. Sudden
changes in stratigraphy, both vertically and laterally, control the geometry
of the knickpoint, which in turn controls the severity of erosion.
49. The occurrence of a knickpoint is dependent on stratigraphic or
other types of inhomogeneities in underlying materials. The location of the
knickpoint is controlled by the occurrence of erosion-resistant materials in
the channel which temporarily prevent downcutting. An example of a knickpoint
in a natural stream is shown in Figure 13. Erosion studies by the Soil Con-
servation Service in northern Mississippi showed that erosion-resistant pale-
osols caused knickpoints to form. The knickpoints migrated upstream as the
paleosol failed in large blocks which were bounded by ancient desiccation
cracks (Grissinger 1984).
50. Knickpoints are caused by a combination of conditions which cause
channel degradation. According to Schumm (1973), the parameters that describe
the geometric and discharge characteristics of stream channels which control
degradation are:
W, stream width (L)
D, stream depth, water depth (L)
s, stream gradient (L/L)
Mw, meander wavelength (L)
30
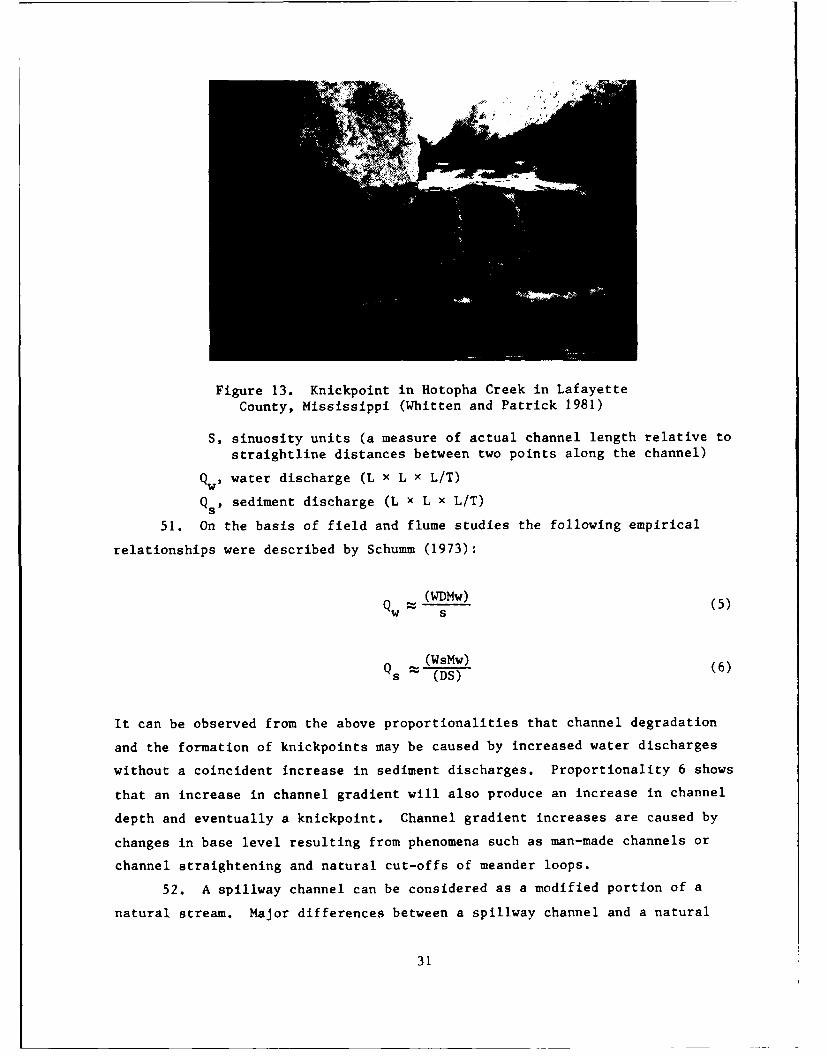
Figure 13. Knickpoint in Hotopha Creek in Lafayette
County, Mississippi (Whitten and Patrick 1981)
S, sinuosity units (a measure of actual channel length relative to
straightline distances between two points along the channel)
Qw' water discharge (L x L x L/T)
Qs' sediment discharge (L x L x L/T)
51. On the basis of field and flume studies the following empirical
relationships were described by Schumm (1973):
(WDMw) (5)Qw s -f-
(WsMw) (6)s (DS)
It can be observed from the above proportionalities that channel degradation
and the formation of knickpoints may be caused by increased water discharges
without a coincident increase in sediment discharges. Proportionality 6 shows
that an increase in channel gradient will also produce an increase in channel
depth and eventually a knickpoint. Channel gradient increases are caused by
changes in base level resulting from phenomena such as man-made channels or
channel straightening and natural cut-offs of meander loops.
52. A spillway channel can be considered as a modified portion of a
natural stream. Major differences between a spillway channel and a natural
31
stream are that flow in the spillway channel is usually sporadic and the
knickpoint is usually located where the constructed portion of the spillway
intersects the natural topography. A significant drop in elevation also
usually occurs at this intersection which initiates headward migration of the
knickpoint.
53. Very subtle variations in erosion resistance can cause the develop-
ment of a knickpoint such as one at an SCS emergency spillway on Mistequay
Creek in Michigan observed by the author. At first glance the material at
this site seemed to be composed of fairly uniform glacial till, but closer
examination revealed a buried paleosol which was slightly more resistant to
erosion than the material just below it. The inhomogeneity provided by the
paleosol helped to initiate a large knickpoint which migrated headward toward
the dam. It cannot be overemphasized that discontinuities and inhomogeneities
are critical factors influencing the initiation and rate of migration of
knickpoints. The knickpoint phenomenon apparently played a key role in
erosion which led to structural failure at the DMAD reservoir in Utah and at
Black Creek No. 53, an SCS project in Holmes County, Mississippi (Cameron et
al. 1986). Knickpoint migration was also apparent at CE emergency spillways
at Grapevine and Saylorville Reservoirs (Cameron et al. 1986).
Stair-step phenomena
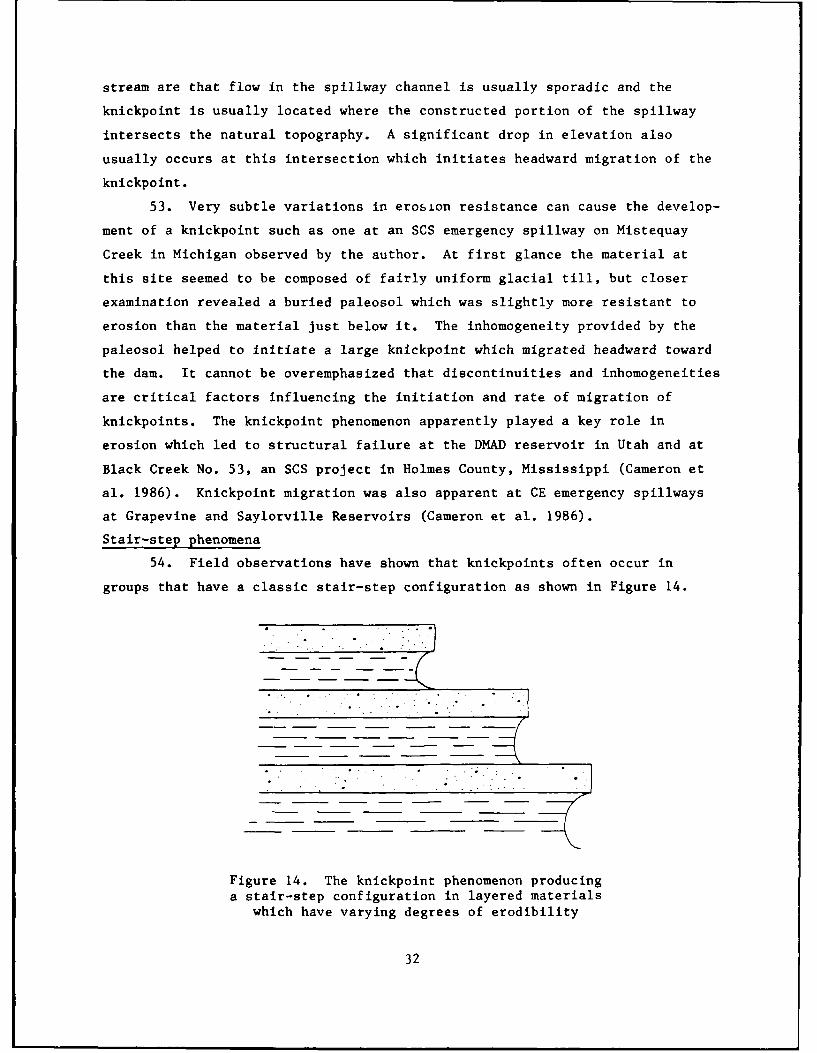
54. Field observations have shown that knickpoints often occur in
groups that have a classic stair-step configuration as shown in Figure 14.
Figure 14. The knickpoint phenomenon producinga stair-step configuration in layered materials
which have varying degrees of erodibility
32
The stair-step configuration is caused by repetition of the knickpoint phenom-
enon as it acts on layered materials with varying degrees of erodibility.
Given enough time that stair-step configuration would evolve to an overfall
that would be controlled by the most erosion resistant layer. However, the
short duration flows in emergency spillways commonly cause a stair-step pat-
tern to develop.
Mass failure mechan-isms at the knickpoint
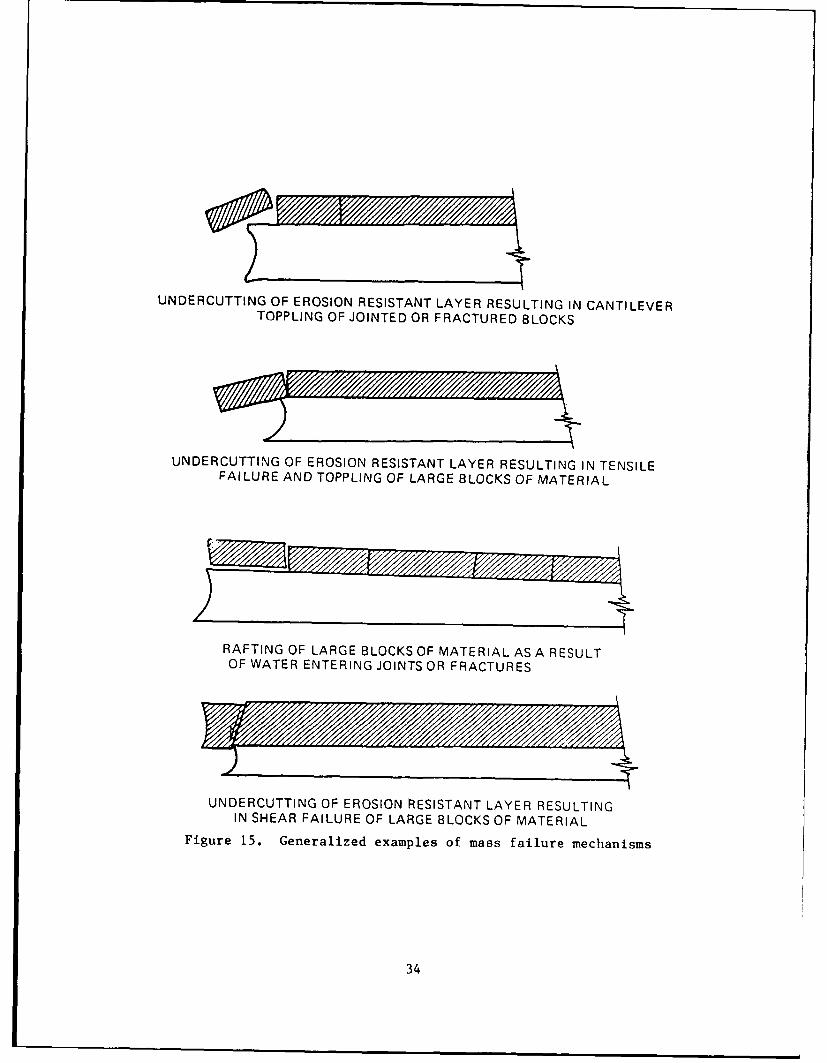
55. Although mass failure mechanisms associated with knickpoint migra-
tion are often complex, they generally fall under one of the following catego-
ries which are illustrated in Figure 15:
a. Undercutting of caprock resulting in cantilever toppling ofjointed or fractured caprock.
b. Undercutting of caprock resulting in tensile failure and top-pling of caprock.
c. Rafting of large blocks of jointed material as a result ofwater entering joints or fractures.
d. Undercutting of a thick erosion resistant top layer resultingin shear failure of large block of material.
33
UNDERCUTTING OF EROSION RESISTANT LAYER RESULTING IN CANTILEVERTOPPLING OF JOINTED OR FRACTURED BLOCKS
UNDERCUTTING OF EROSION RESISTANT LAYER RESULTING IN TENSILEFAILURE AND TOPPLING OF LARGE BLOCKS OF MATERIAL
RAFTING OF LARGE BLOCKS OF MATERIAL ASA RESULTOF WATER ENTERING JOINTS OR FRACTURES
UNDERCUTTING OF EROSION RESISTANT LAYER RESULTINGIN SHEAR FAILURE OF LARGE BLOCKS OF MATERIAL
Figure 15. Generalized examples of mass failure mechanisms
34
PART III: EXPERIMENTAL DESIGN AND PROCEDURES
Flume Design
Principles of operation
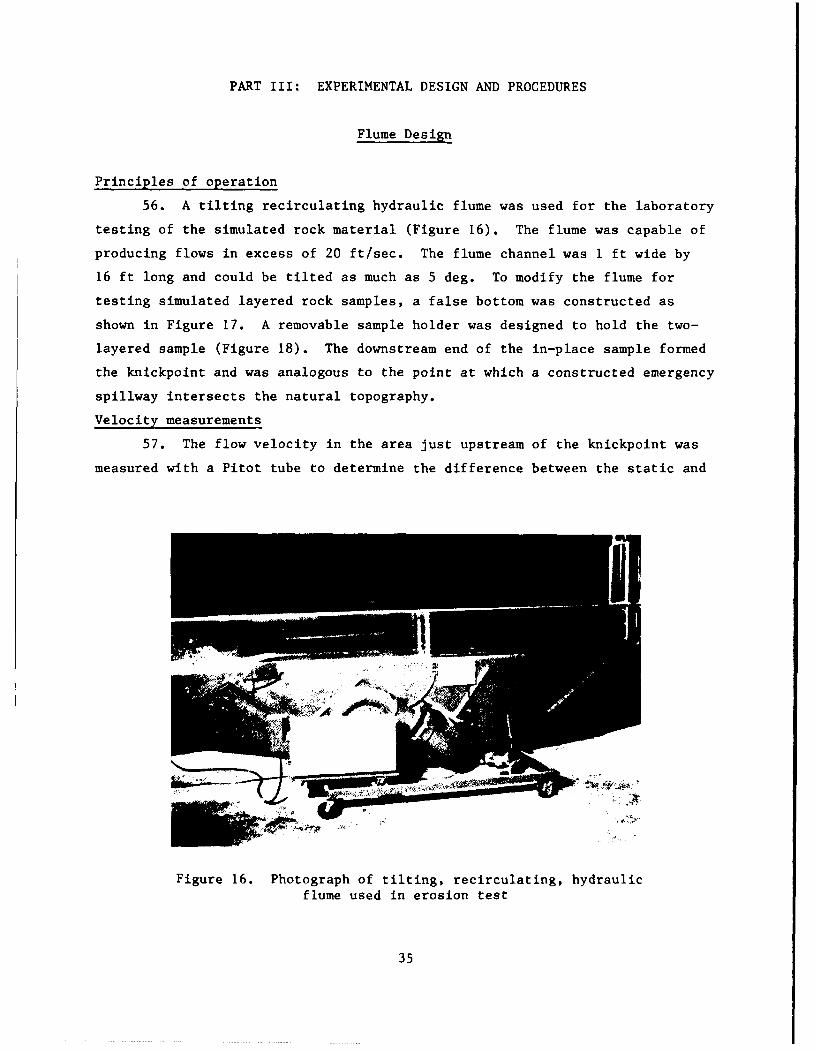
56. A tilting recirculating hydraulic flume was used for the laboratory
testing of the simulated rock material (Figure 16). The flume was capable of
producing flows in excess of 20 ft/sec. The flume channel was 1 ft wide by
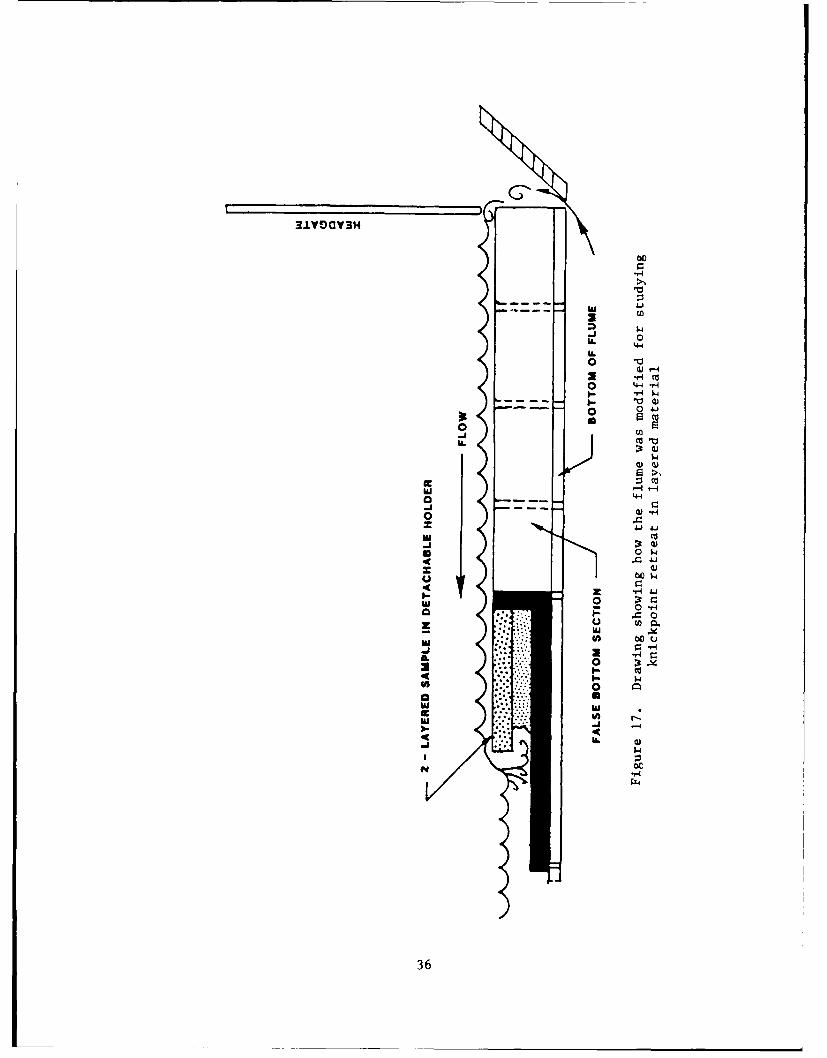
16 ft long and could be tilted as much as 5 deg. To modify the flume for
testing simulated layered rock samples, a false bottom was constructed as
shown in Figure 17. A removable sample holder was designed to hold the two-
layered sample (Figure 18). The downstream end of the in-place sample formed
the knickpoint and was analogous to the point at which a constructed emergency
spillway intersects the natural topography.
Velocity measurements
57. The flow velocity in the area just upstream of the knickpoint was
measured with a Pitot tube to determine the difference between the static and
Figure 16. Photograph of tilting, recirculating, hydraulic
flume used in erosion test
35
0
lo
0 $4
00r
Waa
3b - -
4) 4.c.jU
-r-*3
36,4.
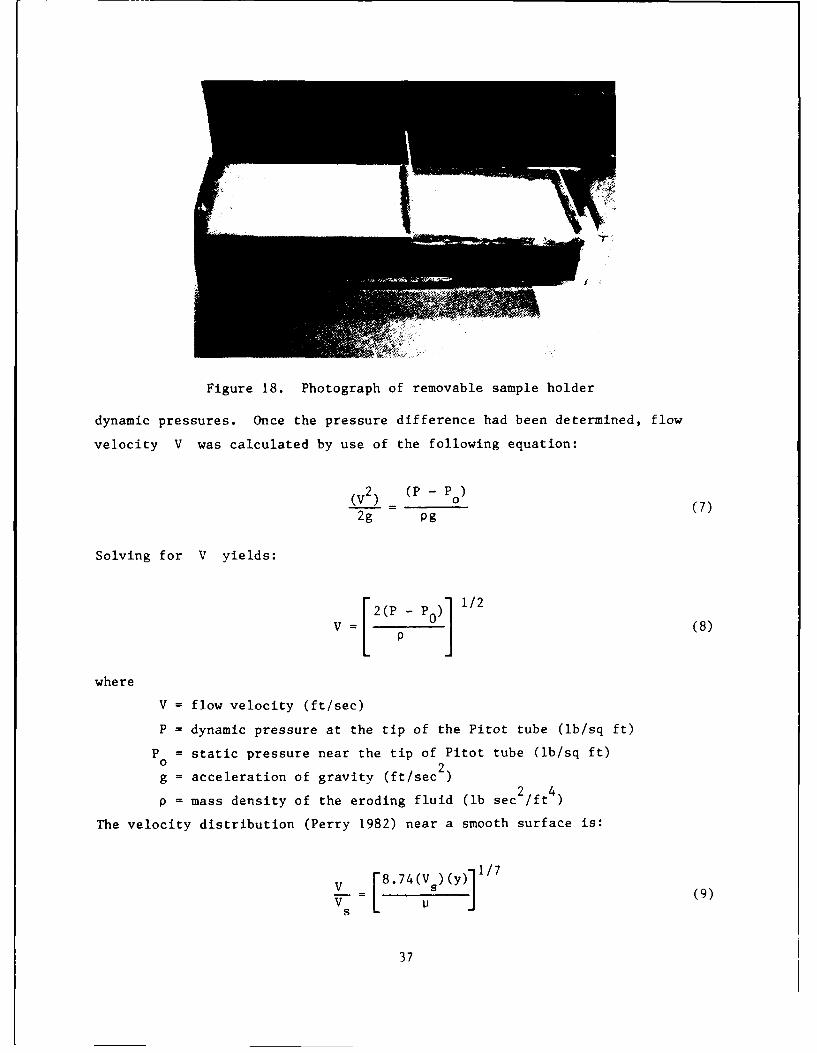
Figure 18. Photograph of removable sample holder
dynamic pressures. Once the pressure difference had been determined, flow
velocity V was calculated by use of the following equation:
(V2 ) (P - Po)(V) 0 (7)
2g Pg
Solving for V yields:
V = [2(P - P0)] 1/2 (8)
where
V = flow velocity (ft/sec)
P = dynamic pressure at the tip of the Pitot tube (lb/sq ft)
P = static pressure near the tip of Pitot tube (lb/sq ft)
g = acceleration of gravity (ft/sec )
p = mass density of the eroding fluid (lb sec 2/ft )
The velocity distribution (Perry 1982) near a smooth surface is:
V = [8.74(Vs)(y) (9)
s
37
where
V = flow velocity at a distance y from the boundary (ft/sec)
V = shear velocity (ft/sec)s
y = distance from the boundary (ft)
V = kinematic viscosity of the eroding water (sq ft/sec)
The shear velocity is:
V = (10)
where
T = hydraulic or tractive shear stress (lb/sq ft)
p = mass density of the eroding fluid (lb sec 2/ft )
58. By placing the Pitot tube on the bed of the flume, the distance y
from the boundary at which the flow velocity can be measureU is:
dy (11)
where dt is the outside diameter of the Pitot tube (ft). In order to calcu-
late the tractive shear stress, Equations 10 and 11 were combined with Equa-
tions 8 and 9 to yield:
T = (p- p [) 0 3 (12)
For a 0.125-in. outside diameter Pitot tube and water at 700 F the tractive
shear stress is:
T = 9.62 x i0-3 (P - P)7/8 (13)
59. For the knickpoint erosion studies thd Pitot tube system had to be
modified. A three-way in-line valve was installed so that the tubes could be
filled with water and the air allowed to bleed out. The Pitot tube apparatus
and transducer were separated from the flume by constructing a wooden frame
which held the apparatus and buffered vibrations during erosion tests
(Figure 19).
38
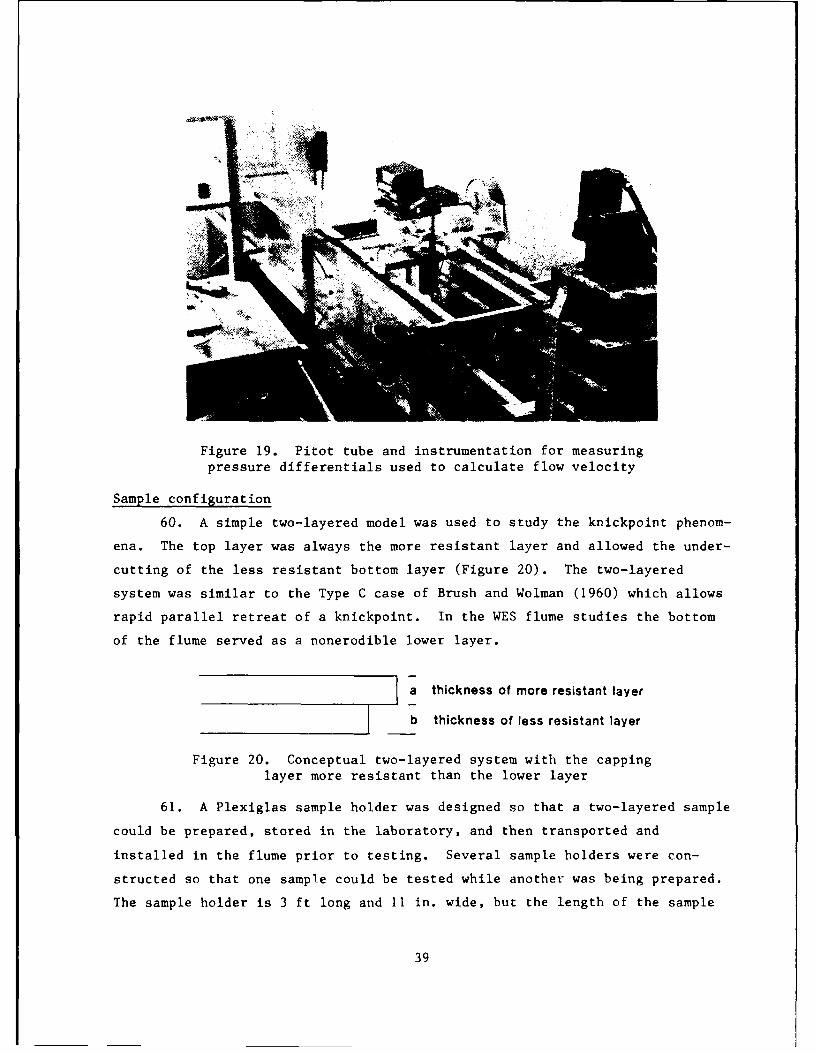
Figure 19. Pitot tube and instrumentation for measuringpressure differentials used to calculate flow velocity
Sample configuration
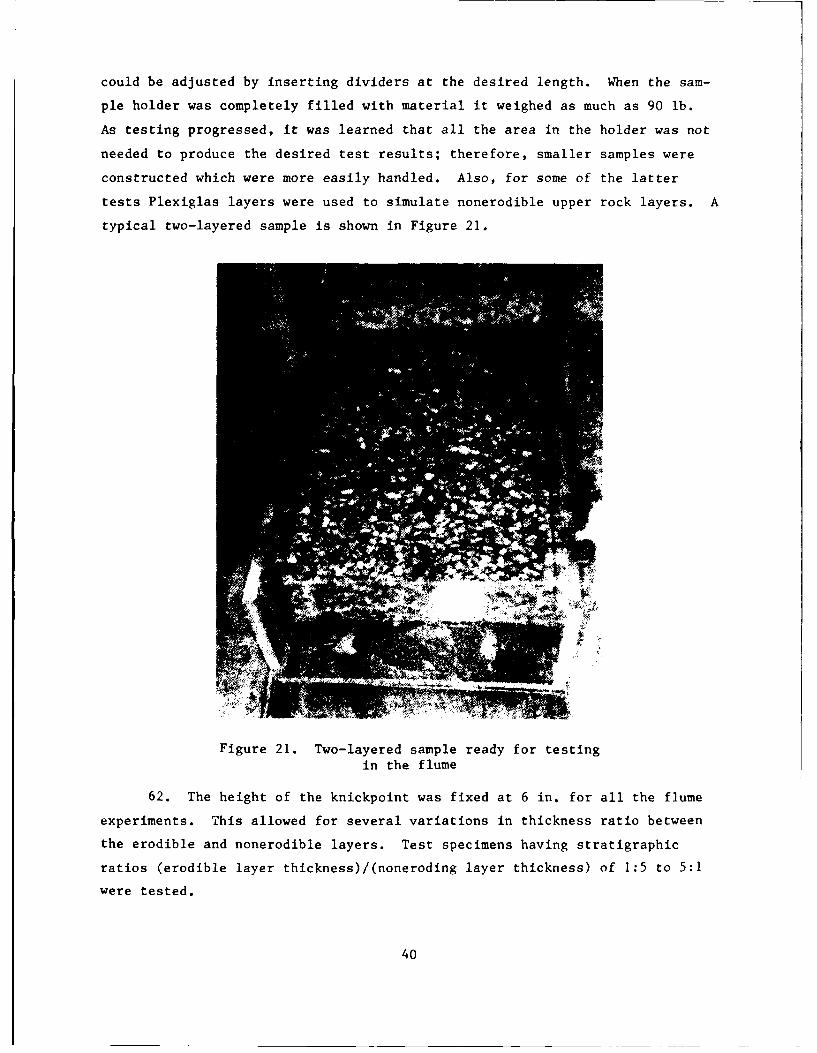
60. A simple two-layered model was used to study the knickpoint phenom-
ena. The top layer was always the more resistant layer and allowed the under-
cutting of the less resistant bottom layer (Figure 20). The two-layered
system was similar to the Type C case of Brush and Wolman (1960) which allows
rapid parallel retreat of a knickpoint. In the WES flume studies the bottom
of the flume served as a nonerodible lower layer.
a thickness of more resistant layer
b thickness of less resistant layer
Figure 20. Conceptual two-layered system with the cappinglayer more resistant than the lower layer
61. A Plexiglas sample holder was designed so that a two-layered sample
could be prepared, stored in the laboratory, and then transported and
installed in the flume prior to testing. Several sample holders were con-
structed so that one sample could be tested while another was being prepared.
The sample holder is 3 ft long and 11 in. wide, but the length of the sample
39
could be adjusted by inserting dividers at the desired length. When the sam-
ple holder was completely filled with material it weighed as much as 90 lb.
As testing progressed, it was learned that all the area in the holder was not
needed to produce the desired test results; therefore, smaller samples were
constructed which were more easily handled. Also, for some of the latter
tests Plexiglas layers were used to simulate nonerodible upper rock layers. A
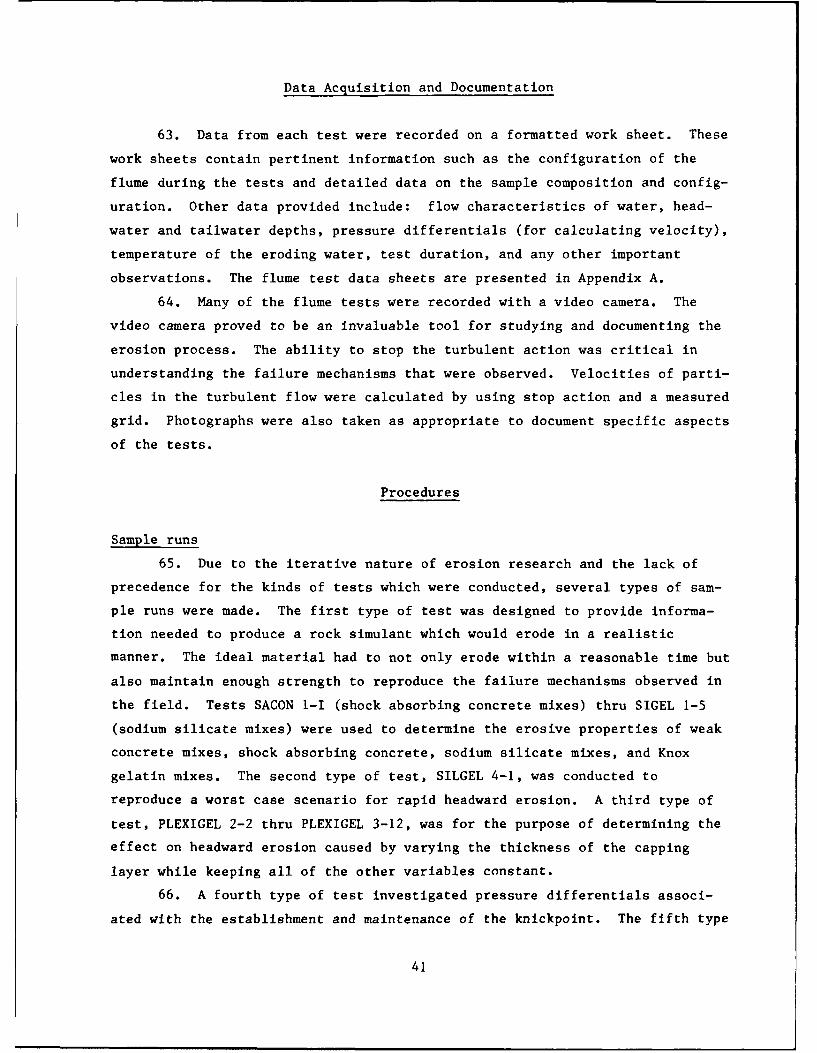
typical two-layered sample is shown in Figure 21.
I
Figure 21. Two-layered sample ready for testing
in the flume
62. The height of the knickpoint was fixed at 6 in. for all the flume
experiments. This allowed for several variations in thickness ratio between
the erodible and nonerodible layers. Test specimens having stratigraphic
ratios (erodible layer thickness)/(noneroding layer thickness) of 1:5 to 5:1
were tested.
40
Data Acquisition and Documentation
63. Data from each test were recorded on a formatted work sheet. These
work sheets contain pertinent information such as the configuration of the
flume during the tests and detailed data on the sample composition and config-
uration. Other data provided include: flow characteristics of water, head-
water and tailwater depths, pressure differentials (for calculating velocity),
temperature of the eroding water, test duration, and any other important
observations. The flume test data sheets are presented in Appendix A.
64. Many of the flume tests were recorded with a video camera. The
video camera proved to be an invaluable tool for studying and documenting the
erosion process. The ability to stop the turbulent action was critical in
understanding the failure mechanisms that were observed. Velocities of parti-
cles in the turbulent flow were calculated by using stop action and a measured
grid. Photographs were also taken as appropriate to document specific aspects
of the tests.
Procedures
Sample runs
65. Due to the iterative nature of erosion research and the lack of
precedence for the kinds of tests which were conducted, several types of sam-
ple runs were made. The first type of test was designed to provide informa-
tion needed to produce a rock simulant which would erode in a realistic
manner. The ideal material had to not only erode within a reasonable time but
also maintain enough strength to reproduce the failure mechanisms observed in
the field. Tests SACON 1-I (shock absorbing concrete mixes) thru SIGEL 1-5
(sodium silicate mixes) were used to determine the erosive properties of weak
concrete mixes, shock absorbing concrete, sodium silicate mixes, and Knox
gelatin mixes. The second type of test, SILGEL 4-1, was conducted to
reproduce a worst case scenario for rapid headward erosion. A third type of
test, PLEXIGEL 2-2 thru PLEXIGEL 3-12, was for the purpose of determining the
effect on headward erosion caused by varying the thickness of the capping
layer while keeping all of the other variables constant.
66. A fourth type of test investigated pressure differentials associ-
ated with the establishment and maintenance of the knickpoint. The fifth type
41
of test determined the effects of the shape of the lip of the overfall on the
formation and maintenance of the knickpoint.
Control of flow
67. Flow control during the tests was maintained by controlling the
pump valve and the tilt of the flume. Flow conditions were reproduced for
various geologic conditions by maintaining identical headwater heights and
flow velocities for similar tests. The velocities were measured by the Pitot
tube method described previously. Because the cross sectional area of the
flume was known, the volume of flow per unit time could easily be calculated.
Test duration
68. Duration of each test run was highly variable depending on the type
of test being conducted. The tests were designed to be completed in a reason-
able amount of time, usually 30 min to I hr. Since most of the tests were
simulating relatively short-lived, dynamic flow events, as opposed to long-
term, equilibrium-producing flows, the shorter tests times appeared reason-
able. The length of the tests ranged from 9 to 125 min.
Volume of eroded material
69. The volume of eroded material was determined by replacing the end
plate on the sample holder after the end of each test, sealing the end plate
to prevent leakage, and filling the eroded space with water. The volume of
water required to fill the void is equal to the volume of the eroded material
for a given test.
Velocity of particles in turbulent flow
70. By using a grid on the side of the flume in conjunction with the
video recorder and stopwatch, the velocity of particles in the turbulent flow
was calculated. The detailed procedures are given in Appendix B.
42
PART IV: DESIGN OF SIMULATED ROCK FOR FLUME TESTS
71. Because of the lack of detailed guidance in the literature, a great
deal of research had to be performed to design a material which would satis-
factorily simulate natural rock under knickpoint erosion conditions. The
original logic was that, because the flume that was used for the tests had
extremely high velocity capability, the rock simulant should be relatively
high in strength. It turned out that high velocities were not as critical as
originally thought and much weaker materials could be used. The details of
the mixes which were used are presented in Appendix C. A general discussion
of the various mixes which were tested is presented below, along with the rea-
sons why each one was chosen or rejected.
72. Perry (1982) used the flume to test cores of shale and sandstone
from the Woodbine and Eagle Ford Formations. He used very high velocities to
erode the materials. The natural materials which he tested were as hard as
weak concrete; therefore, the decision was made to start the knickpoint ero-
sion studies using a weak concrete mix to simulate soft to moderately hard
rock. The weak concrete mixes did not erode at low velocities and at higher
velocities the knickpoint erosion and migration could not be reproduced. The
concrete mixes had several other disadvantages. They had to be tested at the
exact same time after mixing in order to obtain comparative results and at
very low strengths the results of strength tests could not be repeated.
73. Several types of concrete mixes were used in preliminary tests.
First, a portland cement, crushed limestone, and water mixture were used, but
proved to be too erosion resistant for modeling.
74. A light-weight cellular concrete consisting of foam, cement, and
water was designed by Bob Denson of the Structures Laboratory at WES. The
cellular concrete looked very promising in early tests because during erosion
the water remained perfectly clear and the details of the failure mechanisms
could be observed. Another advantage of using the cellular concrete was that
realistic fracture patterns could be carved into the upper surface of the
sample. However, the shock absorbing properties of the cellular concrete
made it erosion resistant.
75. Erosion along the traces of the fractures in the cellular concrete
looked very realistic; although, the knickpoint or headward erosion could not
43
be reproduced. The cellular concrete may be so erosion resistant that it
could be used as a remedial measure to prevent erosion in special cases.
76. Knickpoint migration was accomplished by using a mixture of gravel,
chalk powder, cement, and water. However, the water became so cloudy that the
failure mechanisms could not be seen during the test.
77. Clay mixtures had been used by other researchers in previous
hydraulic modeling tests with some success, but, because of the need to keep
the water clear so that the details of erosion could be observed, the clay
mixtures were eliminated from further consideration.
78. Sodium silicate grout was the next material tested. Sodium sili-
cate has several advantages over the portland cement-based mixes. A distinct
advantage was that gravel could be placed into the holder and the sodium sili-
cate poured into the gravel until all the voids were filled. The sodium sili-
cate would then harden in place and the sample would be ready for testing.
This greatly simplified the sample preparation because only the sodium sili-
cate components had to be mixed and not the aggregate and the grout. Another
advantage of using the sodium silicate was that it kept the eroding water
clean. Mixing procedures, however, had to be very strict because factors such
as mixing time, temperature, and size of the sample being prepared all had to
be carefully controlled.
79. Although the sodium silicate mixes provided the most realistic rock
simulants under erosive conditions observed up to that point, the knickpoint
phenomena could not be reproduced consistently with two layers of sodium
silicate alone. A two-layered sample, with the capping layer composed of
sodium silicate cemented gravel and the underlying layer composed of gelatin
cemented gravel provided the most realistic results.
80. Knox gelatin has proved to be a valuable engineering tool in stud-
ies involving dynamically loaded foundations, ground motion propagation, and
seismic exploration phenomena. Cratering tests conducted by WES used a
gelatin model (Paek and Heller 1968). Gelatin mixed with gravel eroded very
well in preliminary flume tests. The gelatin mixes kept the water clear so
that failure mechanisms and the development of the air pocket under the over-
fall could be studied in detail. The recommended simulated rock for
reproducing the knickpoint migration phenomena for the velocities and geometry
which were used in this research is sodium silicate and gravel for the top
layer and gelatin and gravel for the bottom layer.
44
PART V: HYDRODYNAMIC MECHANISMS
81. The phenomenon of undercutting has been documented for years, but
the actual mechanics involved were largely unknown. During the flume studies
conducted in this research the actual sequence of events, geologic conditions,
geometries, and velocities necessary to cause undercutting were actually
reproduced and understood. The flume studies have demonstrated that the
mechanics of knickpoint migration or headcutting are controlled by the geome-
try of the knickpoint and the velocity of the flow. The geometry of the
knickpoint is in turn governed by the geology at the specific site. There-
fore, geology, in conjunction with topography, plays a key role in the initial
location of a knickpoint.
Drop Structure as a Knickpoint Analog
82. Because the knickpoint plays such an important role in emergency
spillway erosion, it is necessary to understand what is taking place at the
knickpoint from a hydraulics perspective. The review of literature directly
relevant to knickpoint formation and growth showed that the actual mechanics
which controlled the process were largely unknown. However, it was noted that
a hydraulic "drop structure" is geometrically very similar to a knickpoint.
Drop structures are installed at various intervals in steep channels to dissi-
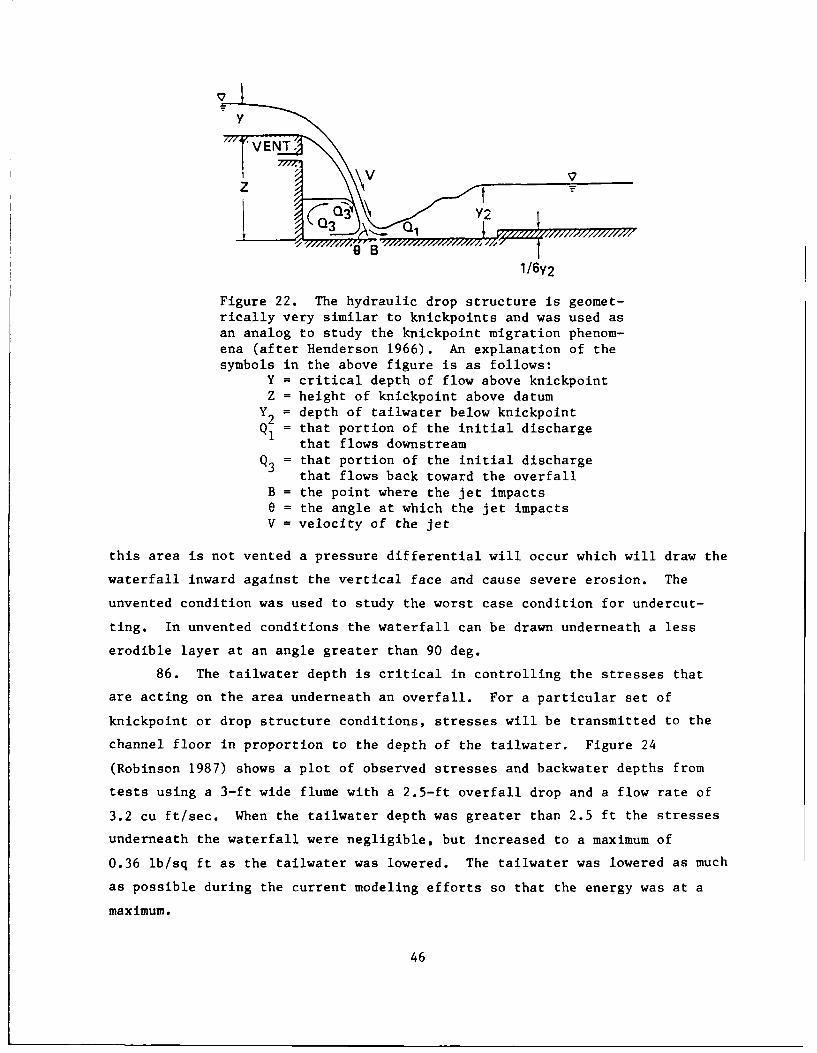
pate energy and prevent scouring of the channel floor (Figure 22).
83. There is a great deal of energy loss in the area where the free
falling jet strikes the floor of the channel. The amount of energy loss has
been determined experimentally by Moore (1943). The energy dissipated at the
base of a free overfall is shown in Figure 23.
84. Based on the concept that drop structures are designed to prevent
scour and headward erosion, it seemed appropriate to assume that knickpoints
which happen to meet the same geometric and hydraulic standards would be much
less likely to have severe erosion potential. Conceptually, the overall
research effort was geared toward creating a model for a worst case scenario
for headward migration of a knickpoint and determining the role of stratig-
raphic variation on erosion.
85. In order for the calculations for the jet impact angle 0 to be
valid, the area underneath the waterfall must be vented to the atmosphere. If
45
y
""VENTJYt2
1/6y2
Figure 22. The hydraulic drop structure is geomet-rically very similar to knickpoints and was used asan analog to study the knickpoint migration phenom-ena (after Henderson 1966). An explanation of thesymbols in the above figure is as follows:
Y = critical depth of flow above knickpointZ = height of knickpoint above datum
Y2 = depth of tailwater below knickpointQ= that portion of the initial discharge
that flows downstreamQ3 = that portion of the initial discharge
that flows back toward the overfallB = the point where the jet impactse = the angle at which the jet impactsV = velocity of the jet
this area is not vented a pressure differential will occur which will draw the
waterfall inward against the vertical face and cause severe erosion. The
unvented condition was used to study the worst case condition for undercut-
ting. In unvented conditions the waterfall can be drawn underneath a less
erodible layer at an angle greater than 90 deg.
86. The tailwater depth is critical in controlling the stresses that
are acting on the area underneath an overfall. For a particular set of
knickpoint or drop structure conditions, stresses will be transmitted to the
channel floor in proportion to the depth of the tailwater. Figure 24
(Robinson 1987) shows a plot of observed stresses and backwater depths from
tests using a 3-ft wide flume with a 2.5-ft overfall drop and a flow rate of
3.2 cu ft/sec. When the tailwater depth was greater than 2.5 ft the stresses
underneath the waterfall were negligible, but increased to a maximum of
0.36 lb/sq ft as the tailwater was lowered. The tailwater was lowered as much
as possible during the current modeling efforts so that the energy was at a
maximum.
46
EXPERIMENTAL (MOORE)
14 - - - - - - -
12//
II
8 -1 t./; V -
o4-
0 2 4 6 8 10 12 14
E
Figure 23. The energy (E) dissipated at the base of afree overfall is dependent on the critical depth of thewater (Y) and the height of the fall (Z) (after
Henderson 1966). EL is energy dissipated
47
0.40 I I I I
0.35
0.30U-
c6 0.25CO,wI-
Ca0.20a
0.15LUU
00.10
0.05 U
0U0 0.4 0.8 1.2 1.6 2.0 2.4 2.8
BACKWATER LEVEL, FT
Figure 24. Plot showing the relationship between backwaterdepth and transmission of stresses to the channel floor
(after Robinson 1987)
87. For headcutting to occur the reverse roller portion of the overfall
must be in close proximity to the vertical face of the knickpoint. The
reverse roller can come in contact with the vertical face in one of several
ways:
a. A vented knickpoint in which the ratio of height of fall Z todepth of flow Y is greater than 8/1.
b. An unvented knickpoint in which negative pressures hold theflow against the vertical face (Figure 25).
In the vented case, erosion is controlled by the flow conditions and the
knickpoint geometry.
Geometric Control
88. Calculations show that erosion is greater when the ratio of the
height of fall Z to critical water depth Y is greater than 8 to I for
48
A
AIRPOCKETA T. A TMOSPHER/C PRESSURE
\B
AIRPOCKET BELOWA TMOSPHERIC PRESSURE
N
03
Figure 25. Schematic diagram showing
vented (A) and unvented (B) condi-tions at a knickpoint
a minimum tailwater depth. Figure 26 shows the significance of the Z:Y
ratio in controlling the impact angle e . As the ratio of Z:Y becomes
larger the angle of impact approaches 90 deg and a higher percent of the orig-
inal discharge is entrained in the reverse roller portion of the jet. The
point of impact is controlled by the velocity of the flow going over the
knickpoint for a given height of fall.
89. The Q3 :Q1 curve in Figure 26 shows that as the impact angle
approaches 90 deg a higher percentage of the total discharge volume is
entrained in Q3 and directed toward the vertical knickpoint face. The
velocities of rock particles in the reverse roller were measured using a video
recorder and stopwatch. The velocities averaged 0.71 ft/sec with a maximum
velocity of 1.4 ft/sec.
49
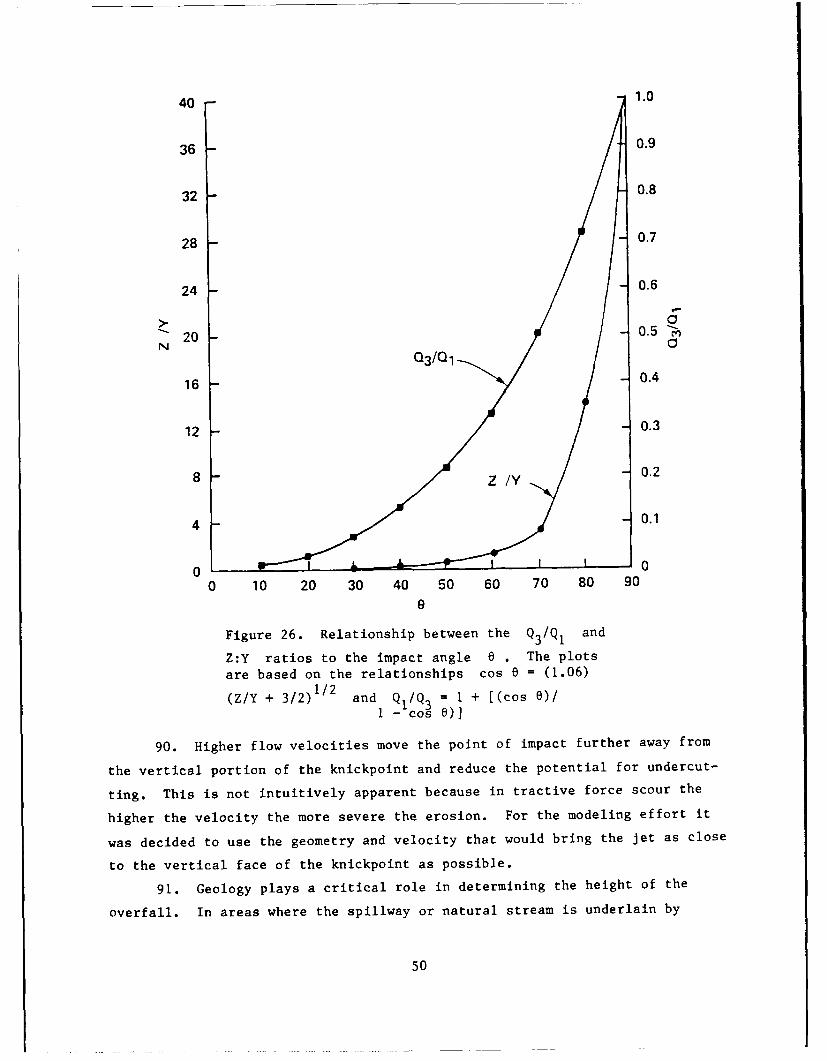
40 - 1.0
36 0.9
32 - 0.8
28 _ 0.7
24 - 0.6
20 _ 0.5
Q3 /Q 1
16 - 0.4
12 - 0.3
8 Z /Y - 0.2
4 0.1
0 0
0 10 20 30 40 50 60 70 80 90
9
Figure 26. Relationship between the Q3/Q, and
Z:Y ratios to the impact angle 0 . The plotsare based on the relationships cos 0 = (1.06)
(Z/Y + 3/2) and = I + [(cos 6)/1 - cos 8)1
90. Higher flow velocities move the point of impact further away from
the vertical portion of the knickpoint and reduce the potential for undercut-
ting. This is not intuitively apparent because in tractive force scour the
higher the velocity the more severe the erosion. For the modeling effort it
was decided to use the geometry and velocity that would bring the jet as close
to the vertical face of the knickpoint as possible.
91. Geology plays a critical role in determining the height of the
overfall. In areas where the spillway or natural stream is underlain by
50
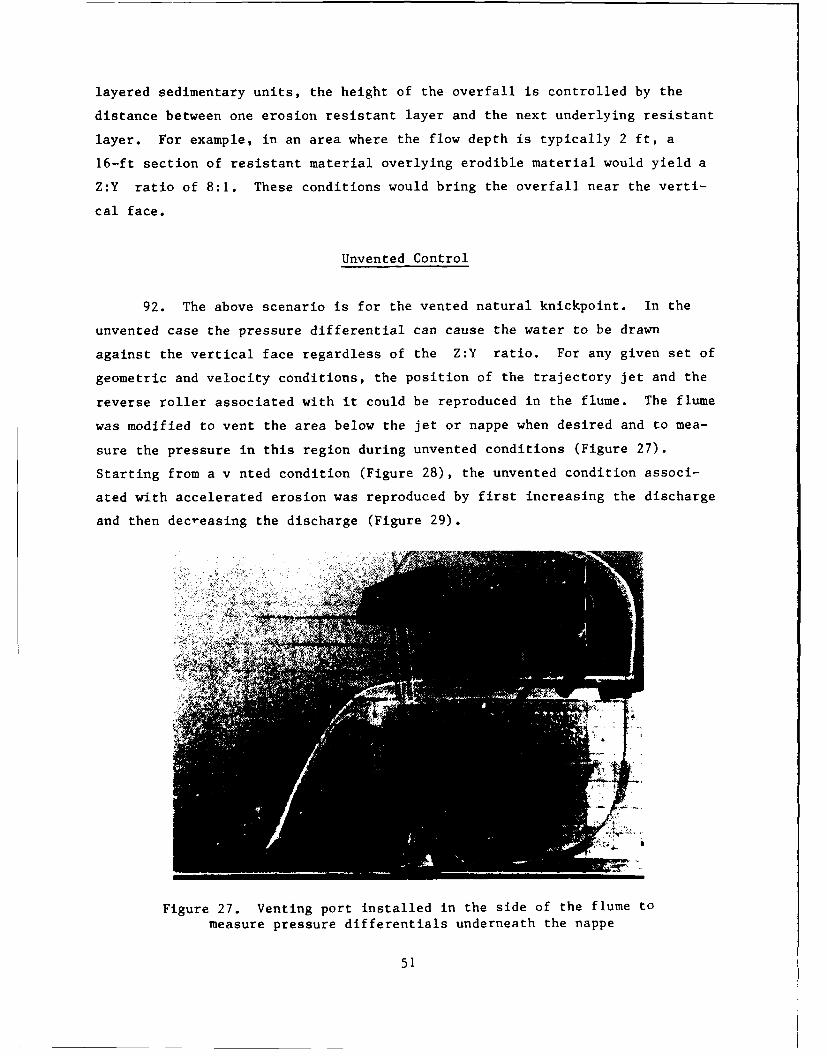
layered sedimentary units, the height of the overfall is controlled by the
distance between one erosion resistant layer and the next underlying resistant
layer. For example, in an area where the flow depth is typically 2 ft, a
16-ft section of resistant material overlying erodible material would yield a
Z:Y ratio of 8:1. These conditions would bring the overfall near the verti-
cal face.
Unvented Control
92. The above scenario is for the vented natural knickpoint. In the
unvented case the pressure differential can cause the water to be drawn
against the vertical face regardless of the Z:Y ratio. For any given set of
geometric and velocity conditions, the position of the trajectory jet and the
reverse roller associated with it could be reproduced in the flume. The flume
was modified to vent the area below the jet or nappe when desired and to mea-
sure the pressure in this region during unvented conditions (Figure 27).
Starting from a v nted condition (Figure 28), the unvented condition associ-
ated with accelerated erosion was reproduced by first increasing the discharge
and then decreasing the discharge (Figure 29).
Figure 27. Venting port installed in the side of the flume to
measure pressure differentials underneath the nappe
51
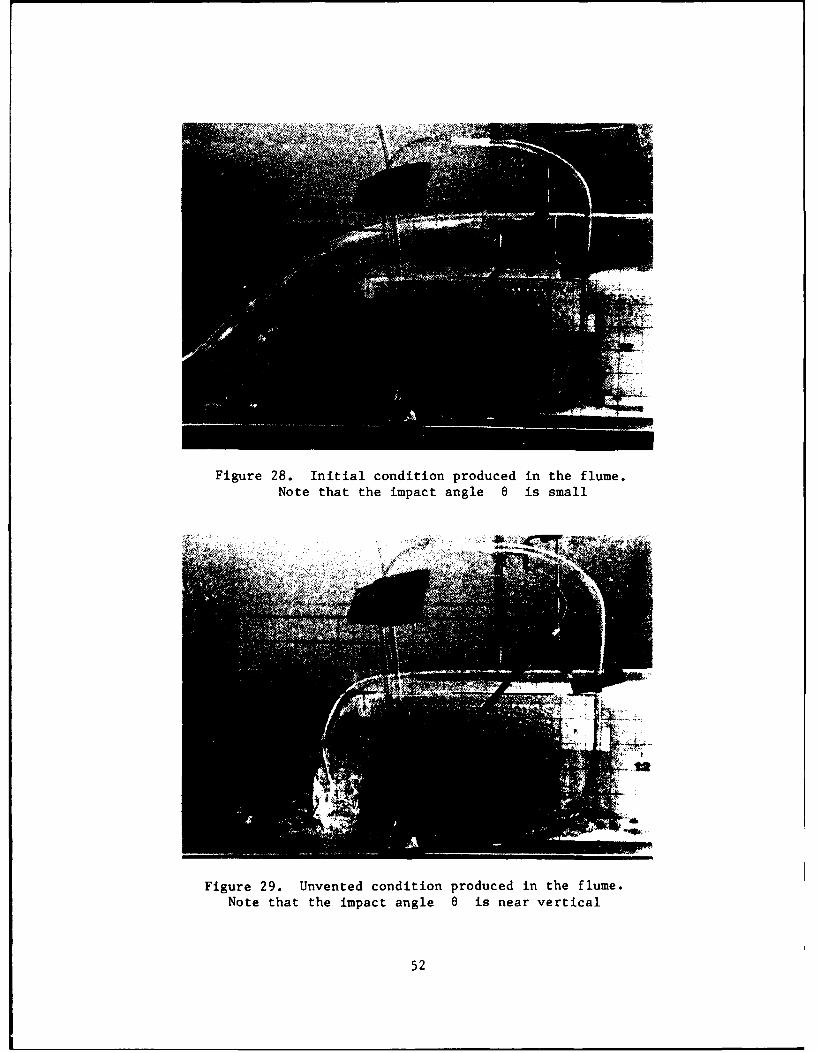
Figure 28. Initial condition produced in the flume.Note that the impact angle e is small
qV
Figure 29. Unvented condition produced in the flume.Note that the impact angle 6 is near vertical
52
The unvented condition was also established by raising the tailgate and flood-
ing the knickpoint and then lowering the tailgate (Figures 30 and 31). The
unvented highly turbulent condition was reproduced either by fluctuating the
discharge or by fluctuating the tailwater elevation.
93. By venting and unventing the area under the nappe, the position of
impact and the corresponding reverse roller can be positioned in a predictable
and repeatable manner. The pressures measured in the area under the nappe
ranged from 0.02 to 0.04 psi below atmospheric pressure to 0.03 psi above
atmospheric pressure. The positive pressures were noted during periods of
accelerated flow. These small negative pressures move the trajectory jet from
a position where no significant headcutting can take place to a position very
close to the vertical face of the knickpoint where the erosion potential is
extremely high.
94. The position of the tailwater also influences the location of
potential undercutting because, as the position of the tailwater moves up and
down, the jet creates turbulence on the vertical face of the knickpoint at an
adjacent position.
Hydraulic Similitude
95. The Froude numbers for flume Tests 3-1 through 3-12 averaged 1.35.
The Froude numbers for ten SCS spillway flows in Kentucky and six SCS spillway
flows in Mississippi were 1.2 and 1.03, respectively (Cameron et al. 1988a).
Because the Froude number is used to formulate the equations for similitude in
hydraulic scale modeling, portions of the results of the flume tests may be
used for studying larger knickpoints.
Effect of Key Geological Variables
Erodible layer thickness
96. A series of tests were designed to study the effect of varying the
thickness of the eroding layer on the unvented undercutting phenomena. It was
decided to use Plexiglas as the capping layer and gelatin cemented gravel as
the underlying erodible material. The variables such as velocity and duration
of flow were kept as low as possible during each test. Because of the
53
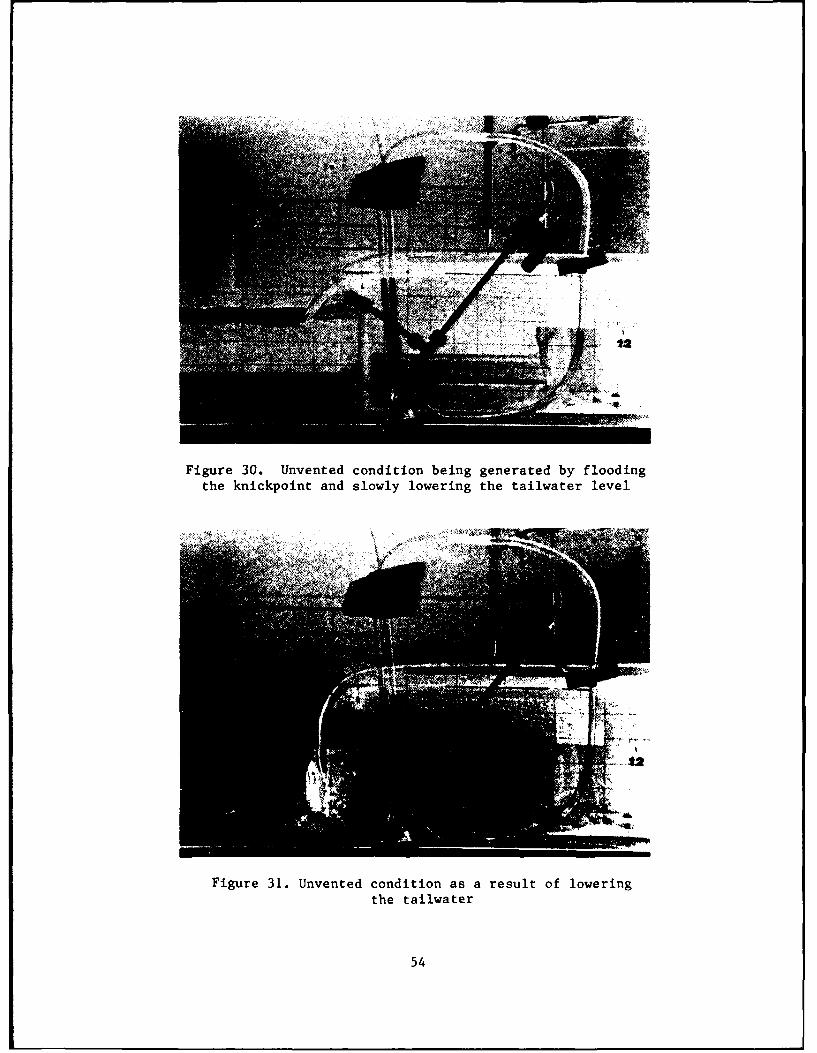
Figure 30. Unvented condition being generated by flooding
the knickpoint and slowly lowering the tailwater level
Figure 31. Unvented condition as a result of lowering
the tailwater
54
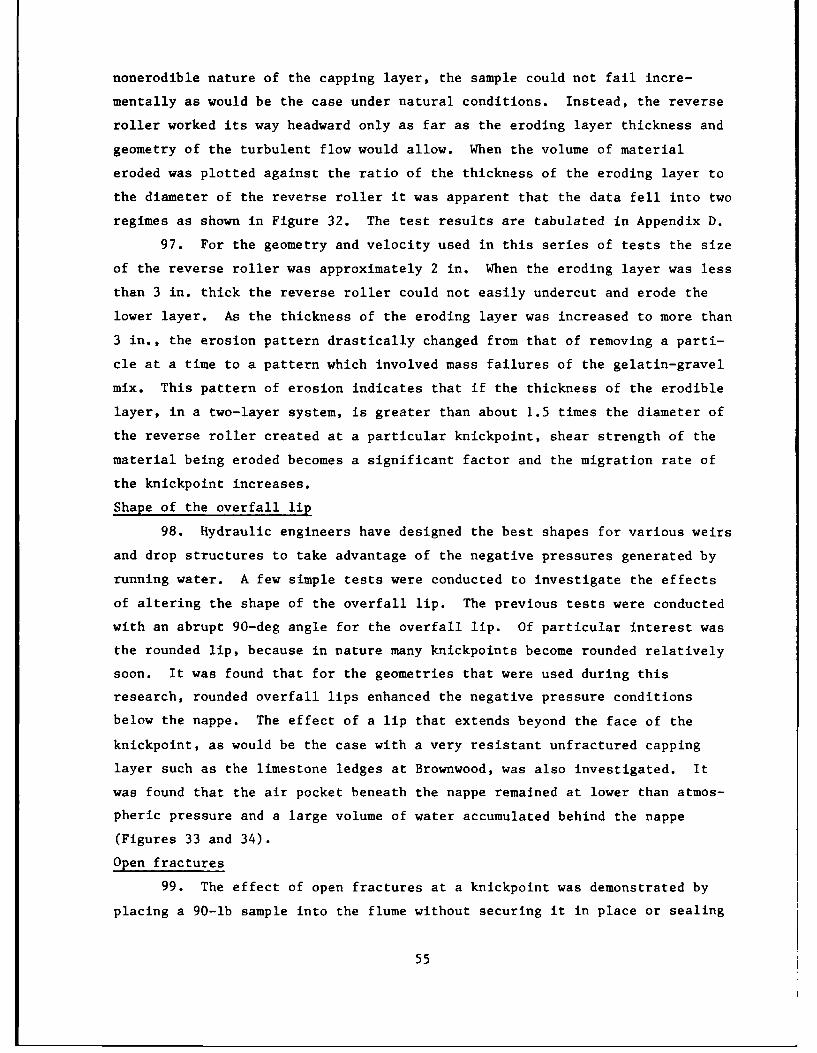
nonerodible nature of the capping layer, the sample could not fail incre-
mentally as would be the case under natural conditions. Instead, the reverse
roller worked its way headward only as far as the eroding layer thickness and
geometry of the turbulent flow would allow. When the volume of material
eroded was plotted against the ratio of the thickness of the eroding layer to
the diameter of the reverse roller it was apparent that the data fell into two
regimes as shown in Figure 32. The test results are tabulated in Appendix D.
97. For the geometry and velocity used in this series of tests the size
of the reverse roller was approximately 2 in. When the eroding layer was less
than 3 in. thick the reverse roller could not easily undercut and erode the
lower layer. As the thickness of the eroding layer was increased to more than
3 in., the erosion pattern drastically changed from that of removing a parti-
cle at a time to a pattern which involved mass failures of the gelatin-gravel
mix. This pattern of erosion indicates that if the thickness of the erodible
layer, in a two-layer system, is greater than about 1.5 times the diameter of
the reverse roller created at a particular knickpoint, shear strength of the
material being eroded becomes a significant factor and the migration rate of
the knickpoint increases.
Shape of the overfall lip
98. Hydraulic engineers have designed the best shapes for various weirs
and drop structures to take advantage of the negative pressures generated by
running water. A few simple tests were conducted to investigate the effects
of altering the shape of the overfall lip. The previous tests were conducted
with an abrupt 90-deg angle for the overfall lip. Of particular interest was
the rounded lip, because in nature many knickpoints become rounded relatively
soon. It was found that for the geometries that were used during this
research, rounded overfall lips enhanced the negative pressure conditions
below the nappe. The effect of a lip that extends beyond the face of the
knickpoint, as would be the case with a very resistant unfractured capping
layer such as the limestone ledges at Brownwood, was also investigated. It
was found that the air pocket beneath the nappe remained at lower than atmos-
pheric pressure and a large volume of water accumulated behind the nappe
(Figures 33 and 34).
Open fractures
99. The effect of open fractures at a knickpoint was demonstrated by
placing a 90-lb sample into the flume without securing it in place or sealing
55
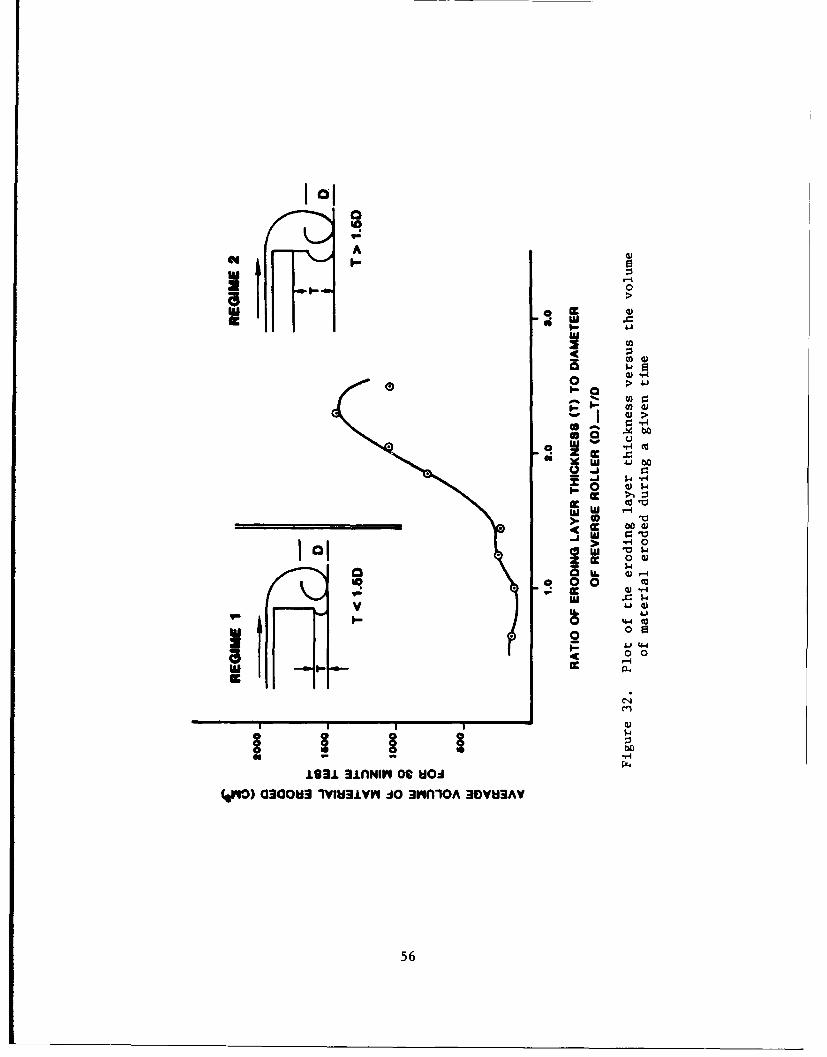
A
El 0
0
w 4. 0
0w
US Uh> .i
$4
a Ui. 4) -4
4-4 cc
0 009
40 0
Z4
±93± 3fLnNI Ot tii4
(V10) (130083 1VWI±lVV J0 3VEAl0A 3lOVH3AV
56
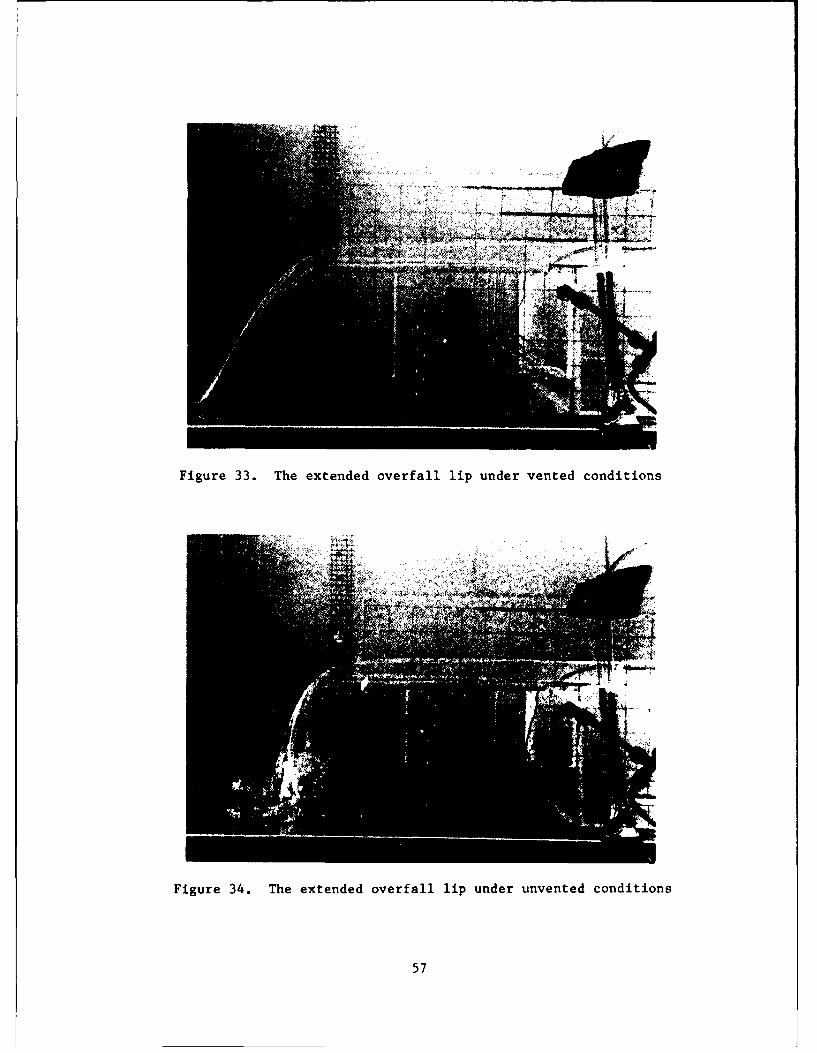
Figure 33. The extended overfall lip under vented conditions
Figure 34. The extended overfall lip under unvented conditions
57
the space between the inner flume walls and the outer sampler holder walls.
When the flow in the flume started, the heavy sample was rafted downstream
within seconds. At a natural occurring knickpoint the same phenomena would
also be enhanced by the negative pressure underneath the nappe.
Maximum erosion rate
100. To put the headward erosion phenomena in proper perspective it was
necessary to demonstrate a worst case scenario. In this case situation the
failure mechanism had to be of a repetitive nature so that once the erosion
was initiated it would proceed headward until the entire simulated spillway
reach was eroded. The sample was designed to simulate an erodible layer
emplaced between a capping layer and a nonerodible lower layer. If the bottom
layer had been erodible a plunge pool could have developed which would have
dissipated energy and actually slowed headward movement. The tailwater was
kept as low as possible to maximize erosion and keep the reverse roller
positioned at the bottom of the erodible layer. By keeping the reverse roller
at the bottom of the softer material, the resulting undercutting also trig-
gered mass slumping and tension failure of the capping material. This test
dramatically demonstrated past peak erosion at its worst.
58
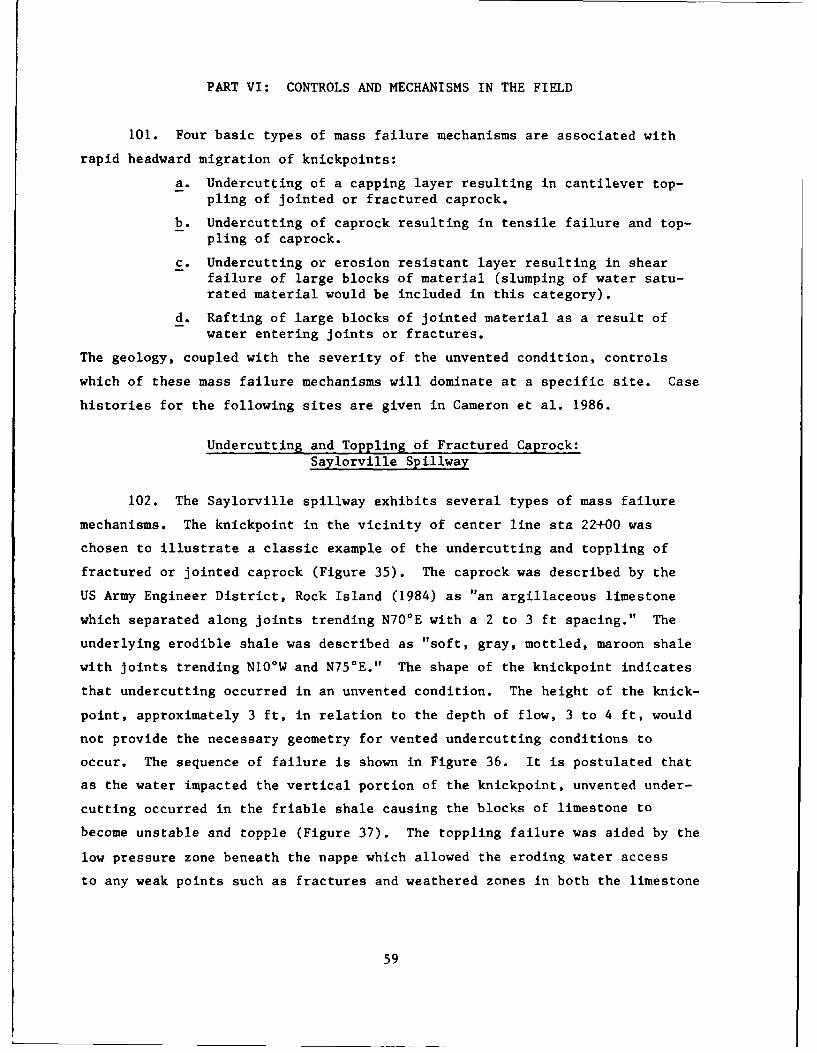
PART VI: CONTROLS AND MECHANISMS IN THE FIELD
101. Four basic types of mass failure mechanisms are associated with
rapid headward migration of knickpoints:
a. Undercutting of a capping layer resulting in cantilever top-pling of jointed or fractured caprock.
b. Undercutting of caprock resulting in tensile failure and top-pling of caprock.
c. Undercutting or erosion resistant layer resulting in shearfailure of large blocks of material (slumping of water satu-rated material would be included in this category).
d. Rafting of large blocks of jointed material as a result ofwater entering joints or fractures.
The geology, coupled with the severity of the unvented condition, controls
which of these mass failure mechanisms will dominate at a specific site. Case
histories for the following sites are given in Cameron et al. 1986.
Undercutting and Toppling of Fractured Caprock:Saylorville Spillway
102. The Saylorville spillway exhibits several types of mass failure
mechanisms. The knickpoint in the vicinity of center line sta 22+00 was
chosen to illustrate a classic example of the undercutting and toppling of
fractured or jointed caprock (Figure 35). The caprock was described by the
US Army Engineer District, Rock Island (1984) as "an argillaceous limestone
which separated along joints trending N70*E with a 2 to 3 ft spacing." The
underlying erodible shale was described as "soft, gray, mottled, maroon shale
with joints trending N10 °W and N75°E." The shape of the knickpoint indicates
that undercutting occurred in an unvented condition. The height of the knick-
point, approximately 3 ft, in relation to the depth of flow, 3 to 4 ft, would
not provide the necessary geometry for vented undercutting conditions to
occur. The sequence of failure is shown in Figure 36. It is postulated that
as the water impacted the vertical portion of the knickpoint, unvented under-
cutting occurred in the friable shale causing the blocks of limestone to
become unstable and topple (Figure 37). The toppling failure was aided by the
low pressure zone beneath the nappe which allowed the eroding water access
to any weak points such as fractures and weathered zones in both the limestone
59
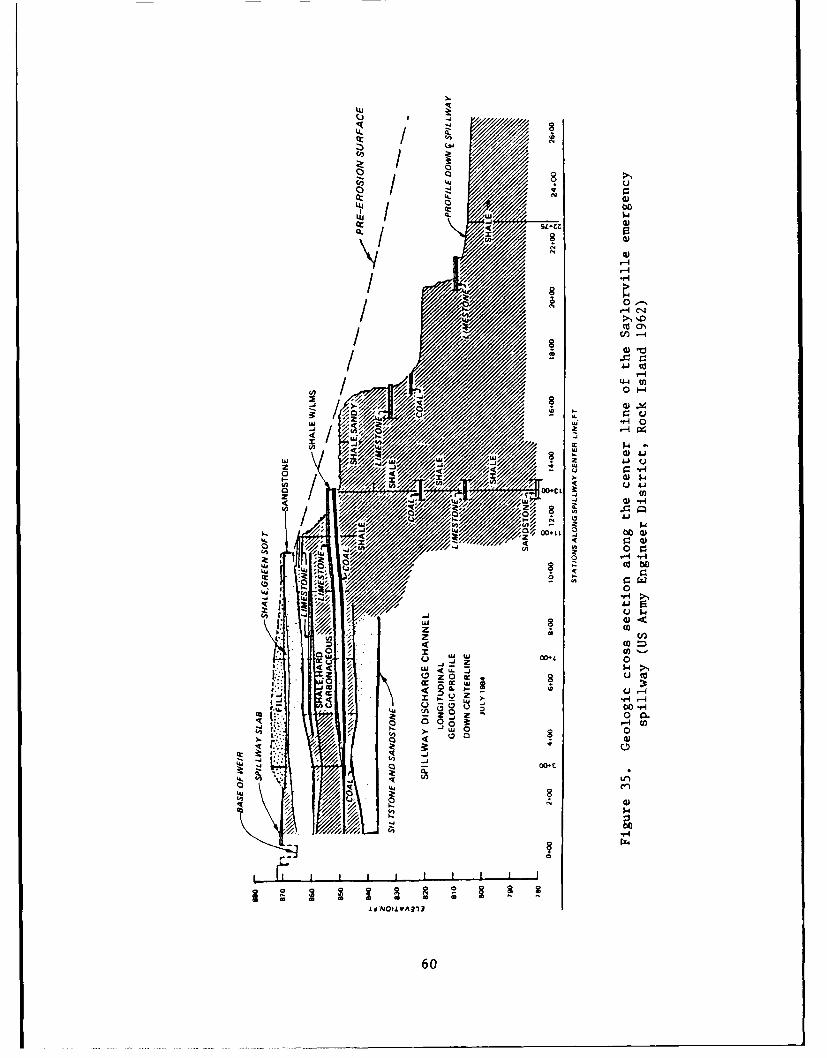
(is
NO
00I M a
-44
0- /u Ai'4
z 00+-L
0oILaUz
CC,
4 .1
U,4
Ll"' -)
0
IA Q -4
-4Htnz 0
on
< 0 W 3
44
604
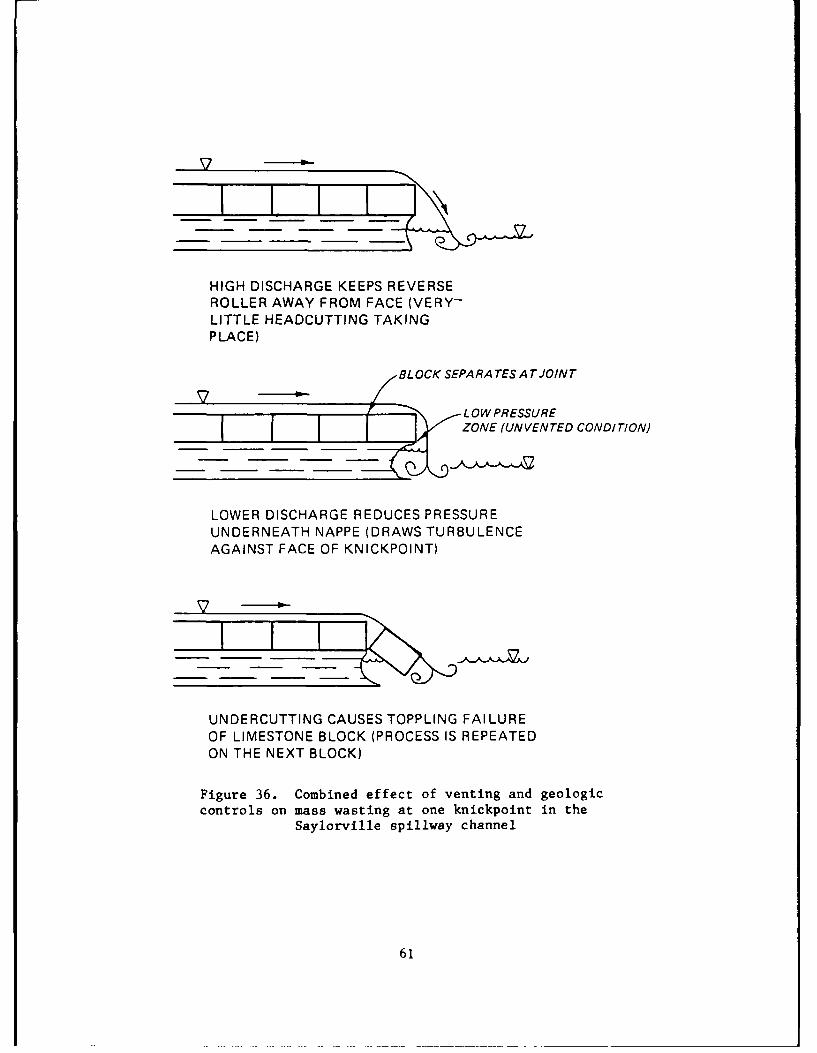
HIGH DISCHARGE KEEPS REVERSEROLLER AWAY FROM FACE (VERY-LITTLE HEADCUTTING TAKINGPLACE)
BL OCK SEPA RA TES A T JOIN T
LOWPRESSUREZONE (UN VENTED CONDITION)
LOWER DISCHARGE REDUCES PRESSUREUNDERNEATH NAPPE (DRAWS TURBULENCEAGAINST FACE OF KNICKPOINT)
UNDERCUTTING CAUSES TOPPLING FAI LUREOF LIMESTONE BLOCK (PROCESS IS REPEATEDON THE NEXT BLOCK)
Figure 36. Combined effect of venting and geologiccontrols on mass wasting at one knickpoint in the
Saylorville spillway channel
61
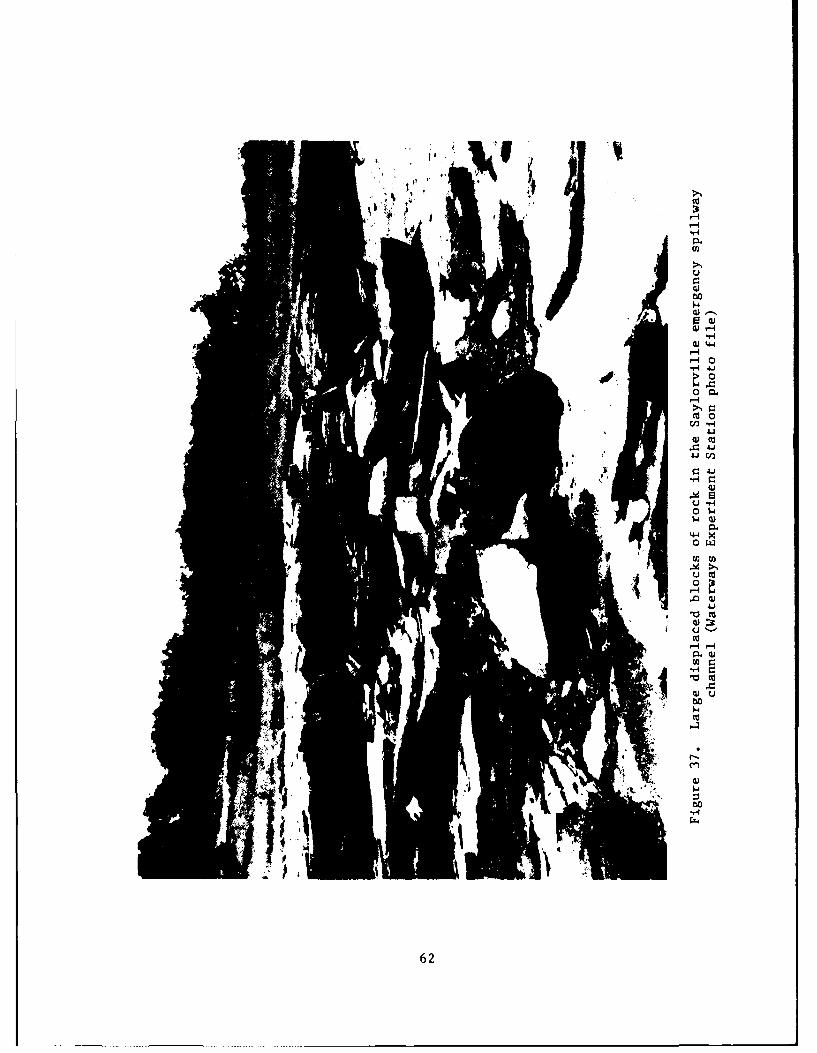
4-4
-1
-44
4d >
4J co~
co
~c
4-4o
62c
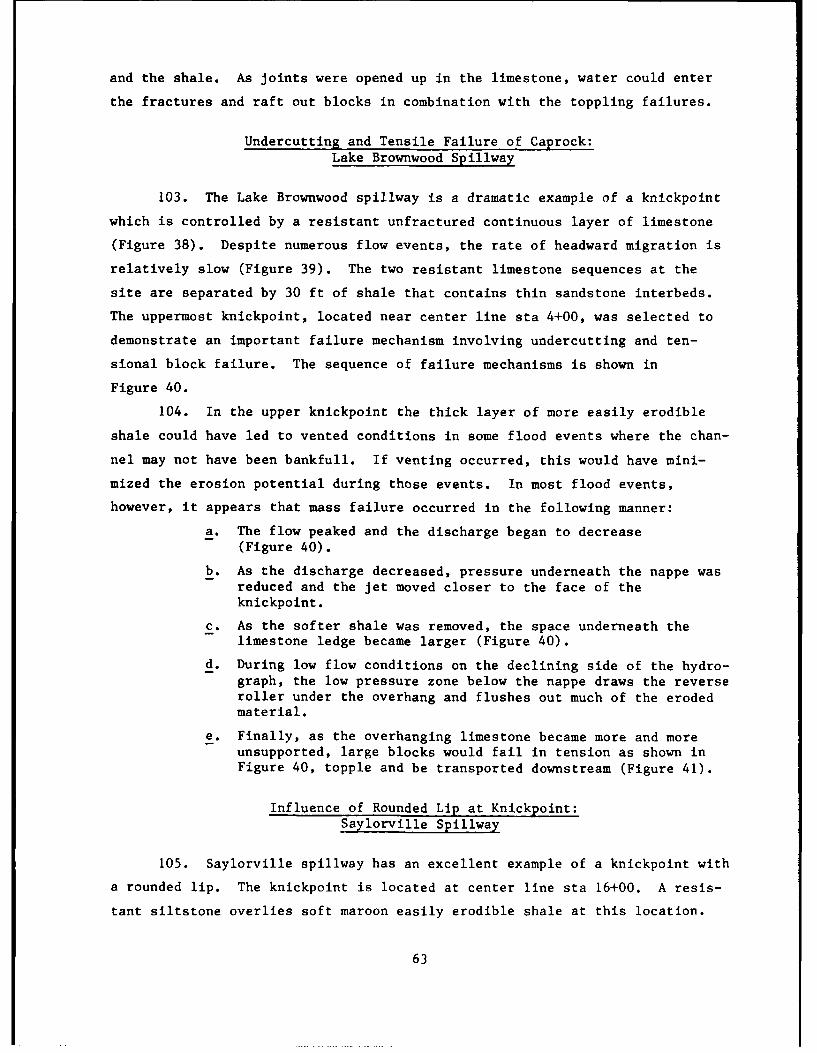
and the shale. As joints were opened up in the limestone, water could enter
the fractures and raft out blocks in combination with the toppling failures.
Undercutting and Tensile Failure of Caprock:Lake Brownwood Spillway
103. The Lake Brownwood spillway is a dramatic example of a knickpoint
which is controlled by a resistant unfractured continuous layer of limestone
(Figure 38). Despite numerous flow events, the rate of headward migration is
relatively slow (Figure 39). The two resistant limestone sequences at the
site are separated by 30 ft of shale that contains thin sandstone interbeds.
The uppermost knickpoint, located near center line sta 4+00, was selected to
demonstrate an important failure mechanism involving undercutting and ten-
sional block failure. The sequence of failure mechanisms is shown in
Figure 40.
104. In the upper knickpoint the thick layer of more easily erodible
shale could have led to vented conditions in some flood events where the chan-
nel may not have been bankfull. If venting occurred, this would have mini-
mized the erosion potential during those events. In most flood events,
however, it appears that mass failure occurred in the following manner:
a. The flow peaked and the discharge began to decrease(Figure 40).
b. As the discharge decreased, pressure underneath the nappe wasreduced and the jet moved closer to the face of theknickpoint.
c. As the softer shale was removed, the space underneath thelimestone ledge became larger (Figure 40).
d. During low flow conditions on the declining side of the hydro-graph, the low pressure zone below the nappe draws the reverseroller under the overhang and flushes out much of the erodedmaterial.
e. Finally, as the overhanging limestone became more and moreunsupported, large blocks would fail in tension as shown inFigure 40, topple and be transported downstream (Figure 41).
Influence of Rounded Lip at Knickpoint:Saylorville Spillway
105. Saylorville spillway has an excellent example of a knickpoint with
a rounded lip. The knickpoint is located at center line sta 16+00. A resis-
tant siltstone overlies soft maroon easily erodible shale at this location.
63
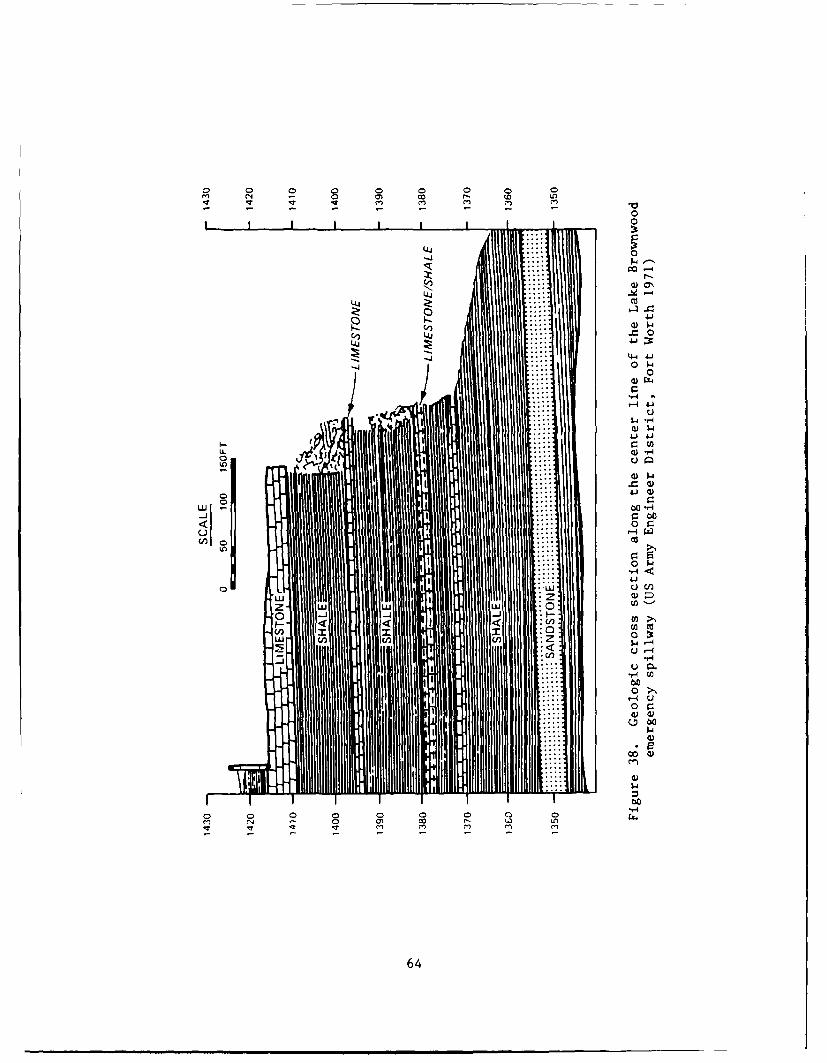
o o 0 0 0 0 0 0 0CN -) 0 L
00
LU co.
000 I0
LuU
u 1-4 w-
cor0
I .0)
0 -1 w
0 cn c
LU Ln Z a '
w u
4:~~ p:0ci
4:4
Jill Ism, r4- 0 c w L
644
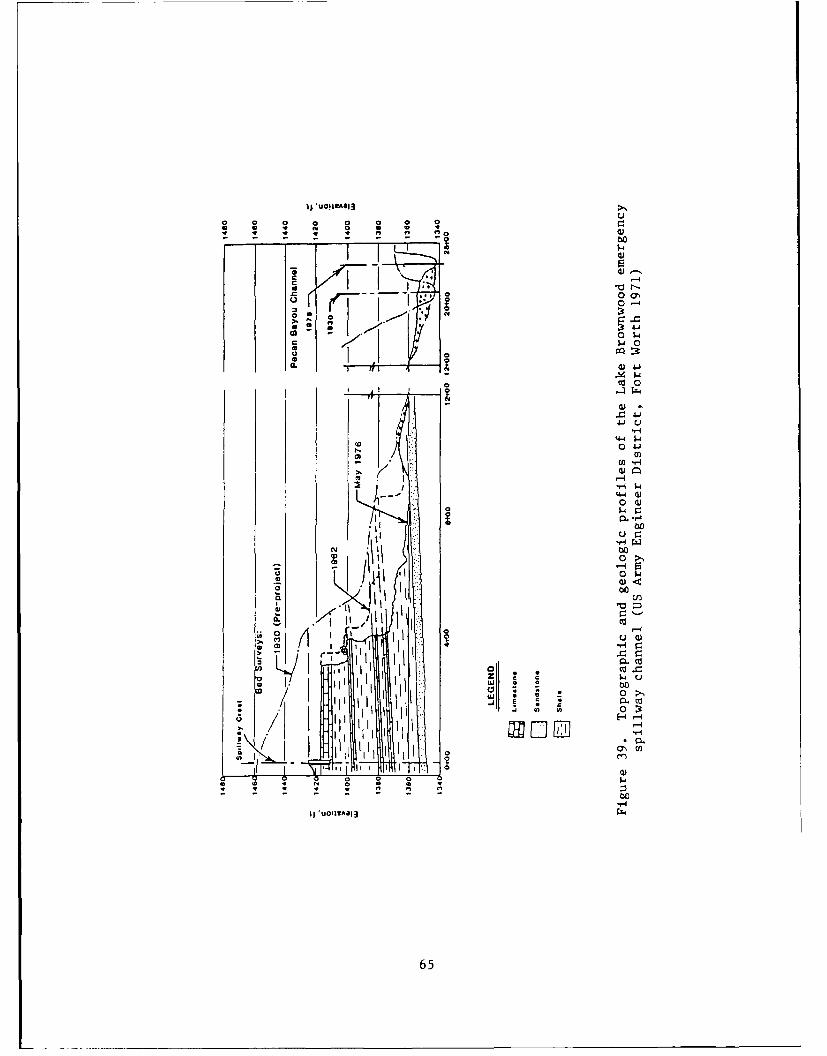
$4)
0 -4
COO4
g4 0
ca 0
4-U
0 4
44-4
-4
IA II
'--I* ..- II I
~ .7j~,' I1a J-1U
c; i-- I
)r I IUIVA 1 rz-
- I I65
A
HIGH DISCHARGE KEEPS TURBULENCEAWAY FROM KNICKPOINT FACE
,,- TENSION CRACK B
LOWPRESSUREZONE
LOWER DISCHARGE REDUCES PRESSUREUNDERNEATH NAPPE (DRAWS JETAGAINST VERTICAL FACE OF KNICKPOINT)
C
UNDERCUTTING CAUSES LIMESTONE TOFAIL IN TENSION (UNDERCUTTING STARTSAGAIN AND THE PROCESS IS REPEATEDAFTER DEBRIS IS REMOVED)
Figure 40. Schematic diagram of the mass failuremechanism at Lake Brownwood, Texas
66
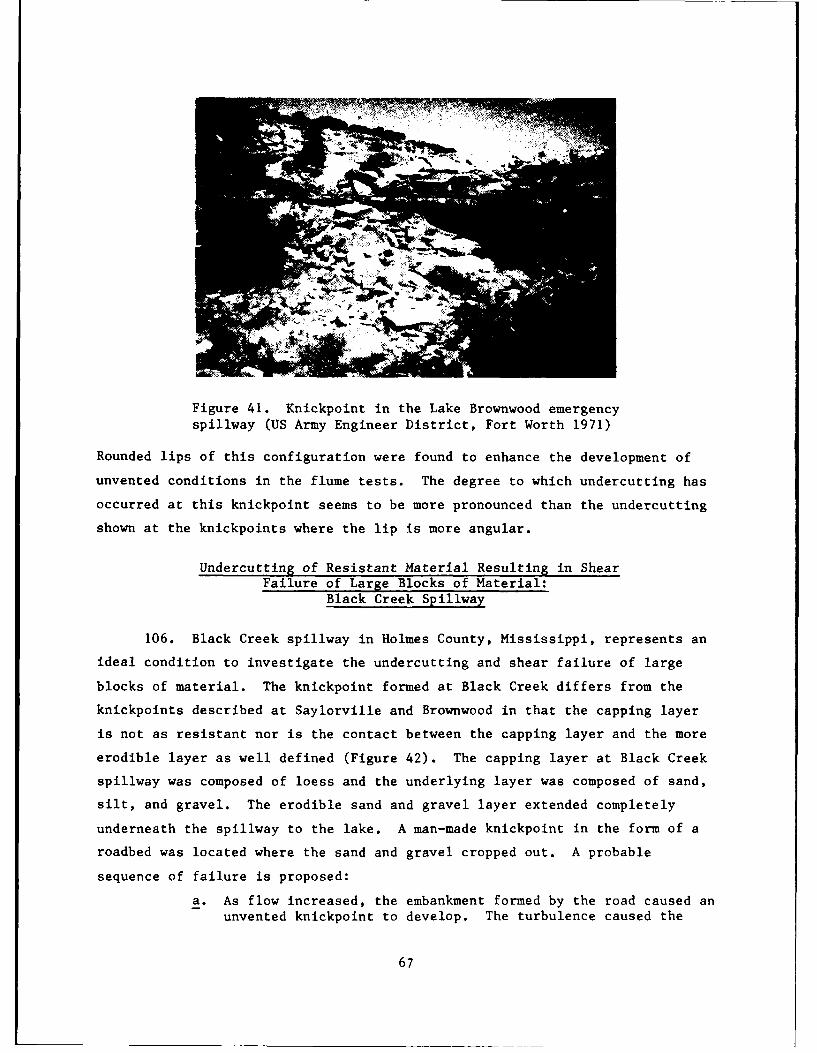
Figure 41. Knickpoint in the Lake Brownwood emergency
spillway (US Army Engineer District, Fort Worth 1971)
Rounded lips of this configuration were found to enhance the development of
unvented conditions in the flume tests. The degree to which undercutting has
occurred at this knickpoint seems to be more pronounced than the undercutting
shown at the knickpoints where the lip is more angular.
Undercutting of Resistant Material Resulting in ShearFailure of Large Blocks of Material:
Black Creek Spillway
106. Black Creek spillway in Holmes County, Mississippi, represents an
ideal condition to investigate the undercutting and shear failure of large
blocks of material. The knickpoint formed at Black Creek differs from the
knickpoints described at Saylorville and Brownwood in that the capping layer
is not as resistant nor is the contact between the capping layer and the more
erodible layer as well defined (Figure 42). The capping layer at Black Creek
spillway was composed of loess and the underlying layer was composed of sand,
silt, and gravel. The erodible sand and gravel layer extended completely
underneath the spillway to the lake. A man-made knickpoint in the form of a
roadbed was located where the sand and gravel cropped out. A probable
sequence of failure is proposed:
a. As flow increased, the embankment formed by the road caused anunvented knickpoint to develop. The turbulence caused the
67
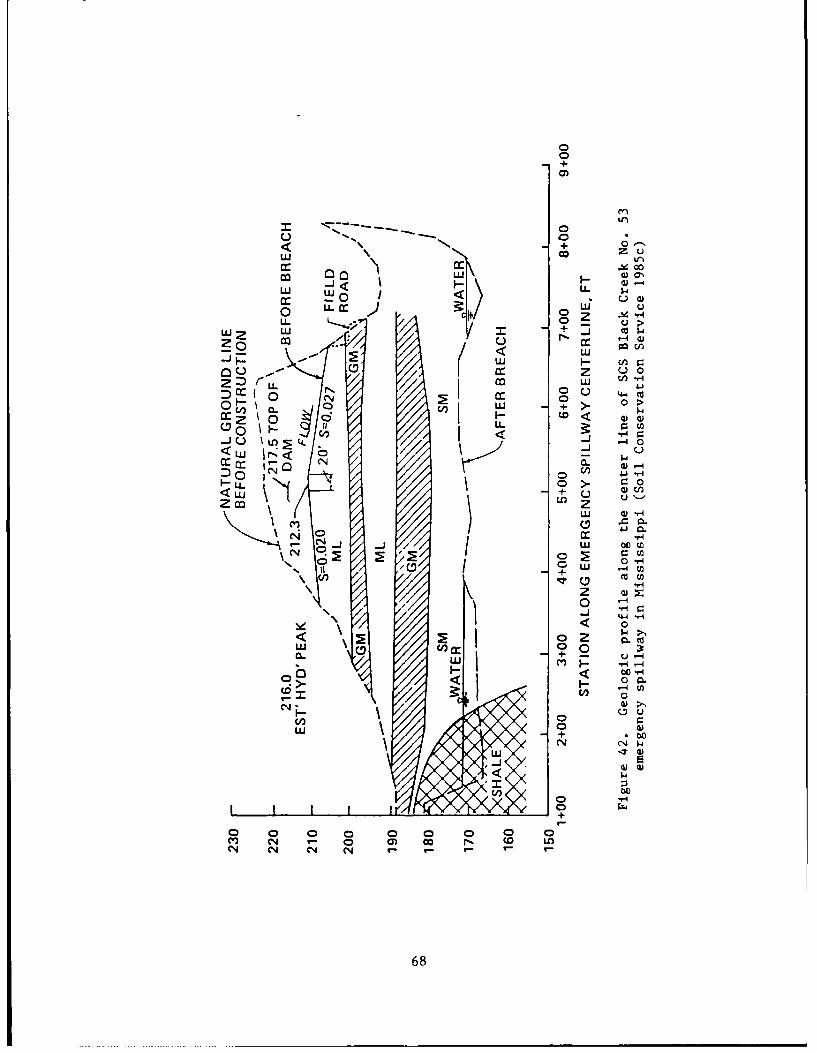
+
0) -4-
w~~ LL
c c LU o u 4
L ( >
LU~ ~ ~ z w j Oww
00 ccn r
cr- z u0
Z D cow En -
U- 41
0 0- 01 0
U) 0 L + >68
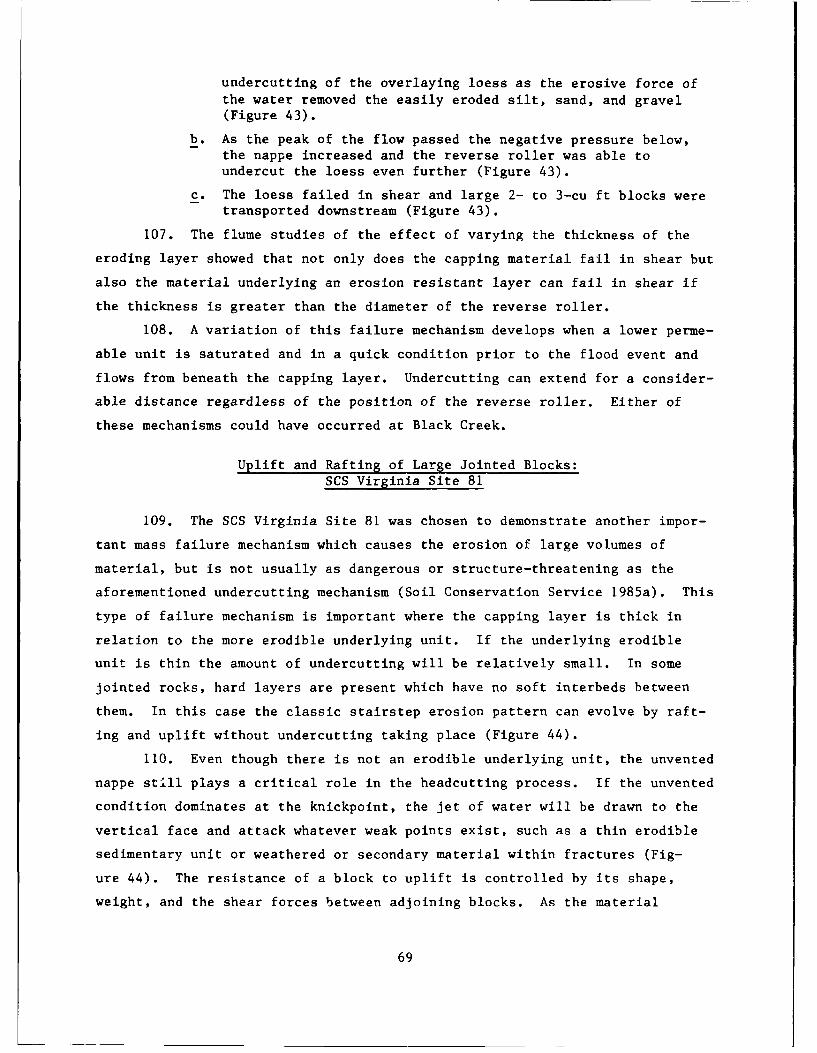
undercutting of the overlaying loess as the erosive force ofthe water removed the easily eroded silt, sand, and gravel(Figure 43).
b. As the peak of the flow passed the negative pressure below,the nappe increased and the reverse roller was able toundercut the loess even further (Figure 43).
c. The loess failed in shear and large 2- to 3-cu ft blocks weretransported downstream (Figure 43).
107. The flume studies of the effect of varying the thickness of the
eroding layer showed that not only does the capping material fail in shear but
also the material underlying an erosion resistant layer can fail in shear if
the thickness is greater than the diameter of the reverse roller.
108. A variation of this failure mechanism develops when a lower perme-
able unit is saturated and in a quick condition prior to the flood event and
flows from beneath the capping layer. Undercutting can extend for a consider-
able distance regardless of the position of the reverse roller. Either of
these mechanisms could have occurred at Black Creek.
Uplift and Rafting of Large Jointed Blocks:SCS Virginia Site 81
109. The SCS Virginia Site 81 was chosen to demonstrate another impor-
tant mass failure mechanism which causes the erosion of large volumes of
material, but is not usually as dangerous or structure-threatening as the
aforementioned undercutting mechanism (Soil Conservation Service 1985a). This
type of failure mechanism is important where the capping layer is thick in
relation to the more erodible underlying unit. If the underlying erodible
unit is thin the amount of undercutting will be relatively small. In some
jointed rocks, hard layers are present which have no soft interbeds between
them. In this case the classic stairstep erosion pattern can evolve by raft-
ing and uplift without undercutting taking place (Figure 44).
110. Even though there is not an erodible underlying unit, the unvented
nappe still plays a critical role in the headcutting process. If the unvented
condition dominates at the knickpoint, the jet of water will be drawn to the
vertical face and attack whatever weak points exist, such as a thin erodible
sedimentary unit or weathered or secondary material within fractures (Fig-
ure 44). The resistance of a block to uplift is controlled by its shape,
weight, and the shear forces between adjoining blocks. As the material
69
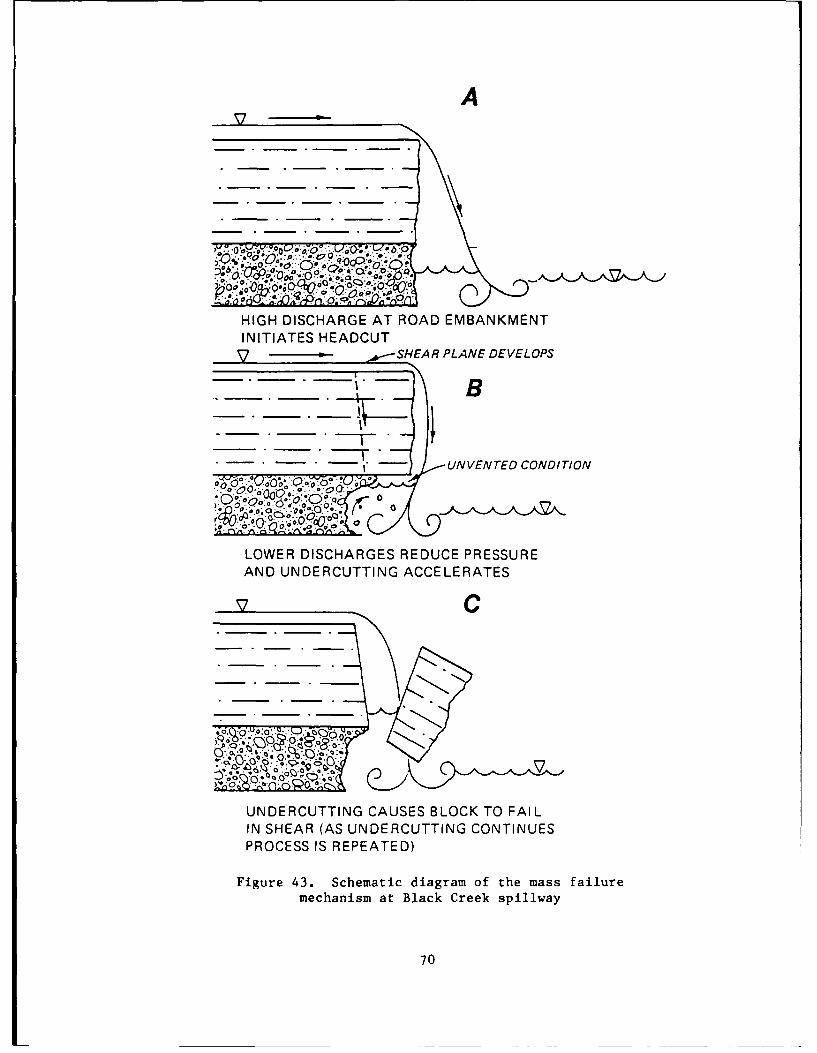
A
4• .9..'-. ', .. • ' ..
HIGH DISCHARGE AT ROAD EMBANKMENTINITIATES HEADCUT
SHEAR PLANE DEVELOPS
___ B
--- , -- UNVENTED CONDITION
LOWER DISCHARGES REDUCE PRESSUREAND UNDERCUTTING ACCELERATES
. , 0 . "0."
UNDERCUTTING CAUSES BLOCK TO FAILIN SHEAR (AS UNDERCUTTING CONTINUESPROCESS IS REPEATED)
Figure 43. Schematic diagram of the mass failuremechanism at Black Creek spillway
70
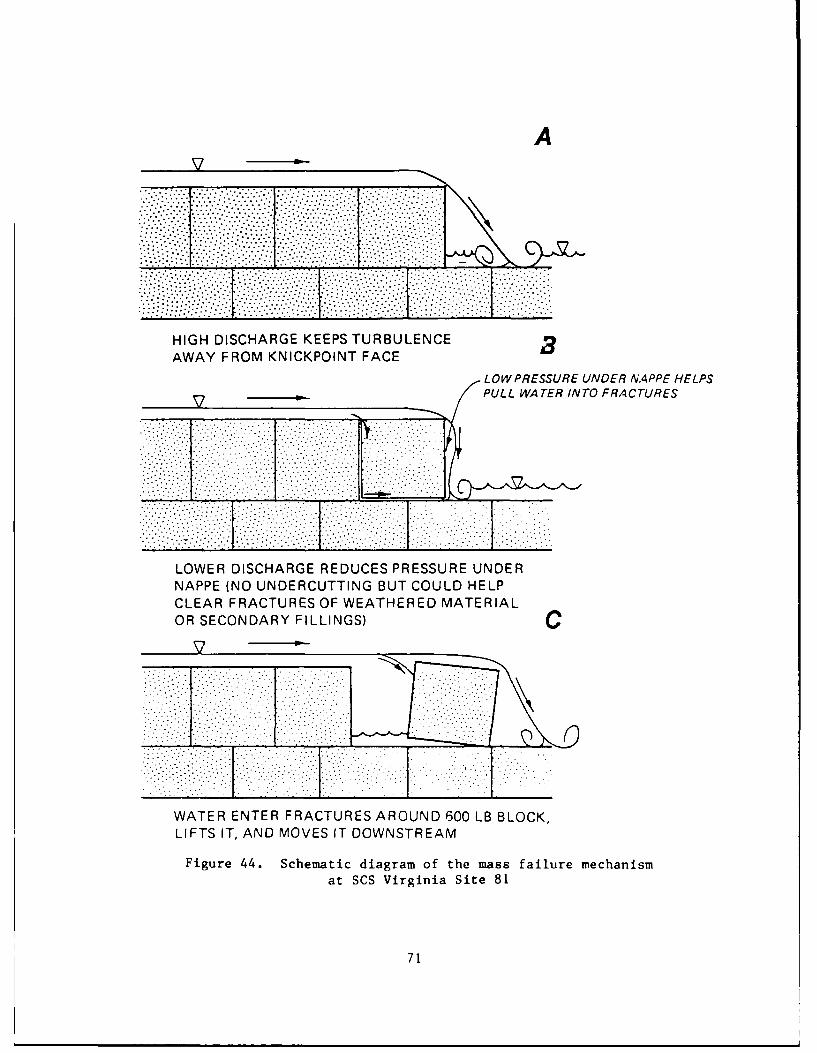
A
• ... ... .. . .. .
,. °,..... ,, ,........-...
HIGH DISCHARGE KEEPS TURBULENCE 3AWAY FROM KNICKPOINT FACE
LOW PRESSURE UNDER NAPPE HELPSPULL WATER INTO FRACTURES
LOWER DISCHARGE REDUCES PRESSURE UNDERNAPPE (NO UNDERCUTTING BUT COULD HELPCLEAR FRACTURES OF WEATHERED MATERIALOR SECONDARY FILLINGS) C
WATER ENTER FRACTURES AROUND 600 LB BLOCK,LIFTS IT, AND MOVES IT DOWNSTREAM
Figure 44. Schematic diagram of the mass failure mechanism
at SCS Virginia Site 81
71
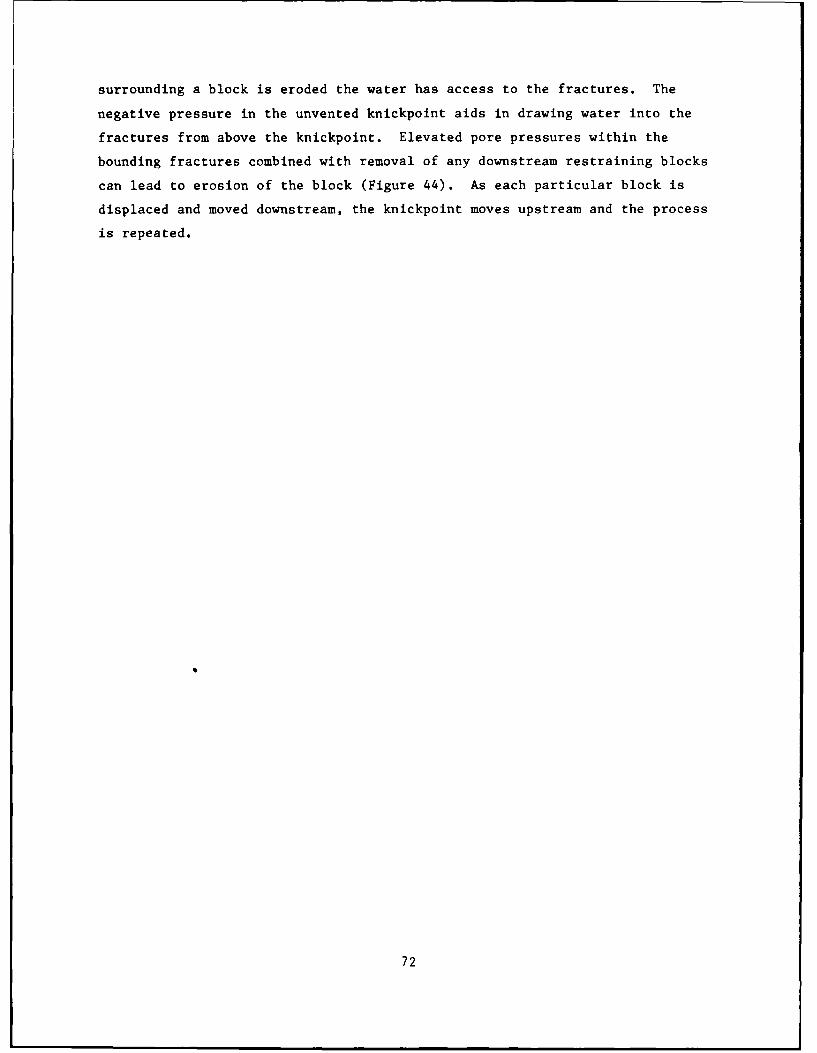
surrounding a block is eroded the water has access to the fractures. The
negative pressure in the unvented knickpoint aids in drawing water into the
fractures from above the knickpoint. Elevated pore pressures within the
bounding fractures combined with removal of any downstream restraining blocks
can lead to erosion of the block (Figure 44). As each particular block is
displaced and moved downstream, the knickpoint moves upstream and the process
is repeated.
72
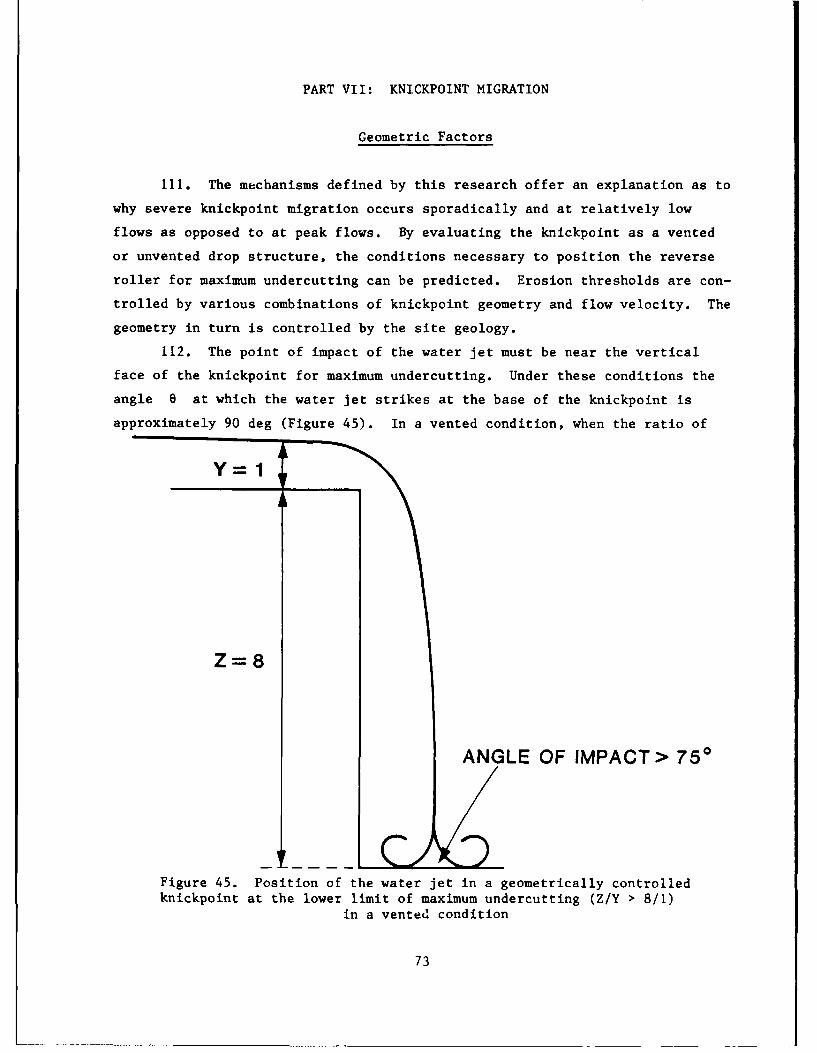
PART VII: KNICKPOINT MIGRATION
Geometric Factors
111. The mechanisms defined by this research offer an explanation as to
why severe knickpoint migration occurs sporadically and at relatively low
flows as opposed to at peak flows. By evaluating the knickpoint as a vented
or unvented drop structure, the conditions necessary to position the reverse
roller for maximum undercutting can be predicted. Erosion thresholds are con-
trolled by various combinations of knickpoint geometry and flow velocity. The
geometry in turn is controlled by the site geology.
112. The point of impact of the water jet must be near the vertical
face of the knickpoint for maximum undercutting. Under these conditions the
angle 6 at which the water jet strikes at the base of the knickpoint is
approximately 90 deg (Figure 45). In a vented condition, when the ratio of
Y=I
Z=8
ANGLE OF IMPACT> 750
Figure 45. Position of the water jet in a geometrically controlledknickpoint at the lower limit of maximum undercutting (Z/Y > 8/1)
in a vented condition
73
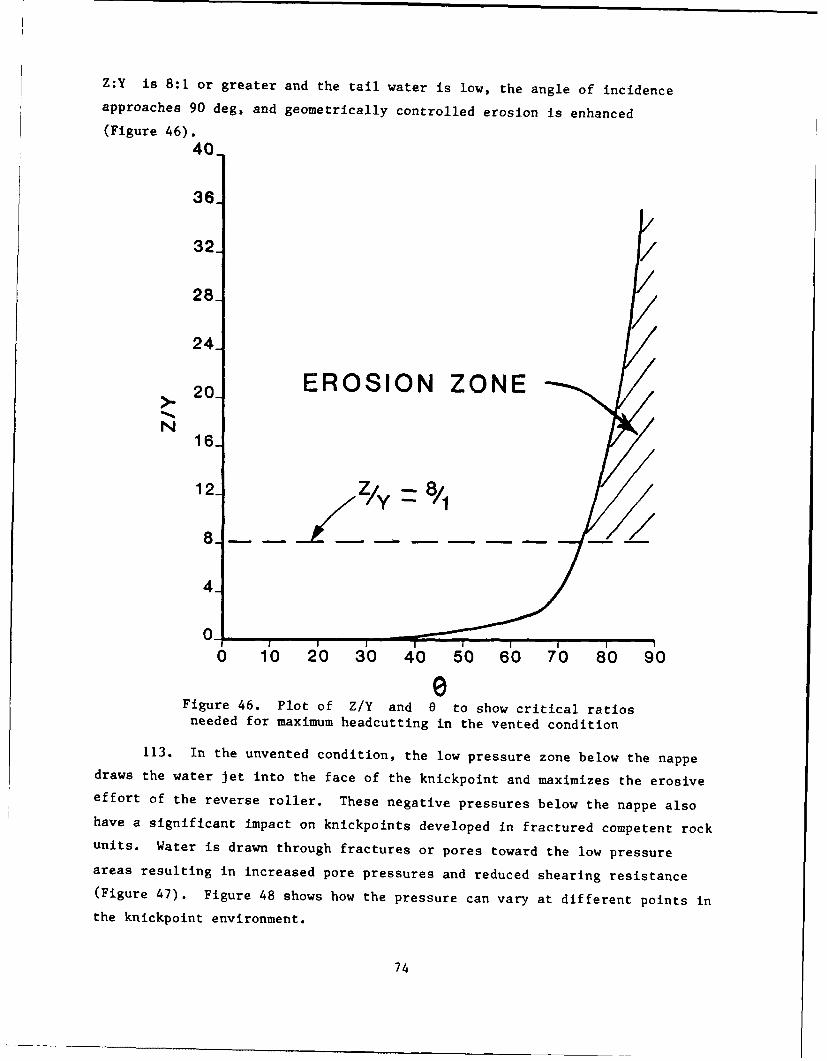
Z:Y is 8:1 or greater and the tail water is low, the angle of incidenceapproaches 90 deg, and geometrically controlled erosion is enhanced
(Figure 46).
40
361
32 //
28-
24-
20- EROSION ZONEN
16-
12-Z, 8
8_ -- - -
4-
010 10 20 30 40 50 60 70 80 90
SFigure 46. Plot of Z/Y and 8 to show critical ratiosneeded for maximum headcutting in the vented condition
113. In the unvented condition, the low pressure zone below the nappedraws the water jet into the face of the knickpoint and maximizes the erosiveeffort of the reverse roller. These negative pressures below the nappe alsohave a significant impact on knickpoints developed in fractured competent rockunits. Water is drawn through fractures or pores toward the low pressureareas resulting in increased pore pressures and reduced shearing resistance(Figure 47). Figure 48 shows how the pressure can vary at different points inthe knickpoint environment.
74
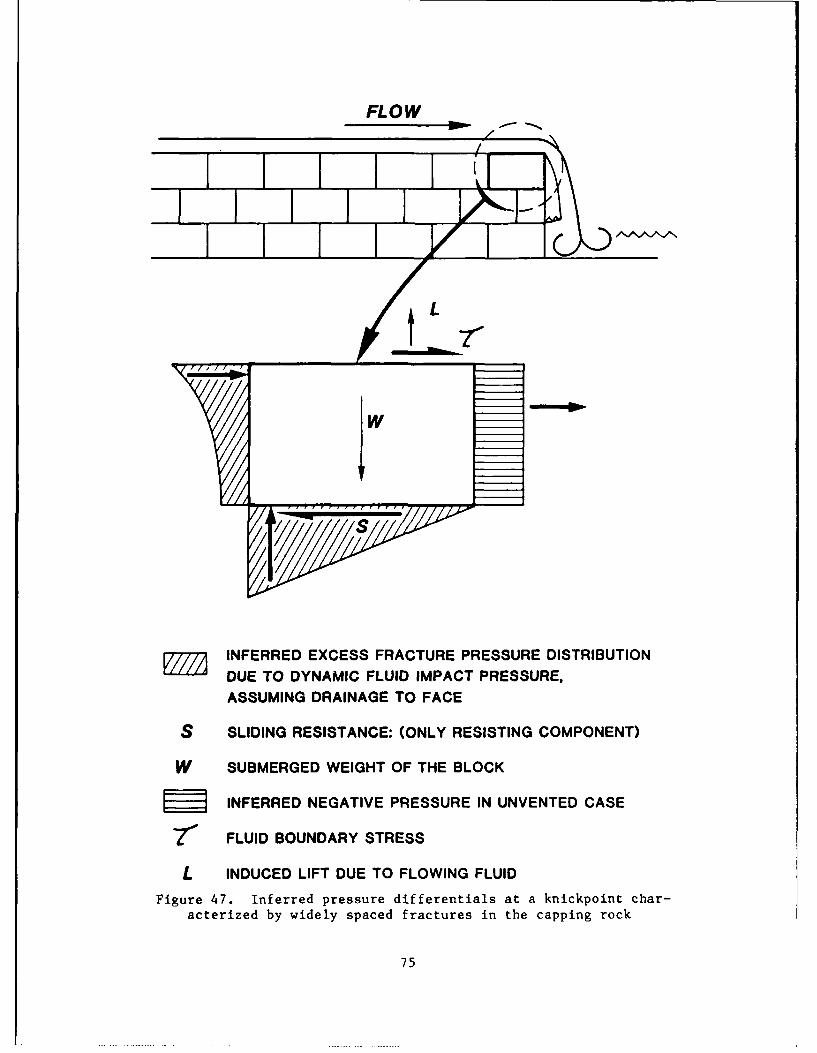
FLOWI 'I , ---
WSW
SINFERRED EXCESS FRACTURE PRESSURE DISTRIBUTION
DUE TO DYNAMIC FLUID IMPACT PRESSURE,
ASSUMING DRAINAGE TO FACE
S SLIDING RESISTANCE: (ONLY RESISTING COMPONENT)
W SUBMERGED WEIGHT OF THE BLOCK
SINFERRED NEGATIVE PRESSURE IN UNVENTED CASE
r FLUID BOUNDARY STRESS
L INDUCED LIFT DUE TO FLOWING FLUID
Figure 47. Inferred pressure differentials at a knickpoint char-acterized by widely spaced fractures in the capping rock
75
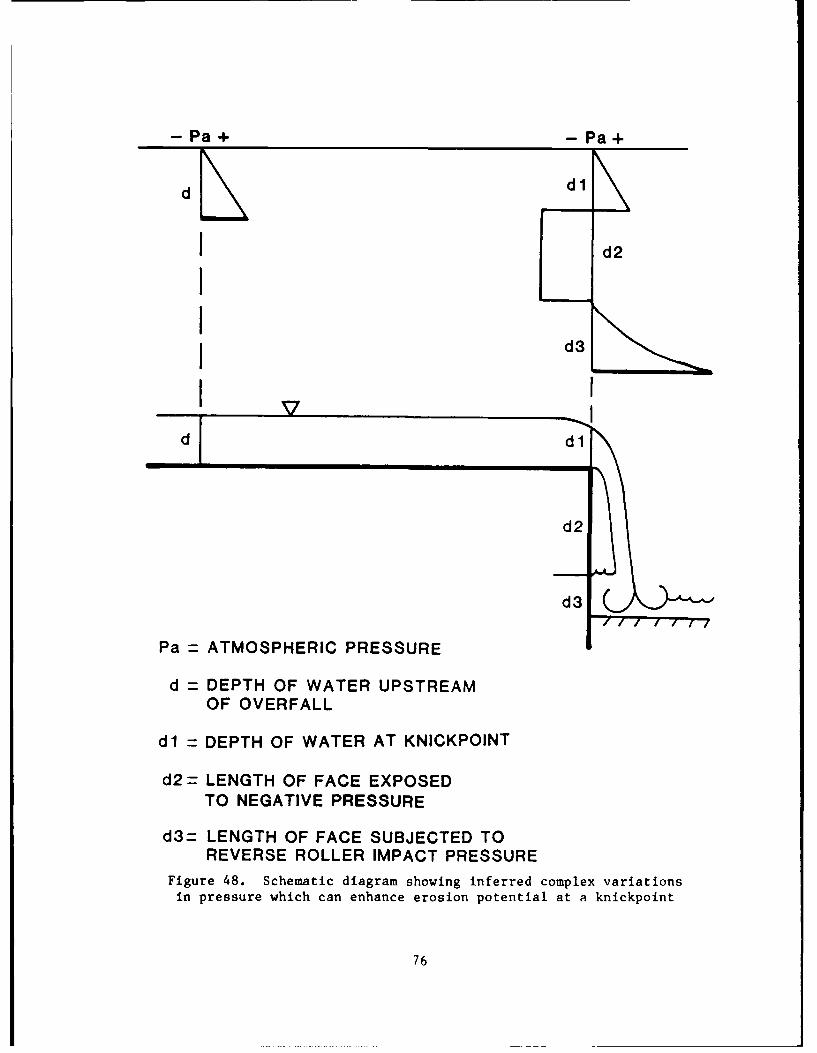
- Pa+ - Pa+
d~d 1,L
I d2
I d3
d dl
d2
d3
Pa = ATMOSPHERIC PRESSURE
d = DEPTH OF WATER UPSTREAMOF OVERFALL
d l = DEPTH OF WATER AT KNICKPOINT
d2 = LENGTH OF FACE EXPOSEDTO NEGATIVE PRESSURE
d3= LENGTH OF FACE SUBJECTED TOREVERSE ROLLER IMPACT PRESSURE
Figure 48. Schematic diagram showing inferred complex variationsin pressure which can enhance erosion potential at a knickpoint
76
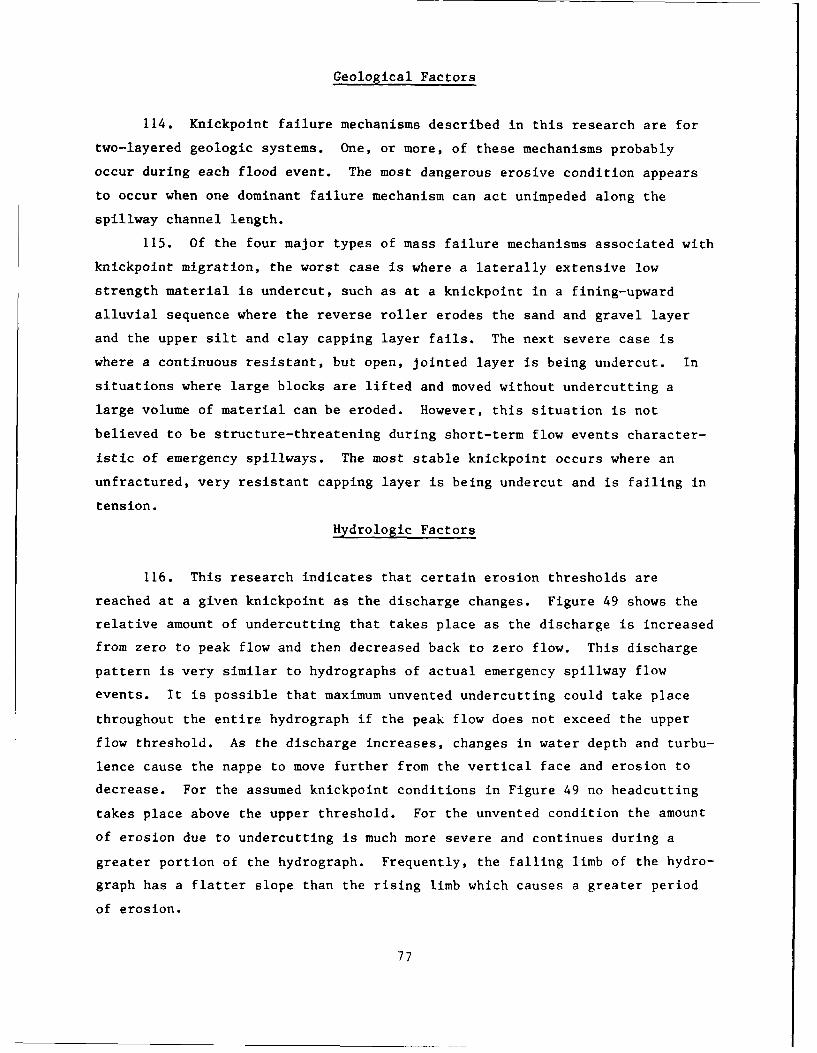
Geological Factors
114. Knickpoint failure mechanisms described in this research are for
two-layered geologic systems. One, or more, of these mechanisms probably
occur during each flood event. The most dangerous erosive condition appears
to occur when one dominant failure mechanism can act unimpeded along the
spillway channel length.
115. Of the four major types of mass failure mechanisms associated with
knickpoint migration, the worst case is where a laterally extensive low
strength material is undercut, such as at a knickpoint in a fining-upward
alluvial sequence where the reverse roller erodes the sand and gravel layer
and the upper silt and clay capping layer fails. The next severe case is
where a continuous resistant, but open, jointed layer is being undercut. In
situations where large blocks are lifted and moved without undercutting a
large volume of material can be eroded. However, this situation is not
believed to be structure-threatening during short-term flow events character-
istic of emergency spillways. The most stable knickpoint occurs where an
unfractured, very resistant capping layer is being undercut and is failing in
tension.
Hydrologic Factors
116. This research indicates that certain erosion thresholds are
reached at a given knickpoint as the discharge changes. Figure 49 shows the
relative amount of undercutting that takes place as the discharge is increased
from zero to peak flow and then decreased back to zero flow. This discharge
pattern is very similar to hydrographs of actual emergency spillway flow
events. It is possible that maximum unvented undercutting could take place
throughout the entire hydrograph if the peak flow does not exceed the upper
flow threshold. As the discharge increases, changes in water depth and turbu-
lence cause the nappe to move further from the vertical face and erosion to
decrease. For the assumed knickpoint conditions in Figure 49 no headcutting
takes place above the upper threshold. For the unvented condition the amount
of erosion due to undercutting is much more severe and continues during a
greater portion of the hydrograph. Frequently, the falling limb of the hydro-
graph has a flatter slope than the rising limb which causes a greater period
of erosion.
77
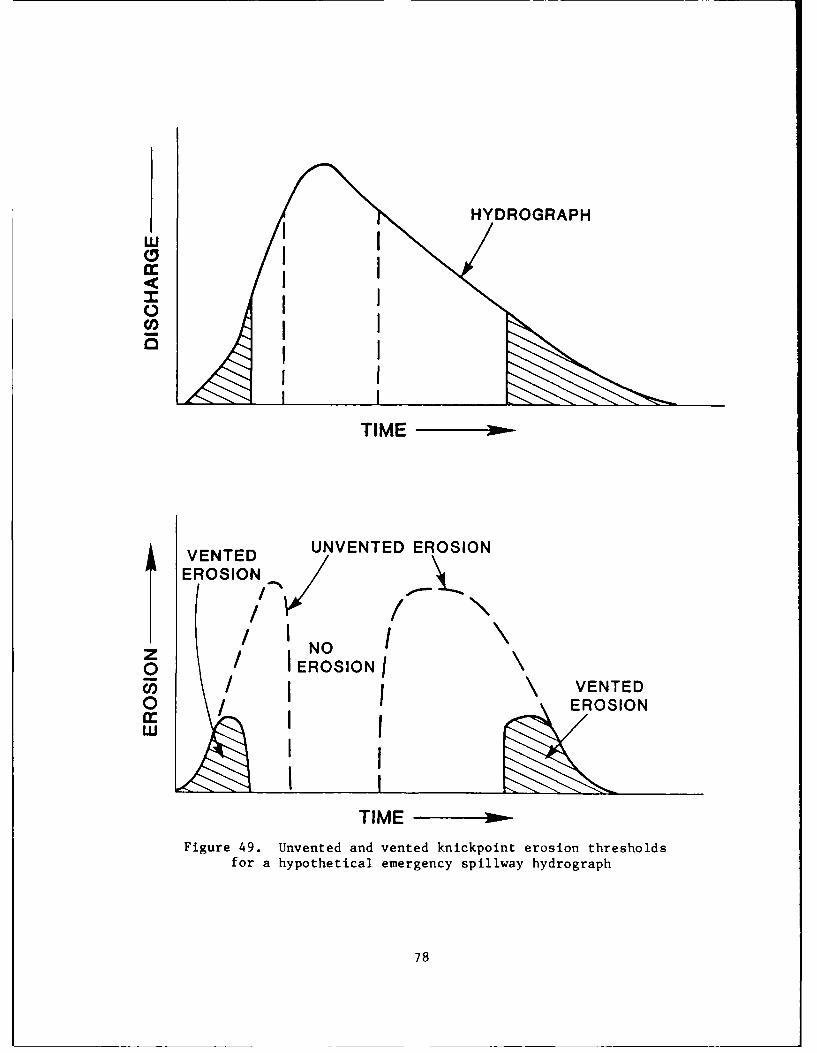
HYDROGRAPH
TIM
0 No
ROSROSIO
tE"EoSO( VENTED
0 EROSION
TIME
Figure 49. Unvented and vented knickpoint erosion thresholds
for a hypothetical emergency spillway hydrograph
78
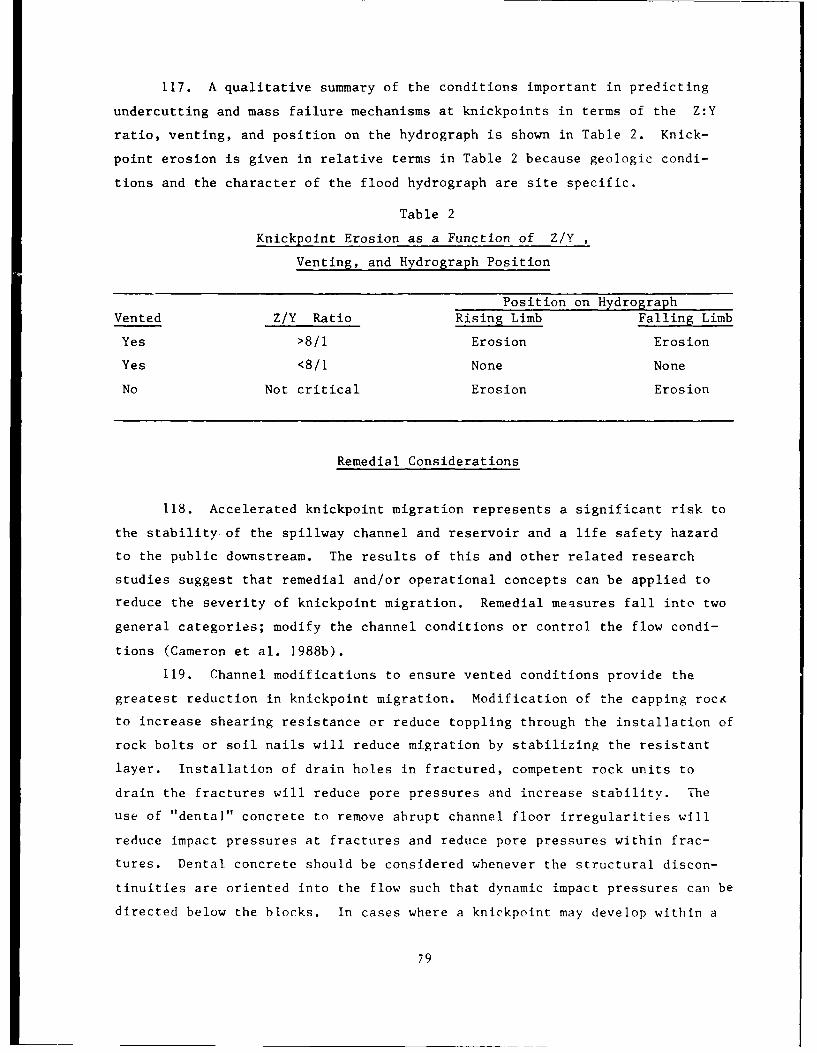
117. A qualitative summary of the conditions important in predicting
undercutting and mass failure mechanisms at knickpoints in terms of the Z:Y
ratio, venting, and position on the hydrograph is shown in Table 2. Knick-
point erosion is given in relative terms in Table 2 because geologic condi-
tions and the character of the flood hydrograph are site specific.
Table 2
Knickpoint Erosion as a Function of Z/Y
Venting, and Hydrograph Position
Position on HydrographVented Z/Y Ratio Rising Limb Falling Limb
Yes >8/1 Erosion Erosion
Yes <8/1 None None
No Not critical Erosion Erosion
Remedial Considerations
118. Accelerated knickpoint migration represents a significant risk to
the stability of the spillway channel and reservoir and a life safety hazard
to the public downstream. The results of this and other related research
studies suggest that remedial and/or operational concepts can be applied to
reduce the severity of knickpoint migration. Remedial measures fall into two
general categories; modify the channel conditions or control the flow condi-
tions (Cameron et al. 1988b).
119. Channel modifications to ensure vented conditions provide the
greatest reduction in knickpoint migration. Modification of the capping rocK
to increase shearing resistance or reduce toppling through the installation of
rock bolts or soil nails will reduce migration by stabilizing the resistant
layer. Installation of drain holes in fractured, competent rock units to
drain the fractures will reduce pore pressures and increase stability. The
use of "dental" concrete to remove abrupt channel floor irregularities will
reduce impact pressures at fractures and reduce pore pressures within frac-
tures. Dental concrete should be considered whenever the structural discon-
tinuities are oriented into the flow such that dynamic impact pressures can be
directed below the blocks. In cases where a knickpoint may develop within a
79
stratigraphic sequence, such as the fluvial section of Black Creek, a complete
cutoff wall to below the erodible layer may be necessary. Such walls should
always be considered at the downstream end of the concrete spillway apron
because the apron can act as the capping layer and concentrate undercutting
below the structure.
120. Knickpoint migration can also be reduced by controlling the flow
in the spillway channel. Dams equipped with gated emergency spillway struc-
tures should be operated such that the flow is either below or above the
threshold flows for knickpoint erosion. At uncontrolled spillway structures,
some flow control may be possible if the outlet works and/or power plant con-
duits are managed to control spillway discharges.
121. Because this research dealt primarily with emergency spillways,
the summary was given in terms of a theoretical hydrograph. It should be
remembered, however, that the unvented condition with resulting erosion
potential can be generated by falling tailwater levels as well as increasing
discharge. Thus, it is as important to properly manage the tailwater levels
as it is to manage the channel discharge if knickpoint migration risks are to
be reduced.
80
PART VIII: CONCLUSIONS AND RECOMMENDATIONS
Conclusions
122. Based on the literature review, laboratory test results, and anal-
yses of field data, the following conclusions can be drawn from this research:
a. Techniques developed in this research can be used to hydrau-lically model certain aspects of headcut erosion using rocksimulants. Rock simulants consisted of various combinationsof sodium silicate cemented gravel, gelatin cemented gravel,and Plexiglas. These materials eroded in a very realistic
manner and kept the eroding water clear.
b. The major types of mass failure mechanisms observed in thefield at sites where severe headward erosion had occurred canbe reproduced in the laboratory by the techniques developed
during this study.
c. Knickpoint migration occurs where a relatively continuous
resistant capping layer overlies a less resistant layer.
d. The headcutting or knickpoint migration phenomenon is depend-
ent on the geometry of the knickpoint and the velocity of thewater. The geometry of the knickpoint is dependent on thegeology at a specific site. The geometry of an undevelopedknickpoint can be predicted if enough geologic information isavailable.
e. The highest rate of headcutting does not necessarily corres-
pond to the highest velocity or discharge. Laboratory resultshave shown that headcutting can be negligible at higher velo-
cities and accelerate greatly as the velocity is reduced.
f. In order for maximum headcutting to take place, the fallingjet of water must impact near the vertical face of the knick-point. At very high velocities the impact area of the jet is
far enough away from the vertical face that very little forceis acting directly on the face. The angle of impact must also
be steep enough so that a high percentage of the discharge inthe falling jet is directed back and underneath the overfall
as a reverse roller.
. The angle of impact and the point of impact can be calculatedfor a "vented" knickpoint. If "unvented" conditions prevailstandard calculation methods are invalid. Unvented conditions
can occur when the nappe is confined within parallel wallsdownstream of the knickpoint.
h. Unvented knickpoints in laboratory tests accelerated headcut-ting by orders of magnitude other than at vented knickpoints.
The low pressure underneath the nappe drew the jet closer tothe vertical face of the knickpoint causing severe undercut-
ting. Not only was the position of the jet moved to where it
would do more damage, the discharge for a given head was
81
increased because of the reduced pressure. Because of therectangular shape of many spillways and natural channels,unvented conditions are probably common.
i. In laboratory tests, when unvented knickpoints are vented, thejet moves away from the vertical face of the knickpoint andundercutting ceases. Depending on the geometry of the knick-point and the velocity of flow an unvented knickpoint that isvented will remain or gradually become unvented again as theair under the nappe is removed.
The diameter of the reverse roller portion of the jet remainsrelatively constant for the dimensions of the knickpoint andflow conditions.
k. For the reverse roller to undercut effectively, the erodiblelayer has to be at least as thick as the diameter of thereverse roller. When the thickness of the erodible layerexceeds the diameter of the reverse roller, mass failuremechanisms such as slumping play an important role.
1. The similarity between the Froude numbers in many of thespillway flows examined in the field and the Froude numbersgenerated in the flume studies suggest that the principles ofhydraulic similitude can be applied.
m. Approximations of the velocities of turbulent water under anoverfall can be accomplished by measuring the velocities ofparticles in the reverse roller by using a video camera andstop action.
Recommendations
123. Based on this research dealing with the effect of stratigraphic
variability and venting of headcutting in layered rocks, the following recom-
mendations are made:
a. Acquire detailed geologic information at spillway sites whereflow has occurred or is expected to occur.
b. Instrument and monitor field sites where knickpoints alreadyexist to determine the extent of the unvented condition.
c. Begin the design of devices to vent naturally occurringknickpoints after the extent of unvented knickpoint problemsin the field is determined. Preventive devices and devicesthat could be used during flood event should also beevaluated.
d. Conduct additional flume studies to better understand thepressure differentials at the knickpoint in relation to therate of headcutting in various geologic materials.
82
e. Carry out large-scale flume and field investigations toquantify the relationship between the thickness of the lowererodible layer and the diameter of the reverse roller.
f. Initiate studies to determine the application of hydraulicsimilitude to modeling of knickpoint prototypes.
. Incorporate the mechanisms causing unvented scour into arecently developed discrete element computer model fortransport of eroded material.
h. Analyze current reservoir discharge practices in regard to thepast peak headcutting phenomena.
i. Conduct studies to determine equations for turbulent flowvelocities using a video camera.
83
REFERENCES
American Geological Institute. 1980. Glossary of Geology, AmericanGeological Institute, Washington, DC.
Berg, R. R. 1986. Reservoir Sandstones, Prentice-Hall, Inc., Englewood
Cliffs, NJ.
Blaisdell, F. W. 1983. Analysis of Scour Observations at Cantilever Outlets,US Department of Agriculture, Miscellaneous Publication No. 1427, US Depart-ment of Agriculture, Washington, DC.
Blaisdell, F. W., and Anderson, C. L. 1984. "Pipe Spillway Plunge PoolDesign Equations," Proceedings, Conference on Water Resource Development,American Society of Civil Engineers, Hydraulics Division, pp 390-396.
Brush, L. M., and Wolman, M. G. 1960. "Knickpoint Behavior in NoncohesiveMaterial: A Laboratory Study," Bulletin of the Geological Society of America,Vol 71, No. 1, pp 59-74.
Cameron, C. P., Cato, K. D., McAneny, C. C., and May, J. H. 1986. "Geotech-nical Aspects of Rock Erosion in Emergency Spillway Channels," TechnicalReport REMR-GT-3, US Army Engineer Waterways Experiment Station, Vicksburg,MS.
Cameron, C. P., Patrick, D. M., Cato, K. D., and May, J. H. 1988a. "Geotech-nical Aspects of Rock Erosion in Emergency Spillway Channels; Report 2:Analysis of Field and Laboratory Data," Technical Report REMR-GT-3, US ArmyEngineer Waterways Experiment Station, Vicksburg, MS.
Cameron, C. P., Patrick, M., Bartholomew, C. 0., Hatheway, A. W., and May,J. H. 1988b. "Geotechnical Aspects of Rock Erosion in Emergency SpillwayChannels; Report 3: Remediation," Technical Report REMR-GT-3, US ArmyEngineer Waterways Experiment Station, Vicksburg, MS.
Clemence, K. T. 1987. Influence of Stratigraphy and Structure on KnickpointErosion, unpublished Undergraduate Fellow Thesis, Texas A&M University,Department of Geology, College Station, TX.
Fletcher, B. P. 1982. "Los Esteros Spillway, Pecos River, New Mexico;Hydraulic Model Investigation," Technical Report HL-82-24, US Army EngineerWaterways Experiment Station, Vicksburg, MS.
Grissinger, E. H., and Bowie, A. . 1984. "Material and Site Controls ofStream Bank Vegetation," Transactions of the American Society of AgricultureEngineers, St. Joseph, MI, Vol 27, No. 6, pp 1829-1835.
Guy, H. P., Simons, D. B., and Richardson, E. V. 1966. "Summary of AlluvialChannel Data from Flume Experiments, 1956-61," US Geological Survey Profes-sional Paper 462-1, US Geological Survey, Washington, DC.
Henderson, F. M. 1966. Open Channel Flow, Macmillan, Inc., New York.
Hjulstrom, F. 1939. "Transportation of Detritus by Running Water," inTrask, P. D. (editor), Recent Marine Sediments, Dover, New York, pp 5-29.
Mason, P. J. 1984. "Erosion of Plunge Pools Downstream of Dams Due to theAction of Free-Trajectory Jets," Proceedings of the Institution of Civil Engi-neers, Paper 8734, Vol 76, pp 523-537.
84
Moore, W. L. 1943. "Energy Loss at the Base of a Free Overfall," Transac-tions of the American Society of Civil Engineers, Vol 108, p 1343, with dis-cussions by White, M. P., p 1361, Rouse, H., p 1381, and others.
Paek, Y. K., and Heller, L. W. 1968. "Gelatin Modeling Methods for the Studyof Foundation Dynamics, Ground Motion and Seismic Phenomena," MiscellaneousPaper No. 4-969, US Army Engineer Waterways Experiment Station, Vicksburg, MS.
Perry, E. B. 1982. "Erosion Tests on Rock from Spillway at Lewisville Dam,"US Army Engineer Waterways Experiment Station, Geotechnical Laboratory,Vicksburg, MS.
Pettigrew, R. J. 1986. Analysis of A Knickpoint Migration on the Spillway ofa Small Lake Near Waco, Texas, unpublished Bachelor of Science Thesis, Depart-ment of Geology, Baylor University, Waco, TX.
Piest, R. F., Bradford, J. M., and Wyatt, G. M. 1975. "Soil Erosion andSediment Transport from Gullies," Journal of the Hydraulics Division, AmericanSociety of Civil Engineers, pp 65-80.
Pugh, C. A., and Gray, E. W., Jr. 1984. "Fuse Plug Embankments in AuxiliarySpillways-Developing Design Guidelines and Parameters," US Bureau of Reclama-tions, Engineering and Research Center, Denver, CO.
Rehbinder, G. 1980. "A Theory About Cutting Rock with a Water Jet," RockMechanics, Springer Verlag, Vol 12, No. 3-4, pp 247-257.
Reinius, E. 1986 (Jun). "Rock Erosion," Water Power and Dam Construction,pp 43-48.
Robinson, R. F. 1987. "Stress Distribution at an Overfall," Draft report,US Department of Agriculture, Soil Conservation Service, Stillwater, OK.
Schumm, S. A. 1973. "Geomorphic Thresholds and Complex Response of DrainageSystems, Fluvial Geomorphology," Morisawa, M. (editor), Proceedings, FourthAnnual Geomorphology Symposium, State of New York, Binghamton, NY, pp 299-310.
• 1985. "Experimental Studies of the Fluvial System,Report No. 6," Colorado State University, Fort Collins, CO.
Simonson, C. P. S. 1979. Hydraulic Model Studies-Scour Velocity of Rock,File J202-EWB, Reference No. MM188/79, (Translation from Russian), US ArmyEngineer Waterways Experiment Station, Vicksburg, MS.
Smith, L. M., and Patrick, D. M. 1979. "Engineering Geology and Geomorphol-ogy of Streambank Erosion: Report 1, Eel River Basin, California," TechnicalReport GL-79-7, US Army Engineer Waterways Experiment Station, Vicksburg, MS.
Soil Conservation Service. 1973. "A Guide for Design and Layout of EarthEmergency Spillways as Part of Emergency Spillway Systems for Earth Dams,Technical Release No. 52," US Department of Agriculture, Washington, DC.
_ 1984a. "Rock Material Field Classification Procedure, Technical
Release No. 71," US Department of Agriculture, Washington, DC.
_ 1984b. "Arkansas, December 1982 Spillway Performance Report,National Bulletin No. 210-4-14," US Department of Agriculture, Washington, DC.
_ 1985a. "Virginia Spillway Damage Report, North River Virginia,Informal Report," US Department of Agriculture, Washington, DC.
85
Soil Conservation Service. 1985b. "1985 Soil and Water Conservation,Research and Education Progress and Needs," US Department of Agriculture,Washington, DC.
_ 1985c. "Mississippi, December 1982 Spillway Performance Report,National Bulletin No. 210-5-16," US Department of Agriculture, Washington, DC.
_ 1986. "June 1986 Spillway Performance Report, National BulletinNo. 210-6-13," US Department of Agriculture, Washington, DC.
Spurr, K. J. W. 1985 (Jul). "Energy Approach to Estimating Scour Downstreamof a Large Dam," Water Power and Dam Construction, pp 81-89.
Temple, D. M. 1980. "Tractive Design of Vegetated Channels," Transactions ofthe.American Society of Agricultural Engineers, St. Joseph, MI, Vol 23, No. 4,pp 884-890.
_ 1982. "Flow Retardance of Submerged Grass Channel Linings,"Transactions of the American Society of Agricultural Engineers, St. Joseph,MI, Vol 25, No. 5, pp 1300-1303.
_ 1983. "Design of Grass-Lined Open Spillways," Transactions of
the American Society of Agricultural Engineers, St. Joseph, MI, Vol 26, No. 4,pp 1064-1069.
_ 1984. "Erosionally Effective Soil Stress in Grass-Lined Open
Channels," American Society of Agricultural Engineers, Paper No. SWR84-102,St. Joseph, MI.
. 1986. "Distribution Coefficients for Grass-Lined Channels,"
Journal of Hydraulic Engineering, American Society of Civil Engineers,Paper No. 20435, Vol 112, No. 3, pp 193-205.
US Army Corps of Engineers. 1970. Hydraulic Design of Flood Control Chan-nels, Engineering Manual 1110-2-1601, Office, Chief of Engineers, US ArmyCorps of Engineers, Washington, DC.
US Army Engineer District, Fort Worth. 1971. "Lake Brownwood: Modificationof Spillway, Design Memorandum No. 2," US Army Engineer District, Fort Worth,Corps of Engineers, Fort Uorth, TX.
US Army Engineer District, Rock Island. 1962. "Spillway, Saylorville Reser-voir, Design Memorandum No. 10," US Army Engineer District, Rock Island, Corpsof Engineers, Rock Island, IA.
_ 1984. "Saylorville Dam: Initial Overflow of Spillway, Supple-
ment to Periodic Inspection Report No. 7," US Army Engineer District, RockIsland, Corps of Engineers, Rock Island, IA.
Whitten, C. B., and Patrick, D. M. 1981. "Engineering Geology and Geo-morphology of Streambank Erosion: Report 2, Yazoo River Basin Uplands,Mississippi," Technical Report GL-79-7, Geotechnical Laboratory, US ArmyEngineer Waterways Experiment Station, Vicksburg, MS.
Vieux, B. E. 1986. "Plunge Pool Erosion in Cohesive Soils at Two Dams inKansas," Draft report, US Department of Agriculture, Soil ConservationService, Washington, DC.
86
APPENDIX A
LABORATORY DATA SHEETS
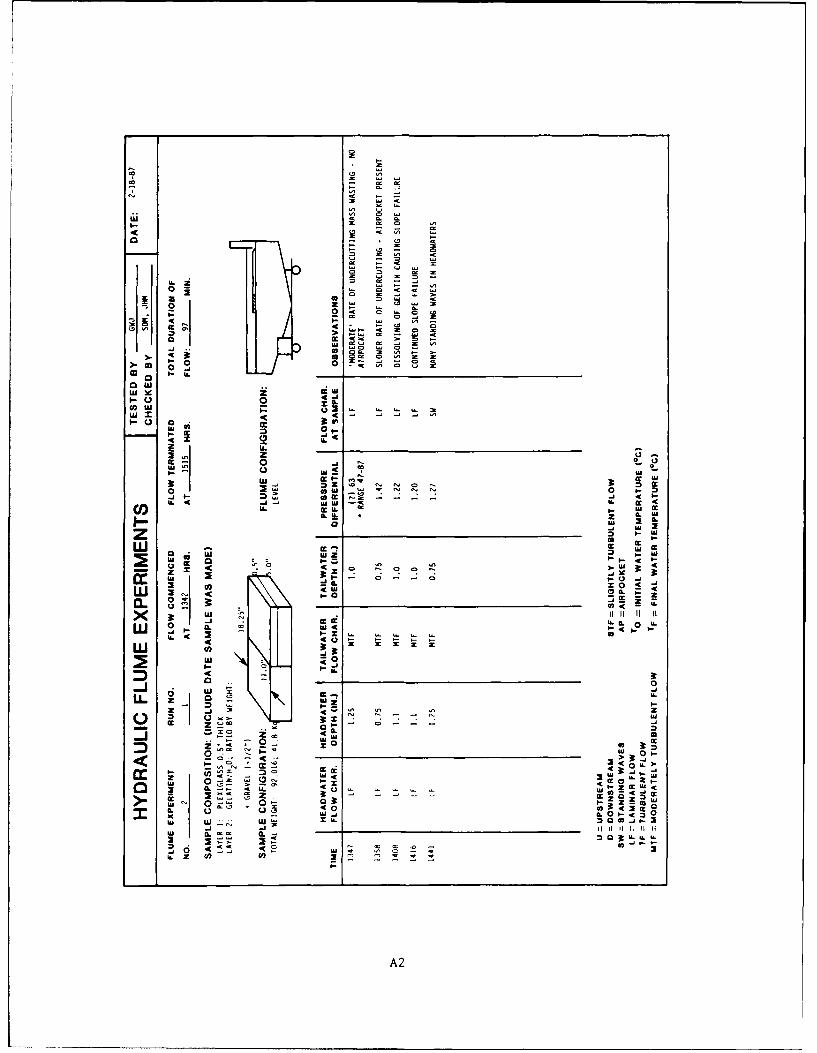
0
a LU
0 L U
-1 CD -
(.4 -I I- w
a w j ;:
CL - U. -Z a
0 LU a
0 ul LU I
cc j. I- L ~ U
0 w a a .
LL* 00 C 0c
ow CO
ICL
a 3:410
2 z : )
-A 0. 0
I-- Lu5 D
.j -J 11 1
z
I- LA2
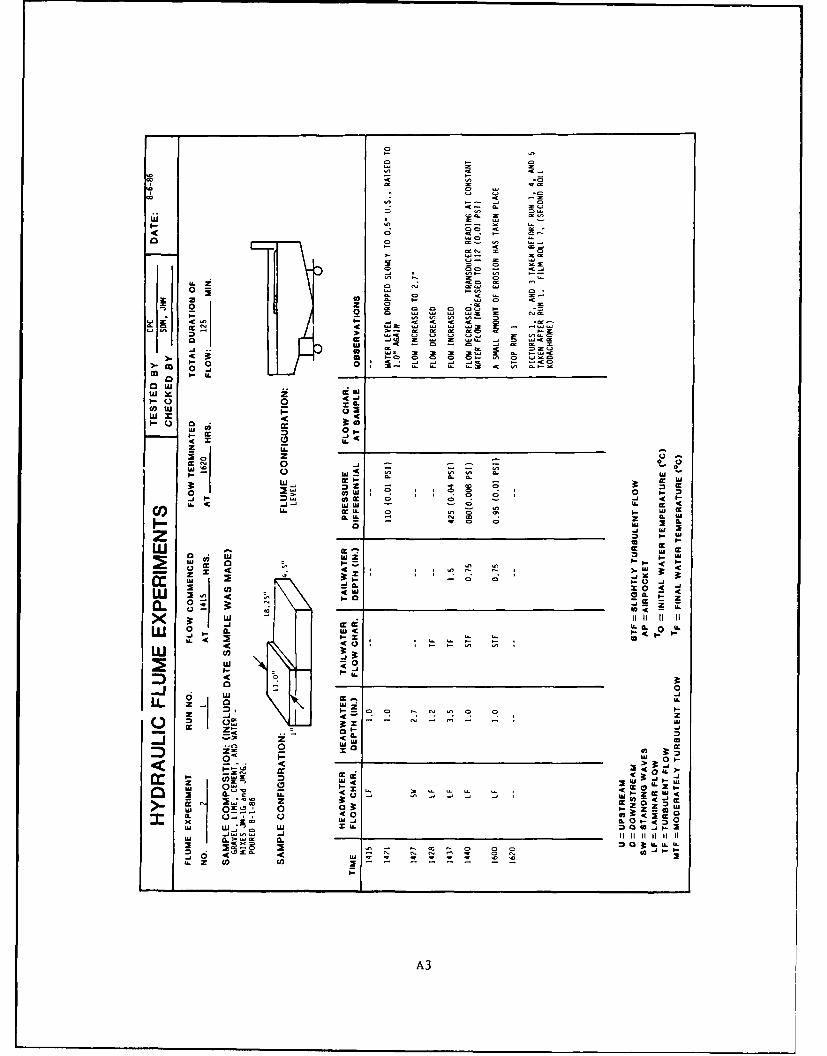
o- -
0 x Az
U.0
0 0 a.$
0 A
.0 U
0 2 0us CC.)L
Wj P. w CC C ) 2
LL. .0 2 V0 a .h C
ow cc~
2 CL 0
C x Ux2 < u.I
50 1.-- 0
0I 0i -j -0 W- 0 06
LL - -- xa
:i w CCC00
z I L U. 11zz2
Uh
2* >Ui 0r 0
tII Co - 4
w X U.. zA
w A OM C 3: - za C
4~I U.U0 --
Z co
- __ __ __ ___A3_ _
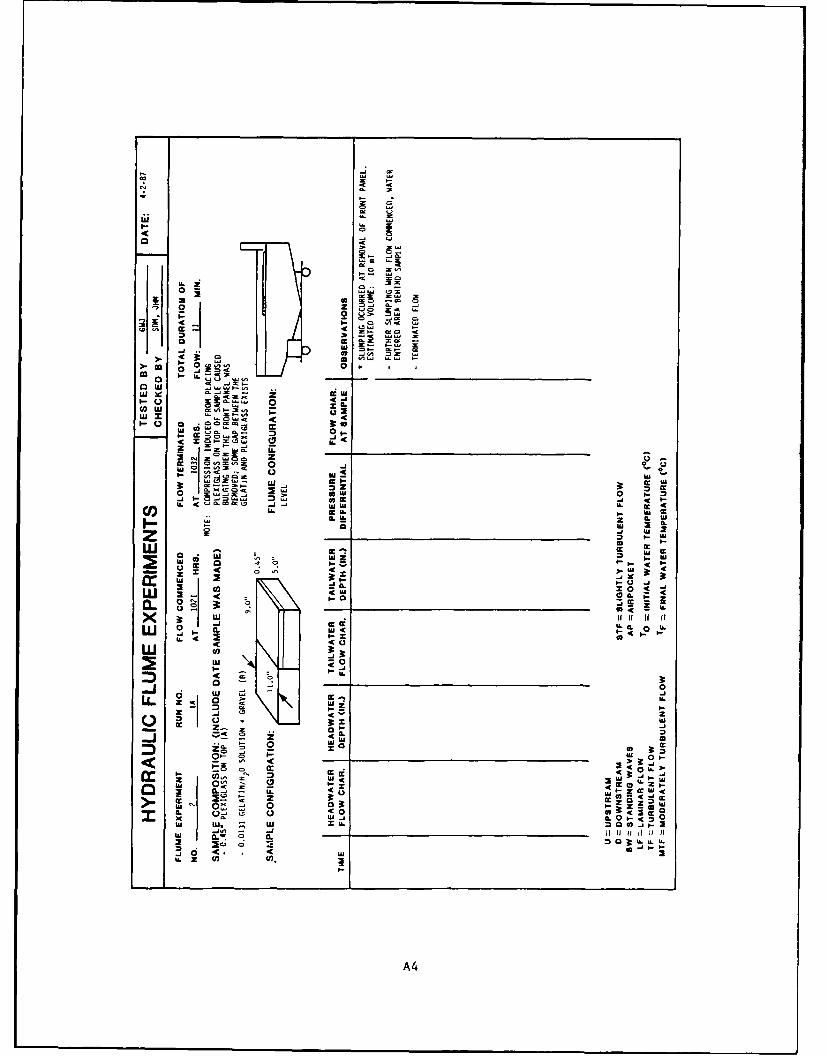
-C K
0-
3, 0
ai x
0 0 jC
K - I-
LL ~I CC U.Us C
= 0 3
o w
w mm .. M,3
-z .u. zCm -! I-=U
C I
w2 ~ ~ - x -I-
w OW 0a. -
a. .0 C~ - ~ lU
oU if-J I--z L x
-L 00z i
w 2 x a
21 w0Wm
wt2 - -) -C
U. . 00 -z m a
M, -j1 11
>.(.. CL 3 K 0
U. z
A4
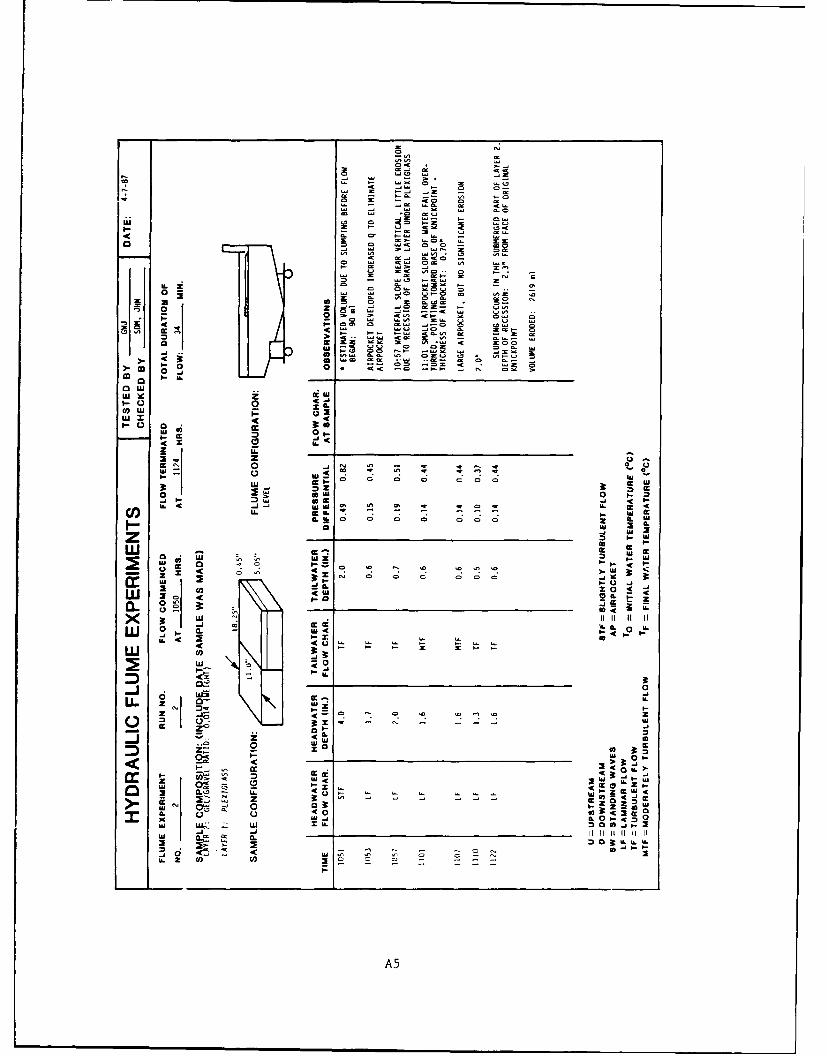
0C
00
P0 0 Z2D
40 0 0
(a La . 0
0 a UsA I..
U. CC ILL CC
- a LaLaJ=e
La CC a- CA I--L
.J -L -A C~Ii.u z 00. L 3. - %
IC- O2 w. -=
C 0 0
CCL L LaIL L-j 0 o- 44 1.? 1a. IL . LU. -C en a -. -a C 0a
w" a~ 40
a 03C 0 A ~ 0*a O
i-. ..- L0. L
0. nn #-
z 00 -
us
I Li.:0%U z Us,
us $. 4 cc @
4L 0 a 0
xL 0= CL 0
C) .~ 0 0)00 02 00
w~W 0. W .~ . 0
~ WI LiA5
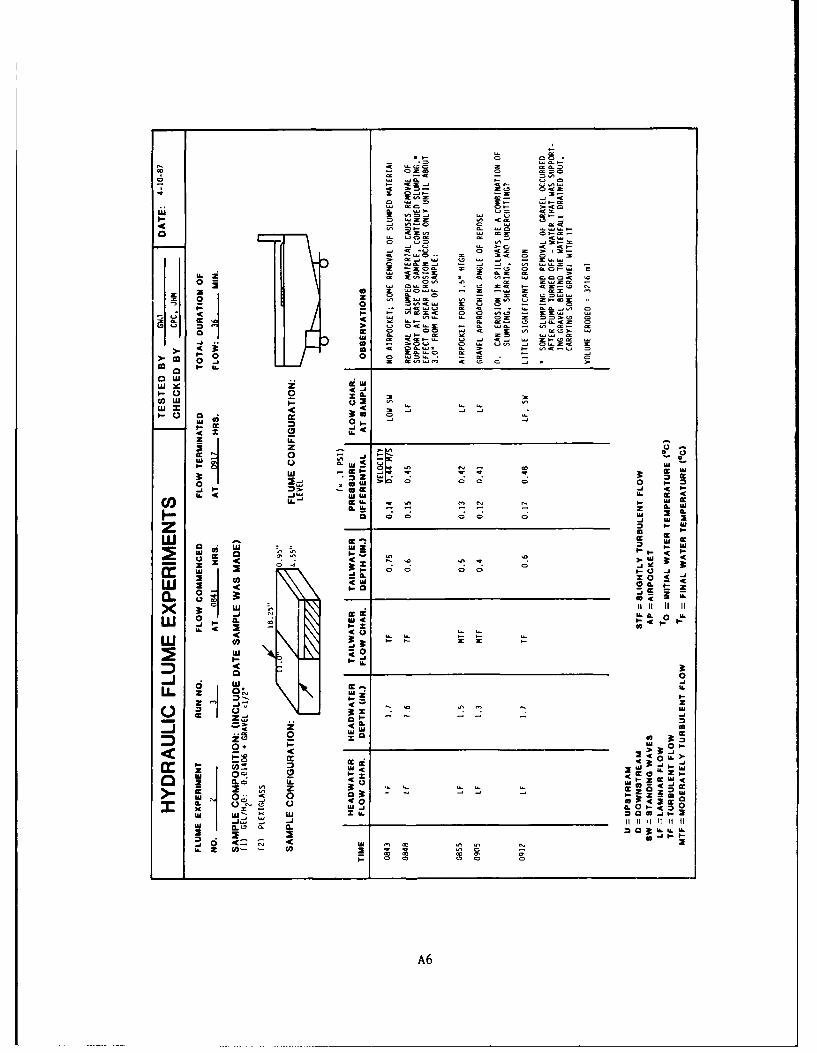
0 0.
o .,4 = cc C
C a X- Lu-Lw xO ci- CC
III ox C LuC L LIL
CCO C
cc r 0 CX C
C: 1LuC Z I. 0CJ 4j Lucc~ - L..
C U.- LuCCC
I.- -u nz AW - Xu
Lu -C 1.zAu L X = C
(0(4 Lu JC u -L C IO. - LA C
w- I-I E__ __ _ __z__ _
a. 0
w ( *3I- .r
I--a
D l-:0
LI.. o iL
C -C 40
I-X
Il 0 - 0 o itt
CL C C C
A6
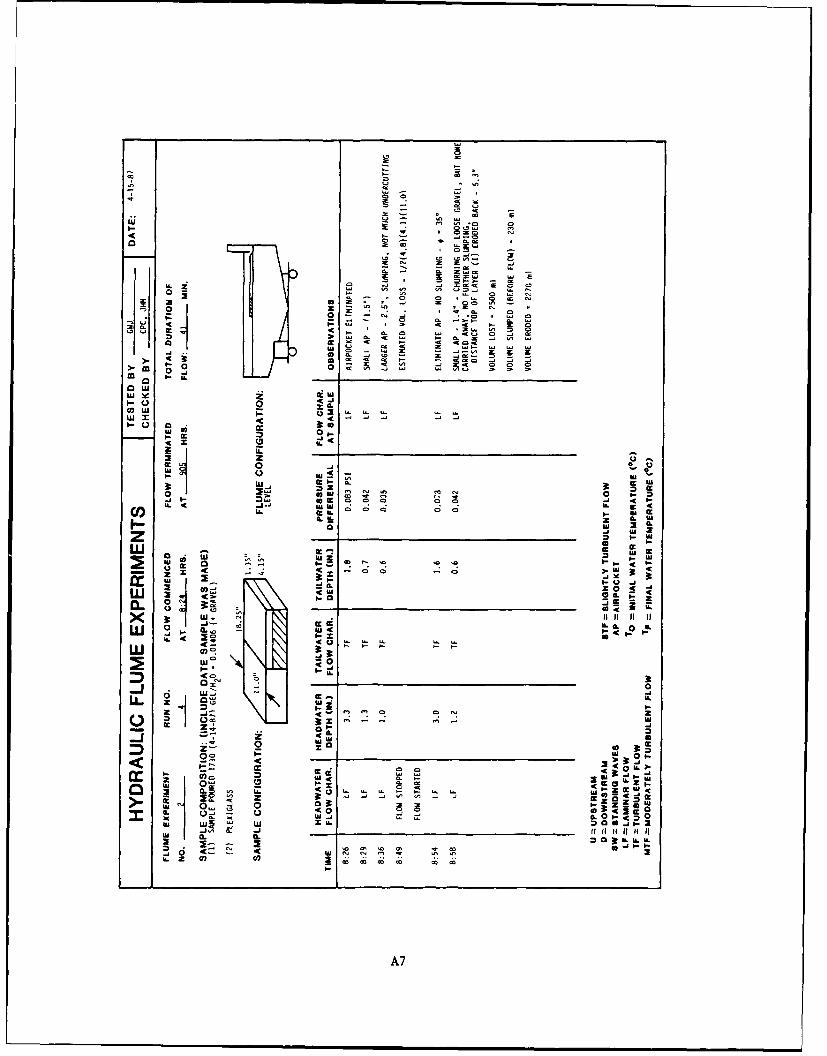
o I.- = ..
0 0 2
Q 0 EC.a In
wl x .
I. 0 C. 0
uj CC I.-~.zz0*ut
2 IL
,-.o~~i a ~- ~ -
4 c
cc .. 1 2-X0. -l0 j
0 WS -
w a 9L0~
-J- ILI
WW
M ~ 0 l< c0
0U. - -J
zao 3:ZZ0I- ____________-______
l. w. ow 1- 3~
w CL L a IL ILU-J~~~ ~~~ 00 t--4w N C ~ t n O
A7
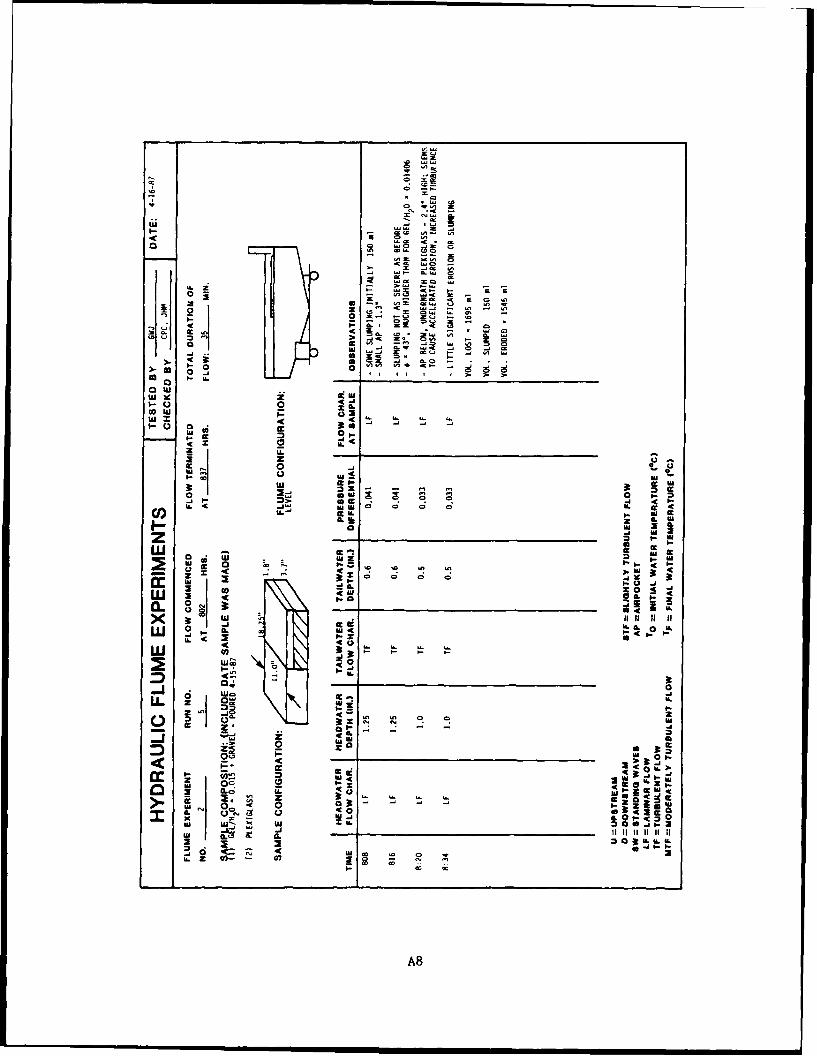
0 0 K
0
--
w '
0K 160
.0 U -
0 2-( 64
_j. P- a6 -
0. 14K - 0 .
Iu !
w
00 0
1-0 a
601.a. 0 0
ww
00
O 0- 31 a . 0M
w 0~. 1--z O
.X - 04 1.-
U. zO~K oa3- 3ZA8
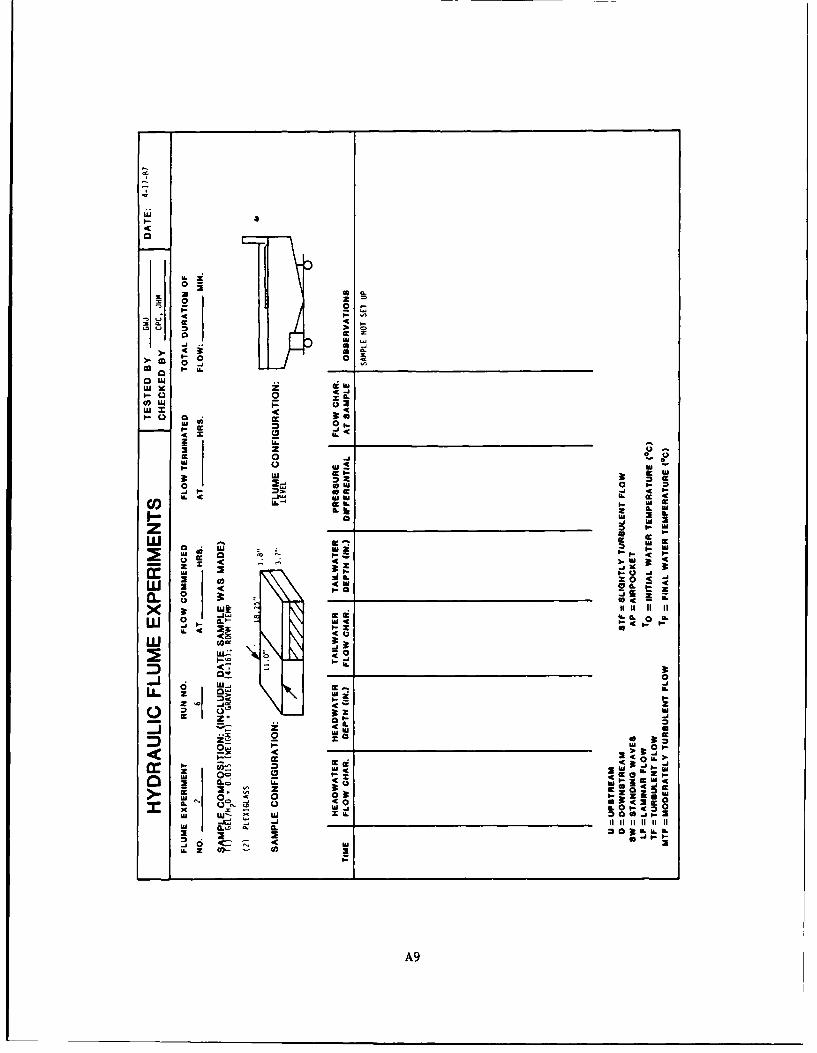
0
'xLI
0 0
3z 2- 0U. -. c
CD I. flu
P... W- 0 -
0 ,IL0
ILL
Il Co. -
0 -JO0 QS w
Z.. P w £
2~~ LWa _I- Ui ez ala 2 £.
0 0 -.hI~0 .14 X
w UJ- LU aL40 1*. C4 a4t .IL2
z() - I 0' 3Z
* a'- -
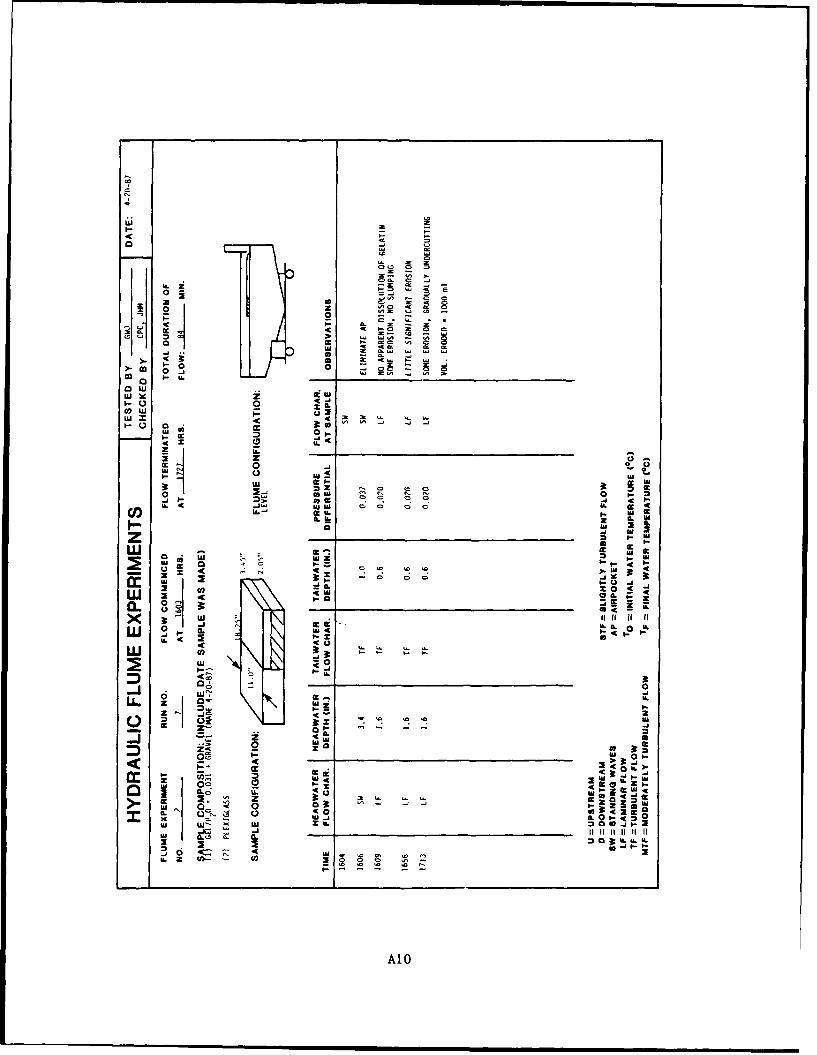
Ci x
co -.
00
CC' I-.0
00
oo IL u.D
0 1- a0
LU~ ~ ~ Il z C- .
>m 0 U
W 0. L. , -
L 0
LU 2 cc ci IL I.
IL0 0., x " - ~01-0
00Z1 0
9L 0
(Uc 20 U.t____________ r 3tv)- U.
L3 LU 0 1.. 39
w LU
~A1
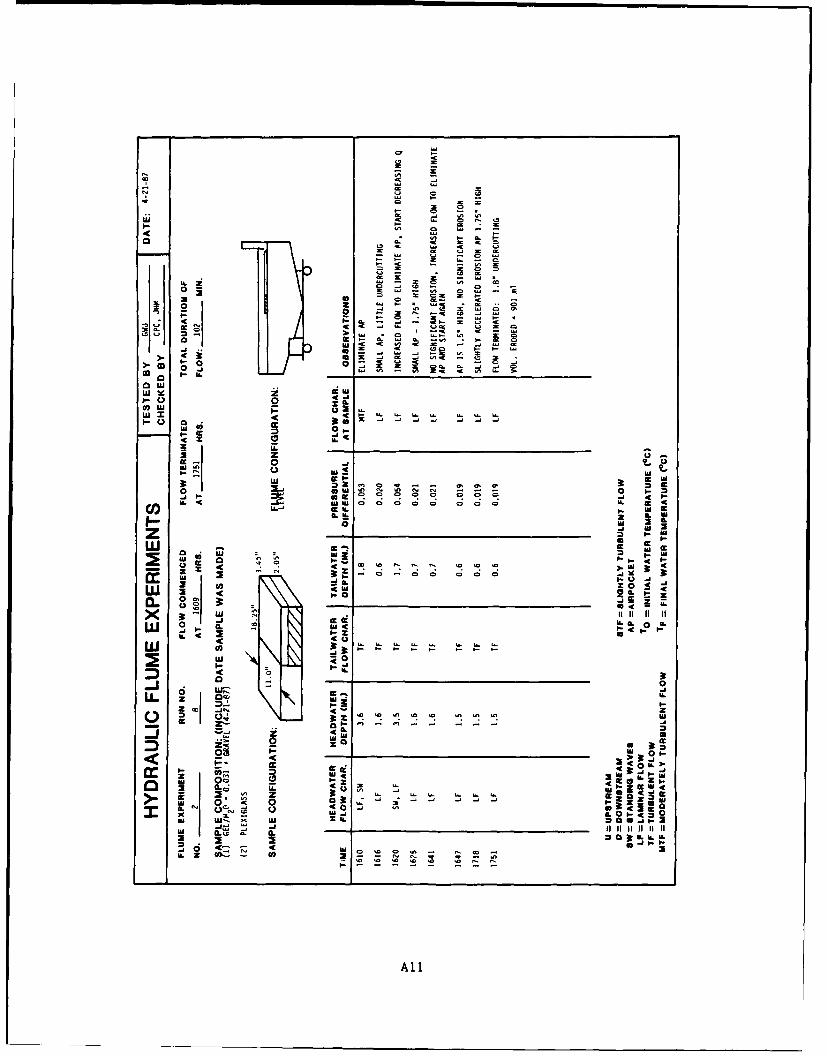
0 2t~
00
p- -J0I 0 II -
w xI-. a a 4i a
1. 0 .-C II c 0
-C m - IL
IL ~ L w U - 0 I
12 o 2
wI Nc CCI
0I A P, U 0 *- - L
0I. -C ). -- .z - C -_ C ; ; C -A 3:L
>01. IA j~I IL_ _ _ _ _ _ _ _ _
ow z , x0 4b-C 2 IL E
X Z TI I0 IL.
IL ~ L
I-.I-zN zx a
w0 00
I u w- Mo -I
W Q0 E C
IL z I-
a -All
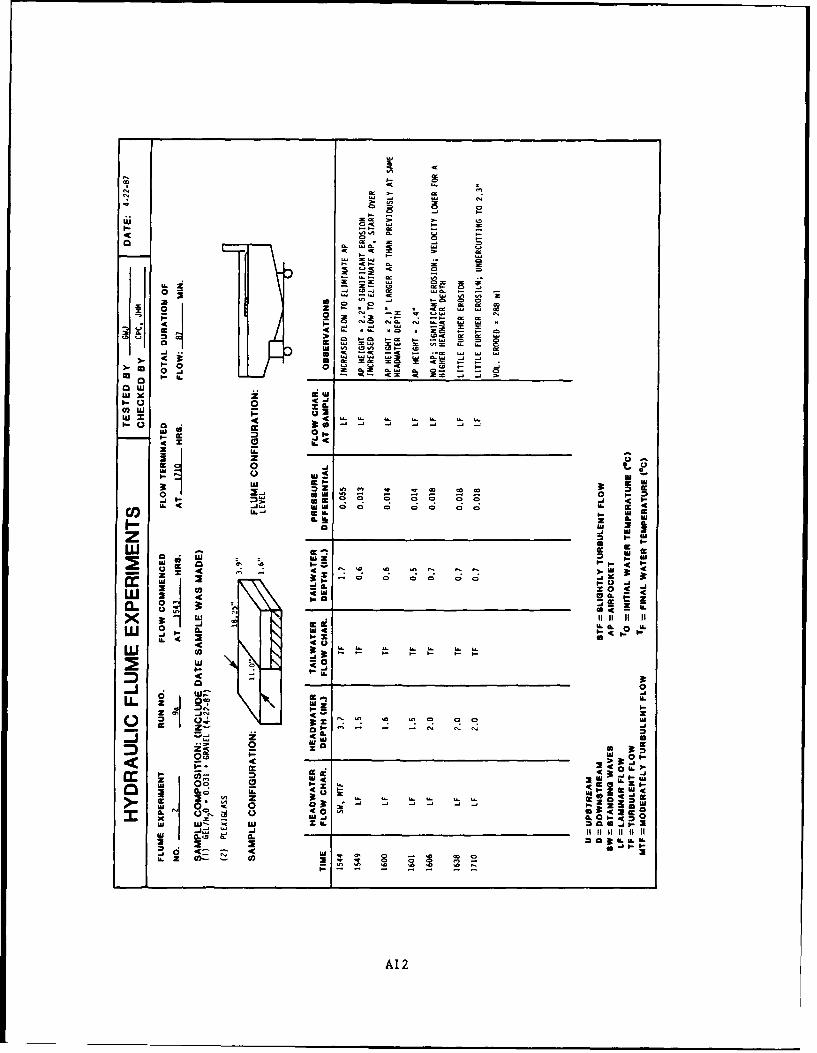
00
U) La .j L
-u X
0
-. -9 P-
z z
Cq aa Itc
.2 1 - f - I
w -z - * w -- - La.La C;. C0C J3
No zo - .LjO
4. 1 0 -.zL - 0 $
0' -. N-0 0
0 N0 L
xL
Lc LaS
w _j NI .-. - c
-i -. I
zjz
0W 0
WI I- t-U2
1 -
~~~0~ . C a L a La L a L
~ a 0 3 J3J:
- .4 A . IL
oc N -C
00 0 z41 00C
z -0 a.0 0C
U.m z zw~z~I -nA12I II I
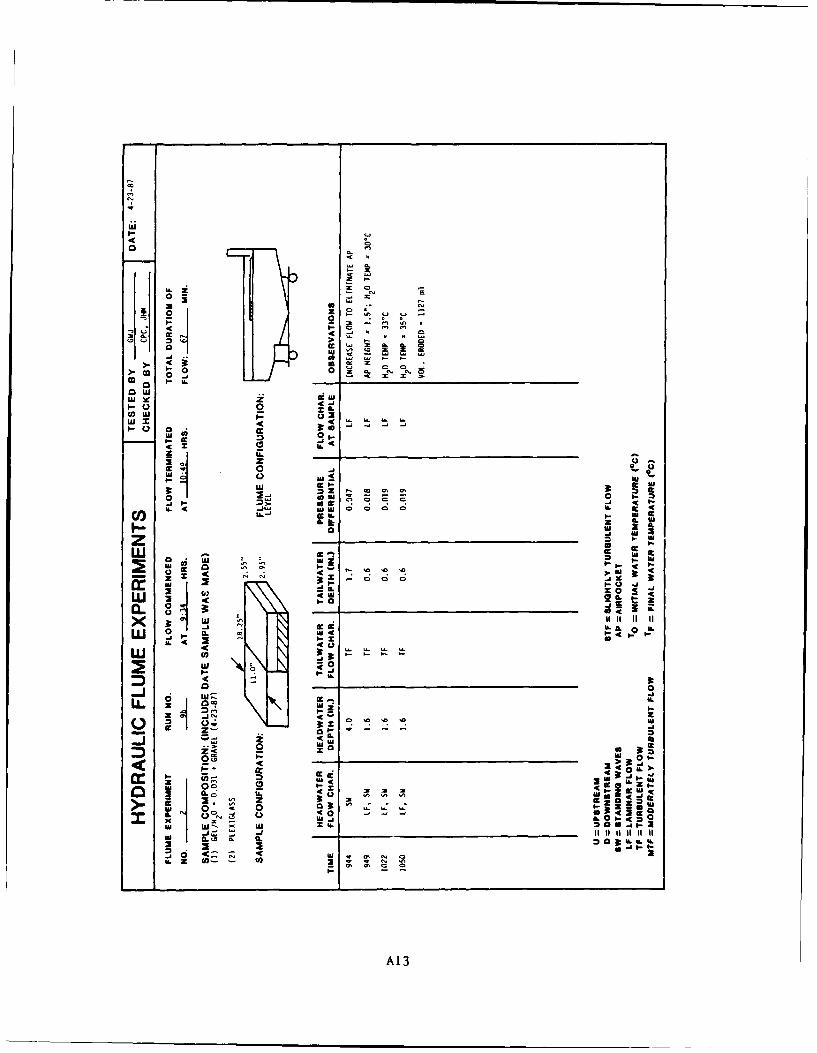
00
00
co0 .0
0 0 -
2~
z*
us i" -C~*d
-I c 't C
IL x~ 0L_ _ _ _ _ _ _ _ _ _ _
CLW o- 0
I-u 0 -1 -. -
I--
o W-a: IL-0 .j
(a- i 1
0 -jm~ U. ILZ - -
MA .. .. 042
LU LU
us W4 L LI
IAA13
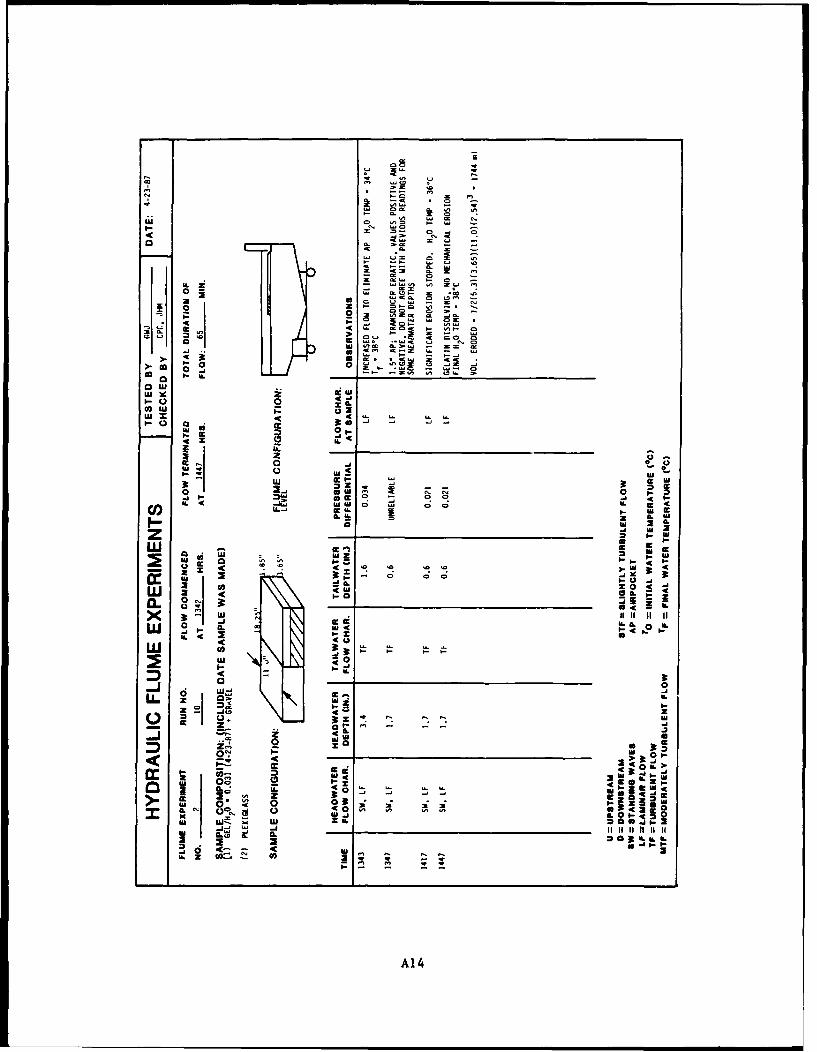
aa C2sUS 00 0 Sn n
0 L -
1. 0* X
-I .a -
0S 1.2 0
U. . .
-t 0 0
"S~~ SW- a 0 u
0U ?.j C j
4LW
1-0a a3 IL ' ~.j u
z1
I0 -J
W X 0 g
(L 0 Ia.- t
0 C IL L I
I- j -- l -
w0 4 0 so s :
0j 00
a. g0:3 IL
ro- -C
0 0 :
IL c 04 0- -4
Zu al- -
0 UE6 jI
2 0 a 36ILI- S
Vx-
o W A14
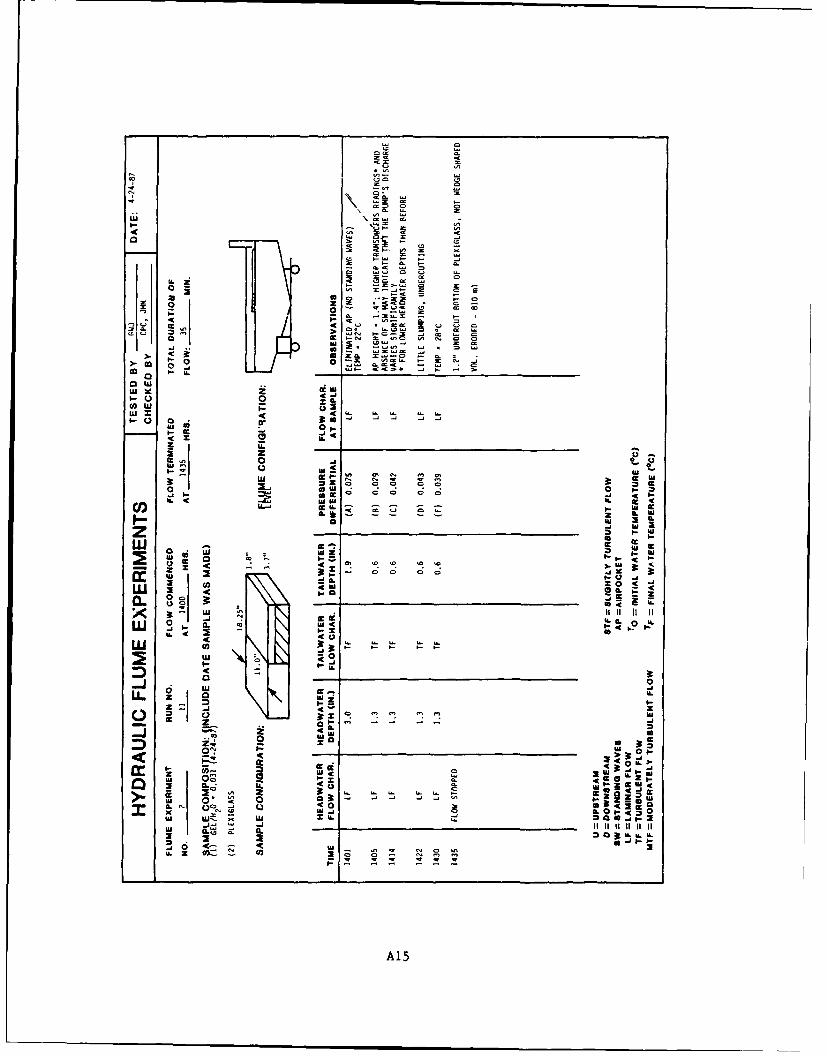
0 Z
'A Y. a! us
cow
. -
-9 0. ca
-6 11a I0J
aU 0 cc cc= -
0uu zl
u - CI
I- .x ~ 0 - K i~-
ow 0)
M" "a aa "aI
0x 0
0. P~ z' ( .ICL 0 00 00 4c
X0 t- t 20 -
o 2 -'W L4
us -i - i-J~J
U. 0
A1
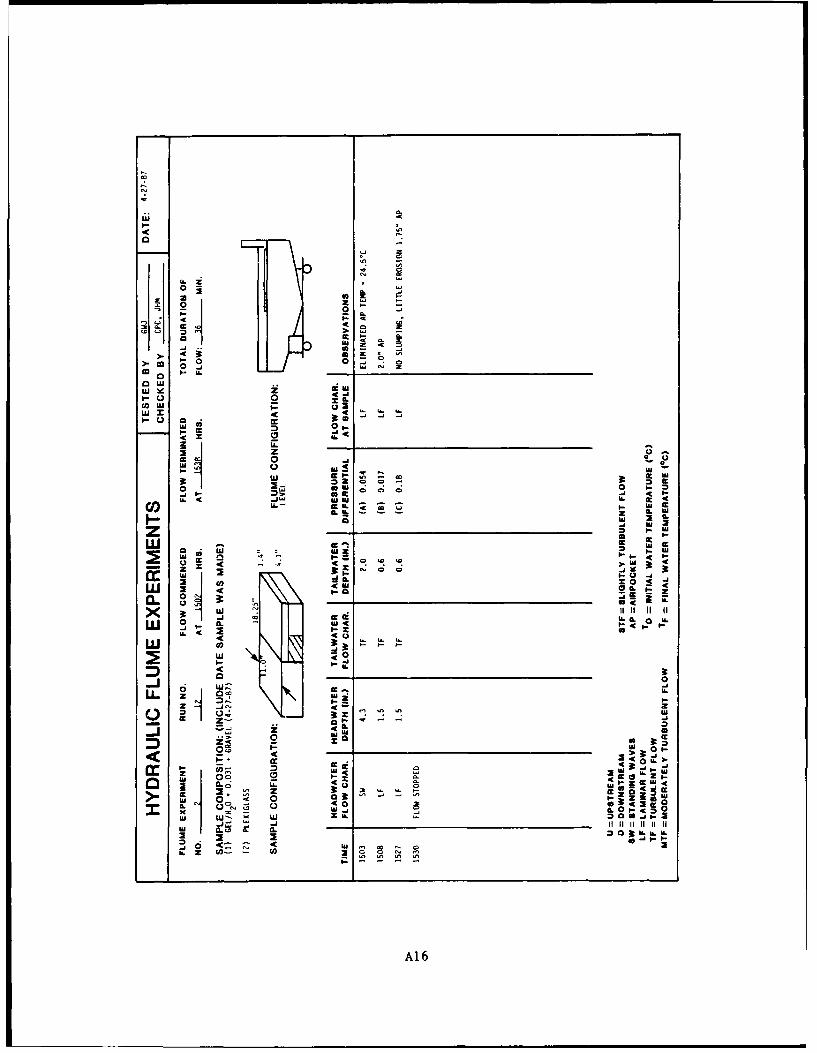
wz
> a
oo 0
U. 2C
01 0
co LU0-jj .. U -
I.- - 0
0c 0 ~*311 z uj
0-4 C; C; Ca
Ml IL
0.-
LI0 q
0 %00.)
-jU. z f~ . Kcic
UK S0
U) SC L. -
M 00 u*l.
.-. 00
W z U.zi*4 j w
o a : II I(W (L) - 0 a-
W j L ,-
.4o C_ _ _ _ _ _ _4L_ _
60
z4A16
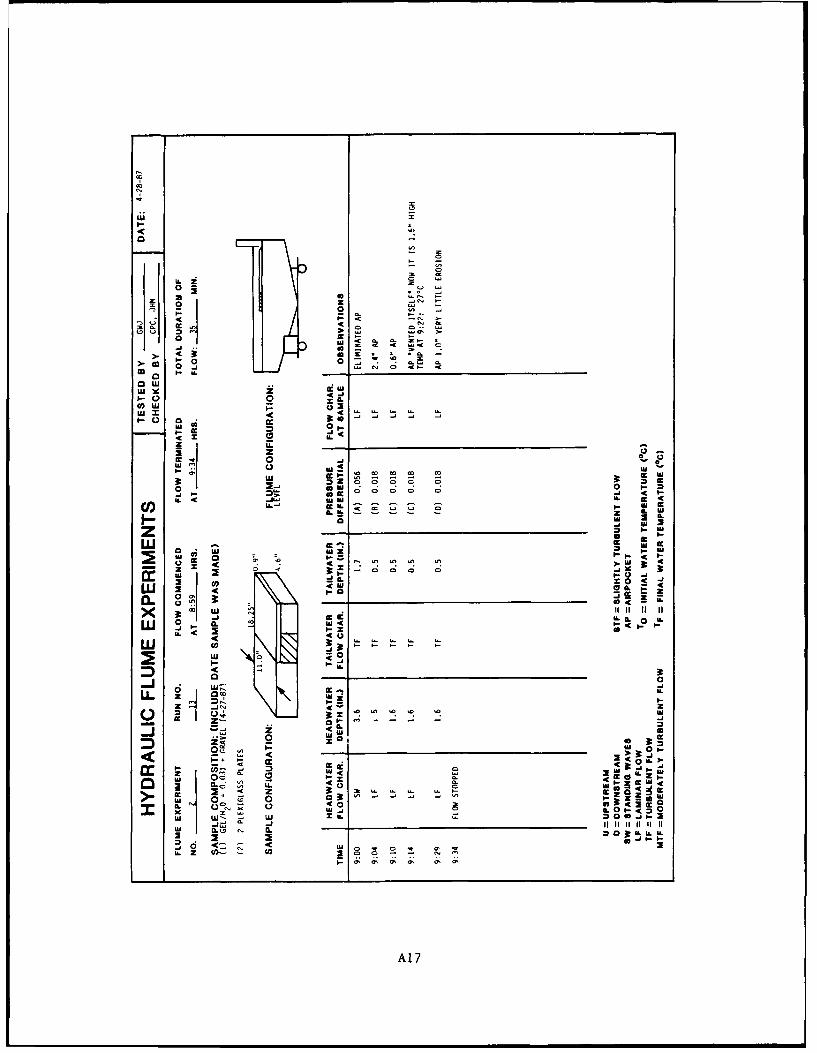
LL 2
0
00
0 0 .C
0 P- - C
U 0. x(A =j P 0 3
w m* -C -:C - -
I-. CO
TW z
j C--
U.0 a U, UW c -
U.. 4- C.2z I C
0 -J -
zC W.W dc W
OWL z 0 -
IL~~~L CdC 01 W
CL. 0 j
z . I- -
~d 0w I
C)-C 3-j
0 -
c cc
W 0Z
I-c - -CLI
IL I- &U. Z ZI g
642
0 22 . "~~. .~A17
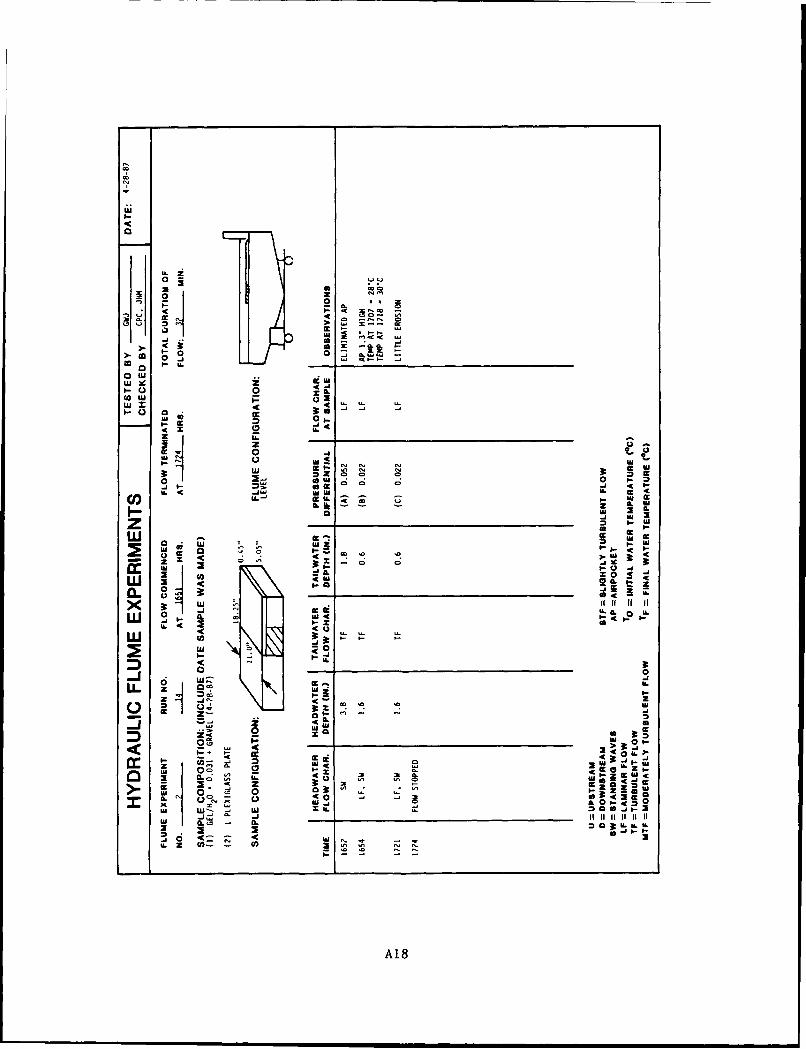
U. 2
P 2
o z
(3 4i
1. -9 I
zE -.. IIr 0:
u
coWI M W CCLow
uw ,- 0
I Z OC c0~ 0a
_ _ _ _ _ _ _ _ i iCi.-0L 0 U
IL l 4
w WI
4
-J3
:
. 4a
UIL
K -
0 a z
IL U 4 Zl I Z
CL - 0 3t (
Uj .4 . W j '
A18
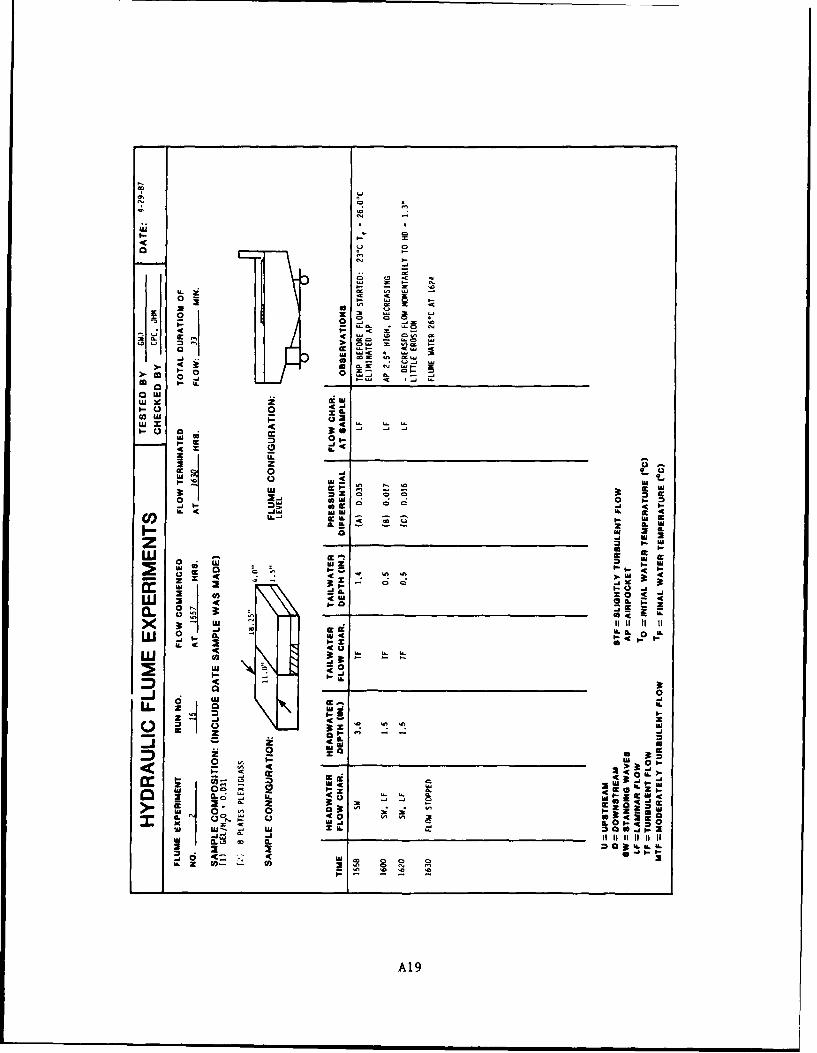
C *0
wI X
o 0 -
3: LU =2 ZLI md - C S
a. C -1 1--a
LL. WCO 'C U. z0 c L u
-j I.. la
U z C; lo:l-
UA 0 JIJ 0.
OW *a .0 % E
Wo 4L IL U. U
W ILI 0
U. I a ww
z S
2 wo
WI 2. -- lii0i
w w 3
0 'a o
L z L.- r41 f IfIL .o 3
3U IL~W
~ ~0La A19
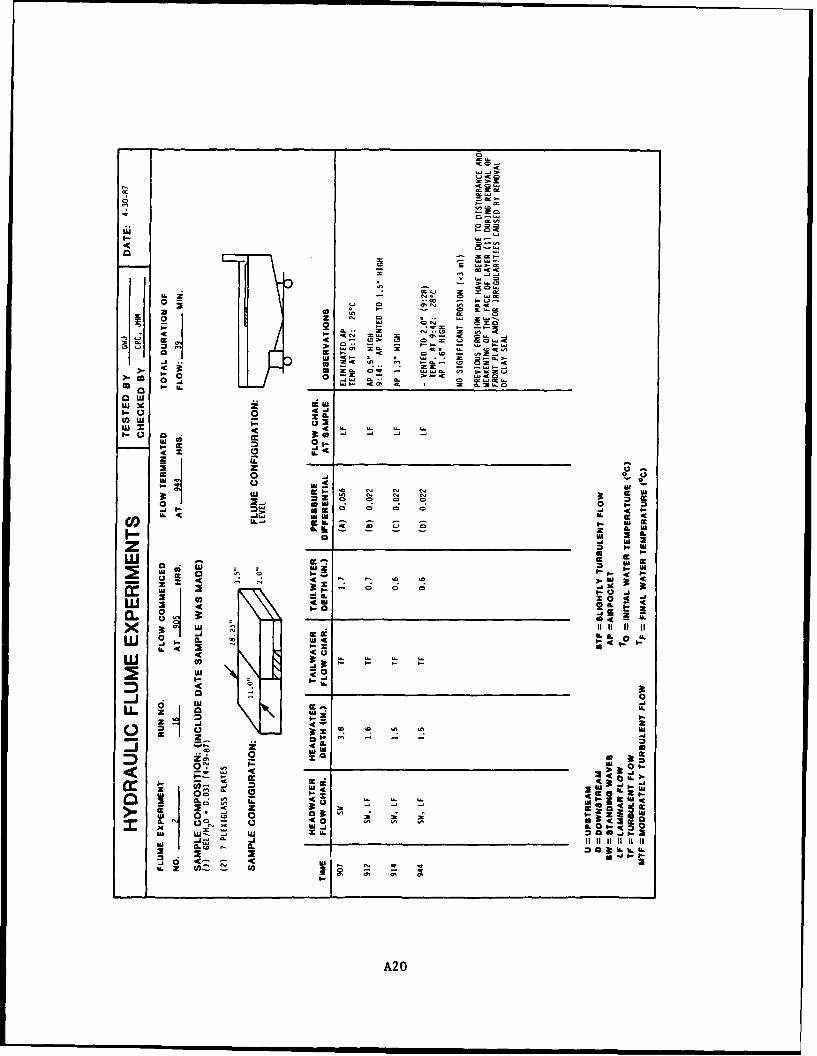
0a 0
Ot C - a.3t.
w~~ ad CE
wI-
ww z39 =2t 9 a. CC
0J 00.N C -a
a..z II Z C *
-U IL O
- - - -C Uu.C. C fl
19C.j- 1. 10
IL 0
0 z
a. N N NAL
w -j LIL Iw -i I- C- 'c
r. -C. C
w- 0L '
6 L II I II
0 w C"
o-a
Z;; -- 0 l %0..
I: Q '0 It I,, ii Ai - - 0IML
a.' IL ILa.
2'2
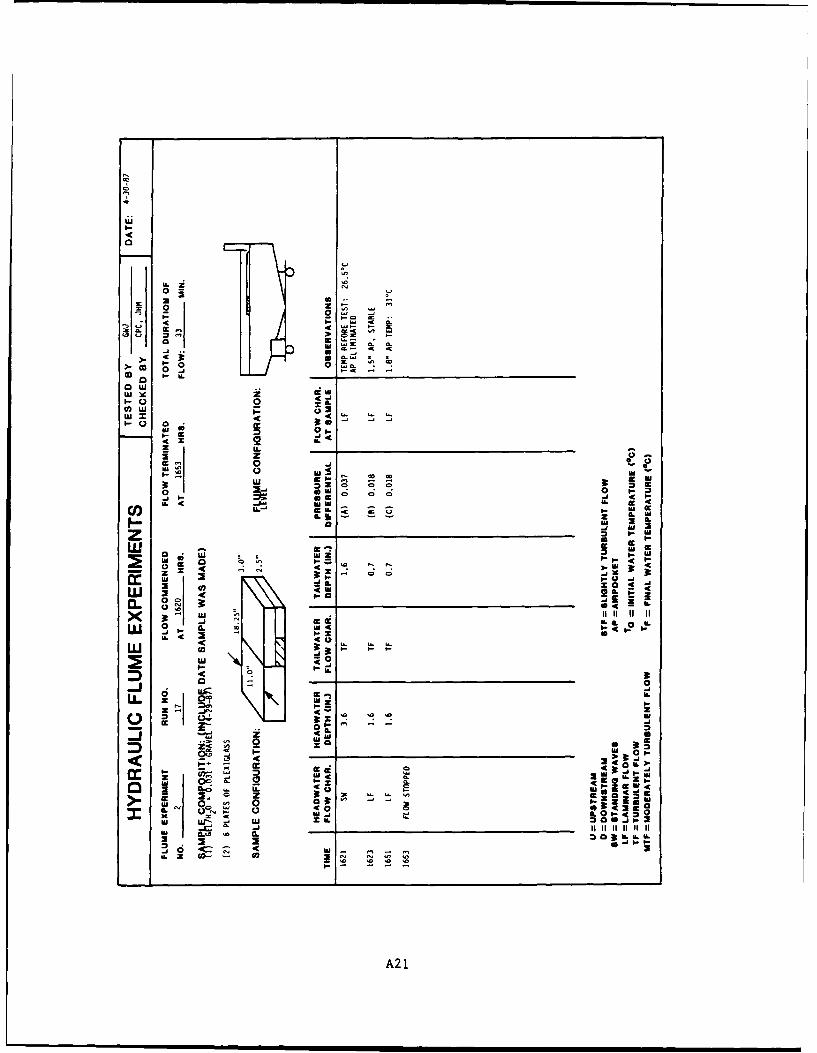
U. L0
0j
co 00 - 40
1.- 0.4 M I
-J .. M
IC0 0 0 a "
O..J~k S a -I- ~ ~ ~ I aL w_ _ _ _ _ __ _ _ _ _
z Ulw2
OWOWS
a.0 0 Z. IL -
W e 0 CLI.
I- E-
0 .. 0
j2 UZI. *g-I 4
Co IL4 .. ~ wW - -IL g
zw t
x U- K 00 -
-h
W %- 0 ~A21
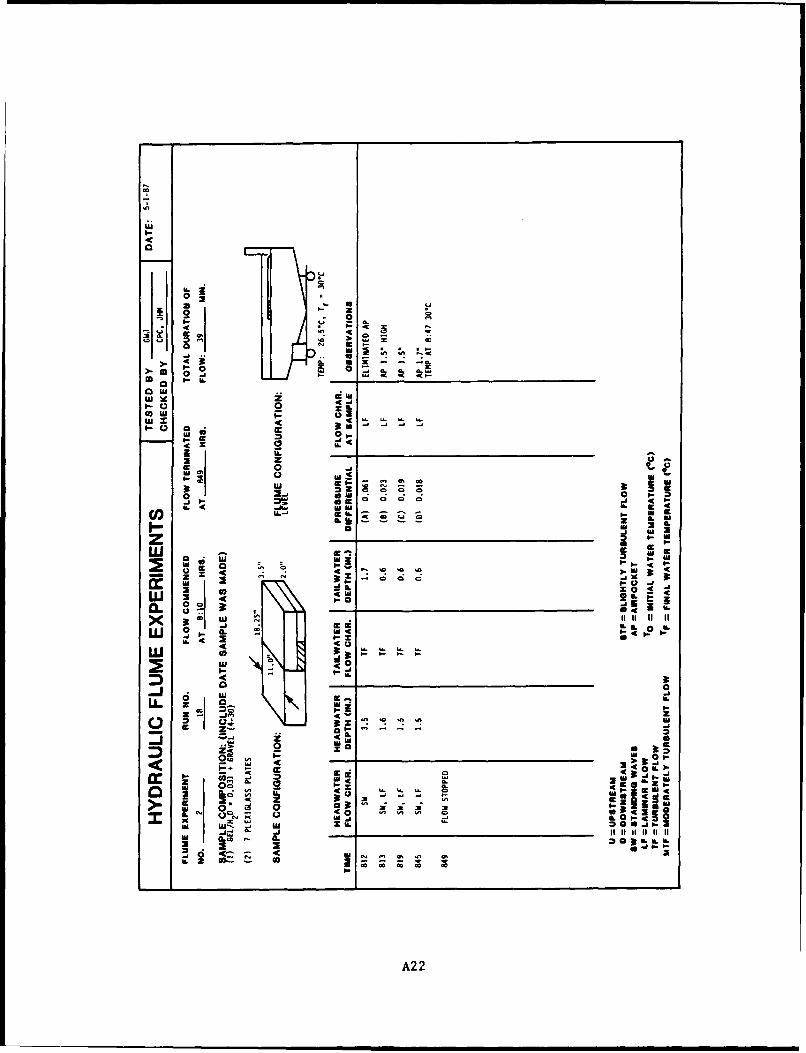
0
w
CO P
I -m 0
2Q IL
)0 Go
co IL I-. It WOW z U
z0
01
03 150 -'L
00
IL C u II. IL
z UziILI
W - 0
w W 0I..
a 0zo--
>( w IL JI I,.IW- 2. 11 11)
4L4
Y L I
Ww w
I-A22
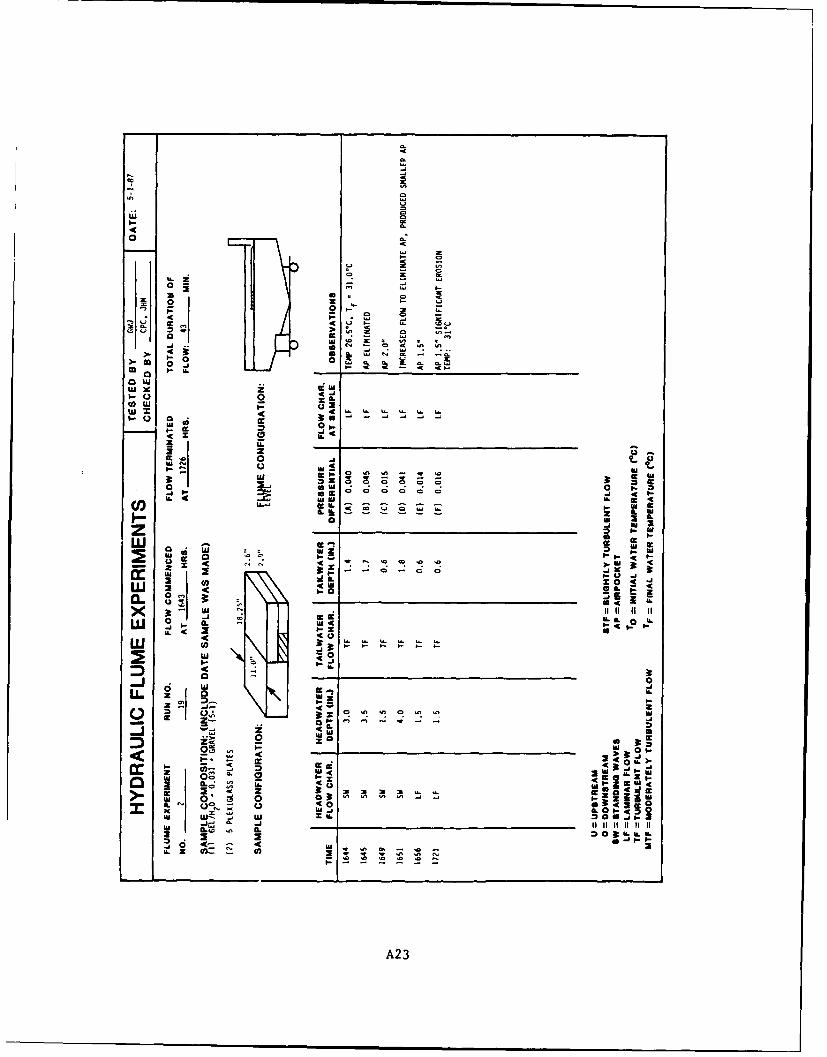
00
000
0 Wa-C -I-
a
S 0Z- t
- 0-
3t 4U ICU,
- tZ-o ; g -z I- VA~t
00~ ILIL-
z z
4c
0L P-0
3L 0 ALt -M
X .3t~
IL4w wI IL
zo; 2 i jzmw
04 0
CW 2L I-a IL
--1
IL' zca
A2
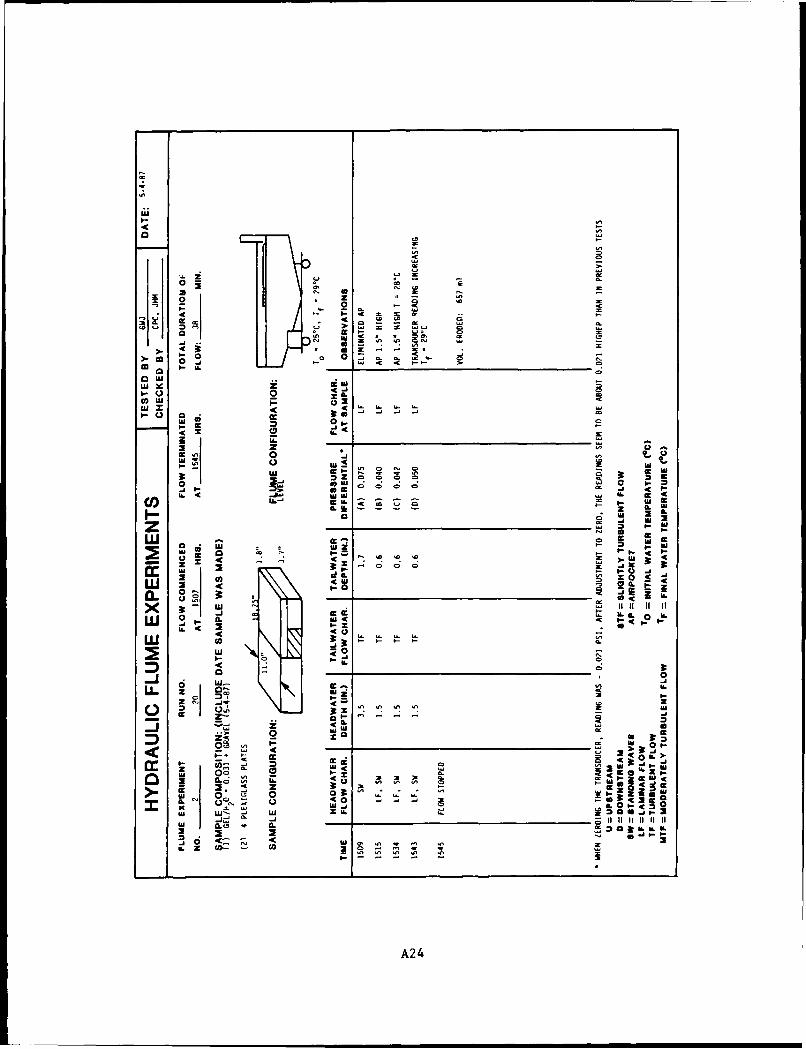
a L
U, c00
I. CCD m
-~ 0 -j- U - . U
0 0U 0D C
c - U
IL z I-
z- I-
CW W -I- U Im. - ~ -
IL I _ _ _ _ _ _ _ _ j1
00C
L
oo_ _ _ _ _ _ _ _ _ _ _ _ _ Im MA~
IL 0 a 1
0. g0 -,I a 0LU~~L ILIi m.20
IL tzCLU
w A24
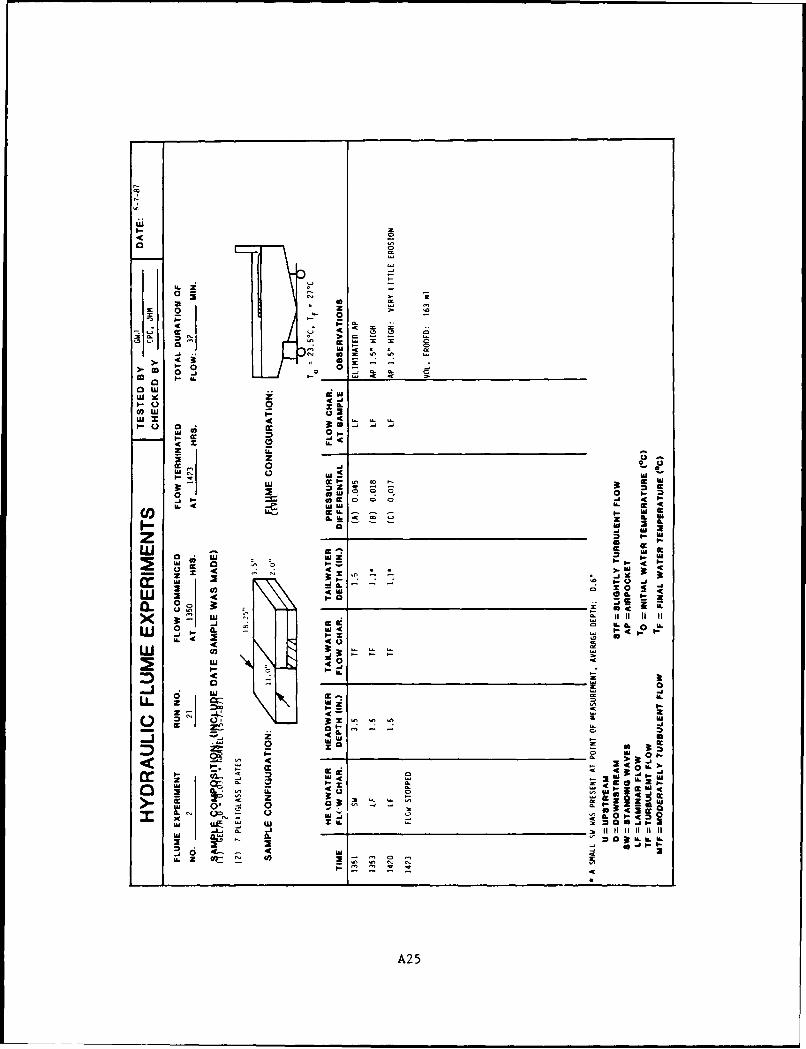
o00
UU x
0 X IL
W 4 N- 0 3 0 U
0c 0->0 0.D 0 . 0 0
ow z0.
0.
U Z0 at J
-j 1 4, CC 0E
zw~ cc
- L I t4 -z
0 3tIS -
w . ILu I.. I
x IL I. w 0 IL
W to
I
0~I 0 IL
L. z wz0' u
'4 0
zU Lug z
G~~e. 1-- 00
Z~ 2 0S -2 2
P RS
A25
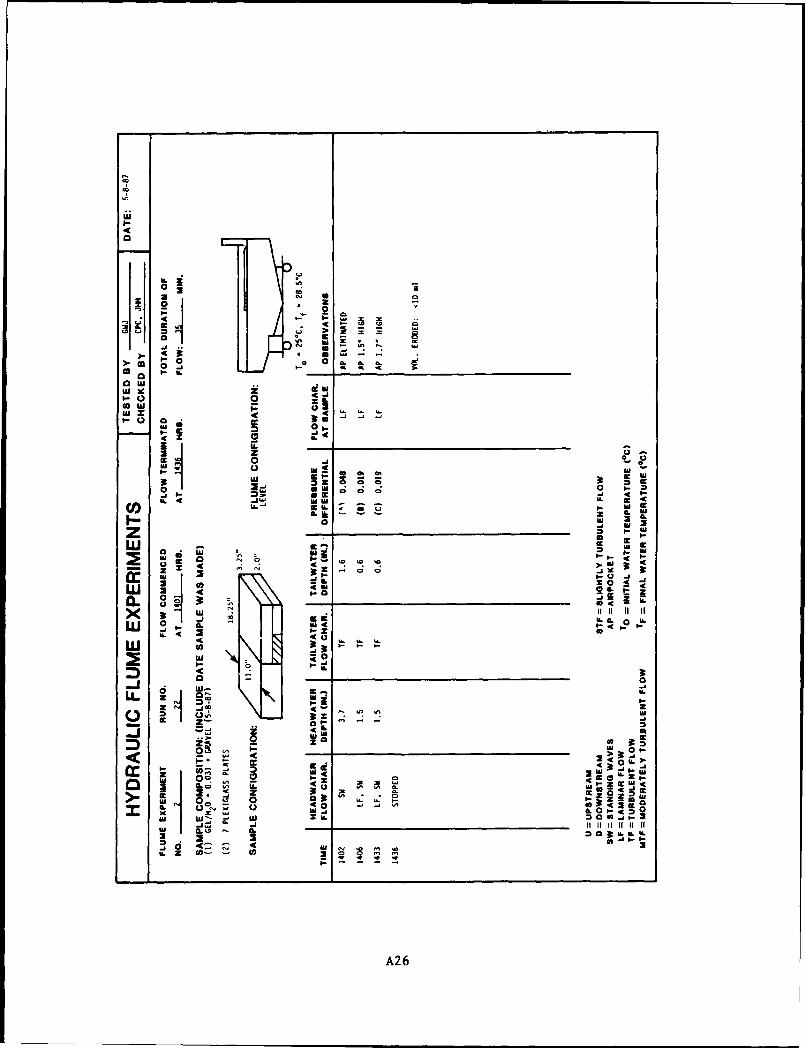
0
a LU
-, 00
l 0
I.N- ICJ
0 * j
0 d
0Z k .4- 0 .
t&L la a.i -
IL z I
* J II. -
W 3 tohit0 IL x
CL 'C G 3
x i -cIL KIL I L
zU .- <-
w3.00
~2~0
w a?2 U-
2- 3t
0. 1i- 0CCCa'A Zl
am 00 a..
4L) 4
IL on I o0 0
A26
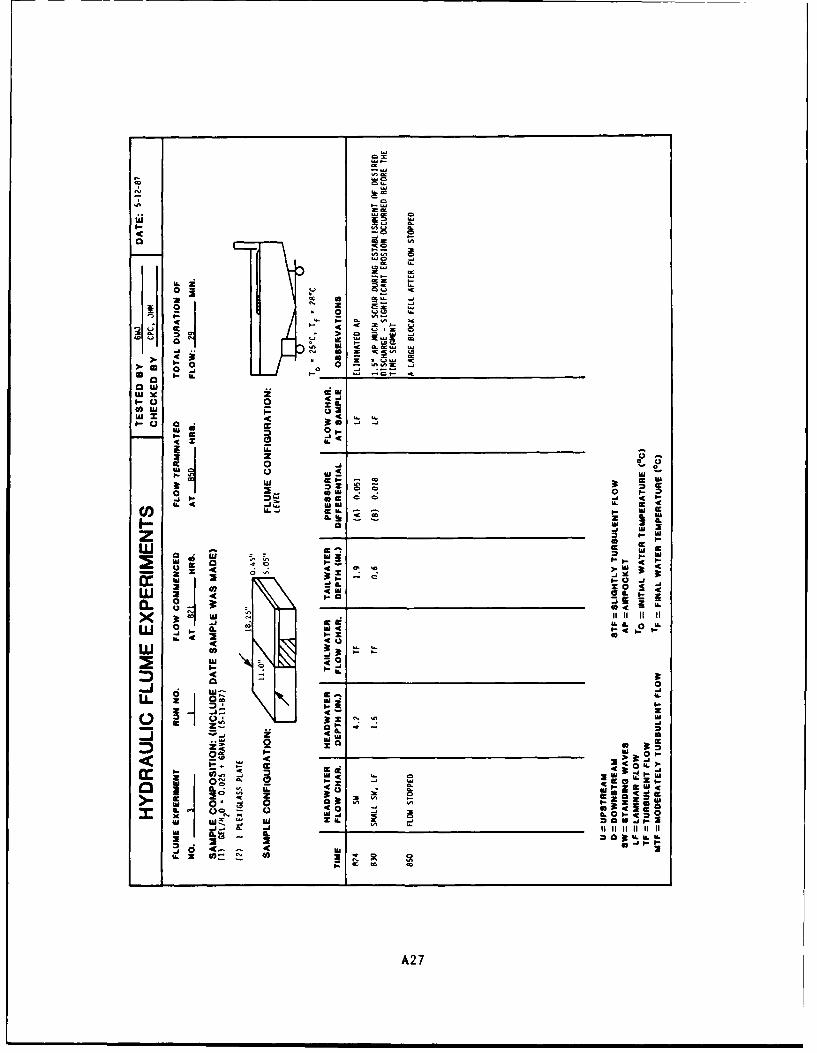
1h- 000 L
I-
00 La
CU x
-) I.. C L
0~ 0-Lj~
.- I- Z - La w C.
-CC. 2J is -
@w cc -
gI- P- >. ,
0 -:
j - 0
w -w Iuz
0. . I.eL 00
W~SL I- IL
Wo- - Lj
c 0. 20@2 20 sx
LLL
z w0- 0. A-WJ
0 1.-__ _ _ _ _ _
3C 0.
IL I-z I- 3t ILm-
dw
3A2
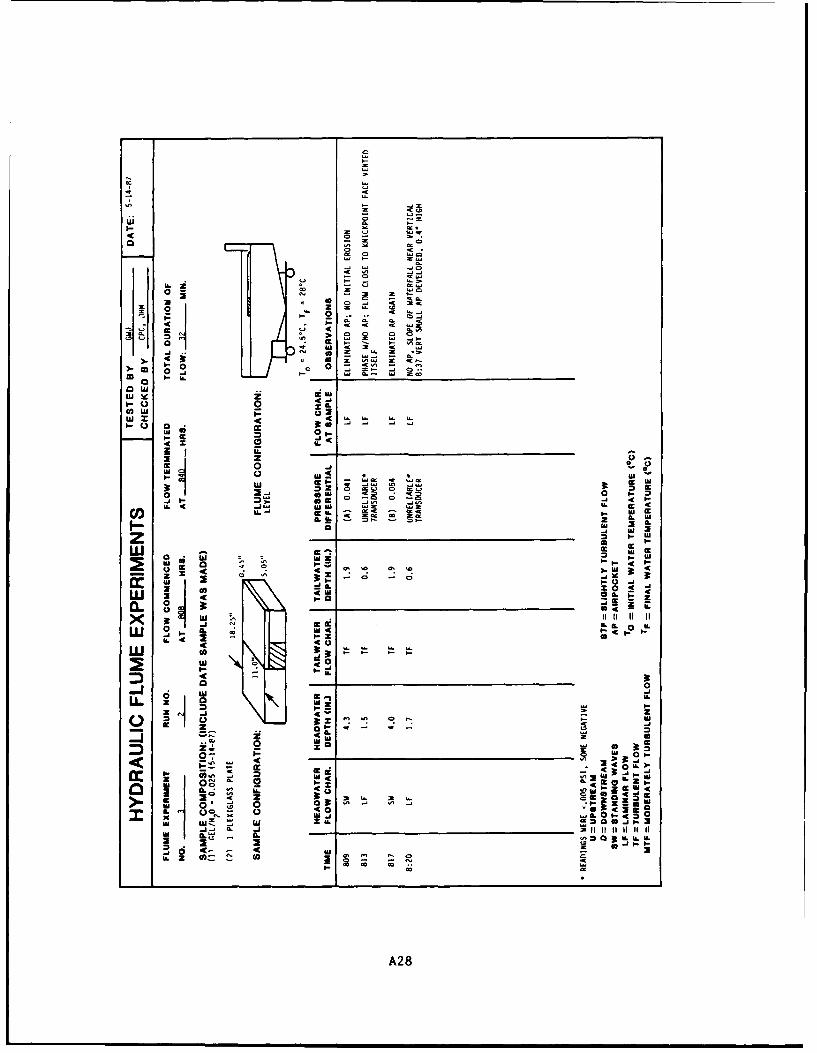
co X -
ui= c
0 t
00
ICSi
zz~ ~ 0 1
3nt 0 CC . C
L2.
w- C
a
IL W 0 4
I I.-
oo-j~ O(JL-
z* Z
2 ~ ~ 0 g 0
fu 0. w
0.I 0 9 - ~- aa;
IJJ IL- 3ul .1 0-J (I
._ _ __ _ __ _ __ _ _ j
-
w L-N l lii 11
tuS- -JU IGo-m
A28
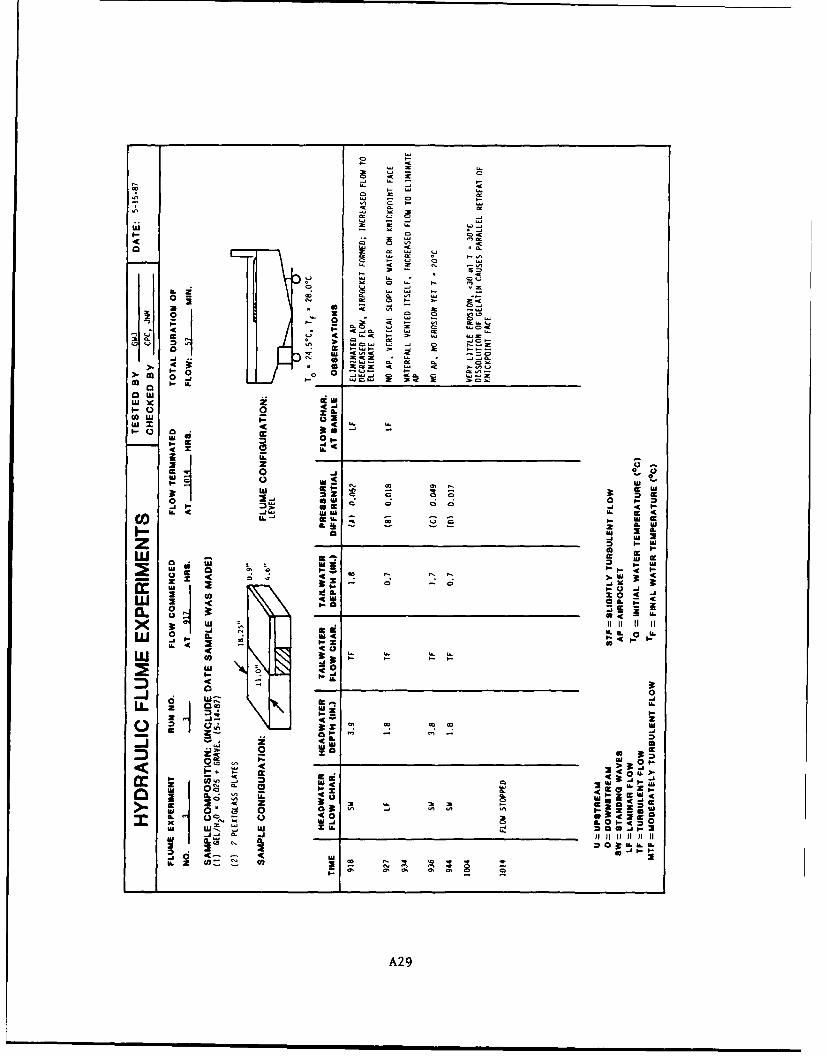
04 w
a X-I
ul 00a,
0 -1U, - J
I 'I P
I l-o~~ OL a
us a,z~~ m P-M
-~~~~. -41 t(.(*x c aa "a = (
a. 40 740
0 cc
I- z
0W0
~~ca IC - ~ -
LL I.U.z I-
Z Z0
Cw IL
M w l"
04
-Z
IL -
0" .. : 1.ac S0 a a2 Go-I
tu L.
I~~~A &L 3 ~ ', a
A29
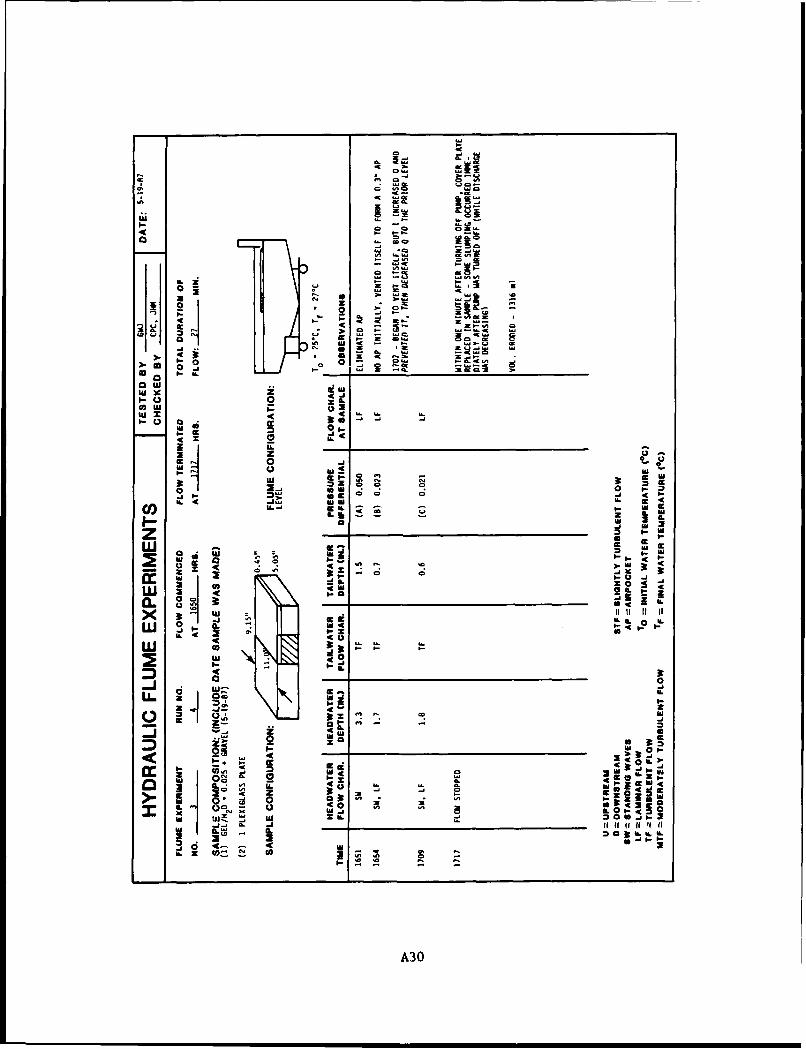
Go w
IL~ a U
4L C, U.,S.
au0 a
a cc
w d2CL , - IL
'C - a IL L--U
0. 5.
w - ( I- 0 oS -. S
-C I-ua
OW z
2 Az zWZ~41 'C S. .. -
X 0~
em] b - it if it it 1 11_ _
2 0 IL I
IL ~ zi L £
CI) f.-~ £. 5.5*A30
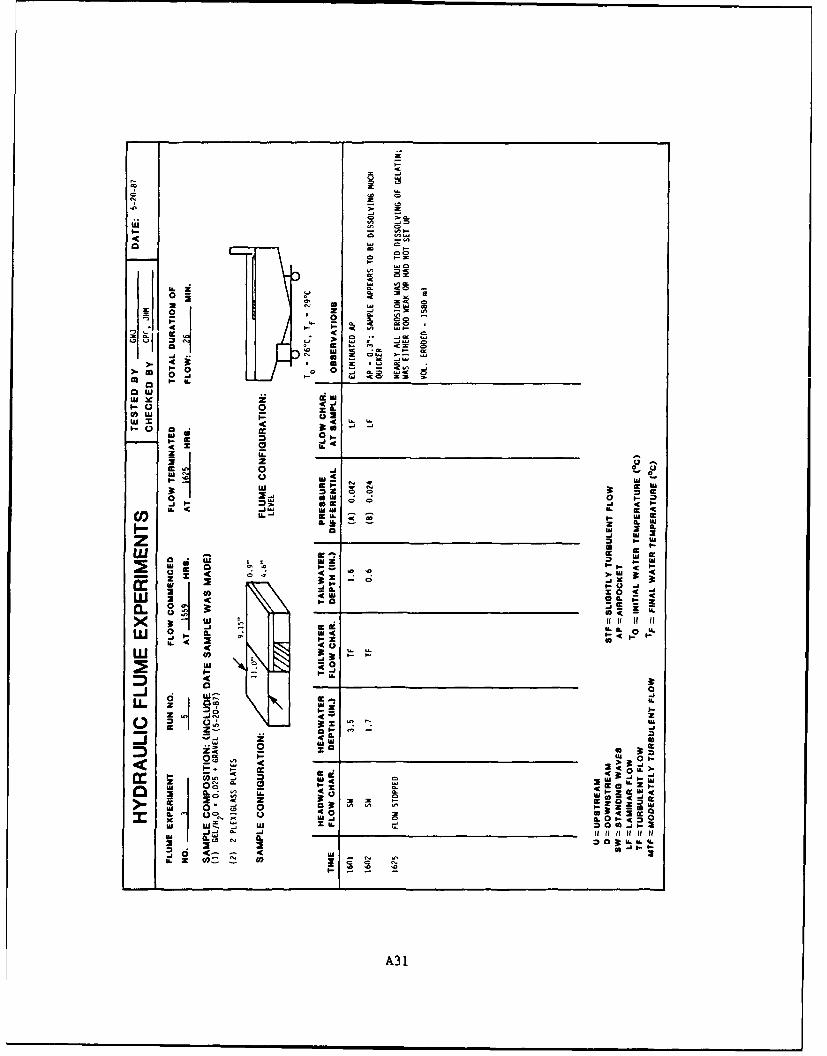
04 -
o i-
l'- 0. aC
w Xs. 0
a 0 0
WIc I L-
0 I0
0 u 0 2hAa
U. P4 Ul
w o- I
w ILCL0 0 4 OO
- 0-; -1( -J O
4W om.
EI4~~. 04-x
0
r 0 U.-
I--
a - C. W 4
a
wo 2U 2 o :
20 &L ~uU. Iji I- I
A3 1
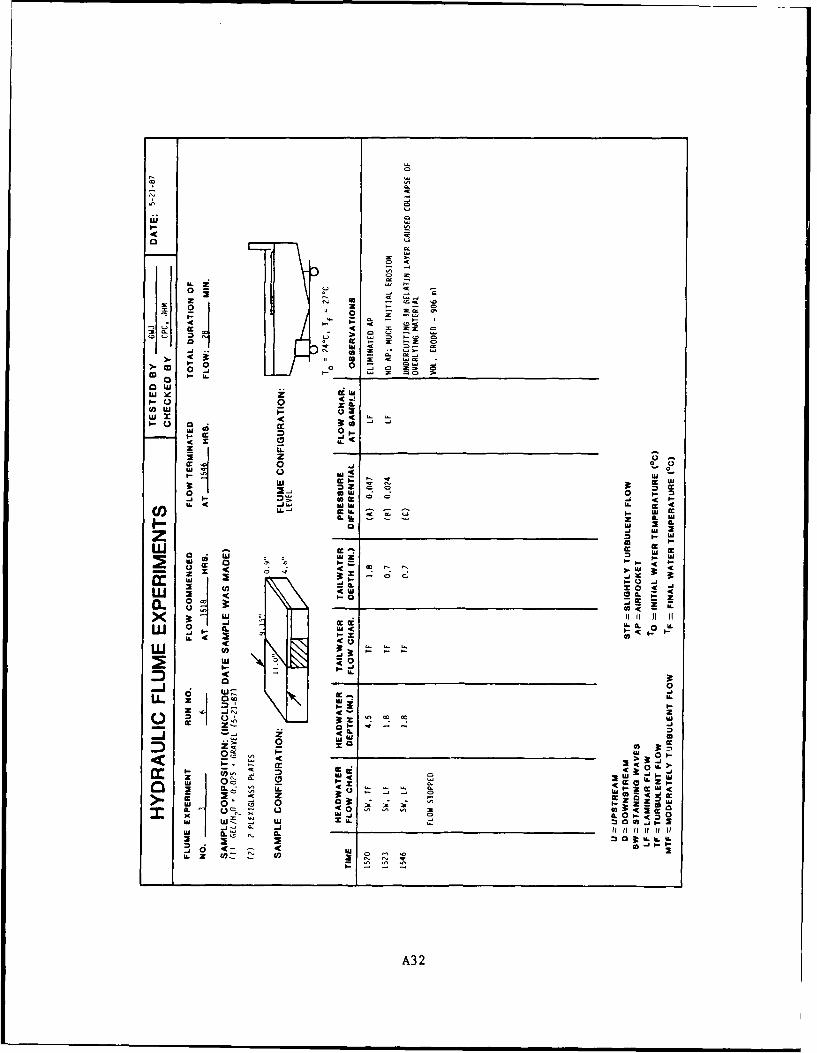
CK
>o 0
0 -4 4
Z -. u0 l4
1. 0 -
x 00
4Z 0LA. -jL . c
. I- LU w
us 0 0'IA0
a, jILU x 0 I
I- 0 16CLUI I L
w_u 0 .
0 z0.
z0 z
U.4
0w -.
4c 0.Cc. ci U.
cc -Z a -,& Z-
0 zo 'I01 -
x ol 0
A 3
LU IU
U.Z 0Z W W0444
A3 2
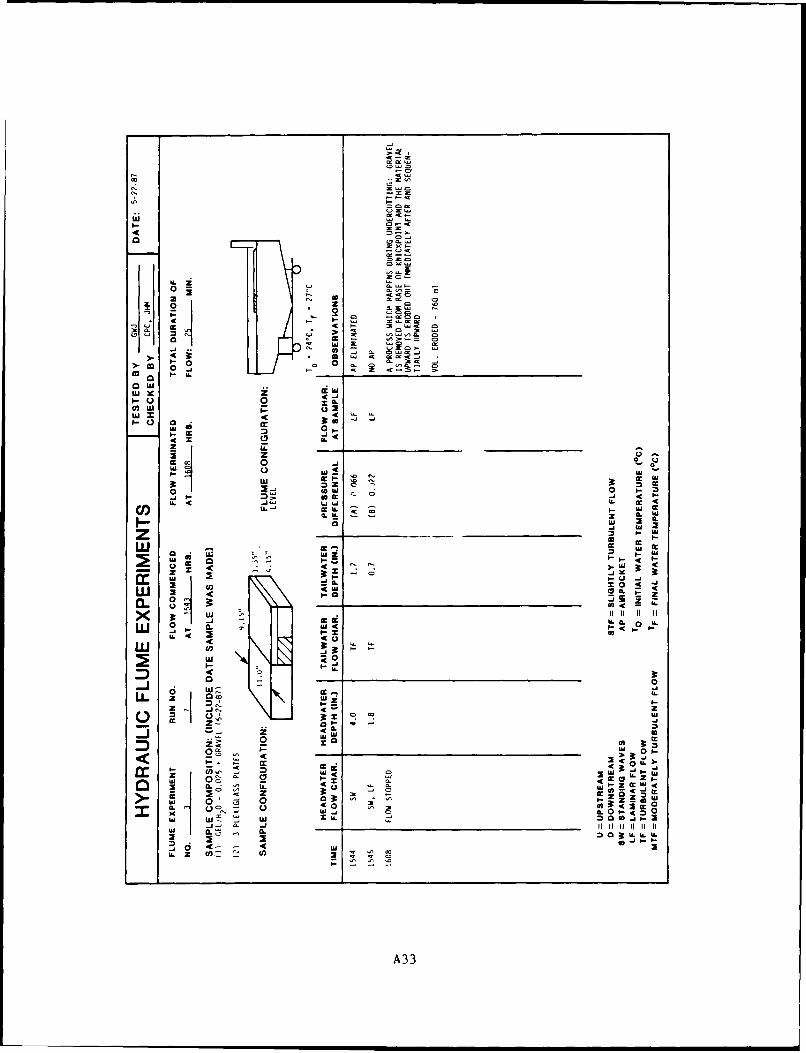
WI c
> c0 0
a CU C
lo 0 1.. ~ ...
I- -AC a,
OW z
i-co or~
a~z C,
z ZU
a u -'u
0 AC x X
3 1hz ILj X 0
i-.ui 39
WZ
L12 0= 3C L
C 0
C~C U.
0O 0 a
2- - -
A33
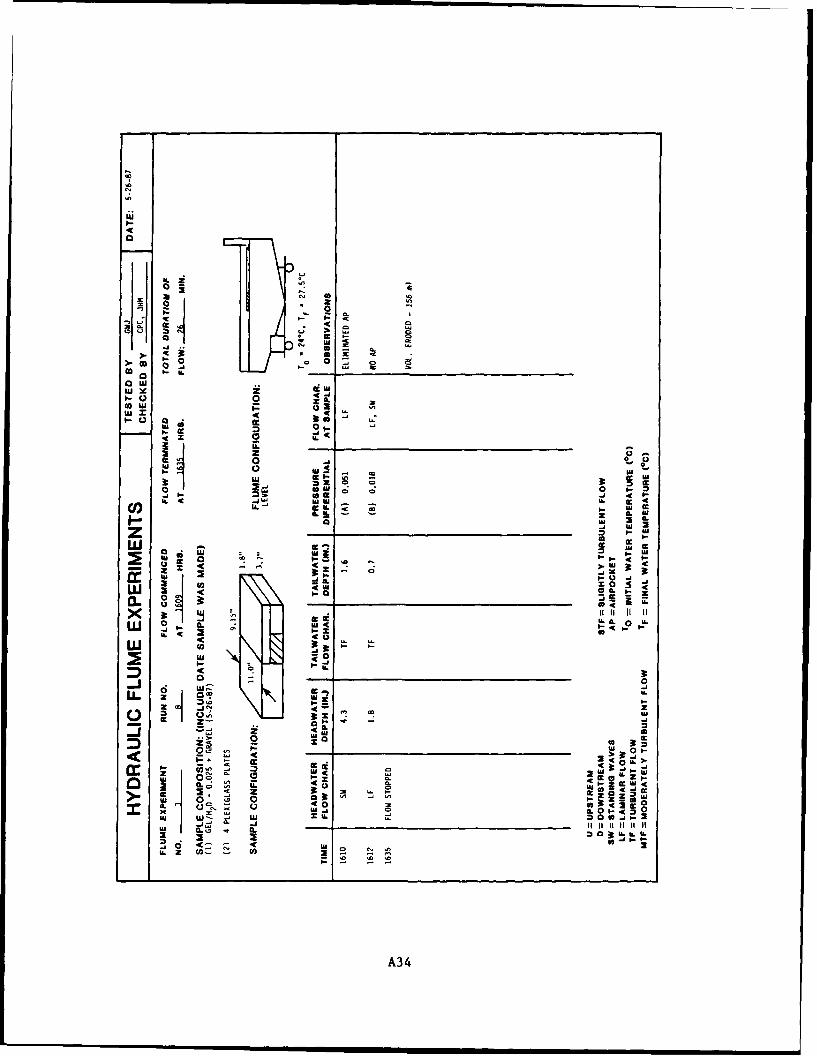
I-L
aL3L
~ a '0
-, Z Z
3l
0U c
, ax 0
OW I- -
42 0
o 0 Uo c4 r
0. 0i.~p
3 2~ 0. &
< -l
W.0 (-
A34
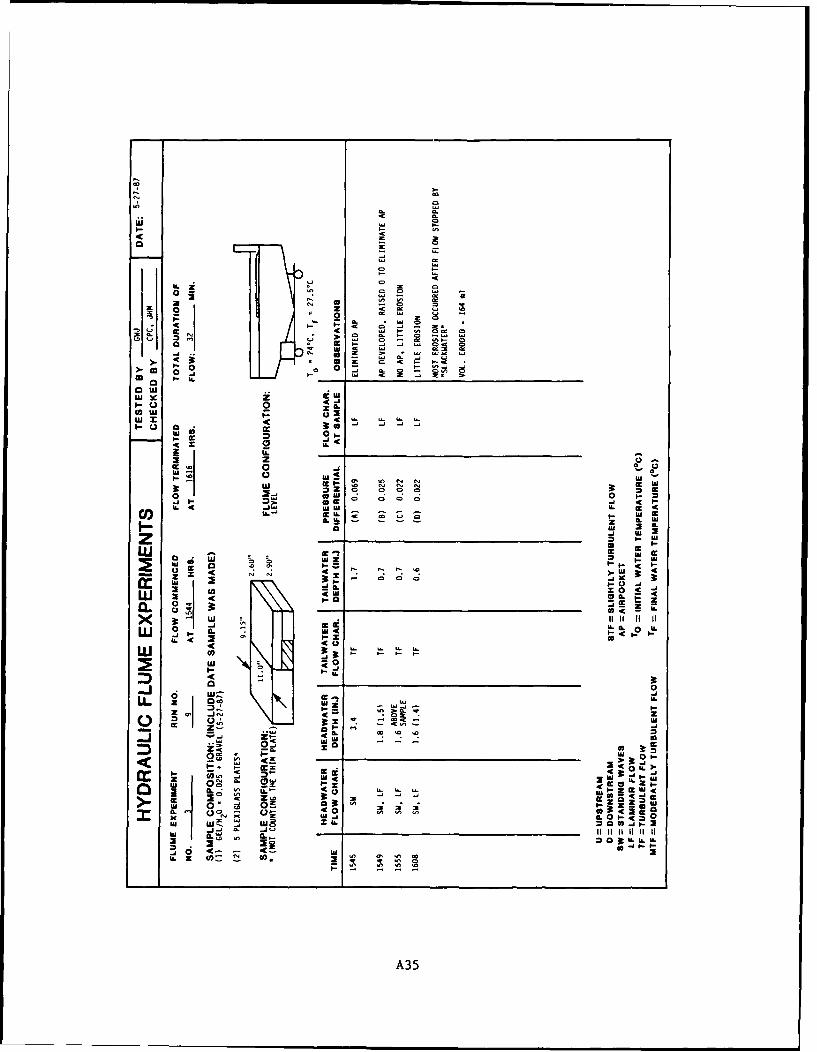
0
00
0 -C
0 kM
0 X-ICA .. P. 02
IC Ma 4 c k
00
0WS
4Z 02 Ixc
0 C)U- W
I- D- N M
w c cc U M
2 , . 4 1-0- Z~ IC- I.-<C 39 4
ir MA 2 - Maz ca II.M0-w IL -
0 Me 0a. a. Z
0 0. -U, U. IL
-C-
L-IILL C =wc- .
C. :) -1j 1-3 M-J-- ,-
ZC 0. 6
I- - z
Ma.. L0I x~
A35
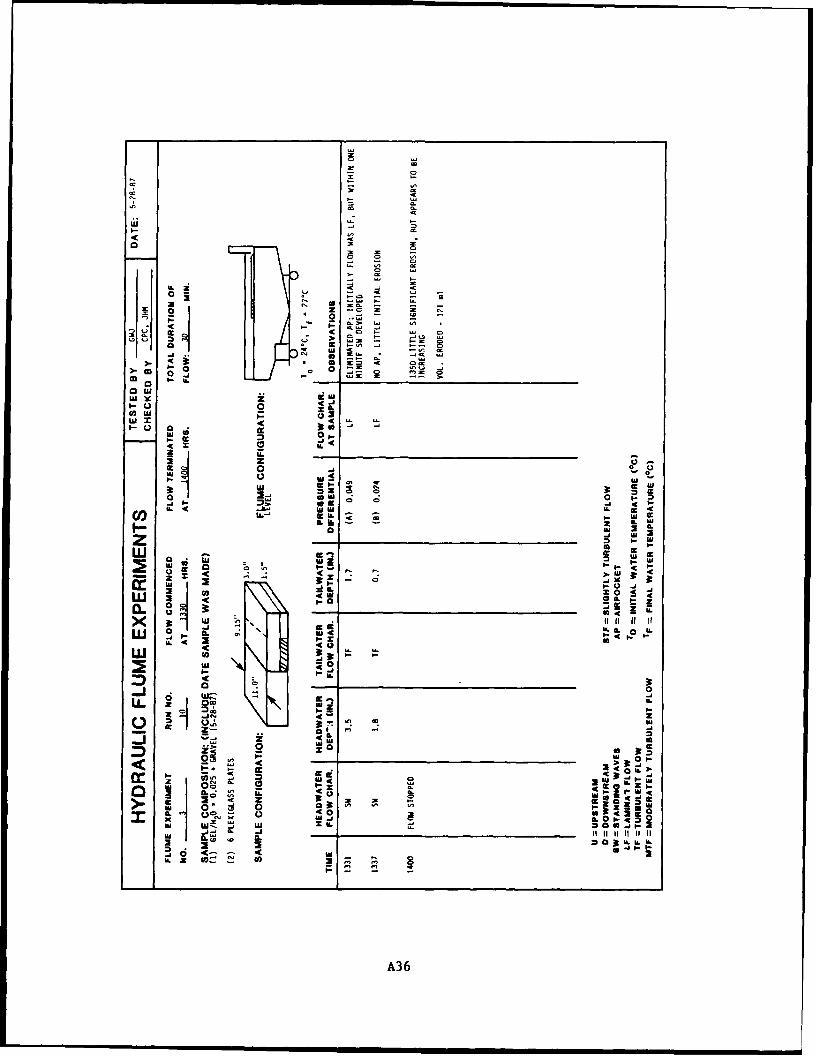
4c aI- !E
0 0
04 x 0.
aa
Cra
0 1
IL -
* 4 -
>0 Le
i-u -0 J LI
LL..
2
0 z - 0'
0 1-
it w
0 3 0
guIt- 11. 11It 1
8.4 -A36
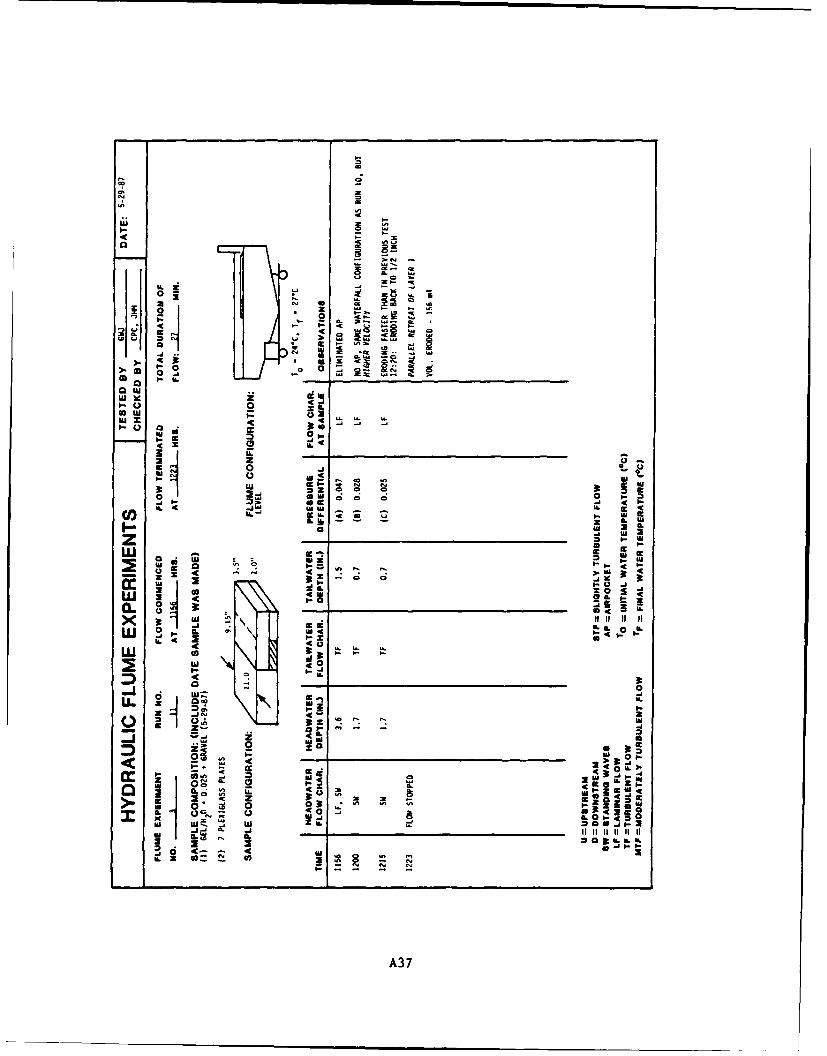
'a
cc
a w.
39 (a
0 -j
ow z
39 2
U. - 5
I I..
C, W w I- U.
w 4cz ICw ~ WE20Wa
C0 0 3a
4W00
w i. 1114
1- 1-
-0
2- I-Z
4- z
-x 0 4
0. _.4
34LI 0 It3
0 0 0 3 a l awa
'a 210I. I
20. -Z 0aA.0t
A3 7
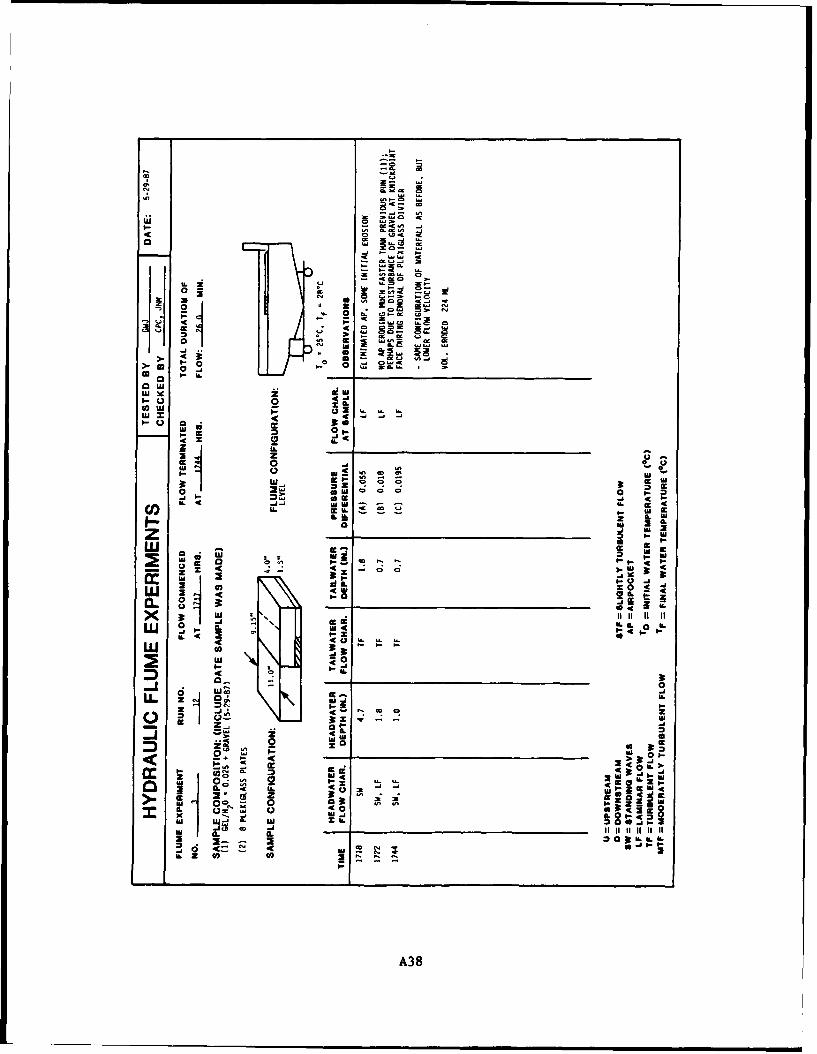
0'2
1-.0 00. 0 &n -
C~ 0 j
1.-0 0 W:!
-iI z - -ZU.-I,
Ilk z 4LII- -J us
I-~ Iu
0 ~~ w 1 I
C- - C I-
-C-
4 I
00 3
221
09I *II0
I-. a.~a.
z 3: 3.W £0
x~ x j SW 0
Iw CLw 01 1-
IL ZI
A38
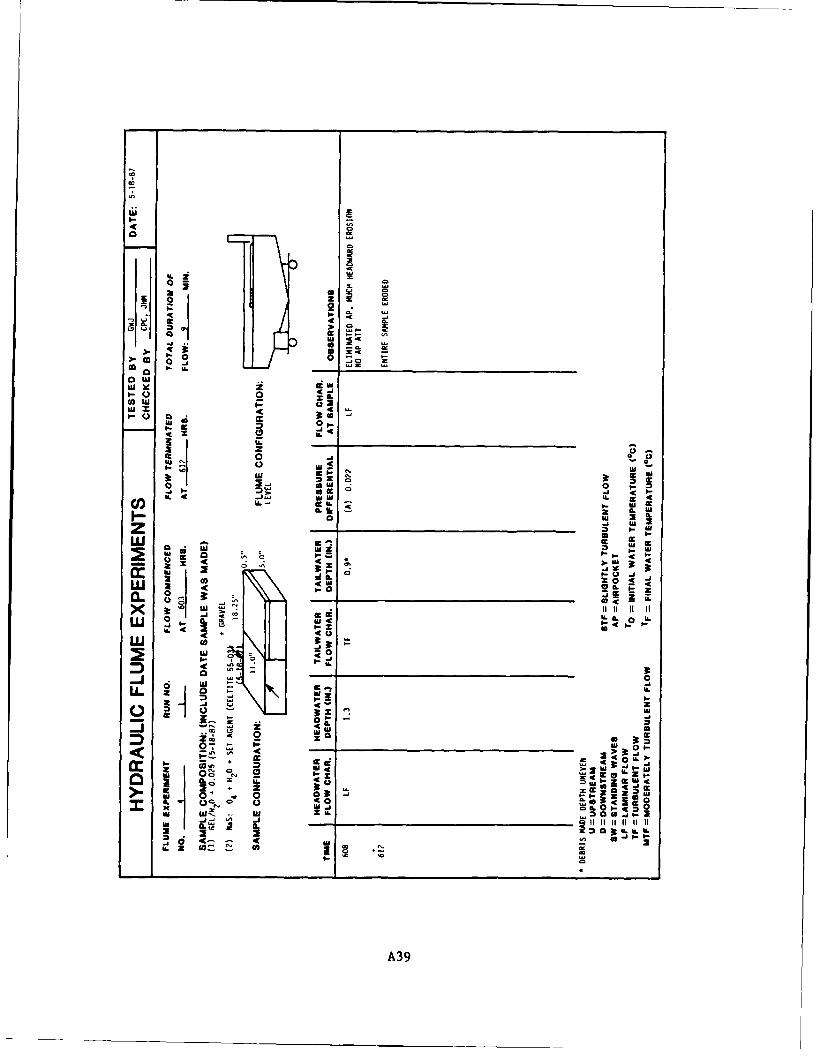
aWL
ILZ L
00j
2- C
ca x- 00
0- '-L-U o0 I.0 U.IZ
I-. 9 a 4
3t m- -_ __1.-_ _ _ _
I- - 0z w
0 3t0-0
w
0- I. -
0 ul a ~
0- 340
II.
ZC 2
2A39
APPENDIX B
METHOD OF ESTIMATING PARTICLE VELOCITY IN TURBULENT FLOW
1. In order to estimate the velocity of flow in the turbulent reverse
roller, a 1-in. grid was placed on the side of the flume in front of the video
camera. A stop watch capable of measuring to hundredths of a second was posi-
tioned in line with the reverse roller. Using stop action, particles were
tracked across the grid and the time recorded. The particles tended to stay
in the same plane of rotation once the reverse roller was set in motion. The
following table presents the particle velocity data.
B2
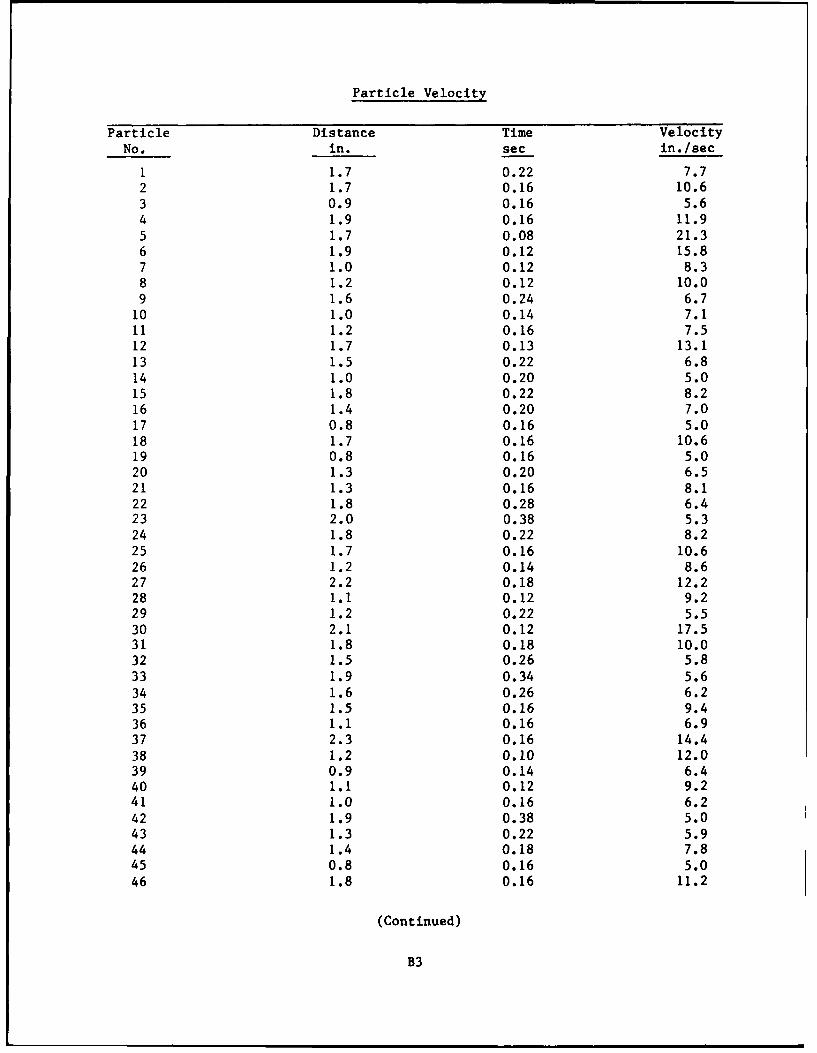
Particle Velocity
Particle Distance Time VelocityNo. in. sec in./sec
1 1.7 0.22 7.72 1.7 0.16 10.63 0.9 0.16 5.64 1.9 0.16 11.95 1.7 0.08 21.36 1.9 0.12 15.87 1.0 0.12 8.38 1.2 0.12 10.09 1.6 0.24 6.7
10 1.0 0.14 7.111 1.2 0.16 7.512 1.7 0.13 13.113 1.5 0.22 6.814 1.0 0.20 5.015 1.8 0.22 8.216 1.4 0.20 7.017 0.8 0.16 5.018 1.7 0.16 10.619 0.8 0.16 5.020 1.3 0.20 6.521 1.3 0.16 8.122 1.8 0.28 6.423 2.0 0.38 5.324 1.8 0.22 8.225 1.7 0.16 10.626 1.2 0.14 8.627 2.2 0.18 12.228 1.1 0.12 9.229 1.2 0.22 5.530 2.1 0.12 17.531 1.8 0.18 10.032 1.5 0.26 5.833 1.9 0.34 5.6
34 1.6 0.26 6.235 1.5 0.16 9.436 1.1 0.16 6.937 2.3 0.16 14.438 1.2 0.10 12.039 0.9 0.14 6.440 1.1 0.12 9.241 1.0 0.16 6.242 1.9 0.38 5.043 1.3 0.22 5.944 1.4 0.18 7.845 0.8 0.16 5.046 1.8 0.16 11.2
(Continued)
B3
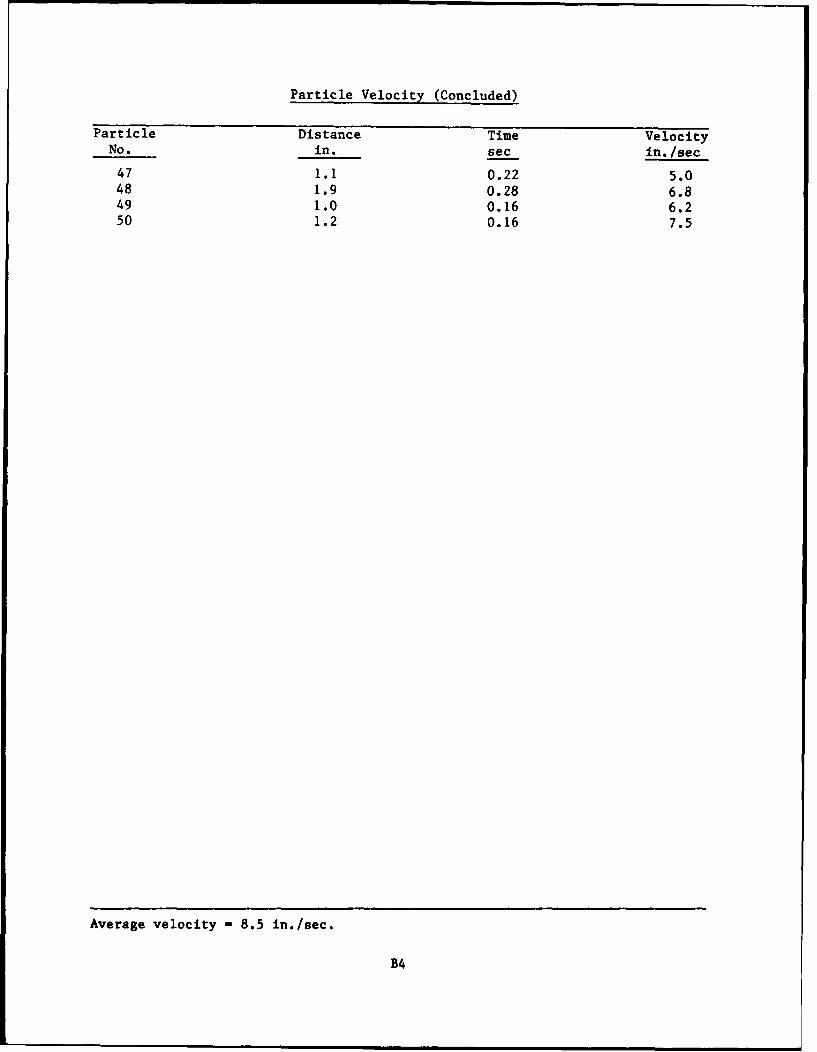
Particle Velocity (Concluded)
Particle Distance Time VelocityNo. in. sec in./sec
47 1.1 0.22 5.048 1.9 0.28 6.849 1.0 0.16 6.250 1.2 0.16 7.5
Average velocity - 8.5 in./sec.
B4

APPENDIX C
MIX DESIGNS AND PROCEDURES
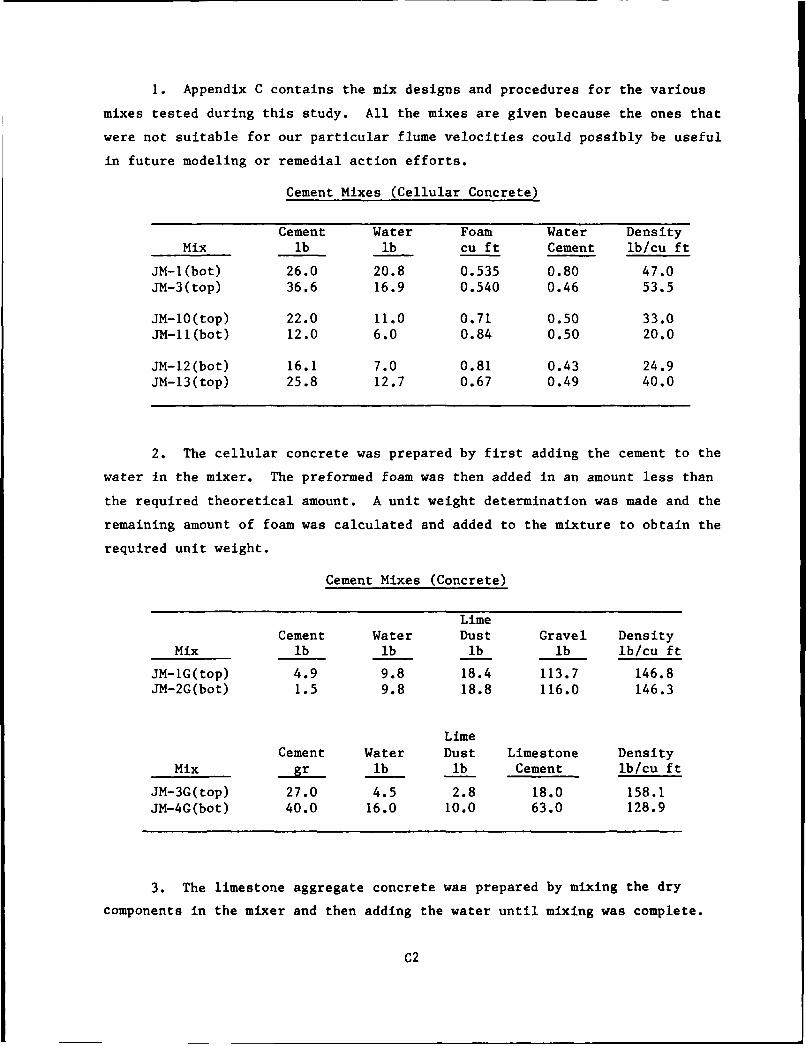
1. Appendix C contains the mix designs and procedures for the various
mixes tested during this study. All the mixes are given because the ones that
were not suitable for our particular flume velocities could possibly be useful
in future modeling or remedial action efforts.
Cement Mixes (Cellular Concrete)
Cement Water Foam Water DensityMix lb lb cu ft Cement lb/cu ft
JM-l(bot) 26.0 20.8 0.535 0.80 47.0JM-3(top) 36.6 16.9 0.540 0.46 53.5
JM-10(top) 22.0 11.0 0.71 0.50 33.0JM-11(bot) 12.0 6.0 0.84 0.50 20.0
JM-12(bot) 16.1 7.0 0.81 0.43 24.9JM-13(top) 25.8 12.7 0.67 0.49 40.0
2. The cellular concrete was prepared by first adding the cement to the
water in the mixer. The preformed foam was then added in an amount less than
the required theoretical amount. A unit weight determination was made and the
remaining amount of foam was calculated and added to the mixture to obtain the
required unit weight.
Cement Mixes (Concrete)
LimeCement Water Dust Gravel Density
Mix lb lb lb lb lb/cu ft
JM-iG(top) 4.9 9.8 18.4 113.7 146.8JM-2G(bot) 1.5 9.8 18.8 116.0 146.3
LimeCement Water Dust Limestone Density
Mix gr lb lb Cement lb/cu ft
JM-3G(top) 27.0 4.5 2.8 18.0 158.1
JM-4G(bot) 40.0 16.0 10.0 63.0 128.9
3. The limestone aggregate concrete was prepared by mixing the dry
components in the mixer and then adding the water until mixing was complete.
C2
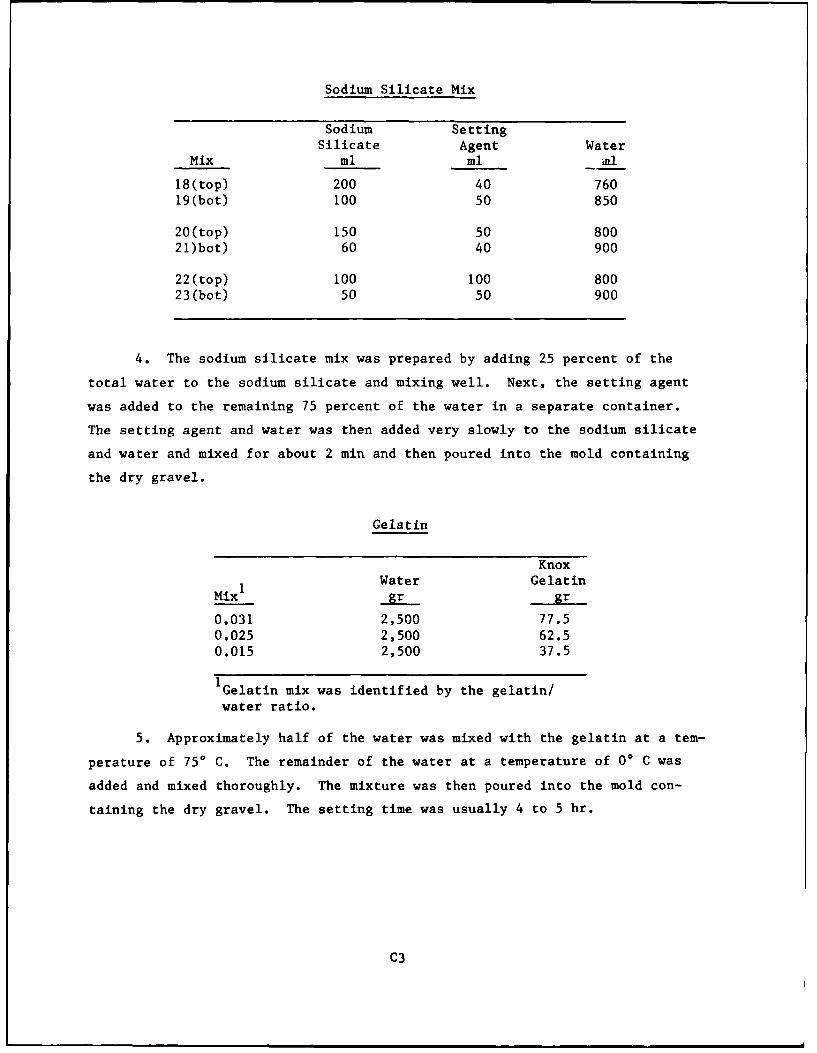
Sodium Silicate Mix
Sodium SettingSilicate Agent Water
Mix ml ml Ml
18(top) 200 40 76019(bot) 100 50 850
20(top) 150 50 80021)bot) 60 40 900
22(top) 100 100 80023(bot) 50 50 900
4. The sodium silicate mix was prepared by adding 25 percent of the
total water to the sodium silicate and mixing well. Next, the setting agent
was added to the remaining 75 percent of the water in a separate container.
The setting agent and water was then added very slowly to the sodium silicate
and water and mixed for about 2 min and then poured into the mold containing
the dry gravel.
Gelatin
Knox
1 Water GelatinMixI _. gr
0.031 2,500 77.50.025 2,500 62.50.015 2,500 37.5
1Gelatin mix was identified by the gelatin/
water ratio.
5. Approximately half of the water was mixed with the gelatin at a tem-
perature of 750 C. The remainder of the water at a temperature of 0* C was
added and mixed thoroughly. The mixture was then poured into the mold con-
taining the dry gravel. The setting time was usually 4 to 5 hr.
C3
APPENDIX D
SUMMARY OF FLUME TEST DATA
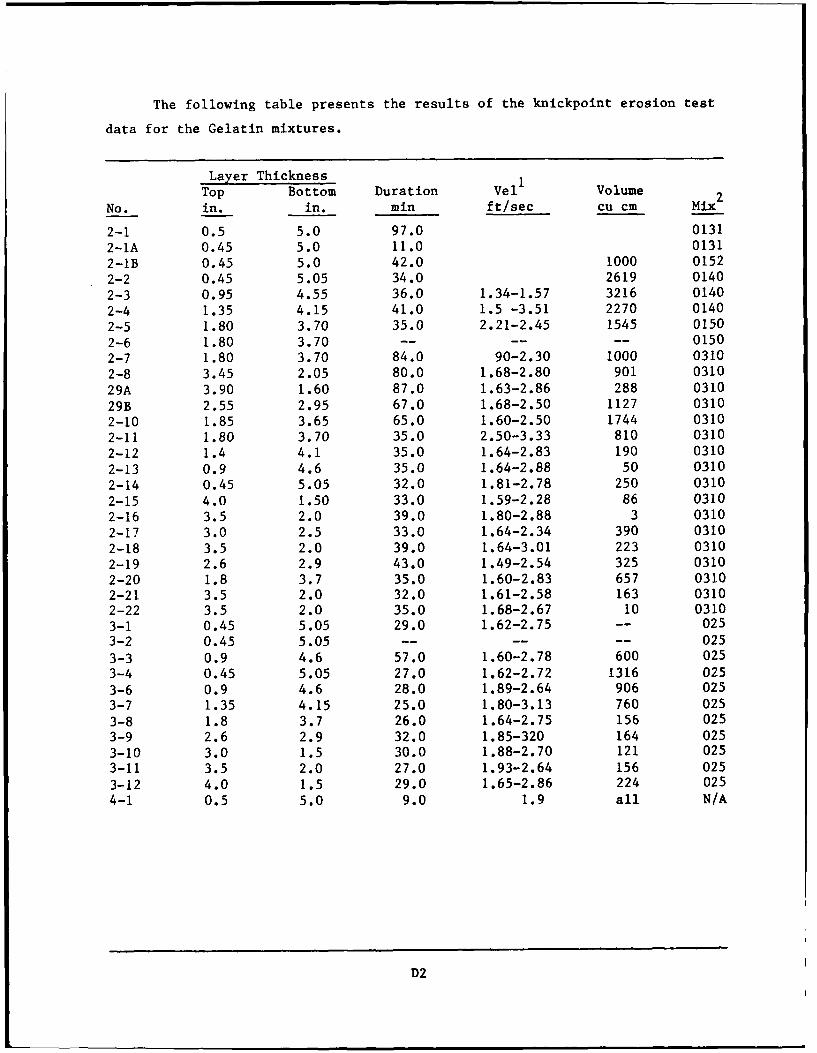
The following table presents the results of the knickpoint erosion test
data for the Gelatin mixtures.
Layer ThicknessTop Bottom Duration Vel' Volume
No. in. in. min ft/sec cu cm Mix2
2-1 0.5 5.0 97.0 01312-lA 0.45 5.0 11.0 01312-1B 0.45 5.0 42.0 1000 01522-2 0.45 5.05 34.0 2619 0140
2-3 0.95 4.55 36.0 1.34-1.57 3216 0140
2-4 1.35 4.15 41.0 1.5 -3.51 2270 0140
2-5 1.80 3.70 35.0 2.21-2.45 1545 0150
2-6 1.80 3.70 -- -- -- 0150
2-7 1.80 3.70 84.0 90-2.30 1000 0310
2-8 3.45 2.05 80.0 1.68-2.80 901 0310
29A 3.90 1.60 87.0 1.63-2.86 288 0310
29B 2.55 2.95 67.0 1.68-2.50 1127 0310
2-10 1.85 3.65 65.0 1.60-2.50 1744 0310
2-11 1.80 3.70 35.0 2.50-3.33 810 0310
2-12 1.4 4.1 35.0 1.64-2.83 190 0310
2-13 0.9 4.6 35.0 1.64-2.88 50 03102-14 0.45 5.05 32.0 1.81-2.78 250 03102-15 4.0 1.50 33.0 1.59-2.28 86 03102-16 3.5 2.0 39.0 1.80-2.88 3 03102-17 3.0 2.5 33.0 1.64-2.34 390 03102-18 3.5 2.0 39.0 1.64-3.01 223 03102-19 2.6 2.9 43.0 1.49-2.54 325 03102-20 1.8 3.7 35.0 1.60-2.83 657 03102-21 3.5 2.0 32.0 1.61-2.58 163 03102-22 3.5 2.0 35.0 1.68-2.67 10 03103-1 0.45 5.05 29.0 1.62-2.75 -- 025
3-2 0.45 5.05 -- -- 025
3-3 0.9 4.6 57.0 1.60-2.78 600 0253-4 0.45 5.05 27.0 1.62-2.72 1316 0253-6 0.9 4.6 28.0 1.89-2.64 906 0253-7 1.35 4.15 25.0 1.80-3.13 760 0253-8 1.8 3.7 26.0 1.64-2.75 156 0253-9 2.6 2.9 32.0 1.85-320 164 0253-10 3.0 1.5 30.0 1.88-2.70 121 0253-11 3.5 2.0 27.0 1.93-2.64 156 0253-12 4.0 1.5 29.0 1.65-2.86 224 0254-1 0.5 5.0 9.0 1.9 all N/A
D2