Embed Size (px)
Citation preview
For important disclosures, refer to the Disclosure section.
M O R G A N S T A N L E Y R E S E A R C H
Global
January 28, 2009
The Global Monetary Analyst
Could Hyperinflation Happen Again?
One stark lesson from the ongoing financial and economic crisis is that so-called black swans – large-impact, hard-to-predict and seemingly rare events – can occur more frequently than generally believed. With policymakers around the world throwing massive conventional and unconventional monetary and fiscal stimuli at their economies, we think that it is worth exploring the black swan event of very high inflation or even hyperinflation. While such an outcome is clearly not our main case, the risk of hyperinflation cannot be dismissed very easily any longer, in our view. We discuss the historical evidence, the conditions that can lead to very high or hyperinflation, and whether and how it might happen again. p 2
Central Bank Watch
US: Head Fake? p 6 Euro Area: ECB to Pause Before Easing Further p 7 Japan: Policy Reaction Continues p 7 Norway: More Rate Cuts on the Way p 8 Russia: How Firm a Floor? p 8 Poland: NBP Cuts 75bp; Downplays Weak PLN p 9 Hungary: An Eye on HUF, Other on the Economy p 9 Israel: Policy Rate Cut Was a Non-Event p 10 South Africa: Bye Bye CPIX p 10 India: RBI Keeps Rate Unchanged p 11 Korea: Has to Survive on its Own p 11 Brazil: Aggressive Start to Easing Cycle p 12 Mexico: More Pain Ahead p 12 Chile: Credit Tightening Intensifies p 13
Key Central Bank Risk Events Date Country Event 28-Jan US Rate decision: Expect on-hold
29 Jan New Zealand Rate decision: Expect 100bp cut
30-Jan Norway Dep Governor Qvigstad speech
30-Jan Colombia Rate decision: Expect 50bp cut
03-Feb Australia Rate decision: Expect 50bp cut
04-Feb Romania Rate decision: Expect 50bp cut
04-Feb South Africa Rate decision: Expect 100bp cut
04-Feb Indonesia Rate decision: Expect 25bp cut
04-Feb Norway Rate decision: Expect 50bp cut
05-Feb Euro Area Rate decision: Expect on-hold
05-Feb UK Rate decision: Expect on-hold
05-Feb Czech Rep. Rate decision: Expect 50bp cut
05-Feb Chile Monetary Policy Meeting minutes
05-Feb Peru Rate decision: Expect on hold
What’s Changed? Forecast Changes Since Last Week US GDP: -6.5% end 4Q08; prev. -6.0%
Turkey Policy rates:11.5, 12.5% end ’09, ’10; prev. 12, 13%
Israel Policy rates: 0.5, 3% end ’09, ’10; prev. 1, 3.5%
UAE Policy rates: 1, 3% end ’09, ’10; prev. 1.5, 3.5%
Where Do We Differ Most from the Market? ECB to cut more aggressively (to 1%) this quarter than mkt expects (p 14)
Bank of Japan expected to move to ZIRP this quarter (page 14)
Bank of England expecting fewer cuts than the market (page 14)
Global Economics Team:
Coordinators of this publication
Joachim Fels [email protected] +44 (0)20 7425 6138
Manoj Pradhan [email protected] +44 (0)20 7425 3805
Spyros Andreopoulos [email protected] +44 (0)20 7677 0528
M O R G A N S T A N L E Y R E S E A R C H
January 28, 2009 The Global Monetary Analyst
Could Hyperinflation Happen Again? Joachim Fels (44 20) 7425 6138 Spyros Andreopoulos (44 20) 7677 0528
• One stark lesson from the ongoing financial and economic crisis is that so-called black swans – large-impact, hard-to-predict and seemingly rare events – can occur more frequently than generally believed.
• With policymakers around the world throwing massive conventional and unconventional monetary and fiscal stimuli at their economies, we think that it is worth exploring the black swan event of very high inflation or even hyperinflation.
• While such an outcome is clearly not our main case, the risk of hyperinflation cannot be dismissed very easily any longer, in our view. We discuss the historical evidence, the conditions that can lead to very high or hyperinflation, and whether and how it might happen again.
According to Philip Cagan’s (1956) classical definition, hyperinflation is an episode where the inflation rate exceeds 50% per month. The historical examples of hyperinflation mostly occurred in the 1920s, when Austria, Germany, Hungary, Poland and Russia experienced galloping price increases. For example, Germany in 1923 recorded an astronomical inflation rate of 3.25 million percent in a single month. Since the 1950s, hyperinflations have been confined to developing and transition economies. Some recent examples include Argentina (1989-90), Bolivia (1984-85), Brazil (1989-90), Peru (1990), Ukraine (1991-94) and Zimbabwe in the past several years.
The root cause of hyperinflation is excessive money supply growth, usually caused by governments instructing their central banks to help finance expenditures through rapid money creation. Hyperinflations have mostly occurred in a context of political instability, adverse economic shocks and chronically high fiscal deficits. Hyperinflationary episodes are characterised by a general loss of confidence in the value of money, a flight into real assets and hard currencies, a surge in barter trade, and a shrinkage of financial intermediation and thus of the banking system.
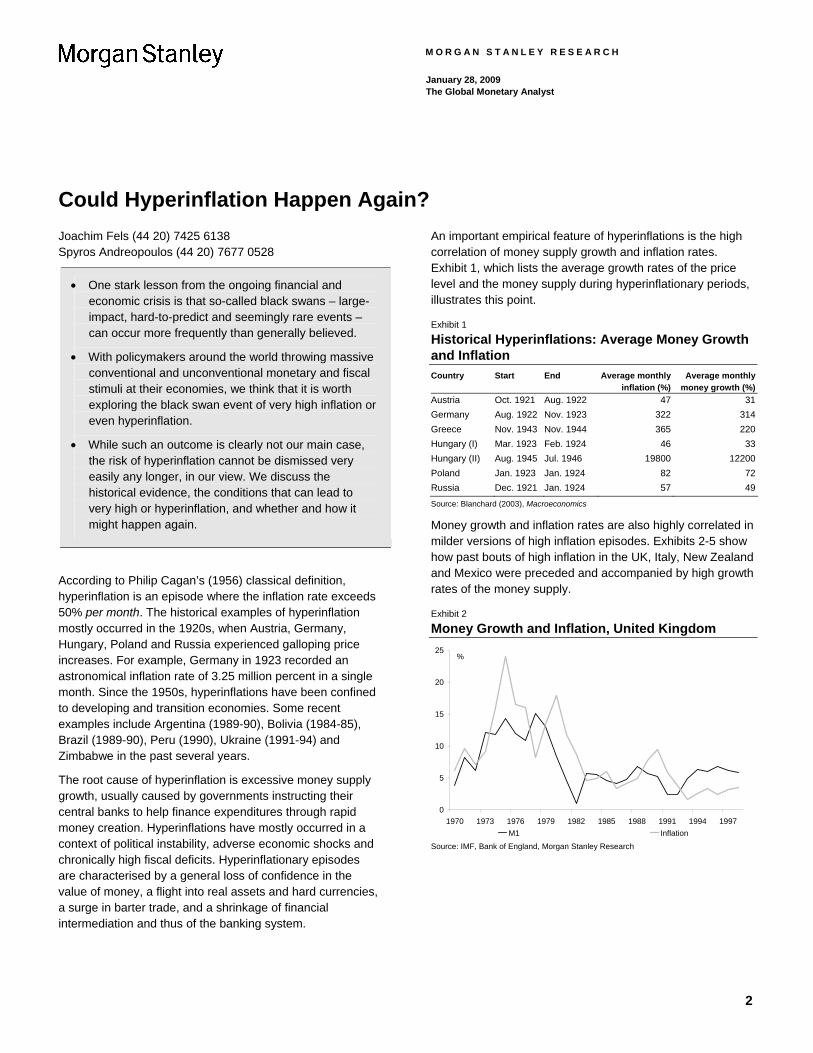
An important empirical feature of hyperinflations is the high correlation of money supply growth and inflation rates. Exhibit 1, which lists the average growth rates of the price level and the money supply during hyperinflationary periods, illustrates this point.
Exhibit 1
Historical Hyperinflations: Average Money Growth and Inflation Country Start End Average monthly
inflation (%)Average monthly
money growth (%)Austria Oct. 1921 Aug. 1922 47 31Germany Aug. 1922 Nov. 1923 322 314Greece Nov. 1943 Nov. 1944 365 220Hungary (I) Mar. 1923 Feb. 1924 46 33Hungary (II) Aug. 1945 Jul. 1946 19800 12200Poland Jan. 1923 Jan. 1924 82 72Russia Dec. 1921 Jan. 1924 57 49
Source: Blanchard (2003), Macroeconomics
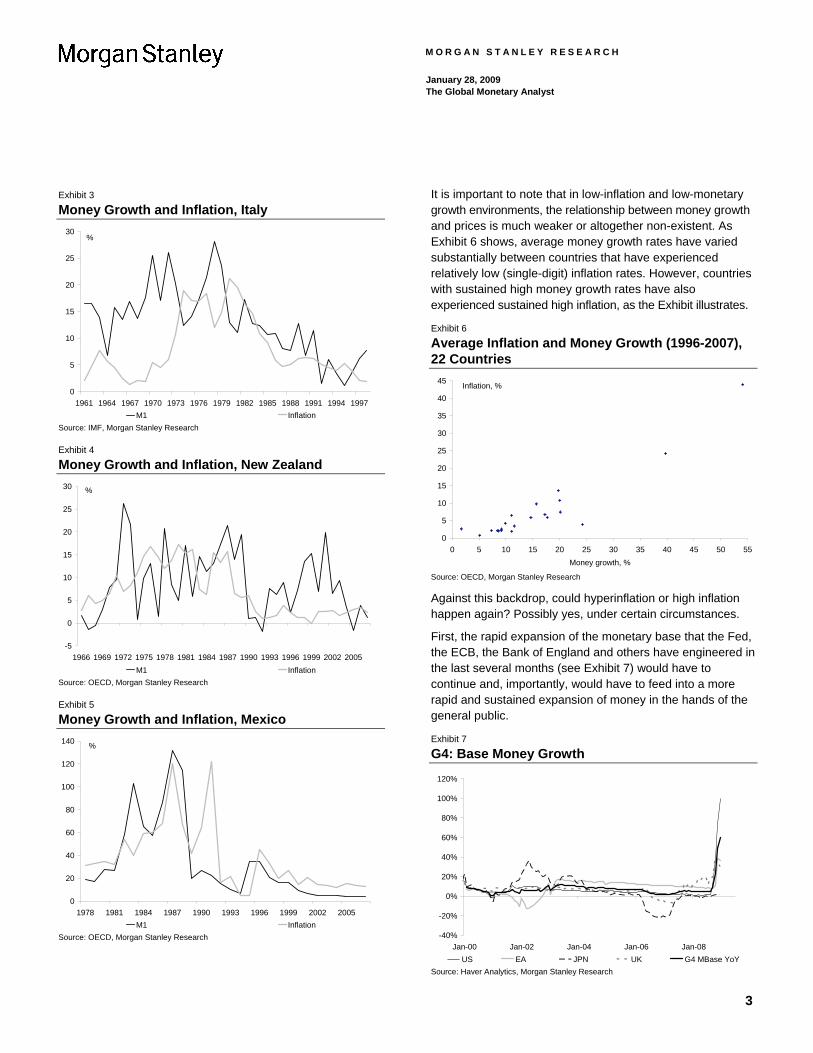
Money growth and inflation rates are also highly correlated in milder versions of high inflation episodes. Exhibits 2-5 show how past bouts of high inflation in the UK, Italy, New Zealand and Mexico were preceded and accompanied by high growth rates of the money supply.
Exhibit 2
Money Growth and Inflation, United Kingdom
0
5
10
15
20
25
1970 1973 1976 1979 1982 1985 1988 1991 1994 1997M1 Inflation
%
Source: IMF, Bank of England, Morgan Stanley Research
2
M O R G A N S T A N L E Y R E S E A R C H
January 28, 2009 The Global Monetary Analyst
Exhibit 3
Money Growth and Inflation, Italy
0
5
10
15
20
25
30
1961 1964 1967 1970 1973 1976 1979 1982 1985 1988 1991 1994 1997M1 Inflation
%
Source: IMF, Morgan Stanley Research
Exhibit 4
Money Growth and Inflation, New Zealand
-5
0
5
10
15
20
25
30
1966 1969 1972 1975 1978 1981 1984 1987 1990 1993 1996 1999 2002 2005M1 Inflation
%
Source: OECD, Morgan Stanley Research
Exhibit 5
Money Growth and Inflation, Mexico
0
20
40
60
80
100
120
140
1978 1981 1984 1987 1990 1993 1996 1999 2002 2005M1 Inflation
%
Source: OECD, Morgan Stanley Research
It is important to note that in low-inflation and low-monetary growth environments, the relationship between money growth and prices is much weaker or altogether non-existent. As Exhibit 6 shows, average money growth rates have varied substantially between countries that have experienced relatively low (single-digit) inflation rates. However, countries with sustained high money growth rates have also experienced sustained high inflation, as the Exhibit illustrates.
Exhibit 6
Average Inflation and Money Growth (1996-2007), 22 Countries
0
5
10
15
20
25
30
35
40
45
0 5 10 15 20 25 30 35 40 45 50 55Money growth, %
Inflation, %
Source: OECD, Morgan Stanley Research
Against this backdrop, could hyperinflation or high inflation happen again? Possibly yes, under certain circumstances.
First, the rapid expansion of the monetary base that the Fed, the ECB, the Bank of England and others have engineered in the last several months (see Exhibit 7) would have to continue and, importantly, would have to feed into a more rapid and sustained expansion of money in the hands of the general public.
Exhibit 7
G4: Base Money Growth
-40%
-20%
0%
20%
40%
60%
80%
100%
120%
Jan-00 Jan-02 Jan-04 Jan-06 Jan-08US EA JPN UK G4 MBase YoY
Source: Haver Analytics, Morgan Stanley Research
3
M O R G A N S T A N L E Y R E S E A R C H
January 28, 2009 The Global Monetary Analyst
Exhibit 8
G4: M1 Growth
-10%
-5%
0%
5%
10%
15%
20%
25%
30%
35%
Jan-00 Jan-02 Jan-04 Jan-06 Jan-08US EA JPN UK G4 M1 YoY
Quantitative easingin Japan
Source: Haver Analytics, Morgan Stanley Research
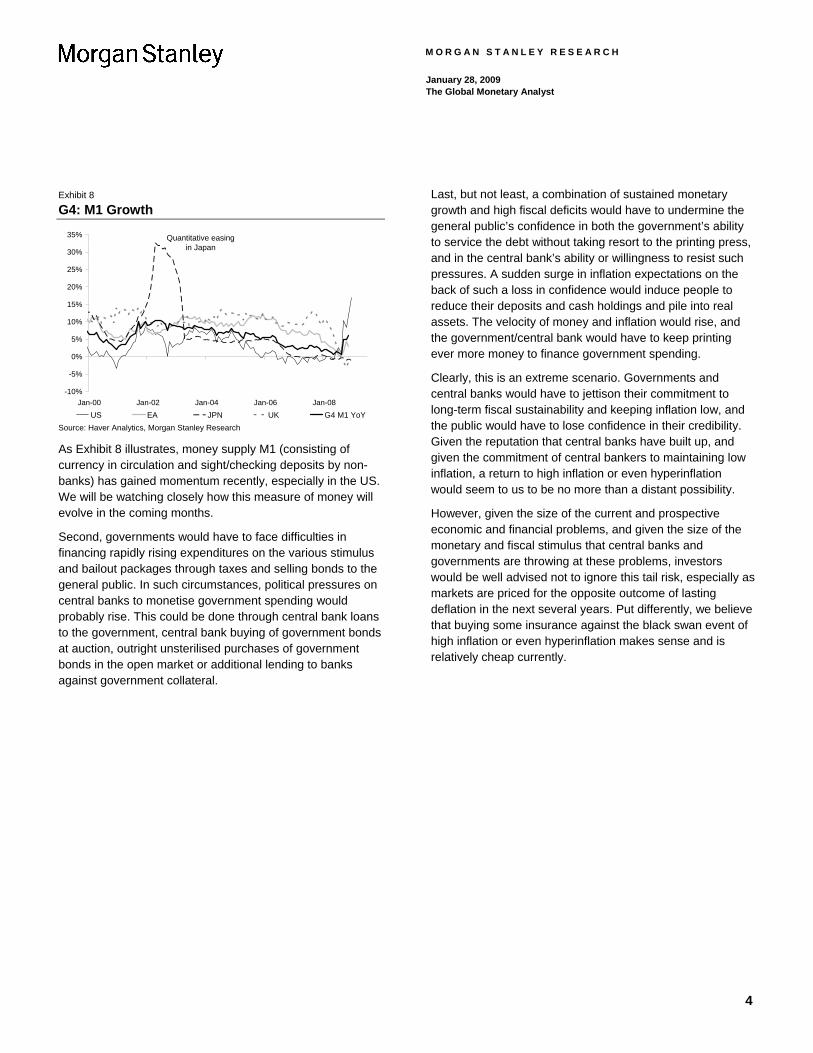
As Exhibit 8 illustrates, money supply M1 (consisting of currency in circulation and sight/checking deposits by non-banks) has gained momentum recently, especially in the US. We will be watching closely how this measure of money will evolve in the coming months.
Second, governments would have to face difficulties in financing rapidly rising expenditures on the various stimulus and bailout packages through taxes and selling bonds to the general public. In such circumstances, political pressures on central banks to monetise government spending would probably rise. This could be done through central bank loans to the government, central bank buying of government bonds at auction, outright unsterilised purchases of government bonds in the open market or additional lending to banks against government collateral.
Last, but not least, a combination of sustained monetary growth and high fiscal deficits would have to undermine the general public’s confidence in both the government’s ability to service the debt without taking resort to the printing press, and in the central bank’s ability or willingness to resist such pressures. A sudden surge in inflation expectations on the back of such a loss in confidence would induce people to reduce their deposits and cash holdings and pile into real assets. The velocity of money and inflation would rise, and the government/central bank would have to keep printing ever more money to finance government spending.
Clearly, this is an extreme scenario. Governments and central banks would have to jettison their commitment to long-term fiscal sustainability and keeping inflation low, and the public would have to lose confidence in their credibility. Given the reputation that central banks have built up, and given the commitment of central bankers to maintaining low inflation, a return to high inflation or even hyperinflation would seem to us to be no more than a distant possibility.
However, given the size of the current and prospective economic and financial problems, and given the size of the monetary and fiscal stimulus that central banks and governments are throwing at these problems, investors would be well advised not to ignore this tail risk, especially as markets are priced for the opposite outcome of lasting deflation in the next several years. Put differently, we believe that buying some insurance against the black swan event of high inflation or even hyperinflation makes sense and is relatively cheap currently.
4
M O R G A N S T A N L E Y R E S E A R C H
January 28, 2009 The Global Monetary Analyst
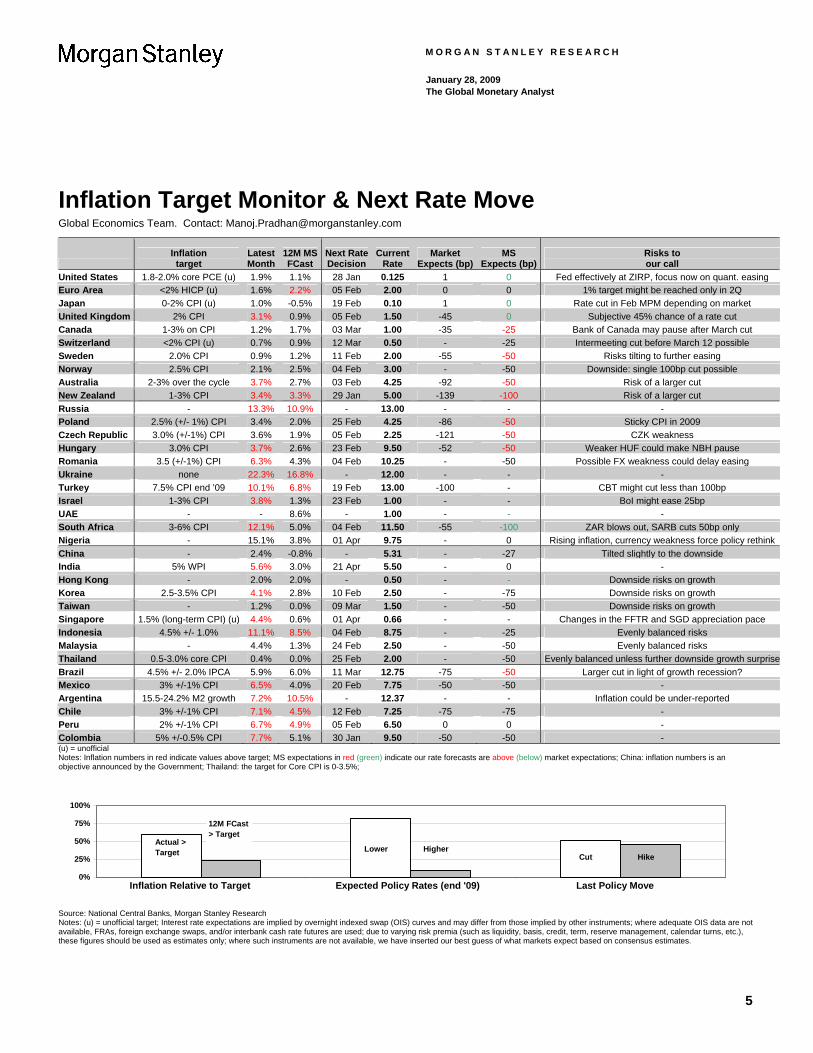
Inflation Target Monitor & Next Rate Move Global Economics Team. Contact: [email protected]
Inflation target
Latest Month
12M MS FCast
Next RateDecision
CurrentRate
Market Expects (bp)
MS Expects (bp)
Risks to our call
United States 1.8-2.0% core PCE (u) 1.9% 1.1% 28 Jan 0.125 1 0 Fed effectively at ZIRP, focus now on quant. easingEuro Area <2% HICP (u) 1.6% 2.2% 05 Feb 2.00 0 0 1% target might be reached only in 2Q Japan 0-2% CPI (u) 1.0% -0.5% 19 Feb 0.10 1 0 Rate cut in Feb MPM depending on market United Kingdom 2% CPI 3.1% 0.9% 05 Feb 1.50 -45 0 Subjective 45% chance of a rate cut Canada 1-3% on CPI 1.2% 1.7% 03 Mar 1.00 -35 -25 Bank of Canada may pause after March cut Switzerland <2% CPI (u) 0.7% 0.9% 12 Mar 0.50 - -25 Intermeeting cut before March 12 possible Sweden 2.0% CPI 0.9% 1.2% 11 Feb 2.00 -55 -50 Risks tilting to further easing Norway 2.5% CPI 2.1% 2.5% 04 Feb 3.00 - -50 Downside: single 100bp cut possible Australia 2-3% over the cycle 3.7% 2.7% 03 Feb 4.25 -92 -50 Risk of a larger cut New Zealand 1-3% CPI 3.4% 3.3% 29 Jan 5.00 -139 -100 Risk of a larger cut Russia - 13.3% 10.9% - 13.00 - - -Poland 2.5% (+/- 1%) CPI 3.4% 2.0% 25 Feb 4.25 -86 -50 Sticky CPI in 2009 Czech Republic 3.0% (+/-1%) CPI 3.6% 1.9% 05 Feb 2.25 -121 -50 CZK weakness Hungary 3.0% CPI 3.7% 2.6% 23 Feb 9.50 -52 -50 Weaker HUF could make NBH pause Romania 3.5 (+/-1%) CPI 6.3% 4.3% 04 Feb 10.25 - -50 Possible FX weakness could delay easing Ukraine none 22.3% 16.8% - 12.00 - - - Turkey 7.5% CPI end ’09 10.1% 6.8% 19 Feb 13.00 -100 - CBT might cut less than 100bp Israel 1-3% CPI 3.8% 1.3% 23 Feb 1.00 - - BoI might ease 25bp UAE - - 8.6% - 1.00 - - - South Africa 3-6% CPI 12.1% 5.0% 04 Feb 11.50 -55 -100 ZAR blows out, SARB cuts 50bp only Nigeria - 15.1% 3.8% 01 Apr 9.75 - 0 Rising inflation, currency weakness force policy rethinkChina - 2.4% -0.8% - 5.31 - -27 Tilted slightly to the downsideIndia 5% WPI 5.6% 3.0% 21 Apr 5.50 - 0 - Hong Kong - 2.0% 2.0% - 0.50 - - Downside risks on growth Korea 2.5-3.5% CPI 4.1% 2.8% 10 Feb 2.50 - -75 Downside risks on growth Taiwan - 1.2% 0.0% 09 Mar 1.50 - -50 Downside risks on growth Singapore 1.5% (long-term CPI) (u) 4.4% 0.6% 01 Apr 0.66 - - Changes in the FFTR and SGD appreciation pace Indonesia 4.5% +/- 1.0% 11.1% 8.5% 04 Feb 8.75 - -25 Evenly balanced risks Malaysia - 4.4% 1.3% 24 Feb 2.50 - -50 Evenly balanced risks Thailand 0.5-3.0% core CPI 0.4% 0.0% 25 Feb 2.00 - -50 Evenly balanced unless further downside growth surprise Brazil 4.5% +/- 2.0% IPCA 5.9% 6.0% 11 Mar 12.75 -75 -50 Larger cut in light of growth recession?Mexico 3% +/-1% CPI 6.5% 4.0% 20 Feb 7.75 -50 -50 - Argentina 15.5-24.2% M2 growth 7.2% 10.5% - 12.37 - - Inflation could be under-reported Chile 3% +/-1% CPI 7.1% 4.5% 12 Feb 7.25 -75 -75 - Peru 2% +/-1% CPI 6.7% 4.9% 05 Feb 6.50 0 0 - Colombia 5% +/-0.5% CPI 7.7% 5.1% 30 Jan 9.50 -50 -50 - (u) = unofficial Notes: Inflation numbers in red indicate values above target; MS expectations in red (green) indicate our rate forecasts are above (below) market expectations; China: inflation numbers is an objective announced by the Government; Thailand: the target for Core CPI is 0-3.5%;
0%
25%
50%
75%
100%
Inflation Relative to Target Expected Policy Rates (end '09) Last Policy Move
Actual >Target
12M FCast> Target
HigherLowerHikeCut
Source: National Central Banks, Morgan Stanley Research Notes: (u) = unofficial target; Interest rate expectations are implied by overnight indexed swap (OIS) curves and may differ from those implied by other instruments; where adequate OIS data are not available, FRAs, foreign exchange swaps, and/or interbank cash rate futures are used; due to varying risk premia (such as liquidity, basis, credit, term, reserve management, calendar turns, etc.), these figures should be used as estimates only; where such instruments are not available, we have inserted our best guess of what markets expect based on consensus estimates.
5
M O R G A N S T A N L E Y R E S E A R C H
Central Bank Watch
January 28, 2009 The Global Monetary Analyst
What’s New This Week? US: Head Fake? ............................................................ p 6 Euro Area: ECB to Pause Before Easing Further......... p 7 Japan: Policy Reaction Continues ................................ p 7 Norway: More Rate Cuts on the Way ........................... p 8 Russia: How Firm a Floor? ........................................... p 8 Poland: NBP Cuts 75bp; Downplays Weak PLN .......... p 9 Hungary: An Eye on HUF, the Other on the Economy . p 9 Israel: Policy Rate Cut Was a Non-Event ................... p 10 South Africa: Bye Bye CPIX ...................................... p 10 India: RBI Keeps Rate Unchanged ............................. p 11 Korea: Has to Survive on its Own ............................... p 11 Brazil: Aggressive Start to Easing Cycle .................... p 12 Mexico: More Pain Ahead........................................... p 12 Chile: Credit Tightening Intensifies ............................. p 13
US: Head Fake? Richard Berner (1 212) 761 3398
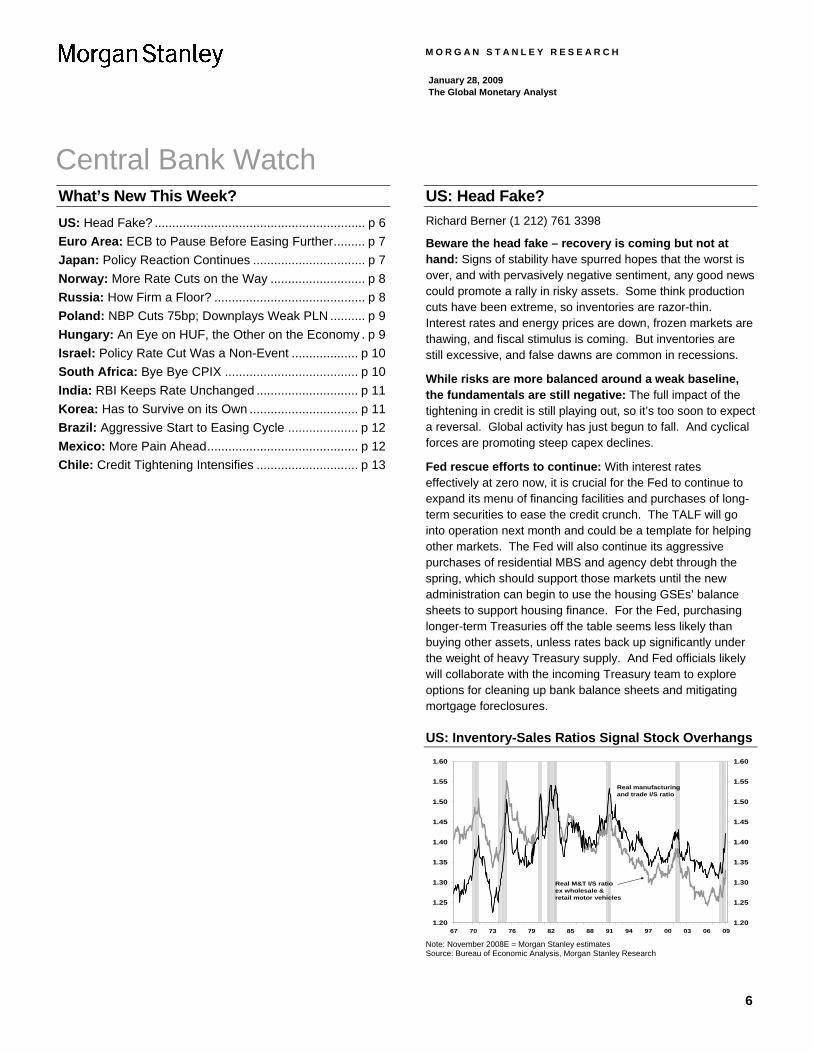
Beware the head fake – recovery is coming but not at hand: Signs of stability have spurred hopes that the worst is over, and with pervasively negative sentiment, any good news could promote a rally in risky assets. Some think production cuts have been extreme, so inventories are razor-thin. Interest rates and energy prices are down, frozen markets are thawing, and fiscal stimulus is coming. But inventories are still excessive, and false dawns are common in recessions.
While risks are more balanced around a weak baseline, the fundamentals are still negative: The full impact of the tightening in credit is still playing out, so it’s too soon to expect a reversal. Global activity has just begun to fall. And cyclical forces are promoting steep capex declines.
Fed rescue efforts to continue: With interest rates effectively at zero now, it is crucial for the Fed to continue to expand its menu of financing facilities and purchases of long-term securities to ease the credit crunch. The TALF will go into operation next month and could be a template for helping other markets. The Fed will also continue its aggressive purchases of residential MBS and agency debt through the spring, which should support those markets until the new administration can begin to use the housing GSEs’ balance sheets to support housing finance. For the Fed, purchasing longer-term Treasuries off the table seems less likely than buying other assets, unless rates back up significantly under the weight of heavy Treasury supply. And Fed officials likely will collaborate with the incoming Treasury team to explore options for cleaning up bank balance sheets and mitigating mortgage foreclosures.
US: Inventory-Sales Ratios Signal Stock Overhangs
1.20
1.25
1.30
1.35
1.40
1.45
1.50
1.55
1.60
67 70 73 76 79 82 85 88 91 94 97 00 03 06 091.20
1.25
1.30
1.35
1.40
1.45
1.50
1.55
1.60
Real manufacturing and trade I/S ratio
Real M&T I/S ratioex wholesale &retail motor vehicles
Note: November 2008E = Morgan Stanley estimates Source: Bureau of Economic Analysis, Morgan Stanley Research
6
M O R G A N S T A N L E Y R E S E A R C H
Central Bank Watch
January 28, 2009 The Global Monetary Analyst
Euro Area: ECB to Pause Before Easing Further Elga Bartsch (44 20) 7425 5434
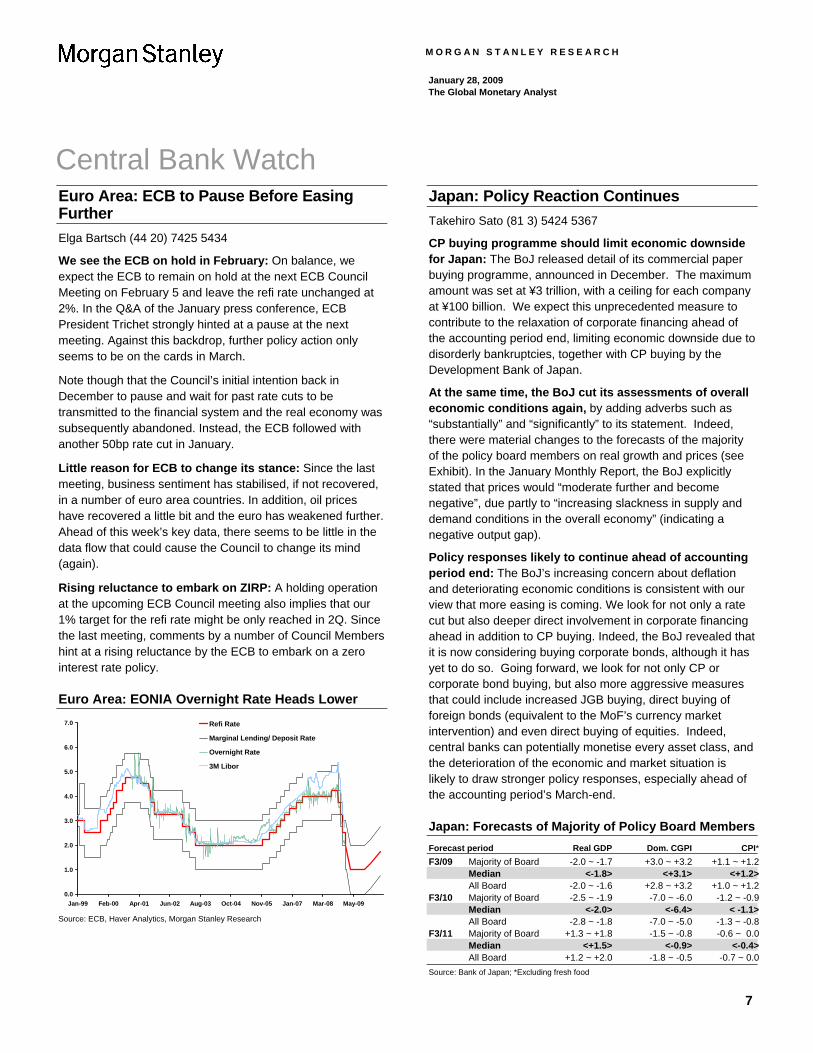
We see the ECB on hold in February: On balance, we expect the ECB to remain on hold at the next ECB Council Meeting on February 5 and leave the refi rate unchanged at 2%. In the Q&A of the January press conference, ECB President Trichet strongly hinted at a pause at the next meeting. Against this backdrop, further policy action only seems to be on the cards in March.
Note though that the Council’s initial intention back in December to pause and wait for past rate cuts to be transmitted to the financial system and the real economy was subsequently abandoned. Instead, the ECB followed with another 50bp rate cut in January.
Little reason for ECB to change its stance: Since the last meeting, business sentiment has stabilised, if not recovered, in a number of euro area countries. In addition, oil prices have recovered a little bit and the euro has weakened further. Ahead of this week’s key data, there seems to be little in the data flow that could cause the Council to change its mind (again).
Rising reluctance to embark on ZIRP: A holding operation at the upcoming ECB Council meeting also implies that our 1% target for the refi rate might be only reached in 2Q. Since the last meeting, comments by a number of Council Members hint at a rising reluctance by the ECB to embark on a zero interest rate policy.
Euro Area: EONIA Overnight Rate Heads Lower
0.0
1.0
2.0
3.0
4.0
5.0
6.0
7.0
Jan-99 Feb-00 Apr-01 Jun-02 Aug-03 Oct-04 Nov-05 Jan-07 Mar-08 May-09
Refi Rate
Marginal Lending/ Deposit Rate
Overnight Rate
3M Libor
Source: ECB, Haver Analytics, Morgan Stanley Research
Japan: Policy Reaction Continues Takehiro Sato (81 3) 5424 5367
CP buying programme should limit economic downside for Japan: The BoJ released detail of its commercial paper buying programme, announced in December. The maximum amount was set at ¥3 trillion, with a ceiling for each company at ¥100 billion. We expect this unprecedented measure to contribute to the relaxation of corporate financing ahead of the accounting period end, limiting economic downside due to disorderly bankruptcies, together with CP buying by the Development Bank of Japan.
At the same time, the BoJ cut its assessments of overall economic conditions again, by adding adverbs such as “substantially” and “significantly” to its statement. Indeed, there were material changes to the forecasts of the majority of the policy board members on real growth and prices (see Exhibit). In the January Monthly Report, the BoJ explicitly stated that prices would “moderate further and become negative”, due partly to “increasing slackness in supply and demand conditions in the overall economy” (indicating a negative output gap).
Policy responses likely to continue ahead of accounting period end: The BoJ’s increasing concern about deflation and deteriorating economic conditions is consistent with our view that more easing is coming. We look for not only a rate cut but also deeper direct involvement in corporate financing ahead in addition to CP buying. Indeed, the BoJ revealed that it is now considering buying corporate bonds, although it has yet to do so. Going forward, we look for not only CP or corporate bond buying, but also more aggressive measures that could include increased JGB buying, direct buying of foreign bonds (equivalent to the MoF’s currency market intervention) and even direct buying of equities. Indeed, central banks can potentially monetise every asset class, and the deterioration of the economic and market situation is likely to draw stronger policy responses, especially ahead of the accounting period’s March-end.
Japan: Forecasts of Majority of Policy Board Members Forecast period Real GDP Dom. CGPI CPI* F3/09 Majority of Board -2.0 ~ -1.7 +3.0 ~ +3.2 +1.1 ~ +1.2 Median <-1.8> <+3.1> <+1.2> All Board -2.0 ~ -1.6 +2.8 ~ +3.2 +1.0 ~ +1.2 F3/10 Majority of Board -2.5 ~ -1.9 -7.0 ~ -6.0 -1.2 ~ -0.9 Median <-2.0> <-6.4> < -1.1> All Board -2.8 ~ -1.8 -7.0 ~ -5.0 -1.3 ~ -0.8 F3/11 Majority of Board +1.3 ~ +1.8 -1.5 ~ -0.8 -0.6 ~ 0.0 Median <+1.5> <-0.9> <-0.4> All Board +1.2 ~ +2.0 -1.8 ~ -0.5 -0.7 ~ 0.0 Source: Bank of Japan; *Excluding fresh food
7
M O R G A N S T A N L E Y R E S E A R C H
Central Bank Watch
January 28, 2009 The Global Monetary Analyst
Norway: More Rate Cuts on the Way Spyros Andreopoulos (44 20) 7677 0528
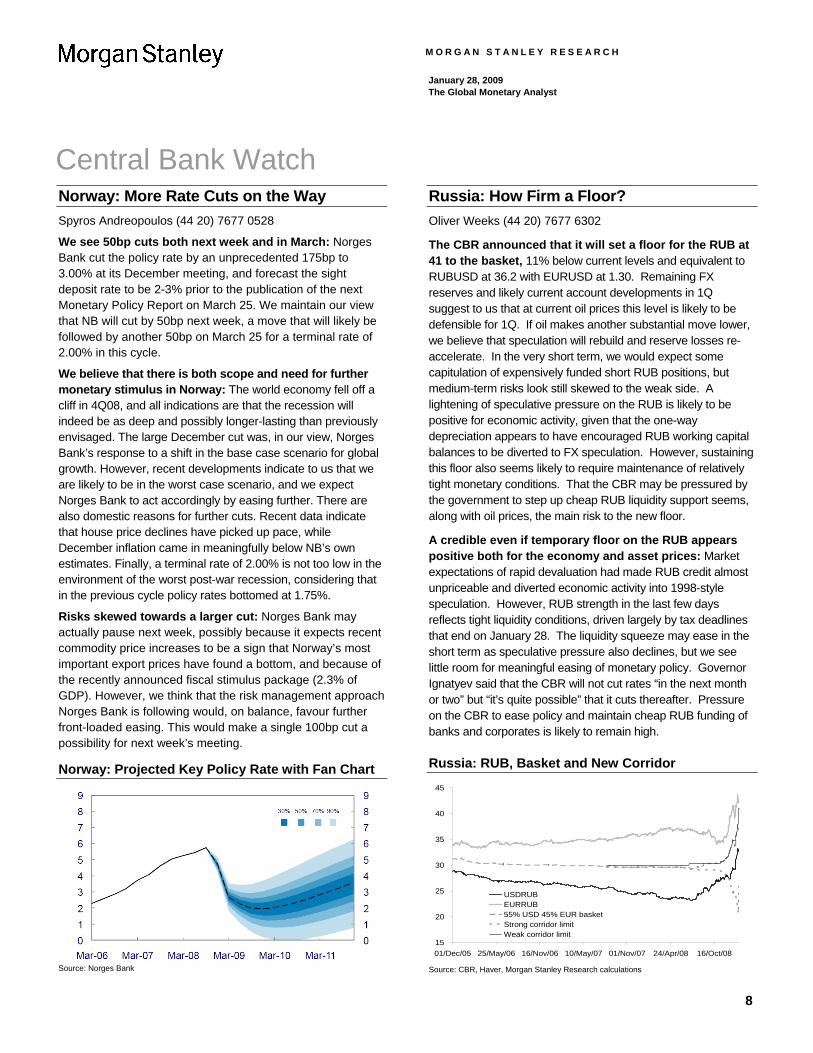
We see 50bp cuts both next week and in March: Norges Bank cut the policy rate by an unprecedented 175bp to 3.00% at its December meeting, and forecast the sight deposit rate to be 2-3% prior to the publication of the next Monetary Policy Report on March 25. We maintain our view that NB will cut by 50bp next week, a move that will likely be followed by another 50bp on March 25 for a terminal rate of 2.00% in this cycle.
We believe that there is both scope and need for further monetary stimulus in Norway: The world economy fell off a cliff in 4Q08, and all indications are that the recession will indeed be as deep and possibly longer-lasting than previously envisaged. The large December cut was, in our view, Norges Bank’s response to a shift in the base case scenario for global growth. However, recent developments indicate to us that we are likely to be in the worst case scenario, and we expect Norges Bank to act accordingly by easing further. There are also domestic reasons for further cuts. Recent data indicate that house price declines have picked up pace, while December inflation came in meaningfully below NB’s own estimates. Finally, a terminal rate of 2.00% is not too low in the environment of the worst post-war recession, considering that in the previous cycle policy rates bottomed at 1.75%.
Risks skewed towards a larger cut: Norges Bank may actually pause next week, possibly because it expects recent commodity price increases to be a sign that Norway’s most important export prices have found a bottom, and because of the recently announced fiscal stimulus package (2.3% of GDP). However, we think that the risk management approach Norges Bank is following would, on balance, favour further front-loaded easing. This would make a single 100bp cut a possibility for next week’s meeting.
Norway: Projected Key Policy Rate with Fan Chart
Source: Norges Bank
Russia: How Firm a Floor? Oliver Weeks (44 20) 7677 6302
The CBR announced that it will set a floor for the RUB at 41 to the basket, 11% below current levels and equivalent to RUBUSD at 36.2 with EURUSD at 1.30. Remaining FX reserves and likely current account developments in 1Q suggest to us that at current oil prices this level is likely to be defensible for 1Q. If oil makes another substantial move lower, we believe that speculation will rebuild and reserve losses re-accelerate. In the very short term, we would expect some capitulation of expensively funded short RUB positions, but medium-term risks look still skewed to the weak side. A lightening of speculative pressure on the RUB is likely to be positive for economic activity, given that the one-way depreciation appears to have encouraged RUB working capital balances to be diverted to FX speculation. However, sustaining this floor also seems likely to require maintenance of relatively tight monetary conditions. That the CBR may be pressured by the government to step up cheap RUB liquidity support seems, along with oil prices, the main risk to the new floor.
A credible even if temporary floor on the RUB appears positive both for the economy and asset prices: Market expectations of rapid devaluation had made RUB credit almost unpriceable and diverted economic activity into 1998-style speculation. However, RUB strength in the last few days reflects tight liquidity conditions, driven largely by tax deadlines that end on January 28. The liquidity squeeze may ease in the short term as speculative pressure also declines, but we see little room for meaningful easing of monetary policy. Governor Ignatyev said that the CBR will not cut rates “in the next month or two” but “it’s quite possible” that it cuts thereafter. Pressure on the CBR to ease policy and maintain cheap RUB funding of banks and corporates is likely to remain high.
Russia: RUB, Basket and New Corridor
15
20
25
30
35
40
45
01/Dec/05 25/May/06 16/Nov/06 10/May/07 01/Nov/07 24/Apr/08 16/Oct/08
USDRUBEURRUB55% USD 45% EUR basketStrong corridor limitWeak corridor limit
Source: CBR, Haver, Morgan Stanley Research calculations
8
M O R G A N S T A N L E Y R E S E A R C H
Central Bank Watch
January 28, 2009 The Global Monetary Analyst
Poland: NBP Cuts 75bp; Downplays Weak PLN Pasquale Diana (44 20) 7677 4183
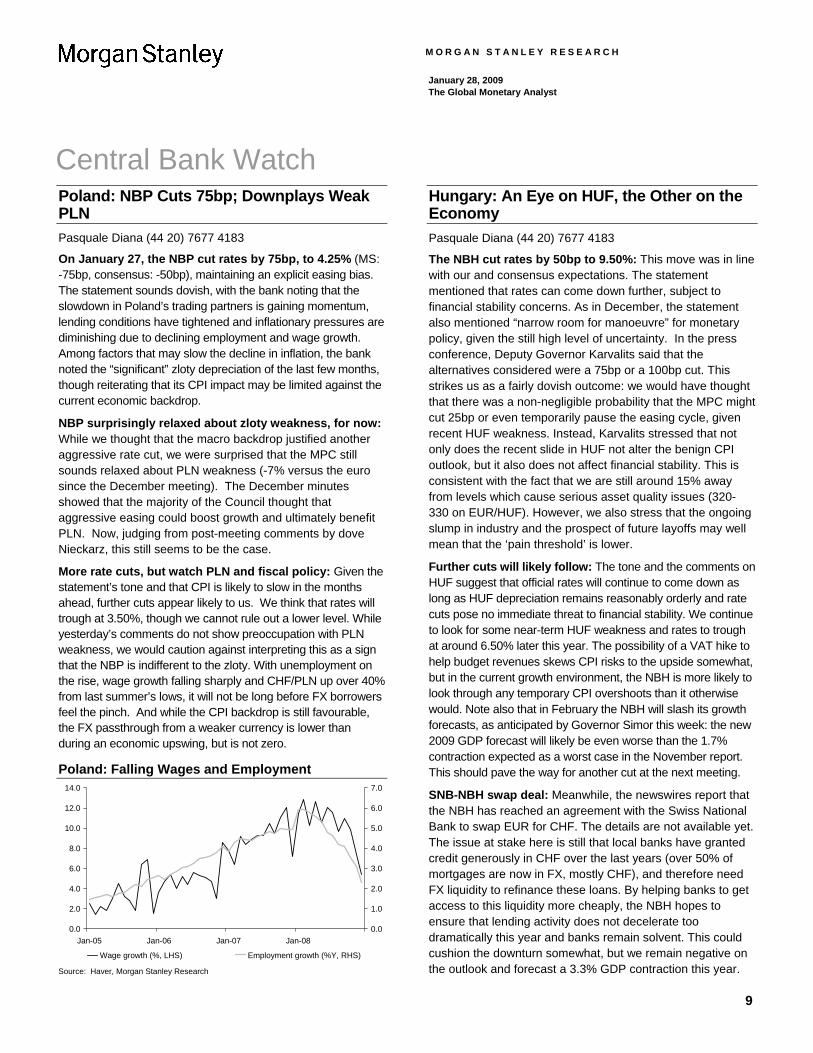
On January 27, the NBP cut rates by 75bp, to 4.25% (MS: -75bp, consensus: -50bp), maintaining an explicit easing bias. The statement sounds dovish, with the bank noting that the slowdown in Poland’s trading partners is gaining momentum, lending conditions have tightened and inflationary pressures are diminishing due to declining employment and wage growth. Among factors that may slow the decline in inflation, the bank noted the “significant” zloty depreciation of the last few months, though reiterating that its CPI impact may be limited against the current economic backdrop.
NBP surprisingly relaxed about zloty weakness, for now: While we thought that the macro backdrop justified another aggressive rate cut, we were surprised that the MPC still sounds relaxed about PLN weakness (-7% versus the euro since the December meeting). The December minutes showed that the majority of the Council thought that aggressive easing could boost growth and ultimately benefit PLN. Now, judging from post-meeting comments by dove Nieckarz, this still seems to be the case.
More rate cuts, but watch PLN and fiscal policy: Given the statement’s tone and that CPI is likely to slow in the months ahead, further cuts appear likely to us. We think that rates will trough at 3.50%, though we cannot rule out a lower level. While yesterday’s comments do not show preoccupation with PLN weakness, we would caution against interpreting this as a sign that the NBP is indifferent to the zloty. With unemployment on the rise, wage growth falling sharply and CHF/PLN up over 40% from last summer’s lows, it will not be long before FX borrowers feel the pinch. And while the CPI backdrop is still favourable, the FX passthrough from a weaker currency is lower than during an economic upswing, but is not zero.
Poland: Falling Wages and Employment
0.0
2.0
4.0
6.0
8.0
10.0
12.0
14.0
Jan-05 Jan-06 Jan-07 Jan-080.0
1.0
2.0
3.0
4.0
5.0
6.0
7.0
Wage growth (%, LHS) Employment growth (%Y, RHS) Source: Haver, Morgan Stanley Research
Hungary: An Eye on HUF, the Other on the Economy Pasquale Diana (44 20) 7677 4183
The NBH cut rates by 50bp to 9.50%: This move was in line with our and consensus expectations. The statement mentioned that rates can come down further, subject to financial stability concerns. As in December, the statement also mentioned “narrow room for manoeuvre” for monetary policy, given the still high level of uncertainty. In the press conference, Deputy Governor Karvalits said that the alternatives considered were a 75bp or a 100bp cut. This strikes us as a fairly dovish outcome: we would have thought that there was a non-negligible probability that the MPC might cut 25bp or even temporarily pause the easing cycle, given recent HUF weakness. Instead, Karvalits stressed that not only does the recent slide in HUF not alter the benign CPI outlook, but it also does not affect financial stability. This is consistent with the fact that we are still around 15% away from levels which cause serious asset quality issues (320-330 on EUR/HUF). However, we also stress that the ongoing slump in industry and the prospect of future layoffs may well mean that the ‘pain threshold’ is lower.
Further cuts will likely follow: The tone and the comments on HUF suggest that official rates will continue to come down as long as HUF depreciation remains reasonably orderly and rate cuts pose no immediate threat to financial stability. We continue to look for some near-term HUF weakness and rates to trough at around 6.50% later this year. The possibility of a VAT hike to help budget revenues skews CPI risks to the upside somewhat, but in the current growth environment, the NBH is more likely to look through any temporary CPI overshoots than it otherwise would. Note also that in February the NBH will slash its growth forecasts, as anticipated by Governor Simor this week: the new 2009 GDP forecast will likely be even worse than the 1.7% contraction expected as a worst case in the November report. This should pave the way for another cut at the next meeting.
SNB-NBH swap deal: Meanwhile, the newswires report that the NBH has reached an agreement with the Swiss National Bank to swap EUR for CHF. The details are not available yet. The issue at stake here is still that local banks have granted credit generously in CHF over the last years (over 50% of mortgages are now in FX, mostly CHF), and therefore need FX liquidity to refinance these loans. By helping banks to get access to this liquidity more cheaply, the NBH hopes to ensure that lending activity does not decelerate too dramatically this year and banks remain solvent. This could cushion the downturn somewhat, but we remain negative on the outlook and forecast a 3.3% GDP contraction this year.
9
M O R G A N S T A N L E Y R E S E A R C H
Central Bank Watch
January 28, 2009 The Global Monetary Analyst
Israel: Policy Rate Cut Was a Non-Event Tevfik Aksoy (90 212) 339 0022
The Bank of Israel (BoI) lowered the main policy rate by 75bp to a new record-low of 1% against the consensus and our expectation of 50bp. The decision did not come as a surprise as, a day prior to the MPC meeting, the central bank lowered its 2009 growth forecast to -0.2% from 1.5% previously and the statements suggested that the risks to the forecast were tilted to the downside. We also revised our 2009 real GDP growth forecast to 0% recently as the data on economic activity had been coming out softer than anticipated. Following the policy rate decision, the central bank issued a press release that explained the basis of the monetary easing. The main considerations were:
• Growth: According to the BoI, the effects of the deteriorating global sentiment on economic activity had been evident and the data had been indicating a marked decline in overall demand. The ongoing weakness in world trade had a marked influence on domestic activity, and the central bank expects further weakness in the coming period.
• Inflation: Falling commodity prices and the recent decline in headline CPI prints had been encouraging, and inflation expectations had been pointing to the possibility of inflation remaining below the 1-3% target. We also expect headline inflation to ease substantially to 1.1% at end-2009, and we project inflation to remain within the 1-3% target band throughout 2010 as well.
• Global rates: The rate cuts from many central banks worldwide also seemed to have affected the BoI’s rate decision. In our view, this is particularly true for the US Fed.
We see further rate cuts to 0.5%: Similar to the case in many countries, the monetary easing has so far resulted in minimal, if any, impact on the real economy. We expect the picture to remain challenging and, despite the BoI’s efforts to stimulate the economy via rate cuts, we do not believe that the task will be accomplished without a noticeable improvement in global demand conditions, as local banks are unlikely to pass on lower borrowing costs. Looking forward, we expect the BoI to ease rates further to 0.5% and bring the policy rate almost in line with the US Fed.
South Africa: Bye Bye CPIX Andrea Masia (27 11) 507 0887
The December print of the now-discontinued CPIX inflation series was released by Statistics South Africa this morning. The reading came in at 10.3%Y (-0.9%M) – below our forecast of 10.4%Y and consensus of 10.6%Y. The extent of deflation in a few key categories caught us off-guard. Overall, we remain on track for around a 350bp drop in the January CPI, when the reweighted and revised inflation basket is introduced.
Deflation surprise: For the first (and last) time ever in the CPIX series, housing costs turned negative, registering -0.1%M from an average 0.6%M through 2008. We find this rather curious, although we do acknowledge that there has been some anecdotal evidence suggesting a softening in the repairs and maintenance category of the housing sub index. Similarly, at a mere 0.1%M in December, household consumables struggled to maintain the 3%M momentum exhibited through 2H08. Although historical inflation readings would have suggested some deceleration in this category at year-end, the sharp moderation in today’s reading is more than we had anticipated, indicating that demand destruction is probably already suppressing inflation at the shop-shelf.
Public transport much stronger than expected: Although expecting an increase in public transports costs, the 3.7%M rise in this category was a lot higher than the 1.5%M we had priced in. The increase here is mostly attributable to the sharp increase in train fares, after a 5-year Metrorail price moratorium signed in 2003 expired in 2008. With rail input costs rising sharply (particularly electricity), we suspect that margin compression was no longer possible, thus forcing the service provider to finally pass on cost increases to the consumer.
Acceleration in policy easing likely: Today’s number should not be much of a surprise to the SARB, and does not affect our view of a step-wise reduction in targeted inflation on conversion to the new CPI in February. Historical data on this new index will be released by Statistics South Africa next week – one day prior to the start of the February MPC meeting. We believe that the SARB’s central inflation forecast would have improved rather markedly compared to the profile presented at its December meeting, thanks to a much bleaker growth outlook, the sustained weakness in oil prices and the scrapping of the fuel slate levy.
10
M O R G A N S T A N L E Y R E S E A R C H
January 28, 2009 The Global Monetary Analyst
India: RBI Keeps Rate Unchanged Chetan Ahya (65) 6834 6738 Tanvee Gupta (91 22) 2209 7927
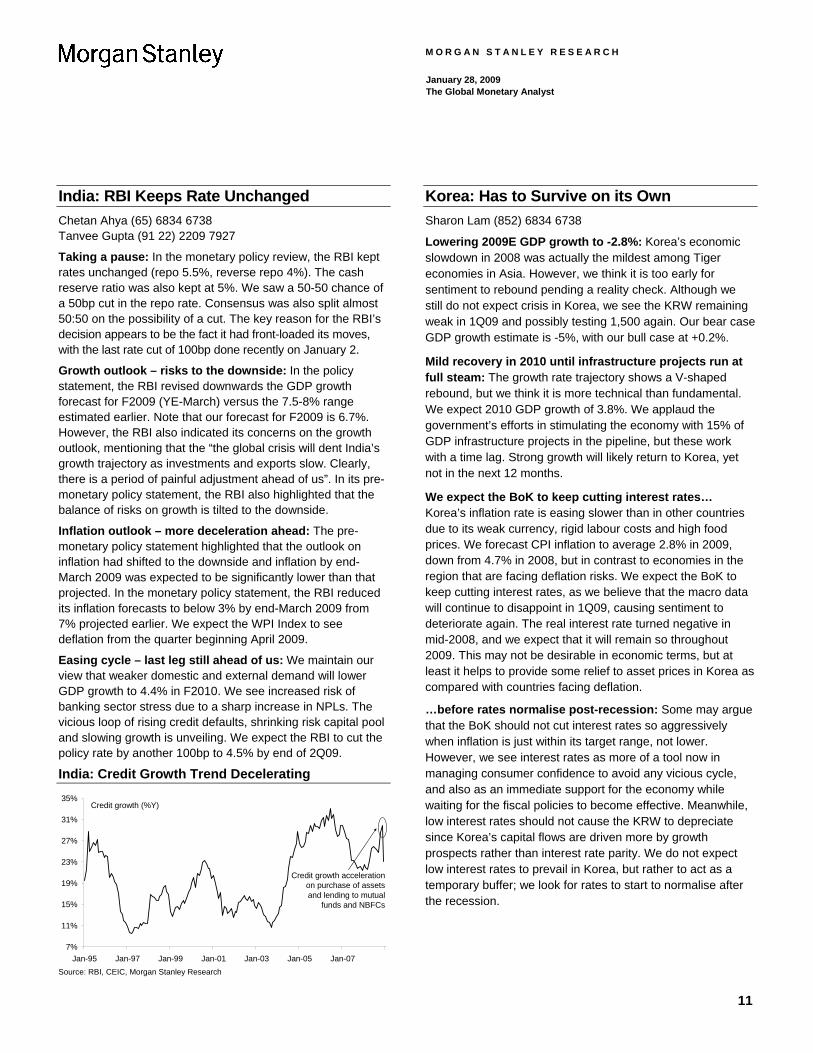
Taking a pause: In the monetary policy review, the RBI kept rates unchanged (repo 5.5%, reverse repo 4%). The cash reserve ratio was also kept at 5%. We saw a 50-50 chance of a 50bp cut in the repo rate. Consensus was also split almost 50:50 on the possibility of a cut. The key reason for the RBI’s decision appears to be the fact it had front-loaded its moves, with the last rate cut of 100bp done recently on January 2.
Growth outlook – risks to the downside: In the policy statement, the RBI revised downwards the GDP growth forecast for F2009 (YE-March) versus the 7.5-8% range estimated earlier. Note that our forecast for F2009 is 6.7%. However, the RBI also indicated its concerns on the growth outlook, mentioning that the “the global crisis will dent India’s growth trajectory as investments and exports slow. Clearly, there is a period of painful adjustment ahead of us”. In its pre-monetary policy statement, the RBI also highlighted that the balance of risks on growth is tilted to the downside.
Inflation outlook – more deceleration ahead: The pre-monetary policy statement highlighted that the outlook on inflation had shifted to the downside and inflation by end-March 2009 was expected to be significantly lower than that projected. In the monetary policy statement, the RBI reduced its inflation forecasts to below 3% by end-March 2009 from 7% projected earlier. We expect the WPI Index to see deflation from the quarter beginning April 2009.
Easing cycle – last leg still ahead of us: We maintain our view that weaker domestic and external demand will lower GDP growth to 4.4% in F2010. We see increased risk of banking sector stress due to a sharp increase in NPLs. The vicious loop of rising credit defaults, shrinking risk capital pool and slowing growth is unveiling. We expect the RBI to cut the policy rate by another 100bp to 4.5% by end of 2Q09.
India: Credit Growth Trend Decelerating
7%
11%
15%
19%
23%
27%
31%
35%
Jan-95 Jan-97 Jan-99 Jan-01 Jan-03 Jan-05 Jan-07
Credit growth (%Y)
Credit growth accelerationon purchase of assetsand lending to mutual
funds and NBFCs
Source: RBI, CEIC, Morgan Stanley Research
Korea: Has to Survive on its Own Sharon Lam (852) 6834 6738
Lowering 2009E GDP growth to -2.8%: Korea’s economic slowdown in 2008 was actually the mildest among Tiger economies in Asia. However, we think it is too early for sentiment to rebound pending a reality check. Although we still do not expect crisis in Korea, we see the KRW remaining weak in 1Q09 and possibly testing 1,500 again. Our bear case GDP growth estimate is -5%, with our bull case at +0.2%.
Mild recovery in 2010 until infrastructure projects run at full steam: The growth rate trajectory shows a V-shaped rebound, but we think it is more technical than fundamental. We expect 2010 GDP growth of 3.8%. We applaud the government’s efforts in stimulating the economy with 15% of GDP infrastructure projects in the pipeline, but these work with a time lag. Strong growth will likely return to Korea, yet not in the next 12 months.
We expect the BoK to keep cutting interest rates… Korea’s inflation rate is easing slower than in other countries due to its weak currency, rigid labour costs and high food prices. We forecast CPI inflation to average 2.8% in 2009, down from 4.7% in 2008, but in contrast to economies in the region that are facing deflation risks. We expect the BoK to keep cutting interest rates, as we believe that the macro data will continue to disappoint in 1Q09, causing sentiment to deteriorate again. The real interest rate turned negative in mid-2008, and we expect that it will remain so throughout 2009. This may not be desirable in economic terms, but at least it helps to provide some relief to asset prices in Korea as compared with countries facing deflation.
…before rates normalise post-recession: Some may argue that the BoK should not cut interest rates so aggressively when inflation is just within its target range, not lower. However, we see interest rates as more of a tool now in managing consumer confidence to avoid any vicious cycle, and also as an immediate support for the economy while waiting for the fiscal policies to become effective. Meanwhile, low interest rates should not cause the KRW to depreciate since Korea’s capital flows are driven more by growth prospects rather than interest rate parity. We do not expect low interest rates to prevail in Korea, but rather to act as a temporary buffer; we look for rates to start to normalise after the recession.
11
M O R G A N S T A N L E Y R E S E A R C H
Central Bank Watch
January 28, 2009 The Global Monetary Analyst
Brazil: Aggressive Start to Easing Cycle Marcelo Carvalho (55 11) 3048 6272
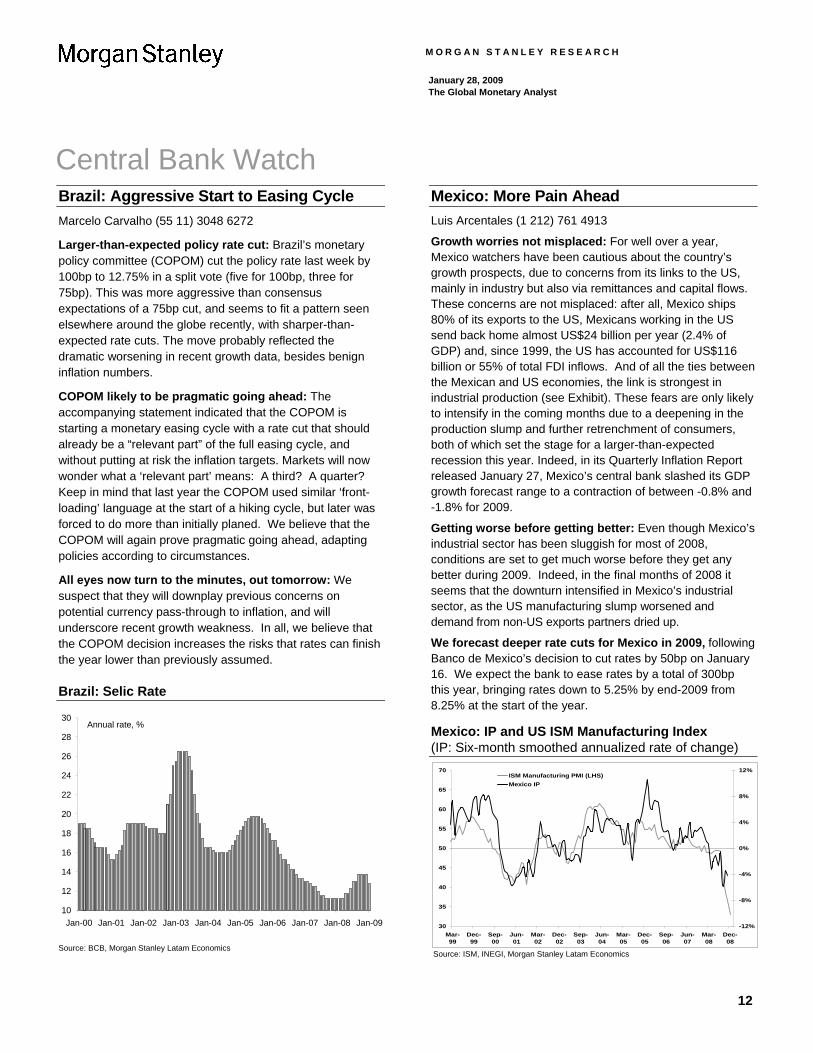
Larger-than-expected policy rate cut: Brazil’s monetary policy committee (COPOM) cut the policy rate last week by 100bp to 12.75% in a split vote (five for 100bp, three for 75bp). This was more aggressive than consensus expectations of a 75bp cut, and seems to fit a pattern seen elsewhere around the globe recently, with sharper-than-expected rate cuts. The move probably reflected the dramatic worsening in recent growth data, besides benign inflation numbers.
COPOM likely to be pragmatic going ahead: The accompanying statement indicated that the COPOM is starting a monetary easing cycle with a rate cut that should already be a “relevant part” of the full easing cycle, and without putting at risk the inflation targets. Markets will now wonder what a ‘relevant part’ means: A third? A quarter? Keep in mind that last year the COPOM used similar ‘front-loading’ language at the start of a hiking cycle, but later was forced to do more than initially planed. We believe that the COPOM will again prove pragmatic going ahead, adapting policies according to circumstances.
All eyes now turn to the minutes, out tomorrow: We suspect that they will downplay previous concerns on potential currency pass-through to inflation, and will underscore recent growth weakness. In all, we believe that the COPOM decision increases the risks that rates can finish the year lower than previously assumed.
Brazil: Selic Rate
10
12
14
16
18
20
22
24
26
28
30
Jan-00 Jan-01 Jan-02 Jan-03 Jan-04 Jan-05 Jan-06 Jan-07 Jan-08 Jan-09
Annual rate, %
Source: BCB, Morgan Stanley Latam Economics
Mexico: More Pain Ahead Luis Arcentales (1 212) 761 4913
Growth worries not misplaced: For well over a year, Mexico watchers have been cautious about the country’s growth prospects, due to concerns from its links to the US, mainly in industry but also via remittances and capital flows. These concerns are not misplaced: after all, Mexico ships 80% of its exports to the US, Mexicans working in the US send back home almost US$24 billion per year (2.4% of GDP) and, since 1999, the US has accounted for US$116 billion or 55% of total FDI inflows. And of all the ties between the Mexican and US economies, the link is strongest in industrial production (see Exhibit). These fears are only likely to intensify in the coming months due to a deepening in the production slump and further retrenchment of consumers, both of which set the stage for a larger-than-expected recession this year. Indeed, in its Quarterly Inflation Report released January 27, Mexico’s central bank slashed its GDP growth forecast range to a contraction of between -0.8% and -1.8% for 2009.
Getting worse before getting better: Even though Mexico’s industrial sector has been sluggish for most of 2008, conditions are set to get much worse before they get any better during 2009. Indeed, in the final months of 2008 it seems that the downturn intensified in Mexico’s industrial sector, as the US manufacturing slump worsened and demand from non-US exports partners dried up.
We forecast deeper rate cuts for Mexico in 2009, following Banco de Mexico’s decision to cut rates by 50bp on January 16. We expect the bank to ease rates by a total of 300bp this year, bringing rates down to 5.25% by end-2009 from 8.25% at the start of the year.
Mexico: IP and US ISM Manufacturing Index (IP: Six-month smoothed annualized rate of change)
30
35
40
45
50
55
60
65
70
Mar-99
Dec-99
Sep-00
Jun-01
Mar-02
Dec-02
Sep-03
Jun-04
Mar-05
Dec-05
Sep-06
Jun-07
Mar-08
Dec-08
-12%
-8%
-4%
0%
4%
8%
12%ISM Manufacturing PMI (LHS)Mexico IP
Source: ISM, INEGI, Morgan Stanley Latam Economics
12
M O R G A N S T A N L E Y R E S E A R C H
Central Bank Watch
January 28, 2009 The Global Monetary Analyst
Chile: Credit Tightening Intensifies Luis Arcentales (1 212) 761 4913
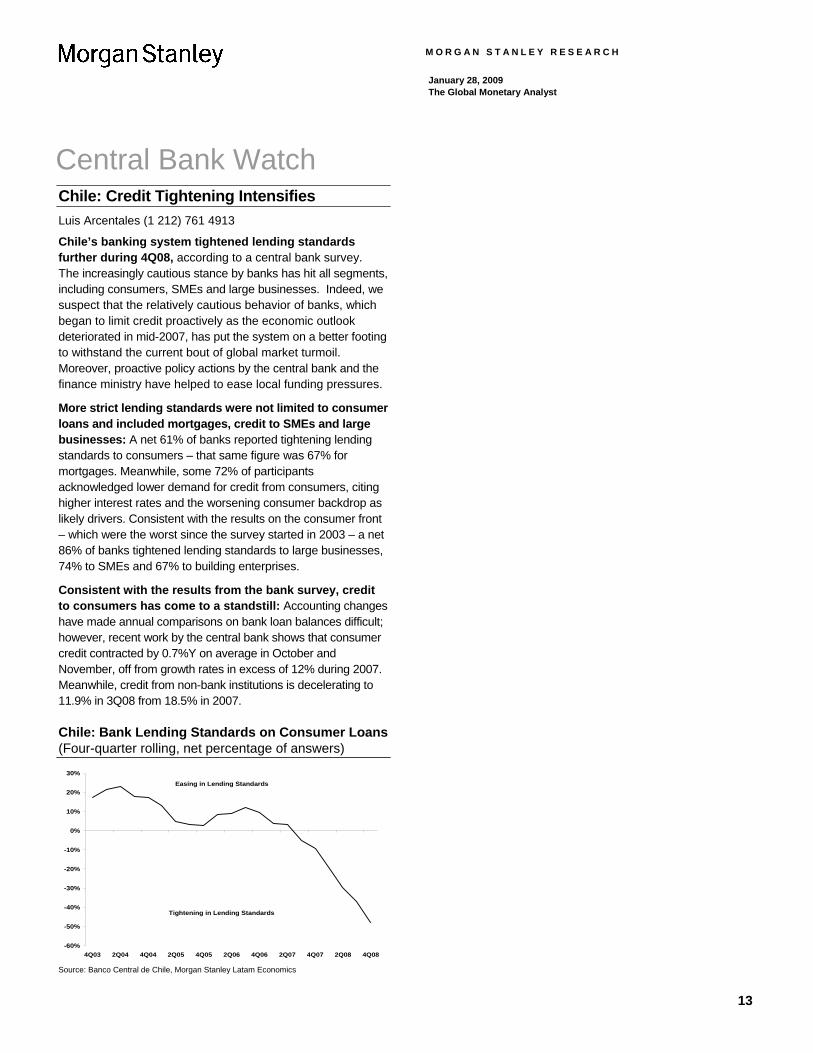
Chile’s banking system tightened lending standards further during 4Q08, according to a central bank survey. The increasingly cautious stance by banks has hit all segments, including consumers, SMEs and large businesses. Indeed, we suspect that the relatively cautious behavior of banks, which began to limit credit proactively as the economic outlook deteriorated in mid-2007, has put the system on a better footing to withstand the current bout of global market turmoil. Moreover, proactive policy actions by the central bank and the finance ministry have helped to ease local funding pressures.
More strict lending standards were not limited to consumer loans and included mortgages, credit to SMEs and large businesses: A net 61% of banks reported tightening lending standards to consumers – that same figure was 67% for mortgages. Meanwhile, some 72% of participants acknowledged lower demand for credit from consumers, citing higher interest rates and the worsening consumer backdrop as likely drivers. Consistent with the results on the consumer front – which were the worst since the survey started in 2003 – a net 86% of banks tightened lending standards to large businesses, 74% to SMEs and 67% to building enterprises.
Consistent with the results from the bank survey, credit to consumers has come to a standstill: Accounting changes have made annual comparisons on bank loan balances difficult; however, recent work by the central bank shows that consumer credit contracted by 0.7%Y on average in October and November, off from growth rates in excess of 12% during 2007. Meanwhile, credit from non-bank institutions is decelerating to 11.9% in 3Q08 from 18.5% in 2007.
Chile: Bank Lending Standards on Consumer Loans (Four-quarter rolling, net percentage of answers)
-60%
-50%
-40%
-30%
-20%
-10%
0%
10%
20%
30%
4Q03 2Q04 4Q04 2Q05 4Q05 2Q06 4Q06 2Q07 4Q07 2Q08 4Q08
Tightening in Lending Standards
Easing in Lending Standards
Source: Banco Central de Chile, Morgan Stanley Latam Economics
13
M O R G A N S T A N L E Y R E S E A R C H
January 28, 2009 The Global Monetary Analyst
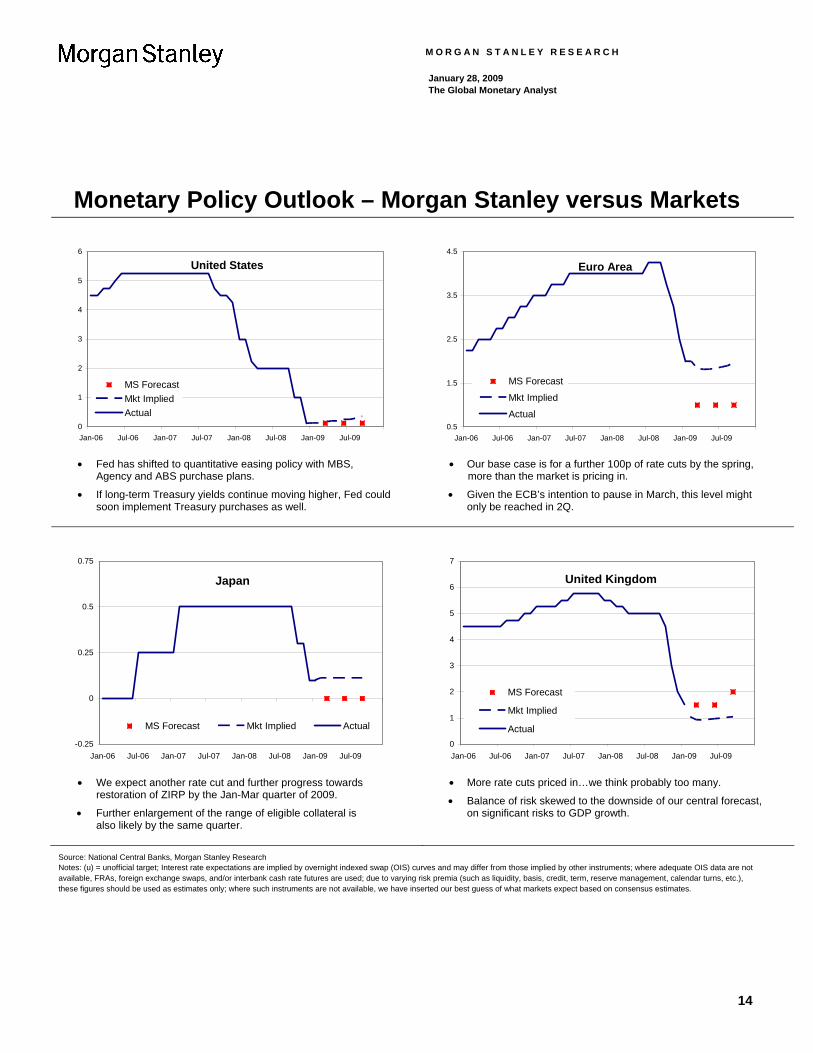
Monetary Policy Outlook – Morgan Stanley versus Markets
0
1
2
3
4
5
6
Jan-06 Jul-06 Jan-07 Jul-07 Jan-08 Jul-08 Jan-09 Jul-09
MS ForecastMkt ImpliedActual
United States
• Fed has shifted to quantitative easing policy with MBS,
Agency and ABS purchase plans.
• If long-term Treasury yields continue moving higher, Fed could soon implement Treasury purchases as well.
0.5
1.5
2.5
3.5
4.5
Jan-06 Jul-06 Jan-07 Jul-07 Jan-08 Jul-08 Jan-09 Jul-09
MS Forecast
Mkt Implied
Actual
Euro Area
• Our base case is for a further 100p of rate cuts by the spring,
more than the market is pricing in.
• Given the ECB’s intention to pause in March, this level might only be reached in 2Q.
-0.25
0
0.25
0.5
0.75
Jan-06 Jul-06 Jan-07 Jul-07 Jan-08 Jul-08 Jan-09 Jul-09
MS Forecast Mkt Implied Actual
Japan
• We expect another rate cut and further progress towards
restoration of ZIRP by the Jan-Mar quarter of 2009.
• Further enlargement of the range of eligible collateral is also likely by the same quarter.
0
1
2
3
4
5
6
7
Jan-06 Jul-06 Jan-07 Jul-07 Jan-08 Jul-08 Jan-09 Jul-09
MS Forecast
Mkt Implied
Actual
United Kingdom
• More rate cuts priced in…we think probably too many.
• Balance of risk skewed to the downside of our central forecast, on significant risks to GDP growth.
Source: National Central Banks, Morgan Stanley Research Notes: (u) = unofficial target; Interest rate expectations are implied by overnight indexed swap (OIS) curves and may differ from those implied by other instruments; where adequate OIS data are not available, FRAs, foreign exchange swaps, and/or interbank cash rate futures are used; due to varying risk premia (such as liquidity, basis, credit, term, reserve management, calendar turns, etc.), these figures should be used as estimates only; where such instruments are not available, we have inserted our best guess of what markets expect based on consensus estimates.
14
M O R G A N S T A N L E Y R E S E A R C H
January 28, 2009 The Global Monetary Analyst
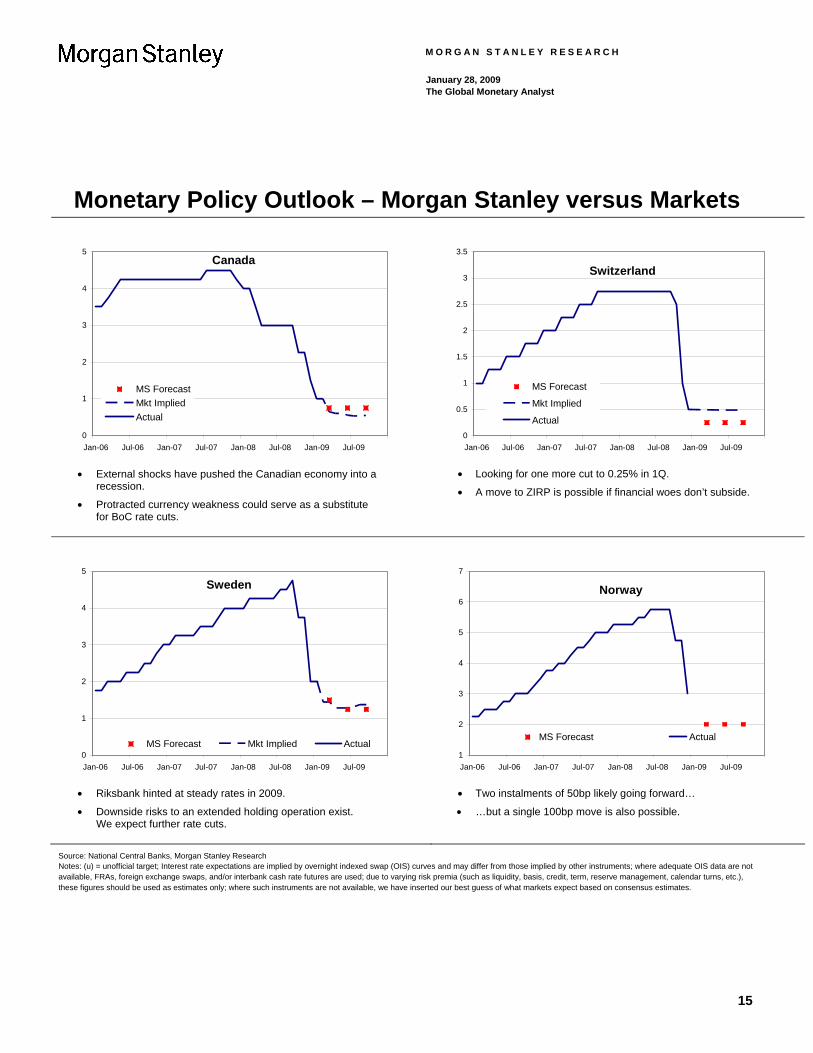
Monetary Policy Outlook – Morgan Stanley versus Markets
0
1
2
3
4
5
Jan-06 Jul-06 Jan-07 Jul-07 Jan-08 Jul-08 Jan-09 Jul-09
MS ForecastMkt ImpliedActual
Canada
• External shocks have pushed the Canadian economy into a
recession.
• Protracted currency weakness could serve as a substitute for BoC rate cuts.
0
0.5
1
1.5
2
2.5
3
3.5
Jan-06 Jul-06 Jan-07 Jul-07 Jan-08 Jul-08 Jan-09 Jul-09
MS Forecast
Mkt Implied
Actual
Switzerland
• Looking for one more cut to 0.25% in 1Q.
• A move to ZIRP is possible if financial woes don’t subside.
0
1
2
3
4
5
Jan-06 Jul-06 Jan-07 Jul-07 Jan-08 Jul-08 Jan-09 Jul-09
MS Forecast Mkt Implied Actual
Sweden
• Riksbank hinted at steady rates in 2009.
• Downside risks to an extended holding operation exist. We expect further rate cuts.
1
2
3
4
5
6
7
Jan-06 Jul-06 Jan-07 Jul-07 Jan-08 Jul-08 Jan-09 Jul-09
MS Forecast Actual
Norway
• Two instalments of 50bp likely going forward…
• …but a single 100bp move is also possible.
Source: National Central Banks, Morgan Stanley Research Notes: (u) = unofficial target; Interest rate expectations are implied by overnight indexed swap (OIS) curves and may differ from those implied by other instruments; where adequate OIS data are not available, FRAs, foreign exchange swaps, and/or interbank cash rate futures are used; due to varying risk premia (such as liquidity, basis, credit, term, reserve management, calendar turns, etc.), these figures should be used as estimates only; where such instruments are not available, we have inserted our best guess of what markets expect based on consensus estimates.
15
M O R G A N S T A N L E Y R E S E A R C H
January 28, 2009 The Global Monetary Analyst
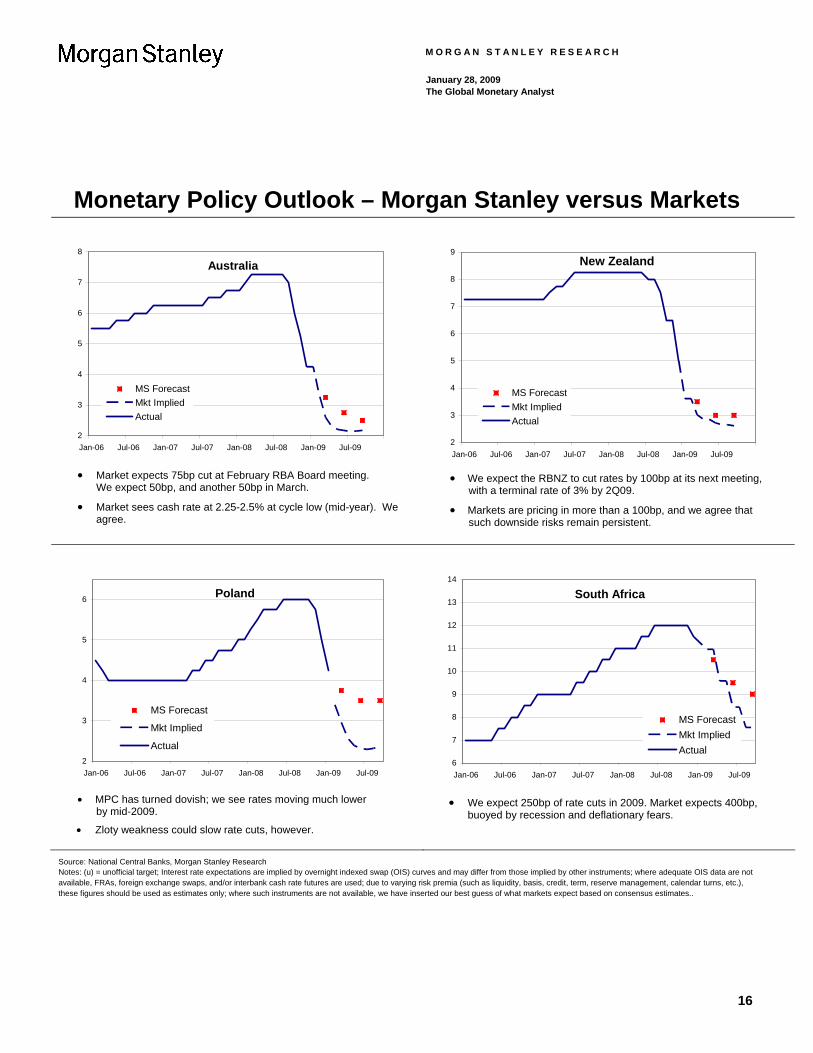
Monetary Policy Outlook – Morgan Stanley versus Markets
2
3
4
5
6
7
8
Jan-06 Jul-06 Jan-07 Jul-07 Jan-08 Jul-08 Jan-09 Jul-09
MS ForecastMkt ImpliedActual
Australia
• Market expects 75bp cut at February RBA Board meeting.
We expect 50bp, and another 50bp in March.
• Market sees cash rate at 2.25-2.5% at cycle low (mid-year). We agree.
2
3
4
5
6
7
8
9
Jan-06 Jul-06 Jan-07 Jul-07 Jan-08 Jul-08 Jan-09 Jul-09
MS ForecastMkt ImpliedActual
New Zealand
• We expect the RBNZ to cut rates by 100bp at its next meeting,
with a terminal rate of 3% by 2Q09.
• Markets are pricing in more than a 100bp, and we agree that such downside risks remain persistent.
2
3
4
5
6
Jan-06 Jul-06 Jan-07 Jul-07 Jan-08 Jul-08 Jan-09 Jul-09
MS Forecast
Mkt Implied
Actual
Poland
• MPC has turned dovish; we see rates moving much lower
by mid-2009.
• Zloty weakness could slow rate cuts, however.
6
7
8
9
10
11
12
13
14
Jan-06 Jul-06 Jan-07 Jul-07 Jan-08 Jul-08 Jan-09 Jul-09
MS ForecastMkt ImpliedActual
South Africa
• We expect 250bp of rate cuts in 2009. Market expects 400bp,
buoyed by recession and deflationary fears.
Source: National Central Banks, Morgan Stanley Research Notes: (u) = unofficial target; Interest rate expectations are implied by overnight indexed swap (OIS) curves and may differ from those implied by other instruments; where adequate OIS data are not available, FRAs, foreign exchange swaps, and/or interbank cash rate futures are used; due to varying risk premia (such as liquidity, basis, credit, term, reserve management, calendar turns, etc.), these figures should be used as estimates only; where such instruments are not available, we have inserted our best guess of what markets expect based on consensus estimates..
16
M O R G A N S T A N L E Y R E S E A R C H
January 28, 2009 The Global Monetary Analyst
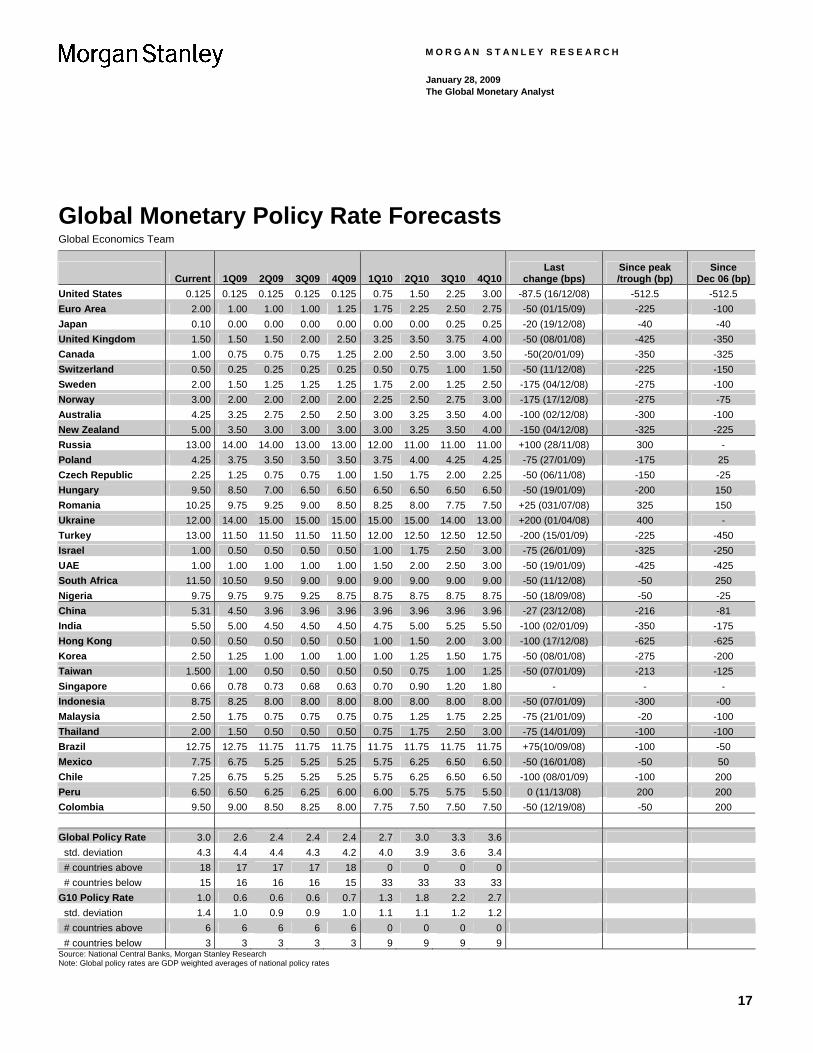
Global Monetary Policy Rate Forecasts Global Economics Team
Current 1Q09 2Q09 3Q09 4Q09 1Q10 2Q10 3Q10 4Q10
Last change (bps)
Since peak /trough (bp)
Since Dec 06 (bp)
United States 0.125 0.125 0.125 0.125 0.125 0.75 1.50 2.25 3.00 -87.5 (16/12/08) -512.5 -512.5 Euro Area 2.00 1.00 1.00 1.00 1.25 1.75 2.25 2.50 2.75 -50 (01/15/09) -225 -100 Japan 0.10 0.00 0.00 0.00 0.00 0.00 0.00 0.25 0.25 -20 (19/12/08) -40 -40 United Kingdom 1.50 1.50 1.50 2.00 2.50 3.25 3.50 3.75 4.00 -50 (08/01/08) -425 -350 Canada 1.00 0.75 0.75 0.75 1.25 2.00 2.50 3.00 3.50 -50(20/01/09) -350 -325 Switzerland 0.50 0.25 0.25 0.25 0.25 0.50 0.75 1.00 1.50 -50 (11/12/08) -225 -150 Sweden 2.00 1.50 1.25 1.25 1.25 1.75 2.00 1.25 2.50 -175 (04/12/08) -275 -100 Norway 3.00 2.00 2.00 2.00 2.00 2.25 2.50 2.75 3.00 -175 (17/12/08) -275 -75 Australia 4.25 3.25 2.75 2.50 2.50 3.00 3.25 3.50 4.00 -100 (02/12/08) -300 -100 New Zealand 5.00 3.50 3.00 3.00 3.00 3.00 3.25 3.50 4.00 -150 (04/12/08) -325 -225 Russia 13.00 14.00 14.00 13.00 13.00 12.00 11.00 11.00 11.00 +100 (28/11/08) 300 - Poland 4.25 3.75 3.50 3.50 3.50 3.75 4.00 4.25 4.25 -75 (27/01/09) -175 25 Czech Republic 2.25 1.25 0.75 0.75 1.00 1.50 1.75 2.00 2.25 -50 (06/11/08) -150 -25 Hungary 9.50 8.50 7.00 6.50 6.50 6.50 6.50 6.50 6.50 -50 (19/01/09) -200 150 Romania 10.25 9.75 9.25 9.00 8.50 8.25 8.00 7.75 7.50 +25 (031/07/08) 325 150 Ukraine 12.00 14.00 15.00 15.00 15.00 15.00 15.00 14.00 13.00 +200 (01/04/08) 400 - Turkey 13.00 11.50 11.50 11.50 11.50 12.00 12.50 12.50 12.50 -200 (15/01/09) -225 -450 Israel 1.00 0.50 0.50 0.50 0.50 1.00 1.75 2.50 3.00 -75 (26/01/09) -325 -250 UAE 1.00 1.00 1.00 1.00 1.00 1.50 2.00 2.50 3.00 -50 (19/01/09) -425 -425 South Africa 11.50 10.50 9.50 9.00 9.00 9.00 9.00 9.00 9.00 -50 (11/12/08) -50 250 Nigeria 9.75 9.75 9.75 9.25 8.75 8.75 8.75 8.75 8.75 -50 (18/09/08) -50 -25 China 5.31 4.50 3.96 3.96 3.96 3.96 3.96 3.96 3.96 -27 (23/12/08) -216 -81 India 5.50 5.00 4.50 4.50 4.50 4.75 5.00 5.25 5.50 -100 (02/01/09) -350 -175 Hong Kong 0.50 0.50 0.50 0.50 0.50 1.00 1.50 2.00 3.00 -100 (17/12/08) -625 -625 Korea 2.50 1.25 1.00 1.00 1.00 1.00 1.25 1.50 1.75 -50 (08/01/08) -275 -200 Taiwan 1.500 1.00 0.50 0.50 0.50 0.50 0.75 1.00 1.25 -50 (07/01/09) -213 -125 Singapore 0.66 0.78 0.73 0.68 0.63 0.70 0.90 1.20 1.80 - - - Indonesia 8.75 8.25 8.00 8.00 8.00 8.00 8.00 8.00 8.00 -50 (07/01/09) -300 -00 Malaysia 2.50 1.75 0.75 0.75 0.75 0.75 1.25 1.75 2.25 -75 (21/01/09) -20 -100 Thailand 2.00 1.50 0.50 0.50 0.50 0.75 1.75 2.50 3.00 -75 (14/01/09) -100 -100 Brazil 12.75 12.75 11.75 11.75 11.75 11.75 11.75 11.75 11.75 +75(10/09/08) -100 -50 Mexico 7.75 6.75 5.25 5.25 5.25 5.75 6.25 6.50 6.50 -50 (16/01/08) -50 50 Chile 7.25 6.75 5.25 5.25 5.25 5.75 6.25 6.50 6.50 -100 (08/01/09) -100 200 Peru 6.50 6.50 6.25 6.25 6.00 6.00 5.75 5.75 5.50 0 (11/13/08) 200 200 Colombia 9.50 9.00 8.50 8.25 8.00 7.75 7.50 7.50 7.50 -50 (12/19/08) -50 200 Global Policy Rate 3.0 2.6 2.4 2.4 2.4 2.7 3.0 3.3 3.6 std. deviation 4.3 4.4 4.4 4.3 4.2 4.0 3.9 3.6 3.4 # countries above 18 17 17 17 18 0 0 0 0 # countries below 15 16 16 16 15 33 33 33 33 G10 Policy Rate 1.0 0.6 0.6 0.6 0.7 1.3 1.8 2.2 2.7 std. deviation 1.4 1.0 0.9 0.9 1.0 1.1 1.1 1.2 1.2 # countries above 6 6 6 6 6 0 0 0 0 # countries below 3 3 3 3 3 9 9 9 9 Source: National Central Banks, Morgan Stanley Research Note: Global policy rates are GDP weighted averages of national policy rates
17
M O R G A N S T A N L E Y R E S E A R C H
January 28, 2009 The Global Monetary Analyst
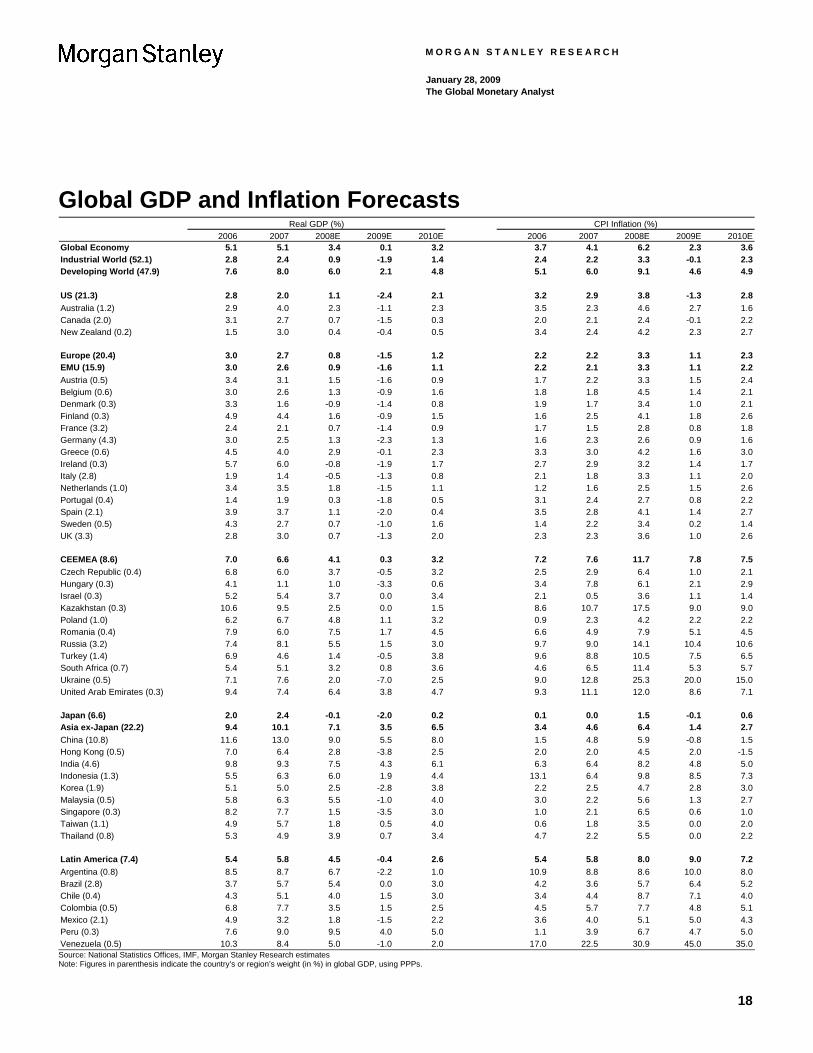
Global GDP and Inflation Forecasts 2006 2007 2008E 2009E 2010E 2006 2007 2008E 2009E 2010E
Global Economy 5.1 5.1 3.4 0.1 3.2 3.7 4.1 6.2 2.3 3.6Industrial World (52.1) 2.8 2.4 0.9 -1.9 1.4 2.4 2.2 3.3 -0.1 2.3Developing World (47.9) 7.6 8.0 6.0 2.1 4.8 5.1 6.0 9.1 4.6 4.9
US (21.3) 2.8 2.0 1.1 -2.4 2.1 3.2 2.9 3.8 -1.3 2.8Australia (1.2) 2.9 4.0 2.3 -1.1 2.3 3.5 2.3 4.6 2.7 1.6Canada (2.0) 3.1 2.7 0.7 -1.5 0.3 2.0 2.1 2.4 -0.1 2.2New Zealand (0.2) 1.5 3.0 0.4 -0.4 0.5 3.4 2.4 4.2 2.3 2.7
Europe (20.4) 3.0 2.7 0.8 -1.5 1.2 2.2 2.2 3.3 1.1 2.3EMU (15.9) 3.0 2.6 0.9 -1.6 1.1 2.2 2.1 3.3 1.1 2.2Austria (0.5) 3.4 3.1 1.5 -1.6 0.9 1.7 2.2 3.3 1.5 2.4Belgium (0.6) 3.0 2.6 1.3 -0.9 1.6 1.8 1.8 4.5 1.4 2.1Denmark (0.3) 3.3 1.6 -0.9 -1.4 0.8 1.9 1.7 3.4 1.0 2.1Finland (0.3) 4.9 4.4 1.6 -0.9 1.5 1.6 2.5 4.1 1.8 2.6France (3.2) 2.4 2.1 0.7 -1.4 0.9 1.7 1.5 2.8 0.8 1.8Germany (4.3) 3.0 2.5 1.3 -2.3 1.3 1.6 2.3 2.6 0.9 1.6Greece (0.6) 4.5 4.0 2.9 -0.1 2.3 3.3 3.0 4.2 1.6 3.0Ireland (0.3) 5.7 6.0 -0.8 -1.9 1.7 2.7 2.9 3.2 1.4 1.7Italy (2.8) 1.9 1.4 -0.5 -1.3 0.8 2.1 1.8 3.3 1.1 2.0Netherlands (1.0) 3.4 3.5 1.8 -1.5 1.1 1.2 1.6 2.5 1.5 2.6Portugal (0.4) 1.4 1.9 0.3 -1.8 0.5 3.1 2.4 2.7 0.8 2.2Spain (2.1) 3.9 3.7 1.1 -2.0 0.4 3.5 2.8 4.1 1.4 2.7Sweden (0.5) 4.3 2.7 0.7 -1.0 1.6 1.4 2.2 3.4 0.2 1.4UK (3.3) 2.8 3.0 0.7 -1.3 2.0 2.3 2.3 3.6 1.0 2.6
CEEMEA (8.6) 7.0 6.6 4.1 0.3 3.2 7.2 7.6 11.7 7.8 7.5Czech Republic (0.4) 6.8 6.0 3.7 -0.5 3.2 2.5 2.9 6.4 1.0 2.1Hungary (0.3) 4.1 1.1 1.0 -3.3 0.6 3.4 7.8 6.1 2.1 2.9Israel (0.3) 5.2 5.4 3.7 0.0 3.4 2.1 0.5 3.6 1.1 1.4Kazakhstan (0.3) 10.6 9.5 2.5 0.0 1.5 8.6 10.7 17.5 9.0 9.0Poland (1.0) 6.2 6.7 4.8 1.1 3.2 0.9 2.3 4.2 2.2 2.2Romania (0.4) 7.9 6.0 7.5 1.7 4.5 6.6 4.9 7.9 5.1 4.5Russia (3.2) 7.4 8.1 5.5 1.5 3.0 9.7 9.0 14.1 10.4 10.6Turkey (1.4) 6.9 4.6 1.4 -0.5 3.8 9.6 8.8 10.5 7.5 6.5South Africa (0.7) 5.4 5.1 3.2 0.8 3.6 4.6 6.5 11.4 5.3 5.7Ukraine (0.5) 7.1 7.6 2.0 -7.0 2.5 9.0 12.8 25.3 20.0 15.0United Arab Emirates (0.3) 9.4 7.4 6.4 3.8 4.7 9.3 11.1 12.0 8.6 7.1
Japan (6.6) 2.0 2.4 -0.1 -2.0 0.2 0.1 0.0 1.5 -0.1 0.6Asia ex-Japan (22.2) 9.4 10.1 7.1 3.5 6.5 3.4 4.6 6.4 1.4 2.7China (10.8) 11.6 13.0 9.0 5.5 8.0 1.5 4.8 5.9 -0.8 1.5Hong Kong (0.5) 7.0 6.4 2.8 -3.8 2.5 2.0 2.0 4.5 2.0 -1.5India (4.6) 9.8 9.3 7.5 4.3 6.1 6.3 6.4 8.2 4.8 5.0Indonesia (1.3) 5.5 6.3 6.0 1.9 4.4 13.1 6.4 9.8 8.5 7.3Korea (1.9) 5.1 5.0 2.5 -2.8 3.8 2.2 2.5 4.7 2.8 3.0Malaysia (0.5) 5.8 6.3 5.5 -1.0 4.0 3.0 2.2 5.6 1.3 2.7Singapore (0.3) 8.2 7.7 1.5 -3.5 3.0 1.0 2.1 6.5 0.6 1.0Taiwan (1.1) 4.9 5.7 1.8 0.5 4.0 0.6 1.8 3.5 0.0 2.0Thailand (0.8) 5.3 4.9 3.9 0.7 3.4 4.7 2.2 5.5 0.0 2.2
Latin America (7.4) 5.4 5.8 4.5 -0.4 2.6 5.4 5.8 8.0 9.0 7.2Argentina (0.8) 8.5 8.7 6.7 -2.2 1.0 10.9 8.8 8.6 10.0 8.0Brazil (2.8) 3.7 5.7 5.4 0.0 3.0 4.2 3.6 5.7 6.4 5.2Chile (0.4) 4.3 5.1 4.0 1.5 3.0 3.4 4.4 8.7 7.1 4.0Colombia (0.5) 6.8 7.7 3.5 1.5 2.5 4.5 5.7 7.7 4.8 5.1Mexico (2.1) 4.9 3.2 1.8 -1.5 2.2 3.6 4.0 5.1 5.0 4.3Peru (0.3) 7.6 9.0 9.5 4.0 5.0 1.1 3.9 6.7 4.7 5.0Venezuela (0.5) 10.3 8.4 5.0 -1.0 2.0 17.0 22.5 30.9 45.0 35.0
Real GDP (%) CPI Inflation (%)
Source: National Statistics Offices, IMF, Morgan Stanley Research estimates Note: Figures in parenthesis indicate the country’s or region’s weight (in %) in global GDP, using PPPs.
18
M O R G A N S T A N L E Y R E S E A R C H
January 28, 2009 The Global Monetary Analyst
Global Economics Team Richard Berner & Joachim Fels, Co-heads of Global Economics
Global Fixed Income Economics Joachim Fels Global [email protected] +44 (0)20 7425 6138 Manoj Pradhan Global [email protected] +44 (0)20 7425 3805 Spyros Andreopoulos Global [email protected] +44 (0)20 7677 0528
Americas
Richard Berner US [email protected] +1 212 761-3398 David Greenlaw US [email protected] +1 212 761-7157 Ted Wieseman US [email protected] +1 212 761-3407 David Cho US [email protected] +1 212 761-0908
Gray Newman Latam [email protected] +1 212 761-6510 Marcelo Carvalho Brazil [email protected] +55 11 3048-6272 Boris Segura Colombia, Peru, Venezuela [email protected] +1 212 761-0930 Luis Arcentales Chile, Mexico [email protected] +1 212 761-4913 Daniel Volberg Argentina [email protected] +1 212 761-0124 Europe & South Africa
Elga Bartsch Euro Area, ECB, Germany [email protected] +44 (0)20 7425 5434 Carlos Caceres Euro Area, Spain, France [email protected] +44 (0)20 7425 8943 David Miles UK [email protected] +44 (0)20 7425 1820 Melanie Baker UK [email protected] +44 (0)20 7425 8607 Oliver Weeks Russia, Kazakhstan, Ukraine [email protected] +44 (0)20 7677 6302 Tevfik Aksoy Turkey, MENA [email protected] +44 (0)20 7677 6917 Mohamed Jaber MENA [email protected] +44 (0)20 7677 8189 Pasquale Diana Poland, Hungary, Czech, Slovakia [email protected] +44 (0)20 7677 4183 Michael Kafe South Africa, Nigeria [email protected] +27 11 507 0891 Andrea Masia South Africa [email protected] +27 11 507 0887 Alina Slyusarchuk Russia, Kazakhstan, Ukraine, Baltics [email protected] +44 (0)20 7677 6869 Asia
Robert Feldman Japan [email protected] +81 3 5424 5385 Takehiro Sato Japan [email protected] +81 3 5424 5367 Takeshi Yamaguchi Japan [email protected] +81 3 5424 5387
Qing Wang Greater China [email protected] +852 2848 5220 Denise Yam China, Hong Kong [email protected] +852 2848 5301 Sharon Lam Korea, Taiwan [email protected] +852 2848 8927 Steven Zhang China, Hong Kong [email protected] +86 21 2326 0015 Katherine Tai China, Hong Kong, Korea, Taiwan [email protected] +852 2848 8191
Chetan Ahya ASEAN, India [email protected] +65 6834 6738 Deyi Tan Singapore, Malaysia [email protected] +65 6834 6703 Shweta Singh ASEAN [email protected] +91 22 2209 7928 Tanvee Gupta India [email protected] +91 22 2209 7927
19
M O R G A N S T A N L E Y R E S E A R C H
January 28, 2009 The Global Monetary Analyst
Disclosure Section The information and opinions in Morgan Stanley research were prepared or are disseminated by Morgan Stanley & Co. Incorporated and/or Morgan Stanley C.T.V.M. S.A. and/or Morgan Stanley & Co. International plc and/or Morgan Stanley Japan Securities Co., Ltd. and/or Morgan Stanley Asia Limited and/or Morgan Stanley Asia (Singapore) Pte. (Registration number 199206298Z) and/or Morgan Stanley Asia (Singapore) Securities Pte Ltd (Registration number 200008434H) and/or Morgan Stanley Taiwan Limited and/or Morgan Stanley & Co International plc, Seoul Branch, and/or Morgan Stanley Australia Limited (A.B.N. 67 003 734 576, holder of Australian financial services licence No. 233742, which accepts responsibility for its contents), and/or Morgan Stanley India Company Private Limited and their affiliates (collectively, "Morgan Stanley"). As used in this disclosure section, Morgan Stanley includes RMB Morgan Stanley (Proprietary) Limited, Morgan Stanley & Co International plc and its affiliates. For important disclosures, stock price charts and rating histories regarding companies that are the subject of this report, please see the Morgan Stanley Research Disclosure Website at www.morganstanley.com/researchdisclosures, or contact your investment representative or Morgan Stanley Research at 1585 Broadway, (Attention: Equity Research Management), New York, NY, 10036 USA. Global Research Conflict Management Policy Morgan Stanley Research observes our conflict management policy, available at www.morganstanley.com/institutional/research/conflictpolicies. Important Disclosures Morgan Stanley Research does not provide individually tailored investment advice. It has been prepared without regard to the circumstances and objectives of those who receive it. Morgan Stanley recommends that investors independently evaluate particular investments and strategies, and encourages them to seek a financial adviser's advice. The appropriateness of an investment or strategy will depend on an investor's circumstances and objectives. Morgan Stanley Research is not an offer to buy or sell any security or to participate in any trading strategy. The value of and income from your investments may vary because of changes in interest rates or foreign exchange rates, securities prices or market indexes, operational or financial conditions of companies or other factors. Past performance is not necessarily a guide to future performance. Estimates of future performance are based on assumptions that may not be realized. With the exception of information regarding Morgan Stanley, research prepared by Morgan Stanley Research personnel is based on public information. Morgan Stanley makes every effort to use reliable, comprehensive information, but we do not represent that it is accurate or complete. We have no obligation to tell you when opinions or information in Morgan Stanley Research change apart from when we intend to discontinue research coverage of a company. Facts and views in Morgan Stanley Research have not been reviewed by, and may not reflect information known to, professionals in other Morgan Stanley business areas, including investment banking personnel. To our readers in Taiwan: Morgan Stanley Research is distributed by Morgan Stanley Taiwan Limited; it may not be distributed to or quoted or used by the public media without the express written consent of Morgan Stanley. To our readers in Hong Kong: Information is distributed in Hong Kong by and on behalf of, and is attributable to, Morgan Stanley Asia Limited as part of its regulated activities in Hong Kong; if you have any queries concerning it, contact our Hong Kong sales representatives. Morgan Stanley Research is disseminated in Japan by Morgan Stanley Japan Securities Co., Ltd.; in Canada by Morgan Stanley Canada Limited, which has approved of and takes responsibility for its contents in Canada; in Germany by Morgan Stanley Bank AG, Frankfurt am Main, regulated by Bundesanstalt fuer Finanzdienstleistungsaufsicht (BaFin);in Spain by Morgan Stanley, S.V., S.A., a Morgan Stanley group company, supervised by the Spanish Securities Markets Commission(CNMV), which states that it is written and distributed in accordance with rules of conduct for financial research under Spanish regulations; in the US by Morgan Stanley & Co. Incorporated, which accepts responsibility for its contents. Morgan Stanley & Co. International plc, authorized and regulated by Financial Services Authority, disseminates in the UK research it has prepared, and approves solely for purposes of section 21 of the Financial Services and Markets Act 2000, research prepared by any affiliates. Private UK investors should obtain the advice of their Morgan Stanley & Co. International plc representative about the investments concerned. In Australia, Morgan Stanley Research and any access to it is intended only for "wholesale clients" within the meaning of the Australian Corporations Act. RMB Morgan Stanley (Proprietary) Limited is a member of the JSE Limited and regulated by the Financial Services Board in South Africa. RMB Morgan Stanley (Proprietary) Limited is a joint venture owned equally by Morgan Stanley International Holdings Inc. and FirstRand Investment Holdings Limited, which is wholly owned by FirstRand Limited. Trademarks and service marks in Morgan Stanley Research are their owners' property. Third-party data providers make no warranties or representations of the accuracy, completeness, or timeliness of their data and shall not have liability for any damages relating to such data. The Global Industry Classification Standard (GICS) was developed by and is the exclusive property of MSCI and S&P. Morgan Stanley bases projections, opinions, forecasts and trading strategies regarding the MSCI Country Index Series solely on public information. MSCI has not reviewed, approved or endorsed these projections, opinions, forecasts and trading strategies. Morgan Stanley has no influence on or control over MSCI's index compilation decisions. Morgan Stanley Research or portions of it may not be reprinted, sold or redistributed without the written consent of Morgan Stanley. Morgan Stanley research is disseminated and available primarily electronically, and, in some cases, in printed form. Additional information on recommended securities/instruments is available on request. The information in Morgan Stanley Research is being communicated by Morgan Stanley & Co. International plc (DIFC Branch), regulated by the Dubai Financial Services Authority (the DFSA), and is directed at wholesale customers only, as defined by the DFSA. This research will only be made available to a wholesale customer who we are satisfied meets the regulatory criteria to be a client. The information in Morgan Stanley Research is being communicated by Morgan Stanley & Co. International plc (QFC Branch), regulated by the Qatar Financial Centre Regulatory Authority (the QFCRA), and is directed at business customers and market counterparties only and is not intended for Retail Customers as defined by the QFCRA. As required by the Capital Markets Board of Turkey, investment information, comments and recommendations stated here, are not within the scope of investment advisory activity. Investment advisory service is provided in accordance with a contract of engagement on investment advisory concluded between brokerage houses, portfolio management companies, non-deposit banks and clients. Comments and recommendations stated here rely on the individual opinions of the ones providing these comments and recommendations. These opinions may not fit to your financial status, risk and return preferences. For this reason, to make an investment decision by relying solely to this information stated here may not bring about outcomes that fit your expectations.
20
M O R G A N S T A N L E Y R E S E A R C H
The Americas 1585 Broadway New York, NY 10036-8293 United States Tel: +1 (1)212 761 4000
Europe 20 Bank Street, Canary Wharf London E14 4AD United Kingdom Tel: +44 (0)20 7425 8000
Japan 4-20-3, Ebisu, Shibuya-ku, Tokyo 150-6008, Japan Tel: +81 (0)3 5424 5000
Asia/Pacific 1 Austin Road West Kowloon Hong Kong Tel: +852 2848 5200
© 2009 Morgan Stanley