Embed Size (px)
Citation preview
Global Foodservice Executive Topline Q1 2017 This document is for the sole use of The NPD Group and its employees. It may contain confidential and
privileged information. Any unauthorized review, use, disclosure, or distribution is prohibited.
Global Foodservice Executive Topline Q1 2017
The Bottom Line:
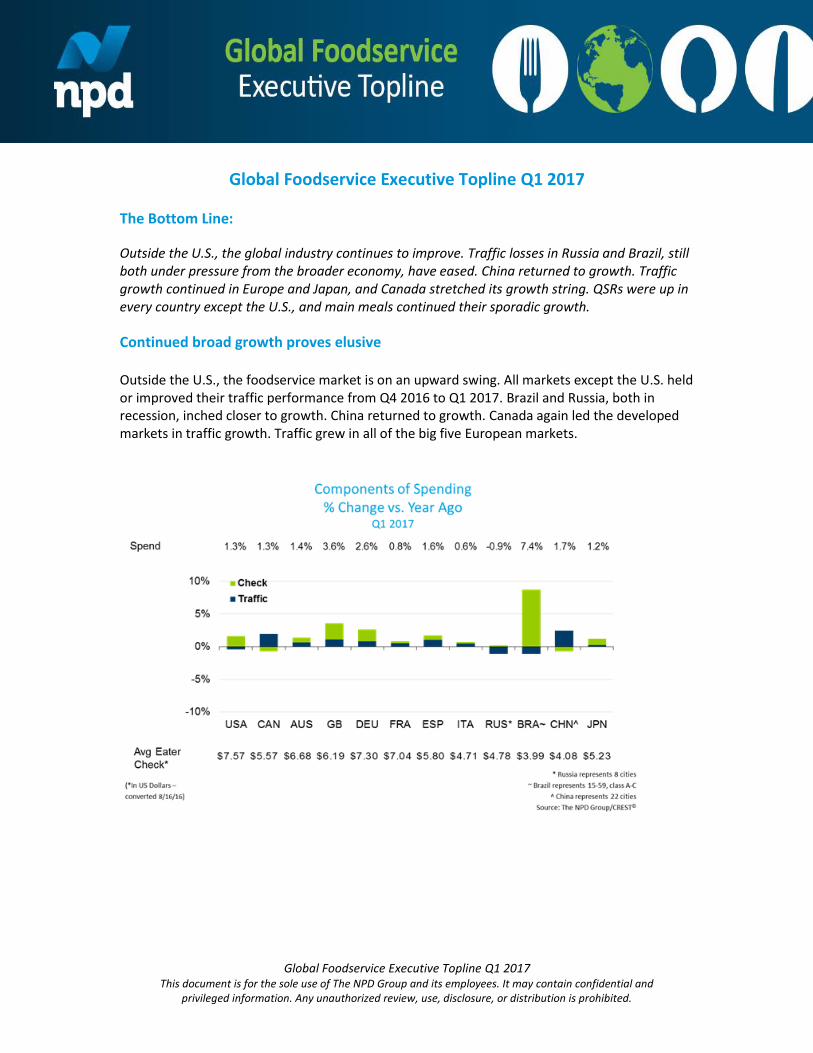
Outside the U.S., the global industry continues to improve. Traffic losses in Russia and Brazil, still both under pressure from the broader economy, have eased. China returned to growth. Traffic growth continued in Europe and Japan, and Canada stretched its growth string. QSRs were up in every country except the U.S., and main meals continued their sporadic growth.
Continued broad growth proves elusive Outside the U.S., the foodservice market is on an upward swing. All markets except the U.S. held or improved their traffic performance from Q4 2016 to Q1 2017. Brazil and Russia, both in recession, inched closer to growth. China returned to growth. Canada again led the developed markets in traffic growth. Traffic grew in all of the big five European markets.
Global Foodservice Executive Topline Q1 2017 This document is for the sole use of The NPD Group and its employees. It may contain confidential and
privileged information. Any unauthorized review, use, disclosure, or distribution is prohibited.
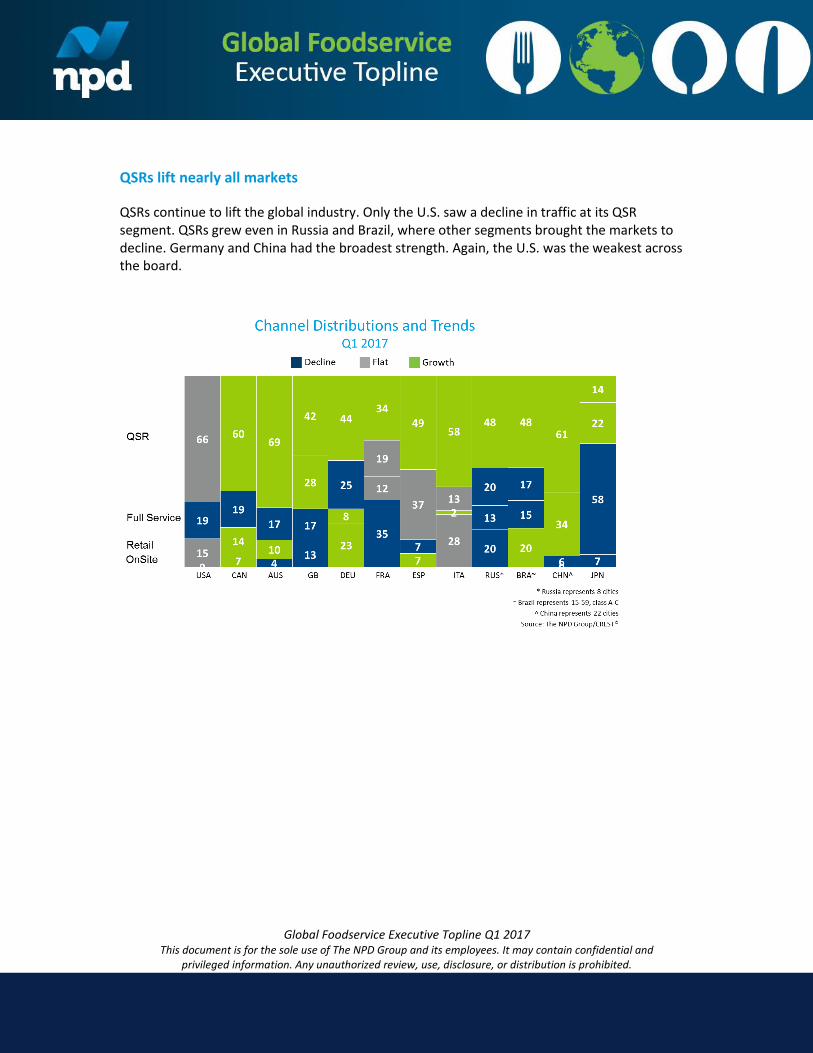
QSRs lift nearly all markets
QSRs continue to lift the global industry. Only the U.S. saw a decline in traffic at its QSR segment. QSRs grew even in Russia and Brazil, where other segments brought the markets to decline. Germany and China had the broadest strength. Again, the U.S. was the weakest across the board.
Global Foodservice Executive Topline Q1 2017
This document is for the sole use of The NPD Group and its employees. It may contain confidential and privileged information. Any unauthorized review, use, disclosure, or distribution is prohibited.
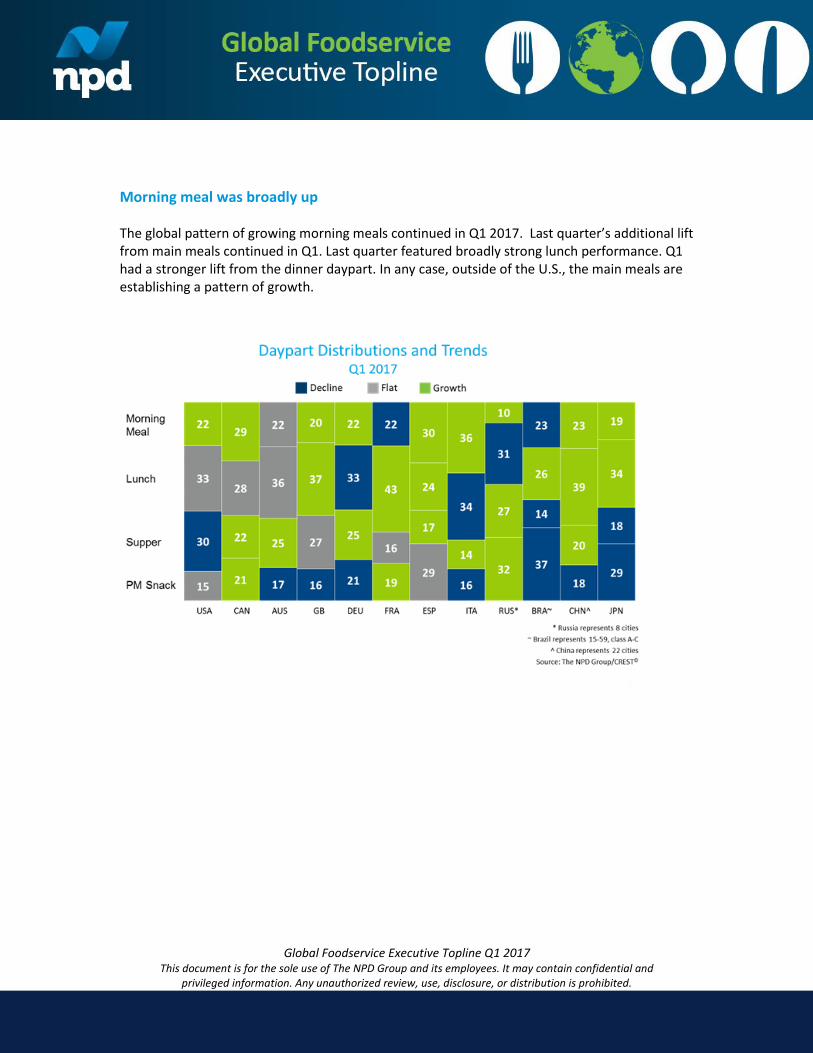
Morning meal was broadly up The global pattern of growing morning meals continued in Q1 2017. Last quarter’s additional lift from main meals continued in Q1. Last quarter featured broadly strong lunch performance. Q1 had a stronger lift from the dinner daypart. In any case, outside of the U.S., the main meals are establishing a pattern of growth.
Global Foodservice Executive Topline Q1 2017 This document is for the sole use of The NPD Group and its employees. It may contain confidential and
privileged information. Any unauthorized review, use, disclosure, or distribution is prohibited.
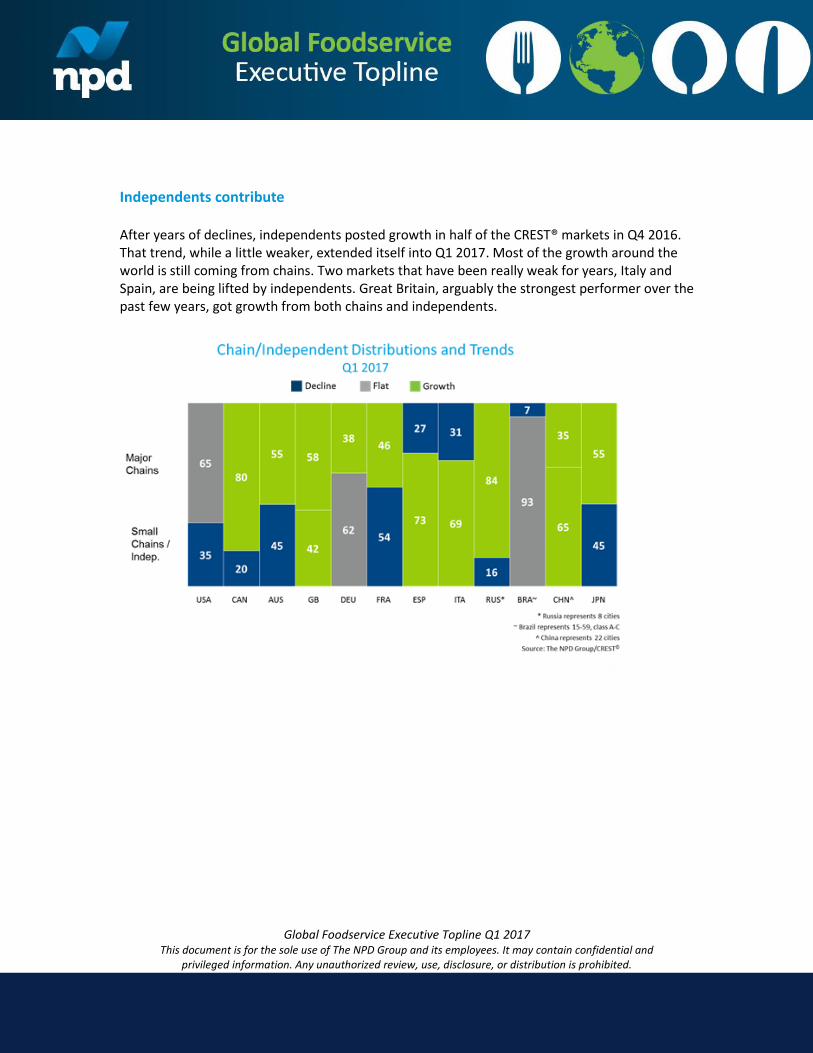
Independents contribute After years of declines, independents posted growth in half of the CREST® markets in Q4 2016. That trend, while a little weaker, extended itself into Q1 2017. Most of the growth around the world is still coming from chains. Two markets that have been really weak for years, Italy and Spain, are being lifted by independents. Great Britain, arguably the strongest performer over the past few years, got growth from both chains and independents.
Global Foodservice Executive Topline Q1 2017
This document is for the sole use of The NPD Group and its employees. It may contain confidential and privileged information. Any unauthorized review, use, disclosure, or distribution is prohibited.
Australia
The Australian economy is forecast to have GDP growth of +1.9 percent in Q1 2017, which is similar to the growth seen in Q4 2016. This cautious forecast is due to a decline in business investment, exacerbated by a slowdown in housing construction. Additionally unemployment has seen a slight increase to 5.8 percent, and household debt to disposable income has reached a record high. Though the cash rate is at a record low of 1.5 percent, consumers are worried that the cash rate may rise later this year. These factors have led to a Consumer Confidence Index of 98.9 points this quarter. This pessimistic outlook likely has contributed to slowed growth in the foodservice industry. CREST shows consumer spending growth in the foodservice industry slowed to +1 percent this quarter from +4 percent in the previous quarter. Foodservice spending growth sourced almost equivalently to both visits and average eater cheque. Though overall industry growth was slow, a positive note was that consumer spending grew in all three channels, with the greatest growth in the retail channel. Retail saw spend gains of +3 percent, sourcing primarily to traffic as average eater cheque remained flat. QSR spend growth (+2 percent) sourced equally to both consumer visits and average eater cheque. Meanwhile, FSR experienced a decrease in visits, but an increase in average eater cheque, as spend increased by +1 percent. The rise in retail in conjunction with a struggling FSR channel reflected the weaker consumer sentiment, amongst other macroeconomic factors. Consumers made decisions through their wallets as they traded down to the value-led QSR and retail options. Whilst this trade-down was not a new trend, and it is one we have talked about over the past year, it’s worth noting the increasing contribution to industry growth made by the retail segment made over the last two quarters relative to its size. Retail contributed for 22 percent of the growth in the industry while accounting for just 10 percent of total traffic. The growth in retail was primarily seen at weekdays through the working consumer and the continuation of consumers buying meals to eat at home, which was a strong growth driver for the retail channel. Supermarkets saw growth with time-poor families at weekday dinner, while convenience stores resonated with the working consumer at weekday snacking occasions. QSR’s traffic growth also stemmed from the working consumer at weekday morning meal and, additionally, from young families at weekend lunch. This was the first time deal-led occasions grew in QSR since mid-2014, with both families and adult-only parties contributing to the growth. It was also the first time non-deal-led occasions declined at QSRs since late 2013, with the losses coming from adult-only parties as they opted for more value and combo meals. Families were the driver of growth this quarter as adult-only parties declined in all
Global Foodservice Executive Topline Q1 2017 This document is for the sole use of The NPD Group and its employees. It may contain confidential and
privileged information. Any unauthorized review, use, disclosure, or distribution is prohibited.
three main segments. As mentioned, families had strong growth with the retail channel on weekdays as home-based occasions were the dominant consumption behavior. This reversed on the weekend as they looked to go out on the dinner occasions. This behaviour had a positive impact on both the QSR and FSR channels. Young Millennials pulled back on their use of restaurants this quarter. The QSR channel had the greatest losses from this demographic. Underemployment of young people was the highest it has been in 40 years, and with tightening finances, this is likely a significant contribution to the decline of this age group in the foodservice industry. In summary, QSR operators and manufacturers need to engage with the families more and continue to innovate with their value offerings as cautious spending dominates the industry in uncertain economic times.
Brazil
CREST Brazil in the first quarter of 201 showed the trends from 2016 have carried over into 2017, but they are losing strength. The traffic was still down by 4 percent, but spend grew + 5 percent due to an average ticket increase of +9 percent (YOY, YE March 2017). On the other hand, analyzing the quarterly trends, Q1 traffic was 3.5 billion visits, the same number as in Q4 2016, when we expected to have more visits due to higher economic activity. This tells us the negative trend is still in the market, but it might be losing strength. The same trend was seen in average ticket, which grew +9.5 percent in the annual comparison (1Q17 x 1Q16), but grew only 0.7 percent in the quarterly comparison (1Q17 x 4Q16). Consumers are still rewarding channels in the consumption moments when they are authority and in the dayparts in which they have the best offer, like bakeries for morning meal and buffet restaurants (por quilos) during lunch. Therefore, channels are gaining share in the dayparts in which they are authority, but they are also losing share in the ones they are not. Like in 2016, we still see a reduction in traffic of big groups (+5 persons) of -17 percent in the annual comparison, but groups with children, which lost 14 percent of traffic in 2016, now are stable in the quarterly comparison. Brazilians are more rational in their choices. Analyzing the reasons for visits, we see convenience and habit that are the main reasons in Brazil, and these are stable. Food-related reasons and price/promotion reasons are growing; in fact, the number of meals with promotions grew +6 percent in the annual comparison. The Brazilian economic scenario became volatile in mid-May due to political instability, when new information about the president’s involvement in corruption became public. With this new fact, the current government lost support in Congress
Global Foodservice Executive Topline Q1 2017
This document is for the sole use of The NPD Group and its employees. It may contain confidential and privileged information. Any unauthorized review, use, disclosure, or distribution is prohibited.
and may not be able to approve the economic measures that were being discussed. Economists are already revising their projections to a worst-case scenario for 2017, but it is still too soon to measure the impacts of the new scenario.
Canada
Canada’s real GDP grew +0.6 percent in the fourth quarter of 2016, slowing from +0.9 percent growth in the previous quarter. The unemployment rate declined to 6.6 percent, while inflation was +2 percent on a year-over-year basis in February. Menu inflation remained stable at +2.3 percent in February; inflation for food purchased from stores declined to -4.1 percent. In February, the Conference Board of Canada’s Index of Consumer Confidence reached its highest level in two years, rising to 110.6 (2014 = 100). CREST shows consumer spending at Canadian foodservice outlets in Q1 2017 grew by +2 percent compared to the same period a year ago. This is the same as Q4 2016, when total spend at Canadian foodservice increased by +2 percent as well. The increase in consumer spending for Q1 was primarily driven by consumer traffic to Canadian foodservice, which went up by +3 percent on the quarter. Average eater cheque declined by -1 percent, limiting the growth of consumer spend. In terms of time of day, traffic increased at all four dayparts. PM snack drove traffic in Q1 and grew by +5 percent, while morning meal and supper matched the total day growth at +3 percent. Lunch lagged at +1 percent growth on the quarter. Average eater cheque grew by +3 percent at PM snack while the remaining dayparts saw a decline. The biggest challenge was seen primarily in the full service restaurant segment in Canada when it comes to overall spend. QSR and retail drove growth. Looking at consumer spending by segments for the quarter, QSR increased +3 percent compared to Q1 a year ago. On the other hand, FSR spend declined by -2 percent compared to the same period last year. On-site spend grew by +2 percent, while spend at retail posted strong growth of over +15 percent. Traffic performance for the quarter was similar. QSR grew by +2 percent, while FSR saw a decline of -4 percent. On-site traffic grew by +1 percent, and retail traffic grew by over +15 percent compared to the same period last year. The traffic growth at QSR was primarily driven by QSR chicken, which increased by +6 percent compared to the same period a year ago. The two largest categories, QSR donut and QSR burger, grew by +3 percent and +2 percent respectively. On the other hand, QSR sandwich and QSR pizza declined by -3 percent and -2 percent respectively. More and more operators are focusing on consumer demands such as “never frozen”, “Canadian” and “all natural” to attract them. Technology-enabled convenience in the form of kiosks, mobile apps, and delivery services such as Uber Eats, Just Eat, Foodora, and others are changing the industry landscape.
Global Foodservice Executive Topline Q1 2017 This document is for the sole use of The NPD Group and its employees. It may contain confidential and
privileged information. Any unauthorized review, use, disclosure, or distribution is prohibited.
China
According to the National Bureau of Statistics, China's economy rebounded in Q1 2017. The GDP growth rate in China reached +6.9 percent year on year, the fastest in the most recent six quarters. Disposable income growth picked up to reach +7.0 percent in Q1, 2017, also the fastest since the end of 2015. The positive sign on the consumer front was that Consumer Confidence Index of 110 hit its highest level in nearly two years. The accommodation and catering market grew by +7.4 percent, a noticeable increase compared with the same period last year. The overall positive macro economy, with the growth of CPI remaining stable, created many more opportunities for manufacturers and foodservice operators, especially in Q1 when consumption is largely driven by holiday celebrations (e.g., Chinese New Year period). CREST reports that among the 22 cities monitored in China, consumer spending in the foodservice market grew by +2 in the first quarter, and traffic grew +3 percent. The second-tier cities grew almost three times as much as first-tier cities in traffic, indicating strong consumption in lower-tier cities. The foodservice market, as always, experienced strong demand in Q1 due to Chinese New Year Golden Week. WQSR was the biggest winner with +6 percent growth in traffic, driven by intensive new launches and diversified marketing campaigns with trendy themes and hot celebrities. FSR, as the biggest share owner, also grew traffic by +5 percent. CREST also shows that the spending in coffee shops and tea houses increased by +2 percent, driven by traffic growth. Retail lost most in traffic within CREST coverage. In the first quarter of 2017, the foodservice industry benefited most from on-premises growth, which was up +6 percent. It seemed consumers showed particular enthusiasm for dining out during this period. It was also a quarter for operators to organize appealing campaigns to expand the current buyer base and increase cheque size accordingly. Menu innovation, premiumization, and promotion were tactics frequently used. The delivery market kept flat versus the same period last year, but WQSR delivery maintained its strong growth momentum with double-digit traffic growth. In Q1 2017, CREST revealed dinner and lunch saw +6 percent and +3 percent increases, respectively, in spending compared to a year ago. This is probably linked to the holiday season. Many Chinese continue to change their habit from eating at home to dining out to celebrate and to spend time with family and friends during the holidays. The traffic surge of dinner this quarter took place in Tier 1 cities as well as in Tier 2 cities, while the lunch increase was only driven by Tier 1 cities. Foodservice operators and product manufacturers may want to consider a differentiation strategy based on consumer behavior preferences cross city tiers.
Global Foodservice Executive Topline Q1 2017
This document is for the sole use of The NPD Group and its employees. It may contain confidential and privileged information. Any unauthorized review, use, disclosure, or distribution is prohibited.
France
Economic growth was disappointing in Q1 2017, closing a disappointing term for outgoing President Hollande in France. According to the first estimate released by the Statistical Office (INSEE) on 28 April, GDP growth moderated from a revised +0.5 percent seasonally-adjusted quarter-on-quarter expansion in the final quarter of 2016 to a soft +0.3 percent increase in the first quarter of this year. In annual terms, the economy expanded at a more than two-year low of 0.8 percent in the first quarter. The French economy was dragged down by a slowdown in the domestic economy and an abysmal performance by the external sector. Despite the economic slowdown, the foodservice industry came back to growth with +1 percent in traffic, which is equal to the gain of 10 million additional visits compared to the first quarter of 2016, shown by CREST. As a result, consumer spending also increased (+1 percent) while the average cheque was flat. The quick service segment was the key contributor to the market growth; its visits were boosted by +2 percent while other segments were flat or negative. This trend confirmed the progressive move of the French toward QSR lunch and dining options instead of the classic full service restaurants that have been slow to renew their codes and style of service. The burger segment (due to new chain development such as Burger King, but also small fast casual players in the segment), chicken, sandwich / bakeries, and coffee shops were the main drivers of this growth. Coffee shops did well in France due to new openings and a non-saturated market for the “white cup.” As for the full service segment, it was flat with some rare spots of growth, such as Italian full service restaurants still being positive (+1 percent in visits), but the overall segment was still depressed. In terms of dayparts, breakfast declined -4 percent in visits for the total industry (mainly affected by the sharp drop of breakfast occasions in on-site canteens and FSR). On the other hand, breakfast was the most dynamic daypart in the QSR segment (+7 percent), mostly driven by new options offered by sandwich / bakeries and coffee shops. Lunch had some recovery (+3 percent), driven by both the QSR and FSR segments. Dinner was stable. With a more positive outlook for 2017, much needed improvement in foodservice industry traffic is expected. The key growth drivers are expected to be fast casual, delivery, and breakfast and lunch options, based on convenience and good food quality.
Germany
The German economy continued to show gratifying development in Q1 2017. Overall, domestic demand increased in both the construction sector and in industry. The international environment also slightly improved, which should benefit German exports. Private consumption also got a boost, which is expected to be supported by very positive labour marketdevelopments. Finally, consumer confidence in Germany also showed slight recovery compared to the entire period of the previous year (source: European Commission), but it still remains slightly negative.
Global Foodservice Executive Topline Q1 2017 This document is for the sole use of The NPD Group and its employees. It may contain confidential and
privileged information. Any unauthorized review, use, disclosure, or distribution is prohibited.
CREST shows traffic grew +1 percent in the German foodservice market in the first quarter. Together with +2 percent growth in average eater check, this resulted in a gain of +3 percent in total consumer spending. The on-site sector (workplace and education), which grew by +2 percent in visits, was the main driver of the positive number of visits. But fast food restaurants (QSR) and the retail sector gained by +1 percent compared to the same quarter in the previous year. Only full service restaurants declined, down -1 percent. The upward trend in the on-site sector was once again driven by increased numbers of guests in school catering and the workplace. In the area of fast food restaurants, the drivers of visitor growth were the chicken, coffee bar, and pizza categories. Fish fast food restaurants and Greek snacks declined. In the retail market there was again a two-fold picture. Classic commercial department store restaurants suffered losses. Prepared food from supermarkets grew. The decline in full service restaurants was primarily the result of losses for steakhouses and fish restaurants. On the other hand, there were increases at Italian and Mexican restaurants. How did the different influencing factors of gastronomy develop? Chains, in particular, contributed strongly to visitor growth; smaller chains and independent businesses stayed more or less flat. In terms of dayparts, there was the strongest increase in guest growth at breakfast, but evening also increased, while lunch and snacking fell. Business was also positive in “during the week consumption,” to-go, and family occasions. On the other hand, there were declines in on the weekend and in on-site consumption.
Great Britain
The U.K. GDP grew by just +0.3 percent in Q1 2017. This was less than economists had forecast and represented a slowdown from the +0.7 percent growth in the final quarter of 2016. The slowdown was driven predominantly by the services sector, with hotels and restaurants both seeing a fall in output. This slowdown is predicted to continue as consumers face increasing pressures on their income due to rising inflation and slowing employment and wage growth; already consumer confidence dipped back down to -7 in April this year. In the face of these tough macro conditions, CREST reports that the foodservice industry continued to perform well. In Q1 this year, foodservice consumer spending grew +4 percent. This was driven by traffic growth, up +1 percent, and average eater cheque, up +3 percent. The strongest sectors were QSR (traffic +3 percent) and full service (traffic +2 percent) – both outperformed the total market in terms of traffic growth. Traffic growth is important, as reliance on price increases will mean that in time consumers will feel that they can no longer afford to eat out in these sectors. Already the foodservice market saw declines in traffic amongst parties with kids,
Global Foodservice Executive Topline Q1 2017
This document is for the sole use of The NPD Group and its employees. It may contain confidential and privileged information. Any unauthorized review, use, disclosure, or distribution is prohibited.
down -3 percent, as parents could no longer afford to take the whole family out for a meal. Full service restaurants have been hit hardest by this, with traffic down -5 percent, despite efforts from pubs and restaurants to attract families with “kids eat free” promotions. Rising prices have not stopped adult-only parties however; traffic for this group increased +3 percent across both QSR and full service restaurants. All traffic growth in foodservice was through weekday out-of-home eating occasions, up +4 percent, as weekend traffic declined by -6 percent. Morning meal continued to be the strongest-performing daypart, with traffic up +7 percent, growing across all sectors. Lunch also continued to grow traffic (+4 percent), driven mainly by QSR( +8 percent). Chains within this sector successfully attracted consumers by showcasing good value for money while also maintaining high quality food and beverages. Dinner traffic was static. Growth from QSR was offset by declines in on-premise visits at dinner, down -3 percent, across all sectors. Fewer consumers went out to eat at restaurants for dinner – instead, they chose to buy food and eat it at home. Traffic here increased by +5 percent, predominantly within the QSR sector, up +6 percent. Although dinner saw on-premise declines, total out-of-home on-premise traffic increased by +1 percent in Q1 2017, an improvement from declines in Q4 2016. QSR and on-site contributed to the growth of on-premise. Several QSR chains invested in refurbishing their outlets, improving their ambience, and making consumers more likely to eat in. Getting the basics right is becoming increasingly important, as consumers’ wallets are increasingly squeezed. They have to feel that they are getting value for money and quality food, in premises that have a great atmosphere. The foodservice industry needs to continue to deliver across all these basics to continue growing. Currently it is one of the more resilient industries, with major chains up +1 percent and small chains/independents up +2 percent.
Italy
Available indicators released by Banca d’Italia indicate that in Q1 2017, the Italian economy continued to expand to a measurable figure of around +0.2 percent on the previous quarter. Growth in service activity was more than offset by the weakening of manufacturing. In addition, according to Banca d’Italia, the industry sentiment on the current economic situation improved. The widespread improvement in confidence in both the manufacturing and retail sectors was confirmed by the data released by ISTAT and by the Consumer Confidence Index that also grew slightly in March. The merit of the increase is essentially attributable to the improvement of the perception on current and future economic situation. As in the entire Euro area, consumer prices in Italy accelerated. In the first quarter, inflation averaged +1.3 percent, reaching the highest levels in the last four years. Household and business inflation expectations have been revised upwards, but are still contained. The foodservice market continued to grow in the first quarter of the year. CREST
Global Foodservice Executive Topline Q1 2017 This document is for the sole use of The NPD Group and its employees. It may contain confidential and
privileged information. Any unauthorized review, use, disclosure, or distribution is prohibited.
data shows there was moderate traffic growth of +1 percent over the first quarter of last year and acceleration in spending by +1 percent. Growth was driven by quick service restaurants, showing a +1 percentage point increase in spending, while full service remained stable both in traffic and in spending. Although the market had a generally positive trend, a recovery was not yet really concrete, reflecting the economic situation in the country. Lunch and families curbed growth rates in this first quarter. Lunch, registering a -2 percent drop in traffic, indicates how growth has not yet affected the most functional occasions. More worrying, however, is the -4 percent drop in family visits. This target has actually started moving away, suggesting a more profound and structural crisis in the foodservice offer that is no longer able to attract this target, which has maintained its presence out of home even in greater periods of uncertainty in the past years.
Japan
The Japanese economy continued on a gradual positive trajectory, with the Bank of Japan announcing in April that the economy had seen “a moderate expansion.” Exports, in particular, remained strong. However, despite gradual improvements and a tight labor market, consumers still appeared cautious and the Bank of Japan concluded that inflation expectations “remained in a weakening phase.” CREST reveals foodservice market traffic was flat in Q1 2017. Traffic growth at quick service restaurants and full service restaurants was offset by traffic declines at retail and on-site, the two segments with the lowest average eater check. Quick service restaurants saw the strongest growth in consumer spending (+3 percent), driven by traffic growth of +3 percent. Full service restaurants also saw spending grow +2 percent, driven by increased traffic (+2 percent). Meanwhile, retail saw spending flat as traffic declined -1 percent and average eater check increased +1 percent. In the total market, weekend traffic increases of +2 percent were offset by weekday traffic declining -1 percent. Quick service restaurants were the only segment to see traffic grow at weekend (+2 percent) and weekday (+3 percent). Morning meal (+4 percent) and lunch (+1 percent) both saw traffic increases. Morning meal traffic grew across most segments, while lunch traffic grew +4 percent at quick service restaurants and +2 percent at full service restaurants. Within quick service restaurants, burger restaurants continued to see strong traffic growth (+6 percent), resulting in spending growth of +7 percent. Within retail, convenience stores continued to see traffic grow, although growth was a relatively weak +1 percent. Meanwhile, other retail (mainly supermarkets) saw traffic decline by -2 percent. As a result, overall retail traffic declined -1 percent.
Russia
The Russian economy showed signs of improvement in early 2017. All macroeconomic indicators improved. GDP grew +0.3 percent in Q1’2017 (vs. -3.8 percent year ago) and inflation eased to +4 percent growth. It seems as if the long-awaited recovery has started, but experts forecast it will be a slow and long process.
Global Foodservice Executive Topline Q1 2017
This document is for the sole use of The NPD Group and its employees. It may contain confidential and privileged information. Any unauthorized review, use, disclosure, or distribution is prohibited.
Consumer confidence stayed negative (-15) in Q1’2017. CREST reports traffic in Russia’s foodservice industry declined -1 percent in Q1 2017 vs. year ago. This decline was fully attributed to the “leap year effect,” which resulted in fewer days in Q1 this year compared to 2016. So, in essence, the foodservice industry has stopped declining, and recovery is expected to continue. Consumer spending was down -1 percent as average check stayed unchanged. QSR kept growing. Traffic was up +7 percent in Q1 2017 due to continuing unit expansion. The full service sector remained the key source of traffic weakness, declining -13 percent. It suffered more than other segments due to higher prices and outmoded style. On-site canteens and retail (ready-to-eat food and drinks) also declined despite lower check size, showing -5 and -3 percent of traffic outflow respectively. Canteens’ average check rose by +13 percent. Lowering of employers’ subsidies resulted in growing end prices for employees, pushing them away from canteens. Fast casual in Russia is still tiny, less than 1 percent in traffic, but it is the fastest increasing category, showing double-digit growth last year. This format is not new but only now, with the crisis, has it started to grow. It attracts consumers who cannot afford to visit restaurants as often as before, but who don’t want to switch to QSR as they appreciate comfort and food quality. As for retail, despite the overall traffic decline, there was visible growth at gas stations (+5 percent). This format grew in popularity among Russian consumers due to the accelerating pace of life and available parking in the big cities. Gas stations as a foodservice channel were modest (less than 2 percent of total market) but they are rapidly expanding. Among 25,000 gas stations in Russia, only 8 percent have a cafe inside or near. This is a great opportunity for foodservice operators! Major chains managed to increase traffic by +3 percent, while independents were heavily impacted by consumer outflow. Consumer loyalty to specific brands is very strong in Russia and became even stronger during the crisis. This factor supported chain growth, as did massive advertising campaigns and promotions. QSR grew because burger concepts were up +19 percent in visits in Q1 2017. These are presented in Russia mostly by international chains. The pizza segment (+9 percent) and bakeries (+14 percent) were also up. Other QSR concepts continued to suffer traffic declines. Russian and Asian fast food places continued to be the weakest QSR category, each losing -30 percent traffic. Visits declined at lunch (-9 percent), while other occasions grew between 1 and 6 percent in Q1 2017. Morning meal and PM snack grew, thanks in large part to QSR. The Russian foodservice landscape is changing, reflecting consumers’ new needs. New and peripheral formats entering market are stealing share from existing
Global Foodservice Executive Topline Q1 2017 This document is for the sole use of The NPD Group and its employees. It may contain confidential and
privileged information. Any unauthorized review, use, disclosure, or distribution is prohibited.
operators. They appeal to the specific motives of particularly customers, satisfy their needs, and make them visit more. And, more importantly, these new formats are flexible enough to accommodate constantly changing consumer behaviour.
Spain
Spanish National Statistics announced its estimation of the GDP, which grew +0.8 percent in Q1 2017 compared to the previous quarter. The yearly rate was +3.0 percent in Q4 2016. Unemployment in Spain continued to decline, reaching 19 percent in the first quarter of the year. The number of people working increased by 69,800 individuals in the first quarter of 2017 compared to the previous three months, and reached 18.5 million people. Annual variation of CPI in April was +2.6 percent. The main contributors to the price growth were tourism services and electricity. CREST shows the first quarter in the foodservice industry also reflected the positive trend of the Spanish economy. Consumer spending in the foodservice industry increased by +2 percent, driven by a positive traffic trend and growth in average eater cheque. During the first three months of the year, visits went up by +1 percent, driven mostly quick service restaurants, followed by on-site restaurants. QSRs and retail drove the average cheque trend. However, full service restaurants did not gain new visitors in the first quarter of 2017, and retail lost traffic. Going into detail on each of the segments, within QSR, chicken specialists grew faster than the average of the channel. Burgers and sandwich/bakery players were the segments with better sales performance. In full service, American restaurants had a higher positive trend in sales and traffic. Italian concepts ranked second. Weekend visits grew in the first quarter of 2017, compared to weekday business, where we saw a traffic loss. Supper was the occasion with the highest traffic growth in Q1. Breakfast and lunch were next. 2017 began as a good year for adult-only parties, bringing new visits to restaurants. This helped to make up for lost traffic caused by declining parties with kids.
Global Foodservice Executive Topline Q1 2017
This document is for the sole use of The NPD Group and its employees. It may contain confidential and privileged information. Any unauthorized review, use, disclosure, or distribution is prohibited.
U.S.
While these are challenging times for the restaurant industry, all is not lost – there are pockets of growth. Convenience continued to drive traffic in Q1, with increased usage of drive-thru and delivery. It’s an online world, and digital technology is meeting consumers’ needs. A presentation on delivery and technology at our recent U.S. Foodservice Summit portrayed the importance of online technology in moving traffic in a positive direction. As more people reach for their laptops and phones to access goods and services, it’s important to make sure sites are up-to-date and promotional information is readily available via your website or mobile app. Traffic remained slightly negative as we moved into the first quarter of 2017. Sales growth slowed, as well, with the increase in check size more moderate than seen in past quarters. This is not say that operators are no longer increasing menu prices; it is a reflection of consumers managing their spending and not increasing their usage of higher-ticket meal occasions. Looking at the quarterly traffic trends over the past few years by segment, we find QSR had basically been growing at 1 to 2 percent a quarter until the second quarter of 2016. March is when we started to see the slowdown, and those trends carried through the first quarter of 2017. The slowdown has also been evident for fast casual, which had been growing at 8 or 9 percent a quarter year after year. The FSR segment remains quite weak and has yet to post traffic growth since the recession. There are bright spots in the industry, with the growth areas driven by consumers’ need for convenience. Drive-thru is once again growing traffic, despite the weakened state of the QSR hamburger category. New developments in technology and third-party providers are fueling growth in delivery. Delivery outside of pizza posted double-digit gains for the quarter and accounted for 40 percent of the delivery market. The demand for convenience is also evidenced by the continued growth of the morning meal, supported entirely by the QSR segment.
Global Foodservice Executive Topline Q1 2017 This document is for the sole use of The NPD Group and its employees. It may contain confidential and
privileged information. Any unauthorized review, use, disclosure, or distribution is prohibited.
Background:
The NPD Group began tracking consumers’ purchases of prepared meals, snacks, and drinks in the United States in 1975. Since that time, we have expanded our coverage to include Australia, Canada, Germany, the U.K., Japan, France, Spain, Italy, China, Russia, Brazil and, most recently, Korea. This broad coverage puts The NPD Group in a unique position to use a harmonized methodology to track the foodservice market in some of the largest opportunity regions where today’s global foodservice companies operate. Every day, in 13 countries around the world, we track the restaurant and foodservice industry to enable operators, manufacturers, and other foodservice companies to make the best-informed business decisions. Our foodservice market research, which is anchored by the ongoing CREST
service, is the
industry’s leading source for trends and performance indicators. These include traffic, consumer spending, same-store sales, check size, food and beverage servings, and consumer demographics.
We provide market information and analytic solutions that drive better decision-making and better results. The world’s leading brands rely on us to help them get the right products in the right places for the right people. Practice areas include apparel, appliances, automotive, beauty, consumer electronics, diamonds, e-commerce, entertainment, fashion accessories, food consumption, foodservice, footwear, home, mobile, office supplies, retail, sports, technology, toys, video games, and watches/jewelry. For more information, visit npd.com and npdgroupblog.com. Follow us on Twitter: @npdgroup. For more information about our global foodservice solutions, please contact Bob O’Brien at [email protected].
Australia: Ciara Clancy +61 2 8257 6425 [email protected] Canada: Robert Carter +1-647-723-7767 [email protected] China: Gimantha Jayasinghe +61 (2) 8257 [email protected] France: Maria Bertoch +33-141-97-26-21 [email protected] Germany: Jochen Pinsker +49-911-8918-210 [email protected] Italy: Matteo Figura +39 02-8550-0641 [email protected] Japan: Kimiharu Sato +81-3-5798-7663 [email protected] Poland: Guy Fielding +44-1-932-359-990 [email protected] Spain: Vicente Montesinos +34-9141-19-445 [email protected] Russia: Maria Vanifatova +(985) 7667558 [email protected] United Kingdom: Guy Fielding +44-1-932-359-990 [email protected] United States: Julie Hoffmeyer +1-847-692-1830 [email protected]