Embed Size (px)
Citation preview
7/25/2019 Global Investment Outlook
http://slidepdf.com/reader/full/global-investment-outlook 1/80
NEW YEAR 2016
THE GLOBALINVESTMENTOUTLOOKRBC Investment Strategy Committee
7/25/2019 Global Investment Outlook
http://slidepdf.com/reader/full/global-investment-outlook 2/80
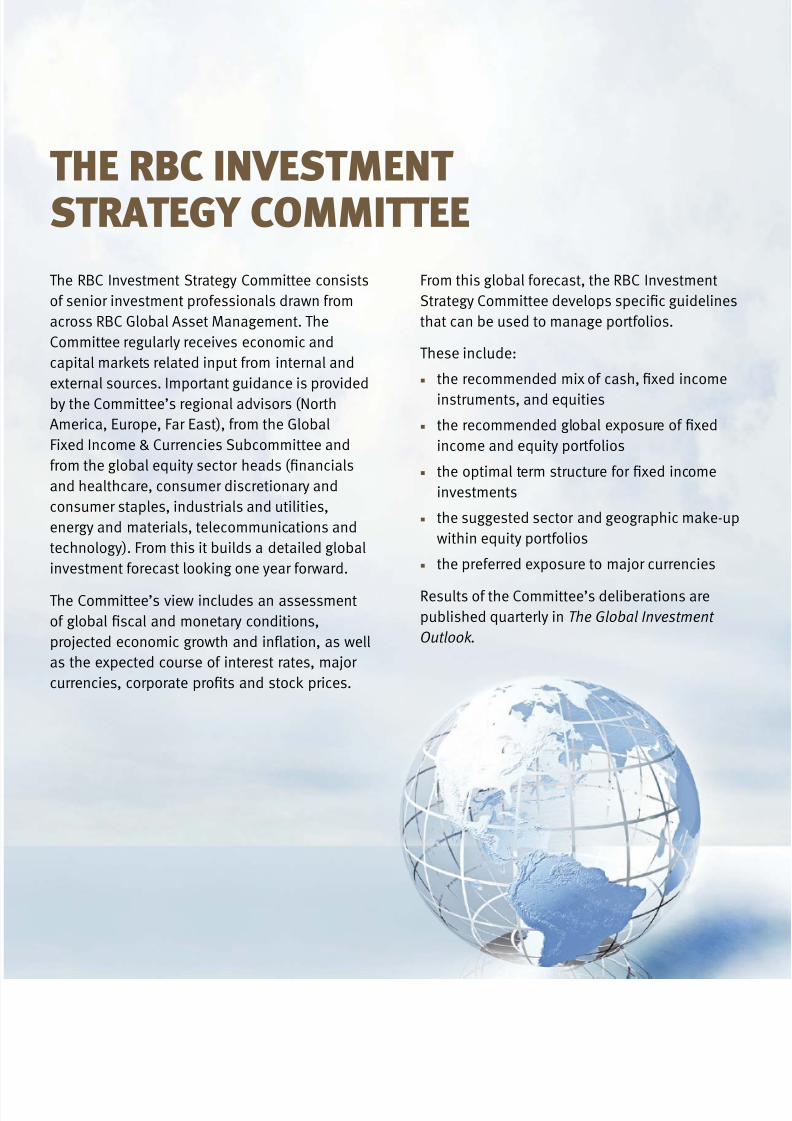
The RBC Investment Strategy Committee consists
of senior investment professionals drawn from
across RBC Global Asset Management. The
Committee regularly receives economic and
capital markets related input from internal and
external sources. Important guidance is provided
by the Committee’s regional advisors (North
America, Europe, Far East), from the Global
Fixed Income & Currencies Subcommittee and
and healthcare, consumer discretionary and
consumer staples, industrials and utilities,
energy and materials, telecommunications and
technology). From this it builds a detailed global
investment forecast looking one year forward.
The Committee’s view includes an assessment
as the expected course of interest rates, major
From this global forecast, the RBC Investment
that can be used to manage portfolios.
These include:
instruments, and equities
income and equity portfolios
investments
the suggested sector and geographic make-up
within equity portfolios
the preferred exposure to major currencies
Results of the Committee’s deliberations are
published quarterly in The Global Investment
Outlook.
THE RBC INVESTMENT
STRATEGY COMMITTEE
7/25/2019 Global Investment Outlook
http://slidepdf.com/reader/full/global-investment-outlook 3/80
CONTENTS
EXECUTIVE SUMMARY 2The Global Investment Outlook
Sarah Riopelle, CFA – V.P. & Senior Portfolio Manager,RBC Global Asset Management Inc.
Daniel E. Chornous, CFA RBC Global Asset Management Inc.
ECONOMIC & CAPITAL MARKETS FORECASTS 4RBC Investment Strategy Committee
RECOMMENDED ASSET MIX 5RBC Investment Strategy Committee
CAPITAL MARKETS PERFORMANCE 10 Milos Vukovic, MBA, CFA – Vice President &Head of Investment Policy,RBC Global Asset Management Inc.
GLOBAL INVESTMENT OUTLOOK 13Girding for rate hikes and geopolitical risks
Eric Lascelles – Chief Economist,RBC Global Asset Management Inc.
Eric Savoie, MBA, CFA – Senior Analyst, Investment Strategy,RBC Global Asset Management Inc.
Daniel E. Chornous, CFA RBC Global Asset Management Inc.
GLOBAL FIXED INCOME MARKETS 46Soo Boo Cheah, MBA, CFA – Senior Portfolio Manager,RBC Global Asset Management (UK) Limited
Suzanne Gaynor – V.P. & Senior Portfolio Manager,RBC Global Asset Management Inc.
CURRENCY MARKETS 52Dagmara Fijalkowski, MBA, CFA – Head, Global Fixed Incomeand Currencies (Toronto and London),
Daniel Mitchell, CFA – Portfolio Manager,RBC Global Asset Management Inc.
WHY THIS TIME IS DIFFERENT 61Taylor Self, MBA – Analyst,Global Fixed Income and Currencies,RBC Global Asset Management Inc.
REGIONAL EQUITY MARKET OUTLOOK
United States 64Raymond Mawhinney – Senior V.P. & Senior Portfolio Manager,RBC Global Asset Management Inc.
Brad Willock, CFA – V.P. & Senior Portfolio Manager,RBC Global Asset Management Inc.
Canada 66Stuart Kedwell, CFA – Senior V.P. & Senior Portfolio Manager,RBC Global Asset Management Inc.
Europe 68David Lambert – Senior Portfolio Manager,RBC Global Asset Management (UK) Limited
Asia 70Mayur Nallamala – Head & Senior Portfolio Manager,RBC Investment Management (Asia) Limited
Emerging Markets 72 Veronique Erb – Portfolio Manager,RBC Global Asset Management (UK) Limited
RBC INVESTMENT STRATEGY COMMITTEE 74
THE GLOBAL INVESTMENT OUTLOOK New Year 2016 I 1
7/25/2019 Global Investment Outlook
http://slidepdf.com/reader/full/global-investment-outlook 4/80
creating a challenging environment
for investors. The geopolitical
environment has been fraught
quite some time, and this is only
increasing. The most salient recent
developments relate to ISIS, but there
are also long-term trends brewing
with regard to the polarization of
developed-world politics, Russia’sincreased aggression and China’s
growing global clout. Although
recently stabilized and it continues
to defy hard-landing fears. We would
the prospect of tighter U.S. monetary
policy to the list of headwinds that we
are monitoring closely.
Minor revisions to our
economic forecasts
Global economic growth has
unquestionably slowed over the
past year, with some concerned that
the process is accelerating into a
more severe correction. We fail to
the recent downward trend in the
U.S. ISM Index, the latest batch of
leading indicators has tentatively
pushed higher and global industrial
production remains fairly normal-
higher in the leading indicators
proves prescient, current levels
remain inconsistent with a global
recession. We have made only minor
quarter, nudging them slightly lower
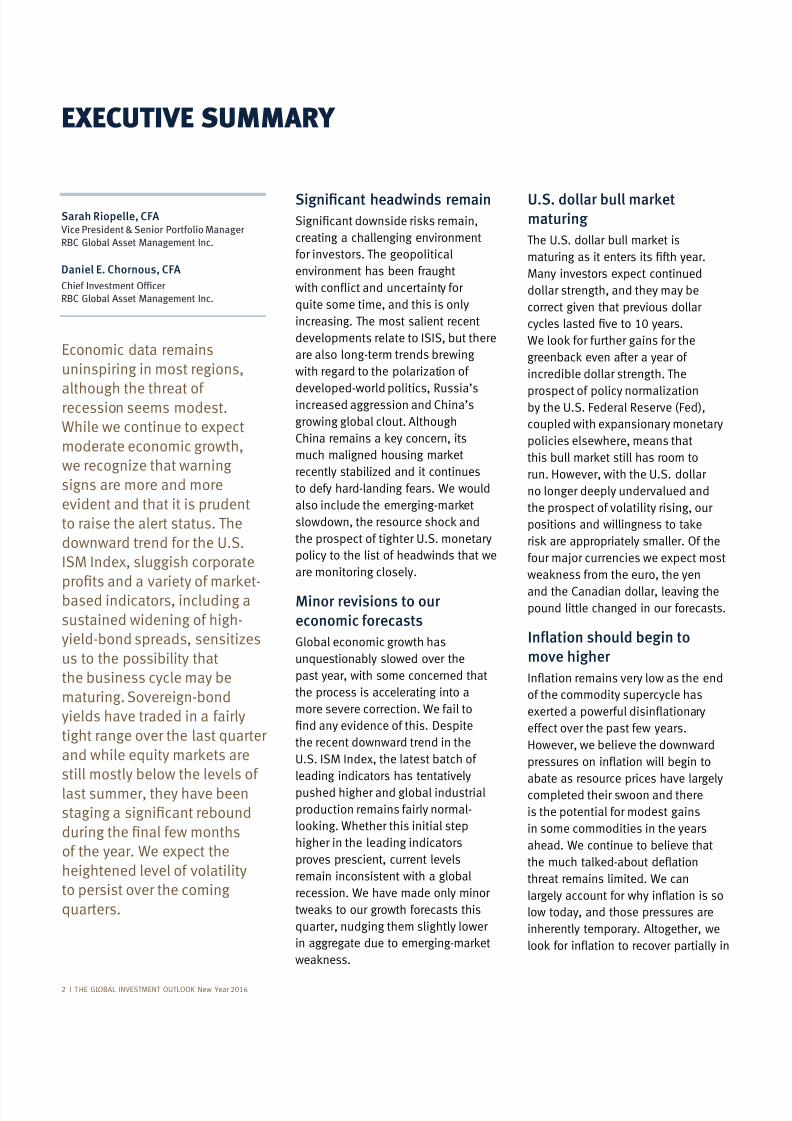
Economic data remains
uninspiring in most regions,
although the threat ofrecession seems modest.
While we continue to expect
moderate economic growth,
we recognize that warning
signs are more and more
evident and that it is prudent
to raise the alert status. The
downward trend for the U.S.
ISM Index, sluggish corporate
based indicators, including a
sustained widening of high-
yield-bond spreads, sensitizes
us to the possibility that
the business cycle may be
maturing. Sovereign-bond
yields have traded in a fairly
tight range over the last quarter
still mostly below the levels of
last summer, they have been
of the year. We expect the
heightened level of volatility
to persist over the coming
quarters.
Sarah Riopelle, CFA
Vice President & Senior Portfolio Manager
RBC Global Asset Management Inc.
Daniel E. Chornous, CFA
RBC Global Asset Management Inc.
2 I T HE GLOBAL INVESTMENT OUTLOOK New Year 2016
EXECUTIVE SUMMARY
U.S. dollar bull marketmaturing
Many investors expect continued
dollar strength, and they may be
correct given that previous dollar
incredible dollar strength. The
prospect of policy normalizationby the U.S. Federal Reserve (Fed),
coupled with expansionary monetary
policies elsewhere, means that
run. However, with the U.S. dollar
no longer deeply undervalued and
the prospect of volatility rising, our
four major currencies we expect most
and the Canadian dollar, leaving thepound little changed in our forecasts.
move higher
of the commodity supercycle has
effect over the past few years.
However, we believe the downward
abate as resource prices have largely
completed their swoon and there
is the potential for modest gains
in some commodities in the years
ahead. We continue to believe that
threat remains limited. We can
low today, and those pressures are
inherently temporary. Altogether, we
7/25/2019 Global Investment Outlook
http://slidepdf.com/reader/full/global-investment-outlook 5/80
THE GLOBAL INVESTMENT OUTLOOK New Year 2016 I 3
supportive of higher equity prices
going forward. With higher valuation
in 2016 and 2017, but given that
earnings estimates have been coming
down for most of this year, this bears
watching.
A little less underweight bondsAs the Fed begins a new tightening
cycle, we expect bond yields to rise,
albeit at a gradual pace. That said,
even a modest rise in yields from the
pressure on bond returns. However,
bonds offer stability through periods
of higher volatility and, as yields rise,
we expect to increase our exposure
following positive U.S. employment
data and added one percentage
sourced from cash.
Our models continue to indicate
bonds so we remain overweight
this volatile investing environment.
Should our stress indicators worsen,
it may be prudent to begin scaling
in the months and quarters ahead.
For a balanced, global investor, we
recommend an asset mix of 62%
equities (strategic neutral position:
(strategic neutral position: 43%), with
the balance in cash.
bond yields higher over the comingquarters. However, there are a
number of factors that may discourage
to be patient, subtle and transparent
as it sets itself on the long path
to restoring “normal” monetary
conditions. In addition, relatively low
yields elsewhere in the world have
made U.S. Treasury bonds attractive
to global investors and the demand
for Treasuries should limit how far
yields can rise in the near term.
to outlook
volatility so far in 2015 driven by the
sideways or down through 2015
as valuations have moderated and
earnings estimates have experienced
constant negative revisions since the
end of 2014.
over the last few months has
bolstered the long-term return
fair value in the spring of 2015,
for periods of sustained growth,
Valuations are considerably more
attractive in Europe and other global
However, as expanding valuations
2016, but not all the way to a normallevel, and we suspect that the revival
will be a tad more gradual than the
Divergent monetary policies
The theme of diverging monetary
pronounced in the coming quarters.
entertaining the delivery of more
stimulus, the rationale generally
developed world and decelerating
other monetary policy extreme, the
Fed – is set to begin raising rates. We
the economy on its optimal growth
are priced for this outcome, and the
Fed has emphasized its desire toproceed with extreme caution, this
should not be overly problematic.
Forecasting a modest increase
in bond yields
Interest rates remain low and have
proven adept at defying widespread
forecasts over the past several years
that they would rise. There is a
especially given the downward
pressure that comes from ultra-
In the U.S., some of these conditions
seem more vulnerable to reversal
than they have been for some time.
new tightening cycle, rising short-
term interest rates should nudge
7/25/2019 Global Investment Outlook
http://slidepdf.com/reader/full/global-investment-outlook 6/80
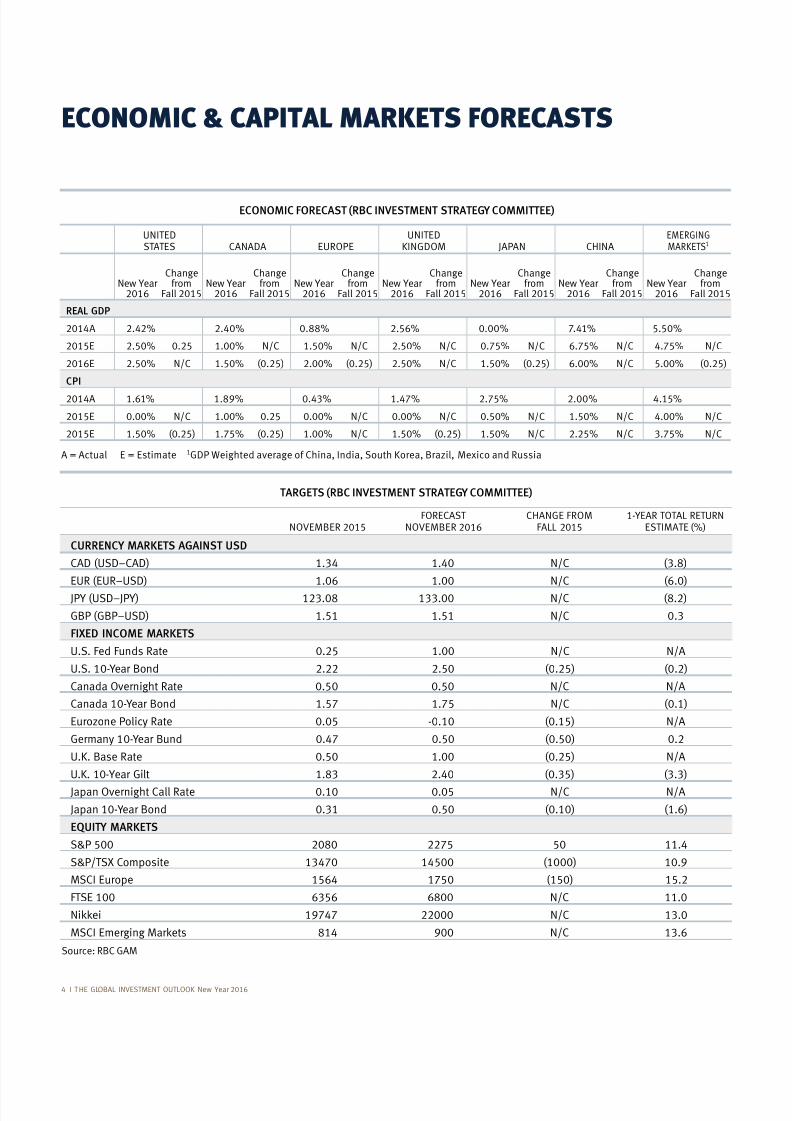
TARGETS (RBC INVESTMENT STRATEGY COMMITTEE)
NOVEMBER 2015FORECAST
NOVEMBER 2016CHANGE FROM
FALL 20151-YEAR TOTAL RETURN
ESTIMATE (%)
CURRENCY MARKETS AGAINST USD
1.34 1.40 N/C
1.06 1.00 N/C (6.0)
133.00 N/C
1.51 1.51 N/C 0.3
FIXED INCOME MARKETS
U.S. Fed Funds Rate 0.25 1.00 N/C N/A
U.S. 10-Year Bond 2.22 2.50 (0.25) (0.2)
Canada Overnight Rate 0.50 0.50 N/C N/A
Canada 10-Year Bond 1.57 1.75 N/C (0.1)
Eurozone Policy Rate 0.05 -0.10 (0.15) N/A
Germany 10-Year Bund 0.47 0.50 (0.50) 0.2
U.K. Base Rate 0.50 1.00 (0.25) N/A
U.K. 10-Year Gilt 2.40 (0.35) (3.3)
Japan Overnight Call Rate 0.10 0.05 N/C N/A
Japan 10-Year Bond 0.31 0.50 (0.10) (1.6)
EQUITY MARKETS
S&P 500 2275 50 11.4
S&P/TSX Composite 13470 14500 (1000)
MSCI Europe 1564 1750 (150) 15.2
FTSE 100 6356 N/C 11.0
22000 N/C 13.0
N/C 13.6
Source: RBC GAM
ECONOMIC & CAPITAL MARKETS FORECASTS
ECONOMIC FORECAST (RBC INVESTMENT STRATEGY COMMITTEE)
UNITEDSTATES CANADA EUROPE
UNITEDKINGDOM JAPAN CHINA
EMERGINGMARKETS1
New Year2016
Changefrom
Fall 2015New Year
2016
Changefrom
Fall 2015New Year
2016
Changefrom
Fall 2015New Year
2016
Changefrom
Fall 2015New Year
2016
Changefrom
Fall 2015New Year
2016
Changefrom
Fall 2015New Year
2016
Changefrom
Fall 2015
REAL GDP
2014A 2.42% 2.40% 2.56% 0.00% 7.41% 5.50%
2015E 2.50% 0.25 1.00% N/C 1.50% N/C 2.50% N/C 0.75% N/C 6.75% N/C 4.75% N/C
2016E 2.50% N/C 1.50% (0.25) 2.00% (0.25) 2.50% N/C 1.50% (0.25) 6.00% N/C 5.00% (0.25)
CPI
2014A 1.61% 0.43% 1.47% 2.75% 2.00% 4.15%
2015E 0.00% N/C 1.00% 0.25 0.00% N/C 0.00% N/C 0.50% N/C 1.50% N/C 4.00% N/C
2015E 1.50% (0.25) 1.75% (0.25) 1.00% N/C 1.50% (0.25) 1.50% N/C 2.25% N/C 3.75% N/C
A = Actual E = Estimate 1
4 I T HE GLOBAL INVESTMENT OUTLOOK New Year 2016
7/25/2019 Global Investment Outlook
http://slidepdf.com/reader/full/global-investment-outlook 7/80
bonds and cash – should include both strategic and
tactical elements. Strategic asset mix addresses the blend
portfolio through many business and investment cycles,
independent of a near-term view of the prospects for the
Every individual has differing return expectations and
strategic asset mix. Based on a 35-year study of historical
returns and the volatility of returns (the range around
the average return within which shorter-term results
aggressive growth. It goes without saying that as investors
accept increasing levels of volatility, and therefore greater
presented below may assist investors in selecting a
strategic asset mix best aligned to their investment goals.
Each quarter, the RBC Investment Strategy Committee
publishes a recommended asset mix based on our current
view of the economy and return expectations for the
major asset classes. These weights are further divided
into recommended exposures to the variety of global
3 2
RECOMMENDED ASSET MIX
asset classes with a goal of tilting portfolios toward
term prospects.
serve as a guide for movement within the ranges allowed
way toward its upper limit of 70% for equities), that would
imply a tactical shift of + 5.02% to 25.02% for the Very
allowed range of +/- 15%).
The value-added of tactical strategies is, of course,
dependent on the degree to which the expected
scenario unfolds.
Regular reviews of portfolio weights are essential to the
ultimate success of an investment plan as they ensure
current exposures are aligned with levels of long-term
investors.
Anchoring portfolios with a suitable strategic asset mix,
tactical positioning, imposes discipline that can limit
damage caused by swings in emotion that inevitably
THE GLOBAL INVESTMENT OUTLOOK New Year 2016 I 5
1. Average return:
2. Volatility: The standard deviation of returns. Standard deviation is a statistical measure that indicates the range around the averagereturn within which 2/3 of results will fall into, assuming a normal distribution around the long-term average.
7/25/2019 Global Investment Outlook
http://slidepdf.com/reader/full/global-investment-outlook 8/80
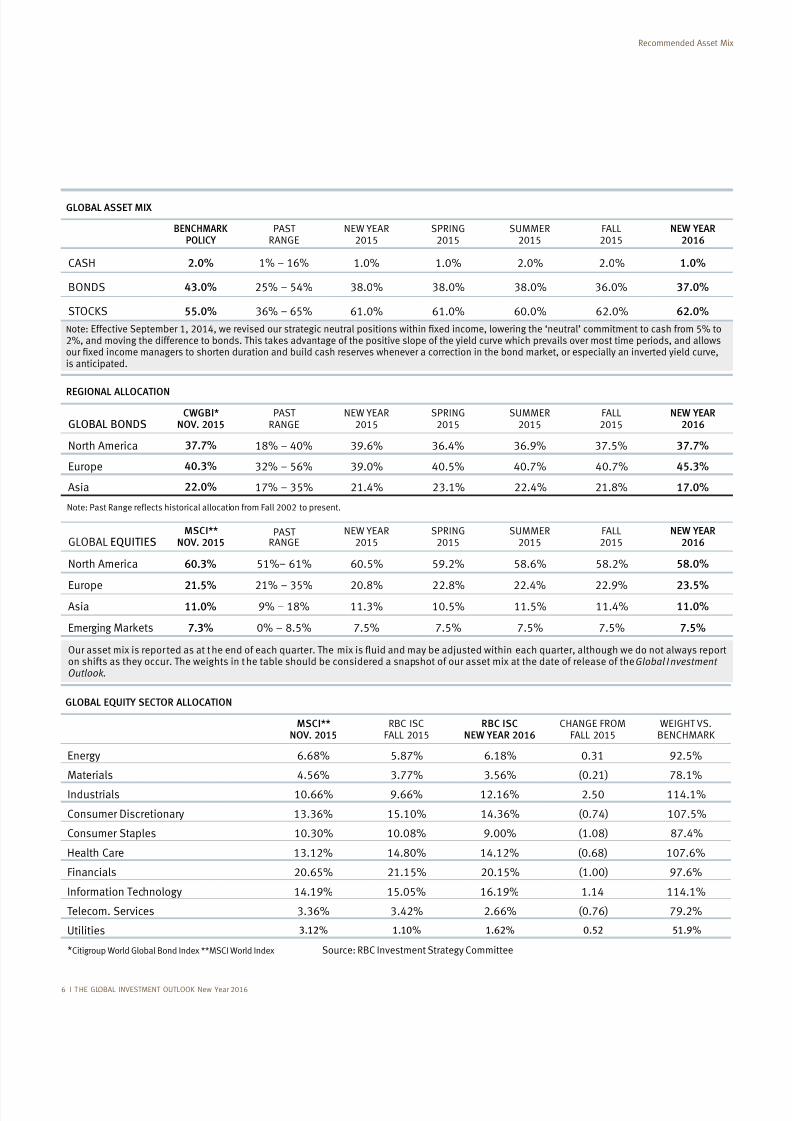
*Citigroup World Global Bond Index **MSCI World Index Source: RBC Investment Strategy Committee
GLOBAL ASSET MIX
BENCHMARK
POLICY
PASTRANGE
NEW YEAR2015
SPRING2015
SUMMER2015
FALL2015
NEW YEAR
2016
CASH 2.0% 1% – 16% 1.0% 1.0% 2.0% 2.0% 1.0%
BONDS 43.0% 25% – 54% 36.0% 37.0%
STOCKS 55.0% 36% – 65% 61.0% 61.0% 60.0% 62.0% 62.0%
N is anticipated.
REGIONAL ALLOCATION
GLOBAL BONDSCWGBI*
NOV. 2015
PASTRANGE
NEW YEAR2015
SPRING2015
SUMMER2015
FALL2015
NEW YEAR
2016
North America 37.7% – 40% 36.4% 37.5% 37.7%
Europe 40.3% 32% – 56% 40.5% 40.7% 40.7% 45.3%
Asia 22.0% 17% – 35% 21.4% 23.1% 22.4% 17.0%
Note: Past Range reflects historical allocation from Fall 2002 to present.
GLOBAL EQUITIESMSCI**
NOV. 2015PAST
RANGENEW YEAR
2015SPRING
2015SUMMER
2015FALL2015
NEW YEAR
2016
North America 60.3% 51%– 61% 60.5% 58.0%
Europe 21.5% 21% – 35% 22.4% 23.5%Asia 11.0% – 11.3% 10.5% 11.5% 11.4% 11.0%
Emerging 7.3% 0% – 7.5% 7.5% 7.5% 7.5% 7.5%
on shifts as they occur. The weights in the table should be considered a snapshot of our asset mix at the date of release of the Global InvestmentOutlook.
GLOBAL EQUITY SECTOR ALLOCATION
MSCI**
NOV. 2015
RBC ISCFALL 2015
RBC ISC
NEW YEAR 2016
CHANGE FROMFALL 2015
WEIGHT VS.BENCHMARK
Energy 0.31
Materials 4.56% 3.77% 3.56% (0.21)
Industrials 10.66% 12.16% 2.50 114.1%
13.36% 15.10% 14.36% (0.74) 107.5%
Consumer Staples 10.30%
Health Care 13.12% 14.12% 107.6%
Financials 20.65% 21.15% 20.15% (1.00)
Information Technology 15.05% 1.14 114.1%
Telecom. Services 3.36% 3.42% 2.66% (0.76)
Utilities 3.12% 1.10% 1.62% 0.52 51.9%
6 I T HE GLOBAL INVESTMENT OUTLOOK New Year 2016
Recommended Asset Mix
7/25/2019 Global Investment Outlook
http://slidepdf.com/reader/full/global-investment-outlook 9/80
Recommended Asset Mix
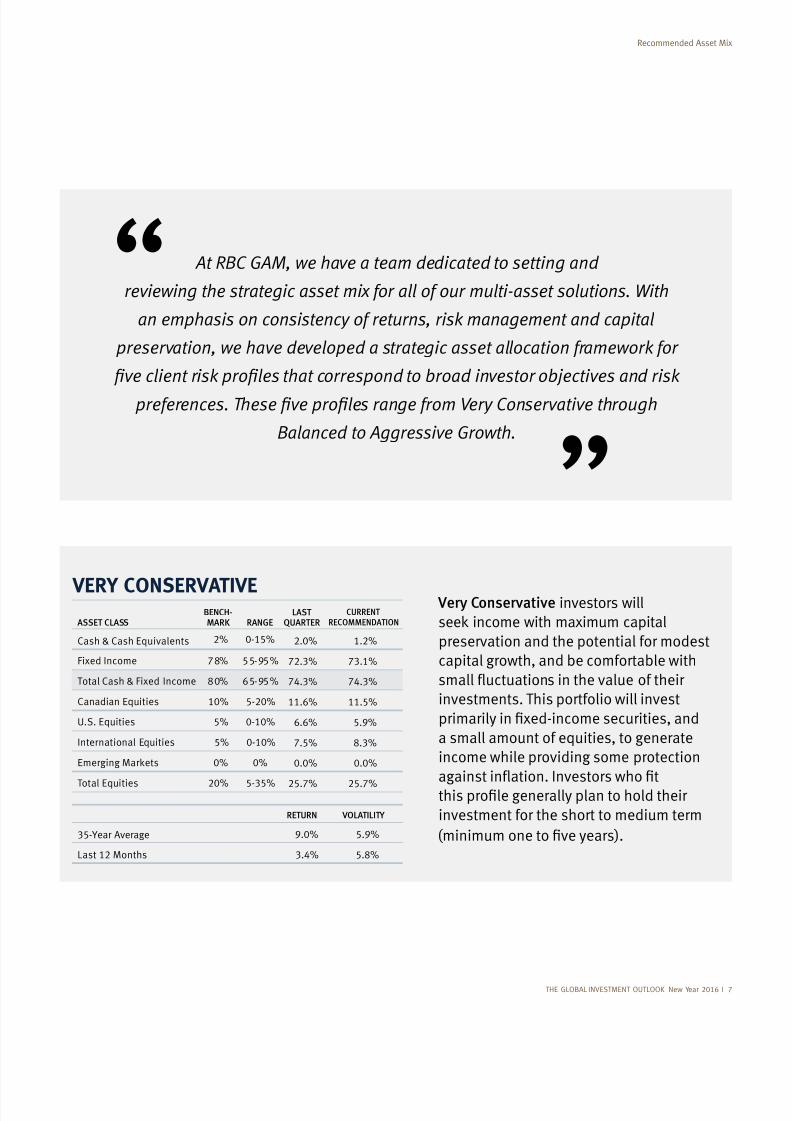
VERY CONSERVATIVE Very Conservative investors will
preservation and the potential for modest
capital growth, and be comfortable with
investments. This portfolio will invest
a small amount of equities, to generate
income while providing some protection
investment for the short to medium term
(minimum
ASSET CLASSBENCH-MARK RANGE
LASTQUARTER
CURRENT
RECOMMENDATION
Cash & Cash Equivalents 2% 0-15% 2.0% 1.2%
Fixed Income 72.3% 73.1%
Total Cash & Fixed Income 74.3% 74.3%
Canadian Equities 10% 5-20% 11.6% 11.5%
U.S. Equities 5% 0-10% 6.6%
International Equities 5% 0-10% 7.5%
0% 0% 0.0% 0.0%
Total Equities 20% 5-35% 25.7% 25.7%
RETURN VOLATILITY
35-Year Average
Last 12 Months 3.4%
At RBC GAM, we have a team dedicated to setting and
reviewing the strategic asset mix for all of our multi-asset solutions. With
an emphasis on consistency of returns, risk management and capital
preservation, we have developed a strategic asset allocation framework for
Balanced to Aggressive Growth.
“
”
THE GLOBAL INVESTMENT OUTLOOK New Year 2016 I 7
7/25/2019 Global Investment Outlook
http://slidepdf.com/reader/full/global-investment-outlook 10/80
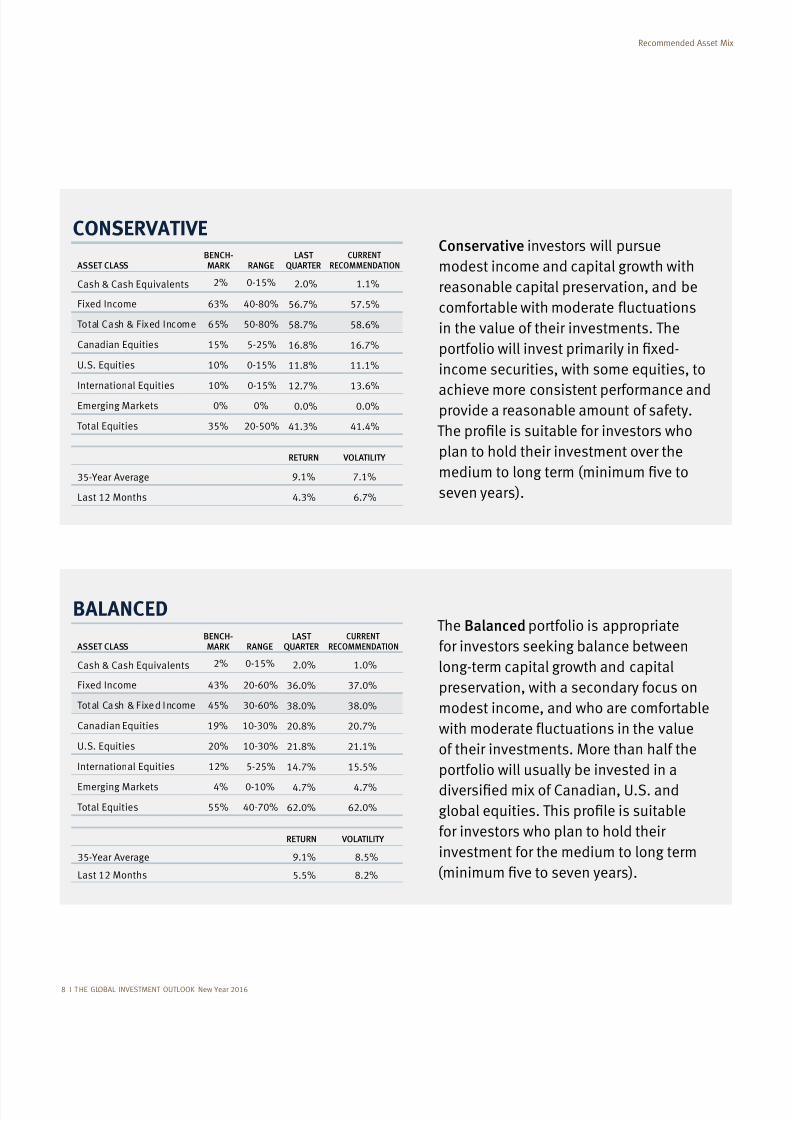
ASSET CLASSBENCH-MARK RANGE
LASTQUARTER
CURRENT
RECOMMENDATION
Cash & Cash Equivalents 2% 0-15% 2.0% 1.0%
Fixed Income 43% 20-60% 36.0% 37.0%
Total Cash & F ixed Income 45% 30-60%
Canadian Equities 10-30% 20.7%
U.S. Equities 20% 10-30% 21.1%
International Equities 12% 5-25% 14.7% 15.5%
4% 0-10% 4.7% 4.7%
Total Equities 55% 40-70% 62.0% 62.0%
BALANCEDThe Balanced portfolio is appropriate
long-term capital growth and capital
preservation, with a secondary focus on
modest income, and who are comfortable
of their investments. More than half the
portfolio will usually be invested in a
for investors who plan to hold their
investment for the medium to long term
RETURN VOLATILITY
35-Year Average
Last 12 Months 5.5%
ASSET CLASSBENCH-MARK RANGE
LASTQUARTER
CURRENT
RECOMMENDATION
Cash & Cash Equivalents 2% 0-15% 2.0% 1.1%
Fixed Income 63% 56.7% 57.5%
Total Cash & Fixed Income 65%
Canadian Equities 15% 5-25% 16.7%
U.S. Equities 10% 0-15% 11.1%
International Equities 10% 0-15% 12.7% 13.6%
0% 0% 0.0% 0.0%
Total Equities 35% 20-50% 41.3% 41.4%
CONSERVATIVEConservative investors will pursue
modest income and capital growth with
reasonable capital preservation, and be
in the value of their investments. The
income securities, with some equities, to
achieve more consistent performance andprovide a reasonable amount of safety.
plan to hold their investment over the
seven years).
RETURN VOLATILITY
35-Year Average 7.1%
Last 12 Months 4.3% 6.7%
New Year 2016
Recommended Asset Mix
7/25/2019 Global Investment Outlook
http://slidepdf.com/reader/full/global-investment-outlook 11/80
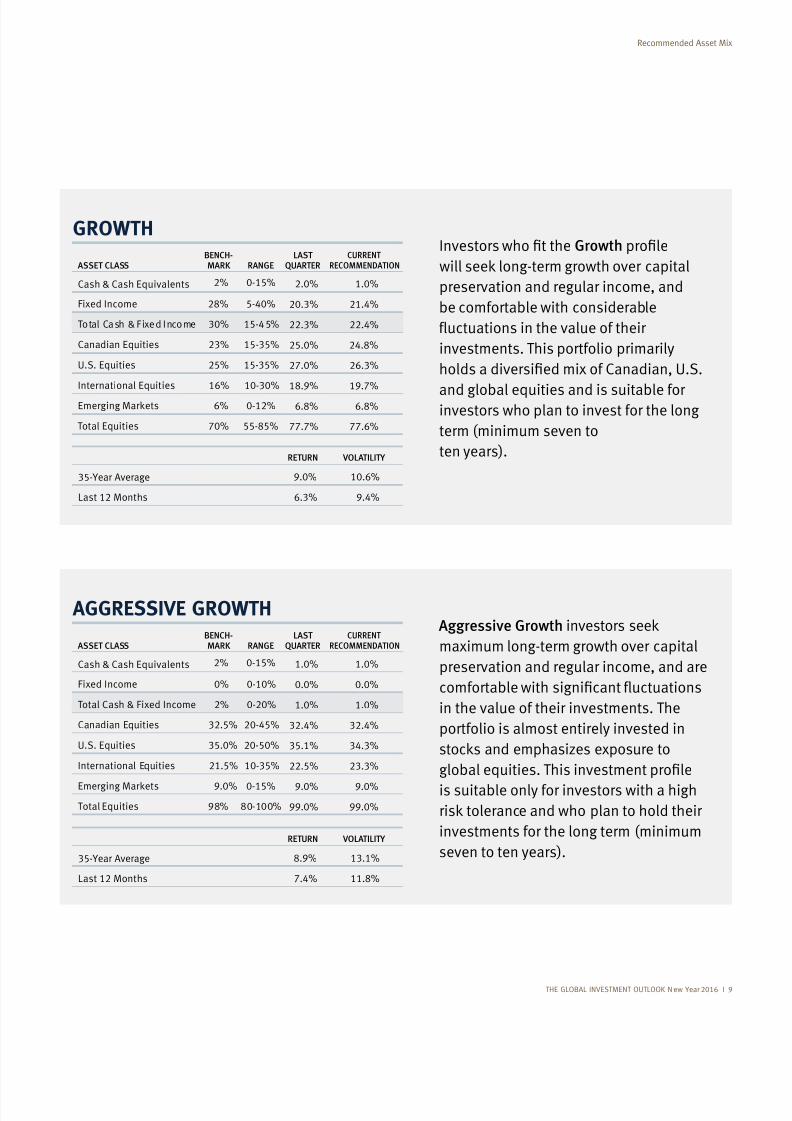
ASSET CLASSBENCH-MARK RANGE
LASTQUARTER
CURRENT
RECOMMENDATION
Cash & Cash Equivalents 2% 0-15% 2.0% 1.0%
Fixed Income 5-40% 20.3% 21.4%
Total Cash & F ixed Income 30% 15-45% 22.3% 22.4%
Canadian Equities 23% 15-35% 25.0%
U.S. Equities 25% 15-35% 27.0% 26.3%
International Equities 16% 10-30%
6% 0-12%
Total Equities 70% 77.7% 77.6%
GROWTHInvestors Growth
preservation and regular income, and
be comfortable with considerable
investments. This portfolio primarily
and global equities and is suitable forinvestors who plan to invest for the long
term (minimum seven to
ten years).RETURN VOLATILITY
35-Year Average 10.6%
Last 12 Months 6.3%
ASSET CLASSBENCH-MARK RANGE
LASTQUARTER
CURRENT
RECOMMENDATION
Cash & Cash Equivalents 2% 0-15% 1.0% 1.0%
Fixed Income 0% 0-10% 0.0% 0.0%
Total Cash & Fixed Income 2% 0-20% 1.0% 1.0%
Canadian Equities 32.5% 20-45% 32.4% 32.4%
U.S. Equities 35.0% 20-50% 35.1% 34.3%
International Equities 21.5% 10-35% 22.5% 23.3%
0-15%
Total Equities
AGGRESSIVE GROWTH
RETURN VOLATILITY
35-Year Average 13.1%
Last 12 Months 7.4%
Aggressive Growth
maximum long-term growth over capital
preservation and regular income, and are
in the value of their investments. The
portfolio is almost entirely invested in
is suitable only for investors with a high
investments for the long term (minimum
seven to ten years).
THE GLOBAL INVESTMENT OUTLOOK N ew Year 2016
Recommended Asset Mix
7/25/2019 Global Investment Outlook
http://slidepdf.com/reader/full/global-investment-outlook 12/80
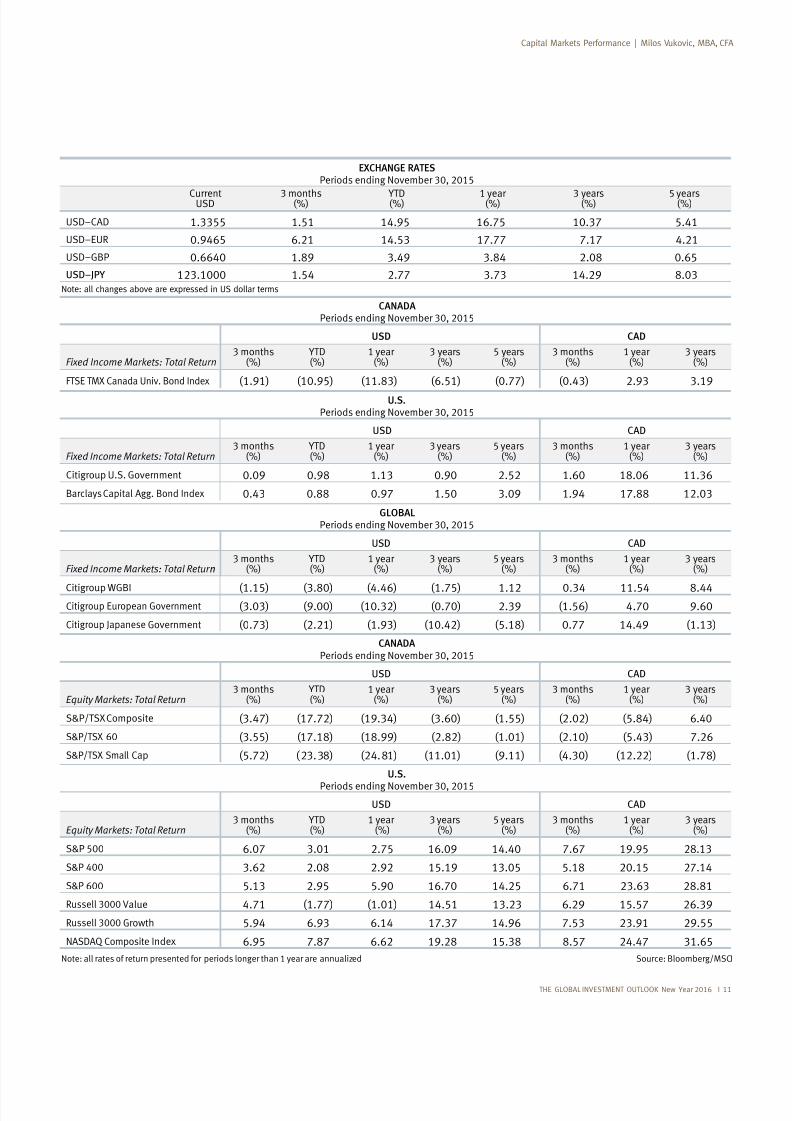
The U.S. dollar rose against all major
currencies between September
1, 2015, and November 30, 2015.
pound, and 1.5% against both
the yen and the Canadian dollar.Over the 12-month period ended
November 30, 2015, the U.S. dollar
sterling and 3.7% versus the yen.
modestly in the U.S. during the
three-month period, but currency
depreciation contributed to bond
losses elsewhere. The Barclays
Capital Aggregate Bond Index,
income performance, climbed 0.4%.
European bonds fell 3.0% in U.S.
dollar terms as measured by the
Citigroup WGBI – Europe Index.
The FTSE TMX Canada Universe
Milos Vukovic, MBA, CFA
Vice President & Head of Investment Policy
RBC Global Asset Management Inc.
10 I TH E GLOBAL INVESTMENT OUTLOOK New Year 2016
CAPITAL MARKETS PERFORMANCE
Japanese bonds, as measured bythe Citigroup Japanese Government
Bond Index, decreased 0.7%.
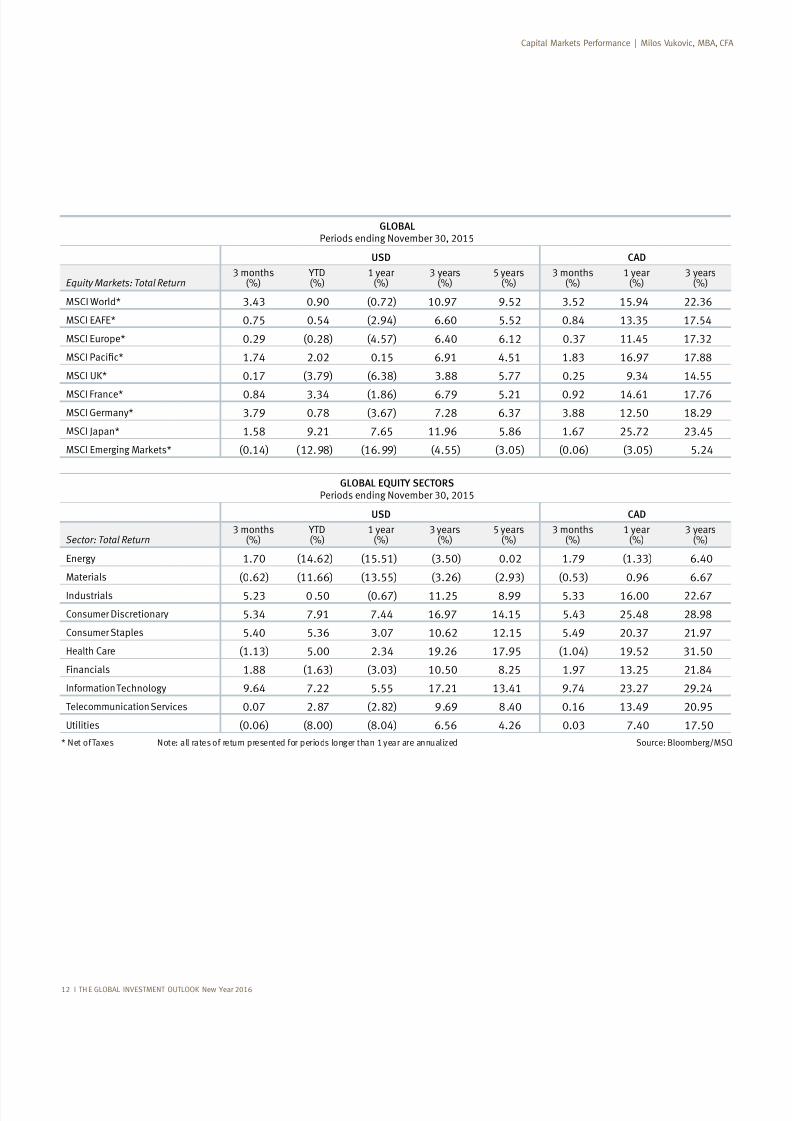
during the latest three-month period,
amid further drops in commodity
prices. The S&P 500 climbed 6.1%,
followed by a 1.6% rise for the MSCI
Japan and a 0.3% gain for the MSCI
Europe. Within Europe, the MSCI
gained 0.2%. Over the 12-month
and the MSCI Japan gained 7.7%.
However, the MSCI U.K. lost 6.4%,
followed by a 3.7% drop in the MSCI
France. The S&P/TSX Composite
Index lost 3.5% in U.S. dollar terms
during the three months, versus the
3.6% drop for the large-cap S&P/TSX60 Index and a 5.7% decline in the
S&P/TSX Small Cap Index. The MSCI
during the three-month period and
dropped 17.0% over the 12-month
period.
The S&P 400 Index, a measure of
in the latest three months and rose
the S&P 600 Index, a gauge of small-
cap performance, gained 5.1% in the
the 12 months. The Russell 3000
quarter versus a 4.7% increase for
the Russell 3000 Value Index. Over
the 12 months, the Russell 3000
Growth Index rose 6.1%, while the
Russell 3000 Value Index lost 1.0%.
Seven of the 10 global equity sectors
climbed during the quarter ended
November 30, 2015. The best-
performing sector was Information
followed by Consumer Staples
with a rise of 5.4%, and Consumer
The worst-performing sectors over
the past three months were Health
Care, which lost 1.1%; Materials,
which lost 0.6%; and Utilities, with
period, the best-performing sectors
Information Technology and
Consumer Staples, and the worst-
performing were Energy, Materials
and Utilities.
7/25/2019 Global Investment Outlook
http://slidepdf.com/reader/full/global-investment-outlook 13/80
CANADA
Periods ending November 30, 2015
USD CAD
Equity Markets: Total Return3 months
(%) (%)
1 year(%)
3 years(%)
5 years(%)
3 months(%)
1 year(%)
3 years(%)
S&P/TSX Composite (3.47) (17.72) (3.60) (1.55) (2.02) 6.40
S&P/TSX 60 (3.55) (1.01) (2.10) (5.43) 7.26
S&P/TSX Small Cap (5.72) (11.01) (4.30) (12.22)
U.S.
Periods ending November 30, 2015
USD CAD
Equity Markets: Total Return3 months
(%) (%)
1 year(%)
3 years(%)
5 years(%)
3 months(%)
1 year(%)
3 years(%)
S&P 500 6.07 3.01 2.75 14.40 7.67
S&P 400 3.62 13.05 20.15 27.14
S&P 600 5.13 16.70 14.25 6.71 23.63
Russell 3000 Value 4.71 (1.77) (1.01) 14.51 13.23 15.57
Russell 3000 Growth 6.14 17.37 7.53
N Index 6.62 24.47 31.65
EXCHANGE RATES
Periods ending November 30, 2015
Current 3 months(%) (%) 1 year(%) 3 years(%) 5 years(%)
1.3355 1.51 16.75 10.37 5.41
6.21 14.53 17.77 7.17 4.21
0.6640 0.65
USD–JPY 123.1000 1.54 2.77 3.73
Source: Bloomberg/MSCI
CANADA
Periods ending November 30, 2015
USD CAD
Fixed Income Markets: Total Return3 months
(%) (%)
1 year(%)
3 years(%)
5 years(%)
3 months(%)
1 year(%)
3 years(%)
FTSE TMX Canada Univ. Bond Index (6.51) (0.77) (0.43)
U.S.
Periods ending November 30, 2015
USD CAD
Fixed Income Markets: Total Return3 months
(%) (%)
1 year(%)
3 years(%)
5 years(%)
3 months(%)
1 year(%)
3 years(%)
Citigroup U.S. Government 1.13 2.52 1.60 11.36
Barclays Capital Agg. Bond Index 0.43 1.50 12.03
GLOBAL
Periods ending November 30, 2015
USD CAD
Fixed Income Markets: Total Retur n3 months
(%) (%)
1 year(%)
3 years(%)
5 years(%)
3 months(%)
1 year(%)
3 years(%)
Citigroup WGBI (1.15) (4.46) (1.75) 1.12 0.34 11.54 Citigroup European Government (3.03) (10.32) (0.70) (1.56) 4.70
Citigroup Japanese Government (0.73) (2.21) (10.42) 0.77 (1.13)
Note: all changes above are expressed in US dollar terms
Note: all rates of return presented for periods longer than 1 year are annualized
THE GLOBAL INVESTMENT OUTLOOK New Year 2016 I 11
7/25/2019 Global Investment Outlook
http://slidepdf.com/reader/full/global-investment-outlook 14/80
GLOBAL
Periods ending November 30, 2015
USD CAD
Equity Markets: Total Return3 months
(%) (%)
1 year(%)
3 years(%)
5 years(%)
3 months(%)
1 year(%)
3 years(%)
MSCI World* 3.43 (0.72) 3.52 22.36
MSCI EAFE* 0.75 0.54 6.60 5.52 13.35 17.54
MSCI Europe* (4.57) 6.40 6.12 0.37 11.45 17.32
MSCI 1.74 2.02 0.15 4.51
MSCI UK* 0.17 5.77 0.25 14.55
MSCI France* 3.34 5.21 14.61 17.76
MSCI Germany* (3.67) 6.37 12.50
MSCI Japan* 7.65 1.67 25.72 23.45
MSCI Emerging M (0.14) (4.55) (3.05) (0.06) (3.05) 5.24
Source: Bloomberg/MSCI
GLOBAL EQUITY SECTORS Periods ending November 30, 2015
USD CAD
Sector: Total Return3 months
(%) (%)
1 year(%)
3 years(%)
5 years(%)
3 months(%)
1 year(%)
3 years(%)
Energy 1.70 (14.62) (15.51) (3.50) 0.02 (1.33) 6.40
Materials (0.62) (11.66) (13.55) (3.26) (0.53) 6.67
Industrials 5.23 0 .50 (0.67) 11.25 5.33 16.00 22.67
Consumer 5.34 7.44 14.15 5.43
Consumer Staples 5.40 5.36 3.07 10.62 12.15 20.37
Health Care (1.13) 5.00 2.34 (1.04) 31.50
F inancials (1.63) (3.03) 10.50 13.25
Information Technology 7.22 5.55 17.21 13.41 23.27
T elecommunication Services 0.07 0.16
Utilities (0.06) 6.56 4.26 0.03 7.40 17.50
* Net of Taxes Note: all rates of return presented for periods longer than 1 year are annualized
12 I TH E GLOBAL INVESTMENT OUTLOOK New Year 2016
7/25/2019 Global Investment Outlook
http://slidepdf.com/reader/full/global-investment-outlook 15/80
Girding for rate hikes and geopolitical risks
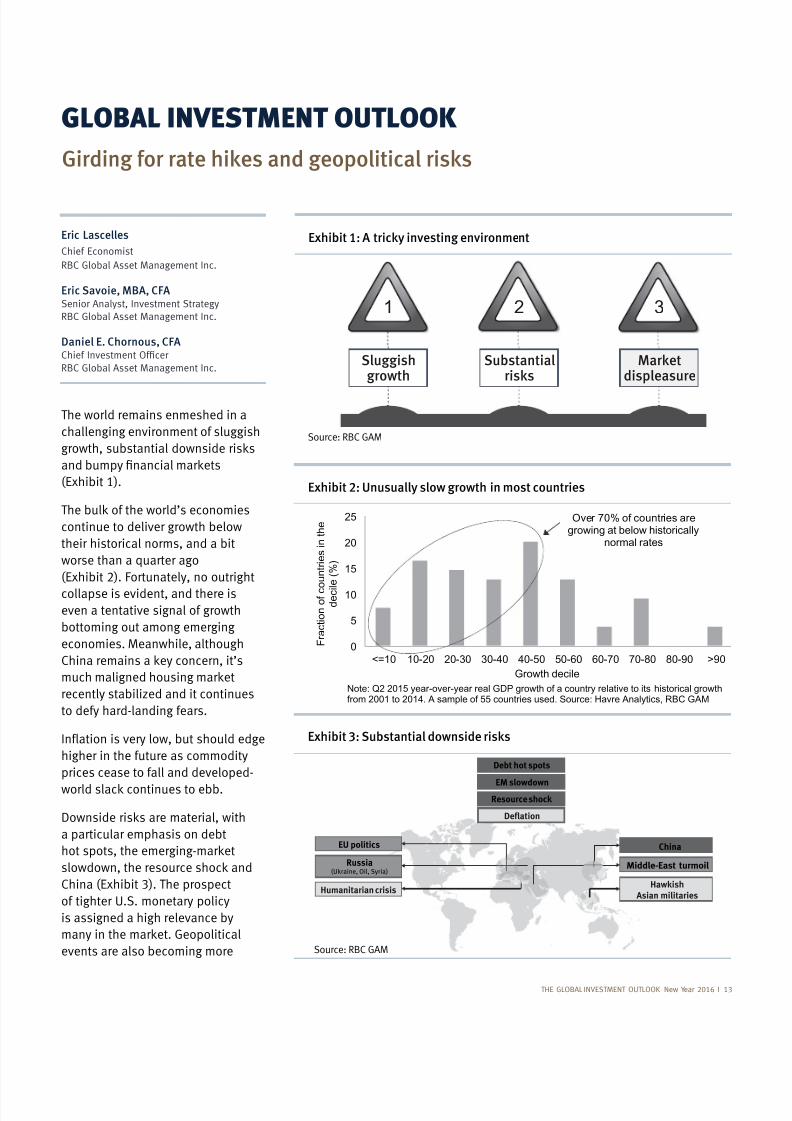
The world remains enmeshed in a
challenging environment of sluggish
(Exhibit 1).
continue to deliver growth below
their historical norms, and a bit
worse than a quarter ago
(Exhibit 2). Fortunately, no outright
collapse is evident, and there iseven a tentative signal of growth
bottoming out among emerging
economies. Meanwhile, although
recently stabilized and it continues
to defy hard-landing fears.
higher in the future as commodity
prices cease to fall and developed-
a particular emphasis on debt
China (Exhibit 3). The prospect
of tighter U.S. monetary policy
is assigned a high relevance by
events are also becoming more
GLOBAL INVESTMENT OUTLOOK
THE GLOBAL INVESTMENT OUTLOOK New Year 2016 I 13
Exhibit 1: A tricky investing environment
1 2 3
Sluggishgrowth
Substantialrisks
Marketdispleasure
Exhibit 2: Unusually slow growth in most countries
0
5
10
15
20
25
<=10 10-20 20-30 30-40 40-50 50-60 60-70 70-80 80-90 >90
F r a c t i o n o f c o u n t r i e s i n t h e
d e c i l e ( % )
Growth decile
Note: Q2 2015 year-over-year real GDP growth of a country relative to its historical growthfrom 2001 to 2014. A sample of 55 countries used. Source: Havre Analytics, RBC GAM
Over 70% of countries aregrowing at below historically
normal rates
Eric Lascelles
Chief Economist
RBC Global Asset Management Inc.
Eric Savoie, MBA, CFASenior Analyst, Investment StrategyRBC Global Asset Management Inc.
Daniel E. Chornous, CFA
RBC Global Asset Management Inc.
Exhibit 3: Substantial downside risks
Debt hot spots
EM slowdownResource shock
Deflation
China
Middle-East turmoil
Hawkish Asian militaries
EU politics
Russia (Ukraine, Oil, Syria)
Humanitarian crisis
Source: RBC GAM
Source: RBC GAM
7/25/2019 Global Investment Outlook
http://slidepdf.com/reader/full/global-investment-outlook 16/80
14 I TH E GLOBAL INVESTMENT OUTLOOK New Year 2016
Exhibit 4: Financial-market hit has faded
-40
-30
-20
-10
0
10
20
30
40
-40
-30
-20
-10
0
10
20
30
40
Commodities TSX S&P500
EMcurrencies
U.S.10yr yield
IG creditspread
Y i e l d / s p r e a d c h a n g e
( b a s i s p o i n t s )
P r i c e c h a n g e ( % )
Latest ExtremeNote: Percentage change of S&P Goldman Sachs Commodity Index, TSX, S&P 500 andJP Morgan EM Currency Index since 6/30/2015. Basis point change of U.S. 10-year yield andinvestment-grade credit spread since 6/30/2015. Source: Haver Analytics, RBC GAM
Exhibit 5: High-yield credit spreads send cautious signal
0
400
800
1200
1600
2000
2006 2009 2012 2015
C r e d i t s p r e a
d ( b a s i s p o i n t s )
Note: Credit spread is spread to worst over government. Source: Haver Analytics, RBC GAM
Spreads have gone upnearly 200 bps since
May 2015
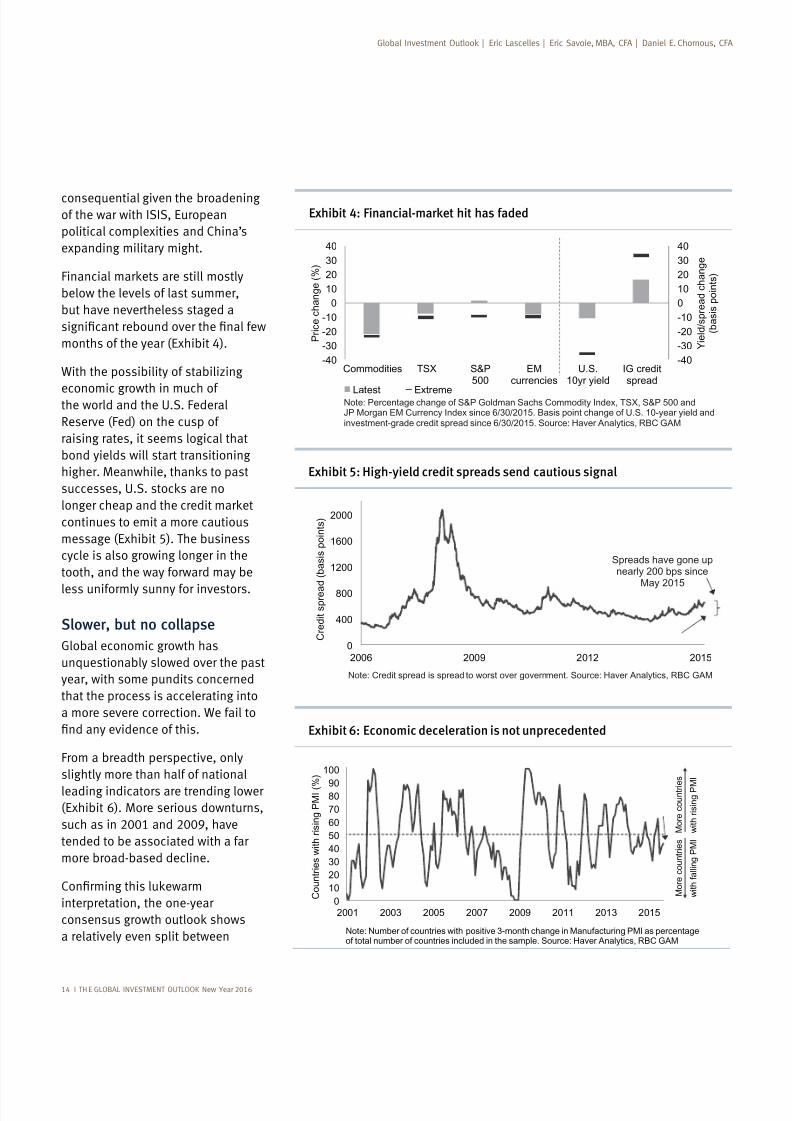
consequential given the broadeningof the war with ISIS, European
political complexities and China’s
expanding military might.
below the levels of last summer,
but have nevertheless staged a
months of the year (Exhibit 4).
With the possibility of stabilizing
economic growth in much ofthe world and the U.S. Federal
Reserve (Fed) on the cusp of
raising rates, it seems logical that
bond yields will start transitioning
continues to emit a more cautious
message (Exhibit 5). The business
cycle is also growing longer in the
tooth, and the way forward may be
less uniformly sunny for investors.
Slower, but no collapse
Global economic growth has
unquestionably slowed over the past
year, with some pundits concerned
that the process is accelerating into
a more severe correction. We fail to
From a breadth perspective, only
slightly more than half of national
leading indicators are trending lower(Exhibit 6). More serious downturns,
tended to be associated with a far
more broad-based decline.
interpretation, the one-year
a relatively even split between
Exhibit 6: Economic deceleration is not unprecedented
0
10
20
30
40
50
60
70
8090
100
2001 2003 2005 2007 2009 2011 2013 2015
C o u n t r i e s w i t h r i s i n g P M I ( %
)
Note: Number of countries with positive 3-month change in Manufacturing PMI as percentageof total number of countries included in the sample. Source: Haver Analytics, RBC GAM
M o r e c o u n t r i e s
w i t h f a l l i n g P M I
M o r e c o u n t r i e s
w i t h r i s i n g P M
I
7/25/2019 Global Investment Outlook
http://slidepdf.com/reader/full/global-investment-outlook 17/80
THE GLOBAL INVESTMENT OUTLOOK New Year 2016 I 15
Exhibit 7: Some consensus forecasts fall, but others rise
-2.9-1.0
-0.6-0.5-0.5-0.5
-0.4-0.3-0.3
-0.2-0.2
-0.1-0.10.0
0.00.1
0.10.20.20.2
0.30.40.4
0.81.3
1.9
-4.0 -1.0 -0.5 0.0 0.5 1.0 1.5 2.0
GreeceBrazil
Indonesia Australia
South AfricaTurkeyMexico
ChinaU.S.
CanadaU.K.India
GermanyJapan
PortugalEurozone
FinlandSwedenFrance Austria
SpainNetherlands
ItalyIrelandCyprusRussia
Change in consensus GDP forecast over past six months (ppt)
Note: Change in rolling 1-year out consensus GDP forecast (percentage points) from April 2015 toOctober 2015. Source: Consensus Forecasts, RBC GAM
Exhibit 8: Global industrial production holding together ok
-20
-15-10
-5
0
5
10
15
2007 2008 2009 2010 2011 2012 2013 2014 2015
I n d u
s t r i a l p r o d u c t i o n
( Y
o Y % c
h a n g e )
Global Emerging markets Developed markets
Note: Country weights based on country PPP share of world total. Countries include Canada,France, Germany, Italy, Japan, Netherlands, Spain, U.K., U.S., Brazil, China, India, Indonesia,Korea, Mexico, Poland, Russia, Turkey. Source: Haver Analytics, RBC GAM
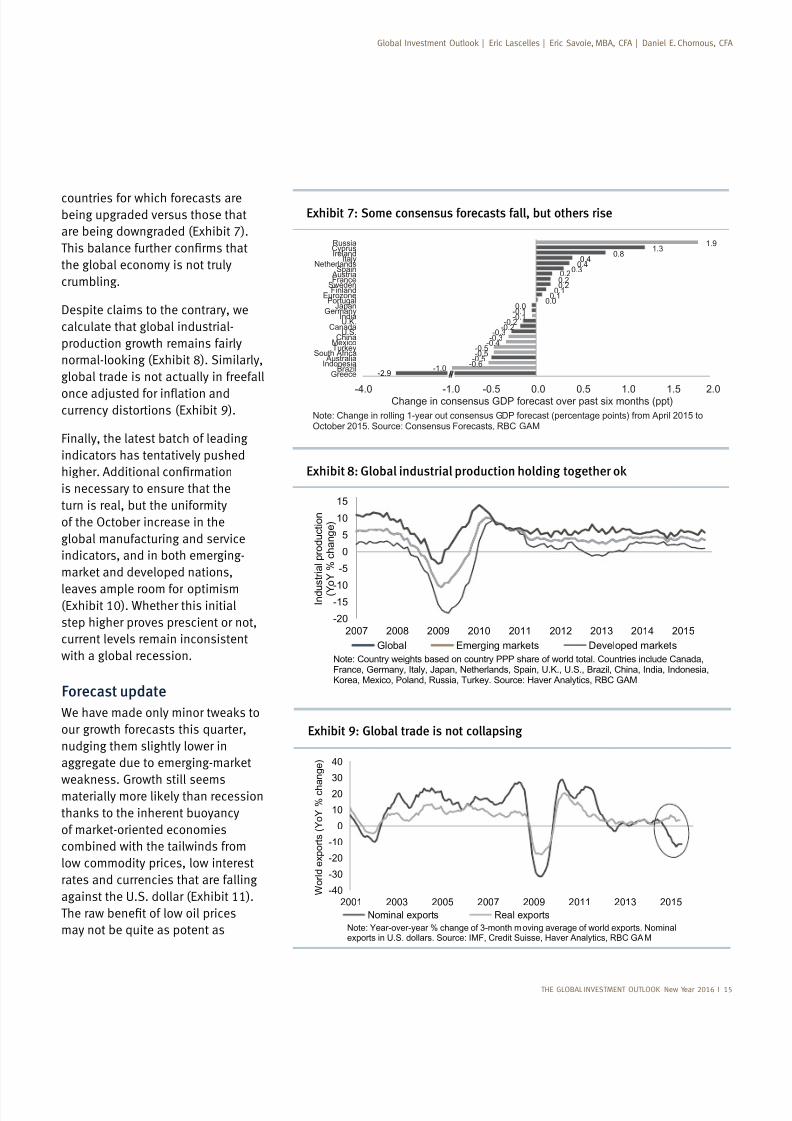
countries for which forecasts arebeing upgraded versus those that
are being downgraded (Exhibit 7).
the global economy is not truly
crumbling.
calculate that global industrial-
production growth remains fairly
global trade is not actually in freefall
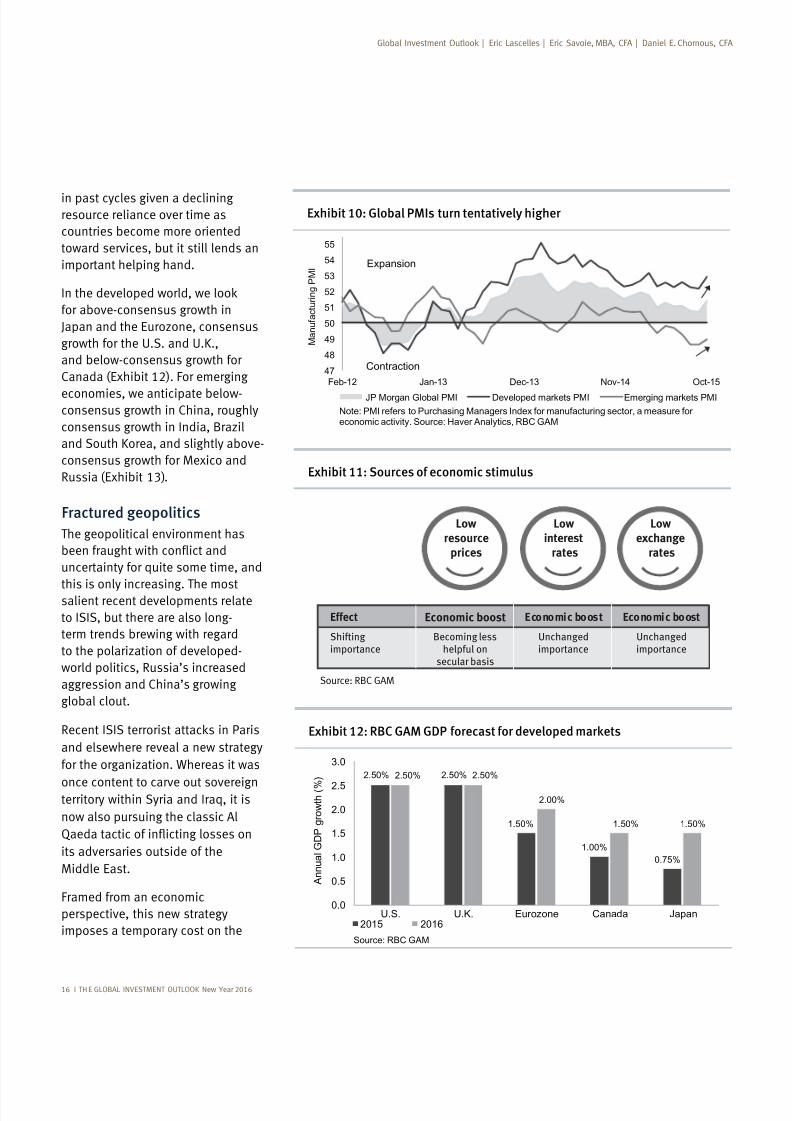
Finally, the latest batch of leading
indicators has tentatively pushed
is necessary to ensure that the
turn is real, but the uniformity
of the October increase in the
global manufacturing and service
indicators, and in both emerging-
leaves ample room for optimism(Exhibit 10). Whether this initial
step higher proves prescient or not,
current levels remain inconsistent
with a global recession.
Forecast update
our growth forecasts this quarter,
nudging them slightly lower in
combined with the tailwinds from
low commodity prices, low interest
rates and currencies that are falling
against the U.S. dollar (Exhibit 11).
may not be quite as potent as
Exhibit 9: Global trade is not collapsing
-40
-30
-20
-10
0
10
20
30
40
2001 2003 2005 2007 2009 2011 2013 2015 W o r l d e x p o r t s ( Y o Y % c h a n g e )
Nominal exports Real exports
Note: Year-over-year % change of 3-month moving average of world exports. Nominalexports in U.S. dollars. Source: IMF, Credit Suisse, Haver Analytics, RBC GAM
7/25/2019 Global Investment Outlook
http://slidepdf.com/reader/full/global-investment-outlook 18/80
16 I TH E GLOBAL INVESTMENT OUTLOOK New Year 2016
Exhibit 10: Global PMIs turn tentatively higher
47
48
49
50
51
52
53
54
55
Feb-12 Jan-13 Dec-13 Nov-14 Oct-15
M a n u f a c t u r i n g P M I
JP Morgan Global PMI Developed markets PMI Emerging markets PMI
Note: PMI refers to Purchasing Managers Index for manufacturing sector, a measure foreconomic activity. Source: Haver Analytics, RBC GAM
Contraction
Expansion
Exhibit 11: Sources of economic stimulus
Lowresource
prices
Lowinterest rates
Lowexchange
rates
Effect Economic boost Economic boost Economic boost
Shiftingimportance
Becoming lesshelpful on
secular basis
Unchangedimportance
Unchangedimportance
in past cycles given a decliningresource reliance over time as
countries become more oriented
toward services, but it still lends an
important helping hand.
for above-consensus growth in
Japan and the Eurozone, consensus
growth for the U.S. and U.K.,
and below-consensus growth for
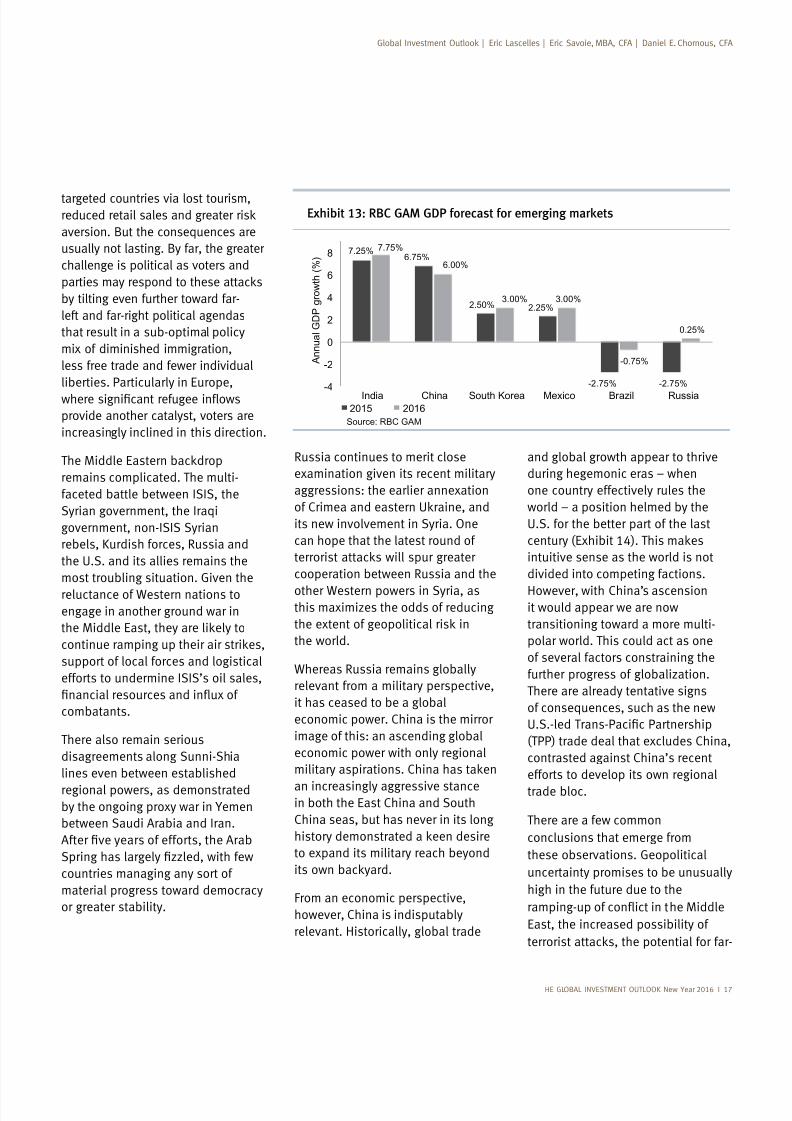
Canada (Exhibit 12). For emerging
economies, we anticipate below-consensus growth in China, roughly
consensus growth in India, Brazil
and South Korea, and slightly above-
consensus growth for Mexico and
Russia (Exhibit 13).
Fractured geopolitics
The geopolitical environment has
uncertainty for quite some time, and
this is only increasing. The mostsalient recent developments relate
to ISIS, but there are also long-
term trends brewing with regard
to the polarization of developed-
world politics, Russia’s increased
aggression and China’s growing
global clout.
and elsewhere reveal a new strategy
for the organization. Whereas it was
once content to carve out sovereignterritory within Syria and Iraq, it is
now also pursuing the classic Al
its adversaries outside of the
Middle East.
Framed from an economic
perspective, this new strategy
imposes a temporary cost on the
Exhibit 12: RBC GAM GDP forecast for developed markets
2.50% 2.50%
1.50%
1.00%
0.75%
2.50% 2.50%
2.00%
1.50% 1.50%
0.0
0.5
1.0
1.5
2.0
2.5
3.0
U.S. U.K. Eurozone Canada Japan
A n n u a l G D P g r o w t h ( %
)
2015 2016
Source: RBC GAM
Source: RBC GAM
7/25/2019 Global Investment Outlook
http://slidepdf.com/reader/full/global-investment-outlook 19/80
HE GLOBAL INVESTMENT OUTLOOK New Year 2016 I 17
targeted countries via lost tourism,
aversion. But the consequences are
usually not lasting. By far, the greater
challenge is political as voters and
by tilting even further toward far-
left and far-right political agendas
that result in a sub-optimal policy
mix of diminished immigration,
less free trade and fewer individual
liberties. Particularly in Europe,
provide another catalyst, voters are
increasingly inclined in this direction.
remains complicated. The multi-
faceted battle between ISIS, the
Syrian government, the Iraqi
government, non-ISIS Syrian
rebels, Kurdish forces, Russia and
the U.S. and its allies remains the
most troubling situation. Given the
reluctance of Western nations toengage in another ground war in
support of local forces and logistical
efforts to undermine ISIS’s oil sales,
combatants.
There also remain serious
disagreements along Sunni-Shia
lines even between established
regional powers, as demonstratedby the ongoing proxy war in Yemen
between Saudi Arabia and Iran.
countries managing any sort of
material progress toward democracy
or greater stability.
Russia continues to merit close
examination given its recent military
aggressions: the earlier annexation
its new involvement in Syria. One
can hope that the latest round of
cooperation between Russia and the
other Western powers in Syria, asthis maximizes the odds of reducing
the world.
Whereas Russia remains globally
relevant from a military perspective,
it has ceased to be a global
economic power. China is the mirror
image of this: an ascending global
economic power with only regional
an increasingly aggressive stancein both the East China and South
China seas, but has never in its long
to expand its military reach beyond
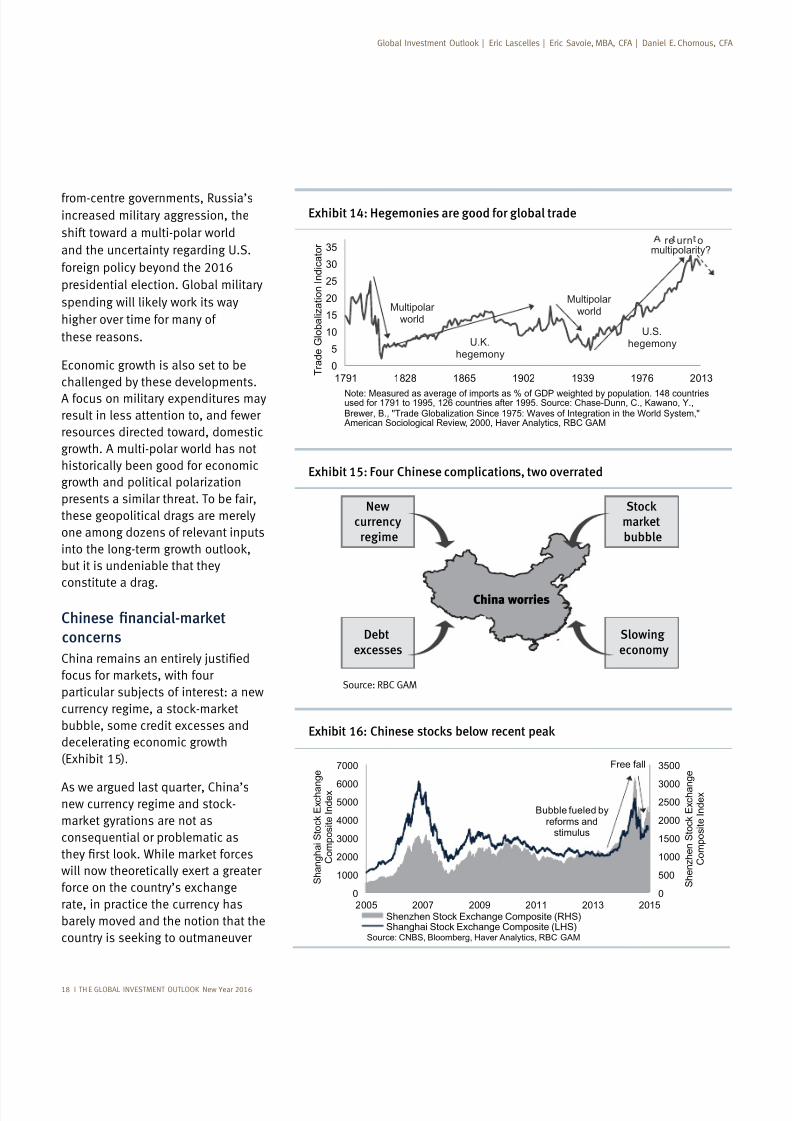
From an economic perspective,
however, China is indisputably
relevant. Historically, global trade
and global growth appear to thrive
during hegemonic eras – when
one country effectively rules the
world – a position helmed by the
U.S. for the better part of the last
intuitive sense as the world is not
divided into competing factions.
However, with China’s ascensionit would appear we are now
transitioning toward a more multi-
polar world. This could act as one
of several factors constraining the
further progress of globalization.
There are already tentative signs
of consequences, such as the new
(TPP) trade deal that excludes China,
contrasted against China’s recent
efforts to develop its own regional
trade bloc.
There are a few common
conclusions that emerge from
these observations. Geopolitical
uncertainty promises to be unusually
high in the future due to the
East, the increased possibility of
Exhibit 13: RBC GAM GDP forecast for emerging markets
7.25%6.75%
2.50% 2.25%
-2.75% -2.75%
7.75%
6.00%
3.00% 3.00%
-0.75%
0.25%
-4
-2
0
2
4
6
8
India China South Korea Mexico Brazil Russia
A n n u a l G D P g r o w t h ( % )
2015 2016
Source: RBC GAM
7/25/2019 Global Investment Outlook
http://slidepdf.com/reader/full/global-investment-outlook 20/80
New Year 2016
Exhibit 14: Hegemonies are good for global trade
0
5
10
15
20
25
30
35
1791 1828 1865 1902 1939 1976 2013 T r a d e G l o b a l i z a t i o n I n d i c a t o r
Note: Measured as average of imports as % of GDP weighted by population. 148 countriesused for 1791 to 1995, 126 countries after 1995. Source: Chase-Dunn, C., Kawano, Y.,Brewer, B., "Trade Globalization Since 1975: Waves of Integration in the World System," American Sociological Review, 2000, Haver Analytics, RBC GAM
U.K.hegemony
U.S.hegemony
Multipolar world
re urn omultipolarity?
Multipolar world
Exhibit 15: Four Chinese complications, two overrated
China worries
Newcurrency
regime
Stockmarket
bubble
Slowing
economy
Debt
excesses
from-centre governments, Russia’sincreased military aggression, the
shift toward a multi-polar world
and the uncertainty regarding U.S.
foreign policy beyond the 2016
presidential election. Global military
higher over time for many of
these reasons.
Economic growth is also set to be
challenged by these developments.
A focus on military expenditures may
result in less attention to, and fewer
resources directed toward, domestic
growth. A multi-polar world has not
historically been good for economic
growth and political polarization
presents a similar threat. To be fair,
these geopolitical drags are merely
one among dozens of relevant inputs
but it is undeniable that they
constitute a drag.
concerns
particular subjects of interest: a new
bubble, some credit excesses and
decelerating economic growth
(Exhibit 15).
As we argued last quarter, China’s
consequential or problematic as
will now theoretically exert a greater
force on the country’s exchange
rate, in practice the currency has
barely moved and the notion that the
Source: RBC GAM
Exhibit 16: Chinese stocks below recent peak
0
500
1000
1500
2000
25003000
3500
0
1000
2000
3000
4000
50006000
7000
2005 2007 2009 2011 2013 2015Shenzhen Stock Exchange Composite (RHS)Shanghai Stock Exchange Composite (LHS)
Source: CNBS, Bloomberg, Haver Analytics, RBC GAM
Bubble fueled byreforms and
stimulus
S h a n g h a i S t o c k E x c h a n
g e
C o m p o s i t e I n d e x
S h e n z h e n S t o c k E x c h a n
g e
C o m p o s i t e I n d e x
Free fall
7/25/2019 Global Investment Outlook
http://slidepdf.com/reader/full/global-investment-outlook 21/80
THE GLOBAL INVESTMENT OUTLOOK New Year
Exhibit 17: China especially vulnerable to a debt crisis
Exhibit 18: Non-performing loans in China rising
0
1
2
3
4
5
6
7
-70-60-50-40-30-20-10
010203040
5060
Mar-08 Sep-09 Mar-11 Sep-12 Mar-14 Sep-15 N o n - p e r f o r m i n g l o a n s r a t i o
( % )
N o n - p e r f o r m i n g l o a n s
( Y o Y % c
h a n g e )
NPLs YoY % change (LHS) NPLs ratio (RHS)
Note: Non-performing loans (NPLs) of commercial banks. Source: China BankingRegulatory Commission, Haver Analytics, RBC GAM
its peers via a competitivedevaluation seems unfounded given
the government’s active defense of
the yuan. China’s imminent addition
to the International Monetary Fund’s
consequential than it seems, as only
a tiny fraction of the world’s currency
reserves are actually invested in
are both highly symbolic and will
help in China’s eventual ascension
toward a more central role in the
don’t move the needle very much in
the short term. Our bias is that the
Chinese currency may decline only
modestly over the next year given
several months. The earlier decline
in equities was less consequentialthan it seems given that the
country’s equity indices are still
higher than they were a year ago,
and furthermore given the relatively
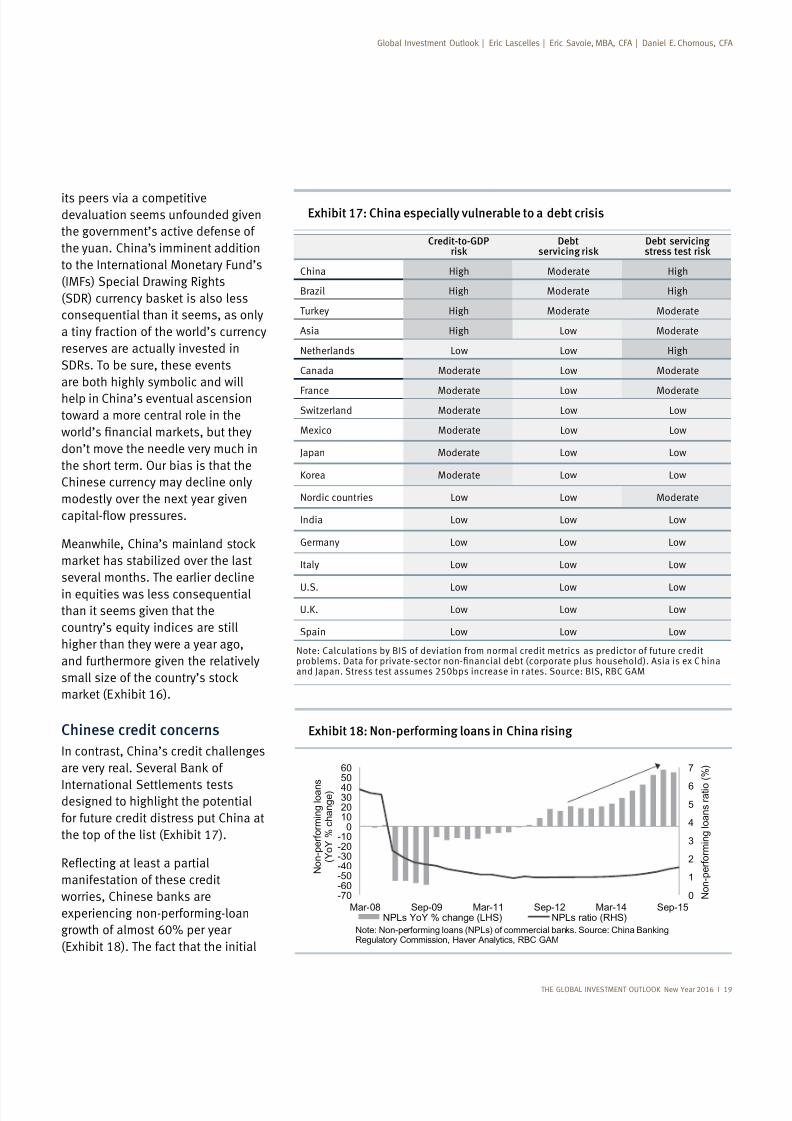
Chinese credit concerns
In contrast, China’s credit challenges
International Settlements testsdesigned to highlight the potential
for future credit distress put China at
the top of the list (Exhibit 17).
manifestation of these credit
experiencing non-performing-loan
growth of almost 60% per year
Credit-to-GDPrisk
Debtservicing risk
Debt servicingstress test risk
China High Moderate High
Brazil High Moderate High
High Moderate Moderate
Asia High Low Moderate
Netherlands Low Low High
Canada Moderate Low Moderate
France Moderate Low Moderate
Switzerland Moderate Low Low
Mexico Moderate Low Low
Japan Moderate Low Low
Korea Moderate Low Low
Nordic countries Low Low Moderate
India Low Low Low
Germany Low Low Low
Italy Low Low Low
U.S. Low Low Low
U.K. Low Low Low
Spain Low Low Low
Note: Calculations by BIS of deviation from normal credit metrics as predictor of future credit and Japan. Stress test assumes 250bps increase in r ates. Source: BIS, RBC GAM
7/25/2019 Global Investment Outlook
http://slidepdf.com/reader/full/global-investment-outlook 22/80
20 I TH E GLOBAL INVESTMENT OUTLOOK New Year 2016
Exhibit 19: Chinese private credit growth slowing
10
15
20
25
30
35
40
2007 2008 2009 2010 2011 2012 2013 2014 2015
T o t a l s o c i a l f i n a n c i n g
( Y o Y % c h a n g e )
Source: Haver Analytics, RBC GAM
Downward trend tolowest growth rate
sincepre-crisis
Exhibit 20: Chinese home prices rebound
-6
-4
-2
0
2
4
6
8
10
12
Mar-12 Sep-12 Mar-13 Sep-13 Mar-14 Sep-14 Mar-15 Sep-15
1 0 0 - c i t y a v e
r a g e h o m e p r i c e s
( Y o Y
% c h a n g e )
Source: China Index Academy/Soufun, Haver Analytics, RBC GAM
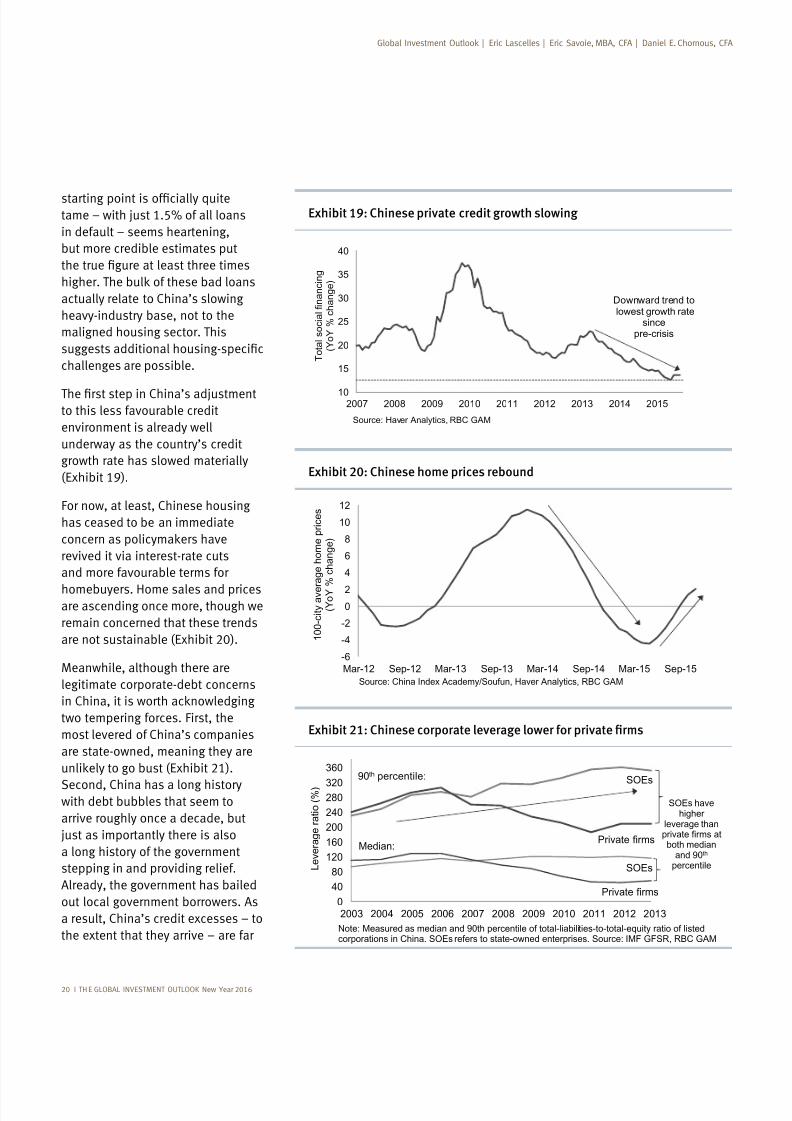
tame – with just 1.5% of all loans
in default – seems heartening,
but more credible estimates put
actually relate to China’s slowing
heavy-industry base, not to the
maligned housing sector. This
challenges are possible.
to this less favourable credit
environment is already well
underway as the country’s credit
growth rate has slowed materially
For now, at least, Chinese housing
has ceased to be an immediate
revived it via interest-rate cuts
and more favourable terms for
homebuyers. Home sales and pricesare ascending once more, though we
remain concerned that these trends
are not sustainable (Exhibit 20).
Meanwhile, although there are
legitimate corporate-debt concerns
two tempering forces. First, the
most levered of China’s companies
are state-owned, meaning they are
Second, China has a long historywith debt bubbles that seem to
arrive roughly once a decade, but
just as importantly there is also
a long history of the government
stepping in and providing relief.
Already, the government has bailed
out local government borrowers. As
a result, China’s credit excesses – to
the extent that they arrive – are far
0
40
80
120
160
200
240
280320
360
2003 2004 2005 2006 2007 2008 2009 2010 2011 2012 2013
L e v e r a g e r a t i o ( % )
Note: Measured as median and 90th percentile of total-liabilities-to-total-equity ratio of listedcorporations in China. SOEs refers to state-owned enterprises. Source: IMF GFSR, RBC GAM
SOEs
Private firms
SOEs
Private firms
SOEs havehigher
leverage thanprivate firms atboth median
and 90th
percentile
90th percentile:
Median:
7/25/2019 Global Investment Outlook
http://slidepdf.com/reader/full/global-investment-outlook 23/80
THE GLOBAL INVESTMENT OUTLOOK New Year 2016 I 21
Exhibit 22: China rebalancing to slower growth
-3
-2
-1
0
1
2
3
4
5
6
7
8
9
10
11
12
13
14
15
1995 1999 2003 2007 2011 2015
E c o n o m i c A c t i v i t y I n d e x
( s t a n d a r d d e v i a t i o n s f r o m
h i s t o r i c a l n o r m )
C h i n a G D P g r o w t h
( Y o Y % c h a n g e )
GDP Growth (LHS) Economic Activity Index (RHS)Note: Index constructed using sixteen proxies for real economic activity in China.Source: Bloomberg, Haver Analytics, RBC GAM
-100
-50
0
50
2008 2009 2010 2011 2012 2013 2014 2015 C h a n g e i n c e n t r a l b a n k p o l i c y r a t e s
( % r a i s i n g
/ c u t t i n g i n m o n t h )
% of central banks tightening % of central banks easing
Net % of banks easingNote: Based on policy rate for 30 countries. Source: Haver Analytics, RBC GAM
Widespread easingin reaction tofinancial crisis
Emergingmarket ledtightening
Persistentlyaccomodative policy
Tightening
Easing
economic growth than to manifest
the world.
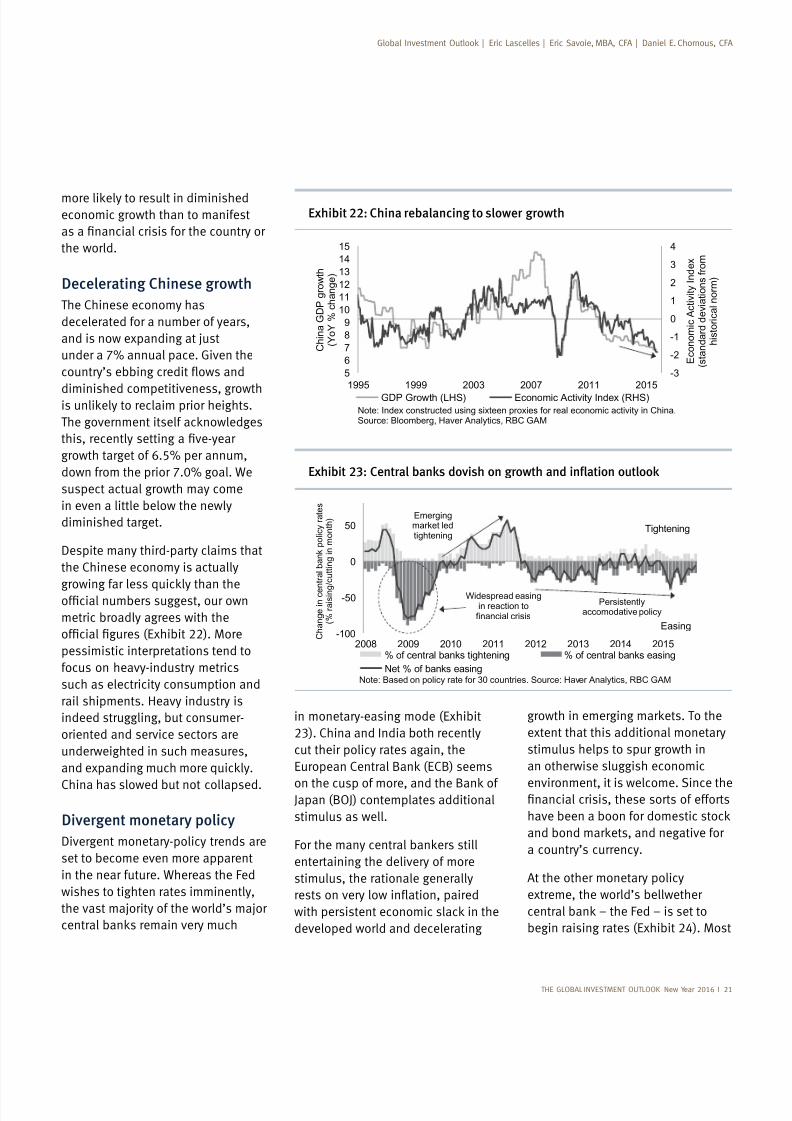
Decelerating Chinese growth
The Chinese economy has
decelerated for a number of years,
and is now expanding at just
under a 7% annual pace. Given the
diminished competitiveness, growth
growth target of 6.5% per annum,
down from the prior 7.0% goal. We
suspect actual growth may come
in even a little below the newly
diminished target.
the Chinese economy is actually
metric broadly agrees with the
pessimistic interpretations tend to
focus on heavy-industry metrics
such as electricity consumption and
rail shipments. Heavy industry is
indeed struggling, but consumer-
oriented and service sectors are
underweighted in such measures,
China has slowed but not collapsed.
Divergent monetary policy
set to become even more apparent
in the near future. Whereas the Fed
wishes to tighten rates imminently,
the vast majority of the world’s major
in monetary-easing mode (Exhibit
23). China and India both recently
cut their policy rates again, the
Japan (BOJ) contemplates additional
stimulus as well.
entertaining the delivery of more
stimulus, the rationale generally
developed world and decelerating
extent that this additional monetary
stimulus helps to spur growth in
an otherwise sluggish economic
environment, it is welcome. Since the
a country’s currency.
At the other monetary policy
extreme, the world’s bellwether
begin raising rates (Exhibit 24). Most
7/25/2019 Global Investment Outlook
http://slidepdf.com/reader/full/global-investment-outlook 24/80
22 I TH E GLOBAL INVESTMENT OUTLOOK New Year 2016
Exhibit 25: Complexity need not be paralyzing
Stronger exchange rate
Lower commodity prices
Bond sell-off
Lower stocks
Higher borrowing cost
Possible debt problems
Lower profit
Lower wagesRate hike
+ 25 bpsrate hike
-0.1 to -0.4 ppt
GDP growth
Yes, the world is complicated, but the collective effect is modest:
=
Exhibit 26: Post-supercyle era for commodities
0
100
200
300
400
500
600
700800
900
2005 2007 2009 2011 2013 2015
S & P G o l d m a n S a c h s
C o m m o d i t y I n d e x
Note: Historical low since July 2005. Source: Haver Analytics, RBC GAM
Initial commodity
rout
Second wave andhovering near lowHistorical
low
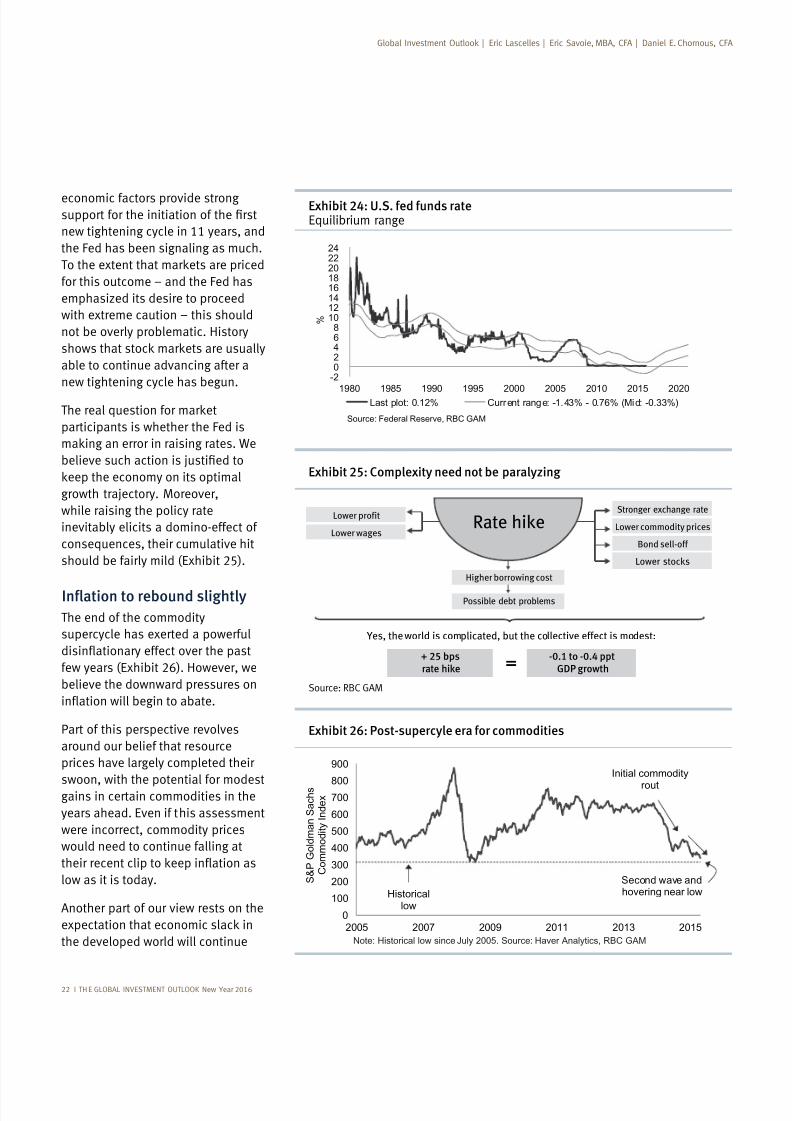
economic factors provide strong
new tightening cycle in 11 years, and
the Fed has been signaling as much.
for this outcome – and the Fed has
emphasized its desire to proceed
with extreme caution – this should
not be overly problematic. History
able to continue advancing after a
new tightening cycle has begun.
participants is whether the Fed is
growth trajectory. Moreover,
while raising the policy rate
inevitably elicits a domino-effect of
consequences, their cumulative hit
should be fairly mild (Exhibit 25).
The end of the commodity
supercycle has exerted a powerful
few years (Exhibit 26). However, we
believe the downward pressures on
Part of this perspective revolves
around our belief that resource
prices have largely completed their
swoon, with the potential for modestgains in certain commodities in the
years ahead. Even if this assessment
were incorrect, commodity prices
would need to continue falling at
low as it is today.
Another part of our view rests on the
the developed world will continue
Source: RBC GAM
Exhibit 24: U.S. fed funds rateEquilibrium range
-202468
1012141618202224
1980 1985 1990 1995 2000 2005 2010 2015 2020
%
Last plot: 0.12% Current range: -1.43% - 0.76% (Mid: -0.33%)
Source: Federal Reserve, RBC GAM
7/25/2019 Global Investment Outlook
http://slidepdf.com/reader/full/global-investment-outlook 25/80
THE GLOBAL INVESTMENT OUTLOOK New Year 2016 I 23
Exhibit 27: RBC GAM CPI forecast for developed markets
1.00%
0.50%
0.00% 0.00% 0.00%
1.75%
1.50% 1.50% 1.50%
1.00%
0.0
0.5
1.0
1.5
2.0
Canada Japan U.K. U.S. Eurozone
Y o Y C P I c h a n g e ( % )
2015 2016
Source: RBC GAM
Exhibit 28: Outlook for world oil demand more optimistic
84
86
8890
92
94
96
98
2010 2011 2012 2013 2014 2015 2016
W o r l d c r u d e o i l d e m a n d
( m i l l i o n b b l / d a y )
World demand (historical) Jan April Sept Oct
October
Forecast
Note: Shaded area represents EIA forecast. Source: OECD,EIA, Haver Analytics, RBC GAM
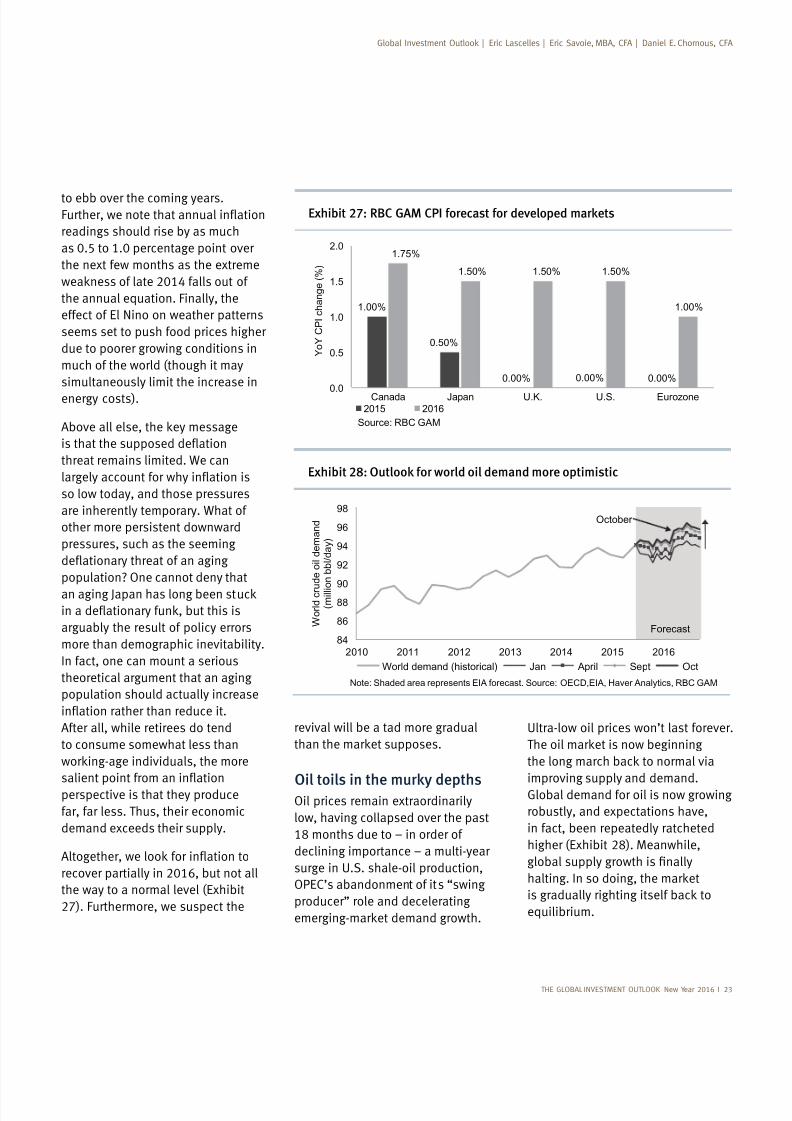
to ebb over the coming years.
readings should rise by as much
as 0.5 to 1.0 percentage point over
the next few months as the extreme
the annual equation. Finally, the
effect of El Nino on weather patterns
seems set to push food prices higher
due to poorer growing conditions in
much of the world (though it may
simultaneously limit the increase in
energy costs).
threat remains limited. We can
so low today, and those pressures
are inherently temporary. What of
other more persistent downward
pressures, such as the seeming
population? One cannot deny that
arguably the result of policy errors
more than demographic inevitability.
In fact, one can mount a serious
theoretical argument that an aging
population should actually increase
After all, while retirees do tend
to consume somewhat less than
perspective is that they produce
far, far less. Thus, their economic
demand exceeds their supply.
recover partially in 2016, but not all
the way to a normal level (Exhibit
27). Furthermore, we suspect the
revival will be a tad more gradual
Oil toils in the murky depthsOil prices remain extraordinarily
low, having collapsed over the past
declining importance – a multi-year
surge in U.S. shale-oil production,
OPEC’s abandonment of its “swing
producer” role and decelerating
Ultra-low oil prices won’t last forever.
improving supply and demand.
Global demand for oil is now growing
robustly, and expectations have,
in fact, been repeatedly ratcheted
equilibrium.
7/25/2019 Global Investment Outlook
http://slidepdf.com/reader/full/global-investment-outlook 26/80
24 I TH E GLOBAL INVESTMENT OUTLOOK New Year 2016
Exhibit 29: U.S. crude-oil production off its peak
9.0
9.1
9.2
9.3
9.4
9.5
9.6
Jan-2015 Apr-2015 Jul-2015 Nov-2015
U . S . c r u d e p r o d u c t i o n
( m i l l i o n b b l / d a y )
Source: EIA, Haver Analytics, RBC GAM
Exhibit 30: World oil-supply forecast revised upwards
84
86
8890
92
94
96
98
2010 2011 2012 2013 2014 2015 2016
W o r l d c r
u d e o i l s u p p l y
( m i l l i o n b b l / d a y )
World production (historical) Jan April Sept Oct
October
Forecast
Note: Shaded area represents EIA forecast. Source: OECD, EIA, Haver Analytics, RBC GAM
Exhibit 31: Bearish scenario for oil still revolves around inventories
Max=343Min=322
Max=362
Min=330
300
320
340
360
380
400
420
440
460
480
500
1 4 7 10 13 16 19 22 25 28 31 34 37 40 43 46 49 52
C o m m e r c i a l c r u d e i n v e n t o
r y
( m i l l i o n b a r r e l s )
Weekly average (2005-2014) Weekly average (1983-2014)Source: EIA, RBC GAM
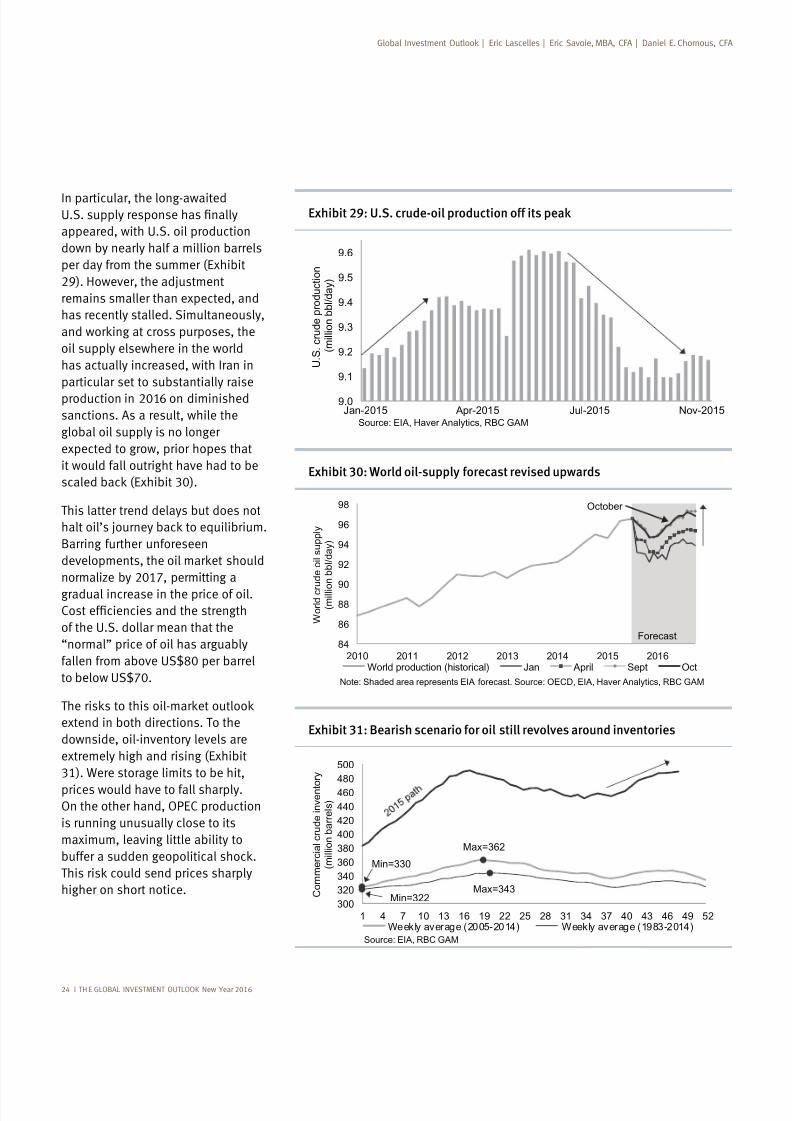
In particular, the long-awaited
appeared, with U.S. oil production
down by nearly half a million barrels
per day from the summer (Exhibit
remains smaller than expected, and
has recently stalled. Simultaneously,
oil supply elsewhere in the world
has actually increased, with Iran in
particular set to substantially raise
production in 2016 on diminished
sanctions. As a result, while the
global oil supply is no longer
expected to grow, prior hopes that
it would fall outright have had to be
This latter trend delays but does not
Barring further unforeseen
normalize by 2017, permitting a
gradual increase in the price of oil.
of the U.S. dollar mean that the
“normal” price of oil has arguably
to below US$70.
extend in both directions. To the
downside, oil-inventory levels are
extremely high and rising (Exhibit
31). Were storage limits to be hit,
prices would have to fall sharply.On the other hand, OPEC production
is running unusually close to its
maximum, leaving little ability to
higher on short notice.
7/25/2019 Global Investment Outlook
http://slidepdf.com/reader/full/global-investment-outlook 27/80
THE GLOBAL INVESTMENT OUTLOOK New Year 2016 I 25
Exhibit 32: U.S. job market improving
0.0
0.1
0.2
0.3
0.4
0.5
0.6
0.7
0.8
0.9
1.0
2001 2003 2005 2007 2009 2011 2013 2015
J o b o p e n i n g s t o u n e m p l o y m e n t
r a t i o
Source: BLS, Haver Analytics, RBC GAM
Back to pre-crisis peak
Exhibit 33: U.S. real personal income rising briskly
-6
-4
-2
0
2
4
6
8
1999 2001 2003 2005 2007 2009 2011 2013 2015
U . S . r e a l p e r s o n a l i n c o m e
( Y o Y %
c h a n g e )
Source: Haver Analytics, RBC GAM
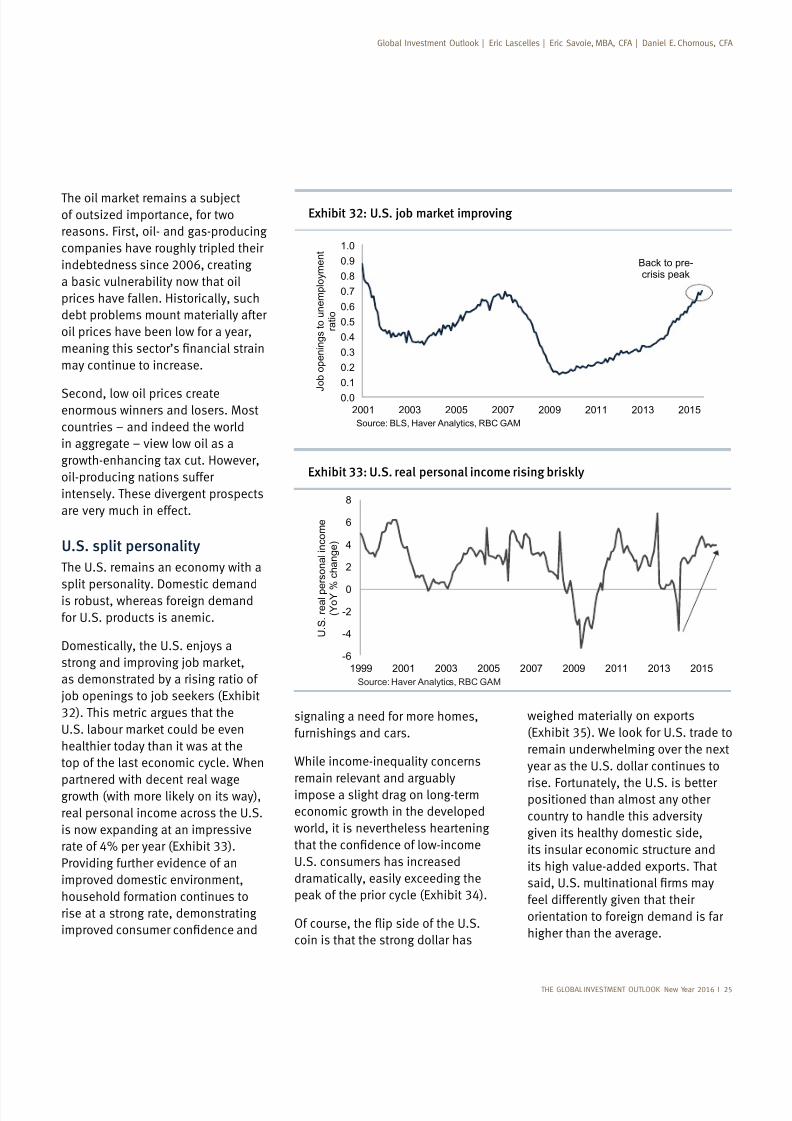
of outsized importance, for two
reasons. First, oil- and gas-producing
companies have roughly tripled their
indebtedness since 2006, creating
a basic vulnerability now that oil
prices have fallen. Historically, such
debt problems mount materially after
oil prices have been low for a year,
may continue to increase.
Second, low oil prices createenormous winners and losers. Most
countries – and indeed the world
in aggregate – view low oil as a
growth-enhancing tax cut. However,
oil-producing nations suffer
intensely. These divergent prospects
are very much in effect.
U.S. split personality
The U.S. remains an economy with a
is robust, whereas foreign demand
for U.S. products is anemic.
as demonstrated by a rising ratio of
32). This metric argues that the
healthier today than it was at the
top of the last economic cycle. When
partnered with decent real wage
real personal income across the U.S.
is now expanding at an impressive
rate of 4% per year (Exhibit 33).
Providing further evidence of an
improved domestic environment,
household formation continues to
rise at a strong rate, demonstrating
signaling a need for more homes,
furnishings and cars.
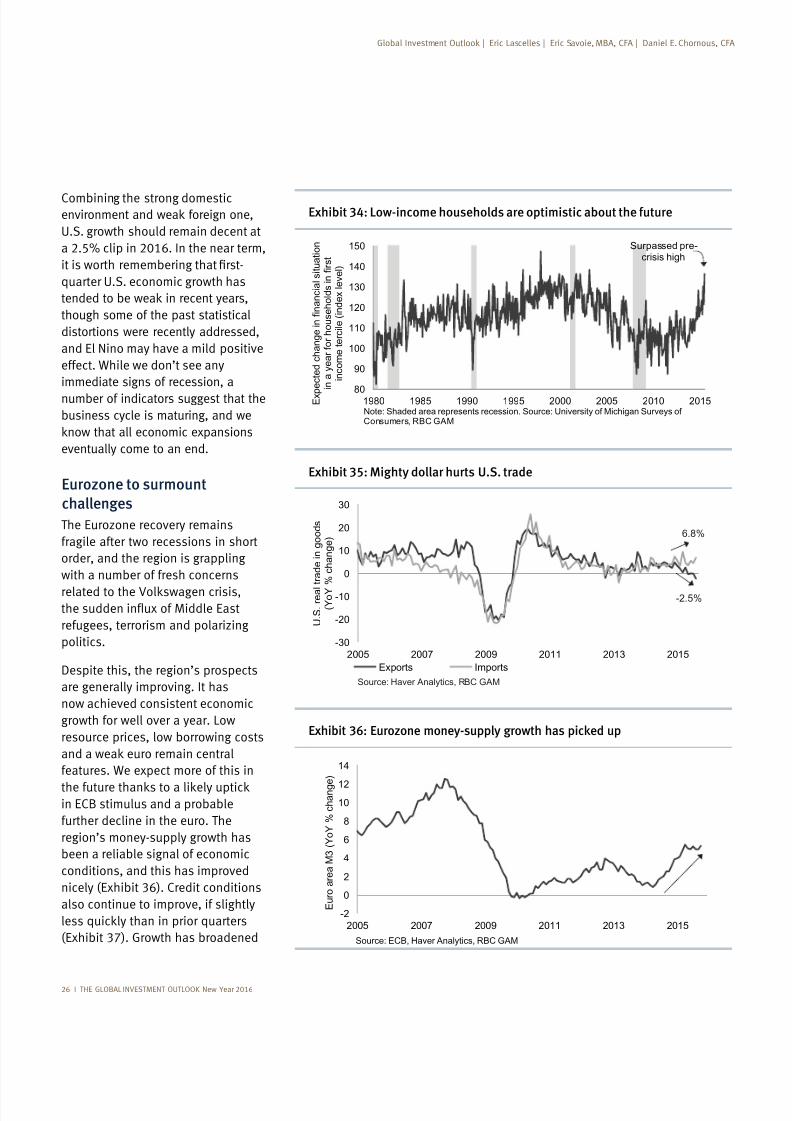
While income-inequality concerns
remain relevant and arguably
impose a slight drag on long-term
economic growth in the developed
world, it is nevertheless heartening
U.S. consumers has increased
dramatically, easily exceeding the
coin is that the strong dollar has
weighed materially on exports
remain underwhelming over the next
year as the U.S. dollar continues to
rise. Fortunately, the U.S. is betterpositioned than almost any other
country to handle this adversity
given its healthy domestic side,
its insular economic structure and
its high value-added exports. That
feel differently given that their
orientation to foreign demand is far
higher than the average.
7/25/2019 Global Investment Outlook
http://slidepdf.com/reader/full/global-investment-outlook 28/80
26 I THE GLOBAL INVESTMENT OUTLOOK New Year 2016
Exhibit 35: Mighty dollar hurts U.S. trade
-30
-20
-10
0
10
20
30
2005 2007 2009 2011 2013 2015
U . S . r e a l t r a d e i n g o o d s
( Y o Y
% c
h a n g e )
Exports Imports
Source: Haver Analytics, RBC GAM
6.8%
-2.5%
Exhibit 36: Eurozone money-supply growth has picked up
-2
0
2
4
6
8
10
12
14
2005 2007 2009 2011 2013 2015
E u r o a r e a M 3 ( Y o Y %
c h a n g e )
Source: ECB, Haver Analytics, RBC GAM
Combining the strong domesticenvironment and weak foreign one,
U.S. growth should remain decent at
a 2.5% clip in 2016. In the near term,
it is worth remembering that first-
quarter U.S. economic growth has
tended to be weak in recent years,
though some of the past statistical
distortions were recently addressed,
and El Nino may have a mild positive
effect. While we don’t see any
immediate signs of recession, a
number of indicators suggest that the
business cycle is maturing, and we
know that all economic expansions
eventually come to an end.
Eurozone to surmount
challenges
The Eurozone recovery remains
fragile after two recessions in short
order, and the region is grappling
with a number of fresh concerns
related to the Volkswagen crisis,the sudden influx of Middle East
refugees, terrorism and polarizing
politics.
Despite this, the region’s prospects
are generally improving. It has
now achieved consistent economic
growth for well over a year. Low
resource prices, low borrowing costs
and a weak euro remain central
features. We expect more of this in
the future thanks to a likely uptickin ECB stimulus and a probable
further decline in the euro. The
region’s money-supply growth has
been a reliable signal of economic
conditions, and this has improved
nicely (Exhibit 36). Credit conditions
also continue to improve, if slightly
less quickly than in prior quarters
(Exhibit 37). Growth has broadened
Global Investment Outlook | Eric Lascelles | Eric Savoie, MBA, CFA | Daniel E. Chornous, CFA
Exhibit 34: Low-income households are optimistic about the future
80
90
100
110
120
130
140
150
1980 1985 1990 1995 2000 2005 2010 2015Note: Shaded area represents recession. Source: University of Michigan Surveys ofConsumers, RBC GAM
Surpassed pre-crisis high
E x p
e c
t e d c
h a n g e
i n f i n a n c
i a l s
i t u a
t i o n
i n a y e a r
f o r
h o u s e
h o
l d s
i n f i r s t
i n c o m e
t e r c
i l e ( i n d e x
l e v e
l )
7/25/2019 Global Investment Outlook
http://slidepdf.com/reader/full/global-investment-outlook 29/80
THE GLOBAL INVESTMENT OUTLOOK New Year 2016 I 27
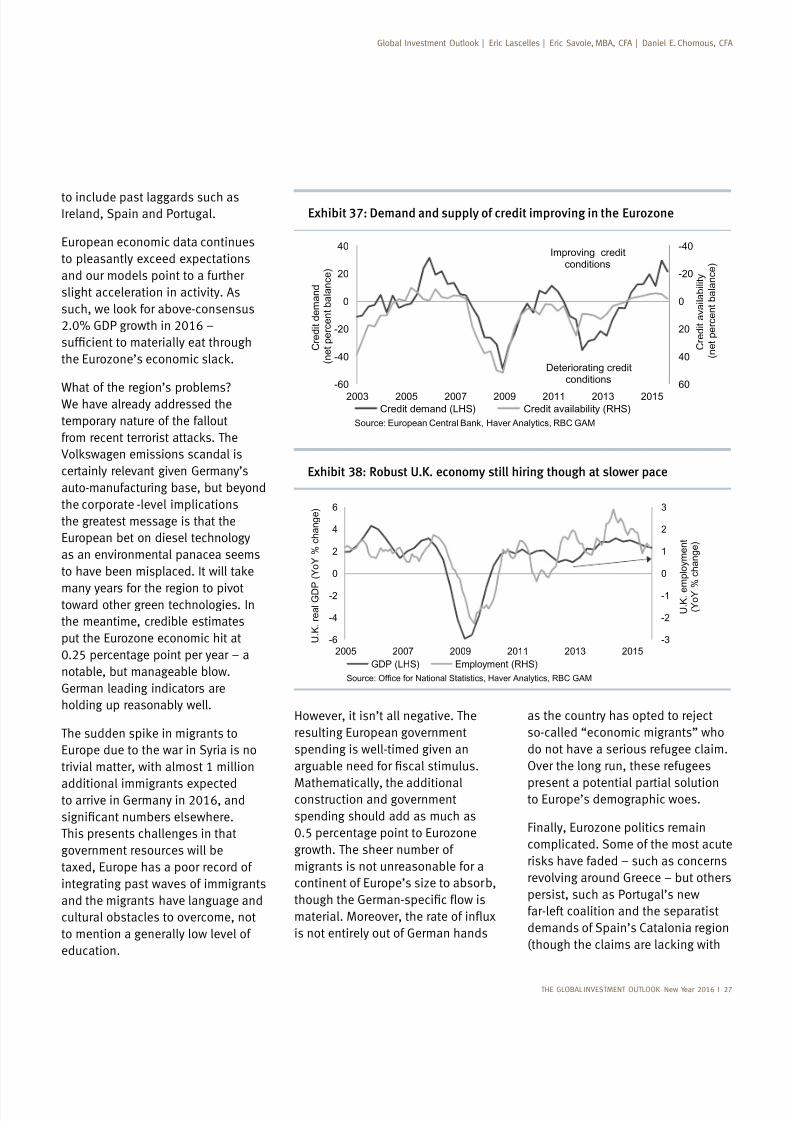
to include past laggards such asIreland, Spain and Portugal.
European economic data continues
to pleasantly exceed expectations
and our models point to a further
slight acceleration in activity. As
What of the region’s problems?We have already addressed the
temporary nature of the fallout
certainly relevant given Germany’s
auto-manufacturing base, but beyond
the corporate -level implications
the greatest message is that the
European bet on diesel technology
as an environmental panacea seems
many years for the region to pivottoward other green technologies. In
the meantime, credible estimates
put the Eurozone economic hit at
0.25 percentage point per year – a
notable, but manageable blow.
German leading indicators are
holding up reasonably well.
Europe due to the war in Syria is no
trivial matter, with almost 1 million
additional immigrants expectedto arrive in Germany in 2016, and
This presents challenges in that
government resources will be
taxed, Europe has a poor record of
integrating past waves of immigrants
and the migrants have language and
cultural obstacles to overcome, not
to mention a generally low level of
education.
Exhibit 37: Demand and supply of credit improving in the Eurozone
-40
-20
0
20
40
60-60
-40
-20
0
20
40
2003 2005 2007 2009 2011 2013 2015
C r e d i t a v a i l a b i l i t y
( n e t p e r c e n t b a l a n c e )
C r e d i t d e m a n d
( n e t p e r c e n t b a l a n c e )
Credit demand (LHS) Credit availability (RHS)
Source: European Central Bank, Haver Analytics, RBC GAM
Improving creditconditions
Deteriorating creditconditions
Exhibit 38: Robust U.K. economy still hiring though at slower pace
-3
-2
-1
0
1
2
3
-6
-4
-2
0
2
4
6
2005 2007 2009 2011 2013 2015
U . K . e m p l o y m e n t
( Y o Y % c h a n g e )
U . K . r e a l G D P ( Y o Y % c h a n g e )
GDP (LHS) Employment (RHS)
Source: Office for National Statistics, Haver Analytics, RBC GAM
However, it isn’t all negative. The
resulting European government
spending is well-timed given an
Mathematically, the additionalconstruction and government
spending should add as much as
0.5 percentage point to Eurozone
growth. The sheer number of
migrants is not unreasonable for a
continent of Europe’s size to absorb,
is not entirely out of German hands
as the country has opted to reject
so-called “economic migrants” who
do not have a serious refugee claim.
Over the long run, these refugees
present a potential partial solutionto Europe’s demographic woes.
Finally, Eurozone politics remain
complicated. Some of the most acute
revolving around Greece – but others
persist, such as Portugal’s new
far-left coalition and the separatist
demands of Spain’s Catalonia region
7/25/2019 Global Investment Outlook
http://slidepdf.com/reader/full/global-investment-outlook 30/80
New Year 2016
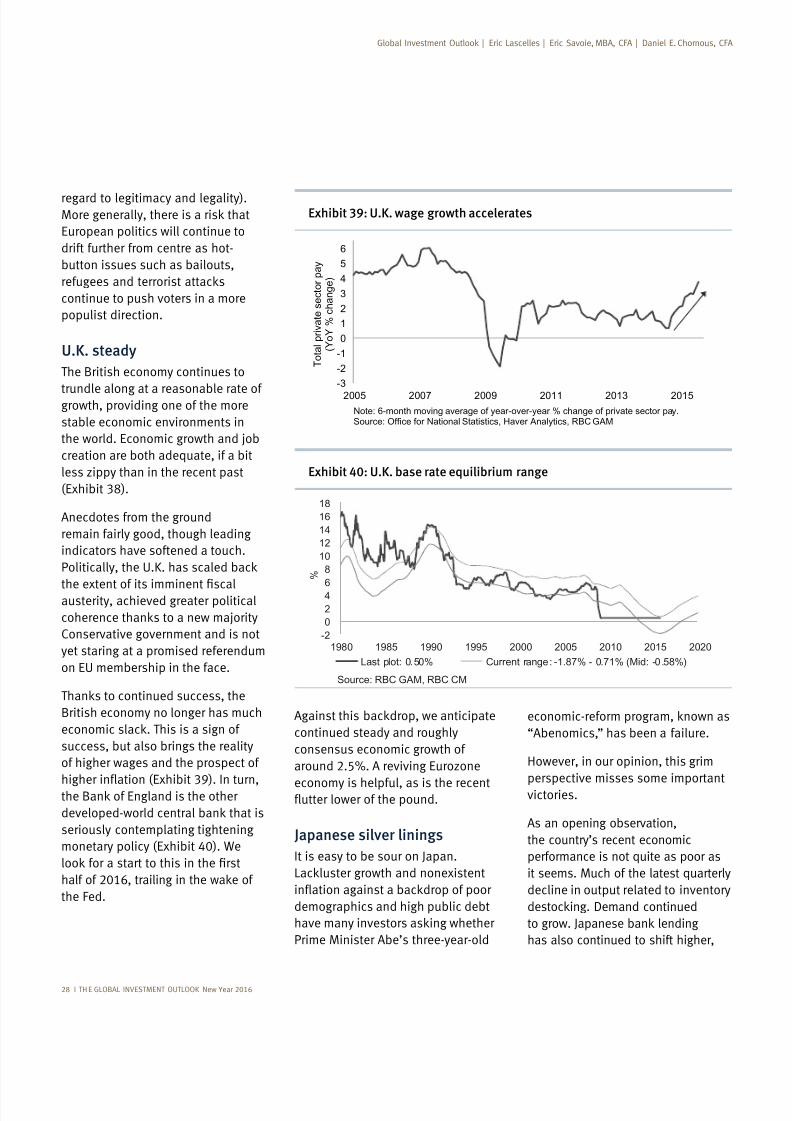
regard to legitimacy and legality).
European politics will continue to
drift further from centre as hot-
button issues such as bailouts,
continue to push voters in a more
populist direction.
U.K. steady
The British economy continues to
trundle along at a reasonable rate ofgrowth, providing one of the more
stable economic environments in
the world. Economic growth and job
creation are both adequate, if a bit
less zippy than in the recent past
Anecdotes from the ground
remain fairly good, though leading
indicators have softened a touch.
austerity, achieved greater political
Conservative government and is not
yet staring at a promised referendum
on EU membership in the face.
British economy no longer has much
success, but also brings the reality
of higher wages and the prospect of
seriously contemplating tightening
monetary policy (Exhibit 40). We
the Fed.
continued steady and roughly
consensus economic growth of
around 2.5%. A reviving Eurozone
economy is helpful, as is the recent
Japanese silver linings
It is easy to be sour on Japan.
demographics and high public debt
Prime Minister Abe’s three-year-old
“Abenomics,” has been a failure.
However, in our opinion, this grim
perspective misses some important
victories.
As an opening observation,
the country’s recent economic
performance is not quite as poor as
it seems. Much of the latest quarterly
decline in output related to inventory
has also continued to shift higher,
Exhibit 39: U.K. wage growth accelerates
-3
-2
-1
0
1
2
3
4
5
6
2005 2007 2009 2011 2013 2015
T o t a l p r i v a t e s e c t o r p a y
( Y o Y % c h a n g e )
Note: 6-month moving average of year-over-year % change of private sector pay.Source: Office for National Statistics, Haver Analytics, RBC GAM
Exhibit 40: U.K. base rate equilibrium range
-2
0
2
4
6
8
10
12
14
16
18
1980 1985 1990 1995 2000 2005 2010 2015 2020
%
Last plot: 0.50% Current range: -1.87% - 0.71% (Mid: -0.58%)
Source: RBC GAM, RBC CM
7/25/2019 Global Investment Outlook
http://slidepdf.com/reader/full/global-investment-outlook 31/80
THE GLOBAL INVESTMENT OUTLOOK New Year 2016
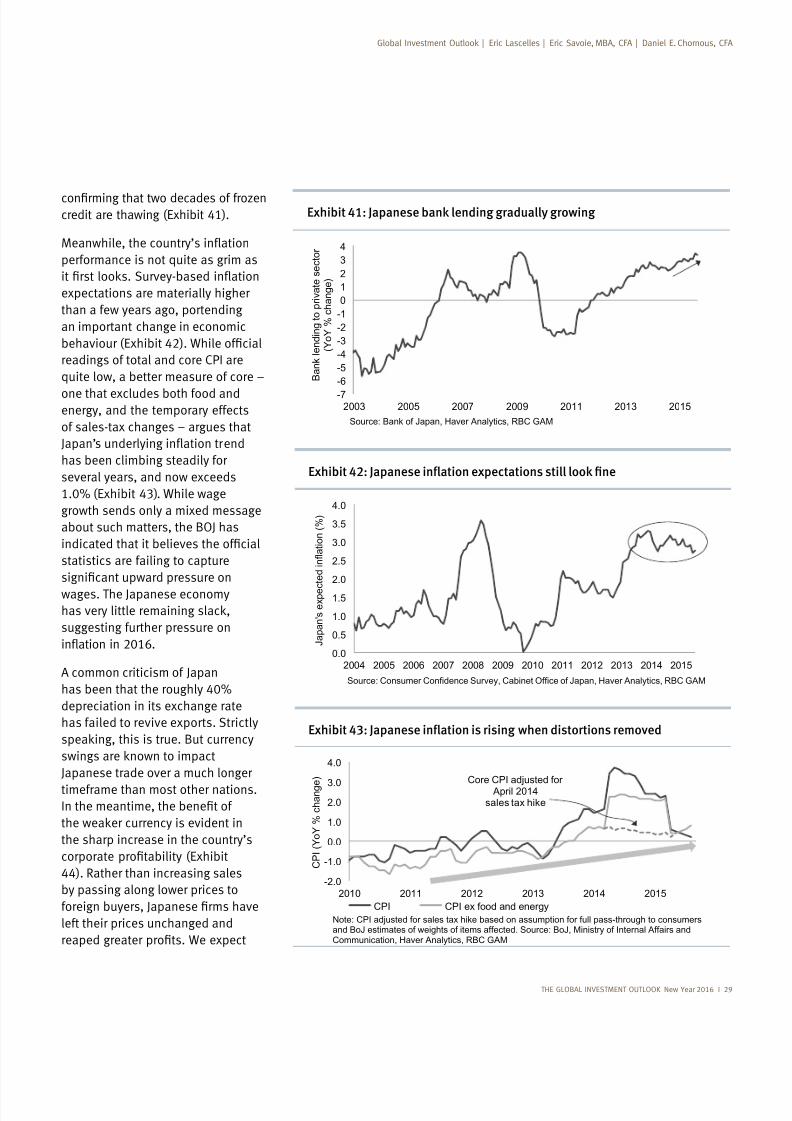
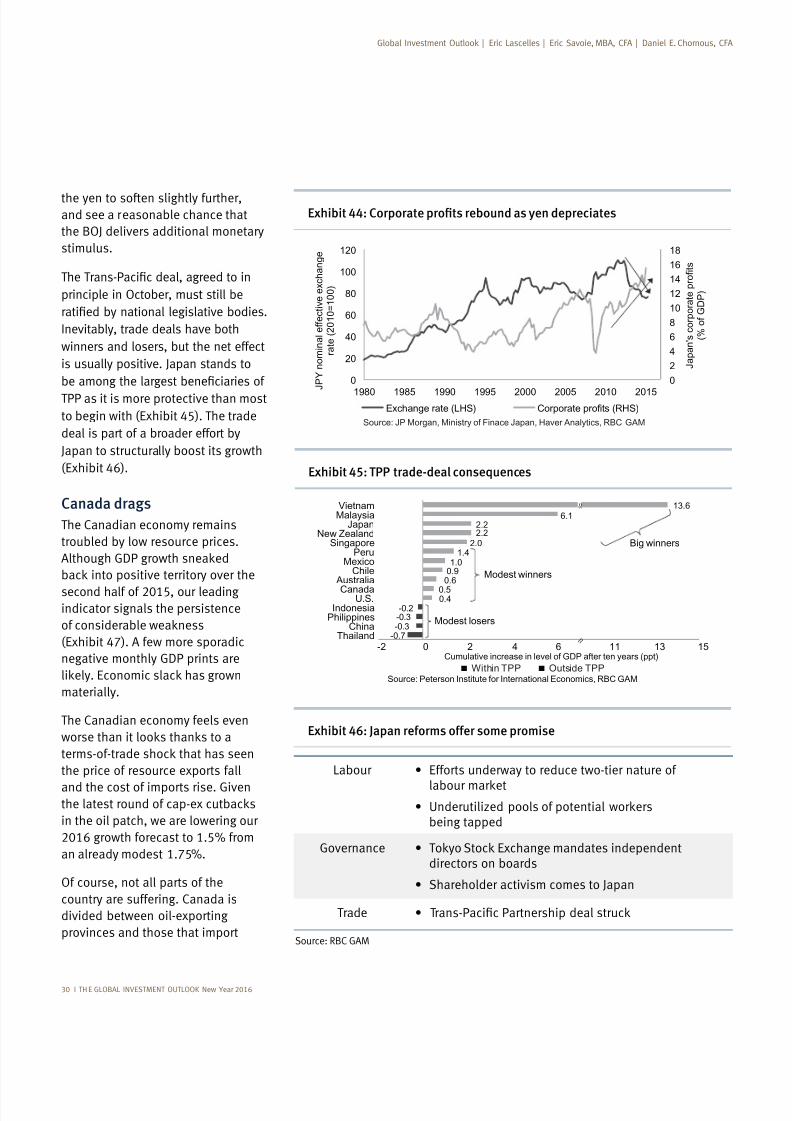
credit are thawing (Exhibit 41).
performance is not quite as grim as
expectations are materially higher
than a few years ago, portending
an important change in economic
readings of total and core CPI are
quite low, a better measure of core –
one that excludes both food andenergy, and the temporary effects
of sales-tax changes – argues that
has been climbing steadily for
several years, and now exceeds
1.0% (Exhibit 43). While wage
growth sends only a mixed message
about such matters, the BOJ has
statistics are failing to capture
wages. The Japanese economy
suggesting further pressure on
A common criticism of Japan
has been that the roughly 40%
depreciation in its exchange rate
has failed to revive exports. Strictly
Japanese trade over a much longer
timeframe than most other nations.
the sharp increase in the country’s
44). Rather than increasing sales
by passing along lower prices to
left their prices unchanged and
-7
-6
-5
-4
-3
-2
-1
0
1
2
3
4
2003 2005 2007 2009 2011 2013 2015
B a n k l e n d i n g t o p r i v a t e s e c t o r
( Y o Y % c h a n g e )
Source: Bank of Japan, Haver Analytics, RBC GAM
Exhibit 41: Japanese bank lending gradually growing
0.0
0.5
1.0
1.5
2.0
2.5
3.0
3.5
4.0
2004 2005 2006 2007 2008 2009 2010 2011 2012 2013 2014 2015
J a p a n ' s e x p e c t e d i n f l a t i o n ( % )
Source: Consumer Confidence Survey, Cabinet Office of Japan, Haver Analytics, RBC GAM
-2.0
-1.0
0.0
1.0
2.03.0
4.0
2010 2011 2012 2013 2014 2015
C P I ( Y o Y % c h a n g e )
CPI CPI ex food and energy
Note: CPI adjusted for sales tax hike based on assumption for full pass-through to consumersand BoJ estimates of weights of items affected. Source: BoJ, Ministry of Internal Affairs andCommunication, Haver Analytics, RBC GAM
Core CPI adjusted for April 2014
sales tax hike
7/25/2019 Global Investment Outlook
http://slidepdf.com/reader/full/global-investment-outlook 32/80
30 I TH E GLOBAL INVESTMENT OUTLOOK New Year 2016
the yen to soften slightly further,and see a reasonable chance that
the BOJ delivers additional monetary
stimulus.
principle in October, must still be
Inevitably, trade deals have both
winners and losers, but the net effect
is usually positive. Japan stands to
TPP as it is more protective than most
to begin with (Exhibit 45). The trade
deal is part of a broader effort by
Japan to structurally boost its growth
(Exhibit 46).
Canada drags
The Canadian economy remains
troubled by low resource prices.
second half of 2015, our leadingindicator signals the persistence
(Exhibit 47). A few more sporadic
materially.
The Canadian economy feels even
the price of resource exports fall
and the cost of imports rise. Given
in the oil patch, we are lowering our
2016 growth forecast to 1.5% from
an already modest 1.75%.
Of course, not all parts of the
country are suffering. Canada is
divided between oil-exporting
provinces and those that import
0
2
4
6
8
10
12
14
16
18
0
20
40
60
80
100
120
1980 1985 1990 1995 2000 2005 2010 2015
J a p a n ' s c o r p o r a t e p r o f i t s
( %
o f G D P )
J P Y n o m i n a l e f f e c t i v e e x c h a n g e
r a t e ( 2 0 1 0 = 1 0 0 )
Exchange rate (LHS) Corporate profits (RHS)
Source: JP Morgan, Ministry of Finace Japan, Haver Analytics, RBC GAM
Exhibit 45: TPP trade-deal consequences
-0.7-0.3-0.3-0.2
0.40.5
0.60.91.0
1.42.0
2.22.2
6.113.6
-2 0 2 4 6 11 13 15Thailand
ChinaPhilippinesIndonesia
U.S.Canada
AustraliaChile
MexicoPeru
SingaporeNew Zealand
JapanMalaysiaVietnam
Cumulative increase in level of GDP after ten years (ppt)
Big winners
Modest winners
Modest losers
Source: Peterson Institute for International Economics, RBC GAM Within TPP Outside TPP
≈
≈
Exhibit 46: Japan reforms offer some promise
Labour Efforts underway to reduce two-tier nature of
being tapped
Governance directors on boards
Shareholder activism comes to Japan
Trade
Source: RBC GAM
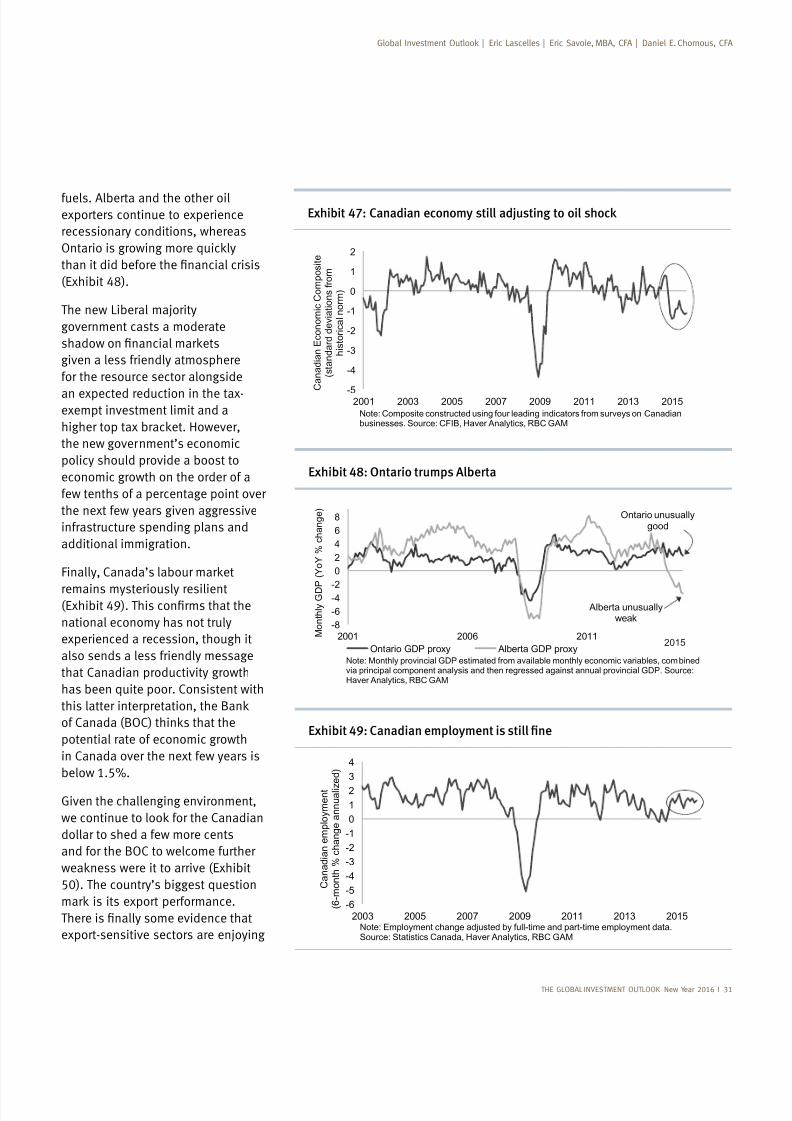
7/25/2019 Global Investment Outlook
http://slidepdf.com/reader/full/global-investment-outlook 33/80
THE GLOBAL INVESTMENT OUTLOOK New Year 2016 I 31
Exhibit 47: Canadian economy still adjusting to oil shock fuels. Alberta and the other oilexporters continue to experience
recessionary conditions, whereas
The new Liberal majority
government casts a moderate
given a less friendly atmosphere
for the resource sector alongside
an expected reduction in the tax-exempt investment limit and a
the new government’s economic
policy should provide a boost to
economic growth on the order of a
few tenths of a percentage point over
the next few years given aggressive
infrastructure spending plans and
additional immigration.
remains mysteriously resilient
national economy has not truly
experienced a recession, though it
also sends a less friendly message
that Canadian productivity growth
has been quite poor. Consistent with
potential rate of economic growth
in Canada over the next few years is
below 1.5%.
Given the challenging environment,
dollar to shed a few more cents
and for the BOC to welcome further
50). The country’s biggest question
export-sensitive sectors are enjoying
-5
-4
-3
-2
-1
0
1
2
2001 2003 2005 2007 2009 2011 2013 2015
C a n a d i a n E c o n o m i c C o m p o s i t e
( s t a n d a r d d e v i a t i o n s f r o m
h i s t o r i c a l n o r m )
Note: Composite constructed using four leading indicators from surveys on Canadianbusinesses. Source: CFIB, Haver Analytics, RBC GAM
Exhibit 48: Ontario trumps Alberta
-8
-6
-4-2
0
2
4
6
8
2001 2006 2011 M o n t h l y G D
P ( Y o Y %
c h a n g e )
Ontario GDP proxy Alberta GDP proxyNote: Monthly provincial GDP estimated from available monthly economic variables, combinedvia principal component analysis and then regressed against annual provincial GDP. Source:Haver Analytics, RBC GAM
2015
Ontario unusuallygood
Alberta unusuallyweak
-6
-5
-4
-3
-2
-1
0
1
2
3
4
2003 2005 2007 2009 2011 2013 2015
C a n a d i a n e m p l o y m e n t
( 6 - m o n t h % c h a n g e a n n u a l i z e d )
Note: Employment change adjusted by full-time and part-time employment data.Source: Statistics Canada, Haver Analytics, RBC GAM
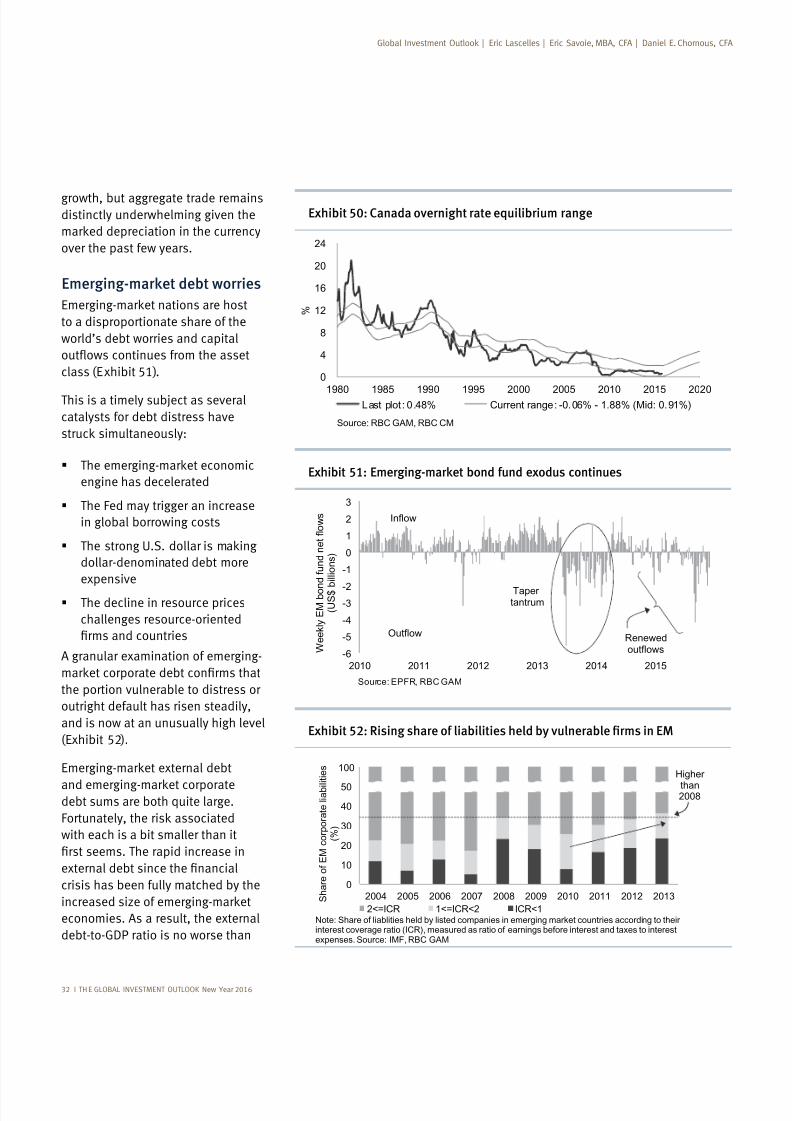
7/25/2019 Global Investment Outlook
http://slidepdf.com/reader/full/global-investment-outlook 34/80
32 I TH E GLOBAL INVESTMENT OUTLOOK New Year 2016
growth, but aggregate trade remainsdistinctly underwhelming given the
over the past few years.
Emerging-market debt worries
to a disproportionate share of the
world’s debt worries and capital
class (Exhibit 51).
This is a timely subject as several
catalysts for debt distress have
engine has decelerated
The Fed may trigger an increase
in global borrowing costs
dollar-denominated debt more
expensive
The decline in resource prices
challenges resource-oriented
A granular examination of emerging-
the portion vulnerable to distress or
outright default has risen steadily,
and is now at an unusually high level
(Exhibit 52).
debt sums are both quite large.
with each is a bit smaller than it
crisis has been fully matched by the
economies. As a result, the external
Exhibit 50: Canada overnight rate equilibrium range
0
4
8
12
16
20
24
1980 1985 1990 1995 2000 2005 2010 2015 2020
%
Last plot: 0.48% Current range: -0.06% - 1.88% (Mid: 0.91%)
Source: RBC GAM, RBC CM
0
10
20
30
40
50
60
2004 2005 2006 2007 2008 2009 2010 2011 2012 2013 S h a r e o f E M c o r p o r a t e l i a b i l i t i e s
( % )
2<=ICR 1<=ICR<2 ICR<1Note: Share of liablities held by listed companies in emerging market countries according to theirinterest coverage ratio (ICR), measured as ratio of earnings before interest and taxes to interestexpenses. Source: IMF, RBC GAM
Higher
than2008
100
Exhibit 51: Emerging-market bond fund exodus continues
-6
-5
-4
-3-2
-1
0
1
2
3
2010 2011 2012 2013 2014 2015
W e e k l y E M b o n d f u n d n e t f l o w s
( U S $ b i l l i o n s )
Source: EPFR, RBC GAM
Inflow
Outflow
Taper tantrum
Renewedoutflows
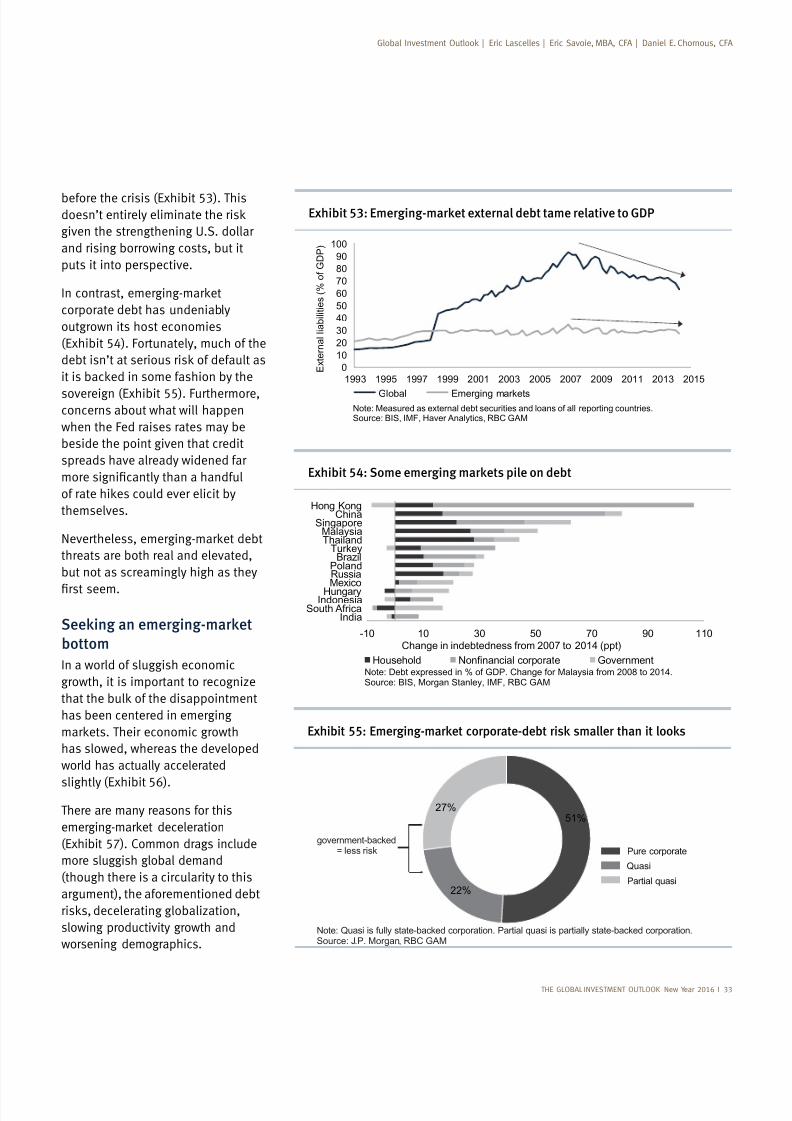
7/25/2019 Global Investment Outlook
http://slidepdf.com/reader/full/global-investment-outlook 35/80
THE GLOBAL INVESTMENT OUTLOOK New Year 2016 I 33
Exhibit 53: Emerging-market external debt tame relative to GDP
0
10
20
30
40
50
60
70
80
90
100
1993 1995 1997 1999 2001 2003 2005 2007 2009 2011 2013 2015 E x t e r n a l l i a b i l i t i e s ( %
o f G D P )
Global Emerging marketsNote: Measured as external debt securities and loans of all reporting countries.Source: BIS, IMF, Haver Analytics, RBC GAM
before the crisis (Exhibit 53). This
given the strengthening U.S. dollar
and rising borrowing costs, but it
puts it into perspective.
corporate debt has undeniably
outgrown its host economies
(Exhibit 54). Fortunately, much of the
sovereign (Exhibit 55). Furthermore,concerns about what will happen
when the Fed raises rates may be
beside the point given that credit
spreads have already widened far
themselves.
threats are both real and elevated,
but not as screamingly high as they
Seeking an emerging-market
bottom
In a world of sluggish economic
growth, it is important to recognize
has been centered in emerging
has slowed, whereas the developed
world has actually accelerated
slightly (Exhibit 56).
There are many reasons for this
(Exhibit 57). Common drags include
more sluggish global demand
(though there is a circularity to this
argument), the aforementioned debt
slowing productivity growth and
worsening demographics.
Exhibit 54: Some emerging markets pile on debt
-10 10 30 50 70 90 110
IndiaSouth Africa
IndonesiaHungary
MexicoRussiaPoland
BrazilTurkey
ThailandMalaysia
SingaporeChina
Hong Kong
Change in indebtedness from 2007 to 2014 (ppt)
Household Nonfinancial corporate GovernmentNote: Debt expressed in % of GDP. Change for Malaysia from 2008 to 2014.Source: BIS, Morgan Stanley, IMF, RBC GAM
Exhibit 55: Emerging-market corporate-debt risk smaller than it looks
51%
22%
27%
Pure corporate
Quasi
Partial quasi
Note: Quasi is fully state-backed corporation. Partial quasi is partially state-backed corporation.Source: J.P. Morgan, RBC GAM
government-backed= less risk
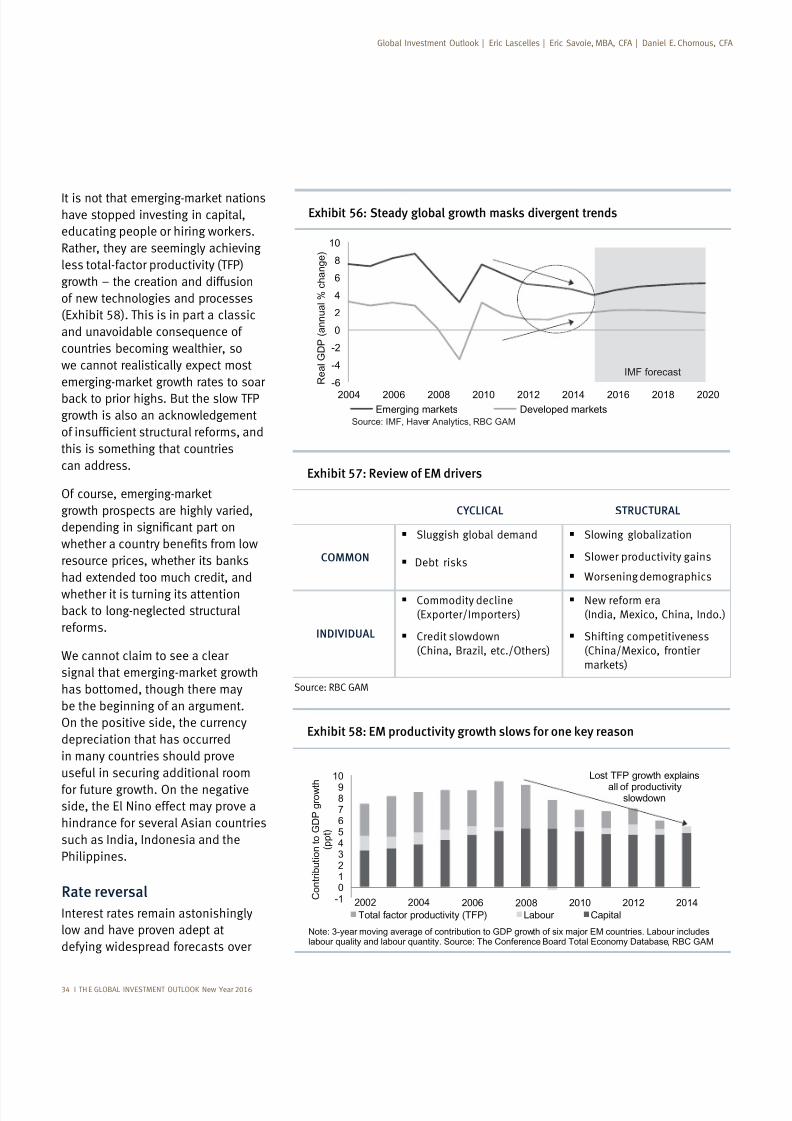
7/25/2019 Global Investment Outlook
http://slidepdf.com/reader/full/global-investment-outlook 36/80
34 I TH E GLOBAL INVESTMENT OUTLOOK New Year 2016
Exhibit 56: Steady global growth masks divergent trends
-6
-4
-2
0
2
4
6
8
10
2004 2006 2008 2010 2012 2014 2016 2018 2020
R e a l G D P ( a n n u a l % c h a n g e )
Emerging markets Developed markets
IMF forecast
Source: IMF, Haver Analytics, RBC GAM
have stopped investing in capital,
Rather, they are seemingly achieving
less total-factor productivity (TFP)
growth – the creation and diffusion
of new technologies and processes
and unavoidable consequence of
countries becoming wealthier, so
we cannot realistically expect most
this is something that countries
can address.
growth prospects are highly varied,
had extended too much credit, and
whether it is turning its attention
reforms.
We cannot claim to see a clear
has bottomed, though there may
be the beginning of an argument.
On the positive side, the currency
depreciation that has occurred
in many countries should prove
useful in securing additional room
for future growth. On the negativeside, the El Nino effect may prove a
hindrance for several Asian countries
such as India, Indonesia and the
Philippines.
Rate reversal
Interest rates remain astonishingly
low and have proven adept at
defying widespread forecasts over
Exhibit 57: Review of EM drivers
Exhibit 58: EM productivity growth slows for one key reason
2002 2004 2006 2008 2010 2012 2014-10123456789
10
C o n t r i b u t i o n t o G D P g r o w t h
( p p t )
Total factor productivity (TFP) Labour Capital
Lost TFP growth explains
all of productivityslowdown
Note: 3-year moving average of contribution to GDP growth of six major EM countries. Labour includeslabour quality and labour quantity. Source: The Conference Board Total Economy Database, RBC GAM
CYCLICAL STRUCTURAL
COMMON
Sluggish global demand
Slowing globalization
Slower productivity gains
Worsening demographics
INDIVIDUAL
Commodity decline(Exporter/Importers)
Credit slowdown(China, Brazil, etc./Others)
New reform era(India, Mexico, China, Indo.)
Shifting competitiveness(China/Mexico, frontier
Source: RBC GAM
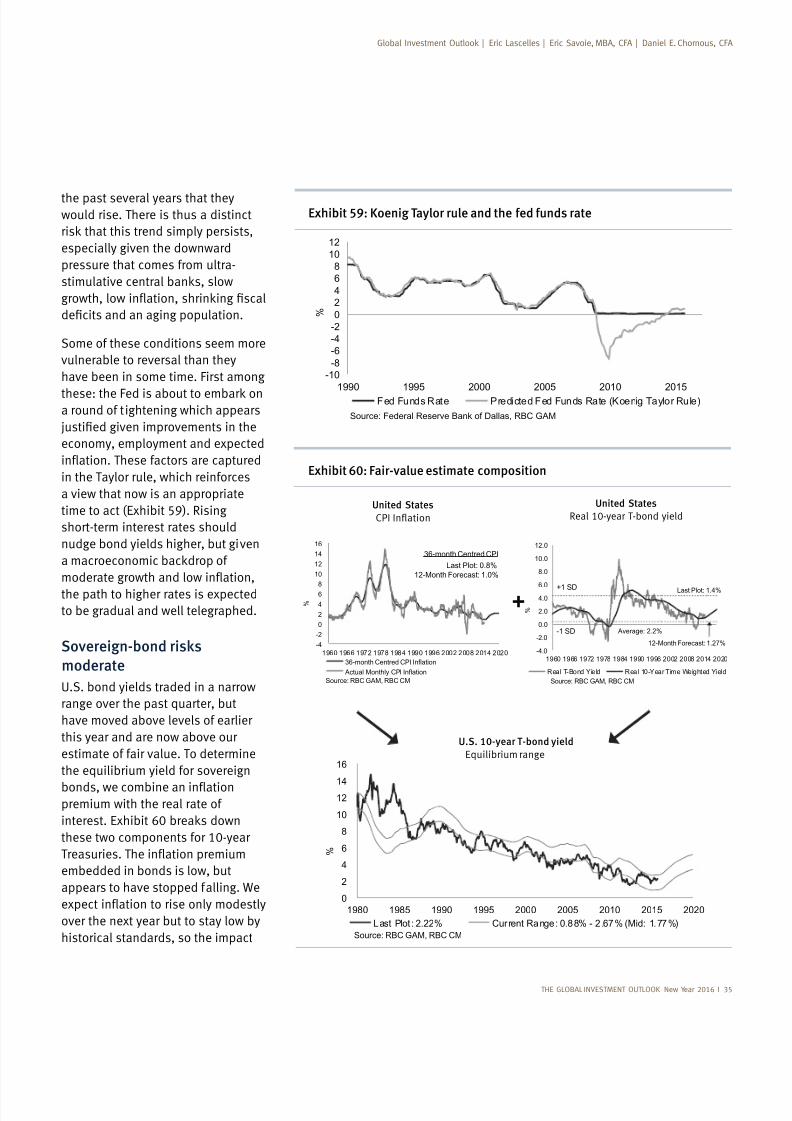
7/25/2019 Global Investment Outlook
http://slidepdf.com/reader/full/global-investment-outlook 37/80
THE GLOBAL INVESTMENT OUTLOOK New Year 2016 I 35
Exhibit 59: Koenig Taylor rule and the fed funds rate
-10-8-6-4-202468
1012
1990 1995 2000 2005 2010 2015
%
Fed Funds Rate Predicted Fed Funds Rate (Koenig Taylor Rule)
Source: Federal Reserve Bank of Dallas, RBC GAM
the past several years that theywould rise. There is thus a distinct
especially given the downward
pressure that comes from ultra-
Some of these conditions seem more
vulnerable to reversal than they
have been in some time. First among
a round of tightening which appears
economy, employment and expected
in the Taylor rule, which reinforces
a view that now is an appropriate
short-term interest rates should
nudge bond yields higher, but given
the path to higher rates is expectedto be gradual and well telegraphed.
Sovereign-bond risks
moderate
U.S. bond yields traded in a narrow
range over the past quarter, but
have moved above levels of earlier
this year and are now above our
estimate of fair value. To determine
the equilibrium yield for sovereign
premium with the real rate of
these two components for 10-year
embedded in bonds is low, but
appears to have stopped falling. We
over the next year but to stay low by
historical standards, so the impact
-4.0
-2.0
0.0
2.0
4.0
6.0
8.0
10.0
12.0
1960 1966 1972 1978 1984 1990 1996 2002 2008 2014 2020
%
Real T-Bond Yield Real 10-Year Time Weighted Yield
Source: RBC GAM, RBC CM
+1 SD
-1 SD Average: 2.2%
Last Plot: 1.4%
12-Month Forecast: 1.27%-4
-2
0
2
4
6
8
10
12
14
16
1960 1966 1972 1978 1984 1990 1996 2002 2008 2014 2020
%
36-month Centred CPI Inflation
Actual Monthly CPI Inflation
Source: RBC GAM, RBC CM
Last Plot: 0.8%
12-Month Forecast: 1.0%
36-month Centred CPI
Exhibit 60: Fair-value estimate composition
0
2
4
6
8
10
1214
16
1980 1985 1990 1995 2000 2005 2010 2015 2020
%
Last Plot : 2.22% Current Range: 0.88% - 2.67% (Mid: 1.77%)
Source: RBC GAM, RBC CM
United States
United States
Real 10-year T-bond yield
U.S. 10-year T-bond yield
Equilibrium range
+
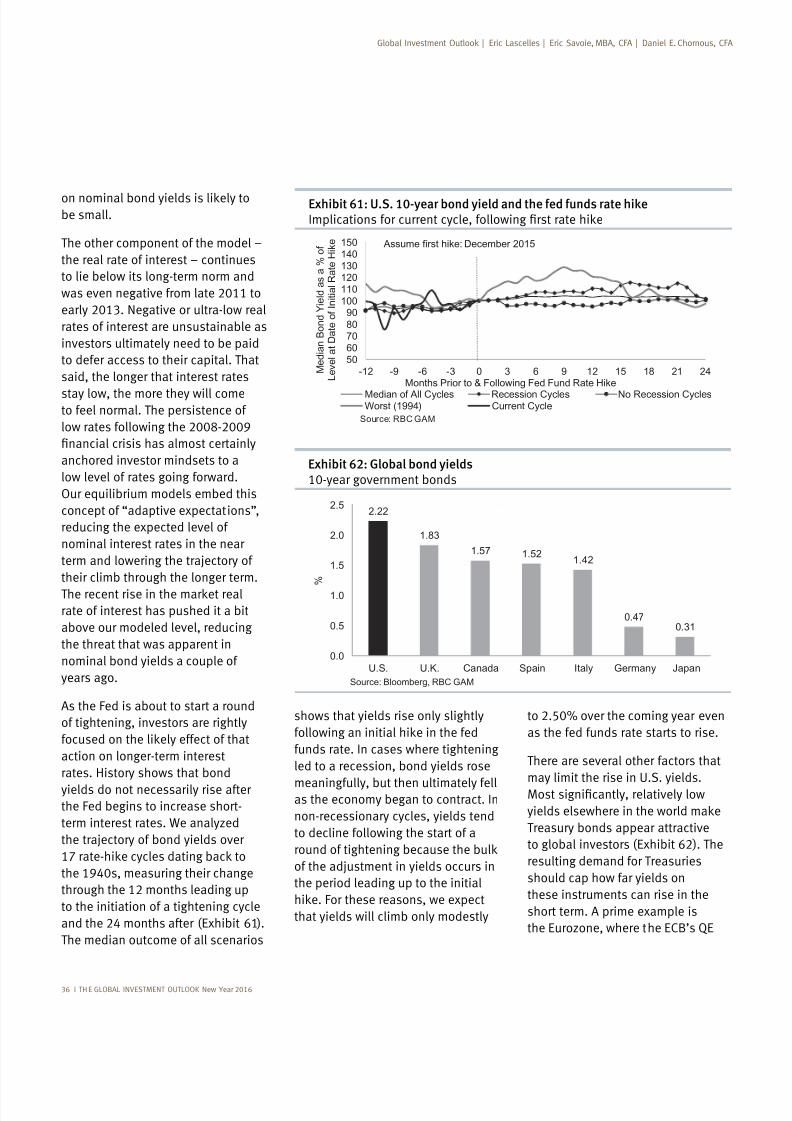
7/25/2019 Global Investment Outlook
http://slidepdf.com/reader/full/global-investment-outlook 38/80
36 I TH E GLOBAL INVESTMENT OUTLOOK New Year 2016
to 2.50% over the coming year even
as the fed funds rate starts to rise.
There are several other factors that
may limit the rise in U.S. yields.
Treasury bonds appear attractive
to global investors (Exhibit 62). The
resulting demand for Treasuries
should cap how far yields on
these instruments can rise in the
short term. A prime example is
shows that yields rise only slightly
funds rate. In cases where tightening
led to a recession, bond yields rose
meaningfully, but then ultimately fellas the economy began to contract. In
non-recessionary cycles, yields tend
to decline following the start of a
of the adjustment in yields occurs in
the period leading up to the initial
that yields will climb only modestly
be small.
The other component of the model –
the real rate of interest – continues
to lie below its long-term norm and
was even negative from late 2011 to
early 2013. Negative or ultra-low real
rates of interest are unsustainable as
investors ultimately need to be paid
to defer access to their capital. That
said, the longer that interest rates
stay low, the more they will cometo feel normal. The persistence of
anchored investor mindsets to a
low level of rates going forward.
Our equilibrium models embed this
concept of “adaptive expectations”,
reducing the expected level of
nominal interest rates in the near
term and lowering the trajectory of
their climb through the longer term.
rate of interest has pushed it a bit
above our modeled level, reducing
the threat that was apparent in
nominal bond yields a couple of
years ago.
As the Fed is about to start a round
of tightening, investors are rightly
action on longer-term interest
rates. History shows that bond
yields do not necessarily rise afterthe Fed begins to increase short-
term interest rates. We analyzed
the trajectory of bond yields over
through the 12 months leading up
to the initiation of a tightening cycle
and the 24 months after (Exhibit 61).
The median outcome of all scenarios
Exhibit 61: U.S. 10-year bond yield and the fed funds rate hike
5060708090
100110120130140150
-12 -9 -6 -3 0 3 6 9 12 15 18 21 24 M e d i a n B o n d Y i e l d a s a % o f
L e v e l a t D a t e o f I n i t i a l R a t e H i k e
Months Prior to & Following Fed Fund Rate Hike
Median of All Cycles Recession Cycles No Recession CyclesWorst (1994) Current Cycle
Source: RBC GAM
Assume first hike: December 2015
Exhibit 62: Global bond yields10-year government bonds
2.22
1.83
1.57 1.521.42
0.470.31
0.0
0.5
1.0
1.5
2.0
2.5
U.S. U.K. Canada Spain Italy Germany Japan
%
Source: Bloomberg, RBC GAM
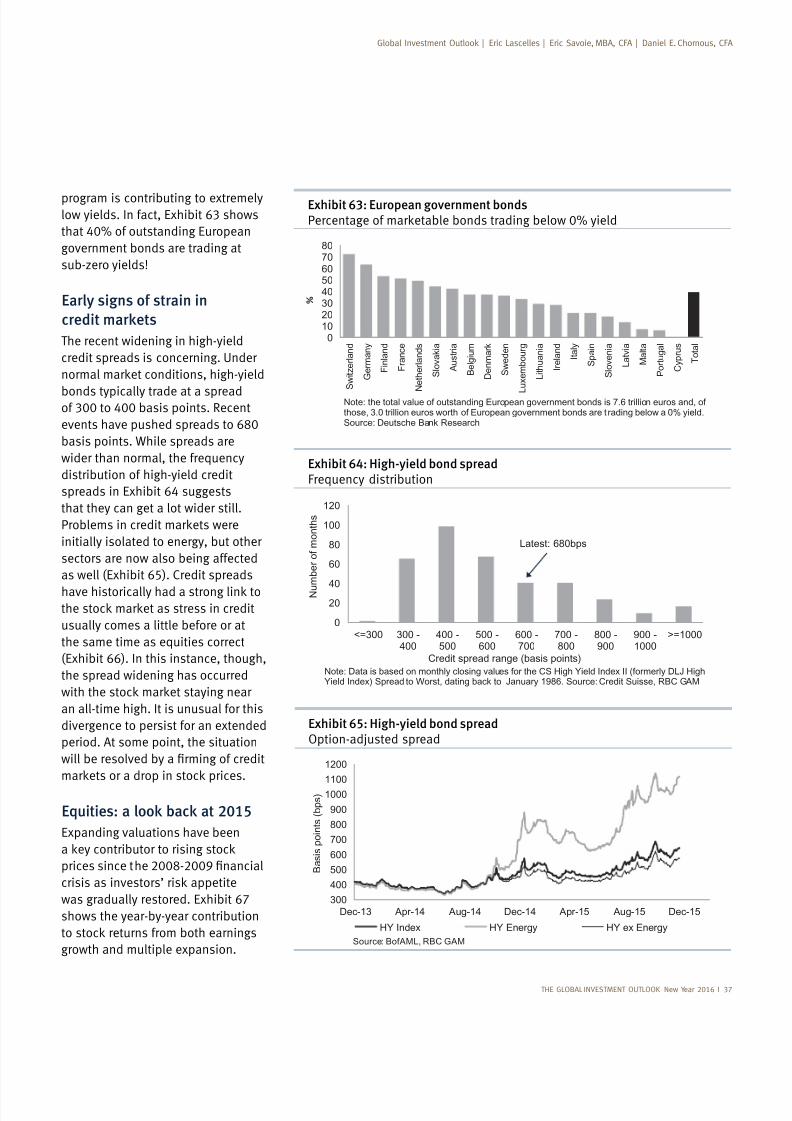
7/25/2019 Global Investment Outlook
http://slidepdf.com/reader/full/global-investment-outlook 39/80
THE GLOBAL INVESTMENT OUTLOOK New Year 2016 I 37
Exhibit 64: High-yield bond spreadFrequency distribution
0
20
40
60
80
100
120
<=300 300 -400
400 -500
500 -600
600 -700
700 -800
800 -900
900 -1000
>=1000
N u
m b e r o f m o n t h s
Credit spread range (basis points)Note: Data is based on monthly closing values for the CS High Yield Index II (formerly DLJ HighYield Index) Spread to Worst, dating back to January 1986. Source: Credit Suisse, RBC GAM
Latest: 680bps
Exhibit 63: European government bonds
01020304050607080
S w i t z e r l a n d
G e r m a n y
F i n l a n d
F r a n c e
N e t h e r l a n d s
S l o v a k i a
A u s t r i a
B e l g i u m
D e n m a r k
S w e d e n
L
u x e m b o u r g
L i t h u a n i a
I r e l a n d
I t a l y
S p a i n
S l o v e n i a
L a t v i a
M a l t a
P o r t u g a l
C y p r u s
T o t a l
Note: the total value of outstanding European government bonds is 7.6 trillion euros and, ofthose, 3.0 trillion euros worth of European government bonds are t rading below a 0% yield.Source: Deutsche Bank Research
program is contributing to extremelylow yields. In fact, Exhibit 63 shows
that 40% of outstanding European
government bonds are trading at
sub-zero yields!
Early signs of strain in
credit markets
The recent widening in high-yield
credit spreads is concerning. Under
bonds typically trade at a spreadof 300 to 400 basis points. Recent
basis points. While spreads are
wider than normal, the frequency
distribution of high-yield credit
spreads in Exhibit 64 suggests
that they can get a lot wider still.
initially isolated to energy, but other
sectors are now also being affected
as well (Exhibit 65). Credit spreads
usually comes a little before or at
the same time as equities correct
(Exhibit 66). In this instance, though,
the spread widening has occurred
an all-time high. It is unusual for this
divergence to persist for an extended
period. At some point, the situation
Equities: a look back at 2015
Expanding valuations have been
was gradually restored. Exhibit 67
shows the year-by-year contribution
growth and multiple expansion.
Exhibit 65: High-yield bond spreadOption-adjusted spread
300
400
500
600
700
800
900
1000
1100
1200
Dec-13 Apr-14 Aug-14 Dec-14 Apr-15 Aug-15 Dec-15
B a s i s p o i n t s ( b p s )
HY Index HY Energy HY ex Energy
Source: BofAML, RBC GAM
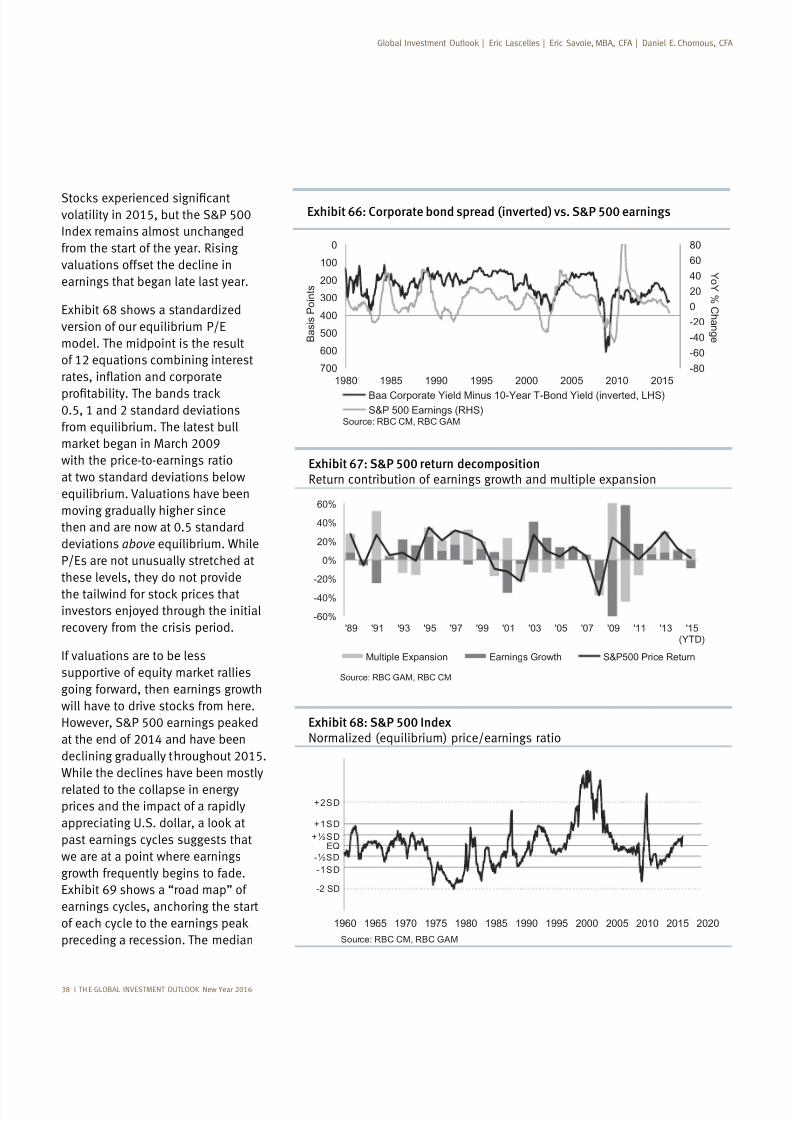
7/25/2019 Global Investment Outlook
http://slidepdf.com/reader/full/global-investment-outlook 40/80
New Year 2016
Exhibit 66: Corporate bond spread (inverted) vs. S&P 500 earnings
-80
-60
-40
-20
0
20
40
60
800
100
200
300
400
500
600
7001980 1985 1990 1995 2000 2005 2010 2015
Y oY % C h an g e
B a s i s P o i n t s
Baa Corporate Yield Minus 10-Year T-Bond Yield (inverted, LHS)S&P 500 Earnings (RHS)
Source: RBC CM, RBC GAM
volatility in 2015, but the S&P 500
Index remains almost unchanged
from the start of the year. Rising
valuations offset the decline in
earnings that began late last year.
version of our equilibrium P/E
model. The midpoint is the result
of 12 equations combining interest
0.5, 1 and 2 standard deviations
from equilibrium. The latest bull
with the price-to-earnings ratio
at two standard deviations below
equilibrium. Valuations have been
moving gradually higher since
then and are now at 0.5 standard
deviations above equilibrium. While
P/Es are not unusually stretched at
these levels, they do not provide
investors enjoyed through the initial
recovery from the crisis period.
If valuations are to be less
going forward, then earnings growth
at the end of 2014 and have been
declining gradually throughout 2015.
While the declines have been mostly
related to the collapse in energyprices and the impact of a rapidly
past earnings cycles suggests that
we are at a point where earnings
growth frequently begins to fade.
earnings cycles, anchoring the start
preceding a recession. The median
Exhibit 68: S&P 500 Index Normalized (equilibrium) price/earnings ratio
1960 1965 1970 1975 1980 1985 1990 1995 2000 2005 2010 2015 2020
EQ
+1SD
-1SD
-½SD
+½SD
+2SD
-2 SD
Source: RBC CM, RBC GAM
Exhibit 67: S&P 500 return decompositionReturn contribution of earnings growth and multiple expansion
-60%
-40%
-20%
0%
20%
40%
60%
'89 '91 '93 '95 '97 '99 '01 '03 '05 '07 '09 '11 '13 '15(YTD)
Multiple Expansion Earnings Growth S&P500 Price Return
Source: RBC GAM, RBC CM
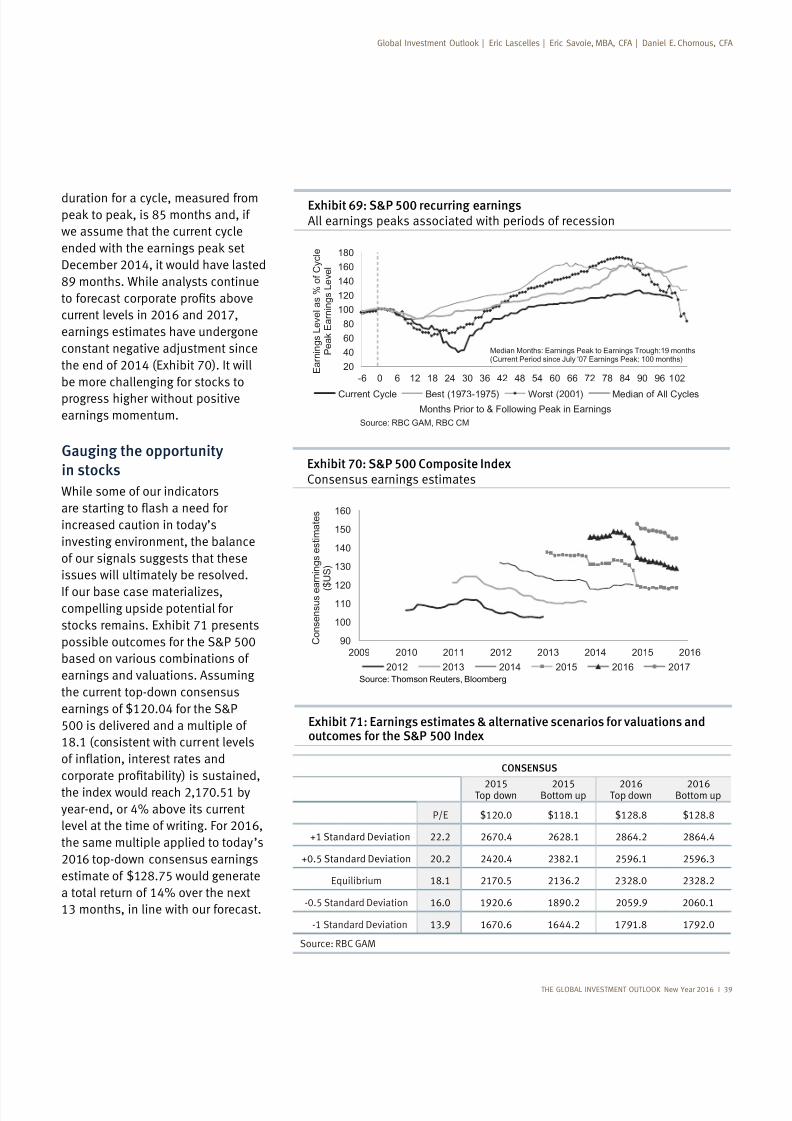
7/25/2019 Global Investment Outlook
http://slidepdf.com/reader/full/global-investment-outlook 41/80
THE GLOBAL INVESTMENT OUTLOOK New Year 2016
Exhibit 70: S&P 500 Composite Index Consensus earnings estimates
90
100
110120
130
140
150
160
2009 2010 2011 2012 2013 2014 2015 2016 C o n s e n s u s e a r n i n g s e s t i m a t e s
( $ U S )
2012 2013 2014 2015 2016 2017Source: Thomson Reuters, Bloomberg
duration for a cycle, measured from
we assume that the current cycle
current levels in 2016 and 2017,
earnings estimates have undergone
constant negative adjustment since
the end of 2014 (Exhibit 70). It will
progress higher without positive
earnings momentum.
Gauging the opportunity
in stocks
While some of our indicators
increased caution in today’s
investing environment, the balance
of our signals suggests that these
issues will ultimately be resolved.
If our base case materializes,compelling upside potential for
possible outcomes for the S&P 500
based on various combinations of
earnings and valuations. Assuming
the current top-down consensus
earnings of $120.04 for the S&P
500 is delivered and a multiple of
the index would reach 2,170.51 by
year-end, or 4% above its current
level at the time of writing. For 2016,
the same multiple applied to today’s
2016 top-down consensus earnings
a total return of 14% over the next
13 months, in line with our forecast.
Exhibit 69: S&P 500 recurring earnings
20
40
60
80
100
120
140
160
180
-6 0 6 12 18 24 30 36 42 48 54 60 66 72 78 84 90 96 102 E a r n i n g s L e v e l a s % o f C y c l e
P e a k E a r n i n g s L e v e l
Months Prior to & Following Peak in Earnings
Current Cycle Best (1973-1975) Worst (2001) Median of All Cycles
Median Months: Earnings Peak to Earnings Trough:19 months(Current Period since July '07 Earnings Peak: 100 months)
Source: RBC GAM, RBC CM
Exhibit 71: Earnings estimates & alternative scenarios for valuations andoutcomes for the S&P 500 Index
CONSENSUS
2015Top down 2015Bottom up 2016Top down 2016Bottom up
P/E $120.0
22.2 2670.4
20.2 2420.4
Equilibrium 2170.5 2136.2
16.0 2060.1
1670.6 1644.2
Source: RBC GAM
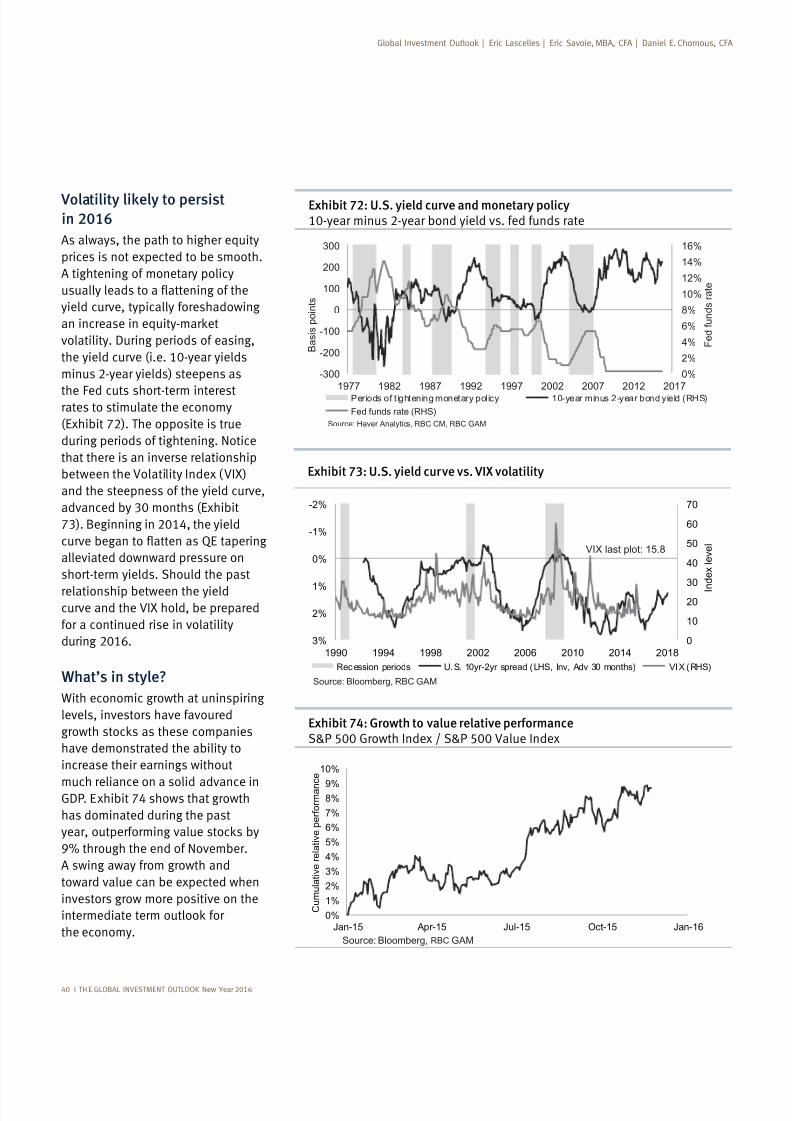
7/25/2019 Global Investment Outlook
http://slidepdf.com/reader/full/global-investment-outlook 42/80
40 I TH E GLOBAL INVESTMENT OUTLOOK New Year 2016
Exhibit 72: U.S. yield curve and monetary policy10-year minus 2-year bond yield vs. fed funds rate
0%
2%
4%
6%
8%
10%
12%
14%
16%
-300
-200
-100
0
100
200
300
1977 1982 1987 1992 1997 2002 2007 2012 2017
F e d f u n d s r a t e
B a s i s p o i n t s
Periods of tightening monetary policy 10-year minus 2-year bond yield (RHS)
Fed funds rate (RHS)
Source: Haver Analytics, RBC CM, RBC GAM
Volatility likely to persistin 2016
As always, the path to higher equity
prices is not expected to be smooth.
A tightening of monetary policy
yield curve, typically foreshadowing
the yield curve (i.e. 10-year yields
minus 2-year yields) steepens as
the Fed cuts short-term interestrates to stimulate the economy
(Exhibit 72). The opposite is true
during periods of tightening. Notice
that there is an inverse relationship
between the Volatility Index (VIX)
and the steepness of the yield curve,
advanced by 30 months (Exhibit
73). Beginning in 2014, the yield
alleviated downward pressure on
short-term yields. Should the past
relationship between the yieldcurve and the VIX hold, be prepared
for a continued rise in volatility
during 2016.
What’s in style?
With economic growth at uninspiring
levels, investors have favoured
have demonstrated the ability to
increase their earnings without
much reliance on a solid advance in
has dominated during the past
A swing away from growth and
toward value can be expected when
investors grow more positive on the
the economy.
Exhibit 74: Growth to value relative performanceS&P 500 Growth Index / S&P 500 Value Index
0%
1%
2%
3%
4%
5%
6%
7%
8%9%
10%
Jan-15 Apr-15 Jul-15 Oct-15 Jan-16
C u m u l a t i v e r e l a t i v e p e r f o r m a n
c e
Source: Bloomberg, RBC GAM
Exhibit 73: U.S. yield curve vs. VIX volatility
0
10
20
30
40
50
60
70-2%
-1%
0%
1%
2%
3%1990 1994 1998 2002 2006 2010 2014 2018
I n d e x l e v e l
Recession periods U.S. 10yr-2yr spread (LHS, Inv, Adv 30 months) VIX (RHS)
Source: Bloomberg, RBC GAM
VIX last plot: 15.8
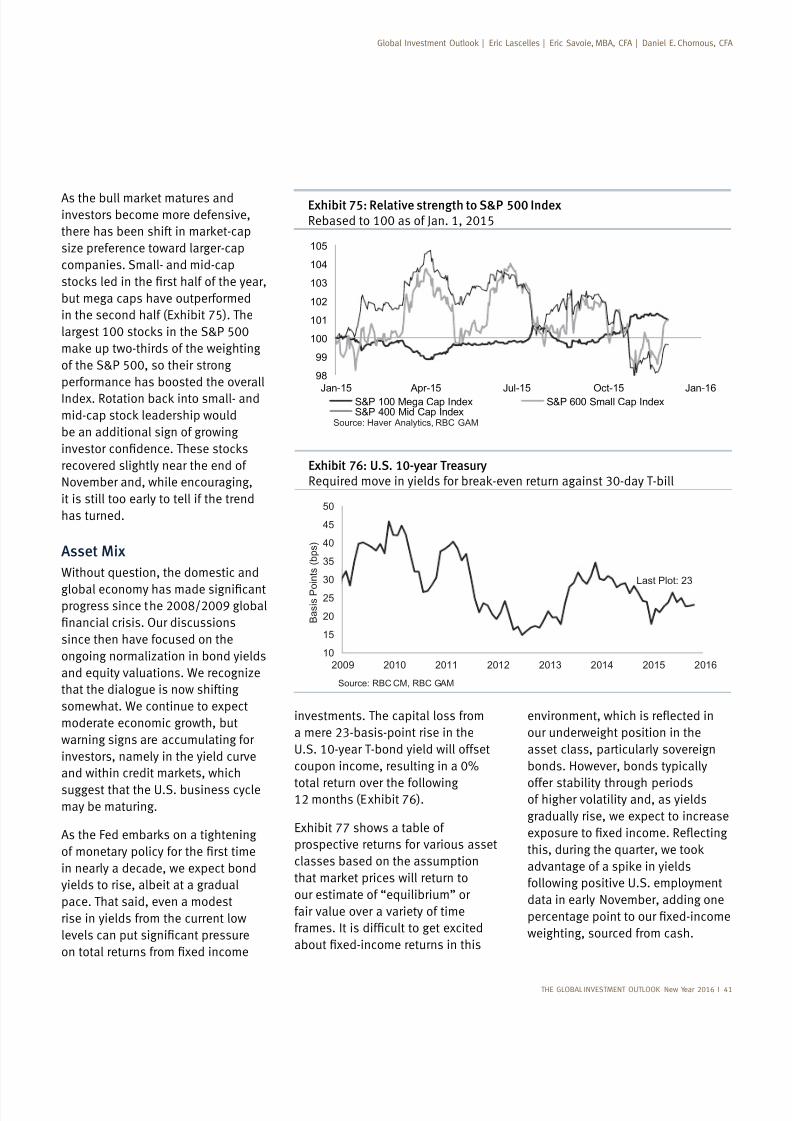
7/25/2019 Global Investment Outlook
http://slidepdf.com/reader/full/global-investment-outlook 43/80
THE GLOBAL INVESTMENT OUTLOOK New Year 2016 I 41
our underweight position in the
asset class, particularly sovereign
bonds. However, bonds typically
offer stability through periodsof higher volatility and, as yields
gradually rise, we expect to increase
following positive U.S. employment
data in early November, adding one
weighting, sourced from cash.
investments. The capital loss from
a mere 23-basis-point rise in the
U.S. 10-year T-bond yield will offset
coupon income, resulting in a 0%
total return over the following12 months (Exhibit 76).
Exhibit 77 shows a table of
prospective returns for various asset
classes based on the assumption
our estimate of “equilibrium” or
fair value over a variety of time
investors become more defensive,
size preference toward larger-cap
companies. Small- and mid-cap
but mega caps have outperformed
in the second half (Exhibit 75). The
of the S&P 500, so their strong
performance has boosted the overall
be an additional sign of growing
recovered slightly near the end of
November and, while encouraging,
it is still too early to tell if the trend
has turned.
Asset Mix
Without question, the domestic and
since then have focused on the
ongoing normalization in bond yields
and equity valuations. We recognize
that the dialogue is now shifting
somewhat. We continue to expect
moderate economic growth, but
warning signs are accumulating for
investors, namely in the yield curve
suggest that the U.S. business cyclemay be maturing.
in nearly a decade, we expect bond
yields to rise, albeit at a gradual
pace. That said, even a modest
rise in yields from the current low
Exhibit 75: Relative strength to S&P 500 Index Rebased to 100 as of Jan. 1, 2015
98
99
100
101
102
103
104
105
Jan-15 Apr-15 Jul-15 Oct-15 Jan-16S&P 100 Mega Cap Index S&P 600 Small Cap IndexS&P 400 Mid Cap Index
Source: Haver Analytics, RBC GAM
Exhibit 76: U.S. 10-year Treasury
10
15
20
25
30
35
40
45
50
2009 2010 2011 2012 2013 2014 2015 2016
B a s i s P o i n t s ( b p s )
Source: RBC CM, RBC GAM
Last Plot: 23
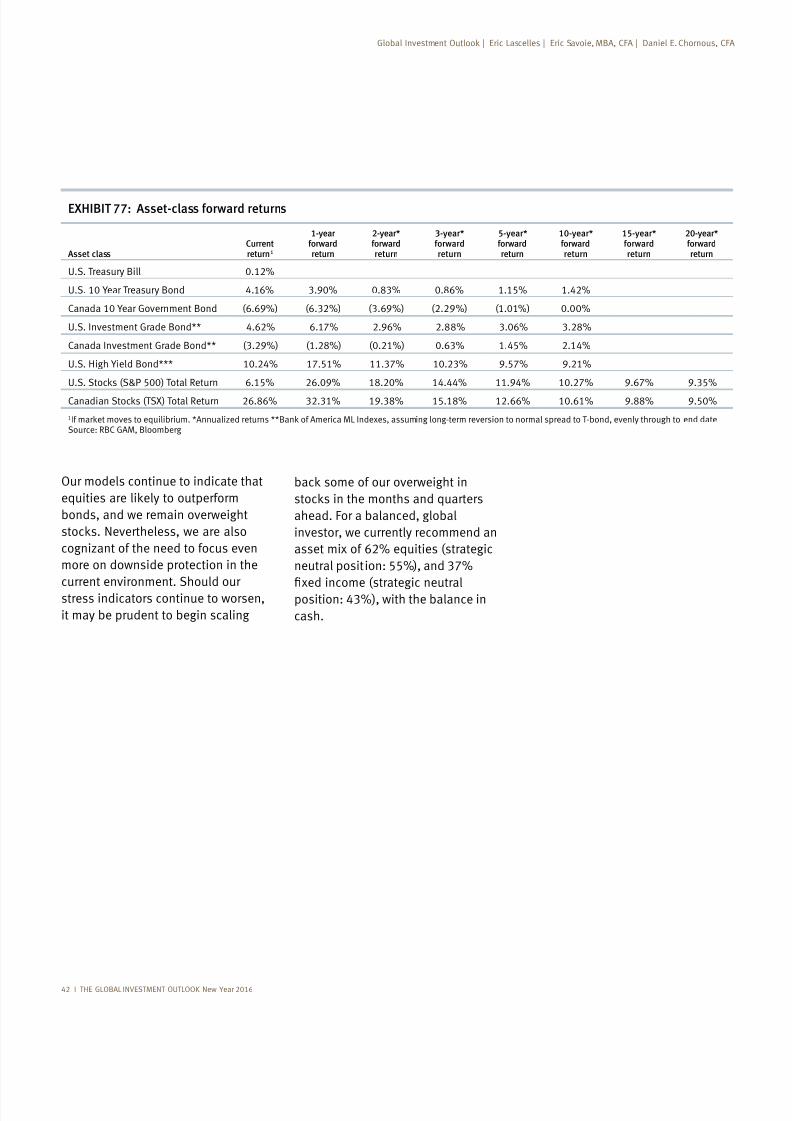
7/25/2019 Global Investment Outlook
http://slidepdf.com/reader/full/global-investment-outlook 44/80
42 I THE GLOBAL INVESTMENT OUTLOOK New Year 2016
back some of our overweight in
stocks in the months and quarters
ahead. For a balanced, global
investor, we currently recommend an
asset mix of 62% equities (strategic
neutral position: 55%), and 37%
fi
xed income (strategic neutralposition: 43%), with the balance in
cash.
Global Investment Outlook | Eric Lascelles | Eric Savoie, MBA, CFA | Daniel E. Chornous, CFA
EXHIBIT 77: Asset-class forward returns
Asset classCurrentreturn1
1-year forwardreturn
2-year*forwardreturn
3-year*forwardreturn
5-year*forwardreturn
10-year*forwardreturn
15-year*forwardreturn
20-year*forwardreturn
U.S. Treasury Bill 0.12%
U.S. 10 Year Treasury Bond 4.16% 3.90% 0.83% 0.86% 1.15% 1.42%
Canada 10 Year Government Bond (6.69%) (6.32%) (3.69%) (2.29%) (1.01%) 0.00%
U.S. Investment Grade Bond** 4.62% 6.17% 2.96% 2.88% 3.06% 3.28%
Canada Investment Grade Bond** (3.29%) (1.28%) (0.21%) 0.63% 1.45% 2.14%
U.S. High Yield Bond*** 10.24% 17.51% 11.37% 10.23% 9.57% 9.21%
U.S. Stocks (S&P 500) Total Return 6.15% 26.09% 18.20% 14.44% 11.94% 10.27% 9.67% 9.35%
Canadian Stocks (TSX) Total Return 26.86% 32.31% 19.38% 15.18% 12.66% 10.61% 9.88% 9.50%
1If market moves to equilibrium. *Annualized returns **Bank of America ML Indexes, assuming long-term reversion to normal spread to T-bond, evenly through to end dateSource: RBC GAM, Bloomberg
Our models continue to indicate that
equities are likely to outperform
bonds, and we remain overweight
stocks. Nevertheless, we are also
cognizant of the need to focus even
more on downside protection in the
current environment. Should our
stress indicators continue to worsen,
it may be prudent to begin scaling
7/25/2019 Global Investment Outlook
http://slidepdf.com/reader/full/global-investment-outlook 45/80
THE GLOBAL INVESTMENT OUTLOOK New Year 2016 I 43
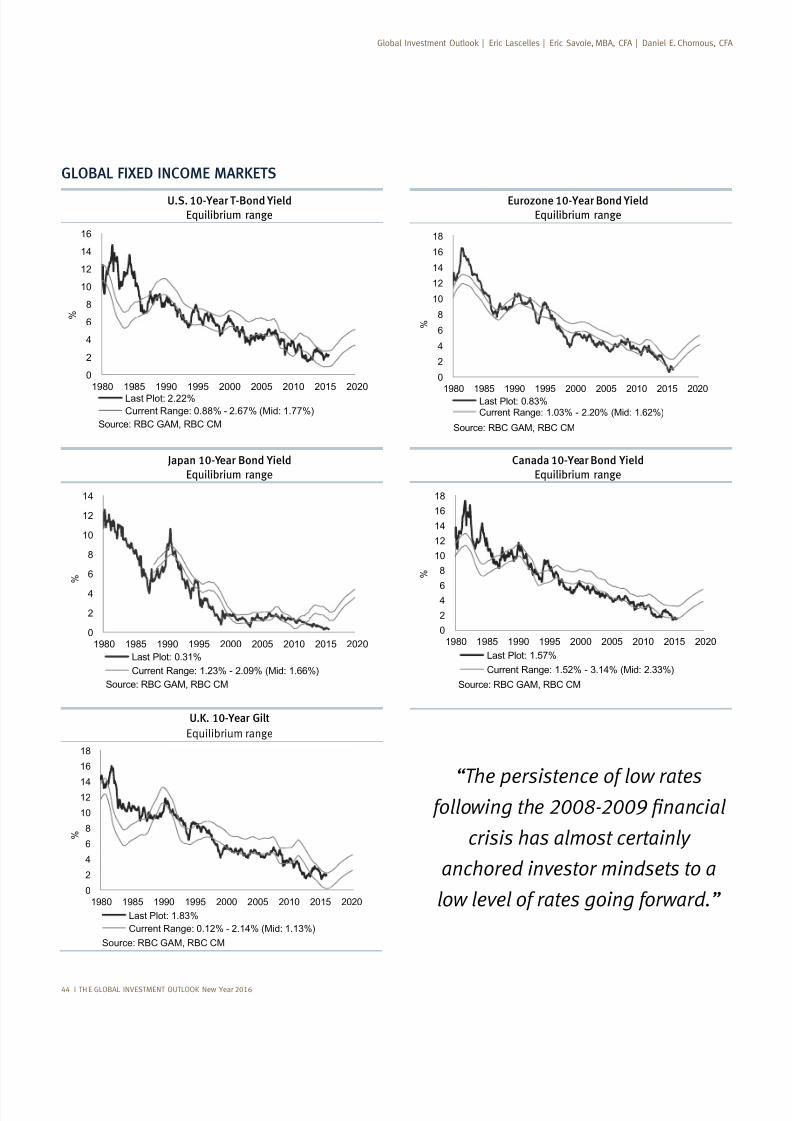
7/25/2019 Global Investment Outlook
http://slidepdf.com/reader/full/global-investment-outlook 46/80
“The persistence of low rates
crisis has almost certainly
anchored investor mindsets to a
low level of rates going forward.”
GLOBAL FIXED INCOME MARKETS
44 I TH E GLOBAL INVESTMENT OUTLOOK New Year 2016
Eurozone 10-Year Bond YieldEquilibrium range
0
2
4
6
8
10
12
14
16
18
1980 1985 1990 1995 2000 2005 2010 2015 2020
%
Last Plot: 0.83%Current Range: 1.03% - 2.20% (Mid: 1.62%)
Source: RBC GAM, RBC CM
U.S. 10-Year T-Bond YieldEquilibrium range
0
2
4
6
8
10
12
14
16
1980 1985 1990 1995 2000 2005 2010 2015 2020
%
Last Plot: 2.22%
Current Range: 0.88% - 2.67% (Mid: 1.77%)
Source: RBC GAM, RBC CM
Canada 10-Year Bond YieldEquilibrium range
0
2
46
8
10
12
14
16
18
1980 1985 1990 1995 2000 2005 2010 2015 2020
%
Last Plot: 1.57%
Current Range: 1.52% - 3.14% (Mid: 2.33%)
Source: RBC GAM, RBC CM
Japan 10-Year Bond YieldEquilibrium range
0
2
4
6
8
10
12
14
1980 1985 1990 1995 2000 2005 2010 2015 2020
%
Last Plot: 0.31%
Current Range: 1.23% - 2.09% (Mid: 1.66%)
Source: RBC GAM, RBC CM
U.K. 10-Year Gilt
Equilibrium range
0
2
4
6
8
10
1214
16
18
1980 1985 1990 1995 2000 2005 2010 2015 2020
%
Last Plot: 1.83%
Current Range: 0.12% - 2.14% (Mid: 1.13%)
Source: RBC GAM, RBC CM
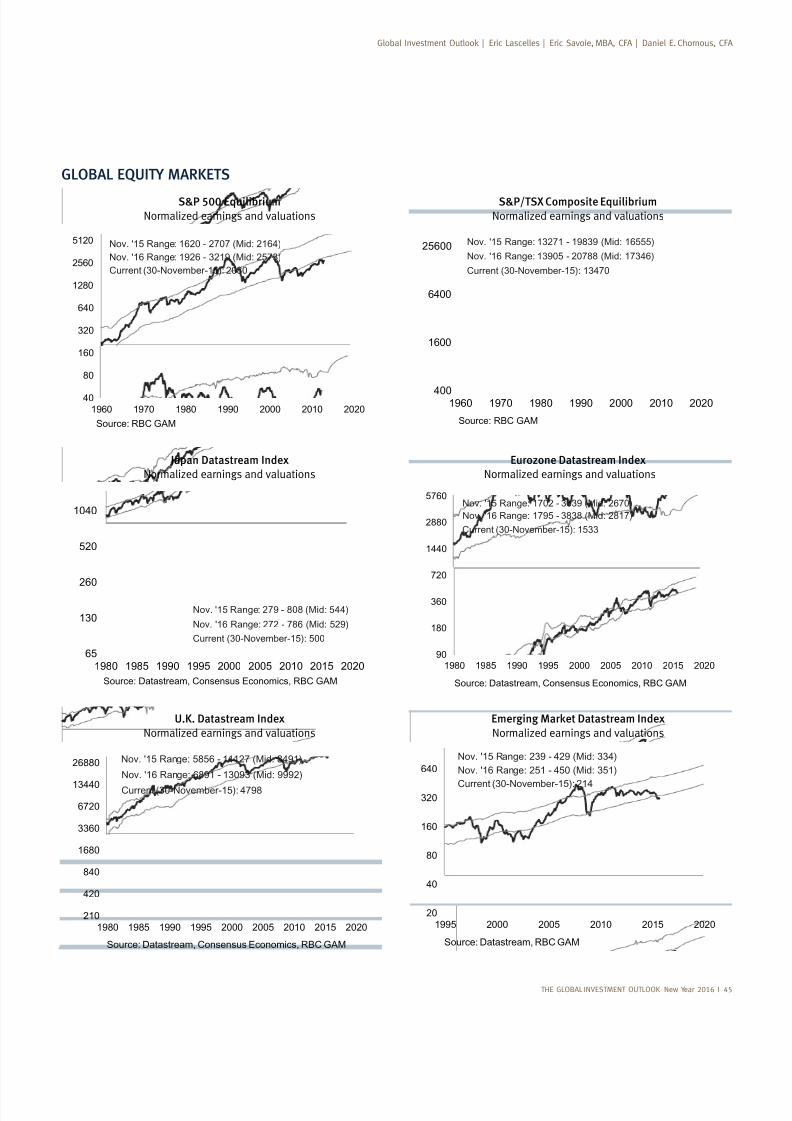
7/25/2019 Global Investment Outlook
http://slidepdf.com/reader/full/global-investment-outlook 47/80
THE GLOBAL INVESTMENT OUTLOOK New Year 2016 I 45
GLOBAL EQUITY MARKETS
S&P/TSX Composite EquilibriumNormalized earnings and valuations
400
1600
6400
25600
1960 1970 1980 1990 2000 2010 2020
Source: RBC GAM
Nov. '15 Range: 13271 - 19839 (Mid: 16555)
Nov. '16 Range: 13905 - 20788 (Mid: 17346)
Current (30-November-15): 13470
S&P 500 EquilibriumNormalized earnings and valuations
40
80
160
320
640
1280
2560
5120
1960 1970 1980 1990 2000 2010 2020
Source: RBC GAM
Nov. '15 Range: 1620 - 2707 (Mid: 2164)
Nov. '16 Range: 1926 - 3219 (Mid: 2573)
Current (30-November-15): 2080
Eurozone Datastream Index Normalized earnings and valuations
90
180
360
720
1440
2880
5760
1980 1985 1990 1995 2000 2005 2010 2015 2020
Source: Datastream, Consensus Economics, RBC GAM
Nov. '15 Range: 1702 - 3639 (Mid: 2670)
Nov. '16 Range: 1795 - 3838 (Mid: 2817)
Current (30-November-15): 1533
Japan Datastream Index Normalized earnings and valuations
65
130
260
520
1040
1980 1985 1990 1995 2000 2005 2010 2015 2020
Source: Datastream, Consensus Economics, RBC GAM
Nov. '15 Range: 279 - 808 (Mid: 544)
Nov. '16 Range: 272 - 786 (Mid: 529)
Current (30-November-15): 500
Emerging Market Datastream Index Normalized earnings and valuations
20
40
80
160
320
640
1995 2000 2005 2010 2015 2020
Source: Datastream, RBC GAM
Nov. '15 Range: 239 - 429 (Mid: 334)
Nov. '16 Range: 251 - 450 (Mid: 351)
Current (30-November-15): 214
U.K. Datastream Index Normalized earnings and valuations
210
420
840
1680
3360
6720
13440
26880
1980 1985 1990 1995 2000 2005 2010 2015 2020
Source: Datastream, Consensus Economics, RBC GAM
Nov. '15 Range: 5856 - 11127 (Mid: 8491)
Nov. '16 Range: 6891 - 13093 (Mid: 9992)
Current (30-November-15): 4798
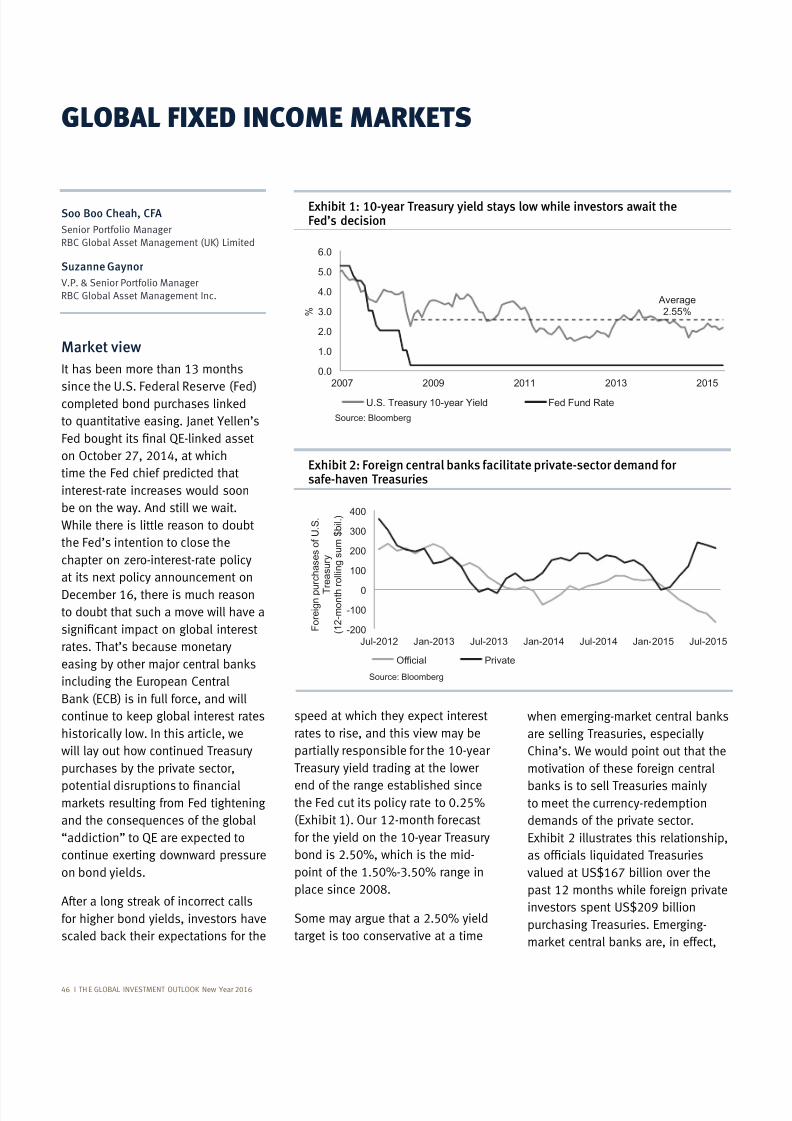
7/25/2019 Global Investment Outlook
http://slidepdf.com/reader/full/global-investment-outlook 48/80
Soo Boo Cheah, CFA
Senior Portfolio Manager
RBC Global Asset Management (UK) Limited
Suzanne Gaynor
V.P. & Senior Portfolio Manager
RBC Global Asset Management Inc.
46 I TH E GLOBAL INVESTMENT OUTLOOK New Year 2016
Market view
It has been more than 13 months
since the U.S. Federal Reserve (Fed)
to quantitative easing. Janet Yellen’s
on October 27, 2014, at which
time the Fed chief predicted that
interest-rate increases would soon
be on the way. And still we wait.
While there is little reason to doubt
the Fed’s intention to close the
chapter on zero-interest-rate policy
at its next policy announcement on
to doubt that such a move will have a
rates. That’s because monetary
including the European Central
historically low. In this article, we
will lay out how continued Treasury
purchases by the private sector,
and the consequences of the global
continue exerting downward pressure
on bond yields.
for higher bond yields, investors have
GLOBAL FIXED INCOME MARKETS
speed at which they expect interest
rates to rise, and this view may be
partially responsible for the 10-year
Treasury yield trading at the lower
end of the range established sincethe Fed cut its policy rate to 0.25%
(Exhibit 1). Our 12-month forecast
for the yield on the 10-year Treasury
bond is 2.50%, which is the mid-
point of the 1.50%-3.50% range in
Some may argue that a 2.50% yield
target is too conservative at a time
are selling Treasuries, especially
China’s. We would point out that the
motivation of these foreign central
to meet the currency-redemption
demands of the private sector.
Exhibit 2 illustrates this relationship,
valued at US$167 billion over the
past 12 months while foreign private
purchasing Treasuries. Emerging-
0.0
1.0
2.0
3.0
4.0
5.0
6.0
2007 2009 2011 2013 2015
%
U.S. Treasury 10-year Yield Fed Fund Rate
Average2.55%
Source: Bloomberg
-200
-100
0
100
200
300
400
Jul-2012 Jan-2013 Jul-2013 Jan-2014 Jul-2014 Jan-2015 Jul-2015
F o r e i g n p u
r c h a s e s o f U . S .
T r e a s u r y
( 1 2 - m o n t h
r o l l i n g s u m $ b i l . )
Official Private
Source: Bloomberg
Exhibit 2: Foreign central banks facilitate private-sector demand forsafe-haven Treasuries
Exhibit 1: 10-year Treasury yield stays low while investors await theFed’s decision
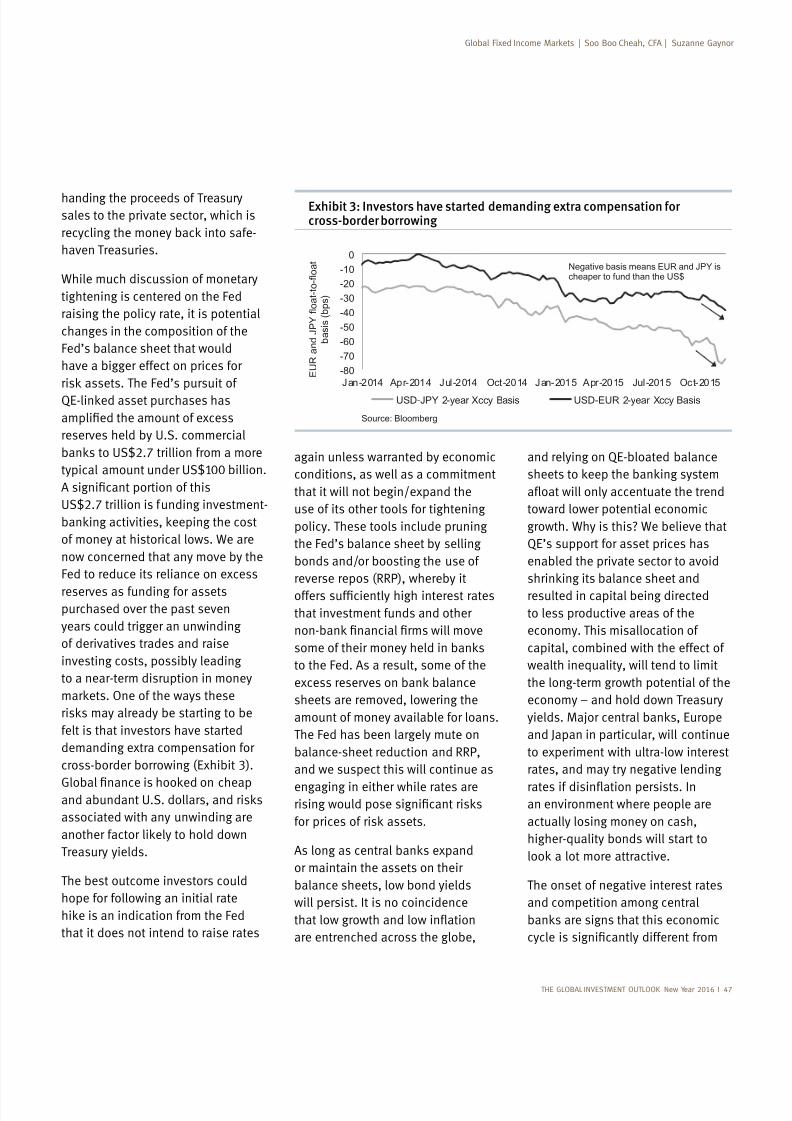
7/25/2019 Global Investment Outlook
http://slidepdf.com/reader/full/global-investment-outlook 49/80
THE GLOBAL INVESTMENT OUTLOOK New Year 2016 I 47
toward lower potential economic
growth. Why is this? We believe that
enabled the private sector to avoid
resulted in capital being directed
to less productive areas of the
economy. This misallocation of
capital, combined with the effect of
wealth inequality, will tend to limit
the long-term growth potential of the
economy – and hold down Treasury
and Japan in particular, will continue
to experiment with ultra-low interest
rates, and may try negative lending
an environment where people are
actually losing money on cash,
higher-quality bonds will start to
The onset of negative interest rates
and competition among central
again unless warranted by economic
conditions, as well as a commitment
that it will not begin/expand the
use of its other tools for tightening
policy. These tools include pruning
the Fed’s balance sheet by selling
bonds and/or boosting the use of
reverse repos (RRP), whereby it
that investment funds and other
to the Fed. As a result, some of the
sheets are removed, lowering the
amount of money available for loans.
The Fed has been largely mute on
balance-sheet reduction and RRP,
and we suspect this will continue as
engaging in either while rates are
or maintain the assets on their
balance sheets, low bond yields
will persist. It is no coincidence
are entrenched across the globe,
handing the proceeds of Treasurysales to the private sector, which is
haven Treasuries.
While much discussion of monetary
tightening is centered on the Fed
raising the policy rate, it is potential
changes in the composition of the
Fed’s balance sheet that would
have a bigger effect on prices for
reserves held by U.S. commercial
typical amount under US$100 billion.
US$2.7 trillion is funding investment-
of money at historical lows. We are
now concerned that any move by the
Fed to reduce its reliance on excess
reserves as funding for assetspurchased over the past seven
years could trigger an unwinding
of derivatives trades and raise
investing costs, possibly leading
to a near-term disruption in money
felt is that investors have started
demanding extra compensation for
cross-border borrowing (Exhibit 3).
associated with any unwinding are
Treasury yields.
The best outcome investors could
hope for following an initial rate
that it does not intend to raise rates
-80
-70
-60
-50
-40
-30
-20
-10
0
Jan-2014 Apr-2014 Jul-2014 Oct-2014 Jan-2015 Apr-2015 Jul-2015 Oct-2015 E U R a n d J P Y f l o a t - t o - f l o a t
b a s i s ( b p s )
USD-JPY 2-year Xccy Basis USD-EUR 2-year Xccy Basis
Negative basis means EUR and JPY ischeaper to fund than the US$
Source: Bloomberg
Exhibit 3: Investors have started demanding extra compensation forcross-border borrowing

7/25/2019 Global Investment Outlook
http://slidepdf.com/reader/full/global-investment-outlook 50/80
New Year 2016
U.S. – We expect the Fed to deliver
the long-anticipated policy-rate
while assuring investors that the
size of its balance sheet will remain
unchanged. Our view is that the Fed
to facilitate further tightening over
the next 12 months. We expect this
adjustment to result in volatility for
forecast a 1.00% fed funds rate by
the end of 2016.
To derive our 2.50% forecast for the
10-year Treasury, we assume a slow
and gradual tightening cycle and use
the 2-year point of the yield curveto express this view. Our model
suggests a 2-year yield of 1.50% by
spread of 100 basis points between
yields on the 2-year and the 10-year
Treasury bonds (Exhibit 4), we get a
2.50% yield for the 10-year bond in a
year’s time.
planned asset purchases and further
cut the policy rate into negative
territory. In Japan, the direction
of yields on Japanese government
bonds (JGBs) will depend largely on
(BOJ) and the speed of investors’
shift away from holding JGBs. We
expect Government of Canada bonds
with intermediate to long maturities
interest rate unchanged.
The Fed is preparing investors for
upstream against many other major
Our belief that the pace of interest-
that this tightening cycle will be less
least in the early stages. However,
opposite directions, the impact of
changes in policy-rate differentials
previous ones. Using unorthodox
trying to outdo each other in this race
to the bottom. Even the Fed, which
policy amid modest domestic growth,
will be limited by how fast it can raise
rates given slowing global growth,
plummeting trade and increased
asset-price volatility. In this monetaryenvironment, bond investors can
pretty much ignore any single action
by the Fed to get policy rates up, and
should instead focus on whether the
Fed will be able to continue boosting
improvement in global economic
conditions, the pace of tightening by
and global bond yields are expected
to move sideways within the band
Direction of rates
We are trimming our bond-yield
forecasts and continue to expect
shorter-maturity yields to rise faster
than yields on longer-term securities.
We forecast that bond yields will be
little changed over the next year,
meaning a global bond portfolio
should produce a small positive
return of 1.5%, not the typical 3% to
5% loss in years after the Fed begins
a tightening cycle. We expect the
that the Fed’s move has been
we expect the ECB to extend its
-50
0
50
100
150
200
250
0 1 2 3 4 5 6
U . S . Y i e l d c u r v e 1 0 - y e a r v s
2 - y e a r ( b p s )
Fed Fund Rate
2004 Cycle
This Cycle?
Source: Bloomberg
Exhibit 4: Our model suggests 1% fed funds rate could narrow yield gapbetween 2-year and 10-year Treasuries
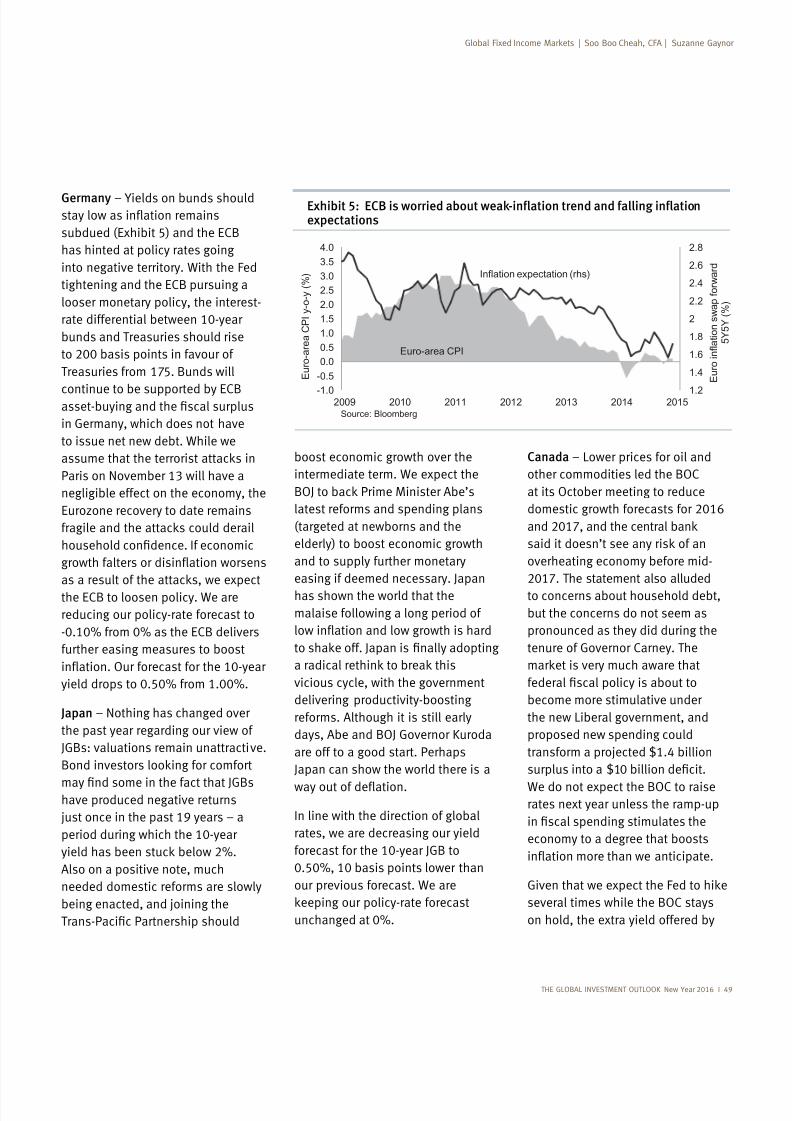
7/25/2019 Global Investment Outlook
http://slidepdf.com/reader/full/global-investment-outlook 51/80
THE GLOBAL INVESTMENT OUTLOOK New Year 2016
Canada – Lower prices for oil and
other commodities led the BOC
at its October meeting to reduce
domestic growth forecasts for 2016
overheating economy before mid-
2017. The statement also alluded
to concerns about household debt,
but the concerns do not seem as
pronounced as they did during the
tenure of Governor Carney. The
become more stimulative under
the new Liberal government, and
proposed new spending could
transform a projected $1.4 billion
We do not expect the BOC to raiserates next year unless the ramp-up
economy to a degree that boosts
several times while the BOC stays
on hold, the extra yield offered by
boost economic growth over the
intermediate term. We expect the
latest reforms and spending plans
(targeted at newborns and the
elderly) to boost economic growth
and to supply further monetary
easing if deemed necessary. Japan
has shown the world that the
malaise following a long period of
vicious cycle, with the government
delivering productivity-boosting
reforms. Although it is still early
days, Abe and BOJ Governor Kuroda
are off to a good start. Perhaps
Japan can show the world there is a
In line with the direction of global
rates, we are decreasing our yield
forecast for the 10-year JGB to
0.50%, 10 basis points lower than
our previous forecast. We are
unchanged at 0%.
Germany – Yields on bunds should
subdued (Exhibit 5) and the ECB
has hinted at policy rates going
into negative territory. With the Fed
tightening and the ECB pursuing a
looser monetary policy, the interest-
rate differential between 10-year
bunds and Treasuries should rise
to 200 basis points in favour of
Treasuries from 175. Bunds will
continue to be supported by ECB
in Germany, which does not have
to issue net new debt. While we
Paris on November 13 will have a
negligible effect on the economy, the
Eurozone recovery to date remains
the ECB to loosen policy. We are
reducing our policy-rate forecast to
-0.10% from 0% as the ECB delivers
further easing measures to boost
yield drops to 0.50% from 1.00%.
Japan – Nothing has changed over
the past year regarding our view of
JGBs: valuations remain unattractive.
have produced negative returns
period during which the 10-year
Also on a positive note, much
needed domestic reforms are slowly
being enacted, and joining the
1.2
1.4
1.6
1.8
2
2.2
2.4
2.6
2.8
-1.0
-0.5
0.0
0.5
1.0
1.5
2.0
2.5
3.0
3.5
4.0
2009 2010 2011 2012 2013 2014 2015
E u r o i n f l a t i o n s w a p f o r w a r d
5 Y 5 Y ( % )
E u r o - a r e a C P I y - o - y ( % )
Euro-area CPI
Inflation expectation (rhs)
Source: Bloomberg
expectations
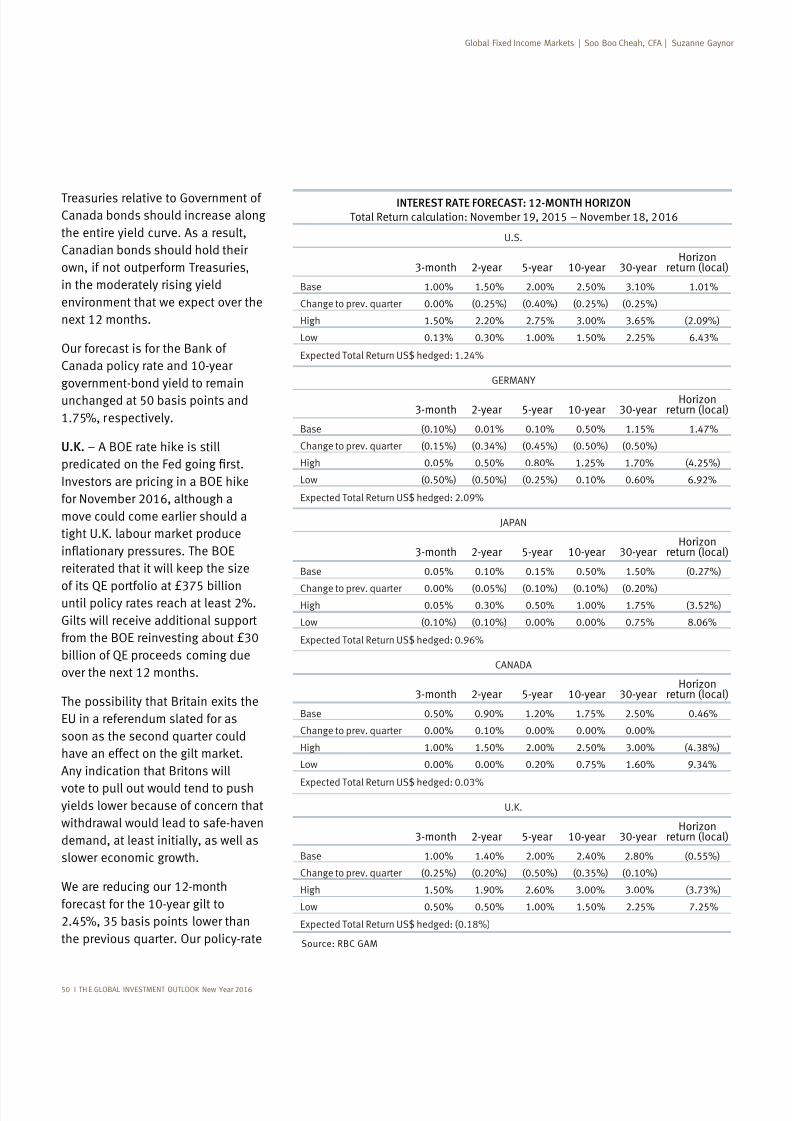
7/25/2019 Global Investment Outlook
http://slidepdf.com/reader/full/global-investment-outlook 52/80
50 I TH E GLOBAL INVESTMENT OUTLOOK New Year 2016
U.S.
3-month 2-year 5-year 10-year 30-yearHorizon
return (local)
Base 1.00% 1.50% 2.00% 2.50% 3.10% 1.01%
Change to prev. quarter 0.00% (0.25%) (0.40%) (0.25%) (0.25%)
High 1.50% 2.20% 2.75% 3.00% 3.65%
Low 0.13% 0.30% 1.00% 1.50% 2.25% 6.43%
Expected Total Return US$ hedged: 1.24%
GERMANY
3-month 2-year 5-year 10-year 30-yearHorizon
return (local)
Base (0.10%) 0.01% 0.10% 0.50% 1.15% 1.47%
Change to prev. quarter (0.15%) (0.34%) (0.45%) (0.50%) (0.50%)
High 0.05% 0.50% 1.25% 1.70% (4.25%)
Low (0.50%) (0.50%) (0.25%) 0.10% 0.60%
JAPAN
3-month 2-year 5-year 10-year 30-yearHorizon
return (local)
Base 0.05% 0.10% 0.15% 0.50% 1.50% (0.27%)
Change to prev. quarter 0.00% (0.05%) (0.10%) (0.10%) (0.20%)High 0.05% 0.30% 0.50% 1.00% 1.75% (3.52%)
Low (0.10%) (0.10%) 0.00% 0.00% 0.75%
3-month 2-year 5-year 10-year 30-yearHorizon
return (local)
Base 0.50% 1.20% 1.75% 2.50% 0.46%
Change to prev. quarter 0.00% 0.10% 0.00% 0.00% 0.00%
High 1.00% 1.50% 2.00% 2.50% 3.00%
Low 0.00% 0.00% 0.20% 0.75% 1.60%
Expected Total Return US$ hedged: 0.03%
U.K.
3-month 2-year 5-year 10-year 30-yearHorizon
return (local)
Base 1.00% 1.40% 2.00% 2.40% (0.55%)
Change to prev. quarter (0.25%) (0.20%) (0.50%) (0.35%) (0.10%)
High 1.50% 2.60% 3.00% 3.00% (3.73%)
Low 0.50% 0.50% 1.00% 1.50% 2.25% 7.25%
INTEREST RATE FORECAST: 12-MONTH HORIZON
Source: RBC GAM
Treasuries relative to Government ofCanada bonds should increase along
the entire yield curve. As a result,
Canadian bonds should hold their
own, if not outperform Treasuries,
in the moderately rising yield
environment that we expect over the
next 12 months.
Canada policy rate and 10-year
government-bond yield to remain
unchanged at 50 basis points and
1.75%, respectively.
U.K.
for November 2016, although a
move could come earlier should a
until policy rates reach at least 2%.
Gilts will receive additional support
over the next 12 months.
The possibility that Britain exits the
EU in a referendum slated for as
soon as the second quarter could
Any indication that Britons will
vote to pull out would tend to pushyields lower because of concern that
withdrawal would lead to safe-haven
demand, at least initially, as well as
slower economic growth.
We are reducing our 12-month
forecast for the 10-year gilt to
2.45%, 35 basis points lower than
the previous quarter. Our policy-rate

7/25/2019 Global Investment Outlook
http://slidepdf.com/reader/full/global-investment-outlook 53/80
THE GLOBAL INVESTMENT OUTLOOK New Year 2016 I 51
points to 1.00%.
Regional preferences
We expect global bond yields to
increase marginally from current
levels driven by higher Fed policy
rates. In our view, short-maturity
rates will rise more than thoseon longer maturities, which are
anchored by uncertainty related
funding costs continue to rise.
We recommend a 5% overweight
in German bunds and a similarunderweight in JGBs.
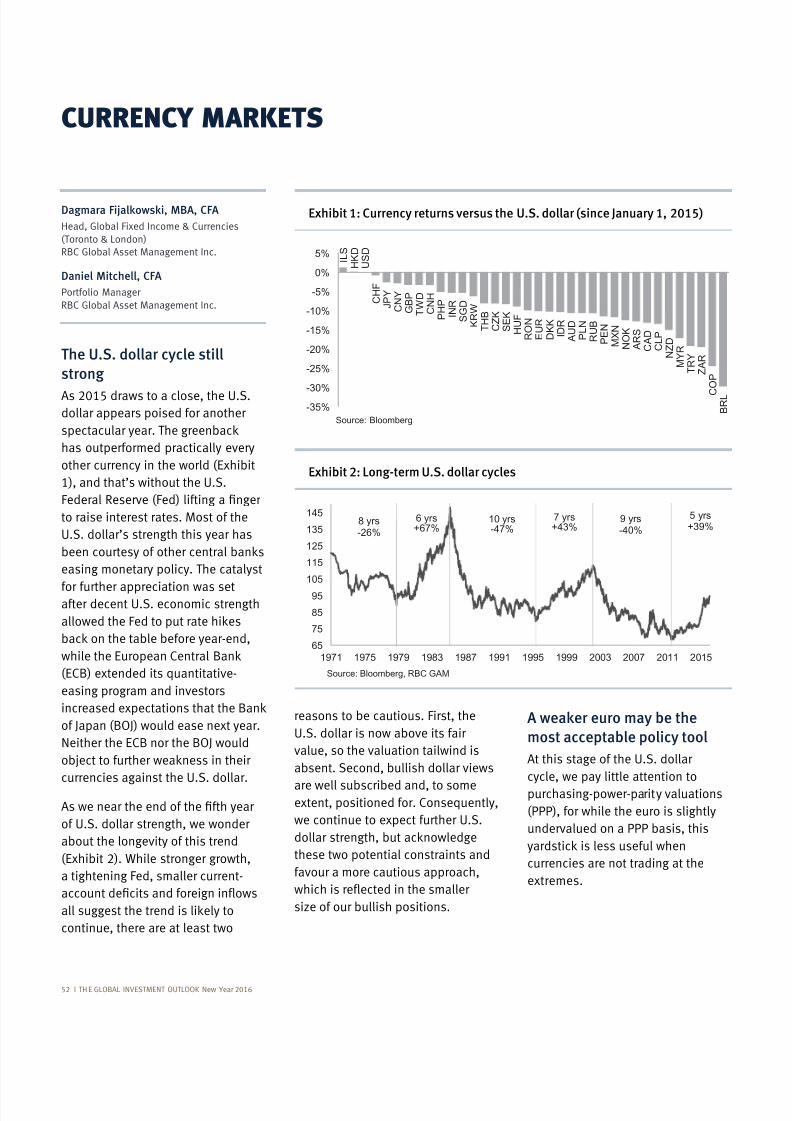
7/25/2019 Global Investment Outlook
http://slidepdf.com/reader/full/global-investment-outlook 54/80
CURRENCY MARKETS
The U.S. dollar cycle still
strong
As 2015 draws to a close, the U.S.dollar appears poised for another
has outperformed practically every
other currency in the world (Exhibit
1), and that’s without the U.S.
to raise interest rates. Most of the
U.S. dollar’s strength this year has
easing monetary policy. The catalyst
for further appreciation was setafter decent U.S. economic strength
(ECB) extended its quantitative-
easing program and investors
of Japan (BOJ) would ease next year.
Neither the ECB nor the BOJ would
currencies against the U.S. dollar.
of U.S. dollar strength, we wonder
about the longevity of this trend
(Exhibit 2). While stronger growth,
a tightening Fed, smaller current-
continue, there are at least two
Dagmara Fijalkowski, MBA, CFA
Head, Global Fixed Income & Currencies
(Toronto & London)RBC Global Asset Management Inc.
Daniel Mitchell, CFA
Portfolio Manager
RBC Global Asset Management Inc.
reasons to be cautious. First, the
U.S. dollar is now above its fair
value, so the valuation tailwind is
absent. Second, bullish dollar views
are well subscribed and, to someextent, positioned for. Consequently,
we continue to expect further U.S.
these two potential constraints and
favour a more cautious approach,
size of our bullish positions.
A weaker euro may be the
most acceptable policy tool
At this stage of the U.S. dollar
cycle, we pay little attention to
purchasing-power-parity valuations
(PPP), for while the euro is slightly
undervalued on a PPP basis, this
currencies are not trading at the
extremes.
52 I TH E GLOBAL INVESTMENT OUTLOOK New Year 2016
Exhibit 1: Currency returns versus the U.S. dollar (since January 1, 2015)
I L S
H K D
U S D
C H F
J P Y
C N Y
G B P
T W D
C N H
P H P I N R
S G D
K R W
T H B
C Z K
S E K
H U F
R O N
E U R
D K K I D R
A U D
P L N
R U B
P E N
M X N
N O K
A R S
C A D
C L P
N Z D
M Y R
T R Y
Z A R
C
O P
B R L
-35%-30%
-25%
-20%
-15%
-10%
-5%
0%
5%
Source: Bloomberg
Exhibit 2: Long-term U.S. dollar cycles
65
75
85
95
105
115
125
135
145
1971 1975 1979 1983 1987 1991 1995 1999 2003 2007 2011 2015
8 yrs-26%
6 yrs+67%
10 yrs-47%
7 yrs+43%
9 yrs-40%
5 yrs+39%
Source: Bloomberg, RBC GAM
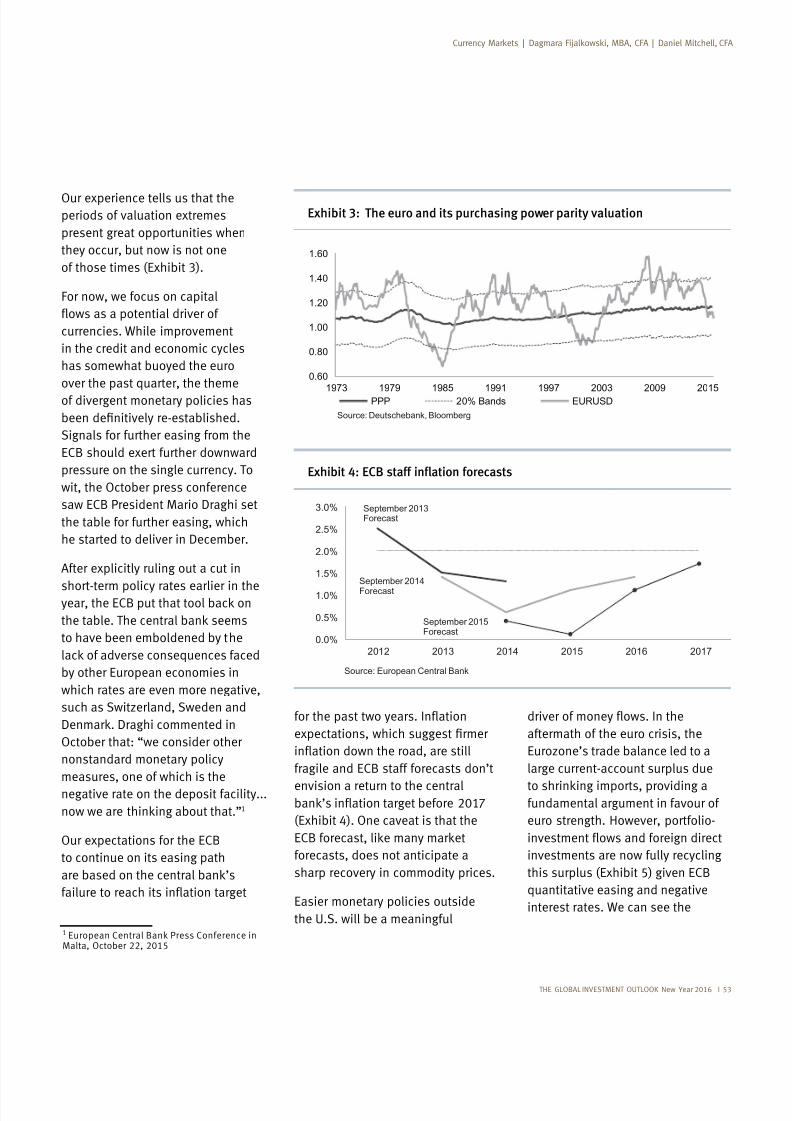
7/25/2019 Global Investment Outlook
http://slidepdf.com/reader/full/global-investment-outlook 55/80
THE GLOBAL INVESTMENT OUTLOOK New Year 2016 I 53
Exhibit 3: The euro and its purchasing power parity valuation
0.60
0.80
1.00
1.20
1.40
1.60
1973 1979 1985 1991 1997 2003 2009 2015PPP 20% Bands EURUSD
Source: Deutschebank, Bloomberg
0.0%
0.5%
1.0%
1.5%
2.0%
2.5%
3.0%
2012 2013 2014 2015 2016 2017
September 2013Forecast
September 2014
Forecast
September 2015Forecast
Source: European Central Bank
| |
Our experience tells us that theperiods of valuation extremes
present great opportunities when
they occur, but now is not one
of those times (Exhibit 3).
For now, we focus on capital
currencies. While improvement
in the credit and economic cycles
has somewhat buoyed the euro
over the past quarter, the theme
of divergent monetary policies has
Signals for further easing from the
ECB should exert further downward
pressure on the single currency. To
wit, the October press conference
the table for further easing, which
After explicitly ruling out a cut in
short-term policy rates earlier in the
to have been emboldened by the
by other European economies in
which rates are even more negative,
such as Switzerland, Sweden and
October that: “we consider other
nonstandard monetary policy
measures, one of which is the
negative rate on the deposit facility...
1
Our expectations for the ECB
to continue on its easing path
1 Malta, October 22, 2015
fragile and ECB staff forecasts don’t
envision a return to the central
(Exhibit 4). One caveat is that the
forecasts, does not anticipate a
sharp recovery in commodity prices.
Easier monetary policies outside
the U.S. will be a meaningful
aftermath of the euro crisis, the
Eurozone’s trade balance led to a
large current-account surplus due
fundamental argument in favour of
euro strength. However, portfolio-
investments are now fully recycling
this surplus (Exhibit 5) given ECB
quantitative easing and negative
interest rates. We can see the
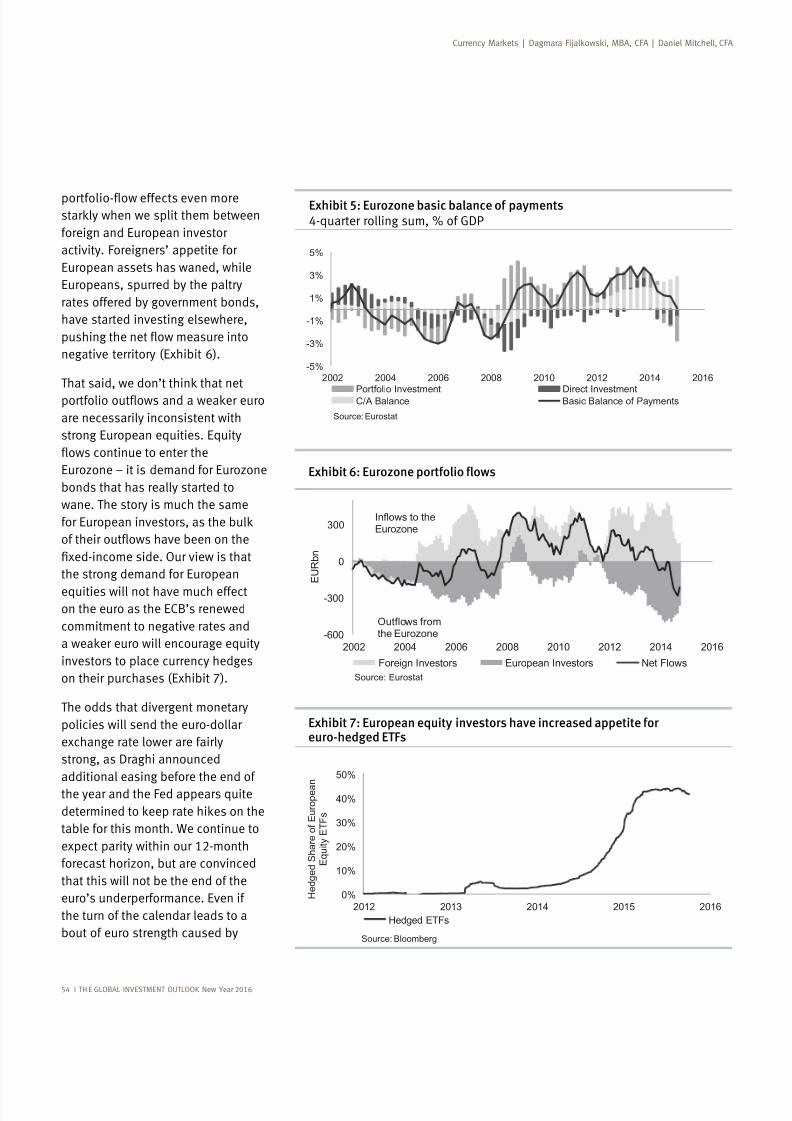
7/25/2019 Global Investment Outlook
http://slidepdf.com/reader/full/global-investment-outlook 56/80
54 I TH E GLOBAL INVESTMENT OUTLOOK New Year 2016
Exhibit 5: Eurozone basic balance of payments4-quarter rolling sum, % of
-5%
-3%
-1%
1%
3%
5%
2002 2004 2006 2008 2010 2012 2014 2016
Portfolio Investment Direct InvestmentC/A Balance Basic Balance of Payments
Source: Eurostat
-600
-300
0
300
2002 2004 2006 2008 2010 2012 2014 2016
E U R b n
Foreign Investors European Investors Net Flows
Outflows fromthe Eurozone
Inflows to theEurozone
Source: Eurostat
Exhibit 7: European equity investors have increased appetite foreuro-hedged ETFs
0%
10%
20%
30%
40%
50%
2012 2013 2014 2015 2016 H e d g e d S h a r e o f E u r o p e a n
E q u i t y E T F s
Hedged ETFs
Source: Bloomberg
foreign and European investor
activity. Foreigners’ appetite for
European assets has waned, while
Europeans, spurred by the paltry
rates offered by government bonds,
have started investing elsewhere,
negative territory (Exhibit 6).
are necessarily inconsistent with
strong European equities. Equity
Eurozone – it is demand for Eurozone
bonds that has really started to
wane. The story is much the same
the strong demand for European
equities will not have much effecton the euro as the ECB’s renewed
commitment to negative rates and
investors to place currency hedges
on their purchases (Exhibit 7).
The odds that divergent monetary
policies will send the euro-dollar
exchange rate lower are fairly
additional easing before the end of
the year and the Fed appears quite
table for this month. We continue to
expect parity within our 12-month
forecast horizon, but are convinced
that this will not be the end of the
euro’s underperformance. Even if
the turn of the calendar leads to a
bout of euro strength caused by
| |
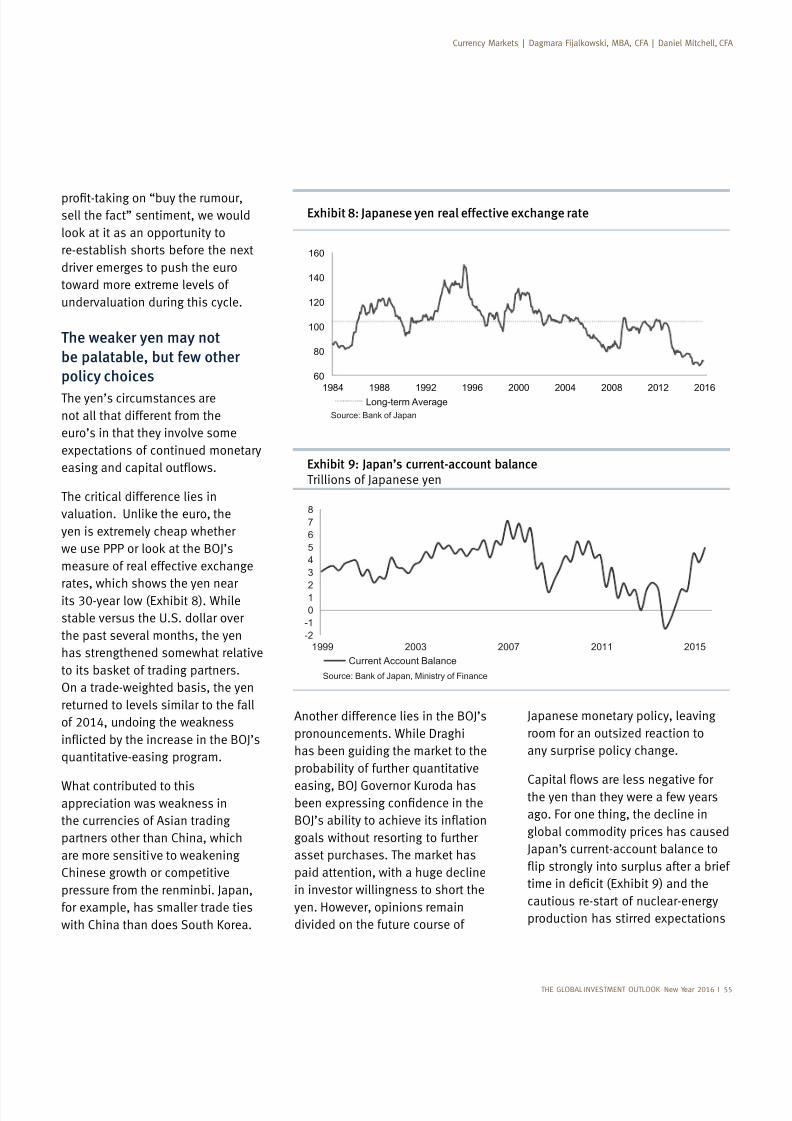
7/25/2019 Global Investment Outlook
http://slidepdf.com/reader/full/global-investment-outlook 57/80
THE GLOBAL INVESTMENT OUTLOOK New Year 2016 I 55
Japanese monetary policy, leaving
room for an outsized reaction to
any surprise policy change.
the yen than they were a few years
ago. For one thing, the decline in
global commodity prices has caused
Japan’s current-account balance to
cautious re-start of nuclear-energy
production has stirred expectations
Another difference lies in the BOJ’s
probability of further quantitative
easing, BOJ Governor Kuroda has
goals without resorting to further
paid attention, with a huge decline
in investor willingness to short the
yen. However, opinions remain
divided on the future course of
sell the fact” sentiment, we would
re-establish shorts before the next
driver emerges to push the euro
toward more extreme levels of
undervaluation during this cycle.
The weaker yen may not
be palatable, but few other
policy choices
The yen’s circumstances are
not all that different from the
euro’s in that they involve some
expectations of continued monetary
The critical difference lies in
yen is extremely cheap whether
measure of real effective exchange
rates, which shows the yen near
stable versus the U.S. dollar over
the past several months, the yen
has strengthened somewhat relative
On a trade-weighted basis, the yen
returned to levels similar to the fall
quantitative-easing program.
What contributed to this
the currencies of Asian trading
partners other than China, which
Chinese growth or competitive
pressure from the renminbi. Japan,
for example, has smaller trade ties
with China than does South Korea.
| |
Exhibit 8: Japanese yen real effective exchange rate
60
80
100
120
140
160
1984 1988 1992 1996 2000 2004 2008 2012 2016Long-term Average
Source: Bank of Japan
Exhibit 9: Japan’s current-account balanceTrillions of Japanese yen
-2
-1
0
12
3
4
5
6
7
8
1999 2003 2007 2011 2015
Current Account Balance
Source: Bank of Japan, Ministry of Finance
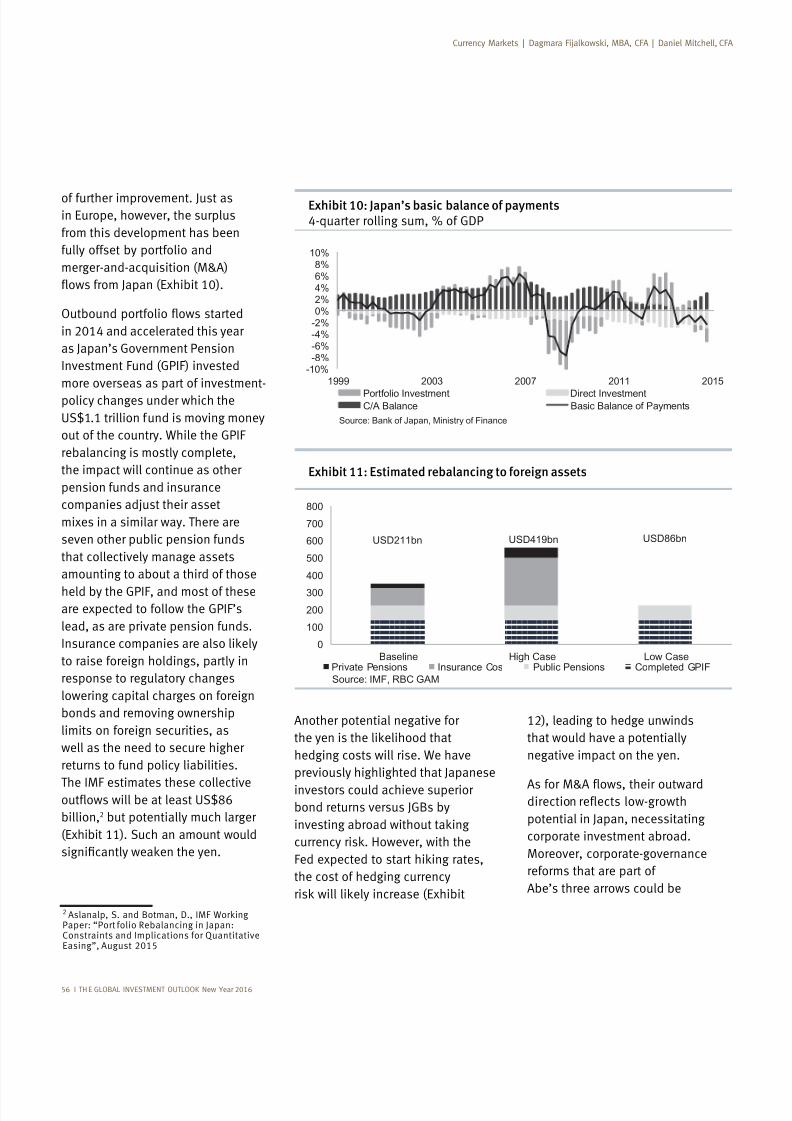
7/25/2019 Global Investment Outlook
http://slidepdf.com/reader/full/global-investment-outlook 58/80
56 I TH E GLOBAL INVESTMENT OUTLOOK New Year 2016
Exhibit 10: Japan’s basic balance of payments
-10%-8%-6%-4%-2%0%2%4%6%8%
10%
1999 2003 2007 2011 2015
Portfolio Investment Direct InvestmentC/A Balance Basic Balance of Payments
Source: Bank of Japan, Ministry of Finance
Exhibit 11: Estimated rebalancing to foreign assets
USD211bn USD419bn USD86bn
0
100
200
300
400
500
600
700
800
Baseline High Case Low CasePrivate Pensions Insurance Cos Public Pensions Completed GPIFSource: IMF, RBC GAM
of further improvement. Just asin Europe, however, the surplus
from this development has been
fully offset by portfolio and
merger-and-acquisition (M&A)
in 2014 and accelerated this year
as Japan’s Government Pension
Investment Fund (GPIF) invested
more overseas as part of investment-
policy changes under which the
US$1.1 trillion fund is moving money
out of the country. While the GPIF
rebalancing is mostly complete,
the impact will continue as other
pension funds and insurance
companies adjust their asset
mixes in a similar way. There are
seven other public pension funds
that collectively manage assets
amounting to about a third of those
held by the GPIF, and most of theseare expected to follow the GPIF’s
lead, as are private pension funds.
to raise foreign holdings, partly in
response to regulatory changes
lowering capital charges on foreign
bonds and removing ownership
limits on foreign securities, as
well as the need to secure higher
returns to fund policy liabilities.
The IMF estimates these collective
billion,2 but potentially much larger
(Exhibit 11). Such an amount would
2 Paper: “Port folio Rebalancing in Japan: Easing”, August 2015
| |
Another potential negative for
hedging costs will rise. We have
previously highlighted that Japanese
investors could achieve superiorbond returns versus JGBs by
the cost of hedging currency
12), leading to hedge unwinds
that would have a potentially
negative impact on the yen.
potential in Japan, necessitating
corporate investment abroad.
Moreover, corporate-governance
reforms that are part of
Abe’s three arrows could be
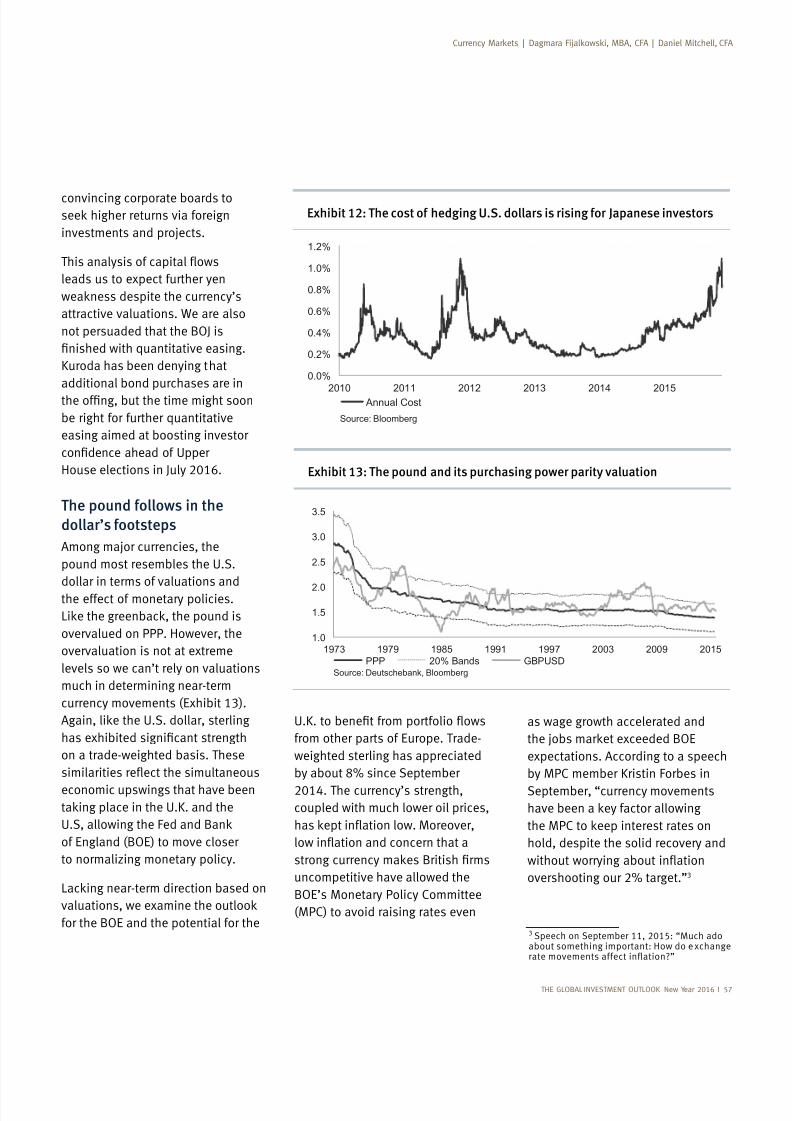
7/25/2019 Global Investment Outlook
http://slidepdf.com/reader/full/global-investment-outlook 59/80
THE GLOBAL INVESTMENT OUTLOOK New Year 2016 I 57
Exhibit 12: The cost of hedging U.S. dollars is rising for Japanese investors
0.0%
0.2%
0.4%
0.6%
0.8%
1.0%
1.2%
2010 2011 2012 2013 2014 2015 Annual Cost
Source: Bloomberg
convincing corporate boards to
investments and projects.
leads us to expect further yen
attractive valuations. We are also
not persuaded that the BOJ is
Kuroda has been denying that
additional bond purchases are in
be right for further quantitative
easing aimed at boosting investor
House elections in July 2016.
The pound follows in the
dollar’s footsteps
Among major currencies, the
pound most resembles the U.S.
dollar in terms of valuations and
the effect of monetary policies.
overvalued on PPP. However, the
overvaluation is not at extreme
levels so we can’t rely on valuations
much in determining near-term
currency movements (Exhibit 13).
on a trade-weighted basis. These
economic upswings that have been
of England (BOE) to move closer
to normalizing monetary policy.
for the BOE and the potential for the
from other parts of Europe. Trade-
weighted sterling has appreciated
2014. The currency’s strength,coupled with much lower oil prices,
uncompetitive have allowed the
BOE’s Monetary Policy Committee
(MPC) to avoid raising rates even
as wage growth accelerated and
expectations. According to a speech
by MPC member Kristin Forbes in
September, “currency movements
hold, despite the solid recovery and
overshooting our 2% target.”3
3 Speech on September 11, 2015: “Much adoabout something important: How do e xchange
| |
Exhibit 13: The pound and its purchasing power parity valuation
1.0
1.5
2.0
2.5
3.0
3.5
1973 1979 1985 1991 1997 2003 2009 2015PPP 20% Bands GBPUSD
Source: Deutschebank, Bloomberg
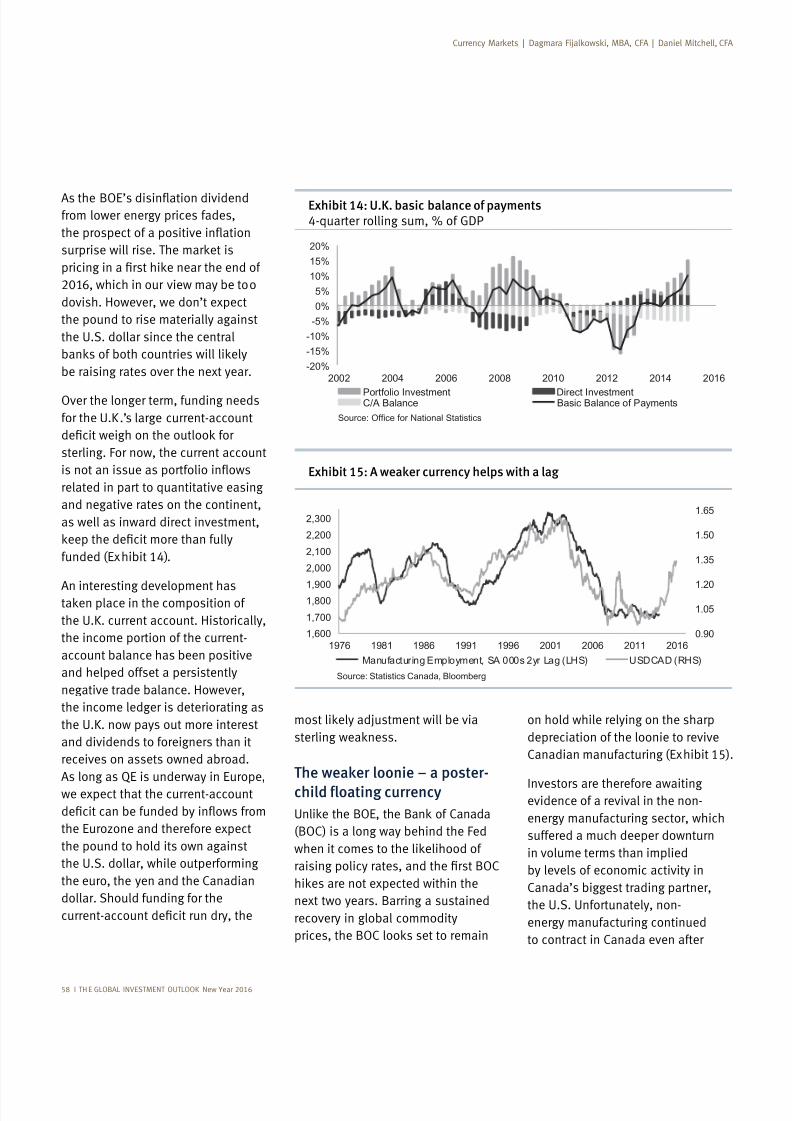
7/25/2019 Global Investment Outlook
http://slidepdf.com/reader/full/global-investment-outlook 60/80
New Year 2016
Exhibit 14: U.K. basic balance of payments
-20%
-15%
-10%
-5%
0%
5%
10%
15%
20%
2002 2004 2006 2008 2010 2012 2014 2016
Portfolio Investment Direct InvestmentC/A Balance Basic Balance of Payments
Source: Office for National Statistics
Exhibit 15: A weaker currency helps with a lag
0.90
1.05
1.20
1.35
1.50
1.65
1,600
1,700
1,8001,900
2,000
2,100
2,200
2,300
1976 1981 1986 1991 1996 2001 2006 2011 2016
Manufacturing Employment, SA 000s 2yr Lag (LHS) USDCAD (RHS)
Source: Statistics Canada, Bloomberg
from lower energy prices fades,
2016, which in our view may be too
dovish. However, we don’t expect
the pound to rise materially against
the U.S. dollar since the central
be raising rates over the next year.
Over the longer term, funding needs
for the U.K.’s large current-account
sterling. For now, the current account
related in part to quantitative easing
and negative rates on the continent,
as well as inward direct investment,
funded (Exhibit 14).
An interesting development has
the U.K. current account. Historically,
the income portion of the current-
account balance has been positive
and helped offset a persistently
negative trade balance. However,
the income ledger is deteriorating as
the U.K. now pays out more interest
and dividends to foreigners than it
receives on assets owned abroad.
we expect that the current-account
the Eurozone and therefore expect
the pound to hold its own against
the U.S. dollar, while outperforming
the euro, the yen and the Canadian
dollar. Should funding for the
| |
The weaker loonie – a poster-
(BOC) is a long way behind the Fed
next two years. Barring a sustained
recovery in global commodity
on hold while relying on the sharp
depreciation of the loonie to revive
Canadian manufacturing (Exhibit 15).
Investors are therefore awaitingevidence of a revival in the non-
energy manufacturing sector, which
suffered a much deeper downturn
in volume terms than implied
by levels of economic activity in
Canada’s biggest trading partner,
the U.S. Unfortunately, non-
energy manufacturing continued
to contract in Canada even after
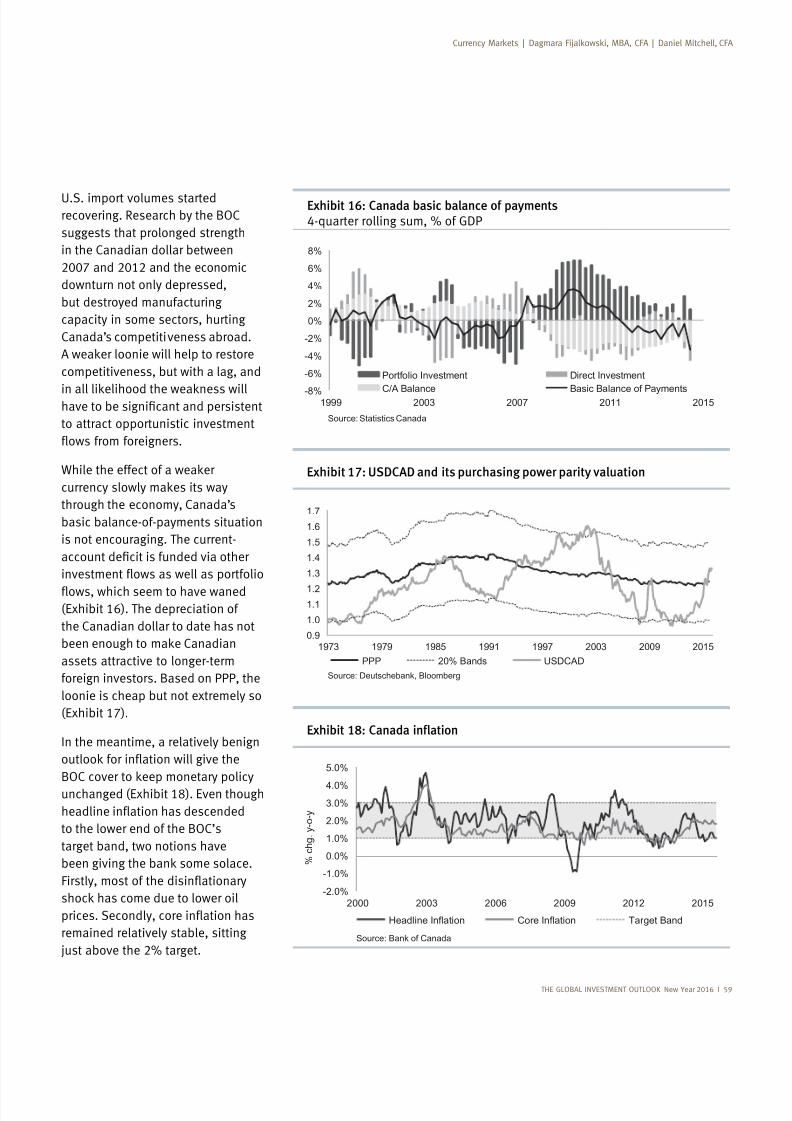
7/25/2019 Global Investment Outlook
http://slidepdf.com/reader/full/global-investment-outlook 61/80
THE GLOBAL INVESTMENT OUTLOOK New Year
Exhibit 16: Canada basic balance of payments
-8%
-6%
-4%
-2%
0%
2%
4%
6%
8%
1999 2003 2007 2011 2015
Portfolio Investment Direct Investment
C/A Balance Basic Balance of Payments
Source: Statistics Canada
Exhibit 17: USDCAD and its purchasing power parity valuation
0.9
1.0
1.11.2
1.3
1.4
1.5
1.6
1.7
1973 1979 1985 1991 1997 2003 2009 2015
PPP 20% Bands USDCAD
Source: Deutschebank, Bloomberg
-2.0%
-1.0%
0.0%
1.0%
2.0%
3.0%
4.0%
5.0%
2000 2003 2006 2009 2012 2015
% c h g . y - o - y
Headline Inflation Core Inflation Target Band
Source: Bank of Canada
U.S. import volumes startedrecovering. Research by the BOC
suggests that prolonged strength
in the Canadian dollar between
2007 and 2012 and the economic
downturn not only depressed,
but destroyed manufacturing
capacity in some sectors, hurting
Canada’s competitiveness abroad.
competitiveness, but with a lag, and
to attract opportunistic investment
through the economy, Canada’s
basic balance-of-payments situation
is not encouraging. The current-
(Exhibit 16). The depreciation of
the Canadian dollar to date has not
assets attractive to longer-term
foreign investors. Based on PPP, the
loonie is cheap but not extremely so
(Exhibit 17).
In the meantime, a relatively benign
to the lower end of the BOC’s
target band, two notions have
remained relatively stable, sitting
just above the 2% target.
| |
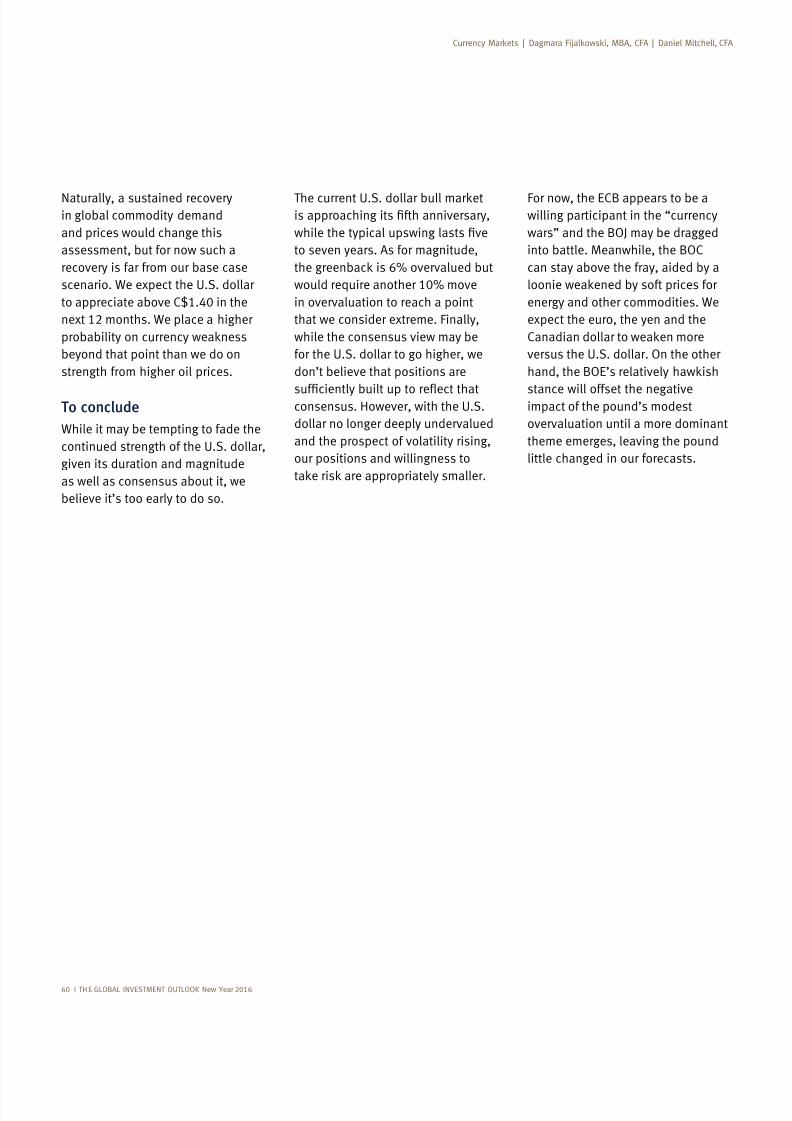
7/25/2019 Global Investment Outlook
http://slidepdf.com/reader/full/global-investment-outlook 62/80
60 I TH E GLOBAL INVESTMENT OUTLOOK New Year 2016
Naturally, a sustained recoveryin global commodity demand
and prices would change this
assessment, but for now such a
recovery is far from our base case
scenario. We expect the U.S. dollar
to appreciate above C$1.40 in the
next 12 months. We place a higher
beyond that point than we do on
strength from higher oil prices.
To conclude
While it may be tempting to fade the
continued strength of the U.S. dollar,
given its duration and magnitude
as well as consensus about it, we
believe it’s too early to do so.
| |
to seven years. As for magnitude,
would require another 10% move
in overvaluation to reach a point
that we consider extreme. Finally,
while the consensus view may be
for the U.S. dollar to go higher, we
don’t believe that positions are
consensus. However, with the U.S.
dollar no longer deeply undervalued
and the prospect of volatility rising,
our positions and willingness to
For now, the ECB appears to be awilling participant in the “currency
wars” and the BOJ may be dragged
into battle. Meanwhile, the BOC
can stay above the fray, aided by a
energy and other commodities. We
expect the euro, the yen and the
versus the U.S. dollar. On the other
stance will offset the negativeimpact of the pound’s modest
overvaluation until a more dominant
theme emerges, leaving the pound
little changed in our forecasts.
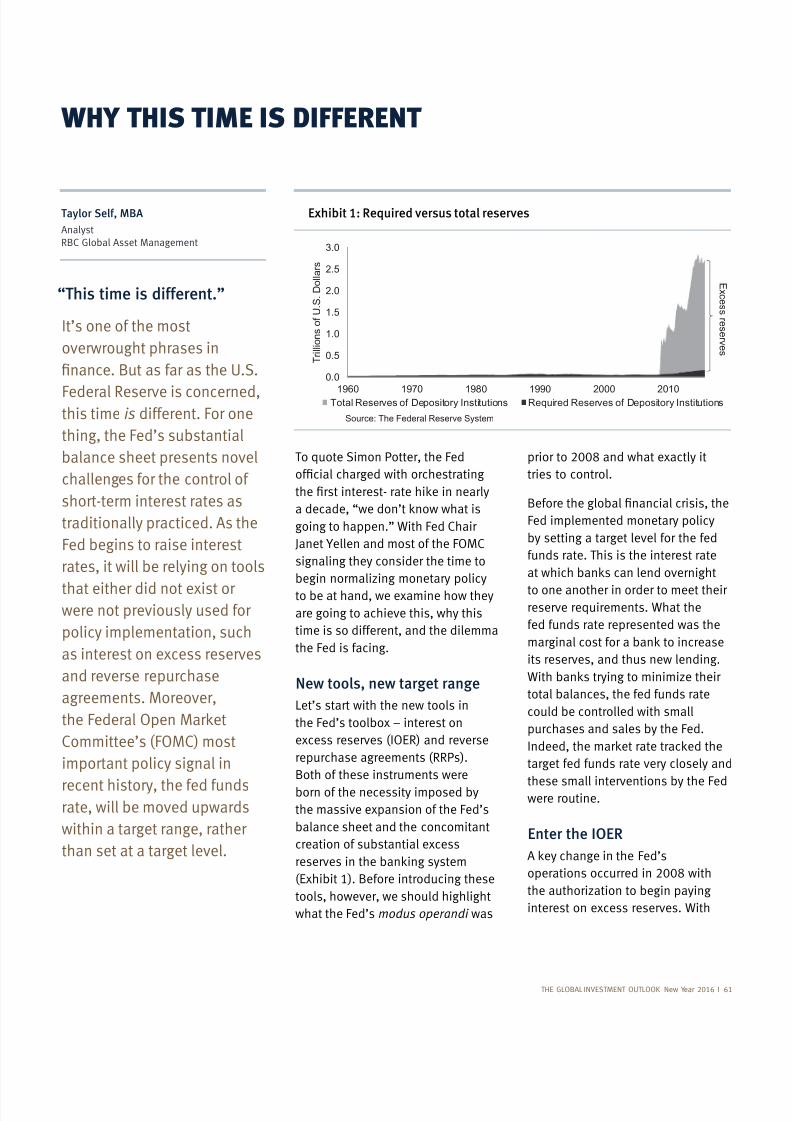
7/25/2019 Global Investment Outlook
http://slidepdf.com/reader/full/global-investment-outlook 63/80
To quote Simon Potter, the Fed
going to happen.” With Fed Chair
Janet Yellen and most of the FOMC
signaling they consider the time to
begin normalizing monetary policy
to be at hand, we examine how they
are going to achieve this, why this
time is so different, and the dilemma
the Fed is facing.
New tools, new target range
Let’s start with the new tools in
the Fed’s toolbox – interest on
excess reserves (IOER) and reverse
repurchase agreements (RRPs).
Both of these instruments were
born of the necessity imposed by
the massive expansion of the Fed’s
balance sheet and the concomitant
creation of substantial excess
(Exhibit 1). Before introducing these
tools, however, we should highlight
what the Fed’s modus operandi was
“This time is different.”
It’s one of the most
overwrought phrases in
Federal Reserve is concerned,this time is different. For one
thing, the Fed’s substantial
balance sheet presents novel
challenges for the control of
short-term interest rates as
traditionally practiced. As the
Fed begins to raise interest
rates, it will be relying on tools
that either did not exist orwere not previously used for
policy implementation, such
as interest on excess reserves
and reverse repurchase
agreements. Moreover,
Committee’s (FOMC) most
important policy signal in
recent history, the fed fundsrate, will be moved upwards
within a target range, rather
than set at a target level.
Taylor Self, MBA
AnalystRBC Global Asset Management
THE GLOBAL INVESTMENT OUTLOOK New Year 2016 I 61
WHY THIS TIME IS DIFFERENT
tries to control.
Fed implemented monetary policy
by setting a target level for the fed
funds rate. This is the interest rate
to one another in order to meet theirreserve requirements. What the
fed funds rate represented was the
its reserves, and thus new lending.
total balances, the fed funds rate
could be controlled with small
purchases and sales by the Fed.
target fed funds rate very closely and
these small interventions by the Fedwere routine.
Enter the IOER
the authorization to begin paying
interest on excess reserves. With
0.0
0.5
1.0
1.5
2.0
2.5
3.0
1960 1970 1980 1990 2000 2010
T r i l l i o n s o f U . S . D o l l a r s
Total Reserves of Depository Institutions Required Reserves of Depository Institutions
E x c e s s r e s er v e s
Source: The Federal Reserve System
Exhibit 1: Required versus total reserves

7/25/2019 Global Investment Outlook
http://slidepdf.com/reader/full/global-investment-outlook 64/80
62 I TH E GLOBAL INVESTMENT OUTLOOK New Year 2016
Why this time is different | Taylor Self, MBA
arbitrage activities. Other researchconcurs with this assessment that
somewhere within the target range.1
Do you want the price or
the quantity?
The use of RRPs as a policy tool is
not uncontroversial for the Fed. One
issue that arises is the fact that it will
dramatically increase the footprint
of the Fed in short-term funding
directly. Currently, the Fed’s stated
limit for the RRP facility’s size is $300
billion per day. However, considering
the amount of excess reserves in the
system and the degree to which IOER
fed funds upwards, the size of the
RRP facility may need to be much
larger. Indeed, the Fed has indicated
that it will offer unlimited amounts ofRRPs initially.
to the Fed, RRPs are effectively the
asset. Important sources of short-
funds, could gravitate towards
placing their money directly with the
Fed and erode the proper functioning
More than that, the draining of a
large amount of excess liquidity
unintended consequences for other
limited to a perceived tightening
1 Zoltan Pozsar, Credit Suisse
The shadow policy rate – RRP
impact short-term interest rates,
the Fed has had to consider other
tools. Namely, it needs a method to
impose some measure of control on
the fed funds rate, while leaving the
size of its balance sheet unchanged.
to succeed and has thus chosen
to employ is reverse repurchase
agreements (RRPs).
In essence, a RRP boils down to
being able to lend to the Fed, much
a RRP, it removes reserves from the
the size of its balance sheet.
The reason that RRPs will be more
beneath short-term interest rates is
institutions with access to the RRP
facility will be much larger than
those with access to IOER. Indeed,
in the list of counterparties eligible
for RRPs. The expectation is that
the RRP rate will be set below IOER,
most probably by 25 basis points.
move both the IOER and RRP rates
funds will end up somewhere in
between, as it is both pushed
up from below by the RRP facility
being offered directly to short-term
a much larger balance sheet, theFOMC faced the prospect that these
rising reserves would limit its ability
to control the fed funds rate. This
is what the IOER was intended to
address.
Effectively, the IOER rate (currently
held at 0.25%) represents the
to the Fed. Theoretically, this should
set a minimum interest rate in the
have no incentive to lend to other
rate lower than the one they can
Since its implementation, however,
fed funds rate, even as the size of the
Fed’s balance sheet has remained
large. This is due to a variety of
factors, not least of which is that
participate in and depend on the
to the IOER, which is restricted to
High levels of excess liquidity in
limited access to IOER, means that
been both consistently below the
IOER rate set by the Fed, as wellas highly variable. This inability to
control the fed funds rate explains
why the FOMC has changed from
a target level to a target range,
currently set at 0.00% to 0.25%.
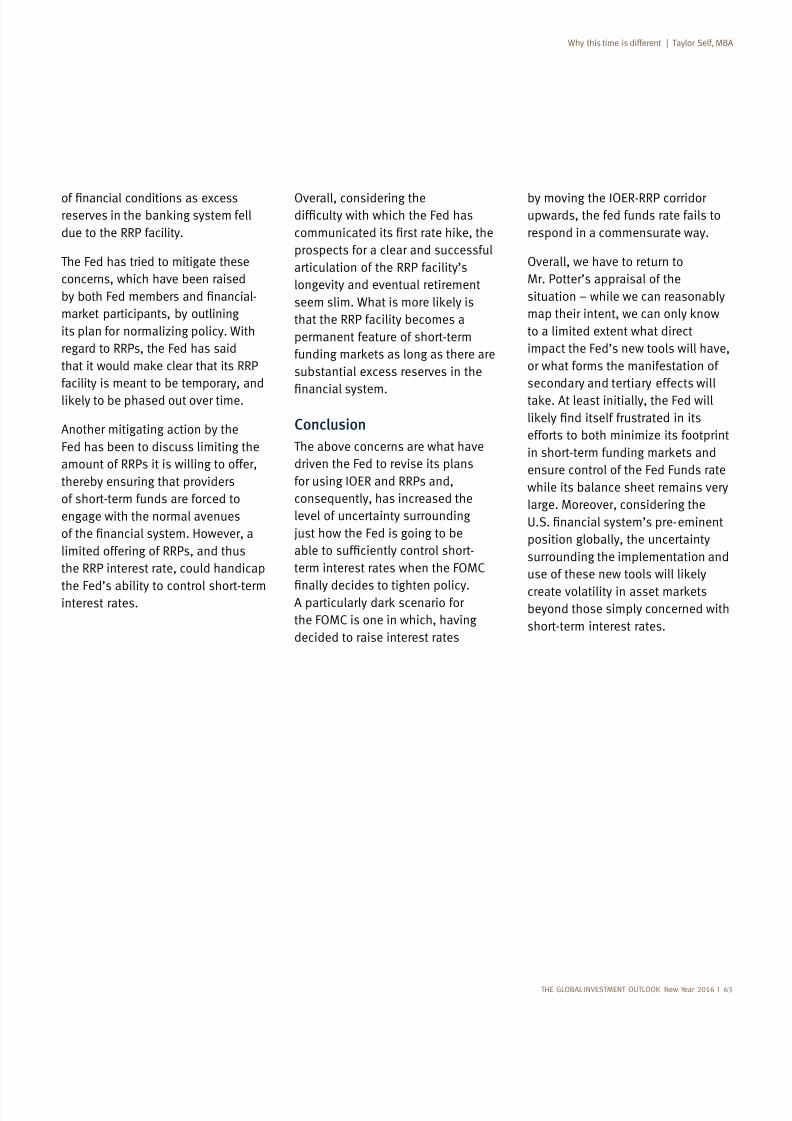
7/25/2019 Global Investment Outlook
http://slidepdf.com/reader/full/global-investment-outlook 65/80
THE GLOBAL INVESTMENT OUTLOOK New Year 2016 I 63
Overall, considering the
prospects for a clear and successful
articulation of the RRP facility’s
longevity and eventual retirement
that the RRP facility becomes a
permanent feature of short-term
substantial excess reserves in the
Conclusion
The above concerns are what have
driven the Fed to revise its plans
for using IOER and RRPs and,
consequently, has increased the
level of uncertainty surrounding
just how the Fed is going to be
term interest rates when the FOMC
the FOMC is one in which, having
decided to raise interest rates
due to the RRP facility.
The Fed has tried to mitigate these
concerns, which have been raised
its plan for normalizing policy. With
regard to RRPs, the Fed has said
facility is meant to be temporary, and
Another mitigating action by the
Fed has been to discuss limiting the
amount of RRPs it is willing to offer,
thereby ensuring that providers
of short-term funds are forced to
engage with the normal avenues
limited offering of RRPs, and thus
the RRP interest rate, could handicap
the Fed’s ability to control short-terminterest rates.
by moving the IOER-RRP corridorupwards, the fed funds rate fails to
respond in a commensurate way.
Overall, we have to return to
Mr. Potter’s appraisal of the
situation – while we can reasonably
to a limited extent what direct
impact the Fed’s new tools will have,
or what forms the manifestation of
secondary and tertiary effects will
efforts to both minimize its footprint
ensure control of the Fed Funds rate
while its balance sheet remains very
large. Moreover, considering the
position globally, the uncertainty
surrounding the implementation and
beyond those simply concerned with
short-term interest rates.
Why this time is different | Taylor Self, MBA
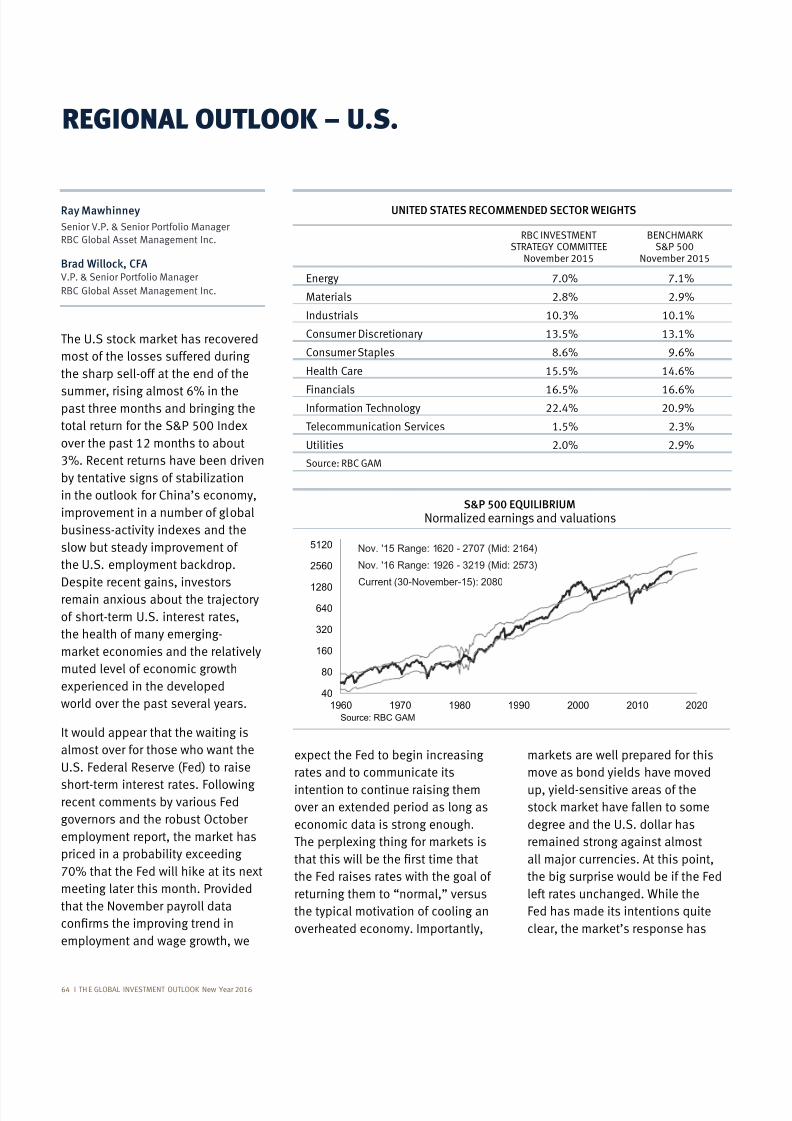
7/25/2019 Global Investment Outlook
http://slidepdf.com/reader/full/global-investment-outlook 66/80
64 I TH E GLOBAL INVESTMENT OUTLOOK New Year 2016
Ray Mawhinney
Senior V.P. & Senior Portfolio Manager
RBC Global Asset Management Inc.
Brad Willock, CFAV.P. & Senior Portfolio Manager
RBC Global Asset Management Inc.
REGIONAL OUTLOOK – U.S.
UNITED STATES RECOMMENDED SECTOR WEIGHTS
RBC INVESTMENTSTRATEGY COMMITTEE
November 2015
BENCHMARKS&P 500
November 2015
Energy 7.0% 7.1%
Materials
Industrials 10.3% 10.1%
13.5% 13.1%
Consumer Staples
Health Care 15.5% 14.6%
Financials 16.5% 16.6%Information Technology 22.4%
Telecommunication Services 1.5% 2.3%
Utilities 2.0%
Source: RBC GAM
most of the losses suffered during
the sharp sell-off at the end of the
summer, rising almost 6% in thepast three months and bringing the
total return for the S&P 500 Index
over the past 12 months to about
3%. Recent returns have been driven
by tentative signs of stabilization
improvement in a number of global
business-activity indexes and the
slow but steady improvement of
remain anxious about the trajectory
of short-term U.S. interest rates,
the health of many emerging-
muted level of economic growth
experienced in the developed
world over the past several years.
It would appear that the waiting is
almost over for those who want the
U.S. Federal Reserve (Fed) to raise
short-term interest rates. Followingrecent comments by various Fed
governors and the robust October
priced in a probability exceeding
meeting later this month. Provided
that the November payroll data
employment and wage growth, we
move as bond yields have moved
up, yield-sensitive areas of the
degree and the U.S. dollar has
remained strong against almost
all major currencies. At this point,
the big surprise would be if the Fed
left rates unchanged. While the
Fed has made its intentions quite
expect the Fed to begin increasing
rates and to communicate its
intention to continue raising themover an extended period as long as
economic data is strong enough.
the Fed raises rates with the goal of
returning them to “normal,” versus
the typical motivation of cooling an
overheated economy. Importantly,
S&P 500 EQUILIBRIUMNormalized earnings and valuations
40
80
160
320
640
1280
2560
5120
1960 1970 1980 1990 2000 2010 2020Source: RBC GAM
Nov. '15 Range: 1620 - 2707 (Mid: 2164)
Nov. '16 Range: 1926 - 3219 (Mid: 2573)
Current (30-November-15): 2080
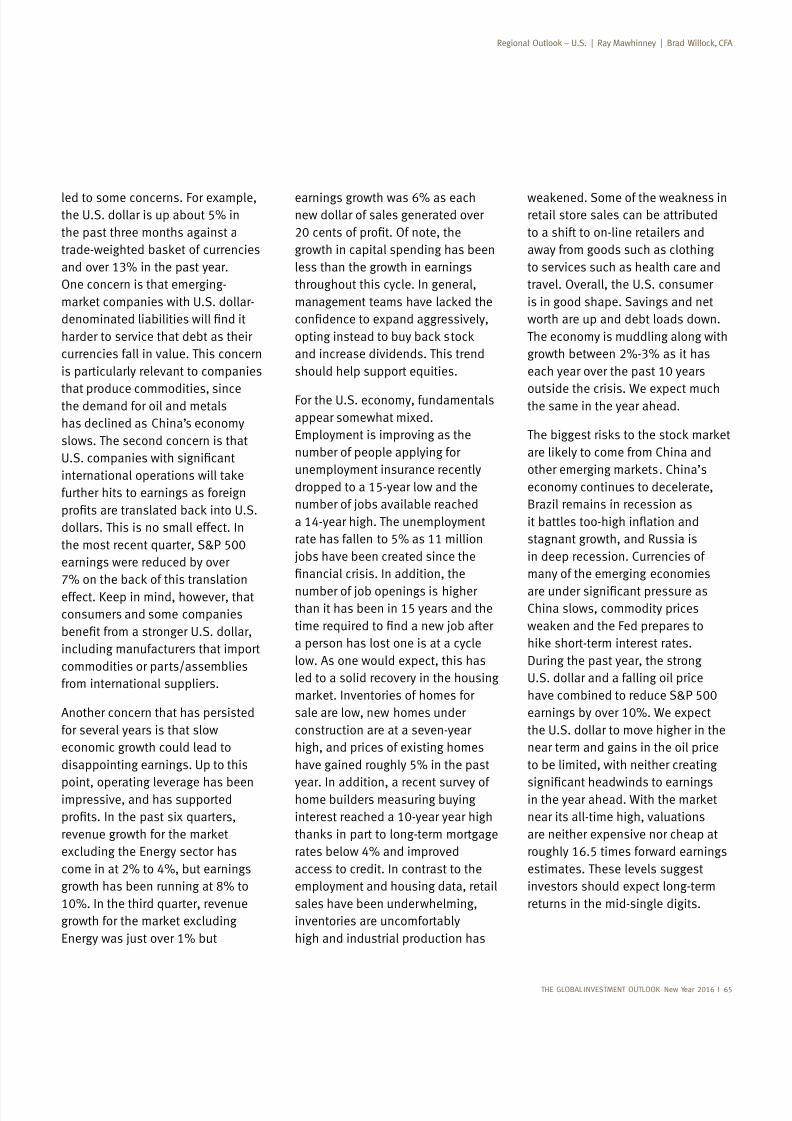
7/25/2019 Global Investment Outlook
http://slidepdf.com/reader/full/global-investment-outlook 67/80
THE GLOBAL INVESTMENT OUTLOOK New Year 2016 I 65
led to some concerns. For example,the U.S. dollar is up about 5% in
the past three months against a
and over 13% in the past year.
One concern is that emerging-
harder to service that debt as their
currencies fall in value. This concern
is particularly relevant to companies
that produce commodities, sincethe demand for oil and metals
has declined as China’s economy
slows. The second concern is that
further hits to earnings as foreign
dollars. This is no small effect. In
the most recent quarter, S&P 500
earnings were reduced by over
effect. Keep in mind, however, that
consumers and some companies
including manufacturers that import
commodities or parts/assemblies
from international suppliers.
Another concern that has persisted
for several years is that slow
economic growth could lead to
disappointing earnings. Up to this
point, operating leverage has beenimpressive, and has supported
excluding the Energy sector has
come in at 2% to 4%, but earnings
10%. In the third quarter, revenue
Energy was just over 1% but
earnings growth was 6% as eachnew dollar of sales generated over
growth in capital spending has been
less than the growth in earnings
throughout this cycle. In general,
and increase dividends. This trend
should help support equities.
For the U.S. economy, fundamentals
appear somewhat mixed.
Employment is improving as the
number of people applying for
unemployment insurance recently
dropped to a 15-year low and the
number of jobs available reached
a 14-year high. The unemployment
rate has fallen to 5% as 11 million
jobs have been created since the
number of job openings is higherthan it has been in 15 years and the
a person has lost one is at a cycle
low. As one would expect, this has
led to a solid recovery in the housing
sale are low, new homes under
construction are at a seven-year
high, and prices of existing homes
have gained roughly 5% in the past
year. In addition, a recent survey ofhome builders measuring buying
interest reached a 10-year year high
rates below 4% and improved
access to credit. In contrast to the
employment and housing data, retail
sales have been underwhelming,
inventories are uncomfortably
high and industrial production has
retail store sales can be attributed
to a shift to on-line retailers and
away from goods such as clothing
to services such as health care and
travel. Overall, the U.S. consumer
is in good shape. Savings and net
worth are up and debt loads down.
The economy is muddling along with
growth between 2%-3% as it has
each year over the past 10 years
outside the crisis. We expect muchthe same in the year ahead.
economy continues to decelerate,
Brazil remains in recession as
stagnant growth, and Russia is
in deep recession. Currencies of
many of the emerging economies
China slows, commodity prices
U.S. dollar and a falling oil price
have combined to reduce S&P 500
earnings by over 10%. We expect
the U.S. dollar to move higher in the
near term and gains in the oil price
to be limited, with neither creating
near its all-time high, valuations
are neither expensive nor cheap at
roughly 16.5 times forward earnings
estimates. These levels suggest
investors should expect long-term
returns in the mid-single digits.
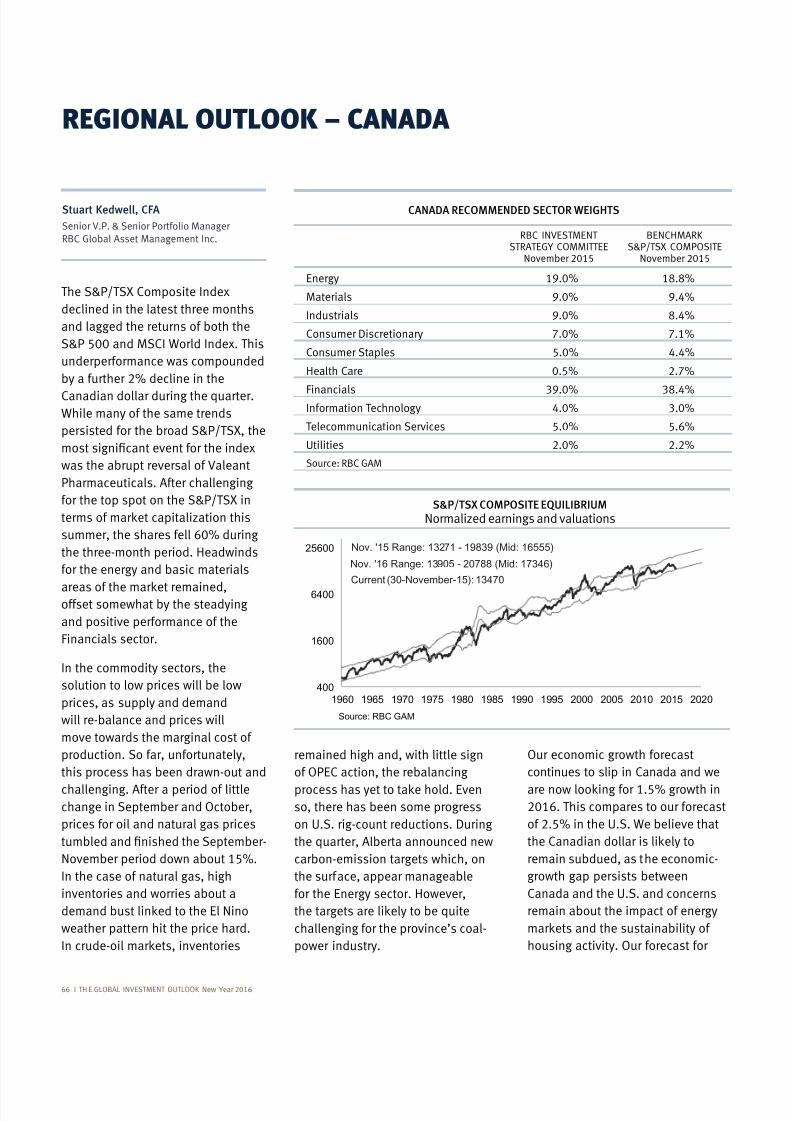
7/25/2019 Global Investment Outlook
http://slidepdf.com/reader/full/global-investment-outlook 68/80
66 I TH E GLOBAL INVESTMENT OUTLOOK New Year 2016
The S&P/TSX Composite Index
declined in the latest three months
and lagged the returns of both the
S&P 500 and MSCI World Index. This
underperformance was compounded
by a further 2% decline in the
Canadian dollar during the quarter.While many of the same trends
persisted for the broad S&P/TSX, the
was the abrupt reversal of Valeant
Pharmaceuticals. After challenging
for the top spot on the S&P/TSX in
summer, the shares fell 60% during
the three-month period. Headwinds
for the energy and basic materials
offset somewhat by the steadying
and positive performance of the
Financials sector.
In the commodity sectors, the
solution to low prices will be low
prices, as supply and demand
will re-balance and prices will
move towards the marginal cost of
production. So far, unfortunately,
this process has been drawn-out and
challenging. After a period of littlechange in September and October,
prices for oil and natural gas prices
November period down about 15%.
In the case of natural gas, high
inventories and worries about a
weather pattern hit the price hard.
Stuart Kedwell, CFA
Senior V.P. & Senior Portfolio ManagerRBC Global Asset Management Inc.
CANADA RECOMMENDED SECTOR WEIGHTS
RBC INVESTMENTSTRATEGY COMMITTEE
November 2015
BENCHMARKS&P/TSX COMPOSITE
November 2015
Energy
Materials
Industrials
7.0% 7.1%
Consumer Staples 5.0% 4.4%
Health Care 0.5% 2.7%
Financials Information Technology 4.0% 3.0%
Telecommunication Services 5.0% 5.6%
Utilities 2.0% 2.2%
Source: RBC GAM
REGIONAL OUTLOOK – CANADA
Our economic growth forecast
continues to slip in Canada and we
2016. This compares to our forecast
of 2.5% in the U.S. We believe that
remain subdued, as the economic-
growth gap persists between
Canada and the U.S. and concerns
remain about the impact of energy
housing activity. Our forecast for
remained high and, with little sign
of OPEC action, the rebalancing
so, there has been some progress
the quarter, Alberta announced new
carbon-emission targets which, on
the surface, appear manageable
for the Energy sector. However,
challenging for the province’s coal-
power industry.
S&P/TSX COMPOSITE EQUILIBRIUMNormalized earnings and valuations
400
1600
6400
25600
1960 1965 1970 1975 1980 1985 1990 1995 2000 2005 2010 2015 2020
Source: RBC GAM
Nov. '15 Range: 13271 - 19839 (Mid: 16555)
Nov. '16 Range: 13905 - 20788 (Mid: 17346)
Current (30-November-15): 13470
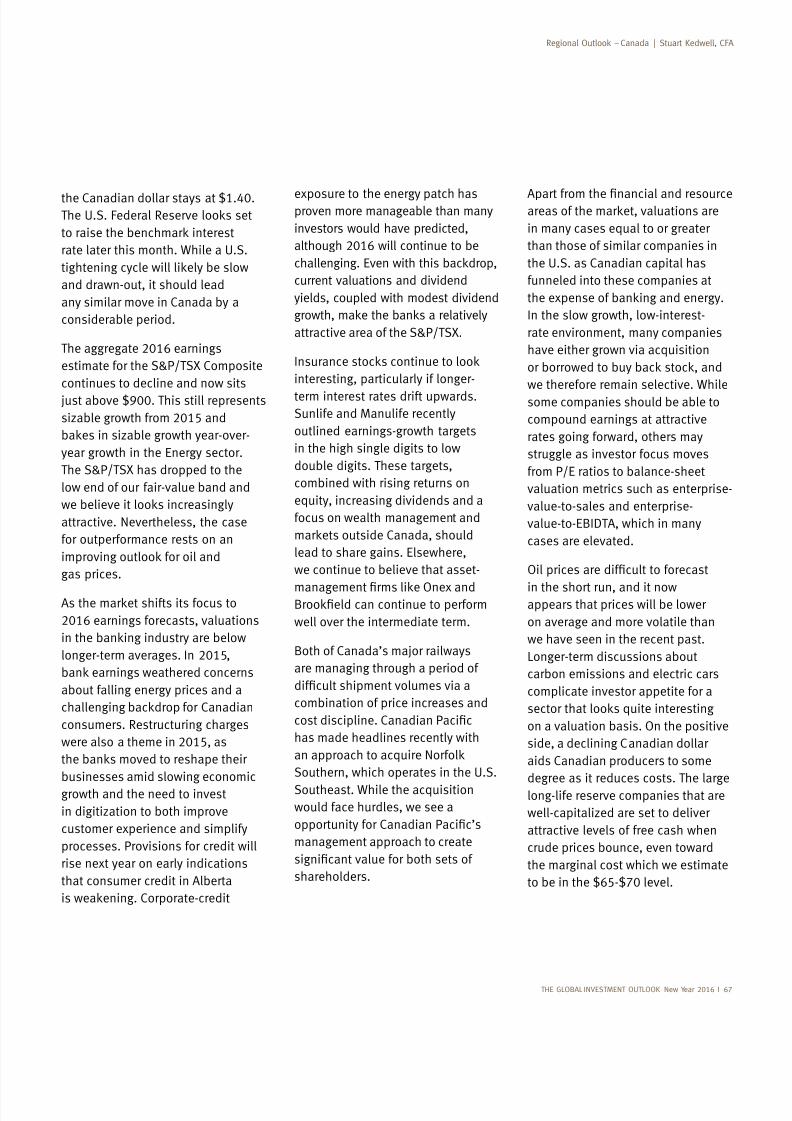
7/25/2019 Global Investment Outlook
http://slidepdf.com/reader/full/global-investment-outlook 69/80
THE GLOBAL INVESTMENT OUTLOOK New Year 2016 I 67
the Canadian dollar stays at $1.40.
rate later this month. While a U.S.
and drawn-out, it should lead
any similar move in Canada by a
considerable period.
The aggregate 2016 earnings
estimate for the S&P/TSX Composite
continues to decline and now sits
sizable growth from 2015 and
year growth in the Energy sector.
The S&P/TSX has dropped to the
low end of our fair-value band and
attractive. Nevertheless, the case
for outperformance rests on an
gas prices.
2016 earnings forecasts, valuations
longer-term averages. In 2015,
about falling energy prices and a
consumers. Restructuring charges
were also a theme in 2015, as
businesses amid slowing economic
growth and the need to invest
in digitization to both improve
customer experience and simplify
processes. Provisions for credit will
rise next year on early indications
that consumer credit in Alberta
exposure to the energy patch hasproven more manageable than many
investors would have predicted,
although 2016 will continue to be
current valuations and dividend
yields, coupled with modest dividend
attractive area of the S&P/TSX.
interesting, particularly if longer-
term interest rates drift upwards.Sunlife and Manulife recently
outlined earnings-growth targets
in the high single digits to low
double digits. These targets,
combined with rising returns on
equity, increasing dividends and a
focus on wealth management and
lead to share gains. Elsewhere,
we continue to believe that asset-
well over the intermediate term.
Both of Canada’s major railways
are managing through a period of
combination of price increases and
has made headlines recently with
Southern, which operates in the U.S.
Southeast. While the acquisitionwould face hurdles, we see a
management approach to create
shareholders.
in many cases equal to or greater
than those of similar companies in
the U.S. as Canadian capital has
funneled into these companies at
In the slow growth, low-interest-
rate environment, many companies
have either grown via acquisition
we therefore remain selective. While
some companies should be able to
compound earnings at attractive
rates going forward, others may
struggle as investor focus moves
from P/E ratios to balance-sheet
valuation metrics such as enterprise-
value-to-sales and enterprise-
cases are elevated.
in the short run, and it nowappears that prices will be lower
on average and more volatile than
we have seen in the recent past.
Longer-term discussions about
carbon emissions and electric cars
complicate investor appetite for a
on a valuation basis. On the positive
side, a declining Canadian dollar
aids Canadian producers to some
degree as it reduces costs. The large
long-life reserve companies that are
well-capitalized are set to deliver
attractive levels of free cash when
crude prices bounce, even toward
the marginal cost which we estimate
to be in the $65-$70 level.
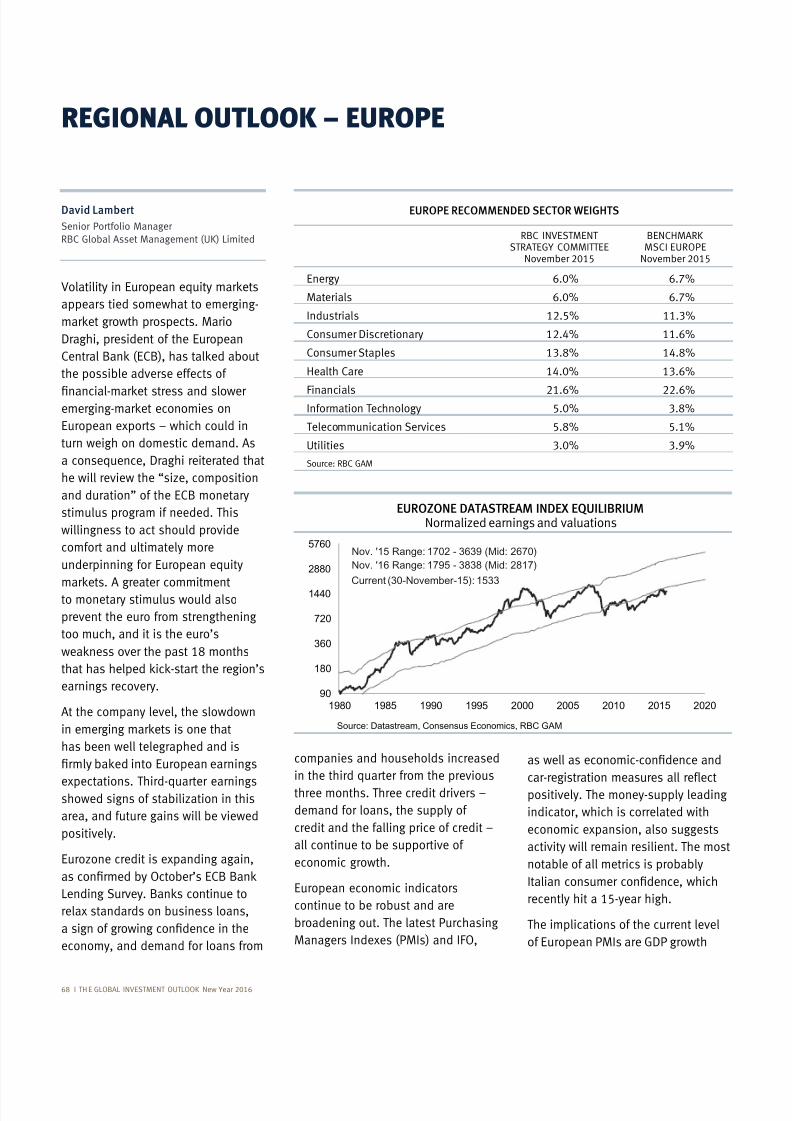
7/25/2019 Global Investment Outlook
http://slidepdf.com/reader/full/global-investment-outlook 70/80
New Year 2016
EUROPE RECOMMENDED SECTOR WEIGHTS
RBC INVESTMENTSTRATEGY COMMITTEE
November 2015
BENCHMARKMSCI EUROPE
November 2015
Energy 6.0% 6.7%
Materials 6.0% 6.7%
Industrials 12.5% 11.3%
12.4% 11.6%
Consumer Staples
Health Care 14.0% 13.6%
Financials 21.6% 22.6%Information Technology 5.0%
Telecommunication Services 5.1%
Utilities 3.0%
Source: RBC GAM
EUROZONE DATASTREAM INDEX EQUILIBRIUMNormalized earnings and valuations
90
180
360
720
1440
2880
5760
1980 1985 1990 1995 2000 2005 2010 2015 2020
Source: Datastream, Consensus Economics, RBC GAM
Nov. '15 Range: 1702 - 3639 (Mid: 2670)
Nov. '16 Range: 1795 - 3838 (Mid: 2817)
Current (30-November-15): 1533
positively. The money-supply leading
indicator, which is correlated with
economic expansion, also suggests
activity will remain resilient. The most
notable of all metrics is probably
recently hit a 15-year high.
The implications of the current level
REGIONAL OUTLOOK – EUROPE
appears tied somewhat to emerging-
the possible adverse effects of
European exports – which could in
turn weigh on domestic demand. As
he will review the “size, composition
and duration” of the ECB monetary
stimulus program if needed. This
willingness to act should provide
comfort and ultimately more
underpinning for European equity
to monetary stimulus would also
prevent the euro from strengthening
too much, and it is the euro’s
earnings recovery.
At the company level, the slowdown
has been well telegraphed and is
expectations. Third-quarter earningsshowed signs of stabilization in this
area, and future gains will be viewed
positively.
Eurozone credit is expanding again,
relax standards on business loans,
economy, and demand for loans from
companies and households increased
in the third quarter from the previous
three months. Three credit drivers –
demand for loans, the supply of
credit and the falling price of credit –
all continue to be supportive of
economic growth.
European economic indicators
continue to be robust and are
broadening out. The latest Purchasing
Managers Indexes (PMIs) and IFO,
David Lambert
Senior Portfolio Manager
RBC Global Asset Management (UK) Limited
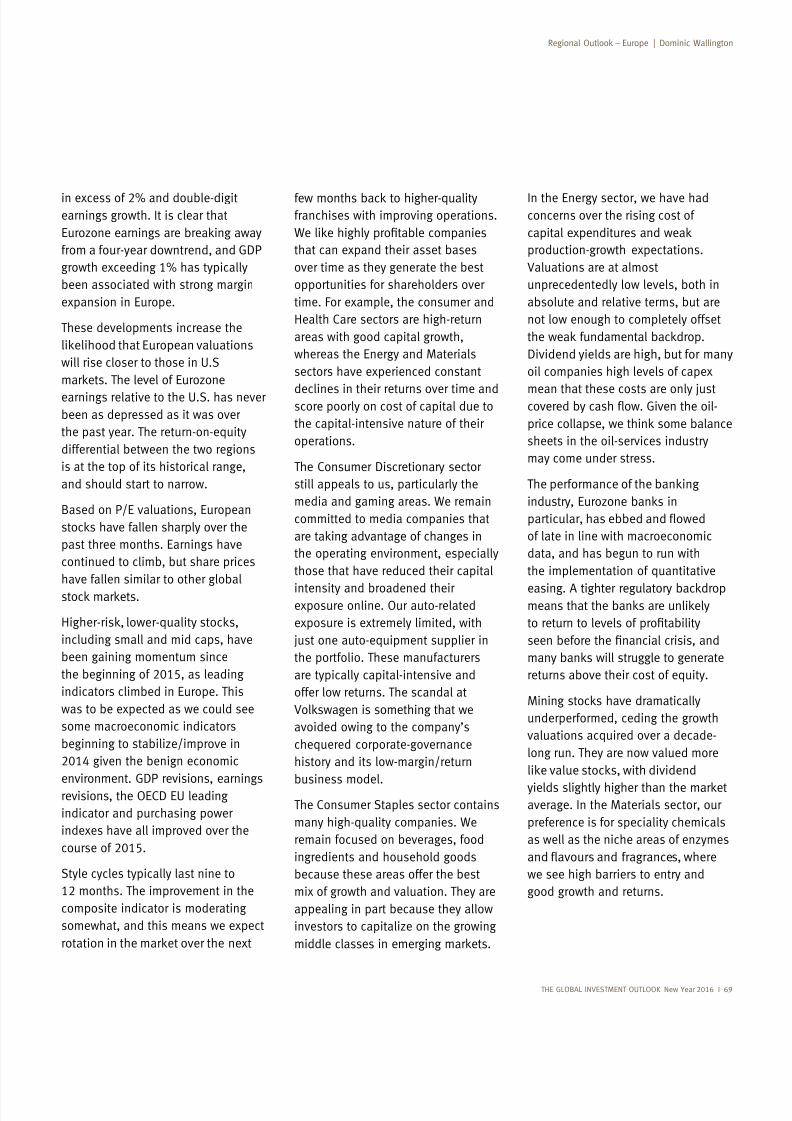
7/25/2019 Global Investment Outlook
http://slidepdf.com/reader/full/global-investment-outlook 71/80
THE GLOBAL INVESTMENT OUTLOOK New Year 2016
in excess of 2% and double-digitearnings growth. It is clear that
growth exceeding 1% has typically
been associated with strong margin
expansion in Europe.
These developments increase the
will rise closer to those in U.S
earnings relative to the U.S. has never
been as depressed as it was over
the past year. The return-on-equity
differential between the two regions
is at the top of its historical range,
and should start to narrow.
Based on P/E valuations, European
past three months. Earnings have
continued to climb, but share prices
have fallen similar to other global
including small and mid caps, have
been gaining momentum since
the beginning of 2015, as leading
indicators climbed in Europe. This
was to be expected as we could see
some macroeconomic indicators
beginning to stabilize/improve in
2014 given the benign economic
indicator and purchasing power
indexes have all improved over the
course of 2015.
Style cycles typically last nine to
12 months. The improvement in the
composite indicator is moderating
somewhat, and this means we expect
franchises with improving operations.
that can expand their asset bases
over time as they generate the best
opportunities for shareholders over
time. For example, the consumer and
Health Care sectors are high-return
areas with good capital growth,
whereas the Energy and Materials
sectors have experienced constant
declines in their returns over time andscore poorly on cost of capital due to
the capital-intensive nature of their
operations.
still appeals to us, particularly the
media and gaming areas. We remain
committed to media companies that
the operating environment, especially
those that have reduced their capital
intensity and broadened theirexposure online. Our auto-related
exposure is extremely limited, with
just one auto-equipment supplier in
the portfolio. These manufacturers
are typically capital-intensive and
offer low returns. The scandal at
avoided owing to the company’s
chequered corporate-governance
history and its low-margin/return
business model.The Consumer Staples sector contains
many high-quality companies. We
remain focused on beverages, food
ingredients and household goods
because these areas offer the best
mix of growth and valuation. They are
appealing in part because they allow
investors to capitalize on the growing
In the Energy sector, we have hadconcerns over the rising cost of
production-growth expectations.
Valuations are at almost
unprecedentedly low levels, both in
absolute and relative terms, but are
not low enough to completely offset
oil companies high levels of capex
mean that these costs are only just
sheets in the oil-services industry
may come under stress.
of late in line with macroeconomic
data, and has begun to run with
the implementation of quantitative
returns above their cost of equity.
underperformed, ceding the growth
valuations acquired over a decade-
long run. They are now valued more
average. In the Materials sector, our
preference is for speciality chemicals
as well as the niche areas of enzymes
we see high barriers to entry and
good growth and returns.
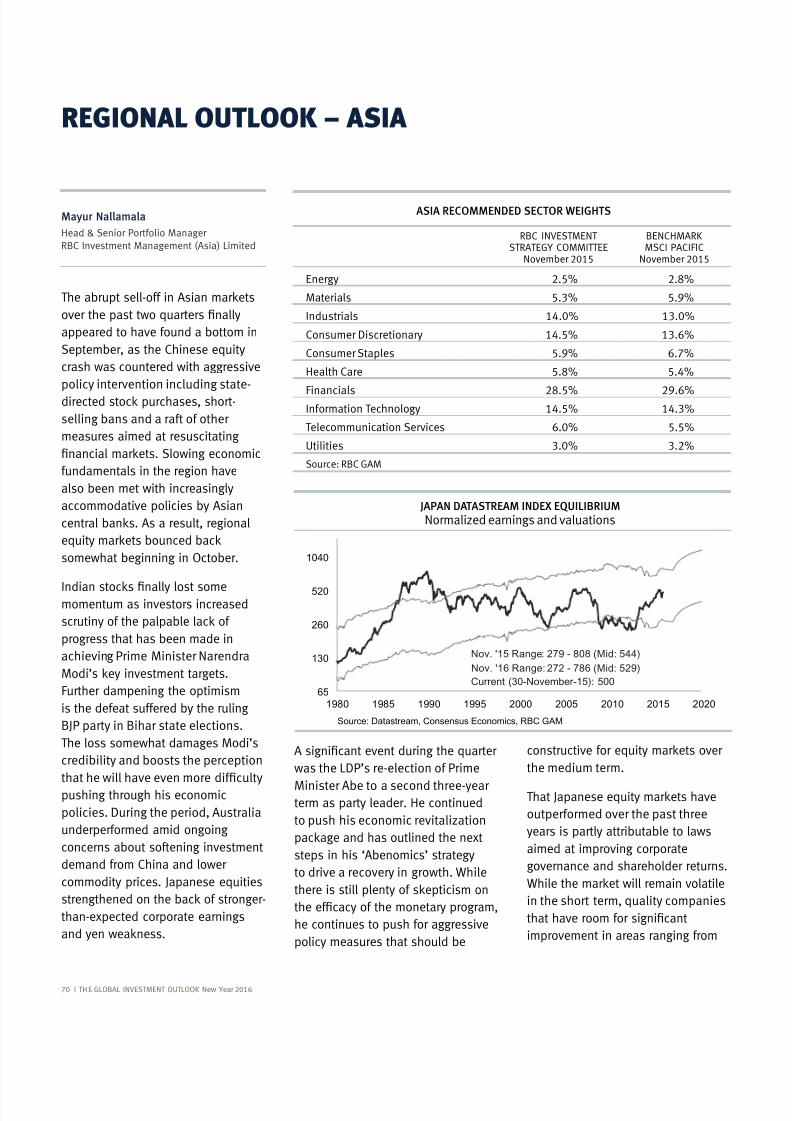
7/25/2019 Global Investment Outlook
http://slidepdf.com/reader/full/global-investment-outlook 72/80
70 I TH E GLOBAL INVESTMENT OUTLOOK New Year 2016
REGIONAL OUTLOOK – ASIA
appeared to have found a bottom in
September, as the Chinese equity
crash was countered with aggressive
policy intervention including state-
selling bans and a raft of other
measures aimed at resuscitating
fundamentals in the region have
also been met with increasingly
accommodative policies by Asian
somewhat beginning in October.
momentum as investors increased
progress that has been made in
achieving Prime Minister Narendra
Further dampening the optimism
is the defeat suffered by the ruling
BJP party in Bihar state elections.
The loss somewhat damages Modi’s
credibility and boosts the perception
pushing through his economic
underperformed amid ongoing
concerns about softening investment
demand from China and lower
commodity prices. Japanese equities
than-expected corporate earnings
ASIA RECOMMENDED SECTOR WEIGHTS
RBC INVESTMENTSTRATEGY COMMITTEE
November 2015
BENCHMARKMSCI PACIFIC
November 2015
Energy 2.5%
Materials 5.3%
Industrials 14.0% 13.0%
14.5% 13.6%
Consumer Staples 6.7%
Health Care 5.4%
Financials Information Technology 14.5% 14.3%
Telecommunication Services 6.0% 5.5%
Utilities 3.0% 3.2%
Source: RBC GAM
Mayur Nallamala
Head & Senior Portfolio ManagerRBC Investment Management (Asia) Limited
JAPAN DATASTREAM INDEX EQUILIBRIUMNormalized earnings and valuations
65
130
260
520
1040
1980 1985 1990 1995 2000 2005 2010 2015 2020
Source: Datastream, Consensus Economics, RBC GAM
Nov. '15 Range: 279 - 808 (Mid: 544)
Nov. '16 Range: 272 - 786 (Mid: 529)
Current (30-November-15): 500
Minister Abe to a second three-yearterm as party leader. He continued
to push his economic revitalization
to drive a recovery in growth. While
he continues to push for aggressive
policy measures that should be
the medium term.
outperformed over the past three
years is partly attributable to laws
aimed at improving corporate
governance and shareholder returns.
in the short term, quality companies
improvement in areas ranging from
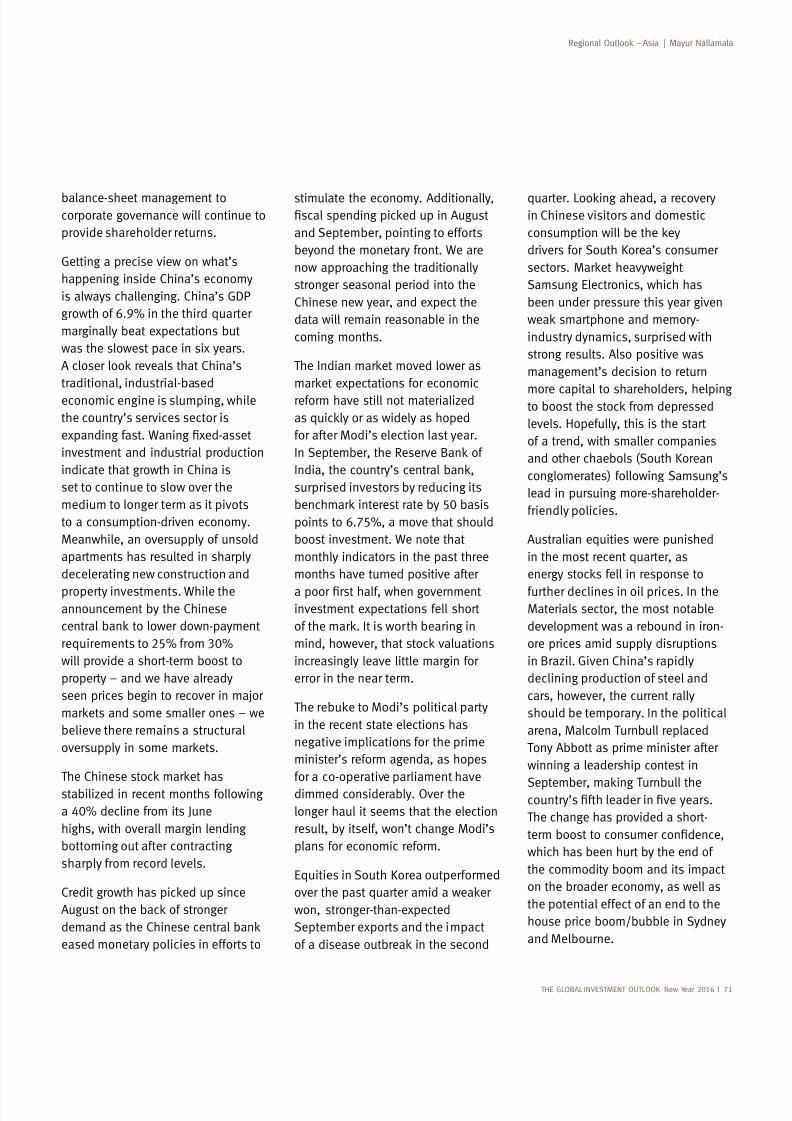
7/25/2019 Global Investment Outlook
http://slidepdf.com/reader/full/global-investment-outlook 73/80
THE GLOBAL INVESTMENT OUTLOOK New Year 2016 I 71
balance-sheet management tocorporate governance will continue to
provide shareholder returns.
Getting a precise view on what’s
happening inside China’s economy
marginally beat expectations but
was the slowest pace in six years.
traditional, industrial-based
economic engine is slumping, while
the country’s services sector is
investment and industrial production
indicate that growth in China is
set to continue to slow over the
medium to longer term as it pivots
to a consumption-driven economy.
Meanwhile, an oversupply of unsold
apartments has resulted in sharply
decelerating new construction and
property investments. While theannouncement by the Chinese
requirements to 25% from 30%
will provide a short-term boost to
property – and we have already
seen prices begin to recover in major
believe there remains a structural
stabilized in recent months following
a 40% decline from its June
highs, with overall margin lending
bottoming out after contracting
sharply from record levels.
eased monetary policies in efforts to
stimulate the economy. Additionally,
and September, pointing to efforts
beyond the monetary front. We are
now approaching the traditionally
stronger seasonal period into the
Chinese new year, and expect the
data will remain reasonable in the
coming months.
reform have still not materialized
for after Modi’s election last year.
surprised investors by reducing its
points to 6.75%, a move that should
boost investment. We note that
monthly indicators in the past three
months have turned positive after
investment expectations fell short
increasingly leave little margin for
error in the near term.
in the recent state elections has
negative implications for the prime
minister’s reform agenda, as hopes
for a co-operative parliament have
dimmed considerably. Over the
longer haul it seems that the election
result, by itself, won’t change Modi’s
plans for economic reform.
Equities in South Korea outperformed
won, stronger-than-expected
September exports and the impact
in Chinese visitors and domestic
drivers for South Korea’s consumer
Samsung Electronics, which has
been under pressure this year given
industry dynamics, surprised with
strong results. Also positive was
management’s decision to return
more capital to shareholders, helping
levels. Hopefully, this is the start
of a trend, with smaller companies
and other chaebols (South Korean
conglomerates) following Samsung’s
lead in pursuing more-shareholder-
friendly policies.
Australian equities were punished
in the most recent quarter, as
further declines in oil prices. In theMaterials sector, the most notable
development was a rebound in iron-
ore prices amid supply disruptions
in Brazil. Given China’s rapidly
declining production of steel and
cars, however, the current rally
should be temporary. In the political
arena, Malcolm Turnbull replaced
Tony Abbott as prime minister after
winning a leadership contest in
The change has provided a short-
which has been hurt by the end of
the commodity boom and its impact
on the broader economy, as well as
the potential effect of an end to the
house price boom/bubble in Sydney
and Melbourne.
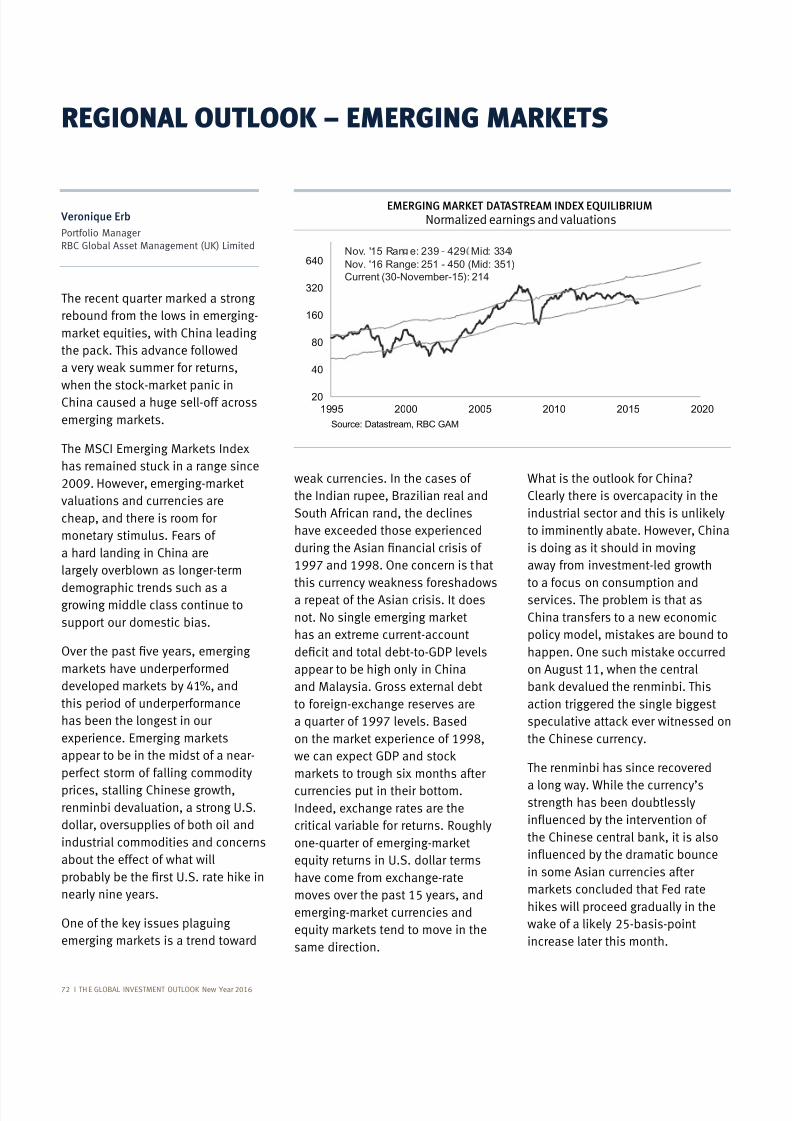
7/25/2019 Global Investment Outlook
http://slidepdf.com/reader/full/global-investment-outlook 74/80
72 I TH E GLOBAL INVESTMENT OUTLOOK New Year 2016
REGIONAL OUTLOOK – EMERGING MARKETS
Clearly there is overcapacity in the
to imminently abate. However, China
is doing as it should in moving
away from investment-led growth
to a focus on consumption andservices. The problem is that as
China transfers to a new economic
on August 11, when the central
action triggered the single biggest
the Chinese currency.
The renminbi has since recovered
a long way. While the currency’sstrength has been doubtlessly
in some Asian currencies after
increase later this month.
rebound from the lows in emerging-
China caused a huge sell-off across
valuations and currencies are
cheap, and there is room for
monetary stimulus. Fears of
a hard landing in China are
largely overblown as longer-term
demographic trends such as agrowing middle class continue to
support our domestic bias.
this period of underperformance
has been the longest in our
appear to be in the midst of a near-
perfect storm of falling commodity
prices, stalling Chinese growth,renminbi devaluation, a strong U.S.
dollar, oversupplies of both oil and
industrial commodities and concerns
about the effect of what will
nearly nine years.
the Indian rupee, Brazilian real and
South African rand, the declines
have exceeded those experienced
a repeat of the Asian crisis. It does
has an extreme current-account
appear to be high only in China
and Malaysia. Gross external debt
to foreign-exchange reserves are
currencies put in their bottom.
Indeed, exchange rates are the
critical variable for returns. Roughly
equity returns in U.S. dollar terms
have come from exchange-rate
moves over the past 15 years, and
same direction.
EMERGING MARKET DATASTREAM INDEX EQUILIBRIUMNormalized earnings and valuations
20
40
80
160
320
640
1995 2000 2005 2010 2015 2020
Source: Datastream, RBC GAM
Nov. '15 Ran e: 239 - 429 Mid: 334
Nov. '16 Range: 251 - 450 (Mid: 351)
Current (30-November-15): 214
Veronique Erb
Portfolio ManagerRBC Global Asset Management (UK) Limited

7/25/2019 Global Investment Outlook
http://slidepdf.com/reader/full/global-investment-outlook 75/80
THE GLOBAL INVESTMENT OUTLOOK New Year 2016 I 73
For the renminbi, however, thereduced speculative pressures
on the Chinese currency are also
decelerated in September after
foreign-exchange reserves fell
by US$43.3 billion in September,
billion decline in August. The fact
September is somewhat encouraging
since it suggests that Beijing
has gained some control over
Besides currency effects, one
increasingly important change in
China’s economy is the growth in
the services sector. China is now the
world’s third-largest service economy
after the U.S. and the Eurozone, and
services became the largest sectorof the Chinese economy in 2012.
The services sector has expanded
at a compound annual growth rate
of 17% over the past decade –
faster than the manufacturing and
agriculture sectors.
According to the third-quarter
account for more than 50% of the
Chinese economy. It appears to us
that the old measures of capital-
and manufacturing PMIs – are now
progress.
We note that services and
consumption have supplanted
investment sectors as the two
This is important as the services
sector is the single biggest creator
of jobs in China and has been the
largest collective employer since
2011. Tourism is a bright spot,
creating a multiplier effect on wealth
elsewhere in Asia. It is widely
tourism. China’s new economic
model is characterized by robust
passengers and civil aviation.
As China’s economy shifts towards
services from manufacturing
and consumption, the country’s
consumption data is changing.
Rising incomes mean that purchases
of basic goods such as food
and clothing become a smaller
part of household budgets, with
marginal disposable income being
spent on services. Therefore, we
expect health care, education,
entertainment, transportation and
telecommunication services to be the
major growth drivers of consumption.
devices nearly doubled and the
number of high-speed-rail passenger
passes sold rose 10%, while freight-
rail numbers were down 11%.
This highlights the increasingly
consumption-led nature of the
economy and the fact that positive
economic conditions on the ground
are increasingly divorced from the
of room for monetary stimulus. Many
rates of growth so there is room
to cut interest rates. China and
India have both cut rates in recent
months.
The quality of growth is also
move away from commodities and
toward consumption. Consumption
now represents a greater share of
resources, and we expect the shift
to continue. The shift away from the
investment-led model is negative for
the Materials sector worldwide.

7/25/2019 Global Investment Outlook
http://slidepdf.com/reader/full/global-investment-outlook 76/80
74 I TH E GLOBAL INVESTMENT OUTLOOK New Year 2016
Daniel E. Chornous, CFA
Chief Investment OfficerRBC Global Asset Management
Chair, RBC Investment Strategy Committee
Dan Chornous is Chief Investment Officer of RBC Global Asset Management Inc., which has total assets under management of $380 billion. Mr. Chornous isresponsible for the overall direction of investment policy and fund management. In addition, he chairs the RBC Investment Strategy Committee, the group responsiblefor global asset-mix recommendations and global-fixed income and equity portfolio construction for use in RBC Wealth Management’s key client groups includingretail mutual funds, International Wealth Management, RBC Dominion Securities Inc. and RBC Phillips, Hager & North Investment Counsel Inc. He also serves on theBoard of Directors of the Canadian Coalition for Good Governance and is Chair of its Public Policy Committee. Prior to joining RBC Asset Management in November2002, Mr. Chornous was Managing Director, Capital Markets Research and Chief Investment Strategist at RBC Capital Markets. In that role, he was responsible for
developing the firm’s outlook for global and domestic economies and capital markets as well as managing the firm’s global economics, technical and quantitativeresearch teams.
Stephen is a fixed-income portfolio manager and Head of the QuantitativeResearch Group, the internal team that develops quantitative researchsolutions for investment decision-making throughout the firm. He is also
a member of the PH&N IM Asset Mix Committee. Stephen joined Phillips,Hager & North Investment Management in 2002. The first six years of hiscareer were spent at an investment-counselling firm where he quickly rose tobecome a partner and fixed-income portfolio manager. He then took two yearsaway from the industry to begin his Ph.D. in Finance and completed it overanother three years while serving as a fixed-income portfolio manager for amutual-fund company. Stephen became a CFA charterholder in 1994.
As Head of Global Fixed Income & Currencies at RBC Global AssetManagement, Dagmara oversees 15 investment professionals in Torontoand London, with more than $40 billion in assets under management. In
her duties as a portfolio manager, Dagmara looks after foreign-exchangehedging and active currency-management programs for fixed-income andequity funds, and co-manages several of the firm's bond portfolios. Dagmarachairs the RBC Fixed Income & Currencies Committee. She is also a memberof the RBC Investment Policy Committee, which determines the asset mix forRBC balanced products, and the RBC Investment Strategy Committee, whichestablishes global strategy for the firm.
Members
RBC INVESTMENT STRATEGY COMMITTEE
Stu began his career with RBC Dominion Securities in the firm’s Generalistprogram and completed rotations in the Fixed Income, Equity Research,Corporate Finance and Private Client divisions. Following this program, hejoined the RBC Investments Portfolio Advisory Group and was a member of theRBC DS Strategy and Stock Selection committees. He later joined RBC GlobalAsset Management as a senior portfolio manager and now manages the RBCCanadian Dividend Fund, RBC North American Value Fund and a number ofother mandates. He is co-head of RBC Global Asset Management’s CanadianEquity Team.
Eric is the Chief Economist for RBC Global Asset Management Inc. (RBC GAM)and is responsible for maintaining the firm’s global economic forecast andgenerating macroeconomic research. He is also a member of the InvestmentStrategy Committee, the group responsible for the firm’s global asset-mixrecommendations. Eric is a frequent media commentator and makes regularpresentations both within and outside RBC GAM. Prior to joining RBC GAM inearly 2011, Eric spent six years at a large Canadian securities firm, the lastfour as the Chief Economics and Rates Strategist. His previous experienceincludes positions as economist at a large Canadian bank and researcheconomist for a federal government agency.
Dagmara Fijalkowski, MBA, CFA
Head, Global Fixed Income & Currencies(Toronto and London)RBC Global Asset Management
Eric Lascelles
Chief Economist
RBC Global Asset Management
Stephen Burke, PhD, CFA
Vice President and Portfolio ManagerRBC Global Asset Management
Stuart Kedwell, CFA
Senior Vice President and Senior Portfolio Manager
RBC Global Asset Management

7/25/2019 Global Investment Outlook
http://slidepdf.com/reader/full/global-investment-outlook 77/80
THE GLOBAL INVESTMENT OUTLOOK New Year 2016 I 75
RBC Global Asset Management
Sarah Riopelle, CFA
Vice President andSenior Portfolio ManagerRBC Global Asset Management
Martin Paleczny, who has been in the investment industry since 1994, beganhis career at Royal Bank Investment Management, where he developed anexpertise in derivatives management and created a policy and process for the
products. He also specializes in technical analysis and uses this backgroundto implement derivatives and hedging strategies for equity, fixed-income,currency and commodity-related funds. Since becoming a portfolio manager,Martin has focused on global allocation strategies for the full range of assets,with an emphasis on using futures, forwards and options. He serves as advisorfor technical analysis to the RBC Investment Strategy Committee.
Since 2009, Sarah has managed the entire suite of RBC Portfolio Solutions,including the RBC Select Portfolios, RBC Select Choices Portfolios, RBC TargetEducation Funds and RBC Managed Payout Solutions. Sarah is a member of
the RBC Investment Strategy Committee, which sets global strategy for thefirm, and the RBC Investment Policy Committee, which is responsible for theinvestment strategy and tactical asset allocation for RBC Funds’ balancedproducts and portfolio solutions. In addition to her fund management role,she works closely with the firm’s Chief Investment Officer on a variety ofprojects, as well as co-manages the Global Equity Analyst team.
Martin Paleczny, CFA
Vice President andSenior Portfolio ManagerRBC Global Asset Management
William E. (Bill) Tilford
RBC Global Asset ManagementBill is Head, Quantitative Investments, at RBC Global Asset Management andis responsible for expanding the firm’s quantitative-investment capabilities.Prior to joining RBC GAM in 2011, Bill was Vice President and Head ofGlobal Corporate Securities at a federal Crown corporation and a member ofits investment committee. His responsibilities included security-selectionprograms in global equities and corporate debt that integrated fundamentaland quantitative disciplines, as well as management of one of the world’slargest market neutral/overlay portfolios. Previously, Bill spent 12 years witha large Canadian asset manager, where he was the partner who helped builda quantitative-investment team that ran core, style-tilted and alternativeCanadian / U.S. funds. Bill has been in the investment industry since 1986.
Ray Mawhinney
Senior Vice President andSenior Portfolio ManagerRBC Global Asset Management
Hanif Mamdani is Head of both Corporate Bond Investments and AlternativeInvestments. He is responsible for the portfolio strategy and trading executionof all investment-grade and high-yield corporate bonds. Hanif is Lead Managerof the PH&N High Yield Bond Fund and the PH&N Absolute Return Fund (amulti-strategy hedge fund). He is also a member of the Asset Mix Committee.Prior to joining the firm in 1998, he spent 10 years in New York with two globalinvestment banks working in a variety of roles in Corporate Finance, Capital
Markets and Proprietary Trading. Hanif holds a master's degree from HarvardUniversity and a bachelor's degree from the California Institute of Technology(Caltech).
Ray leads the U.S. Equity team in Toronto and brings a wealth of expertise tohis role, having specialized in U.S. equities since 1984. He joined the firm in1992 and is involved in managing several of the firm's U.S. equity funds. Rayis also a member of the RBC Investment Policy Committee, which determinesasset mix for balanced products, and the RBC Investment Strategy Committee,which establishes a global asset mix covering mutual funds, as well asportfolios for institutions and high-net-worth private clients. Ray graduated
from the University of Manitoba with a bachelor's of commerce degree infinance, with honours.
Hanif Mamdani
Head of Alternative InvestmentsRBC Global Asset Management

7/25/2019 Global Investment Outlook
http://slidepdf.com/reader/full/global-investment-outlook 78/80
76 I TH E GLOBAL INVESTMENT OUTLOOK New Year 2016
RBC Global Asset Management
> Paul Johnson
V.P. & Senior Port folio Manager,
Global Equities
RBC Global Asset Management Inc.
> Philippe Langham
Senior Portfolio Manager,
RBC Global Asset Management (UK)Limited
> Ray Mawhinney
Senior V.P. & Senior Portfolio Manager,
U.S. & Global Equities
RBC Global Asset Management Inc.
> Mayur Nallamala
Head & Senior V.P., Asian Equities
RBC Investment Management (Asia)
Limited
> Dominic Wallington
RBC Global Asset Management (UK)
Limited
> Stuart Morrow, CFA
Portfolio Manager, U.S. Equities &
Vice President Global Equity Research
RBC Global Asset Management Inc.
> Martin Paleczny, CFA
V.P. & Senior Portfolio Manager,
RBC Global Asset Management Inc
> Hakim Ben Aissa, CFA
Senior Analyst, Global Equities (Energy)
RBC Global Asset Management Inc.
> Rob Cavallo, CFA
Senior Analyst, Global Equities
(Health Care)
RBC Global Asset Management Inc.
> Kent Crosland, CFA
Analyst, Global Equities (Semis/Tech
Hardware, Commercial Services)
RBC Global Asset Management Inc.
> Sean Davey, CFA
Analyst, Global Equities
(Consumer Staples)RBC Global Asset Management Inc.
> Matt Gowing, CFA
Analyst, Global Equities
(Telecommunications, Software,
Utilities)
RBC Global Asset Management Inc.
> John Richards, CFA
RBC Global Asset Management Inc.
> Joe Turnbull, CFA
Analyst , Global Equities
(Industrials ex Commercial Services,
Building Products)RBC Global Asset Management Inc.
> Angelica Uruena
Analyst , Global Equities
RBC Global Asset Management Inc.
> Dagmara Fijalkowski, MBA, CFA
Head, Global Fixed Income & Currencies
(Toronto and London)
RBC Global Asset Management Inc.
> Soo Boo Cheah, MBA, CFA
Senior Port folio Manager,
Global Fixed Income & Currencies
RBC Global Asset Management (UK)
Limited
> Suzanne Gaynor
V.P. & Senior Port folio Manager, Global
Fixed Income & Currencies
RBC Global Asset Management Inc.
GLOBAL EQUITY HEADS
GLOBAL EQUITY ADVISORY COMMITTEE
GLOBAL FIXED INCOME & CURRENCIES ADVISORY COMMITTEE
> Eric Lascelles
Chief Economist
RBC Global Asset Management Inc.
7/25/2019 Global Investment Outlook
http://slidepdf.com/reader/full/global-investment-outlook 79/80
This report has been provided by RBC Global Asset Management Inc. (RBC GAM Inc.) for informational purposes only and maynot be reproduced, distributed or published without the written consent of RBC GAM Inc. In the United States, this report isprovided by RBC Global Asset Management (U.S.) Inc., a federally registered investment adviser founded in 1983. In Europeand the Middle East, this report is provided by RBC Global Asset Management (UK) Limited, which is authorised and regulatedby the Financial Conduct Authority. RBC Global Asset Management (RBC GAM) is the asset management division of Royal Bankof Canada (RBC) which includes RBC Global Asset Management Inc., RBC Global Asset Management (U.S.) Inc., RBC GlobalAsset Management (UK) Limited, RBC Alternative Asset Management Inc., and BlueBay Asset Management LLP, which are
not be relied upon for providing such advice. RBC GAM takes reasonable steps to provide up-to-date, accurate and reliableinformation, and believes the information to be so when printed. Due to the possibility of human and mechanical error as wellas other factors, including but not limited to technical or other inaccuracies or typographical errors or omissions, RBC GAM isnot responsible for any errors or omissions contained herein. RBC GAM reserves the right at any time and without notice tochange, amend or cease publication of the information.
Any investment and economic outlook information contained in this report has been compiled by RBC GAM from varioussources. Information obtained from third parties is believed to be reliable, but no representation or warranty, express or
All opinions and estimates contained in this report constitute our judgment as of the indicated date of the information, are
subject to change without notice and are provided in good faith but without legal responsibility. To the full extent permitted consequential loss arising from any use of the outlook information contained herein. Interest rates and market conditions aresubject to change.
A note on forward-looking statements
This report may contain forward-looking statements about future performance, strategies or prospects, and possible futureaction. The words “may,” “could,” “should,” “would,” “suspect,” “outlook,” “believe,” “plan,” “anticipate,” “estimate,”“expect,” “intend,” “forecast,” “objective” and similar expressions are intended to identify forward-looking statements.Forward-looking statements are not guarantees of future performance. Forward-looking statements involve inherent risks anduncertainties about general economic factors, so it is possible that predictions, forecasts, projections and other forward-lookingstatements will not be achieved. We caution you not to place undue reliance on these statements as a number of importantfactors could cause actual events or results to differ materially from those expressed or implied in any forward-lookingstatement made. These factors include, but are not limited to, general economic, political and market factors in Canada, theUnited States and internationally, interest and foreign exchange rates, global equity and capital markets, business competition,technological changes, changes in laws and regulations, judicial or regulatory judgments, legal proceedings and catastrophicevents. The above list of important factors that may affect future results is not exhaustive. Before making any investmentdecisions, we encourage you to consider these and other factors carefully. All opinions contained in forward-looking statementsare subject to change without notice and are provided in good faith but without legal responsibility.
DISCLOSURE

7/25/2019 Global Investment Outlook
http://slidepdf.com/reader/full/global-investment-outlook 80/80