Embed Size (px)
Citation preview
Golden Math Nuggets:Golden Math Nuggets:Digging into Assessment Digging into Assessment DataDatato Improve Instruction in to Improve Instruction in MathMath
James McBride, Renaissance LearningR. James Milgram, Stanford UniversityMichael Gallagher, North Carolina DPIElliot Asp, Cherry Creek Public Schools, CO
1
The Common Core Math The Common Core Math Standards – Standards –
How American Students Measure How American Students Measure Up:Up:
Three Years of DataThree Years of Data
Presented at CCSSO National Conference on Student Assessment
James R. McBrideRenaissance Learning
June 20 20132
Outline
Background and OverviewMethodsAggregate Results
Interpretation…Professor Milgram
3
Background
Since Spring 2011, Renaissance Learning has conducted a program of research to provide advance information about the status of US students relative to the Common Core Math Standards.
This paper, and that of Professor Milgram, present an update on the most recent year of the project, and a brief summary of findings and interpretations.
4
Background and Overview
Beginning in 2008, Renaissance Learning has developed and field tested thousands of new STAR Math items measuring more than 550 standards-based skills, and calibrated them using the Rasch model. Thousands of those items have been aligned to the new Common Core Math Standards.
Selected items that align to the Common core have been chosen for use in a research program designed to provide an early appraisal of U.S. students’ proficiency on some of the Common Core Math Standards. What follows is a summary of the design of that research, as well as findings from three annual evaluations of mastery of those items.
5
Methods
The study consists of more than 100 Common Core-aligned items embedded as “experimental items” in STAR Math, and randomly chosen for administration to the universe of students taking STAR Math on the Renaissance Place RealTime™ platform. Response data from that platform is available to Renaissance Learning for research use.
6
7
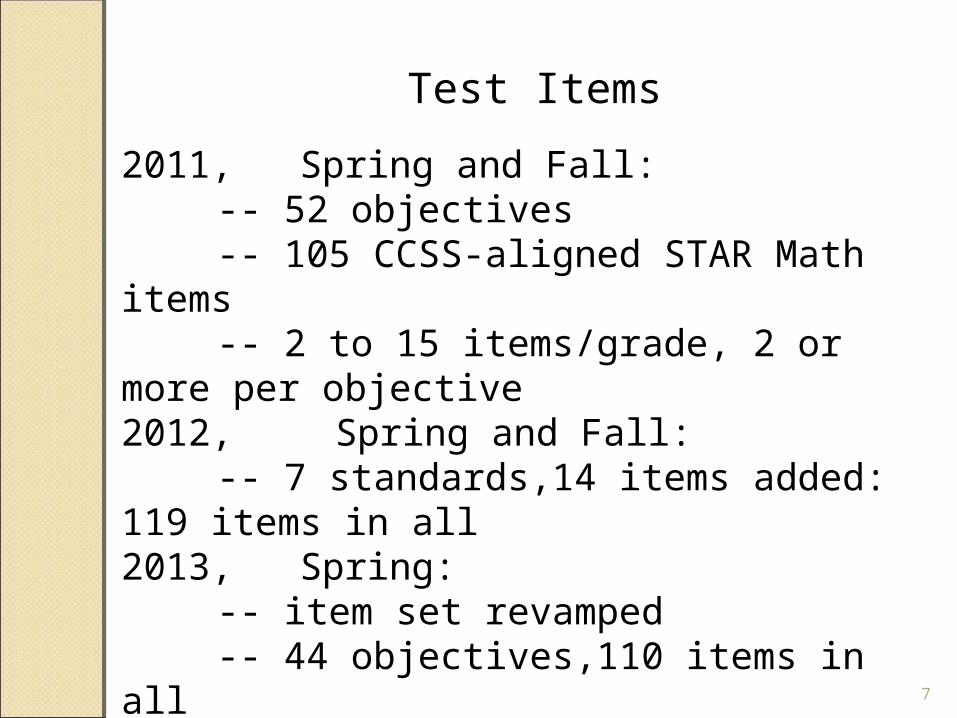
Test Items
2011, Spring and Fall: -- 52 objectives-- 105 CCSS-aligned STAR Math items-- 2 to 15 items/grade, 2 or more per
objective2012, Spring and Fall:
-- 7 standards,14 items added: 119 items in all2013, Spring:
-- item set revamped-- 44 objectives,110 items in all-- 72 new or revised; 38 carried over
9
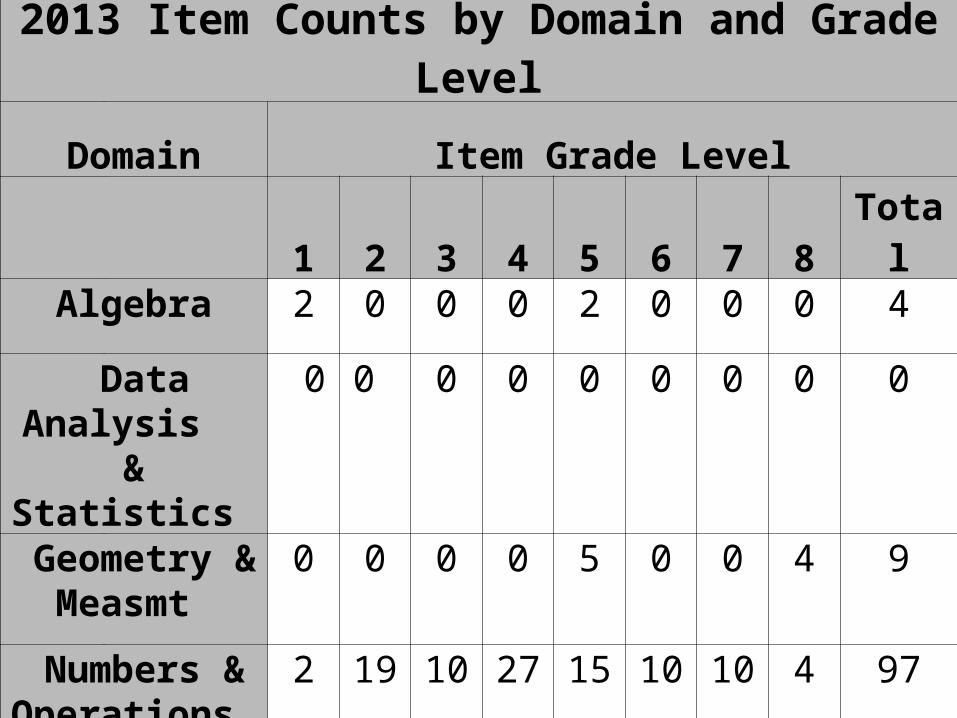
2013 Item Counts by Domain and Grade Level
Domain Item Grade Level
1 2 3 4 5 6 7 8 TotalAlgebra 2 0 0 0 2 0 0 0 4
Data Analysis & Statistics
0 0 0 0 0 0 0 0 0
Geometry & Measmt
0 0 0 0 5 0 0 4 9
Numbers & Operations
2 19 10 27 15 10 10 4 97
Total 4 19 10 27 22 10 10 8 110
Students
All students taking STAR Math on the RP RealTime™ platform took one or more unscored CCSS-aligned test items on grade level
-- random assignment of items to students
-- items embedded in random positions
Most students took 1 or 2 Common Core-aligned items. Each item was administered to students in its target grade, as well as the next higher grade. 10
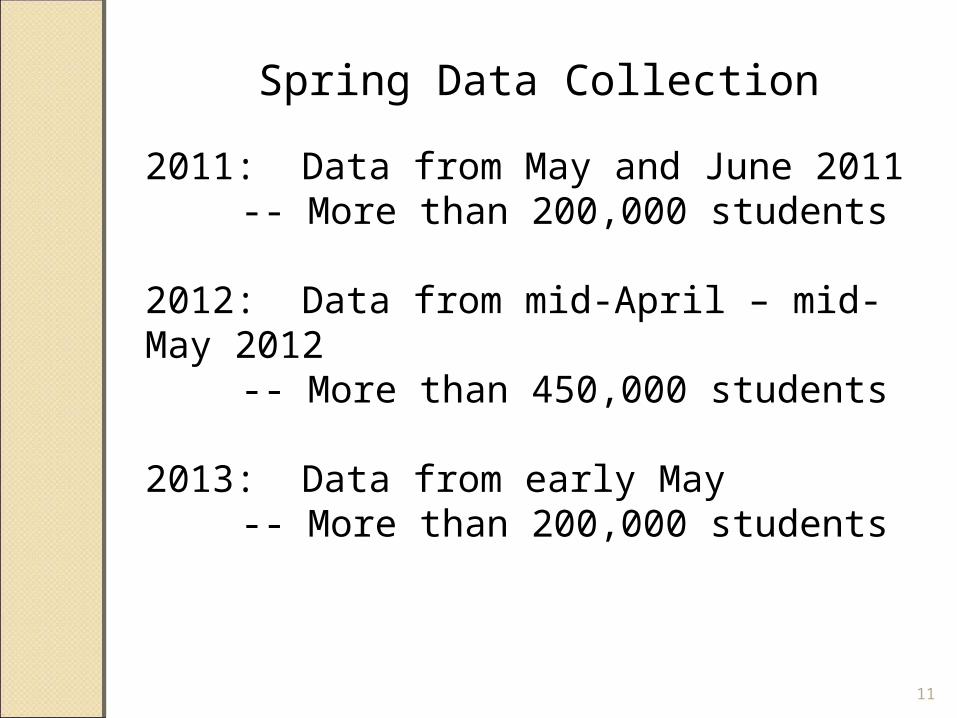
Spring Data Collection
2011: Data from May and June 2011 -- More than 200,000 students
2012: Data from mid-April – mid-May 2012
-- More than 450,000 students
2013: Data from early May-- More than 200,000 students
11
12
Outcome Variables
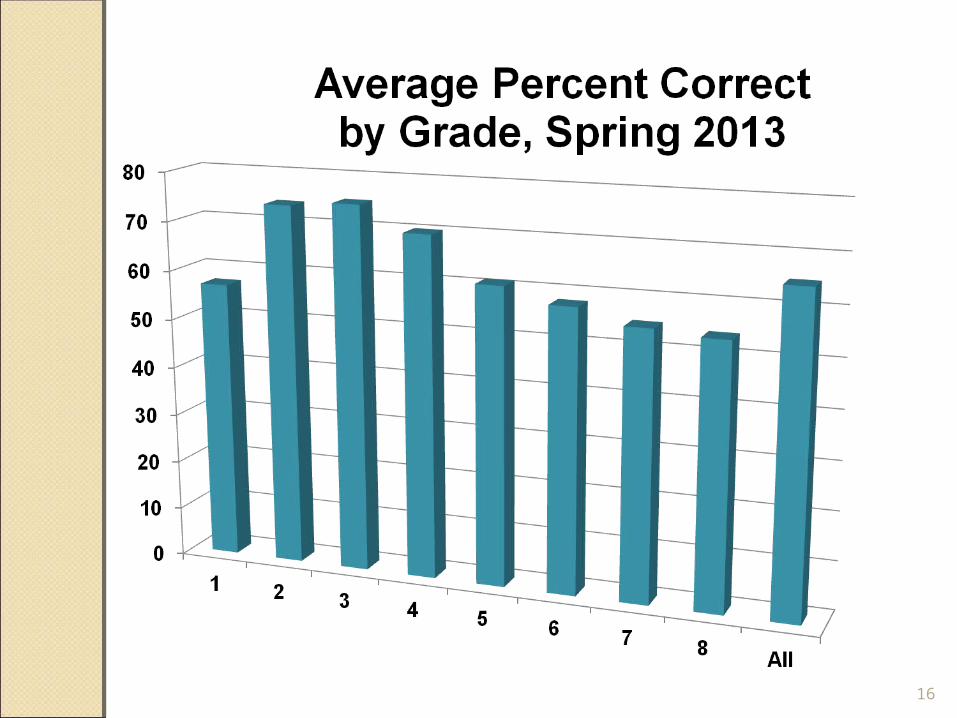
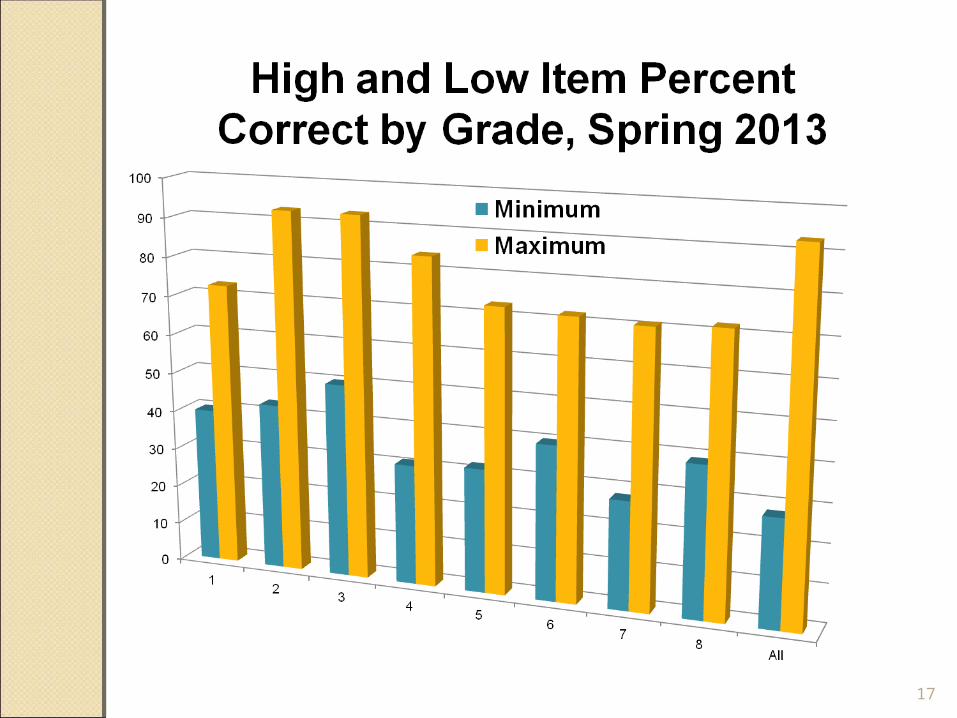
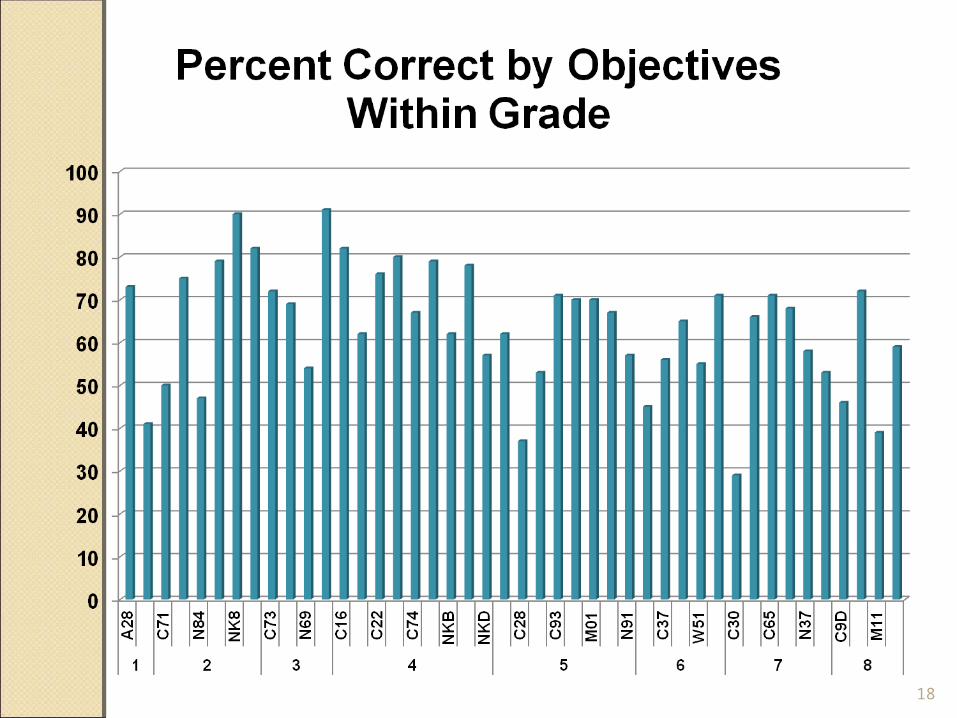
Percent Correct was calculated for each Common Core-aligned item. On-grade percent correct was the variable of primary interest.
Other item statistics, including distractor choice percentages, item-score correlations and Rasch difficulty parameters, were calculated but are not reported here. Professor Milgram’s presentation will address some of those data.
Selected 2013 Results
13
14
15
16
17
18
19
20
Interpretation
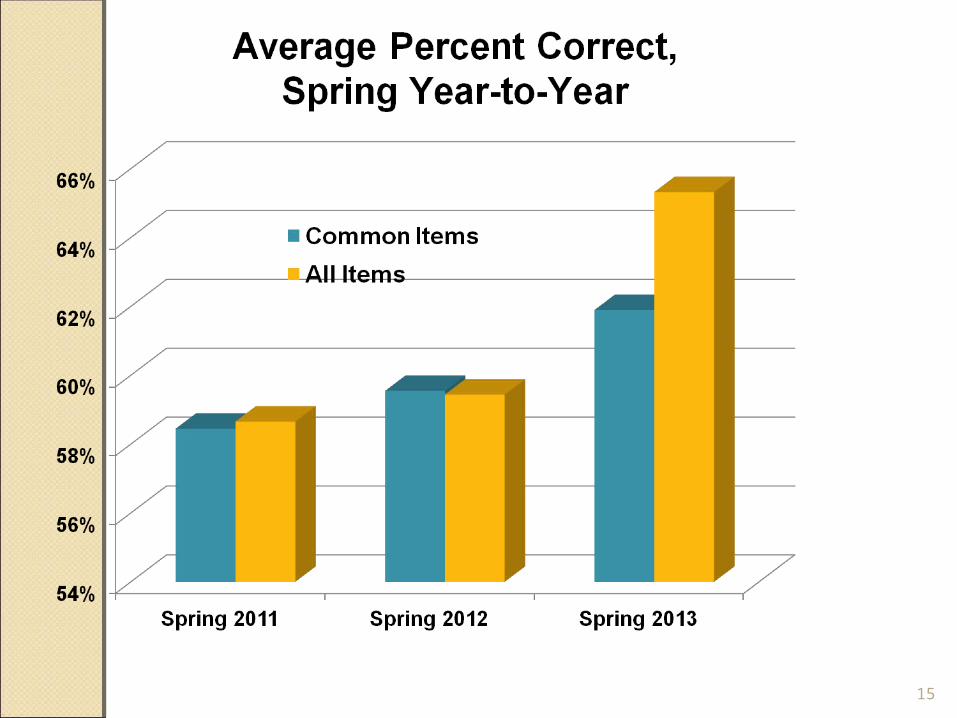
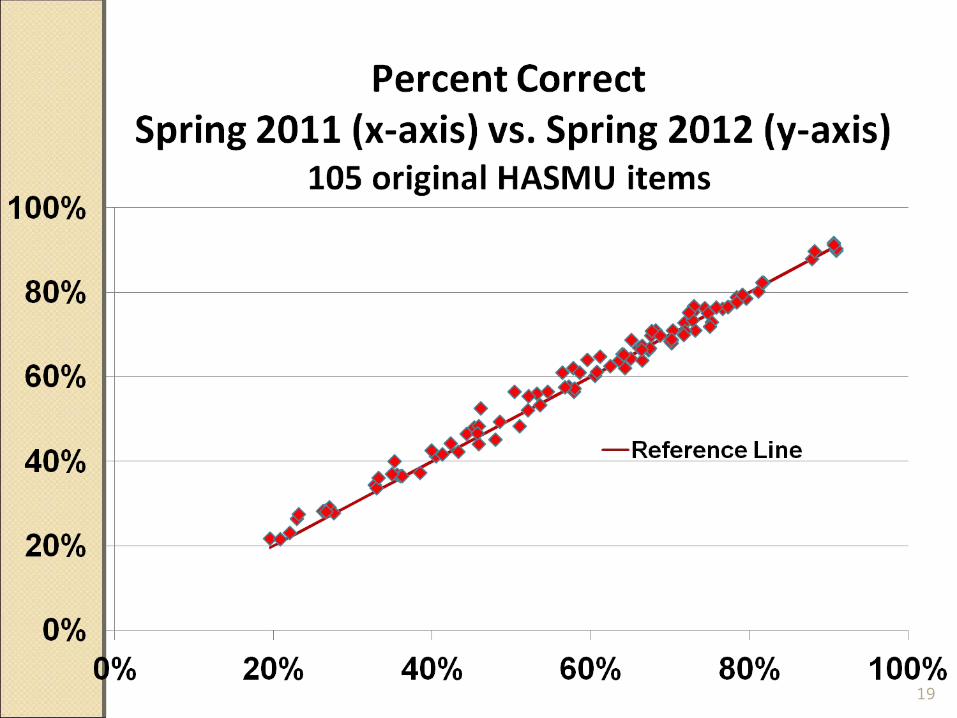
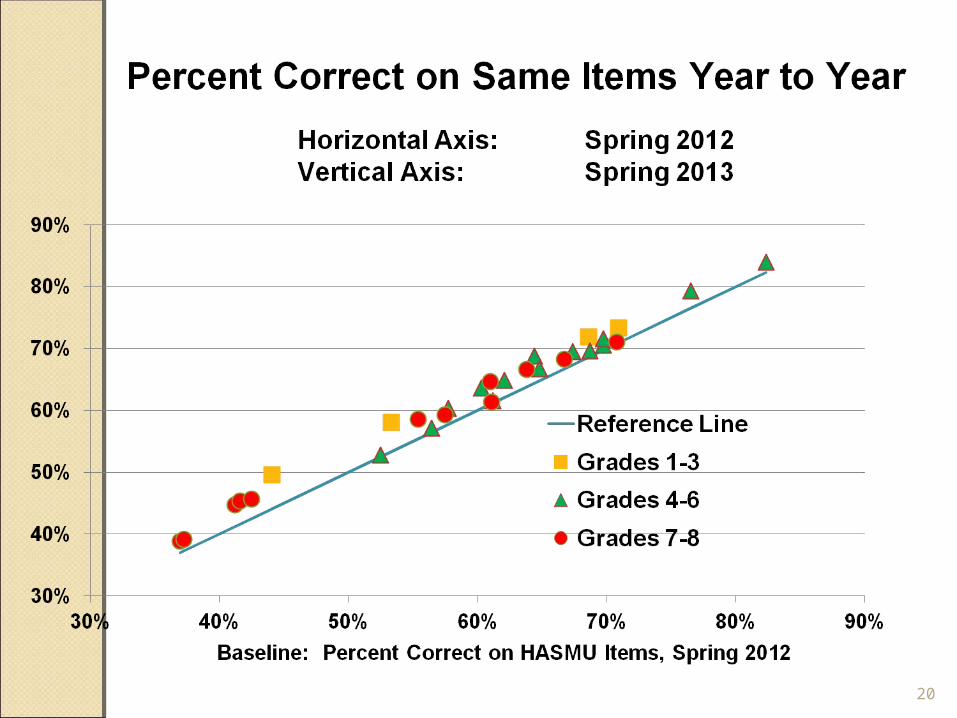
-- Overall percent correct increased somewhat each year from 2011 to 2013 - overall and for the 30 common items.
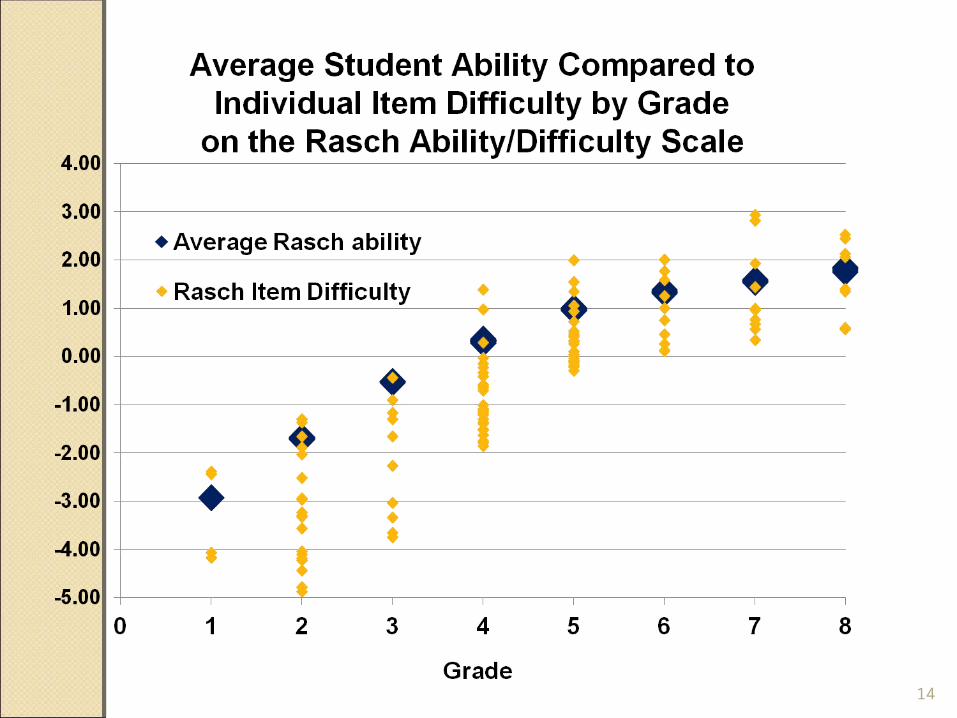
-- Substantial differences grade-to grade, possibly due to: - objectives selected at each grade - differences in CCSS difficulty by grade
21
22
-- Steady decline from grade 4 to 8 gives pause. What does it signify?
- Difficulties ahead?- Differences between 2010-
2013 curricula and CCSS?- Is it attributable to curriculum?
Instruction? Teacher preparation? More than one of these?

Next Steps
-- Technical report on 2010-13 study
-- Replicate for 2013-14 with expanded scope
- Assess Fall-Spring 2013-14 growth-
25

27