Embed Size (px)
Citation preview
Golden Triangle 20
June 1, 2018— September 21, 2018
GT-20: -3.7% (-23.6% Y/Y)
Gold Price: -7.2% (-7.5% Y/Y)
TSX Gold Index: -17.4% (-20.0% Y/Y)
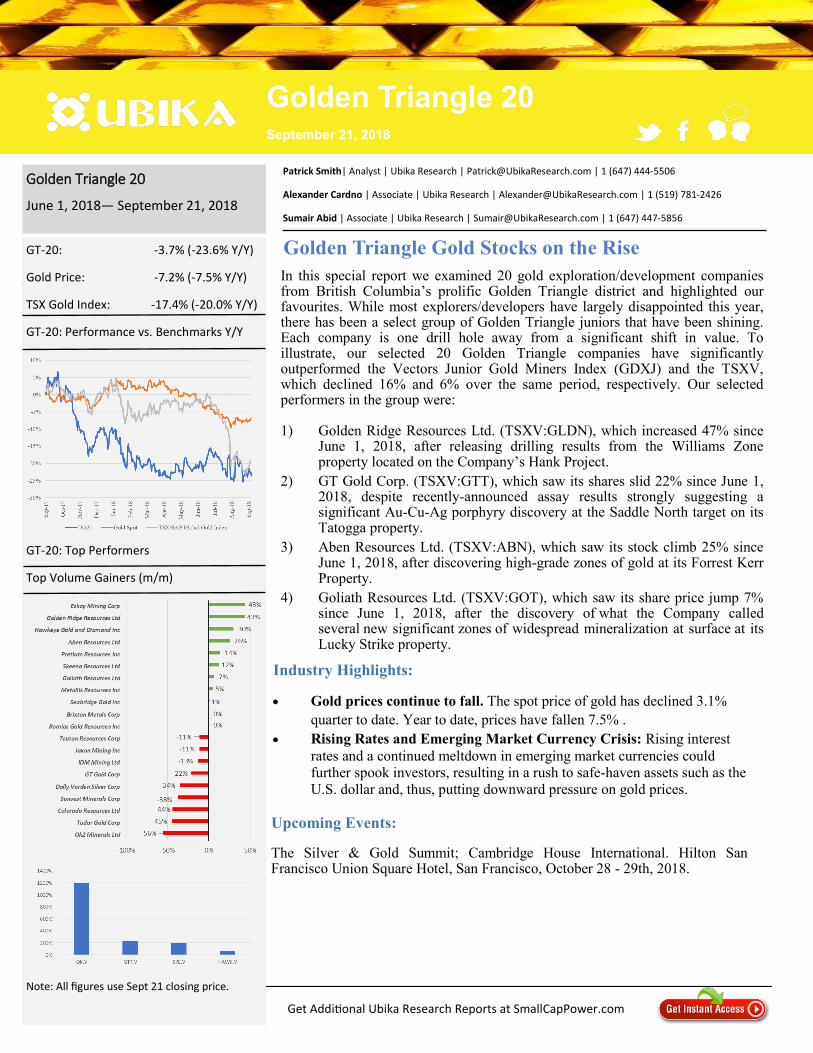
GT-20: Performance vs. Benchmarks Y/Y
GT-20: Top Performers
Top Volume Gainers (m/m)
Note: All figures use Sept 21 closing price.
Patrick Smith| Analyst | Ubika Research | [email protected] | 1 (647) 444-5506
Alexander Cardno | Associate | Ubika Research | [email protected] | 1 (519) 781-2426
Sumair Abid | Associate | Ubika Research | [email protected] | 1 (647) 447-5856
Golden Triangle Gold Stocks on the Rise
In this special report we examined 20 gold exploration/development companies from British Columbia’s prolific Golden Triangle district and highlighted our favourites. While most explorers/developers have largely disappointed this year, there has been a select group of Golden Triangle juniors that have been shining. Each company is one drill hole away from a significant shift in value. To illustrate, our selected 20 Golden Triangle companies have significantly outperformed the Vectors Junior Gold Miners Index (GDXJ) and the TSXV, which declined 16% and 6% over the same period, respectively. Our selected performers in the group were: 1) Golden Ridge Resources Ltd. (TSXV:GLDN), which increased 47% since
June 1, 2018, after releasing drilling results from the Williams Zone property located on the Company’s Hank Project.
2) GT Gold Corp. (TSXV:GTT), which saw its shares slid 22% since June 1, 2018, despite recently-announced assay results strongly suggesting a significant Au-Cu-Ag porphyry discovery at the Saddle North target on its Tatogga property.
3) Aben Resources Ltd. (TSXV:ABN), which saw its stock climb 25% since June 1, 2018, after discovering high-grade zones of gold at its Forrest Kerr Property.
4) Goliath Resources Ltd. (TSXV:GOT), which saw its share price jump 7% since June 1, 2018, after the discovery of what the Company called several new significant zones of widespread mineralization at surface at its Lucky Strike property.
Industry Highlights:
• Gold prices continue to fall. The spot price of gold has declined 3.1%
quarter to date. Year to date, prices have fallen 7.5% .
• Rising Rates and Emerging Market Currency Crisis: Rising interest
rates and a continued meltdown in emerging market currencies could further spook investors, resulting in a rush to safe-haven assets such as the
U.S. dollar and, thus, putting downward pressure on gold prices.
Upcoming Events:
The Silver & Gold Summit; Cambridge House International. Hilton San Francisco Union Square Hotel, San Francisco, October 28 - 29th, 2018.
Get Additional Ubika Research Reports at SmallCapPower.com
Golden Triangle 20 September 21, 2018

Get Additional Ubika Research Reports at SmallCapPower.com
Notable Performers
Golden Ridge Resources Ltd. (TSXV:GLDN)
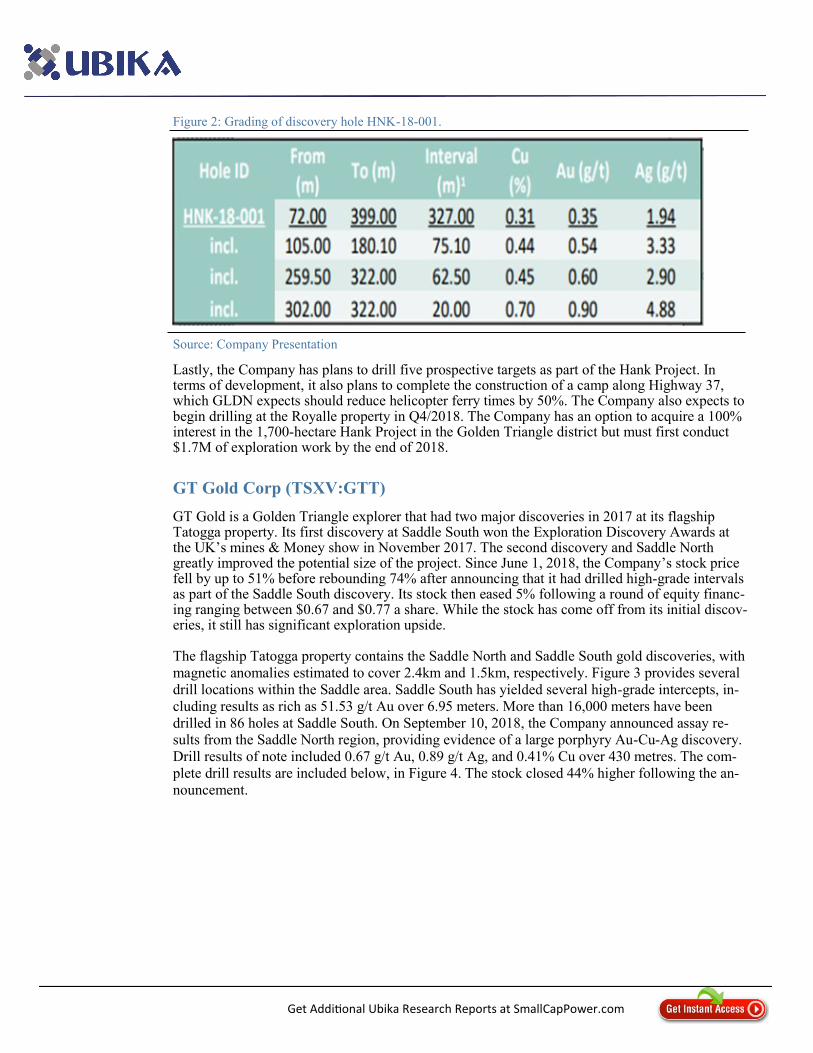
Golden Ridge Resources is focused on high-grade gold and silver in the Golden Triangle district of British Columbia. The Company’s shares have generated a return of 47% since June 1, 2018, including a 20% gain following the August 27, 2018 announcement of favourable survey results from the William’s Zone, located within the Hank Project. Golden Ridge is currently drilling a 6,000m program at the Hank project and is cashed up for the near-term with $2M in the bank. Importantly, the team is led by “legendary” explorer Larry Nagy, who was instrumental in the discovery of the SNIP mine for Delaware Resources, which eventually moved from $1/share to $28/share on a takeover. As well, Mr. Nagy was behind the discovery by Stikine Resources and the Eskay Creek property, which turned out to be Canada’s highest grade gold mine. Stinkine’s stock moved from $1/share to $67/share at takeover. The Company announced recently the discovery of an alkalic porphyry system in the William’s Zone following the release of drill results for the William’s Zone Discovery Hole HNK-18-001. In the three days following the announcement, its stock price increased by 20%. HNK-18-001 includes grading of 0.44% Cu, 0.54 g/t Au, and 3.3 g/t Ag over 75 meters. Figure 1 below depicts the location of the Hank Project within the Golden Triangle, while Figure 2 illustrates the grading at various intervals for HNK-18-001. Figure 1: Location of Hank Project within Golden Triangle.
Source: Company Website
Get Additional Ubika Research Reports at SmallCapPower.com
Figure 2: Grading of discovery hole HNK-18-001.
Source: Company Presentation
Lastly, the Company has plans to drill five prospective targets as part of the Hank Project. In terms of development, it also plans to complete the construction of a camp along Highway 37, which GLDN expects should reduce helicopter ferry times by 50%. The Company also expects to begin drilling at the Royalle property in Q4/2018. The Company has an option to acquire a 100% interest in the 1,700-hectare Hank Project in the Golden Triangle district but must first conduct $1.7M of exploration work by the end of 2018.
GT Gold Corp (TSXV:GTT)
GT Gold is a Golden Triangle explorer that had two major discoveries in 2017 at its flagship Tatogga property. Its first discovery at Saddle South won the Exploration Discovery Awards at the UK’s mines & Money show in November 2017. The second discovery and Saddle North greatly improved the potential size of the project. Since June 1, 2018, the Company’s stock price fell by up to 51% before rebounding 74% after announcing that it had drilled high-grade intervals as part of the Saddle South discovery. Its stock then eased 5% following a round of equity financ-ing ranging between $0.67 and $0.77 a share. While the stock has come off from its initial discov-eries, it still has significant exploration upside. The flagship Tatogga property contains the Saddle North and Saddle South gold discoveries, with
magnetic anomalies estimated to cover 2.4km and 1.5km, respectively. Figure 3 provides several
drill locations within the Saddle area. Saddle South has yielded several high-grade intercepts, in-
cluding results as rich as 51.53 g/t Au over 6.95 meters. More than 16,000 meters have been
drilled in 86 holes at Saddle South. On September 10, 2018, the Company announced assay re-sults from the Saddle North region, providing evidence of a large porphyry Au-Cu-Ag discovery.
Drill results of note included 0.67 g/t Au, 0.89 g/t Ag, and 0.41% Cu over 430 metres. The com-
plete drill results are included below, in Figure 4. The stock closed 44% higher following the an-
nouncement.

Get Additional Ubika Research Reports at SmallCapPower.com
Figure 3: The Saddle area, divided into Saddle North and Saddle South
Source: Company Presentation
Figure 4: Hole TTD085 Assay Results
Source: Company Presentation
The New Nanik property is significantly smaller at 13,000 hectares and is only accessible by plane or helicopter. The property has strong copper and molybdenum in its soils over an area spanning 500 x 2000 meters. Several holes have returned intercepts of >0.2% Cu plus Au and Ag for lengths up to 200m. Currently, the Company has not made plans to develop the New Nanik property. Instead, it is planning significant expansions to its drilling operations in both Saddle North and South for the second half of 2018.

Get Additional Ubika Research Reports at SmallCapPower.com
Aben Resources Ltd. (TSXV:ABN)
Aben Resources is a gold exploration company with projects located in British Columbia’s Gold-en Triangle district as well as in Saskatchewan and the Yukon. The Company’s stock price has surged 25% since June 1, 2018, due primarily to positive assay results for the Forrest Kerr Gold Project and the Southern Boundary mineralized zone discovery. The Company’s 100%-owned flagship property, the Forrest Kerr Gold Project, is 23,000 hectares and located in northwestern British Columbia. On August 9, 2018, Aben announced that its first drill hole of 2018 yielded multiple high-grade zones, with the highest-grade zone consisting of 331 g/t Au over 1 meter within a broad zone averaging 38.7 g/t gold over 10.0 metres. By the end of August 2018, the Company had completed 4,850 meters of drilling at 16 locations. Most drill-ing sites were concentrated in high-priority areas of the Northern Boundary (first assayed in 2017) but a 1,150m drilling campaign was completed at the southeast side of the property, re-ferred to as the Southern Boundary target. Recently, 2018 exploration results at the Northern Boundary at Forrest Kerr indicated high-grade zones, including 62.4 g/t Au over 6 meters, causing Aben’s stock price to soar 111% over a four-day period. Follow-up drilling at Forrest Kerr is expected to continue into the fall. Figures 5 and 6 below depict the Forrest Kerr Project in relation to other mining operations within the Golden Triangle. As of March 31, 2018, the Company held more than C$15.5M in cash.
Figures 5 (Left) and 6 (Right): Location of the Forrest Kerr Project
Source: Company Presentation
Aben’s property in the Yukon is the Justin Project. In January 2011, the Company entered into an acquisition agreement with Eagle Plains Resources to acquire 100% interest in the Justin Project. The site consists of 80 claims across 18,314 acres in east-central Yukon Territory. Exploration in 2017 indicated gold-bearing intercepts with results including 1.44 g/t Au over 5.00 meters, as well as 2.11 g/t Au over 3.85 meters. The Company said it is encouraged by these results and plans to continue exploration in 2018. In Saskatchewan, Aben Resources owns an 80% interest in the Chico gold project. In 2018, the Company had plans for an extensive 10,000-meter winter drilling program that was ultimately suspended following a request by the citizens of Pelican Narrows, SK and members of the Peter Ballantyne Cree Nation (PBCN).
Get Additional Ubika Research Reports at SmallCapPower.com
Goliath Resources Ltd. (TSXV:GOT, Frankfurt:B4IE)
Goliath Resources is a project generator and exploration company focused on four projects within the Golden Triangle and surrounding area. All four projects have significant upside potential that could host new elephant-size discoveries that would tick the boxes for any senior mining company. Its stock price has increased 7% since June 1, 2018, following consistent news releases about drilling progress at both the Copperhead and Lucky Strike properties. The Company controls four properties that include Bingo, Copperhead, Golddigger and Lucky Strike covering 44,003 hectares. Two of the properties, Bingo and Golddigger, are located within BC’s Golden Triangle while Copperhead and Lucky Strike are just south of the Golden Triangle located within the Skeena Arch of British Columbia close to existing power lines and major infrastructure. Goliath’s flagship project is the Lucky Strike project, 40 km north of Terrance BC and covers 24,951 hectares. It has a massive textbook geophysical and geochemical porphyry drill target for 2018 that covers 2500 x 1500 x 500 metres at its Prosperity Zone. In addition, a new area named the Gold Source Zone has been discovered where a 2017 hydrothermal breccia sample assayed 96.8 g/t gold (3.1 ounces per ton); the new zone is an epithermal, milky quartz hydrothermal breccia and sheeted vein corridors extend more than 400 metres along an E-W trend and over 200 metres wide and remains open. As seen below, Figure 7 depicts the four exploration projects of Goliath Resources in relation to the Golden Triangle. The Company’s Copperhead property covers 4,354 hectares and is located 35km southwest of Smithers B.C. The area is dominated by Massive Sulphide breccias that have yielded copper mineralization of up to 7.97% and silver 45.41 g/t. This property is being drilled during its 2018 program. Goliath owns a 10% interest in the DSM syndicate, a project generator focused on discovering areas of glacial and snowpack recession.

Get Additional Ubika Research Reports at SmallCapPower.com
On August 13, 2018, Goliath Resources announced that its 2018 exploration had discovered several significant zones, specifically the Gold Source Zone believed to be the source of a highly-mineralized hydrothermal breccia sample that assayed 96.8 g/t gold (3.1 ounces per ton) in 2017. In conjunction with these findings the stock price of the Company jumped 50% between August 14 –29th. The Company has since expanded its exploration and drill program to test this mineralization zone further.
Upcoming Catalysts:
• Worsening Trade Conditions: A failure to reach a trade understanding between the U.S.
and China could result in a flight to safe-haven assets such as the U.S. dollar, further strain-
ing gold prices, which are already 12% below their peak of US$1365 in April. Meanwhile,
continued trade tensions with Canada could continue to depress the Canadian dollar, widen-
ing margins for producers who primarily generate revenues in U.S. dollars.
• A Brexit deal “realistic in 6 - 8 weeks”: EU Negotiator. A Brexit deal could prop up the
Euro and Pound, making gold cheaper for buyers in the U.K. and Europe, pushing up the
price of gold.
Figure 7: Location of Goliath’s four mining assets
Source: Company Presentation
To find out more about Goliath Resources Limited (TSXV:GOT), please visit the company’s Investor Hub. Ubika Research/SmallCapPower has received compensation from Goliath Resources Limited. to provide analyst research coverage. For full disclosure please visit here >>

Important Disclosure
Smallcappower.com is owned and operated by Ubika Corporation whose divisions include Ubika Research and Ubika Communications. Ubika Corp. is a wholly owned subsidiary of Gravitas Financial Inc. The following terms and conditions (“Terms of Use”) govern the use of this website (“site”) www.SmallCapPower.com. By accessing this site, you agree to comply with and be legally bound by the Terms of Use as set out herein. Ubika reserves the right to seek all remedies available at law and in equity for violations of these Terms of Use, including the right to block access from a particular internet address to our site.
Disclaimer
Ubika Corporation and its affiliates or partners will seek to provide services to companies mentioned on the smallcappower.com website. Hence, all information availa-ble on smallcappower.com should be considered as commercial advertisement and not an endorsement, offer or recommendation to buy or sell securities. Ubika Corpo-ration and its related companies (including its directors, employees and representatives) or a connected person may have ownership/stock positions in, or options on the securities detailed in this report, and may buy, sell or offer to purchase or sell such securities from time to time.
Ubika and/or its affiliates and/or their respective officers, directors or employees may from time to time acquire, hold or sell securities and/or commodities and/or com-modity futures contracts in certain underlying companies mentioned in this site and which may also be clients of Ubika’s affiliates. In such instances, Ubika and/or its affiliates and/or their respective officers, directors or employees will use all reasonable efforts to avoid engaging in activities that would lead to conliicts of interest and Ubika and/or its affiliates will use all reasonable efforts to comply with conliicts of interest disclosures and regulations to minimize the conliict.
Specifically all companies mentioned or listed as “Analyst Covered Companies” at smallcappower.com and which are shown under the heading “Analyst Covered Compa-nies” on the page: http://www.smallcappower.com/companies have entered into a commercial relationship with Ubika Corporation or our affiliates for capital market services and have paid fees and/or shares or stock options or warrants for being featured and mentioned in smallcappower.com. Hence these “Analyst Covered Compa-nies” at smallcappower.com are shown at the website as an advertisement only and any mention of these companies does not and will not constitute an offer to buy or sell securities in the featured companies. Ubika Corporation, its affiliates or partners will seek to provide services to companies mentioned in smallcappower. com web-site. Hence, all information available on smallcappower.com should be considered as commercial advertisement and not an endorsement, offer or recommendation to buy or sell securities.
Ubika Corporation and its divisions Ubika Communication and Ubika Research (collectively, “Ubika”) are not registered with any financial or securities regulatory authori-ty in Ontario or Canada, and do not provide nor claims to provide investment advice or recommendations to any visitor of this site or readers of any content on this site.
The information on this site is for informational purposes only. This site, including the data, information, research reports, press releases, findings, comments, views and opinions of Ubika’s analysts, columnists, speakers or commentators, and other contents contained in it, is not intended to be: investment, tax, banking, accounting, legal, financial or other professional or expert advice of Ubika or its affiliates, or a recommendation, solicitation or offer by Ubika or its affiliates to buy or sell any secu-rities, futures, options or other financial instruments, and such information should not be relied upon for such advice. Every user of this site is advised to seek profes-sional advice before acting or omitting to act on any information contained in the site.
Research reports and newsletters have been prepared without reference to any particular user’s investment requirements or financial situation. Where reference is made to estimate of value or relative value of a specific company, there is no guarantee that these estimates are reliable or will materialize. Readers of these reports and newsletters are advised to conduct their own due diligence before making any investment decisions. Ubika does not make independent investigation or inquiry as to the accuracy and completeness of any information provided by the Analyst Covered companies. Although the content has been obtained from sources believed to be reliable, this website could include technical or other inaccuracies or typographical errors and it is provided to you on an “as is” basis without warranties or repre-sentations of any kind. Ubika and its affiliates make no representation and disclaim all express and implied warranties and conditions of any kind, including without limitation, representations, warranties or conditions regarding accuracy, timeliness, completeness, non-infringement, satisfactory quality, merchantability, merchanta-ble quality or fitness for any particular purpose or those arising by law, statute, usage of trade, or course of dealing. Ubika and its affiliates assume no responsibility to you or any third party for the consequences of any errors or omissions.
Information in this site is subject to change without notice. Ubika assumes no liability for any inaccurate, delayed or incomplete information, nor for any actions taken in reliance thereon.
Ubika, its affiliates and their respective directors, officers, employees, or agents expressly disclaim any liability for losses or damages, whether direct, indirect, special, or consequential, or other consequences, howsoever caused, arising out of any use or reproduction of this site or any decision made or action taken in reliance upon the content of this site, whether authorized or not. By accessing this site, each user of this site releases Ubika, its affiliates and their respective officers, directors, agents and employees from all claims and proceedings for such losses, damages or consequences.
Ubika and its affiliates do not endorse or recommend any securities issued by any companies identified on, or linked through, this site. Please seek professional advice to evaluate
specific securities or other content on this site. Links, if any, to third party sites are for informational purposes only and not for trading purposes.Ubika and its affiliates have not
prepared, reviewed or updated any content on third party sites and assume no responsibility for the information posted on them.
Ubika and/or its affiliates and/or their respective officers, directors or employees may from time to time acquire, hold or sell securities and/or commodities and/or commodity futures contracts mentioned in this site.
This site may include forward-looking statements about objectives, strategies and expected financial results of companies featured in this site or where research reports are available on companies displayed and/or featured on this site. Such forward-looking statements are inherently subject to uncertainties beyond the control of such companies. The users of this site are cautioned that the company’s actual performance could differ materially from such forward-looking statements.
World Wide Web sites accessed by hypertext links (“hyperlinks”) appearing in this site have been independently developed by parties other than Ubika and Ubika has no control over information in any hyperlinked site. Ubika is providing hyperlinks to users of this site only as a convenience. Ubika makes no representation and is not responsible for the quality, content or reliability of any information in any hyperlinked site. The inclusion of any hyperlink in this site should not be construed as an endorsement by Ubika of the information in such hyperlinked site and does not imply that Ubika has investigated, verified or monitored the information in any such hyperlinked site. Should you wish to inquire about creating a link from your World Wide Web site to this site, contact SCP marketing via e-mail at: info@ smallcap-power.com. for written authorization.
See our full disclaimer here.