Embed Size (px)
Citation preview

Goldman Sachs Global Energy Conference 2020
Mark Smith| Sr. EVP & CFO
January 7-8, 2020

Goldman Sachs Global Energy Conference 2020| 2
This presentation contains forward-looking statements that involve risks and uncertainties that could materially affect our expected results of operations, liquidity, cash flows and business
prospects. Such statements include those regarding our expectations as to our future:
Actual results may differ from anticipated results, sometimes materially, and reported results should not be considered an indication of future performance. While we believe assumptions or bases
underlying our expectations are reasonable and made them in good faith, they almost always vary from actual results, sometimes materially. We also believe third-party statements we cite are
accurate but have not independently verified them and do not warrant their accuracy or completeness. Factors (but not necessarily all the factors) that could cause results to differ include:
Words such as "anticipate," "believe," "continue," "could," "estimate," "expect," "goal," "intend," "likely," "may," "might," "plan," "potential," "project," "seek," "should," "target, "will" or "would" and similar
words that reflect the prospective nature of events or outcomes typically identify forward-looking statements. Any forward-looking statement speaks only as of the date on which such statement is
made and we undertake no obligation to correct or update any forward-looking statement, whether as a result of new information, future events or otherwise, except as required by applicable law.
• financial position, liquidity, cash flows and results of operations
• business prospects
• transactions and projects
• operating costs
• Value Creation Index (VCI) metrics, which are based on certain estimates including
future production rates, costs and commodity prices
• operations and operational results including production, hedging and capital investment
• budgets and maintenance capital requirements
• reserves
• type curves
• expected synergies from acquisitions and joint ventures
• commodity price changes
• debt limitations on our financial flexibility
• insufficient cash flow to fund our capital plan, planned investments, debt repurchases
and distributions to JV partners
• inability to enter into desirable transactions, including acquisitions, asset sales and
joint ventures
• legislative or regulatory changes, including those related to drilling, completion, well
stimulation, operation, maintenance or abandonment of wells or facilities, managing
energy, water, land, greenhouse gases or other emissions, protection of health, safety
and the environment, or transportation, marketing and sale of our products
• joint ventures and acquisitions and our ability to achieve expected synergies
• the recoverability of resources and unexpected geologic conditions
• incorrect estimates of reserves and related future cash flows and the inability to replace
reserves
• changes in business strategy
• PSC effects on production and unit production costs
• effect of stock price on costs associated with incentive compensation
• insufficient capital, including as a result of lender restrictions, unavailability of capital
markets or inability to attract potential investors
• effects of hedging transactions
• equipment, service or labor price inflation or unavailability
• availability or timing of, or conditions imposed on, permits and approvals
• lower-than-expected production, reserves or resources from development projects, joint
ventures or acquisitions, or higher-than-expected decline rates
• disruptions due to accidents, mechanical failures, transportation or storage constraints,
natural disasters, labor difficulties, cyber attacks or other catastrophic events
• factors discussed in “Item 1A – Risk Factors” in our Annual Report on Form 10-K
available on our website at crc.com.
Forward Looking / Cautionary Statements – Certain Terms
See the Investor Relations page at www.crc.com for important information about 3P reserves and other hydrocarbon resource quantities, PV-10 and standardized measure, finding and development
(F&D) costs, recycle ratio calculations, reserve replacement ratios, Value Creation Index (VCI), debt adjusted shares calculation, drilling locations and reconciliations of non-GAAP measures to the
closest GAAP equivalent.

Goldman Sachs Global Energy Conference 2020| 3
Positioned to Execute Our Strategy to Deliver Long-Term Value
Value
Focus
Value Creation Index
The VCI Difference Delivers Real Value
• Value-directed investments
• Disciplined capital allocation
• Enhanced returns over full-cycle time frame
• Drives team alignment
• CRC ahead of competitive landscape in shifting to valuePV10 pre-tax cash flows
PV10 of investmentsVCI =

Goldman Sachs Global Energy Conference 2020| 4
Strengthen
Balance SheetDrive Operational
Excellence
Ensure Effective
Capital Allocation
• Reinvest to grow cash
flow
• Simplify capital
structure
• Enhance credit metrics
• Pursue value-accretive
M&A
• Reduce absolute level of
debt
• Utilize VCI-based
decision making
• Optimize core operating
area investment
• Enhance targeted
growth area investment
• Pursue impactful
capital workovers
• Streamline processes
• Apply technology
• Leverage sizeable
infrastructure
• Drive strategic
consolidation
• Employ new thinking
and approaches
• Pursue value-driven
production growth
• Delineate future growth
areas
• Enhance already
substantial inventory
• Pursue strategic joint
ventures
Capture Value
of Portfolio
CRC’s Value-Driven Strategic Approach
Proven and pressure-tested strategic approach
preserved value through the downturn and is set to
drive significant value creation for years to come

Goldman Sachs Global Energy Conference 2020| 5
California’s Compelling Needs
• World’s 5th largest economy runs first and foremost on energy
▪ Consume more gasoline than countries with populations 4x
larger
▪ 37% of U.S. Port container traffic – with the busiest ports in
the country
• Operate in energy island importing 73% of crude
• Equates to sending $32 billion annually out of the state
• Energy inequality reflected in highest poverty rate in
wealthiest state
• Industry provides high-paying, middle class careers to achieve
American dream
• Imported energy does not apply California’s safety, labor and
environmental standards
• Native energy aligns with state’s progressive values
• In-state production provides critical sources of state, county
and city revenues
• Over $4.8 billion generated by CRC’s Long Beach operations
alone over past 15 years
• CRC constructively engaged on legislative front to solve
California’s challenges
• Believe thoughtful leadership will prevail as it has in the past
CRC supplies affordable,
reliable energy that
California needs

Goldman Sachs Global Energy Conference 2020| 6
Pressure Tested Through the Commodity Price Cycle and Focused on Long-Term Value
5
10
15
20
25
30
$20
$50
$80
$110
07/14 01/15 07/15 01/16 07/16 01/17 07/17 01/18 07/18 01/19 07/19 01/20
Rig
Co
un
t
Bre
nt
Cru
de
Oil P
rice
($
/B
BL)
Brent Crude Price
CRC + JV Rig Count
CRC Rig Count
TRANSITION TO OFFENSE
Cut rigs
Began hedging
Managed liabilities
Utilized existing facilities
Protected base production
QUICK
RESPONSE TO
PRICE CHANGE
Increased activity
Engaged in JVs
Locked in hedges
Increased liquidity
Extended maturities
Invest for value preservation
Drill high-graded portfolio
Invest in exploration and facilities
Strengthen balance sheet
Entered into JV with Alpine
VALUE
PRESERVATION
SEPARATION
ANNOUNCEMENT
Spin
Date

Goldman Sachs Global Energy Conference 2020| 7
Key Highlights
$278 Million$1.1 billion LTM
3rd
Qu
art
er
20
19
1 Includes all wells drilled by CRC, including BSP, MIRA and Alpine wells. Includes steam injectors and drilled but uncompleted wells, which would not be included in the SEC definition of wells drilled.2 Includes BSP, MIRA and Alpine capital.3 See the Investor Relations page at www.crc.com for a reconciliation to the closest GAAP measure and other important information.
$188 Million2
$117 million
internally funded
128 Mboe/d62% Oil
91 Total Wells Drilled1
Includes 35 internally
funded wells
$834 Million$1.1 billion LTM
$466 Million2
$345 million
internally funded
130 Mboe/d62% Oil
190 Total Wells Drilled1
Includes 114 internally
funded wells
Fir
st
9 M
on
ths 2
01
9 AC
TIV
ITY
PR
OD
UC
TIO
N
CA
PIT
AL
Ad
j.E
BIT
DA
X3

Goldman Sachs Global Energy Conference 2020| 8
- 5 10 15 20 25 30
Niobrara
Barnett
Anadarko - Woodford
Haynesville - Bossier
Utica
Marcellus Shale
Eagle Ford
Bakken
Permian (Wolfcamp + Sprayberry)
California
Remaining Recoverable Resources (BBOE1)
Oil (BBO) NGL (BBOE) Gas (BBOE)
CRC Advantage
World-Class Hydrocarbon Province with Significant Potential
• Five of the largest conventional, onshore fields in the lower 48
• Over 35 billion BOE produced since 1876
• Still discovering the limits of remaining potential
• Over 10 billion BOE1 in remaining recoverable resources
California a Top Oil Province
• Stacked pays provide additional opportunity through value chain
• Operating expertise to develop the diverse opportunity set
• Robust infrastructure turns disparate fields into integrated plays1MCF:BOE = 20:1
Note: produced volumes source: DOGGR; Remaining Recoverable Resources Source: USGS

Goldman Sachs Global Energy Conference 2020| 9
Proved Reserves
Large Resource Base with Production Diversity
SAN JOAQUIN BASIN
Greater Elk Hills – Flagship Asset
Thermal – Protecting Base Production
South Valley – New Opportunities
Shales & Tight Sands – New Opportunities
#2 Producer94,000 BOE/d2
27% of basin production
60% of basin mineral acreage
1 Based on gross production as of YE18. 2 CRC net production based on 3Q19. 3 Proved reserves at SEC18 pricing of $71.75 Brent / $3.10 NYMEX.
Note: Total basin production and CRC’s % of basin production are based on gross FY2018 production. Source: DOGGR. Total basin mineral acreage is based on internal estimates.
Largest Producer in California1
Operate
~12,000wells
with
712MMBOE3
SACRAMENTO BASINGas Optionality
#1 Producer 5,000 BOE/d2
86% of basin production
85% of basin mineral acreage
LOS ANGELES BASIN
Steady High Margin Oil Assets
#1 Producer 24,000 BOE/d2
43% of basin production
65% of basin mineral acreage
Across
135 fieldsVENTURA BASINGrowth and Exploration
#2 Producer5,000 BOE/d2
22% of basin production
90% of basin mineral acreage

Goldman Sachs Global Energy Conference 2020| 10
2018 Highlights
Enhanced Inventory Growth and Expanded 3P Position
• Proved reserves today only 7% lower despite 29%
decrease in price from the YE 2014
• Life-of-field studies increased unproved resources
• Recent exploration success not included
• Organic F&D costs excluding price related revisions
and acquisitions were $11.31 per BOE in 2018 and
4-year average of $6.42
• Organic recycle ratio of 1.9x in 2018 and 4-year
average of 2.6x
• Comprehensive technical review of 40% of fields
• Over 95% of total proved reserves audited by Ryder
Scott in the previous three years
1 See the Investor Relations page at www.crc.com for important information about 3P
reserves and other hydrocarbon quantities.2 Reserve amounts uneconomic at SEC prices for the applicable year.3 Unproved reserves (probable and possible) represent technical volumes irrespective of
commodity price. Proven reserves utilize applicable SEC prices for all year-end periods.
Growth in Unproved Reserves1
58 109 156 204
768 644 568618
712
222 251226
204
171
181431
450458
150
159
395
679
704
0
250
500
750
1,000
1,250
1,500
1,750
2,000
2,250
2,500
2014 2015 2016 2017 2018
MM
Bo
e
>250%
Unproved
Growth
Probable3Price-Contingent
Reserves2
ProvedCumulative
Production
Possible3

Goldman Sachs Global Energy Conference 2020| 11
Unlocking Value with a Deep Inventory of Actionable Projects at $65 Brent
• Fully burdened, growth-focused
portfolio
• Achieve a VCI of 1.3 or greater at
$65 Brent and $3.00 NYMEX
• Projects deliver robust cash flow
• Reflects all recovery
mechanisms and reserves types
• Leverage existing infrastructure,
while opportunistically targeting
new infrastructure investment
0
5
10
0 100 200 300 400 500 600 700 800
Dev
Cap
ital
($
B)
Net Resources2 (MMBoe)
1 Full cycle costs = operating costs + development costs +
facility costs + field-level G&A + taxes other than on income.2 See the Investor Relations page at www.crc.com for details
regarding net resources and other hydrocarbon resource
quantities.
0
10
20
30
40
50
0 100 200 300 400 500 600 700 800
Full
Cyc
le C
ost
1($
/Bo
e)
Net Resources2 (MMBoe)
Steamflood
Waterflood
Primary
Shale
Gas
Goldman Sachs Global Energy Conference 2020| 12
0
40
80
120
160
200
240
280
320
0
20
40
60
80
100
120
140
160
1Q17 2Q17 3Q17 4Q17 1Q18 2Q18 3Q18 4Q18 1Q19 2Q19 3Q19 4Q19E
Ca
pit
al ($
MM
)
Pro
du
cti
on
(M
BO
EP
D)
Oil NGL Gas Total Capital CRC Capital (Internally Funded)
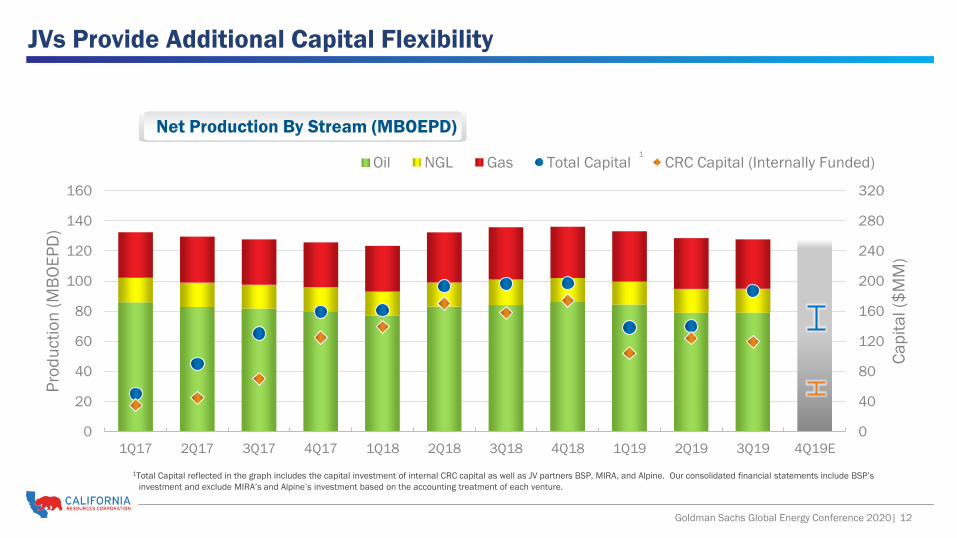
JVs Provide Additional Capital Flexibility
Net Production By Stream (MBOEPD)
1Total Capital reflected in the graph includes the capital investment of internal CRC capital as well as JV partners BSP, MIRA, and Alpine. Our consolidated financial statements include BSP’s
investment and exclude MIRA’s and Alpine’s investment based on the accounting treatment of each venture.
1

Goldman Sachs Global Energy Conference 2020| 13
Up to $250MM▪ Total of $200MM funded to date
Focus on three fields within the San
Joaquin Basin
▪ Kern Front, Mt. Poso, Pleito Ranch
Accelerating Value and Derisking Inventory through Development JVs
Up to $500MM
▪ Current commitment of $320MM, with
$63MM funded to date
Investor funds project capital in exchange
for a net profits interest (NPI) held through
a JV
▪ Investor preferred interest is redeemed
upon achieving target IRR
▪ CRC retains early termination options
Focus on the San Joaquin and
Los Angeles Basins
CRC operates all wells
Up to $300MM
▪ Current commitment of $140MM,
with $125MM funded to date
DrillCo-type structure where investor funds
100% of project capital for 90% working
interest (WI) in wells drilled, with CRC
carried on its 10% WI
▪ CRC interest increases to 75% upon investor
achieving target IRR
▪ CRC retains an acceleration option
CRC operates all wells
DrillCo-type structure where investor
funds 100% of project capital for 90% WI
in wells drilled, with CRC carried on its
10% WI
▪ CRC interest increases to 82.5% upon
investor achieving target IRR
Focus on portions of the Elk
Hills field within the San
Joaquin Basin
CRC operates all wells
April 2017Feb 2017 July 2019

Goldman Sachs Global Energy Conference 2020| 14
JV
35%
Core
33%
Growth
6%
Workover
8%
Facilities
13%
Exploration
2%
Other
3%
San Joaquin,
~75%
Los Angeles,
~20%
Sacramento and Ventura,
~5%
Disciplined Capital Plan Leverages Project Portfolio
2019 Internally Funded
Capital Program
$385 to $400 Million
Discretionary Cash Flow
Expect to Remain within
Core Properties
JV Capital
$200 to $225 Million to invest in Core and Growth properties
Buena Vista | Elk Hills
Wilmington
Kern Front | Mount Poso
2019E Internally Funded
Development Capital By Basin2019E Total Capital
1Other includes corporate, maintenance and occupational health, safety and environmental projects, seismic and other investments.

Goldman Sachs Global Energy Conference 2020| 15
50%
Growth
Projects
50%
Mature
Projects
25%
Growth
Projects
75%
Mature
Projects
10%
Growth
Projects
90%
Mature
Projects
Low-Price Scenario
• Invest to grow cash flow
• Drill in high-graded portfolio (>1.5 VCI)
▪ Oil to gas ratio for steamfloods (>5:1) - Selectively add steam
generation facilities
▪ EOR and IOR for long-term cash flow - Primary/shale for high IP impact
• Delineate future growth areas to unlock upside
• Target 10-15% of discretionary cash flow to balance sheet strengthening
Dynamic Capital Allocation Through Commodity CycleO
il P
rice
$/
BB
L
Gas Price $/MCF
High-Price Scenario
Mid-Cycle Price Scenario
• Invest to accelerate production growth and explore/pilot new resources
• Add facilities (steam and water handling) to support pace of growth
• High cash generation
• VCI 1.3 floor to reinvest for value
• Accelerate balance sheet strengthening
• Invest to protect base production
• Take advantage of existing facilities and prior capacity investments
▪ Steamfloods and waterfloods – drill to fill
▪ Workover existing wellbores for best investment
• Utilize excess equipment to reduce capital costs
• Engineering efforts focused on field surveillance to protect existing production

Goldman Sachs Global Energy Conference 2020| 16
CRC’s Dynamic Portfolio Provides Flexibility
0
200
400
600
800
BO
EP
D
YEAR 50
200
400
600
800
BO
EP
D
YEAR 5
0
200
400
600
800
BO
EP
D
YEAR 5
0%
25%
50%
75%
100%
Po
rtfo
lio
Mix
Gas
Shale
Primary
Waterflood
Steamflood
Workover
Oil Oil Oil
For illustration of portfolio optionality based on normalized results per $10MM of investment and not guidance. See end note for details on type curves.
Prices for recycle ratio are $65 Brent and $3.00 NYMEX.
Goldman Sachs Global Energy Conference 2020| 17
$69.50
$58.81 $54.90
$59.82 $56.45
$63.63 $59.97
$65.28
$70.66 $68.41
$75.97
$68.08
$63.90 $68.32
$62.00
40
50
60
70
80
3Q18 4Q18 1Q19 2Q19 3Q19
$/B
bl
WTI Realizations Brent
-≈
66%74%
77%
47%
42%
60%64%
67%
41% 38%30%
40%
50%
60%
70%
80%
3Q18 4Q18 1Q19 2Q19 3Q19
% o
f W
TI
& B
ren
t
WTI Brent
-
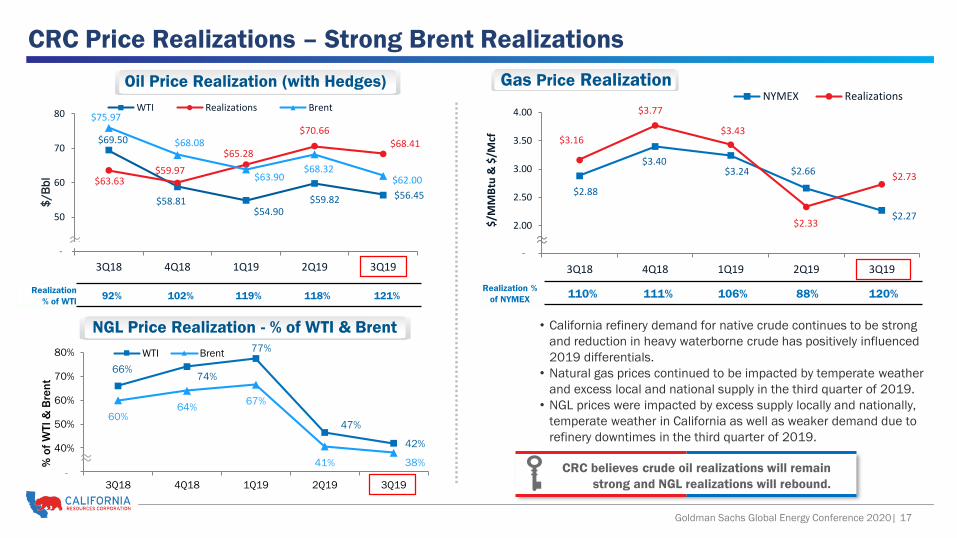
≈CRC believes crude oil realizations will remain
strong and NGL realizations will rebound.
CRC Price Realizations – Strong Brent Realizations
Oil Price Realization (with Hedges) Gas Price Realization
• California refinery demand for native crude continues to be strong
and reduction in heavy waterborne crude has positively influenced
2019 differentials.
• Natural gas prices continued to be impacted by temperate weather
and excess local and national supply in the third quarter of 2019.
• NGL prices were impacted by excess supply locally and nationally,
temperate weather in California as well as weaker demand due to
refinery downtimes in the third quarter of 2019.
NGL Price Realization - % of WTI & Brent
Realization
% of WTI92% 102% 119% 118% 121%
$2.88
$3.40 $3.24 $2.66
$2.27
$3.16
$3.77
$3.43
$2.33
$2.73
1.50
2.00
2.50
3.00
3.50
4.00
3Q18 4Q18 1Q19 2Q19 3Q19
$/M
MB
tu &
$/M
cf
NYMEX Realizations
≈
Realization %
of NYMEX110% 111% 106% 88% 120%
-

Goldman Sachs Global Energy Conference 2020| 18
Unparalleled California Expertise and Insight
Core Assets Provide Operational Leverage
Applying analog development to adjacent fields
Decadesof observed field behavior and demonstrated shallow base decline rates
Largest 3-D Seismic
Position in California
Sources: DOGGR, Wood Mackenzie, Company Estimates. Note: Gross production data is average production in 2018.
142
120 119
2821
-
50
100
150
CRC Chevron
USA
Aera
Energy
Sentinel
Peak
Berry
DO
GG
R R
ep
ort
ed
MB
OE
/d
Top California Producers in 2018
$19$21
$24$22
$0
$5
$10
$15
$20
$25
$30
0%
25%
50%
75%
100%
CRC Chevron
USA
Aera
Energy
Berry
OP
EX
$/B
OE
Pro
du
cti
on
Mix
Shallow Deeper (>5,000') FY2018 OPEX $/BOE
Majority of CA Production is Shallow
Extensive Field Operations Experience
~ 25,000net identified proven and unproved
drilling locations in 2018
Midstream infrastructure provides low cost advantage

Goldman Sachs Global Energy Conference 2020| 19
Elk Hills Flagship Asset in San Joaquin Basin
• Large field with 100% NRI
▪ 10 billion original BOE in place within multiple reservoirs
▪ Produces ~60,000 BOE/d with annual 10% base decline
• Infrastructure provides low-cost advantage
▪ On-site gas processing and liquids extraction
▪ Large power plant reduces electricity costs by 75%
▪ Various light crude blends desired by multiple
customers
• Large integrated business
▪ Stacked reservoirs with 280+ MMBOE proven reserves
▪ Diverse development inventory
▪ Proving ground for recovery techniques
Annualized Elk Hills synergies1 ($MM)
1Synergies include operational cost savings and revenue enhancement

Goldman Sachs Global Energy Conference 2020| 20
Leveraging Infrastructure for Nearby Low-Cost Field Development
• Coring up with Elk Hills
▪ Elk Hills serves as the hub
▪ Power, pipelines, compression
▪ Connecting fields and building out
• Lower cost shared resources
▪ Central control facilities and automation
▪ Optimized service provider utilization
▪ Shared support staff across fields
• Efficient step-out to new growth areas
▪ Dominant acreage position
▪ Low development costs for bolt-ons
▪ Discovering new resources through exploration
Southern San Joaquin Valley Consolidation
1 3P approximate totals: 380 MMBOE proved, 280 MMBOE probable, 250 MMBOE possible
~900 Million BOE of 3P reserves1

Goldman Sachs Global Energy Conference 2020| 21
Developing Entire Southern San Joaquin Basin into Core Area
• Redevelopment, expansion and additional recovery in existing CRC operated fields
▪ Large fields with low recovery factors
▪ >500 identified development locations
▪ >150 MMBOE potential 3P reserves1
• New field development project following recent exploration successes: Pleito Ranch
▪ Extension of CRC operated Pleito Ranch field
▪ >90 identified development locations
▪ >30 MMBOE discovered resources1
• Delivering value-driven growth
▪ Apply technology, operating expertise and knowledge
▪ Improved returns from leveraging existing infrastructure
▪ Disciplined and deliberate investment into high graded portfolio
Large Inventory of Development Projects
1See the Investor Relations page at www.crc.com for important information regarding potential reserves, discovered resources and other hydrocarbon resources.
Applying CRC asset playbook to substantial
drilling inventory extends core Elk Hills
operations and infrastructure
Field AreaOriginal MMBOE
in PlaceRecovery
FactorProjects
Yowlumne 900 13%Workover, primary drilling,
new reservoirs and EOR
Paloma 1,000 14% Workover, primary drilling and EOR
Coles Levee 1,300 21% Workover, primary drilling and EOR
Rio Viejo 60 16% Primary drilling, new reservoirs
Landslide 70 23% Workover, primary drilling and EOR
TOTAL 3,300 18%

Goldman Sachs Global Energy Conference 2020| 22
Conventional Exploration Program Generates Substantial Value
• 10 well exploration program in 2017 and 2018
▪ Delineation and expansion of proven play trends
plus new impact play concepts
• Reduced risk via joint ventures
▪ 7 exploration wells funded by partners1; CRC total
initial net investment of ~$20MM
• Meaningful value creation
▪ ~$4/share value, potential to increase further
with additional appraisal
1 Partner WI funding varied by well; 2 $65 Brent and $3/NYMEX; 3 Net P50 PV10 = Sum [P50 type curve PV10 x NRI] for development locations; 4 VCI = [Net P50 PV10 pre-tax cash flows] / [PV10 exploration and development capital]
Multiple Small
Joint Ventures
$170+MM2,3 PV10 from
Initial Net Investment
of ~$20MM
Fully-Burdened
VCI of 1.52,4Repeatable recipe for success
provided by analog prospects in
CRC’s differentiated inventory

Goldman Sachs Global Energy Conference 2020| 23
Strengthening the Balance Sheet Remains a Priority
Target 2x – 3x Leverage Ratio
0.0x
1.0x
2.0x
3.0x
4.0x
5.0x
6.0x
7.0x
8.0x
9.0x
YE14 YE15 YE16 YE17 YE18 Target
To
tal D
eb
t / L
TM
Ad
j. E
BIT
DA
X1
Leverage
Complicated
Capital Structure
Simplified
Capital Structure
Simple
Capital Structure
1See the Investor Relations page at www.crc.com for a reconciliation to the closest GAAP measure and other
important information.
Capital MarketsSolutions
Disciplined Capital
Investment
Asset Monetizations
Joint ventures
Infrastructure
Producing
assets
Refinance and
simplify
capital
structure
Target 10-15% of
discretionary
cash flow for
balance sheet
strengthening2
Accretive
acquisitions Cash flow growth
and support future
reinvestment
Continue to Employ
ALL of the ABOVE Approach
Mineral
interests

Goldman Sachs Global Energy Conference 2020| 24
Current Enterprise Value Deeply Discounted
1-5 See endnotes in the Appendix. See the Investor Relations page at www.crc.com for important information about 3P reserves and other hydrocarbon quantities.
PD1
PUD1
Unproved4
Surface and Minerals3
Infrastructure and Other2
0 1
0
5
10
15
20
25
$55 Brent $65 Brent $75 Brent
Va
lue
($
B)
Current EV
of $6.3 Bn5

Goldman Sachs Global Energy Conference 2020| 25
Disciplined Execution on Highest Value Projects to Deliver Substantial Value
Portfolio of world-class assets investable
throughout the commodity cycle
Robust inventory of high
value growth projects
Deep operational knowledge
and technical expertise
Integrated and complementary
infrastructure
Disciplined and effective
capital allocation
Balance Sheet Goals
High VCI Projects
Investing for the Future
Growth Prospects
Core Operating Areas
Simplify Balance Sheet
Reduce Fixed Charges
Reduce Debt
Balance capital investment with
Financial
Strengthening Effortsfor best long-term value creation
VALUE DRIVEN

APPENDIX

Goldman Sachs Global Energy Conference 2020| 27
Barrels per Day 35,000 30,000 15,000 10,000 5,000
Weighted Average
Price per Barrel$75.71 $70.83 $68.33 $65.00 $65.00
Barrels per Day 35,000 30,000 15,000 10,000 5,000
Weighted Average
Price per Barrel$60.00 $56.67 $55.00 $55.00 $55.00
Barrels per Day - - 5,0001
- -
Weighted Average
Price per Barrel- - $70.05 - -
Percentage Hedged Against 3Q19
Oil Production44% 38% 25% 13% 6%
Opportunistically Built Oil Hedge Portfolio
Strategy
• Protect cash flow, operating
margins and capital
investment program
• Hedge program targets up to
50% of crude oil production
Hedge program preserves
significant upside exposure to
commodity price movement
Note: The BSP JV entered into crude oil derivatives that are included in our consolidated results but not in the
above table. For further information please see Attachment 8 of our Q3 2019 Earnings Release.
Sold Calls
Sold Puts
Purchased
Calls
Swaps
1Counterparties have the option to increase swap volumes by up to 5,000 barrels per day at a weighted-average Brent price of $70.05 for the second quarter of 2020.
4Q19 1Q20 2Q20 3Q20 4Q20
Sold Puts
Purchased
Puts
Swaps
Goldman Sachs Global Energy Conference 2020| 28
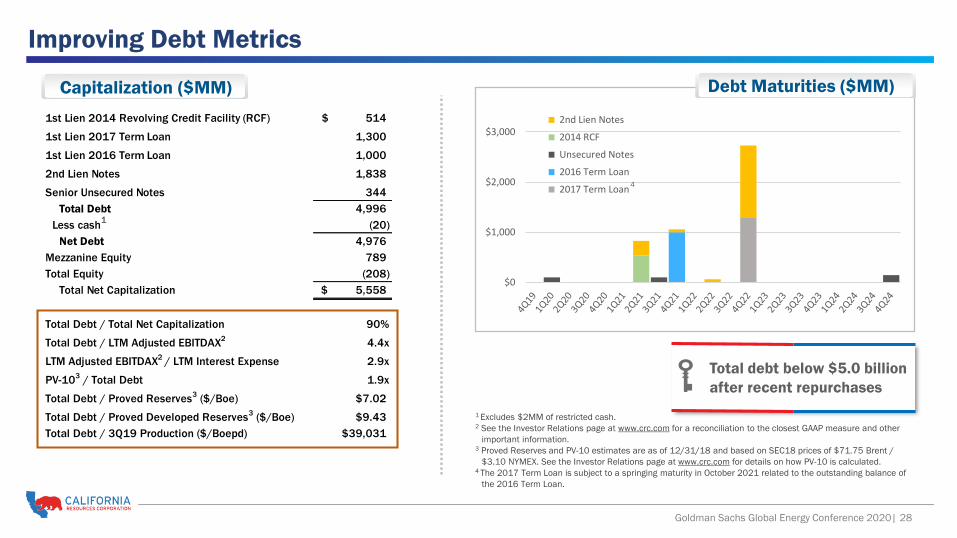
Improving Debt Metrics
1st Lien 2014 Revolving Credit Facility (RCF) 514$
1st Lien 2017 Term Loan 1,300
1st Lien 2016 Term Loan 1,000
2nd Lien Notes 1,838
Senior Unsecured Notes 344
Total Debt 4,996
Less cash (20)
Net Debt 4,976
Mezzanine Equity 789
Total Equity (208)
Total Net Capitalization 5,558$
Total Debt / Total Net Capitalization 90%
Total Debt / LTM Adjusted EBITDAX2
4.4x
LTM Adjusted EBITDAX2
/ LTM Interest Expense 2.9x
PV-103 / Total Debt 1.9x
Total Debt / Proved Reserves3 ($/Boe) $7.02
Total Debt / Proved Developed Reserves3 ($/Boe) $9.43
Total Debt / 3Q19 Production ($/Boepd) $39,031
Capitalization ($MM)
1 Excludes $2MM of restricted cash.2 See the Investor Relations page at www.crc.com for a reconciliation to the closest GAAP measure and other
important information.3 Proved Reserves and PV-10 estimates are as of 12/31/18 and based on SEC18 prices of $71.75 Brent /
$3.10 NYMEX. See the Investor Relations page at www.crc.com for details on how PV-10 is calculated.4 The 2017 Term Loan is subject to a springing maturity in October 2021 related to the outstanding balance of
the 2016 Term Loan.
Debt Maturities ($MM)
1
$0
$1,000
$2,000
$3,000 2nd Lien Notes
2014 RCF
Unsecured Notes
2016 Term Loan
2017 Term Loan4
Total debt below $5.0 billion
after recent repurchases

Goldman Sachs Global Energy Conference 2020| 29
CRC’s BOE Recovery per Foot Competes With Major Shale Plays
Normalizing estimated ultimate recovery (EUR) vs. measured depth shows CRC advantage:
• Better recovery factors driven by low decline rate waterfloods and steamfloods
• Diverse reservoir portfolio provides optionality to drill deep large EUR producers with later life up-hole recompletions
Historical focus:
• Cheaper, simpler well designs (primarily vertical)
• Quality reservoirs that do not require complicated completions or long horizontal
Future upside:
• Tighter rock, horizontal drilling with new generation stimulation, increasing reservoir contact
We
ll T
ota
l M
ea
su
red
De
pth
(ft
)
21,000’
17,000’
6,000’
13,000’
14,000’
BOE/ft
BV Nose
South
Valley
LA Basin
Notes:
Source: Wood Mackenzie data for Shale Play areas; Source: Internal estimates for CRC, taking all wells drilled since 2012. BOE calculated as Oil + 20:1 Gas.
Well dots sized by oil expected ultimate recovery (MMBOE). Darker colors are newer wells; lighter colors are older wells.
Wolfcamp includes Midland and Delaware Basins.

Goldman Sachs Global Energy Conference 2020| 30
250
500
1000
$600
$700
$800
$900
$1,000
$1,100
$1,200
$20 $40 $60 $80 $100 $120P
rod
ucti
on
Co
sts
($
MM
)Brent $/Bbl
Annual Production Costs & Capital Investment1
Demonstrated Experience Controlling Production Costs Through Price Cycle
• Capital investment scales with
commodity price changes
• Flexible operations and shallow base
decline allow for quick response to
commodity price changes while
preserving value
• Consistently controlled production
costs throughout price cycles
• Production costs have been as low as
approximately $15/boe when
commodity prices reached a relative
low point
2014
(Pre-spin)2015
2016
20172018
1Includes JV Capital.
Capital Investment
Scale ($MM)
1
1

Goldman Sachs Global Energy Conference 2020| 31
CRC’s Natural Gas Liquids Marketing
CRC’s NGLs trend with national prices, but trade at a
premium due to market conditions in California and
isolation from the larger national market.
• Approximately half sold locally and half exported
to Mexico
• Dynamically adjust market mix to achieve
highest net realization
• 100% sold in the California market
Infrastructure connected to multiple processing
facilities
• California is a premium market for butane
• 100% sold in the California market
• Minimize transportation costs and maximize net
realization
• CRC is the largest NGLs producer in California
Approximately 16,000 bpd
• Breakdown of CRC’s NGLs production:
1Proxy peers with reported NGLs include: CRZO, FANG, GPOR, LPI, PDCE, PE, QEP, RRC, SM, SWN, WLL,
WPX, XEC. All prices, including CRC’s, are unhedged and current as reported in 2018 10-K and 1Q19,
2Q19 and 3Q19 10-Q filings.
NG
L R
ea
lize
d P
rice
pe
r B
arr
el ($
/b
bl)
CR
C's
% P
rem
ium
Ove
r P
roxy
Pe
ers
53%Propane
33%Butane
14%Natural
Gasoline
0%
20%
40%
60%
80%
100%
120%
140%
160%
180%
$0
$5
$10
$15
$20
$25
$30
$35
$40
$45
$50
2016 2017 2018 1Q19 2Q19 3Q19
CRC Average of Proxy Peers Premium % Over Proxy Peers' Avg

Goldman Sachs Global Energy Conference 2020| 32
Advancing California’s Sustainability Strategy
WATERIncrease volume of recycled
produced water by 30%
Progress: 17% increase through 2018
METHANEReduce methane emissions
by 50%
Progress: Surpassed Target with 60%
reduction through 2018
Note: CRC 2030 Sustainability Goals are subject to liquidity, securing funding and permits
RENEWABLESIntegrate renewables into oil and gas
operations by adding 10 MW
Progress: 4 MW of solar in development
CARBONDesign and permit carbon capture
system at Elk Hills by 2030 to
reduce CO2 emissions by 30%
Progress: Miscible ethane gas pilot installed
and carbon capture technology evaluation
underway
CRC’s 2030 Goals demonstrate our long-term commitment to sustainable in-state energy production that meets the needs of
California’s growing population and California’s leading safety, labor, human rights and environmental standards.
Measured against a 2013 baseline, the year before CRC’s formation and a baseline for several state goals.

Goldman Sachs Global Energy Conference 2020| 33
-
1,000.00
2,000.00
3,000.00
4,000.00
5,000.00
6,000.00
7,000.00
1 5 9 13 17 21 25 29 33 37 41 45 49 53 57 61 65 69 73 77 81 85 89 93 97 101105109113117JV Share Typical E&P Share
Typical Industry JV Structure
• Based on recent industry JV deals, a typical deal structure is
o Partner pays 80-100% Capital
o Receives 80-100% Working Interest
o Typical hurdle rate:o 10% - 20% IRR
o Partner’s working interest once hurdle rate is achieved:o 5% - 25%
Hurdle Rate
Reached
Pro
du
cti
on
Time

Goldman Sachs Global Energy Conference 2020| 34
Lost Hills Field – 50% Operated Working Interest Sale + Joint Venture
• Completed a sale of operatorship and a 50% working interest in certain zones in the Lost Hills field
• Over $200 MM in total consideration consisting of $168 MM in cash + drilling carry with estimated minimum value of $35 MM
• Implied transaction metrics (assuming minimum carry):
• ~$88,000 per flowing barrel
• Other transaction highlights:
• Partner will carry CRC on 100% of the investment in 200 new wells
• Operatorship is transferred to buyer
• CRC retains rights to deep formations
• Closed May 1, 2019
• Lost Hills is a heavy oil field in the northwestern San Joaquin basin
Map to be updated
Proposed Patterns
Proposed Tulare Producer
Elk Hills
Buena Vista
Lost Hills
Kern
Front

Goldman Sachs Global Energy Conference 2020| 35
End Notes
From Slide 24
1 CRC estimate of reserves value as of December 31, 2018. Includes field-level operating expenses, G&A and taxes other than on
income. Assumes $3.00/MMBTU NYMEX in all cases.
2 Reflects the value of facilities and midstream assets, excluding assets owned by the Ares JV, at 50% of estimated replacement value.
This discount is estimated to exceed the burden on reserves that would be incurred if assets were monetized. Does not include value
of extensive seismic library.
3 Surface & Mineral reflects the estimated value of undeveloped surface and mineral acreage held in fee.
4 Unproved reserves are comprised of risked probable and possible reserves as of December 31, 2018.
5 Calculated using September 30, 2019 debt at par and a market cap as of 12/27/2019. Includes non-controlling interests reported
as mezzanine and permanent equity as of September 30, 2019.
See the Investor Relations page at www.crc.com for important information about 3P reserves and other hydrocarbon resource quantities,
PV-10 and standardized measure, finding and development (F&D) costs, recycle ratio calculations, reserve replacement ratios, Value
Creation Index (VCI), debt adjusted shares calculation, drilling locations and reconciliations of non-GAAP measures to the closest GAAP
equivalent.
Type Curve Note: Each field-specific type well curve represents an average of the historical results of multiple projects over the prior four-
year time period. Drive mechanism type curves are the weighted average of the field-specific curves related to the projects chosen for our
near-term growth plan. Type curves represent management’s estimates of future results and are subject to project selection and other
variables. Our type well curves are prepared for purposes of modeling overall results of our near-term growth program and are not useful
for purpose of benchmarking any individual well/pattern performance. Actual results are expected to vary depending on which projects
are specifically developed.