Embed Size (px)
Citation preview

Governm
ent of West B
engal Report N
o. 2 of the year 2018
Ó�COMPTROLLER AND AUDITOR GENERAL OF INDIA
www.cag.gov.in
agwb.cag.gov.in
Report of theComptroller and Auditor General of India
onPublic Sector Undertakings
for the year ended 31 March 2017
Government of West BengalReport No. 2 of the year 2018
Printed at Saraswaty Press Limited
Report of theComptroller and Auditor General of India
on
Public Sector Undertakingsfor the year ended 31 March 2017
Government of West BengalReport No. 2 of the year 2018

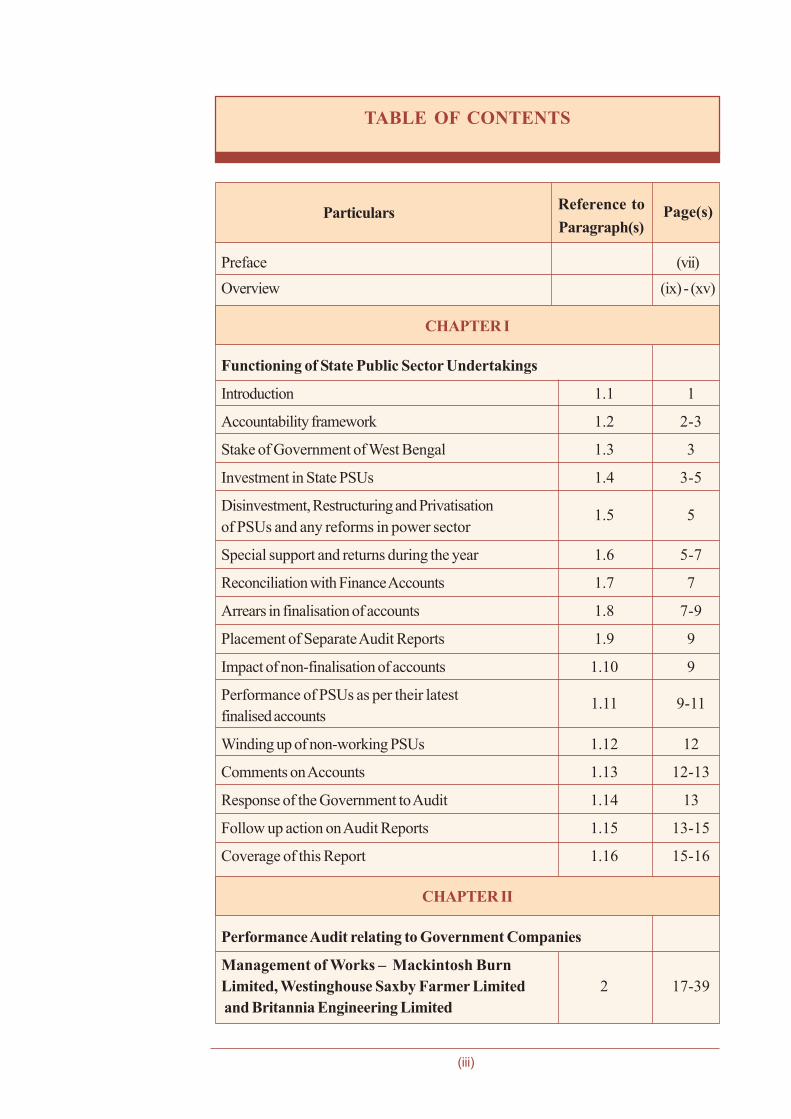
TABLE OF CONTENTS
Particulars Reference to Page(s)Paragraph(s)
Preface (vii)Overview (ix) - (xv)
CHAPTER I
Functioning of State Public Sector Undertakings
Introduction 1.1 1
Accountability framework 1.2 2-3
Stake of Government of West Bengal 1.3 3
Investment in State PSUs 1.4 3-5
Disinvestment, Restructuring and Privatisation 1.5 5of PSUs and any reforms in power sector
Special support and returns during the year 1.6 5-7
Reconciliation with Finance Accounts 1.7 7
Arrears in finalisation of accounts 1.8 7-9
Placement of Separate Audit Reports 1.9 9
Impact of non-finalisation of accounts 1.10 9
Performance of PSUs as per their latest 1.11 9-11finalised accounts
Winding up of non-working PSUs 1.12 12
Comments on Accounts 1.13 12-13
Response of the Government to Audit 1.14 13
Follow up action on Audit Reports 1.15 13-15
Coverage of this Report 1.16 15-16
CHAPTER II
Performance Audit relating to Government Companies
Management of Works – Mackintosh BurnLimited, Westinghouse Saxby Farmer Limited 2 17-39and Britannia Engineering Limited
(iii)
(iv)
Audit Report (PSUs) for the year ended 31 March 2017
Particulars Reference to Page(s)Paragraph(s)
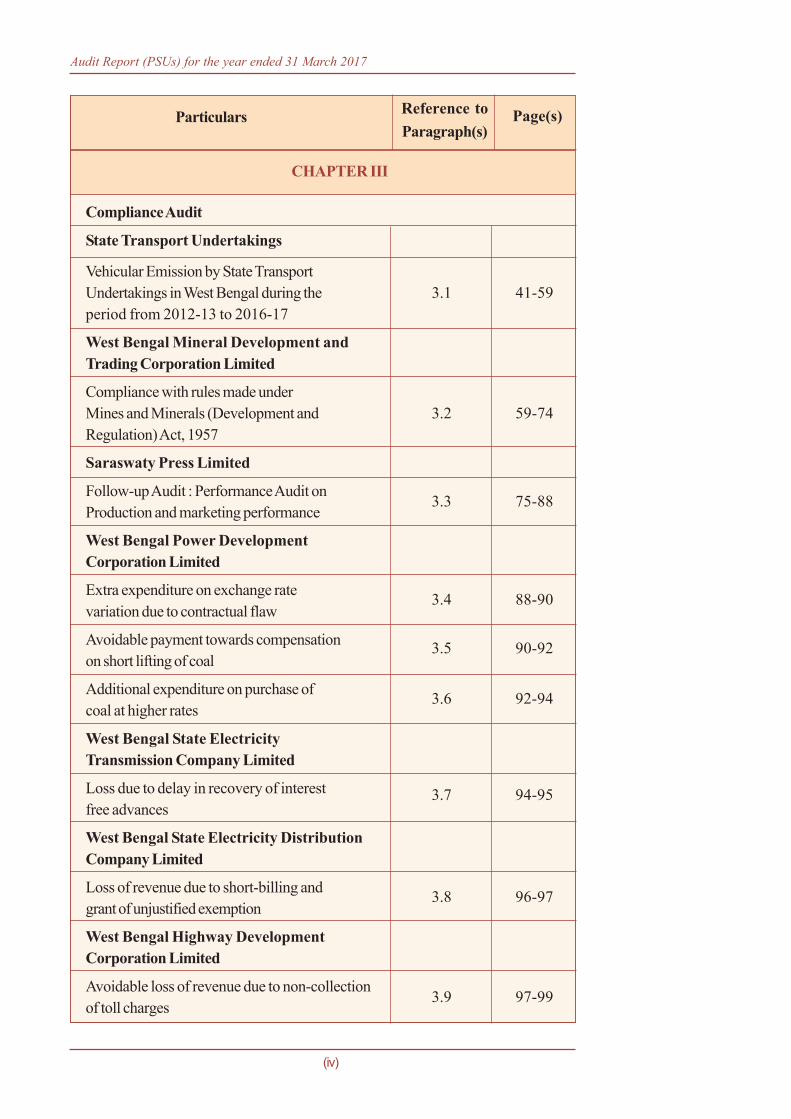
CHAPTER III
Compliance Audit
State Transport Undertakings
Vehicular Emission by State TransportUndertakings in West Bengal during the 3.1 41-59period from 2012-13 to 2016-17
West Bengal Mineral Development andTrading Corporation Limited
Compliance with rules made underMines and Minerals (Development and 3.2 59-74Regulation) Act, 1957
Saraswaty Press Limited
Follow-up Audit : Performance Audit on 3.3 75-88Production and marketing performance
West Bengal Power DevelopmentCorporation Limited
Extra expenditure on exchange rate 3.4 88-90variation due to contractual flaw
Avoidable payment towards compensation 3.5 90-92on short lifting of coal
Additional expenditure on purchase of 3.6 92-94coal at higher rates
West Bengal State ElectricityTransmission Company Limited
Loss due to delay in recovery of interest 3.7 94-95free advances
West Bengal State Electricity DistributionCompany Limited
Loss of revenue due to short-billing and 3.8 96-97grant of unjustified exemption
West Bengal Highway DevelopmentCorporation Limited
Avoidable loss of revenue due to non-collection3.9 97-99
of toll charges
(v)
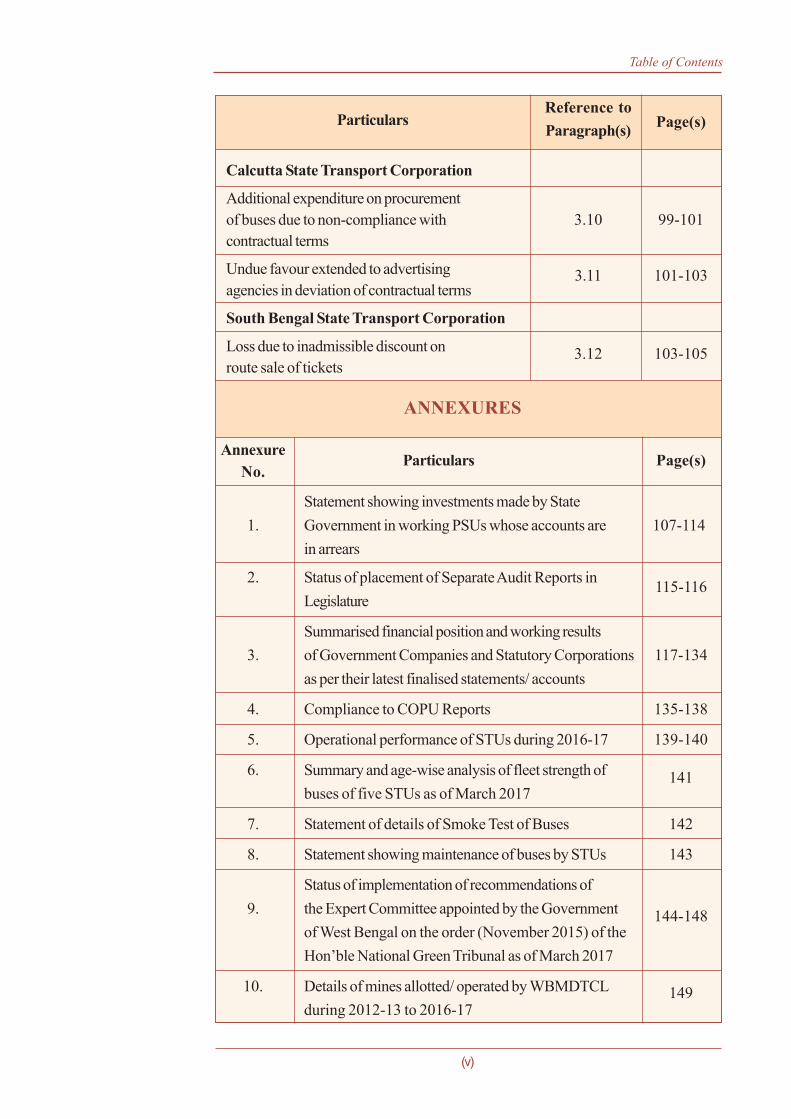
Table of Contents
ParticularsReference to
Page(s)Paragraph(s)
Calcutta State Transport Corporation
Additional expenditure on procurementof buses due to non-compliance with 3.10 99-101contractual terms
Undue favour extended to advertising 3.11 101-103agencies in deviation of contractual terms
South Bengal State Transport Corporation
Loss due to inadmissible discount on 3.12 103-105route sale of tickets
ANNEXURES
Annexure Particulars Page(s)No.
Statement showing investments made by State1. Government in working PSUs whose accounts are 107-114
in arrears
2. Status of placement of Separate Audit Reports in 115-116Legislature
Summarised financial position and working results3. of Government Companies and Statutory Corporations 117-134
as per their latest finalised statements/ accounts
4. Compliance to COPU Reports 135-138
5. Operational performance of STUs during 2016-17 139-140
6. Summary and age-wise analysis of fleet strength of 141buses of five STUs as of March 2017
7. Statement of details of Smoke Test of Buses 142
8. Statement showing maintenance of buses by STUs 143
Status of implementation of recommendations of9. the Expert Committee appointed by the Government 144-148
of West Bengal on the order (November 2015) of theHon’ble National Green Tribunal as of March 2017
10. Details of mines allotted/ operated by WBMDTCL 149during 2012-13 to 2016-17
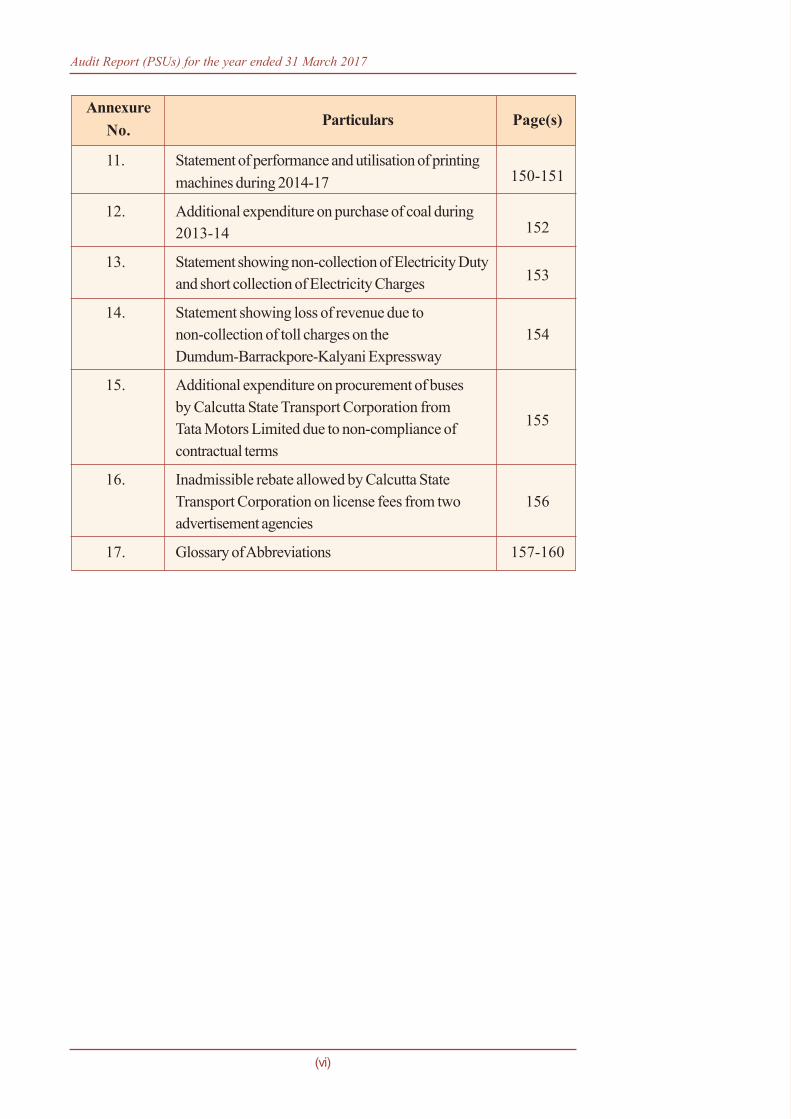
AnnexureParticulars Page(s)No.
11. Statement of performance and utilisation of printingmachines during 2014-17 150-151
12. Additional expenditure on purchase of coal during2013-14 152
13. Statement showing non-collection of Electricity Dutyand short collection of Electricity Charges 153
14. Statement showing loss of revenue due tonon-collection of toll charges on the 154Dumdum-Barrackpore-Kalyani Expressway
15. Additional expenditure on procurement of busesby Calcutta State Transport Corporation fromTata Motors Limited due to non-compliance of 155
contractual terms
16. Inadmissible rebate allowed by Calcutta StateTransport Corporation on license fees from two 156advertisement agencies
17. Glossary of Abbreviations 157-160
(vi)
Audit Report (PSUs) for the year ended 31 March 2017
(vii)
PREFACE
This report deals with results of audit of Government Companies and StatutoryCorporations for the year ended March 2017.
The accounts of the Government Companies (including companies deemed tobe government companies as per the provisions of the Companies Act) areaudited by the Comptroller and Auditor General of India (CAG) under theprovisions of Section 619 of the Companies Act 1956 and Section 139 and143 of the Companies Act 2013. The accounts certified by the StatutoryAuditors (Chartered Accountants) appointed by the CAG under the CompaniesAct are subject to supplementary audit by officers of the CAG and the CAGgives his comments or supplements the reports of the Statutory Auditors. Inaddition, these companies are also subject to test audit by the CAG.
Reports in relation to the accounts of a Government Company or StatutoryCorporation are submitted to the Government of West Bengal by CAG forlaying before the State Legislature under the provisions of Section 19-A of theComptroller and Auditor General’s (Duties, Powers and Conditions of Service)Act, 1971.
Under the provisions of the related Acts establishing the Statutory Corporations,CAG is the sole auditor for seven Statutory Corporations in the state.
The instances mentioned in this Report are those, which came to notice incourse of test audit for the period 2016-17, as well as those, which came tonotice in earlier years, but could not be reported in previous Audit Reports.Matters relating to the period subsequent to 2016-17 have also been included,wherever necessary.
Audit has been conducted in conformity with the Auditing Standards issued bythe Comptroller and Auditor General of India.


OVERVIEW

1 West Bengal Dairy and Poultry Development Corporation Limited incurred loss of` 26,611.12 only in 2016-17.
(ix)
OVERVIEW
1. Functioning of State Public Sector Undertakings
As on 31 March 2017, there were 92 State Public Sector Undertakings (PSUs) in WestBengal which comprised of 73 working PSUs (including nine Statutory Corporations) and19 non-working PSUs (including one Statutory Corporation). During 2016-17, the workingPSUs registered a turnover of ̀ 35,271.91 crore which was equal to 2.82 per cent ofGross State Domestic Product (GSDP). Further, the total turnover was 89.42 per centof the aggregate investment (` 39,443.37 crore) in these working PSUs. They hademployed 0.47 lakh employees as of March 2017. The return on equity of the workingPSUs stood negative at 1.77 per cent.
(Paragraph 1.1)
Investments in PSUs
As on 31 March 2017, total investment of the Government in 92 PSUs was` 40,611.43 crore. Power sector accounted for 72.40 per cent of total investment in2016-17. During 2016-17, State Government provided financial support of` 3,894.34 crore to PSUs towards equity, loans and grants/ subsidies.
(Paragraphs 1.4 and 1.6)
Arrears in finalisation of accounts
The Companies Act 2013 applicable Acts require PSUs to finalise their accounts, getthem audited and presented to the Legislature in a time-bound manner. The StateGovernment appoints the Chief Executive and Directors to the Board, who then areresponsible for preparation of the PSUs’ accounts. The accounts of 40 working PSUswere in arrears for periods ranging from one to nine years. Hence, the managementhad failed in this responsibility. There were 19 non-working PSUs of which 13 PSUshad arrears of accounts for one to 11 years.
(Paragraph 1.8 )
Performance of PSUs
Out of 73 working PSUs, only 33 PSUs prepared accounts for 2016-17 as ofSeptember 2017. During 2016-17, 21 PSUs earned profit of ̀ 621.59 crore, 11 PSUsincurred loss of ` 665.34 crore and one1 PSU incurred nominal loss. The totalaccumulated losses of 30 out of 73 working PSUs was ̀ 9,026.60 crore that exceededtheir paid-up capital of ̀ 1,717.68 crore.
(Paragraph 1.11)

(x)
Follow up actions on Audit Reports
Audit Reports were not being laid before the Legislature in a timely manner as AuditReports pertaining to the years 2011-12 and 2012-13 were laid together in July 2014.Similarly, Audit Reports of 2013-14 and 2014-15 were laid together in July 2016.The pattern indicates that the State Government had reduced the laying of Audit Reportsto a biennial exercise. This goes against constitutional and statutory obligations of theState Government.
(Paragraph 1.15)
2. Performance Audit relating to Government Companies
Management of works by three PSUs
Introduction
Mackintosh Burn Limited (MBL), Westinghouse Saxby Farmer Limited (WSFL) andBritannia Engineering Limited (BEL) are three PSUs (PSUs) under the Public WorksDepartment (PWD), Government of West Bengal (GoWB). These three PSUs plan,manage and execute construction works across the state, predominantly in the publicsector. All the recommendations made in the Performance Audit, were accepted bythe Government in December 2017.
Lack of due diligence in preparing estimates and framing terms and conditionsof contracts
• PWD guidelines were not followed for preparing estimates for formulating bids totenders. This led to loss of ̀ 5.11 crore.
• BEL did not include defect liability period in the agreements for 15 works. Thiswas in violation of the PWD guidelines. Similarly, specification of machinery to beprovided at site was not mentioned in 15 sub-contracts of MBL and BEL.
• Time schedule for taking over the completed works were to be included in28 agreements formed by BEL and WSFL. However, no schedules were includedin these agreements. Thirteen completed works were yet to be taken over byclients. This led to undue extension in defect liability period.
(Paragraph 2.8)
Execution of works
• The PSUs completed only eight to 33 per cent of works within schedule, remainingworks were either completed with delays or were yet to be completed. In respectof 86 works completed beyond schedule, the clients had not released the paymentof ̀ 62.44 crore.
Audit Report (PSUs) for the year ended 31 March 2017
• Works valued at ̀ 911.49 crore were behind schedule. This was on account ofthe work sites not being free from all encumbrances and delay in receipt of approveddesign drawings.
• The delay in execution resulted in imposition of liquidated damages of` 3.33 crore, cost overrun amounting to ̀ 6.56 crore and termination of projectsat a loss of ̀ 1.24 crore.
• Defects were noticed within three to 21 months of the completion of constructionin 36 works executed by all three PSUs. Management did not provide informationabout the costs involved in rectification.
• E-tendering process for hiring sub-contractors was not followed in any of theworks tendered by MBL during 2014-15 to 2016-17. MBL sub-contracted13 works valued at ̀ 33.17 crore on the basis of single bids. Hence, no assuranceon competitiveness of bids could be obtained.
• MBL had issued 46.24 per cent orders (80 out of 173 orders exceeding ̀ 10 lakh)valued at ̀ 18.27 crore, on the basis of single quotation. This resulted in extraexpenditure of ̀ 2.46 crore.
• MBL executed additional works valued at ̀ 26.88 crore without prior approvalof clients.
(Paragraph 2.9)
Financial Management
• The three PSUs had not raised running account bills for ̀ 134.15 crore for theportion of work completed in 86 ongoing works.
• Funds amounting to ̀ 31.69 crore, for agency works undertaken on behalf ofState Government, were not received till March 2017. This hindered the progressof work.
• MBL and WSFL completed 109 agency works but had not claimed agency feesamounting to ̀ 22.91 crore.
• The three PSUs undercharged agency fees by ̀ 4.38 crore.
(Paragraph 2.10)
Monitoring of works and existence of internal controls
• Progress reports were maintained for only 23 per cent of works by MBL, theother two PSUs did not prepare progress reports of ongoing works.
• None of the site offices maintained registers as required.
(xi)
Overview
(xii)
• Adequate staff at site offices for supervision as per the norm fixed by GoWB wasnot deployed, leading to shortfalls in inspection.
(Paragraph 2.11)
Hence, audit of management of works by three PSUs revealed that due diligence wasnot observed in preparing estimates to bid for tenders and contract documents werenot properly formulated. Delays in execution of works, imprudent purchase of materials,non-recovery of agency fees, lack of monitoring etc. were also noticed.
3. Compliance AuditCompliance audit observations included in this Report highlight deficiencies in themanagement of PSUs, which had serious financial implications. The irregularities pointedout include:
Vehicular Emission by State Transport Undertakings (STUs) in West Bengal
• Transport Department had not prepared requisite action plans to (i) protect andsafeguard the environment from pollution and (ii) mitigate green-house gas emissionsarising out of vehicular emissions in operation of its STUs as stated in theEnvironmental Policy Statement and the State Action Plan.
(Paragraph 3.1.4.1)
• GoWB failed to create compressed natural gas (CNG)/coal bed methane (CBM)distribution network for CNG buses. This led to flaring of 2.81 lakh tonnes ofCBM i.e. 39.12 per cent of production in 2015-16 and 2016-17 which couldhave been utilised for operation of 7,812 CNG buses annually.
(Paragraph 3.1.4.2)
• Audit noticed non-phasing out of BS-I, II and III buses and non-compliance withthe testing norms of Pollution Under Control Certification.
(Paragraphs 3.1.5.1 and 3.1.5.2)
Compliance with rules made under Mines and Minerals (Development andRegulation) Act, 1957 by West Bengal Mineral Development and TradingCorporation Limited (Company)
• Out of 95 milestones fixed for commencement of production in six coal blocks,only 15 were achieved in time. Achievement of 38 were delayed and 42 werenot achieved.
(Paragraph 3.2.3.1)
• There was a delay of 12 years in execution of lease deed for extraction of graniteat Bara Panjania, Purulia. The Company had forgone revenue of ̀ 14.81 crorefrom the date of grant of lease upto the date of start of actual quarrying.
(Paragraph 3.2.4.2)
Audit Report (PSUs) for the year ended 31 March 2017
• The Company had allowed irregular and unjustified waivers aggregating to` 52.60 crore to “raising contractors for coal”.
(Paragraphs 3.2.5.1 and 3.2.5.2)
Follow-up Audit: Performance audit on production and marketingperformance of Saraswaty Press Limited (SPL)
Introduction
A Performance Audit on the ‘Production and Marketing performance of SaraswatyPress Limited’ was incorporated as Paragraph 2.3 in the Report of the Comptrollerand Auditor General of India (Commercial), Government of West Bengal for the yearended 31 March 2008. The Report was laid in the West Bengal Legislative Assemblyin July 2009. Government of West Bengal accepted all the observations/recommendations and assured to take action for improvement of performance. TheCommittee on Public Undertakings had not discussed the Performance Audit till date.
Audit Findings
• None of the recommendations made by audit during the previous audit were fullyimplemented.
Production planning and optimal utilisation of press / binding sectionmachinery
• In the press section, the annual standard production capacity was planned at onlyone-third of the installed capacity. Against this, the actual production was only40.10 to 56.76 per cent of the planned standard production. This indicated verylow capacity utilisation. Similarly, in the binding section, achievement was between60.56 and 64.56 per cent of targets.
• Lack of production planning through the Enterprise Resources Planning systemled to belated delivery of textbooks. The textbooks were delivered after 31 to148 days of commencement of academic sessions.
• SPL hired machinery at annual hire charges of ̀ 2.14 crore. That machinery wasunderutilised, leading to unproductive expenditure of ̀ 1.50 crore per year.
(Paragraph 3.3.3)
Sub-contracting
• Both the PSUs (SPL and its subsidiary West Bengal Text Book CorporationLimited) had sub-contracted work to other entities, totaling ̀ 101.31 crore. Thiswas inconsistent with their commitment to stop outsourcing.
(Paragraph 3.3.4)
(xiii)
Overview
Revamping the incentive schemes to ensure increase in productivity and reduceovertime
• The standard production targets were set lower than the installed production capacityby 62.68 to 69.15 per cent during 2014-17. During these three years, on anaverage, each employee received incentives of ` 30,875 for no additionalachievements.
• On an average, 120 out of 130 employees were engaged in overtime work ofmore than fifty hours in a quarter. This violated the statutory norms. SPL/ WBTBCLpaid overtime allowance of ̀ 5.25 crore on this account to 106 to 145 employees.
(Paragraph 3.3.5)
Introduction of sales and realisation target for the marketing agents
• Jobs amounting to ̀ 9.56 crore relating to printing of books were executed withoutany formal order or agreement. The client did not make the payment.
(Paragraph 3.3.7.1)
Strengthening of monitoring mechanism
• Lack of monitoring over generation of scrap paper led to loss of ̀ 23.62 crore.
(Paragraph 3.3.8.1)
• Raising invoices after time lags of 14 to 268 days from their dates of deliveryresulted in delayed realisation of payment. Consequently, bearing the burden ofadditional interest of ̀ 1.78 crore paid to the banks against the borrowed capital.
(Paragraph 3.3.8.2)
Gist of other important audit observations is given below:
• Non-inclusion of exchange rate variation clause in the tender document led toextra expenditure of ` 156.76 crore by West Bengal Power DevelopmentCorporation Limited.
(Paragraph 3.4)
• West Bengal Power Development Corporation Limited failed to give requisitethree months’ advance notice to ECL for renovation and short lifting of coal. Thisled to payment of avoidable compensation of ̀ 80.97 crore.
(Paragraph 3.5)
(xiv)
Audit Report (PSUs) for the year ended 31 March 2017
• Non-recovery of advances in time-based manner led to loss of interest of` 4.06 crore to West Bengal State Electricity Transmission CompanyLimited.
(Paragraph 3.7)
• West Bengal Highway Development Corporation Limited failed to float andfinalise the tender well in advance for the collection of toll charges. This led toavoidable loss of revenue of ̀ 2.56 crore.
(Paragraph 3.9)
(xv)
Overview


CHAPTER I

Chapter I Functioning of State Public Sector Undertakings
1
1 Government PSUs include other Companies referred to in Section 139(5) and 139(7) of theCompanies Act 2013.
2 Bengal Birbhum Coalfields Limited, Biswa Bangla Marketing Corporation Limited and WestBengal Biotech Development Corporation Limited.
3 Gross State Domestic Product at current prices (Advance Estimates) - ̀ 12,51,067.42 crore.(Source : Economic Review 2016-17, Government of West Bengal).
4 Percentage of aggregate net loss after taxes for the year as per latest accounts of workingPSUs and preference dividend to total shareholders’ fund (paid-up share capital, shareapplication money and free reserves and surplus as reduced by accumulated losses anddeferred revenue expenditure).
5 WEBFIL Limited.6 Non-working PSUs are those which have ceased to carry on their operations.
CHAPTER I
1. Functioning of State Public Sector Undertakings
1.1 Introduction
State Public Sector Undertakings (PSUs) comprise State Government Companies1
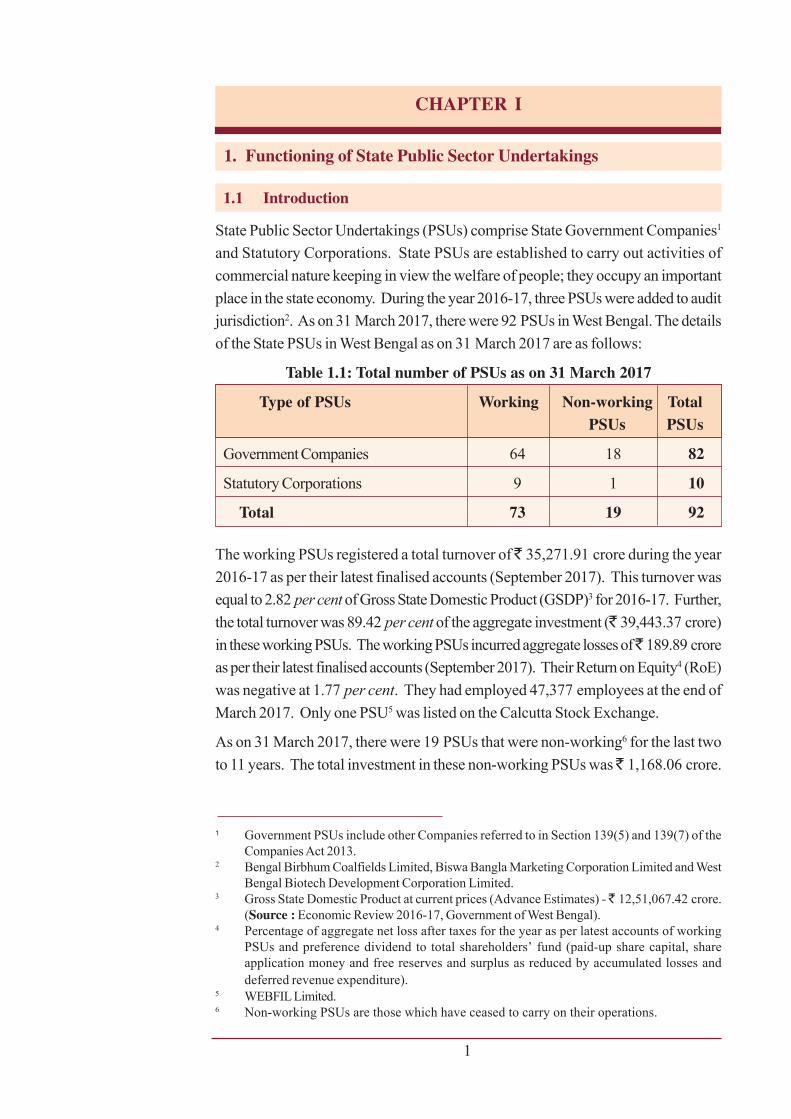
and Statutory Corporations. State PSUs are established to carry out activities ofcommercial nature keeping in view the welfare of people; they occupy an importantplace in the state economy. During the year 2016-17, three PSUs were added to auditjurisdiction2. As on 31 March 2017, there were 92 PSUs in West Bengal. The detailsof the State PSUs in West Bengal as on 31 March 2017 are as follows:
Table 1.1: Total number of PSUs as on 31 March 2017
Type of PSUs Working Non-working TotalPSUs PSUs
Government Companies 64 18 82
Statutory Corporations 9 1 10
Total 73 19 92
The working PSUs registered a total turnover of ̀ 35,271.91 crore during the year2016-17 as per their latest finalised accounts (September 2017). This turnover wasequal to 2.82 per cent of Gross State Domestic Product (GSDP)3 for 2016-17. Further,the total turnover was 89.42 per cent of the aggregate investment (` 39,443.37 crore)in these working PSUs. The working PSUs incurred aggregate losses of ̀ 189.89 croreas per their latest finalised accounts (September 2017). Their Return on Equity4 (RoE)was negative at 1.77 per cent. They had employed 47,377 employees at the end ofMarch 2017. Only one PSU5 was listed on the Calcutta Stock Exchange.
As on 31 March 2017, there were 19 PSUs that were non-working6 for the last twoto 11 years. The total investment in these non-working PSUs was ̀ 1,168.06 crore.
Audit Report (PSUs) for the year ended 31 March 2017
2
1.2 Accountability framework
A Government Company or any other Company owned or controlled7, directly orindirectly, by the Central Government, or by any State Government or Governmentsor partly by Central Government and partly by one or more State Governments issubject to audit by the CAG. The process of audit of Government Companies isgoverned by respective provisions of Section 139 and 143 of the Companies Act,2013 (Act). According to Section 2 (45) of the Act, a Government Company is anycompany in which not less than fifty-one per cent of the paid-up share capital is heldby the Central Government, or by any State Government/ Governments, or partly bythe Central Government and partly by one or more State Governments. This includesa company which is a subsidiary company of such a Government Company.
Further, as per sub-section 7 of Section 143 of the Act, the CAG may, in case of anycompany covered under sub-section 5 or sub-section 7 of Section 139, if considerednecessary, by an order, cause test audit to be conducted on the accounts of suchCompany. The provisions of Section 19A of the Comptroller and Auditor General’s(Duties, Powers and Conditions of Service) Act, 1971 shall apply to the report ofsuch test Audit. An audit of the financial statements of a Company in respect of thefinancial years that commenced on or before 31 March 2014 shall continue to begoverned by the provisions of the Companies Act, 1956.
1.2.1 Statutory Audit
The financial statements of the Government Companies (as defined in Section 2 (45)of the Companies Act, 2013) are audited by Statutory Auditors, appointed by CAGas per the provisions of Section 139 (5) or (7) of the Act who shall submit a copy ofthe Audit Report to the CAG including the financial statements of the Company underSection 143(5) of the Act. These financial statements are subject to supplementaryaudit to be conducted by CAG within 60 days from the date of receipt of the auditreport under the provisions of Section 143 (6) of the Act.
Audit of Statutory Corporations is governed by their respective legislations. Out ofnine working Statutory Corporations, CAG is the sole auditor for seven Corporations8.
7 Control is defined in Section 2(27) of the Companies Act 2013. Also see General CircularNo. 33/2014 of 31 July 2014 of Ministry of Corporate Affairs, Government of India.
8 Calcutta State Transport Corporation, South Bengal State Transport Corporation, NorthBengal State Transport Corporation, West Bengal Scheduled Castes and Scheduled TribesDevelopment and Finance Corporation, West Bengal Minorities Development and FinanceCorporation, West Bengal Backward Classes Development and Finance Corporation andWest Bengal Industrial Infrastructure Development Corporation.
Chapter I Functioning of State Public Sector Undertakings
3
In respect of the remaining two9 working statutory corporations, audit is conducted byChartered Accountants and supplementary audit by CAG. In the case of one non-working corporation, i.e., Great Eastern Hotel Authority, only compliance audit isundertaken by the CAG.
1.2.2 Role of Government and Legislature
The State Government exercises control over the affairs of these PSUs through itsadministrative departments. The Chief Executive and Directors to the Board areappointed by the Government.
The State Legislature also monitors the accounting and utilisation of Governmentinvestment in the PSUs. For this, the Annual Reports together with the StatutoryAuditors’ Reports and comments of the CAG , in respect of State Governmentcompanies and Separate Audit Reports in case of Statutory Corporations are to beplaced before the Legislature under Section 39(4) of the Act or as stipulated in therespective Acts. The Audit Reports of CAG are submitted to the Government underSection 19A of the CAG’s (Duties, Powers and Conditions of Service) Act, 1971.
1.3 Stake of Government of West Bengal
The State Government has a financial stake in these PSUs. This stake is of mainly threetypes:
• Share Capital and Loans- In addition to the Share Capital Contribution,State Government also provides financial assistance by way of loans to the PSUsfrom time to time.
• Special Financial Support- State Government provides budgetary supportby way of grants and subsidies to the PSUs as and when required.
• Guarantees- State Government also guarantees the repayment of loans withinterest availed by the PSUs from Financial Institutions.
1.4 Investment in State PSUs
9 West Bengal State Warehousing Corporation and West Bengal Financial Corporation.10 The investment was calculated as per information submitted by the PSUs as well as the
current accounts submitted by them. However, four working PSUs had not submitted theinformation as sought for.
As on 31 March 2017, the investment (capital and long-term loans) in 9210 PSUs was` 40,611.43 crore. As on 31 March 2017 of the total investment in state PSUs,97.12 per cent was in working PSUs and the remaining 2.88 per cent in non-working
Audit Report (PSUs) for the year ended 31 March 2017
4
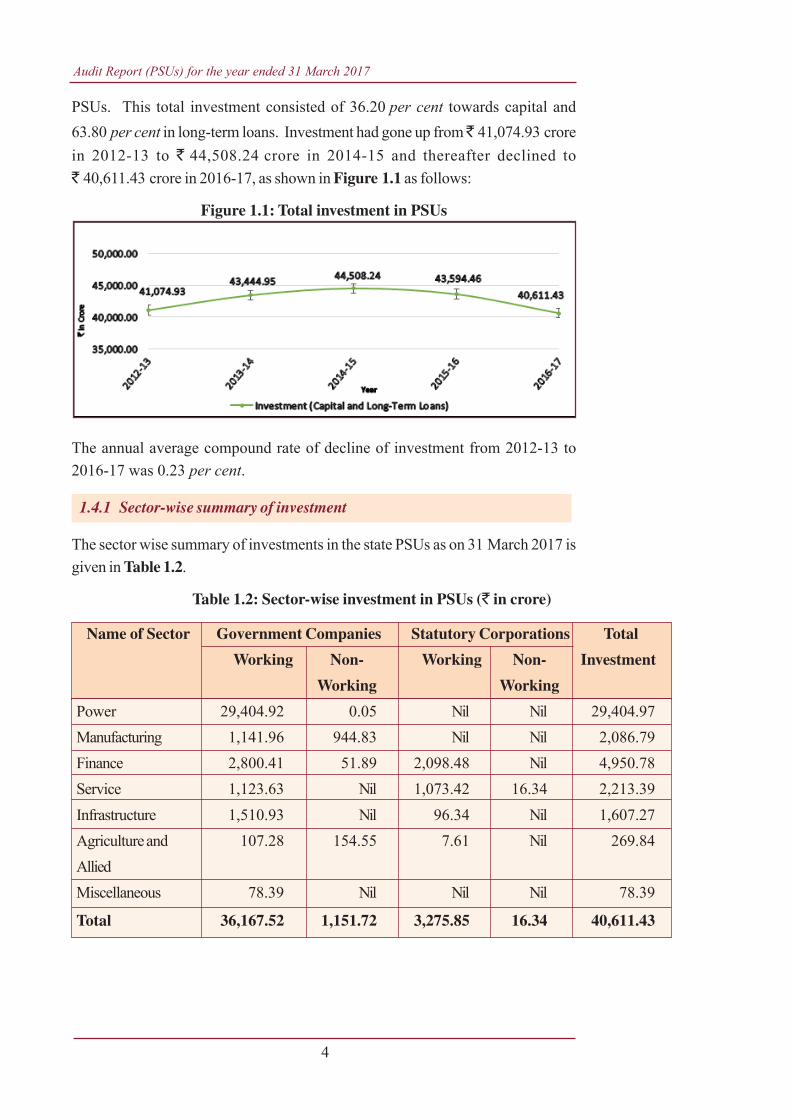
PSUs. This total investment consisted of 36.20 per cent towards capital and63.80 per cent in long-term loans. Investment had gone up from ̀ 41,074.93 crorein 2012-13 to ` 44,508.24 crore in 2014-15 and thereafter declined to` 40,611.43 crore in 2016-17, as shown in Figure 1.1 as follows:
Figure 1.1: Total investment in PSUs
The annual average compound rate of decline of investment from 2012-13 to2016-17 was 0.23 per cent.
1.4.1 Sector-wise summary of investment
The sector wise summary of investments in the state PSUs as on 31 March 2017 isgiven in Table 1.2.
Table 1.2: Sector-wise investment in PSUs (` in crore)
Name of Sector Government Companies Statutory Corporations Total
Working Non- Working Non- Investment
Working Working
Power 29,404.92 0.05 Nil Nil 29,404.97Manufacturing 1,141.96 944.83 Nil Nil 2,086.79Finance 2,800.41 51.89 2,098.48 Nil 4,950.78Service 1,123.63 Nil 1,073.42 16.34 2,213.39Infrastructure 1,510.93 Nil 96.34 Nil 1,607.27Agriculture and 107.28 154.55 7.61 Nil 269.84AlliedMiscellaneous 78.39 Nil Nil Nil 78.39
Total 36,167.52 1,151.72 3,275.85 16.34 40,611.43
Chapter I Functioning of State Public Sector Undertakings
5
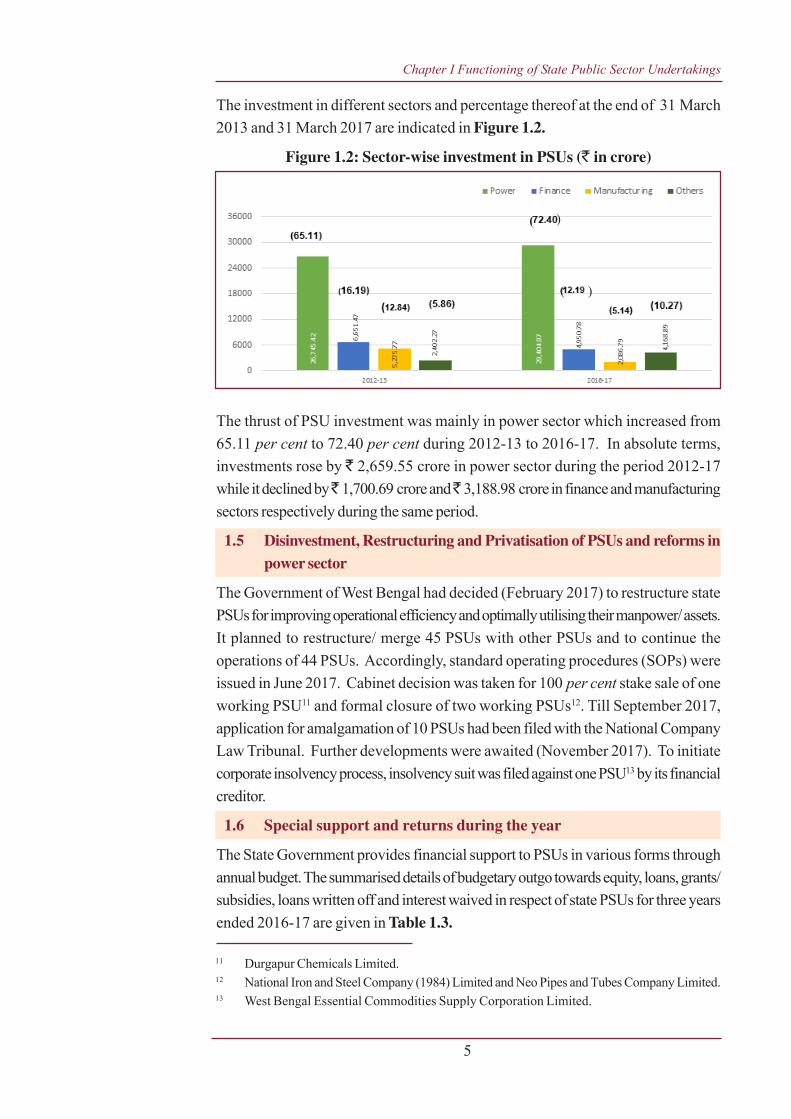
The investment in different sectors and percentage thereof at the end of 31 March2013 and 31 March 2017 are indicated in Figure 1.2.
Figure 1.2: Sector-wise investment in PSUs (` in crore)
The thrust of PSU investment was mainly in power sector which increased from65.11 per cent to 72.40 per cent during 2012-13 to 2016-17. In absolute terms,investments rose by ` 2,659.55 crore in power sector during the period 2012-17while it declined by ̀ 1,700.69 crore and ̀ 3,188.98 crore in finance and manufacturingsectors respectively during the same period.
1.5 Disinvestment, Restructuring and Privatisation of PSUs and reforms inpower sector
The Government of West Bengal had decided (February 2017) to restructure statePSUs for improving operational efficiency and optimally utilising their manpower/ assets.It planned to restructure/ merge 45 PSUs with other PSUs and to continue theoperations of 44 PSUs. Accordingly, standard operating procedures (SOPs) wereissued in June 2017. Cabinet decision was taken for 100 per cent stake sale of oneworking PSU11 and formal closure of two working PSUs12. Till September 2017,application for amalgamation of 10 PSUs had been filed with the National CompanyLaw Tribunal. Further developments were awaited (November 2017). To initiatecorporate insolvency process, insolvency suit was filed against one PSU13 by its financialcreditor.
1.6 Special support and returns during the year
The State Government provides financial support to PSUs in various forms throughannual budget. The summarised details of budgetary outgo towards equity, loans, grants/subsidies, loans written off and interest waived in respect of state PSUs for three yearsended 2016-17 are given in Table 1.3.
11 Durgapur Chemicals Limited.12 National Iron and Steel Company (1984) Limited and Neo Pipes and Tubes Company Limited.13 West Bengal Essential Commodities Supply Corporation Limited.
(
( )
)
Audit Report (PSUs) for the year ended 31 March 2017
6
(` in
cro
re)
14 Amount represents outgo from the State Budget only.15 The figure represents number of PSUs which have received outgo from the State Budget
under one or more heads, i.e, equity, loans, grants and subsidies.
Sl.No. No. of
PSUs
Amount No. of
PSUs
Amount AmountNo. of
PSUs
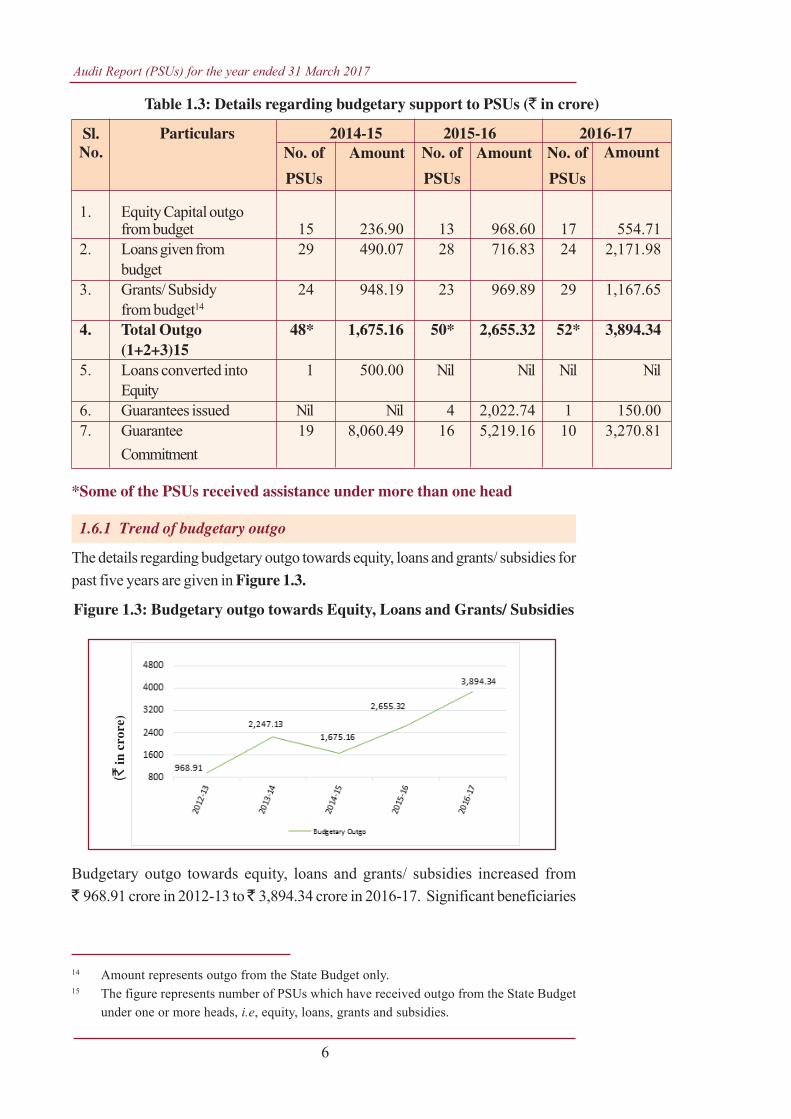
Table 1.3: Details regarding budgetary support to PSUs (` in crore)
Particulars 2014-15 2015-16 2016-17
1. Equity Capital outgofrom budget 15 236.90 13 968.60 17 554.71
2. Loans given from 29 490.07 28 716.83 24 2,171.98budget
3. Grants/ Subsidy 24 948.19 23 969.89 29 1,167.65from budget14
4. Total Outgo 48* 1,675.16 50* 2,655.32 52* 3,894.34(1+2+3)15
5. Loans converted into 1 500.00 Nil Nil Nil NilEquity
6. Guarantees issued Nil Nil 4 2,022.74 1 150.007. Guarantee 19 8,060.49 16 5,219.16 10 3,270.81
Commitment
*Some of the PSUs received assistance under more than one head
1.6.1 Trend of budgetary outgo
The details regarding budgetary outgo towards equity, loans and grants/ subsidies forpast five years are given in Figure 1.3.
Figure 1.3: Budgetary outgo towards Equity, Loans and Grants/ Subsidies
Budgetary outgo towards equity, loans and grants/ subsidies increased from` 968.91 crore in 2012-13 to ̀ 3,894.34 crore in 2016-17. Significant beneficiaries
Chapter I Functioning of State Public Sector Undertakings
7
of equity, loans and subsidy/ grants from the state budget were four16 PSUs in thepower sector, which had received 52.40 per cent (` 2,040.76 crore).
1.6.2 Guarantee commission payable by PSUs to the State Government
PSUs are liable to pay guarantee commission at the rate of one per cent per annumto the State Government on the outstanding amount of loan guaranteed as of 31 March.At the end of 2016-17, guarantee commitment by the Government was` 3,270.81 crore in respect of 10 PSUs. During the year, two PSUs paid guaranteecommission of ` 0.34 crore to the State Government while ` 25.92 crore wasoutstanding from 13 PSUs.
1.7 Reconciliation with Finance Accounts
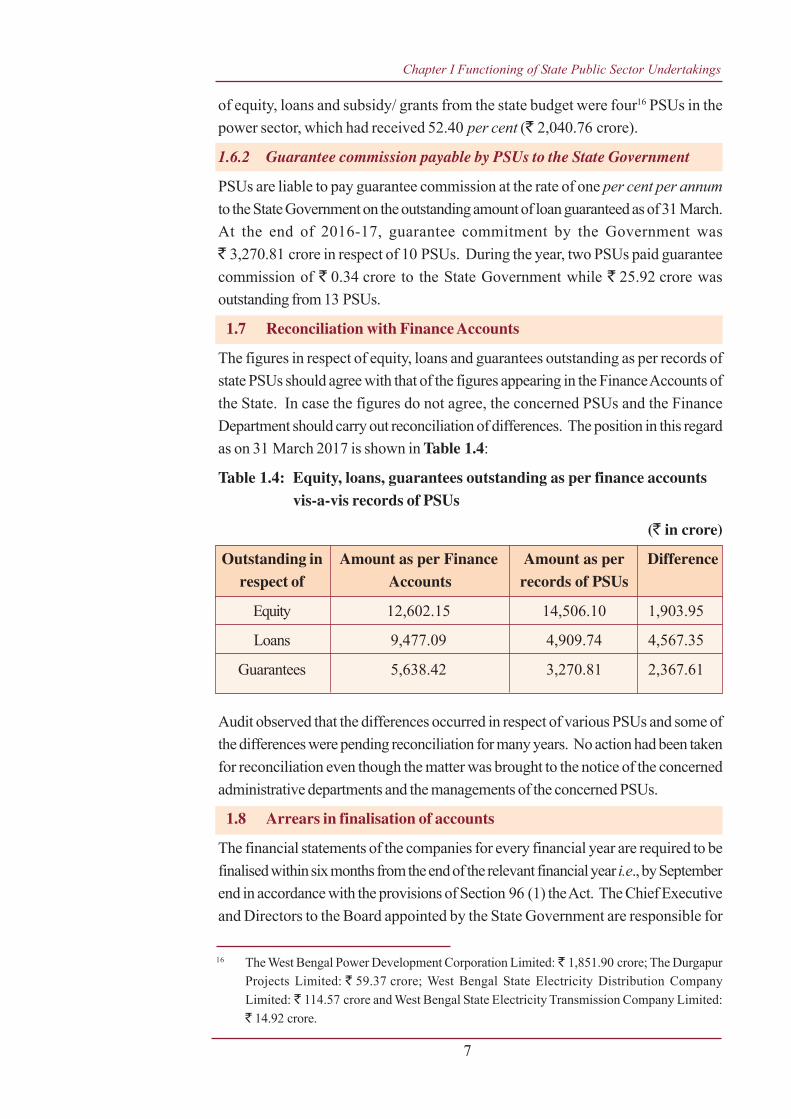
The figures in respect of equity, loans and guarantees outstanding as per records ofstate PSUs should agree with that of the figures appearing in the Finance Accounts ofthe State. In case the figures do not agree, the concerned PSUs and the FinanceDepartment should carry out reconciliation of differences. The position in this regardas on 31 March 2017 is shown in Table 1.4:
Table 1.4: Equity, loans, guarantees outstanding as per finance accountsvis-a-vis records of PSUs
(` in crore)
Outstanding in Amount as per Finance Amount as per Differencerespect of Accounts records of PSUs
Equity 12,602.15 14,506.10 1,903.95
Loans 9,477.09 4,909.74 4,567.35
Guarantees 5,638.42 3,270.81 2,367.61
Audit observed that the differences occurred in respect of various PSUs and some ofthe differences were pending reconciliation for many years. No action had been takenfor reconciliation even though the matter was brought to the notice of the concernedadministrative departments and the managements of the concerned PSUs.
1.8 Arrears in finalisation of accounts
The financial statements of the companies for every financial year are required to befinalised within six months from the end of the relevant financial year i.e., by Septemberend in accordance with the provisions of Section 96 (1) the Act. The Chief Executiveand Directors to the Board appointed by the State Government are responsible for
16 The West Bengal Power Development Corporation Limited: ` 1,851.90 crore; The DurgapurProjects Limited: ` 59.37 crore; West Bengal State Electricity Distribution CompanyLimited: ` 114.57 crore and West Bengal State Electricity Transmission Company Limited:` 14.92 crore.
Audit Report (PSUs) for the year ended 31 March 2017
8
No.
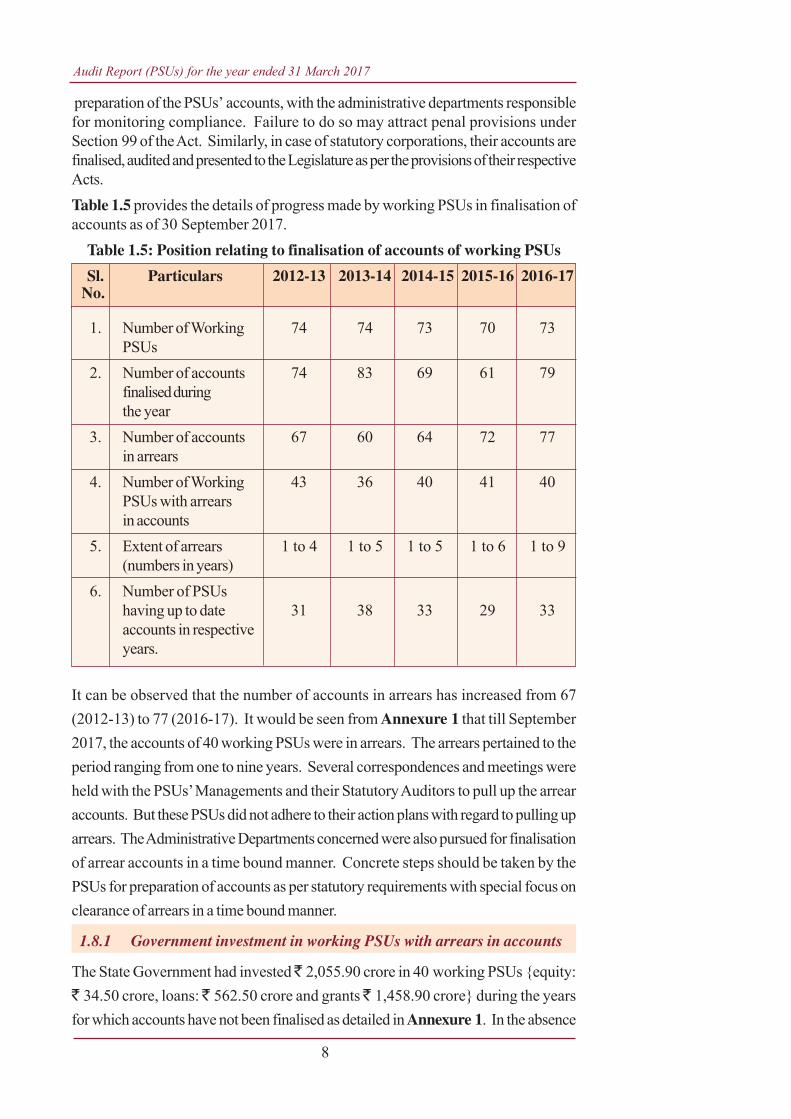
preparation of the PSUs’ accounts, with the administrative departments responsiblefor monitoring compliance. Failure to do so may attract penal provisions underSection 99 of the Act. Similarly, in case of statutory corporations, their accounts arefinalised, audited and presented to the Legislature as per the provisions of their respectiveActs.Table 1.5 provides the details of progress made by working PSUs in finalisation ofaccounts as of 30 September 2017.
Table 1.5: Position relating to finalisation of accounts of working PSUs
Sl. Particulars 2012-13 2013-14 2014-15 2015-16 2016-17
1. Number of Working 74 74 73 70 73PSUs
2. Number of accounts 74 83 69 61 79finalised duringthe year
3. Number of accounts 67 60 64 72 77in arrears
4. Number of Working 43 36 40 41 40PSUs with arrearsin accounts
5. Extent of arrears 1 to 4 1 to 5 1 to 5 1 to 6 1 to 9(numbers in years)
6. Number of PSUshaving up to date 31 38 33 29 33accounts in respectiveyears.
It can be observed that the number of accounts in arrears has increased from 67(2012-13) to 77 (2016-17). It would be seen from Annexure 1 that till September2017, the accounts of 40 working PSUs were in arrears. The arrears pertained to theperiod ranging from one to nine years. Several correspondences and meetings wereheld with the PSUs’ Managements and their Statutory Auditors to pull up the arrearaccounts. But these PSUs did not adhere to their action plans with regard to pulling uparrears. The Administrative Departments concerned were also pursued for finalisationof arrear accounts in a time bound manner. Concrete steps should be taken by thePSUs for preparation of accounts as per statutory requirements with special focus onclearance of arrears in a time bound manner.
1.8.1 Government investment in working PSUs with arrears in accounts
The State Government had invested ̀ 2,055.90 crore in 40 working PSUs {equity:` 34.50 crore, loans: ̀ 562.50 crore and grants ̀ 1,458.90 crore} during the yearsfor which accounts have not been finalised as detailed in Annexure 1. In the absence

Chapter I Functioning of State Public Sector Undertakings
9
of finalisation of accounts and their subsequent audit, it could not be ensured whetherthe investments and expenditure incurred have been properly accounted for and thepurpose, for which the amount was invested, was achieved or not. Thus, Government’sinvestment in such PSUs remained outside the control of State Legislature.
1.8.2 Arrears in accounts of non-working PSUs
In addition to above, as on 30 September 2017, there were arrears from one year to11 years in finalisation of accounts by 13 out of 19 non-working PSUs. Six non-working PSUs had up-to-date accounts while 13 PSUs had arrears of 60 accountsranging over the years from 2006-07 to 2016-17.
The issue was pursued on a regular basis and the status intimated to the Chief Secretaryto the Government of West Bengal (October 2016, May 2017 and November 2017).Responsibility needs to be fixed for failure to prepare accounts in time to safeguard theassets of these PSUs.
1.9 Placement of Separate Audit Reports
The status of placement of Separate Audit Reports (SARs) issued by the CAG (up to30 September 2017) on the accounts of Statutory Corporations in the Legislature hasbeen shown in Annexure 2. Twenty-two SARs in respect of the 10 StatutoryCorporations have not either been issued to Government or placed in the Legislature.Audit was in progress in respect of 13 accounts. In case of nine accounts, SARs havebeen issued to Government during April 2015 to September 2017. These are yet tobe placed in the State Legislature. Accounts in respect of one Statutory Corporationare pending since 2013-14 onwards.
1.10 Impact of non-finalisation of accounts
As pointed out above (Paragraph 1.8), the delay in finalisation of accounts may alsoresult in risk of fraud and wastage of public money, apart from violation of the provisionsof the relevant statutes. In view of the above, state of arrears of accounts, the actualcontribution of PSUs to the state GDP for the year 2016-17 could not be ascertainedand their contribution to state exchequer was also not reported to the State Legislature.
1.11 Performance of PSUs as per their latest finalised accounts
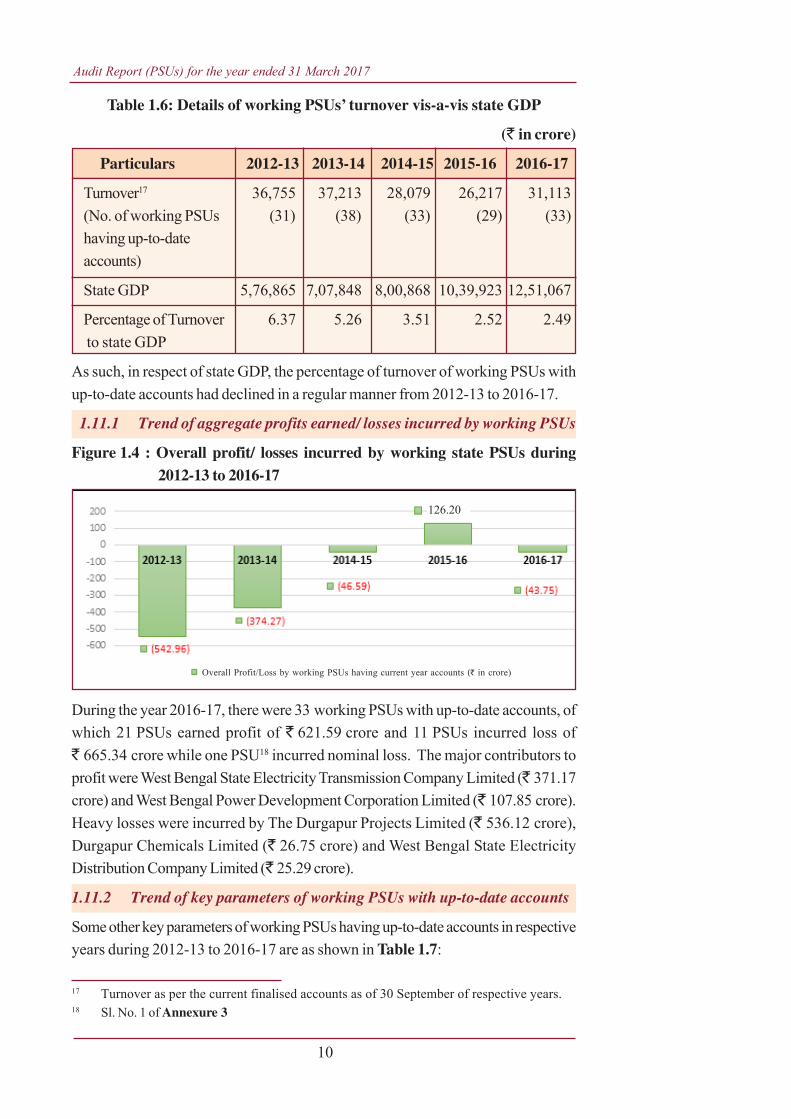
The financial position and working results of Government Companies and StatutoryCorporations are detailed in Annexure 3. A ratio of PSU turnover to state GDPshows the extent of PSU activities in the State Economy. The details of turnover ofworking PSUs with up-to-date accounts and state GDP for a period of five yearsending 2016-17 were as depicted in Table 1.6.
Audit Report (PSUs) for the year ended 31 March 2017
10
17 Turnover as per the current finalised accounts as of 30 September of respective years.18 Sl. No. 1 of Annexure 3
Table 1.6: Details of working PSUs’ turnover vis-a-vis state GDP
(` in crore)
Particulars 2012-13 2013-14 2014-15 2015-16 2016-17
Turnover17 36,755 37,213 28,079 26,217 31,113(No. of working PSUs (31) (38) (33) (29) (33)having up-to-dateaccounts)
State GDP 5,76,865 7,07,848 8,00,868 10,39,923 12,51,067
Percentage of Turnover 6.37 5.26 3.51 2.52 2.49 to state GDP
As such, in respect of state GDP, the percentage of turnover of working PSUs withup-to-date accounts had declined in a regular manner from 2012-13 to 2016-17.
1.11.1 Trend of aggregate profits earned/ losses incurred by working PSUs
Figure 1.4 : Overall profit/ losses incurred by working state PSUs during2012-13 to 2016-17
During the year 2016-17, there were 33 working PSUs with up-to-date accounts, ofwhich 21 PSUs earned profit of ` 621.59 crore and 11 PSUs incurred loss of` 665.34 crore while one PSU18 incurred nominal loss. The major contributors toprofit were West Bengal State Electricity Transmission Company Limited (` 371.17crore) and West Bengal Power Development Corporation Limited (` 107.85 crore).Heavy losses were incurred by The Durgapur Projects Limited (` 536.12 crore),Durgapur Chemicals Limited (` 26.75 crore) and West Bengal State ElectricityDistribution Company Limited (` 25.29 crore).
1.11.2 Trend of key parameters of working PSUs with up-to-date accounts
Some other key parameters of working PSUs having up-to-date accounts in respectiveyears during 2012-13 to 2016-17 are as shown in Table 1.7:
`̀̀̀̀Overall Profit/Loss by working PSUs having current year accounts (` in crore)
126.20
Chapter I Functioning of State Public Sector Undertakings
11
19 Ratio of return on capital employed (net profit/ loss plus interest charged in profit and lossaccount) to capital employed i.e. shareholders’ funds plus long term borrowings. In respectof finance sector PSUs, capital employed is worked out as the mean of the aggregate ofopening and closing balances of shareholders’ funds plus long term borrowings.
20 Turnover of working PSUs as per their accounts for the current financial year as of30 September of that year.
21 West Bengal Biotech Development Corporation Limited was incorporated in 2008-09. Theaudit of the PSU was entrusted in 2016-17. However, no information or accounts weresubmitted by the PSU. Therefore, the accounts for 2008-09 to 2016-17, i.e. nine years wereconsidered as arrear account. Refer Sl. No. 34 of Annexure 1.
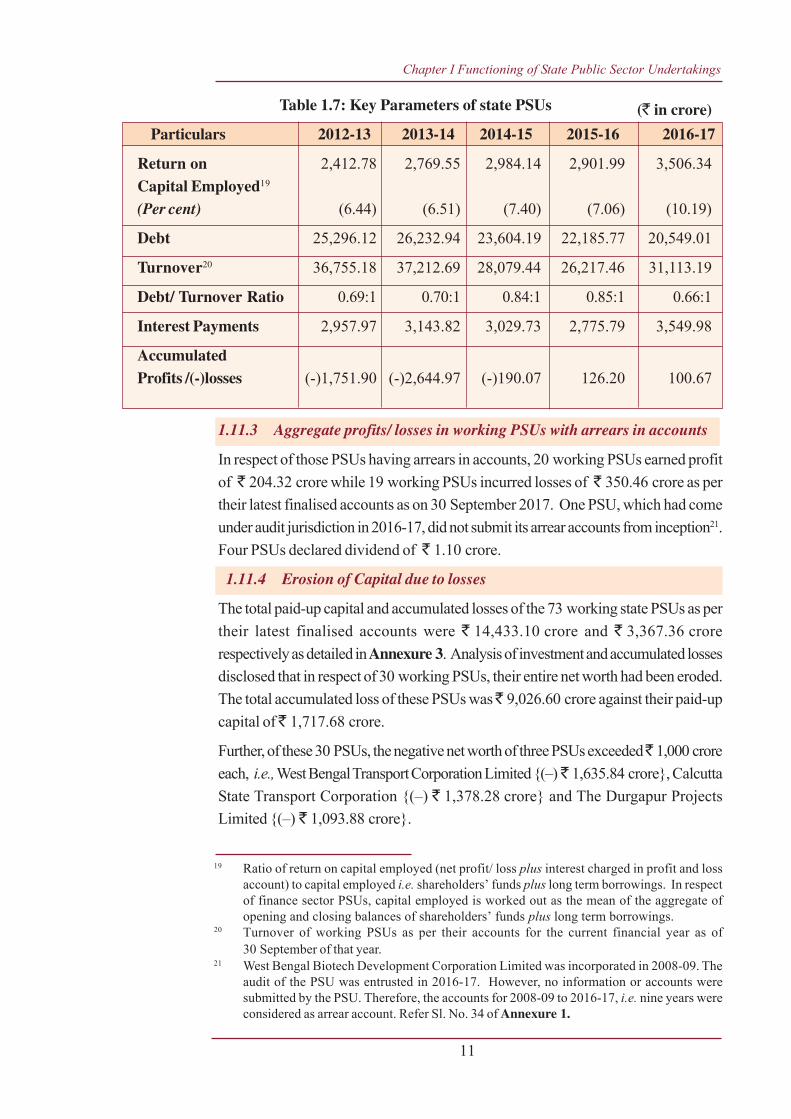
Table 1.7: Key Parameters of state PSUs (` in crore)
Particulars 2012-13 2013-14 2014-15 2015-16 2016-17
Return on 2,412.78 2,769.55 2,984.14 2,901.99 3,506.34Capital Employed19
(Per cent) (6.44) (6.51) (7.40) (7.06) (10.19)
Debt 25,296.12 26,232.94 23,604.19 22,185.77 20,549.01
Turnover20 36,755.18 37,212.69 28,079.44 26,217.46 31,113.19
Debt/ Turnover Ratio 0.69:1 0.70:1 0.84:1 0.85:1 0.66:1
Interest Payments 2,957.97 3,143.82 3,029.73 2,775.79 3,549.98
AccumulatedProfits /(-)losses (-)1,751.90 (-)2,644.97 (-)190.07 126.20 100.67
1.11.3 Aggregate profits/ losses in working PSUs with arrears in accounts
In respect of those PSUs having arrears in accounts, 20 working PSUs earned profitof ̀ 204.32 crore while 19 working PSUs incurred losses of ̀ 350.46 crore as pertheir latest finalised accounts as on 30 September 2017. One PSU, which had comeunder audit jurisdiction in 2016-17, did not submit its arrear accounts from inception21.Four PSUs declared dividend of ̀ 1.10 crore.
1.11.4 Erosion of Capital due to losses
The total paid-up capital and accumulated losses of the 73 working state PSUs as pertheir latest finalised accounts were ` 14,433.10 crore and ` 3,367.36 crorerespectively as detailed in Annexure 3. Analysis of investment and accumulated lossesdisclosed that in respect of 30 working PSUs, their entire net worth had been eroded.The total accumulated loss of these PSUs was ̀ 9,026.60 crore against their paid-upcapital of ̀ 1,717.68 crore.
Further, of these 30 PSUs, the negative net worth of three PSUs exceeded ̀ 1,000 croreeach, i.e., West Bengal Transport Corporation Limited {(–) ` 1,635.84 crore}, CalcuttaState Transport Corporation {(–) ` 1,378.28 crore} and The Durgapur ProjectsLimited {(–) ` 1,093.88 crore}.
Audit Report (PSUs) for the year ended 31 March 2017
12
No. ofaccounts
Amount No. ofaccounts
Amount No. ofaccounts
AmountParticulars
22 Seven non-working PSUs did not submit requisite information.23 Lily Products Limited.24 West Bengal Plywood and Allied Products Limited, Krishna Silicate and Glass (1987) Limited
and The Carter Pooler Engineering Company.
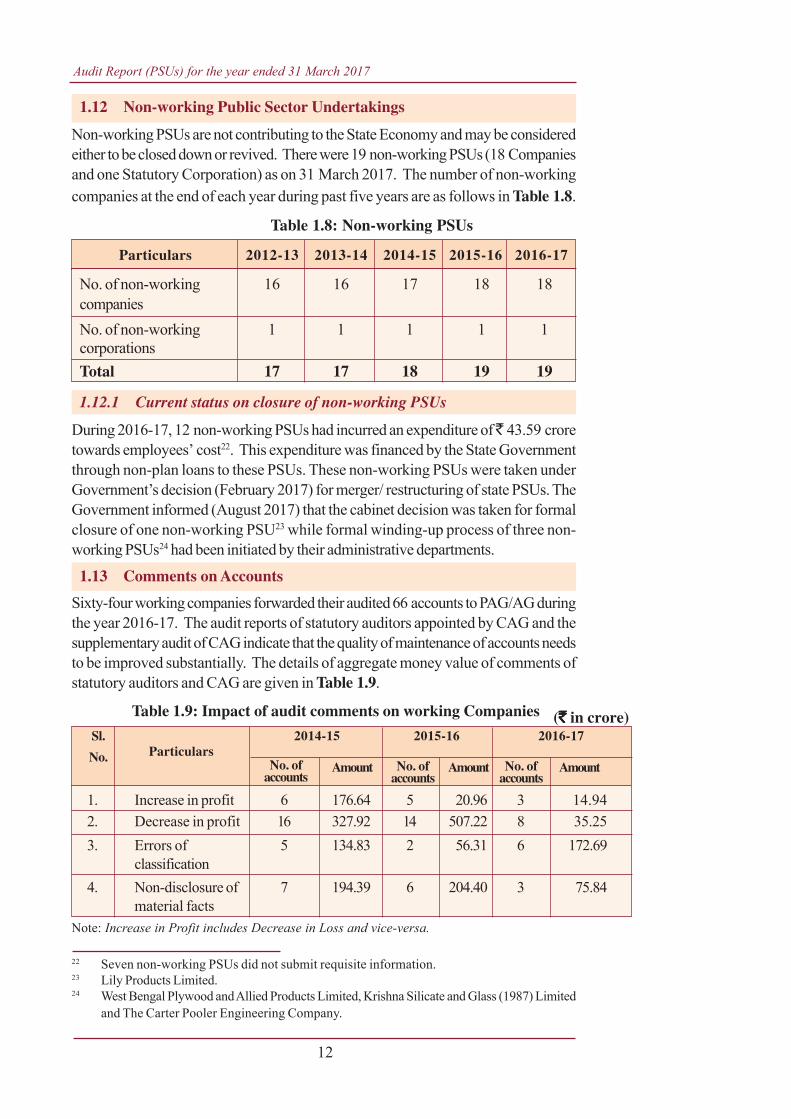
1.12 Non-working Public Sector Undertakings
Non-working PSUs are not contributing to the State Economy and may be consideredeither to be closed down or revived. There were 19 non-working PSUs (18 Companiesand one Statutory Corporation) as on 31 March 2017. The number of non-workingcompanies at the end of each year during past five years are as follows in Table 1.8.
Table 1.8: Non-working PSUs
Particulars 2012-13 2013-14 2014-15 2015-16 2016-17
No. of non-working 16 16 17 18 18companiesNo. of non-working 1 1 1 1 1corporationsTotal 17 17 18 19 19
1.12.1 Current status on closure of non-working PSUs
During 2016-17, 12 non-working PSUs had incurred an expenditure of ̀ 43.59 croretowards employees’ cost22. This expenditure was financed by the State Governmentthrough non-plan loans to these PSUs. These non-working PSUs were taken underGovernment’s decision (February 2017) for merger/ restructuring of state PSUs. TheGovernment informed (August 2017) that the cabinet decision was taken for formalclosure of one non-working PSU23 while formal winding-up process of three non-working PSUs24 had been initiated by their administrative departments.
1.13 Comments on Accounts
Sixty-four working companies forwarded their audited 66 accounts to PAG/AG duringthe year 2016-17. The audit reports of statutory auditors appointed by CAG and thesupplementary audit of CAG indicate that the quality of maintenance of accounts needsto be improved substantially. The details of aggregate money value of comments ofstatutory auditors and CAG are given in Table 1.9.
Table 1.9: Impact of audit comments on working Companies
Sl. 2014-15 2015-16 2016-17
No.
1. Increase in profit 6 176.64 5 20.96 3 14.942. Decrease in profit 16 327.92 14 507.22 8 35.253. Errors of 5 134.83 2 56.31 6 172.69
classification4. Non-disclosure of 7 194.39 6 204.40 3 75.84
material factsNote: Increase in Profit includes Decrease in Loss and vice-versa.
(`̀̀̀̀ in crore)
Chapter I Functioning of State Public Sector Undertakings
13
25 Saraswaty Press Limited-Sl. No 63 of Working Government Companies in Annexure 3
During the year, the Statutory Auditors did not give unqualified certificates on anyaccount. An adverse certificate was given on the accounts of one PSU25.
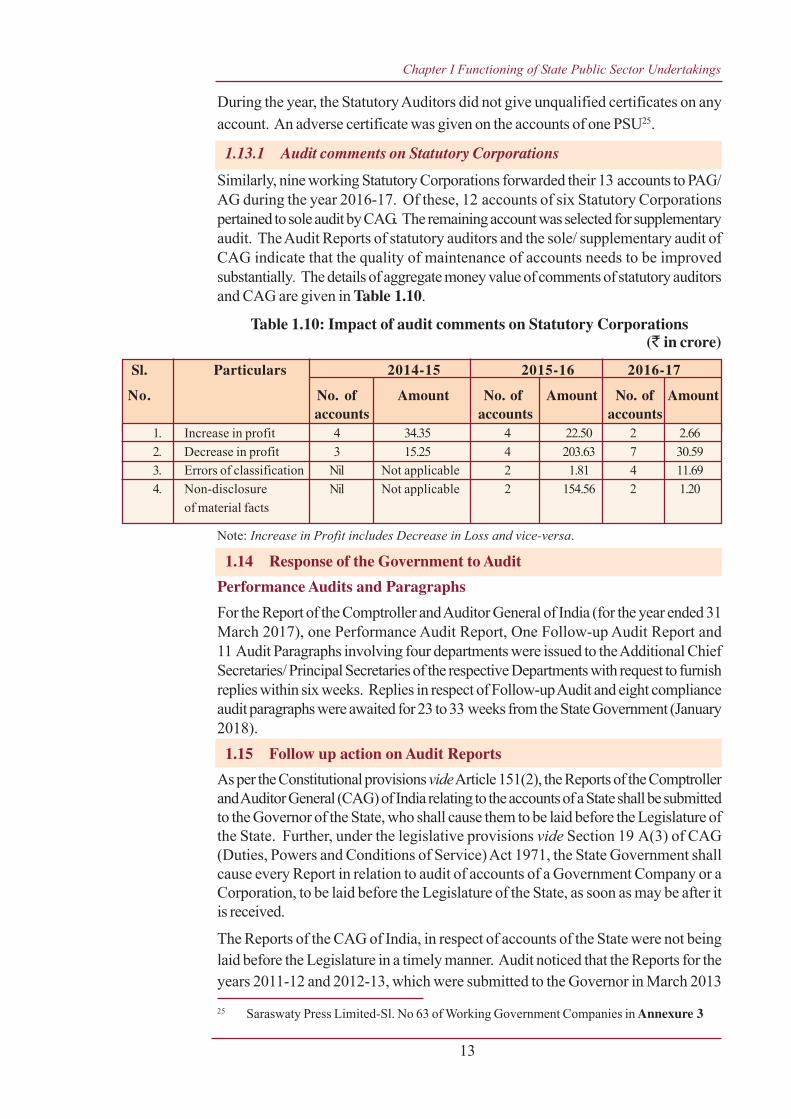
1.13.1 Audit comments on Statutory Corporations
Similarly, nine working Statutory Corporations forwarded their 13 accounts to PAG/AG during the year 2016-17. Of these, 12 accounts of six Statutory Corporationspertained to sole audit by CAG. The remaining account was selected for supplementaryaudit. The Audit Reports of statutory auditors and the sole/ supplementary audit ofCAG indicate that the quality of maintenance of accounts needs to be improvedsubstantially. The details of aggregate money value of comments of statutory auditorsand CAG are given in Table 1.10.
Table 1.10: Impact of audit comments on Statutory Corporations
Sl. Particulars 2014-15 2015-16 2016-17
No. No. of Amount No. of Amount No. of Amount accounts accounts accounts
1. Increase in profit 4 34.35 4 22.50 2 2.662. Decrease in profit 3 15.25 4 203.63 7 30.593. Errors of classification Nil Not applicable 2 1.81 4 11.694. Non-disclosure Nil Not applicable 2 154.56 2 1.20
of material facts
Note: Increase in Profit includes Decrease in Loss and vice-versa.
1.14 Response of the Government to Audit
Performance Audits and Paragraphs
For the Report of the Comptroller and Auditor General of India (for the year ended 31March 2017), one Performance Audit Report, One Follow-up Audit Report and11 Audit Paragraphs involving four departments were issued to the Additional ChiefSecretaries/ Principal Secretaries of the respective Departments with request to furnishreplies within six weeks. Replies in respect of Follow-up Audit and eight complianceaudit paragraphs were awaited for 23 to 33 weeks from the State Government (January2018).1.15 Follow up action on Audit Reports
As per the Constitutional provisions vide Article 151(2), the Reports of the Comptrollerand Auditor General (CAG) of India relating to the accounts of a State shall be submittedto the Governor of the State, who shall cause them to be laid before the Legislature ofthe State. Further, under the legislative provisions vide Section 19 A(3) of CAG(Duties, Powers and Conditions of Service) Act 1971, the State Government shallcause every Report in relation to audit of accounts of a Government Company or aCorporation, to be laid before the Legislature of the State, as soon as may be after itis received.
The Reports of the CAG of India, in respect of accounts of the State were not beinglaid before the Legislature in a timely manner. Audit noticed that the Reports for theyears 2011-12 and 2012-13, which were submitted to the Governor in March 2013
(` in crore)
Audit Report (PSUs) for the year ended 31 March 2017
14
and April 2014 respectively, were laid before Legislature in July 2014. Similarly, theReports for the years 2013-14 and 2014-15, which were submitted to the Governorin April 2015 and March 2016 respectively, were also tabled together in July 2016.The pattern indicates that laying of Reports of CAG before the Legislature has beenreduced to a biennial exercise by the State Government. Such violation of Constitutionaland Legislative obligations deprived the Legislature of the opportunity to exercise controlover the Executive in respect of finances and its utilisation in the State.1.15.1 Replies outstanding
The Report of the Comptroller and Auditor General (CAG) of India represents theculmination of the process of audit scrutiny. It is, therefore, necessary that they elicitappropriate and timely response from the executives. The Finance Department,Government of West Bengal issued Manual for Financial Advisors (January 2016) forall Administrative Departments. As per the manual, the heads of AdministrativeDepartments as well as the PSUs have to furnish the replies/explanatory notes toparagraphs/ performance audits included in the Audit Reports of the CAG of Indiawithin a period of one month of their presentation to the Legislature, duly signed bySecretary/ Joint Secretary.Out of 258 paragraphs/ performance audits, explanatory notes to 39 paragraphs/performance audits in respect of 15 departments were awaited (September 2017).1.15.2 Discussion of Audit Reports by COPU
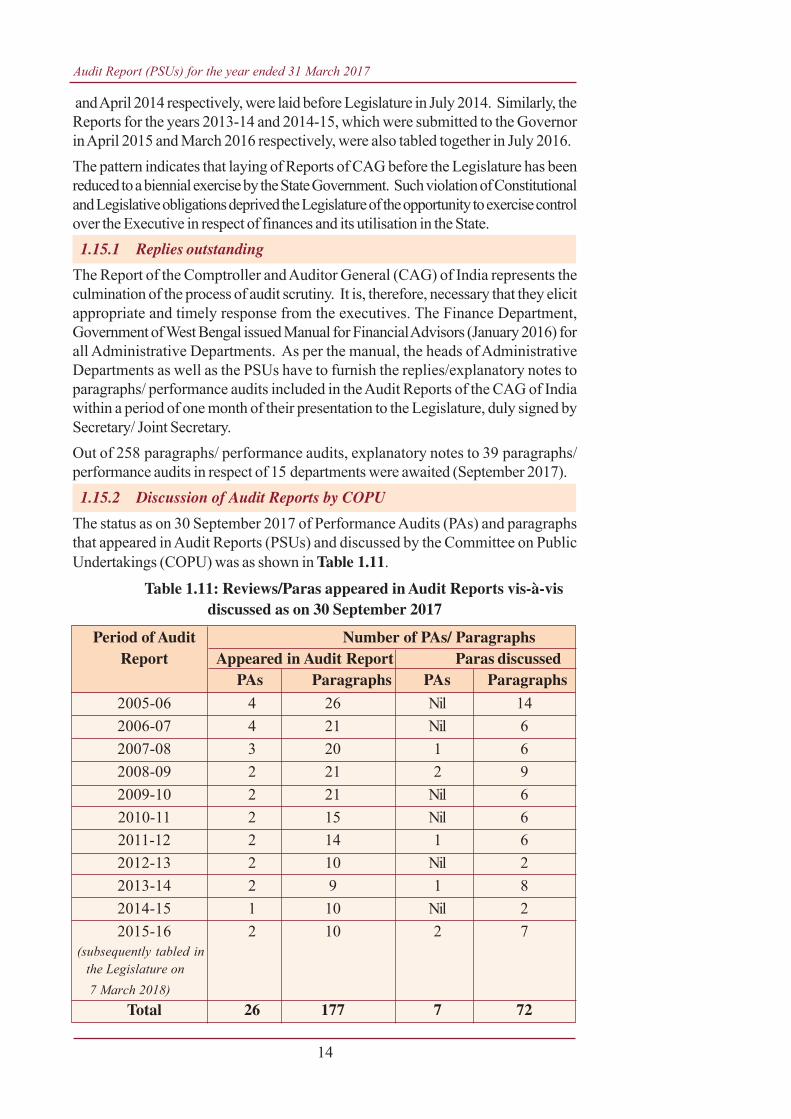
The status as on 30 September 2017 of Performance Audits (PAs) and paragraphsthat appeared in Audit Reports (PSUs) and discussed by the Committee on PublicUndertakings (COPU) was as shown in Table 1.11.
Table 1.11: Reviews/Paras appeared in Audit Reports vis-à-visdiscussed as on 30 September 2017
Period of Audit Number of PAs/ ParagraphsReport Appeared in Audit Report Paras discussed
PAs Paragraphs PAs Paragraphs
2005-06 4 26 Nil 142006-07 4 21 Nil 62007-08 3 20 1 62008-09 2 21 2 92009-10 2 21 Nil 62010-11 2 15 Nil 62011-12 2 14 1 62012-13 2 10 Nil 22013-14 2 9 1 82014-15 1 10 Nil 22015-16 2 10 2 7
(subsequently tabled in the Legislature on 7 March 2018)
Total 26 177 7 72
Chapter I Functioning of State Public Sector Undertakings
15
1.15.3 Compliance to Reports of Committee on Public Undertakings(COPU)
According to Rules of Procedure of COPU, Action Taken Notes (ATNs) on therecommendations contained in the COPU Reports are to be submitted by theGovernment within three months of their receipt. The statement in Annexure 4 indicatedthe details of 22 COPU reports where Action Taken Notes are yet to be receivedfrom the departments as on 30 September 2017.
These reports of COPU contain 50 recommendations in respect of paragraphs pertainingto eight departments, which had either appeared in the Reports of the CAG of Indiafor the years 2003-04 to 2014-15 or were taken up for suo-motu study.
1.16 Coverage of this Report
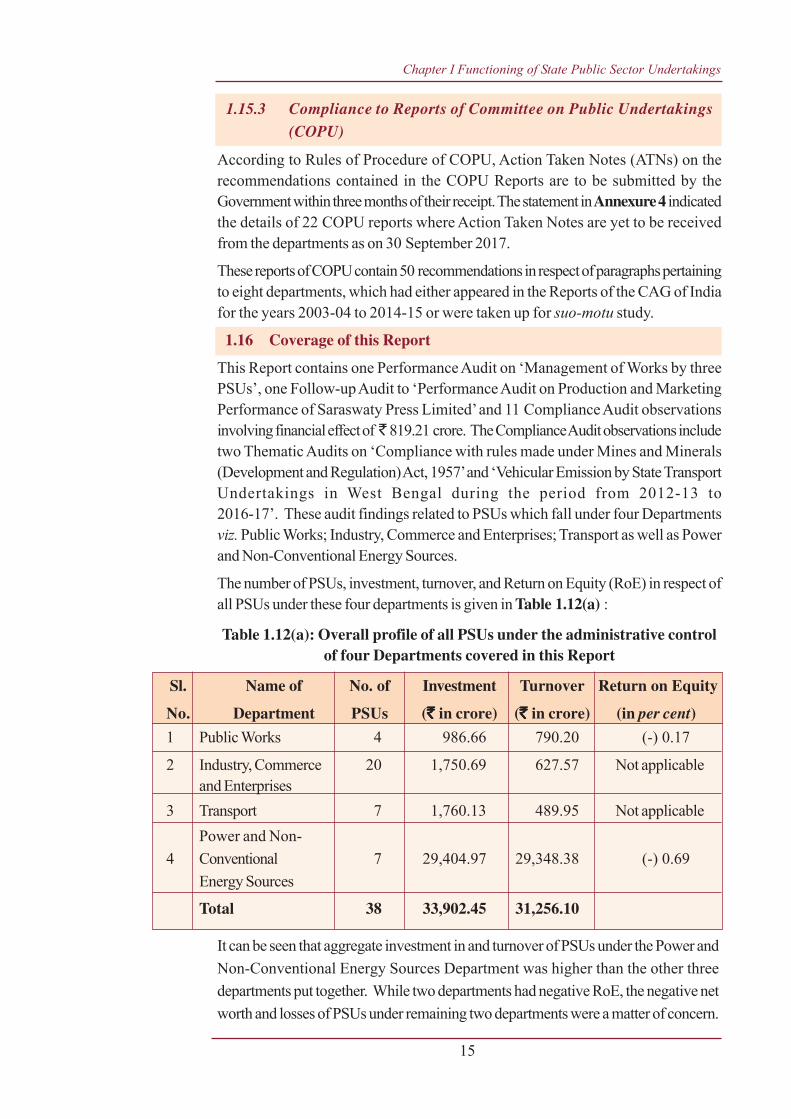
This Report contains one Performance Audit on ‘Management of Works by threePSUs’, one Follow-up Audit to ‘Performance Audit on Production and MarketingPerformance of Saraswaty Press Limited’ and 11 Compliance Audit observationsinvolving financial effect of ̀ 819.21 crore. The Compliance Audit observations includetwo Thematic Audits on ‘Compliance with rules made under Mines and Minerals(Development and Regulation) Act, 1957’ and ‘Vehicular Emission by State TransportUndertakings in West Bengal during the period from 2012-13 to2016-17’. These audit findings related to PSUs which fall under four Departmentsviz. Public Works; Industry, Commerce and Enterprises; Transport as well as Powerand Non-Conventional Energy Sources.
The number of PSUs, investment, turnover, and Return on Equity (RoE) in respect ofall PSUs under these four departments is given in Table 1.12(a) :
Table 1.12(a): Overall profile of all PSUs under the administrative controlof four Departments covered in this Report
Sl. Name of No. of Investment Turnover Return on Equity
No. Department PSUs (`̀̀̀̀ in crore) (`̀̀̀̀ in crore) (in per cent)1 Public Works 4 986.66 790.20 (-) 0.17
2 Industry, Commerce 20 1,750.69 627.57 Not applicableand Enterprises
3 Transport 7 1,760.13 489.95 Not applicablePower and Non-
4 Conventional 7 29,404.97 29,348.38 (-) 0.69Energy Sources
Total 38 33,902.45 31,256.10
It can be seen that aggregate investment in and turnover of PSUs under the Power andNon-Conventional Energy Sources Department was higher than the other threedepartments put together. While two departments had negative RoE, the negative networth and losses of PSUs under remaining two departments were a matter of concern.
Audit Report (PSUs) for the year ended 31 March 2017
16
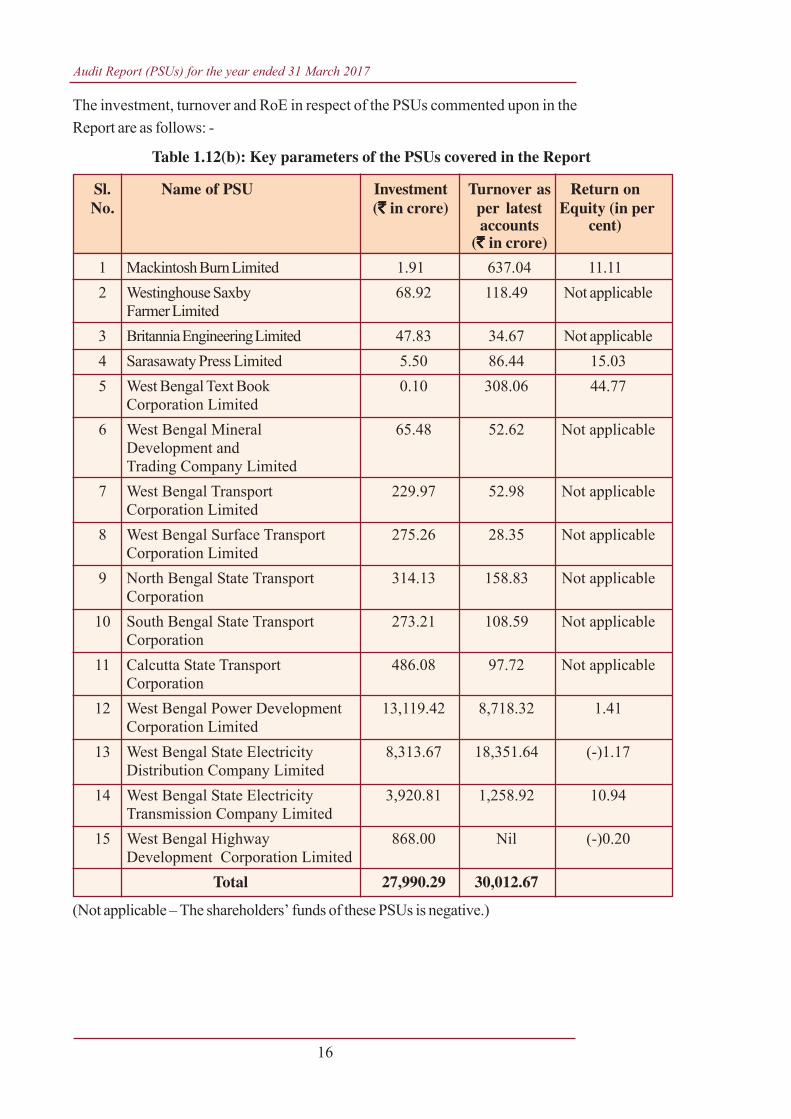
The investment, turnover and RoE in respect of the PSUs commented upon in theReport are as follows: -
Table 1.12(b): Key parameters of the PSUs covered in the Report
Sl. Name of PSU Investment Turnover as Return onNo. (`̀̀̀̀ in crore) per latest Equity (in per
accounts cent)(`̀̀̀̀ in crore)
1 Mackintosh Burn Limited 1.91 637.04 11.112 Westinghouse Saxby 68.92 118.49 Not applicable
Farmer Limited3 Britannia Engineering Limited 47.83 34.67 Not applicable4 Sarasawaty Press Limited 5.50 86.44 15.035 West Bengal Text Book 0.10 308.06 44.77
Corporation Limited6 West Bengal Mineral 65.48 52.62 Not applicable
Development andTrading Company Limited
7 West Bengal Transport 229.97 52.98 Not applicableCorporation Limited
8 West Bengal Surface Transport 275.26 28.35 Not applicableCorporation Limited
9 North Bengal State Transport 314.13 158.83 Not applicableCorporation
10 South Bengal State Transport 273.21 108.59 Not applicableCorporation
11 Calcutta State Transport 486.08 97.72 Not applicableCorporation
12 West Bengal Power Development 13,119.42 8,718.32 1.41Corporation Limited
13 West Bengal State Electricity 8,313.67 18,351.64 (-)1.17Distribution Company Limited
14 West Bengal State Electricity 3,920.81 1,258.92 10.94Transmission Company Limited
15 West Bengal Highway 868.00 Nil (-)0.20Development Corporation Limited
Total 27,990.29 30,012.67
(Not applicable – The shareholders’ funds of these PSUs is negative.)

CHAPTER II

Chapter II Performance Audit relating to Government Companies
17
CHAPTER II
Performance Audit relating to Government Companies
Mackintosh Burn Limited, Westinghouse Saxby Farmer Limited andBritannia Engineering Limited
2. Management of works
Executive Summary
Introduction
Mackintosh Burn Limited (MBL), Westinghouse Saxby Farmer Limited (WSFL)and Britannia Engineering Limited (BEL) are three Public Sector Undertakings (PSUs)under the Public Works Department (PWD), Government of West Bengal (GoWB).These three PSUs plan, manage and execute construction works across the state,predominantly in the public sector. In February 2017, GoWB decided to amalgamateBEL with WSFL to improve operational efficiency and ensure optimal utilisation ofmanpower/ assets.
Lack of due diligence in preparing estimates and framing terms andconditions of contracts
In their role as contractors, these PSUs secure contracts by participation in tendersfloated by various Government departments/ clients. However, bids were not basedon realistic estimates. PSUs violated the guiding principles in framing contracts bynot, inter alia, incorporating defect liability period and specifying machinery to beutilised by sub-contractors.
Deficiencies in execution of works
Delays in execution of works resulted in cost overrun, imposition of liquidated damagesand termination of works. Quality of work was also not ensured by the PSUs in theconstruction of works. The appointment of sub-contractors/ suppliers suffered fromdeficiencies. Mandatory e-tendering was not followed by WSFL and MBL for16 agency works. MBL had executed works valuing ̀ 26.88 crore without priorapproval of clients.
Poor Financial Management
PSUs had not prepared bills for works executed by them as a contractor, in violationof extant provisions. The reason for not raising the bills was that the clients preparedthe bills subject to their availability of funds.
Audit Report (PSUs) for the year ended 31 March 2017
18
During 2012-13 to 2016 17, MBL and WSFL had not billed agency fees valuing` 5.35 crore and ̀ 17.56 crore respectively. The three PSUs had also underchargedagency fees by ̀ 4.38 crore.
The three PSUs had kept agency fees below the admissible margins notified(June 2012) by GoWB.
Lack of monitoring of works and inadequate internal controls
The work programme submitted by the PSUs omitted information regardingdeployment of men, machineries and material. None of the site offices maintainedregisters as required. MBL, WSFL and BEL had not deployed adequate staff atsite offices for supervision as per the norm fixed by GoWB.
2.1 Introduction
MBL, incorporated in April 1913, became a Government Company in December2010. WSFL, incorporated in May 1923, became a Government Company in 1969and BEL was a Government Company since its establishment in April 1986. Thesethree PSUs, under the Public Works Department (PWD), Government of West Bengal(GoWB), conduct planning, management and execution of construction works acrossthe state, predominantly in the public sector. MBL, since incorporation, wasundertaking construction of buildings, bridges, flyovers, roads and highways, drainageetc. WSFL26 and BEL27 took up civil works since 1975 and 2006 respectively. InFebruary 2017, GoWB decided28 to amalgamate BEL with WSFL to improveoperational efficiency and ensure optimal utilisation of manpower/ assets. Thereafter,GoWB filed (September 2017) application with the National Company Law Tribunalfor amalgamation of both PSUs. Further developments were awaited (November2017).
2.2 Organisation structure
The managements of these three PSUs were vested in their Boards of Directors (BoDs),each headed by a Chairman. The Managing Directors (MD) were the Chief Executives.As of March 2017, the Boards of MBL, WSFL and BEL consisted of eight, five andsix members respectively, nominated by GoWB.
These three PSUs followed two business models for execution of works -
(i) Role as contractor: Securing contracts by participation in tenders floated byvarious government departments/ non–government clients and their execution.
26 Apart from civil works, WSFL also manufactured railway brakes and railway signallingequipment.
27 BEL manufactured road rollers and tea -processing machineries.28 Finance Department, GoWB order no 1093-F(Y) dated 21 February 2017.
Chapter II Performance Audit relating to Government Companies
19
(ii) Role as a nominated agency of GoWB for execution of Government works:Non-engineering Departments of GoWB could nominate29 these PSUs as agencies to(a) prepare estimates/ drawings/ designs, (b) invite tenders for selection of contractors,(c) evaluate of bids, (d) award contracts, (e) monitor and supervise the works, (f) issuecompletion certificates, etc. and (g) undertake overall execution. For these activities,the PSUs would earn an agency commission30.
In August 2016, GoWB had omitted both WSFL and BEL from the list of nominatedagencies. PWD stated (November 2017) that the reasons for omission of WSFL andBEL from the list of nominated agency works were not known to them.
2.3 Audit Objectives
The Performance Audit was conducted to ascertain whether these three PSUs had:
• Exercised due diligence, followed guidelines and processes in preparing andfinalising contracts for various construction works/ projects;
• Properly planned and executed works, both departmentally and through sub-contracts, in conformity with the prevailing norms/ guidelines with regard toefficiency and economy;
• Effectively enforced financial management to ensure timely collection of dues,and;
• Monitored the implementation of works and had in place adequate and effectiveinternal controls.
2.4 Scope and methodology of audit
The Performance Audit was conducted between March and July 2017. Its scopecovered management of works executed by these three PSUs. Audit methodologyinvolved test check of records of 15031 out of 74532 works executed during 2012-13to 2016-17 available at the Head Offices of these PSUs. Stratified random samplingbased on the value of works was used as a tool for the selection of works for audit.
An Entry Conference was held on 7 March 2017. Audit objectives, audit criteria,scope and methodology of the Performance Audit were discussed with the managementsof the PSUs and PWD. The Exit Conference was held on 5 December 2017 whereinthe findings and audit conclusions were discussed. In the exit conference, the Departmentaccepted all recommendations made in the PA report. Replies of the Department andmanagements of the PSUs have been suitably incorporated in the report.
29 Notification No. 5400(Y) dated 25 June 2012 of the Budget Branch, Deptt. of Finance, GoWB.30 The commission varied between two and 8.5 per cent of the estimated cost.31 MBL : 67 (` 1,923.69 crore), WSFL : 28 (` 547.65 crore) and BEL : 55 (` 136.11 crore).32 MBL : 396 (` 3,629.80 crore), WSFL : 237 (` 1,153.72 crore) and BEL : 112 (` 339.15 crore).
Audit Report (PSUs) for the year ended 31 March 2017
20
2.5 Audit criteria
The audit criteria had been derived from:
• CPWD Works Manuals33 and PWD Code, GoWB;
• Applicable PWD Schedule of Rates (PWD-SORs) and Government orders;
• Agreements and Tender Documents;
• Board minutes and agenda papers of PSUs;
• Other relevant rules and regulations.
2.6 Acknowledgement
Audit acknowledges the co-operation of MBL, WSFL and BEL in providing thenecessary records and information in connection with the conduct of this PerformanceAudit.
2.7 Operational performance
During 2012-13 to 2016-17, the three PSUs had secured orders for 413 works34
(value: ` 4,029.75 crore) as contractors and orders for 332 works35
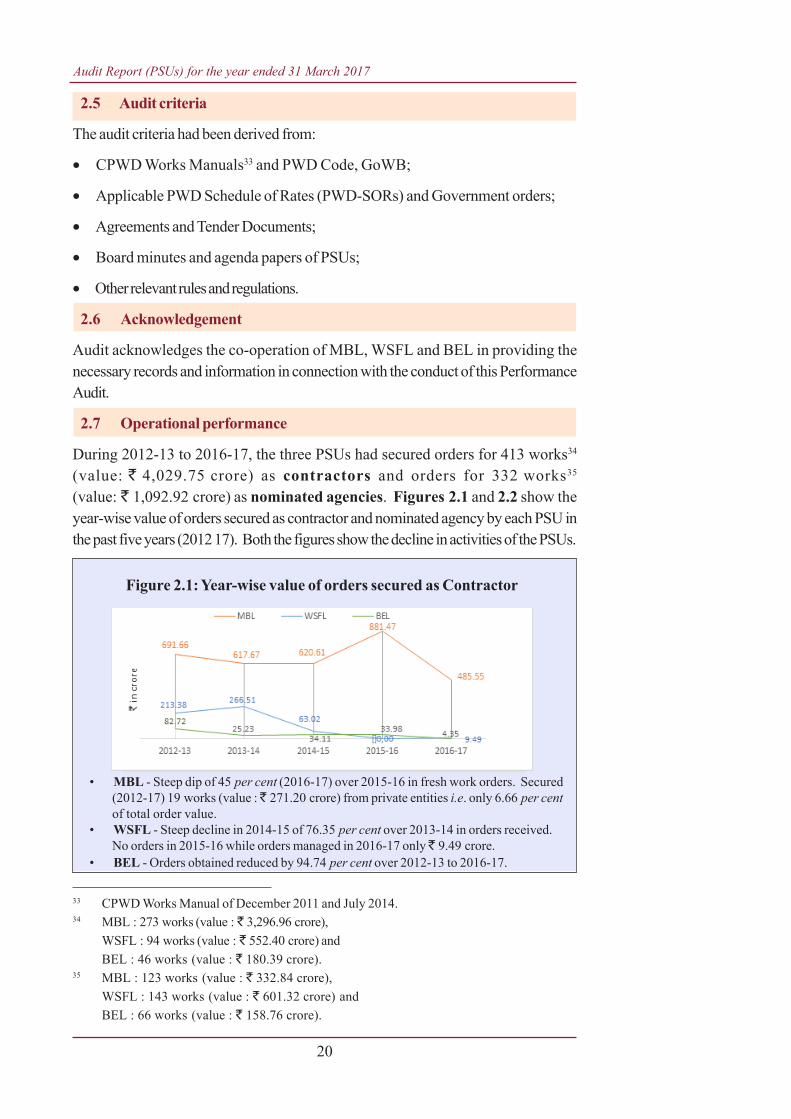
(value: ` 1,092.92 crore) as nominated agencies. Figures 2.1 and 2.2 show theyear-wise value of orders secured as contractor and nominated agency by each PSU inthe past five years (2012 17). Both the figures show the decline in activities of the PSUs.
33 CPWD Works Manual of December 2011 and July 2014.34 MBL : 273 works (value : ` 3,296.96 crore),
WSFL : 94 works (value : ` 552.40 crore) andBEL : 46 works (value : ` 180.39 crore).
35 MBL : 123 works (value : ` 332.84 crore),WSFL : 143 works (value : ` 601.32 crore) andBEL : 66 works (value : ` 158.76 crore).
Figure 2.1: Year-wise value of orders secured as Contractor
• MBL - Steep dip of 45 per cent (2016-17) over 2015-16 in fresh work orders. Secured(2012-17) 19 works (value : ̀ 271.20 crore) from private entities i.e. only 6.66 per centof total order value.
• WSFL - Steep decline in 2014-15 of 76.35 per cent over 2013-14 in orders received.No orders in 2015-16 while orders managed in 2016-17 only ̀ 9.49 crore.
• BEL - Orders obtained reduced by 94.74 per cent over 2012-13 to 2016-17.
Chapter II Performance Audit relating to Government Companies
21
Audit scrutiny indicated:1. WSFL and BEL were mostly dependent on GoWB’s work orders. This showedtheir inability to compete with other players to secure private sector contracts.2. The decline in orders for agency works in respect of WSFL and BEL in 2016-17was a consequence of their omission (August 2016) from the list of GoWB nominatedagencies. This has the potential of affecting the economic viability of project divisionsof WSFL and BEL, unless a plan was put in place by the Government/ Management tobolster their order books.
The Government stated (November 2017) that as there were significant amount ofagency works in WSFL’s and BEL’s hands, they did not attempt to secure works ascontractors. As a result, their works as contractor had declined since 2014-15. Besides,they did not venture in private sector works as it is always safe to undertake Governmentjobs.
However, the reply is not acceptable as total dependency on Government works is notdesirable. This is evident from the present situation arising from their omission asnominated agencies. Since August 2016, they neither had any contract works noragency works in hand.
Audit Findings
Out of 15036 test checked works, it was seen that only 10 were completed37, insteadof the 79 works scheduled to be completed by March 2017. While nine works earneda profit of ` 14.66 crore, one sustained loss of ` 0.96 crore. In respect of the140 incomplete38 works, their final profit or loss was not ascertainable. The auditfindings are discussed in the succeeding paragraphs.
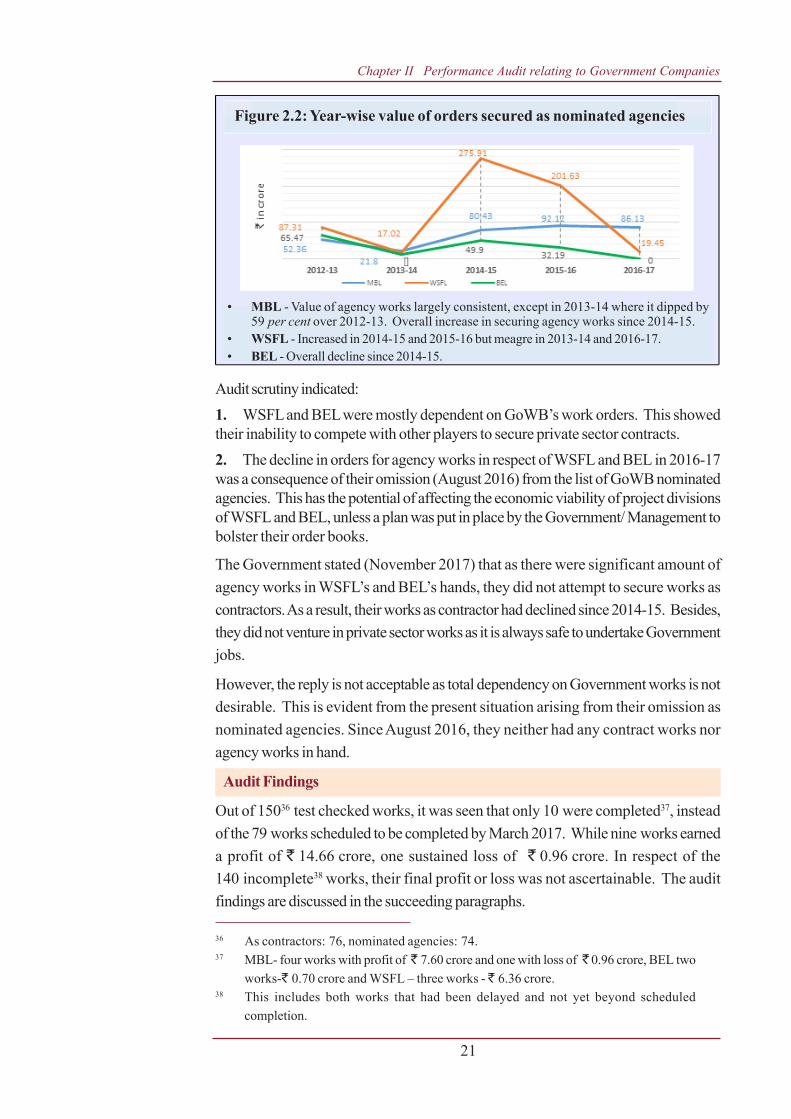
Figure 2.2: Year-wise value of orders secured as nominated agencies
• MBL - Value of agency works largely consistent, except in 2013-14 where it dipped by59 per cent over 2012-13. Overall increase in securing agency works since 2014-15.
• WSFL - Increased in 2014-15 and 2015-16 but meagre in 2013-14 and 2016-17.• BEL - Overall decline since 2014-15.
36 As contractors: 76, nominated agencies: 74.37 MBL- four works with profit of ̀ 7.60 crore and one with loss of ̀ 0.96 crore, BEL two
works-` 0.70 crore and WSFL – three works - ̀ 6.36 crore.38 This includes both works that had been delayed and not yet beyond scheduled
completion.
Audit Report (PSUs) for the year ended 31 March 2017
22
2.8 Lack of due diligence in preparing estimates and framing terms andconditions of contracts
In their role as contractors, the PSUs secure contracts by participation in tendersfloated by various Government departments/ clients. These works were executed eitherdepartmentally or through sub-contractors. Where they were appointed as nominatedagencies, the PSUs were required to select contractors for execution of works basedon estimates/ contracts prepared by the PSUs.
The shortcomings in preparation of estimates and deficiencies in the contracts observedby audit were as follows:
2.8.1 Submission of bids for tenders with unrealistic estimatesThe PSUs were required to submit bids against tenders floated by governmentdepartments/ private agencies to secure orders. For this purpose, PWD guidelinesreiterated39 (November 2014) that estimates were to be prepared based on (i) currentmarket rates (ii) place and nature of work (iii) extent of competition (iv) risk involvedetc. Audit observation showed the following:
(i) Analysis of the 150 selected works showed that 64 works had been quoted“below” the amounts put to tender, 50 “at par” and only 36 “above”. None of thePSUs provided the details/records of the process followed for arriving at the price tobe quoted. Hence, in absence of any record, audit could not conclude whether thePWD guidelines had been followed for assessing the estimates and preparation ofquotations.
(ii) Further, these PSUs had not maintained any database showing particulars of allthe tenders in which they had participated. As such, they were unable to (i) benchmarkthe estimates for similar works against the successful bids and (ii) prepare realistic bidsto make the entire process of tendering a speculative exercise.
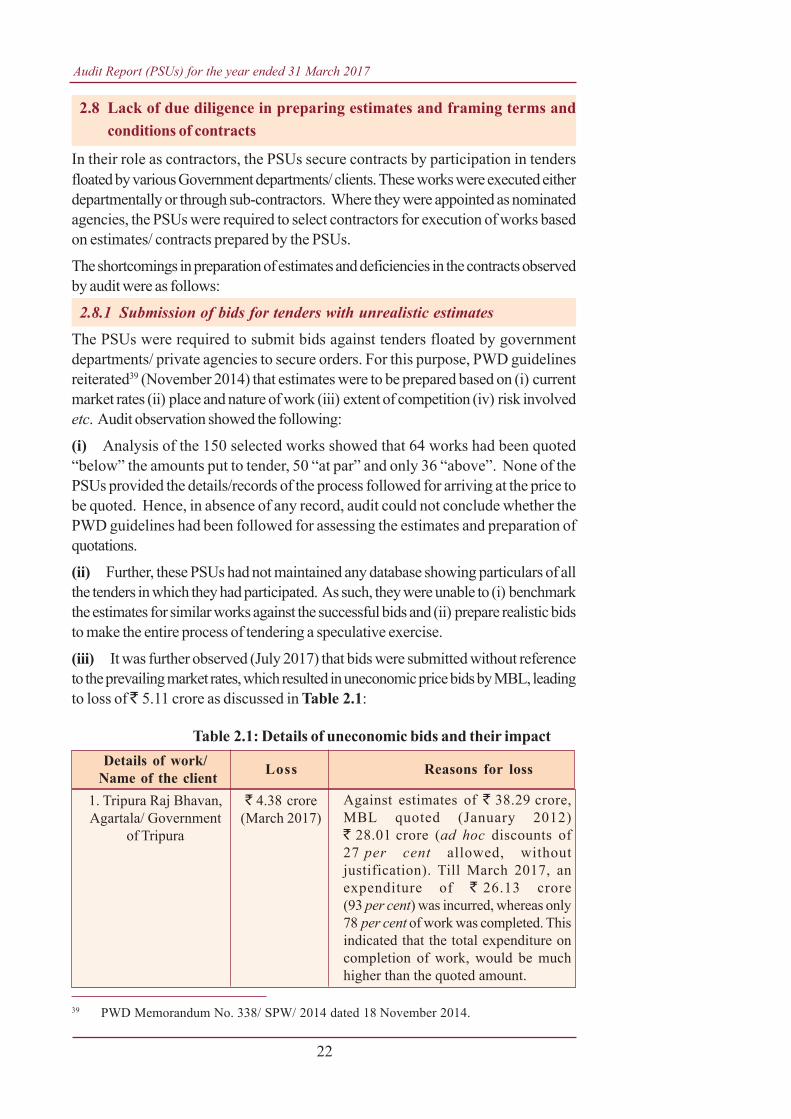
(iii) It was further observed (July 2017) that bids were submitted without referenceto the prevailing market rates, which resulted in uneconomic price bids by MBL, leadingto loss of ̀ 5.11 crore as discussed in Table 2.1:
Table 2.1: Details of uneconomic bids and their impactDetails of work/ Loss Reasons for loss Name of the client
1. Tripura Raj Bhavan, ` 4.38 croreAgartala/ Government (March 2017)
of Tripura
Against estimates of ` 38.29 crore,MBL quoted (January 2012)` 28.01 crore (ad hoc discounts of27 per cent allowed, withoutjustification). Till March 2017, anexpenditure of ` 26.13 crore(93 per cent) was incurred, whereas only78 per cent of work was completed. Thisindicated that the total expenditure oncompletion of work, would be muchhigher than the quoted amount.
39 PWD Memorandum No. 338/ SPW/ 2014 dated 18 November 2014.
Chapter II Performance Audit relating to Government Companies
23
Details of work/ Loss Reasons for loss Name of the client
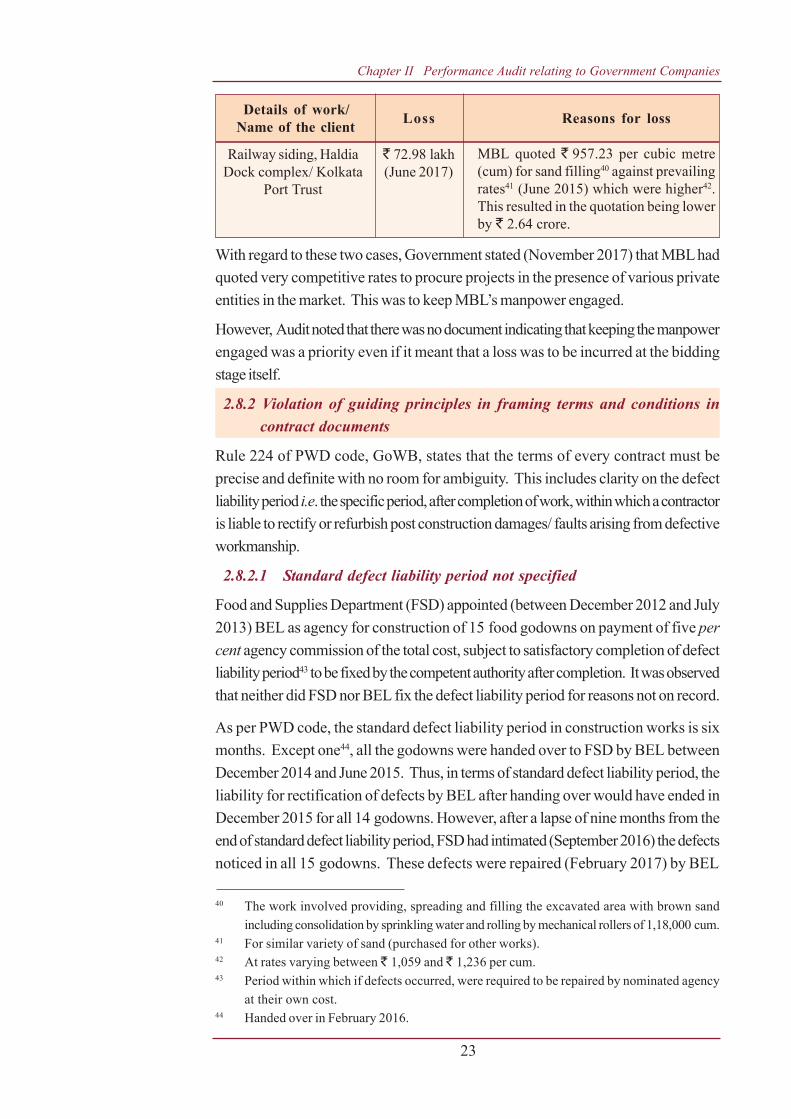
Railway siding, Haldia ` 72.98 lakhDock complex/ Kolkata (June 2017)
Port Trust
With regard to these two cases, Government stated (November 2017) that MBL hadquoted very competitive rates to procure projects in the presence of various privateentities in the market. This was to keep MBL’s manpower engaged.
However, Audit noted that there was no document indicating that keeping the manpowerengaged was a priority even if it meant that a loss was to be incurred at the biddingstage itself.
2.8.2 Violation of guiding principles in framing terms and conditions incontract documents
Rule 224 of PWD code, GoWB, states that the terms of every contract must beprecise and definite with no room for ambiguity. This includes clarity on the defectliability period i.e. the specific period, after completion of work, within which a contractoris liable to rectify or refurbish post construction damages/ faults arising from defectiveworkmanship.
2.8.2.1 Standard defect liability period not specified
Food and Supplies Department (FSD) appointed (between December 2012 and July2013) BEL as agency for construction of 15 food godowns on payment of five percent agency commission of the total cost, subject to satisfactory completion of defectliability period43 to be fixed by the competent authority after completion. It was observedthat neither did FSD nor BEL fix the defect liability period for reasons not on record.
As per PWD code, the standard defect liability period in construction works is sixmonths. Except one44, all the godowns were handed over to FSD by BEL betweenDecember 2014 and June 2015. Thus, in terms of standard defect liability period, theliability for rectification of defects by BEL after handing over would have ended inDecember 2015 for all 14 godowns. However, after a lapse of nine months from theend of standard defect liability period, FSD had intimated (September 2016) the defectsnoticed in all 15 godowns. These defects were repaired (February 2017) by BEL
40 The work involved providing, spreading and filling the excavated area with brown sandincluding consolidation by sprinkling water and rolling by mechanical rollers of 1,18,000 cum.
41 For similar variety of sand (purchased for other works).42 At rates varying between ` 1,059 and ` 1,236 per cum.43 Period within which if defects occurred, were required to be repaired by nominated agency
at their own cost.44 Handed over in February 2016.
MBL quoted ` 957.23 per cubic metre(cum) for sand filling40 against prevailingrates41 (June 2015) which were higher42.This resulted in the quotation being lowerby ` 2.64 crore.
Audit Report (PSUs) for the year ended 31 March 2017
24
through their sub-contractors at ̀ 24.79 lakh. BEL repaired it due to absence ofspecific defect liability period defined in the contract. Audit further observed that thesecurity deposit amounting to ̀ 3.83 crore had not yet been released to BEL. Noefforts for recovery of the security deposit was found on records.
The Government stated (November 2017) that the defects were rectified by thecontractor. BEL complied the request of FSD being Government Department for theinterest of smooth co-ordination and future business. They had preferred claim onFSD for reimbursement of the cost. Moreover, the security deposit had not beenrefunded, even after expiry of two years from the date of completion.
2.8.2.2 Machinery specifications not included in agreements with sub-contractors
For smooth execution of works, the PSUs should stipulate45 the machinery required tobe deployed at the site by the sub-contractors in their tenders/ contracts. PWDstipulated46 (February 2015) standard lists of machinery and equipment for roads,bridges and buildings works to be included in the tender documents. The sub-contractors should possess these machinery and equipment for executing the work.
Audit scrutinised agreements of 15 works47 between the PSUs and their sub-contractors entered into after February 2015. The machinery to be utilised by the sub-contractors was not specified. The reason for this was also not on record. TheGovernment stated (November 2017) that in future, contracts by WSFL and BELwould mention the specific machineries required for executing the work. It added(November 2017) that a clause in MBL’s agreements with sub-contractors impliedthat the sub-contractor would deploy the machinery specified in the client’s tender.
2.8.2.3 Delayed taking over of completed works by clients
Clause 2.8 of the CPWD Manual provides that reasonable advance intimation ofcompletion of the work should be given to the client, for timely taking over of completedworks. None of the agreements/ contracts entered into by the PSUs with their clientsincluded provisions for reimbursement of charges if the clients had delayed in takingover of completed projects/ completed components. Thus, charges for security, re-finishing and re-commissioning, conservancy charges, etc. were borne by the PSUs orsub-contractors executing the work. Further, this unnecessarily prolonged the defectliability/ warranty period also.
Government stated (October 2017) that regular persuasions were made by site officesof BEL and WSFL for transferring the sites. However, fact remained that handing overof completed projects were belated which is stated below:
45 Clause 53.2 of CPWD Manual 2012.46 Memorandum No. 44-W(C)/1 M-24/ 15 dated 13 February 2015.47 Eleven sub–contractor works for MBL and four sub –contractor works for BEL.
Chapter II Performance Audit relating to Government Companies
25
Test check revealed that in 28 agency works of BEL and WSFL, completed betweenJanuary 2015 and March 2017, 15 works had been belatedly (one year) handed overto clients. The remaining 13 were still to be handed over to the client (July 2017).Since all these works had defect liability clause, this had resulted in extension of thedefect liability period. Moreover, agency commission of ̀ 69.52 lakh for these workshad not been received from the clients and safety of the property had not been secured.Government accepted (November 2017) the audit observation.2.9 Execution of works
For the works entrusted by Government Departments to PSUs as a nominated agency,the PSUs execute the work through contractors. In such cases, the role of PSUscomprises, inter-alia, preparation of estimates and drawings, appointment ofcontractors. GoWB mandated48 that the PSUs were to follow the West Bengal PublicWorks Code49. For departmentally executed work, MBL purchased constructionmaterials at prevailing market price through tenders. It then engaged its own employeesas well as piece rate workers (PRW)50 for execution. With regard to execution ofworks by the three PSUs, audit observed the following deficiencies:
2.9.1 Delays in execution of works
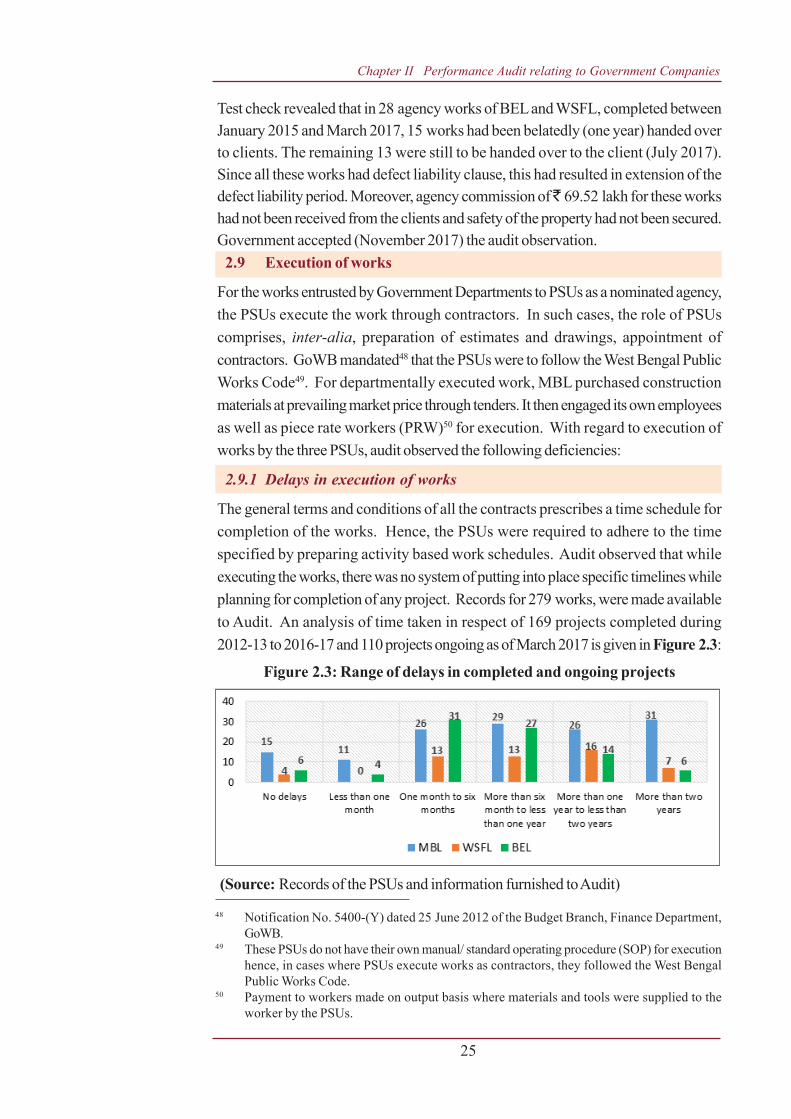
The general terms and conditions of all the contracts prescribes a time schedule forcompletion of the works. Hence, the PSUs were required to adhere to the timespecified by preparing activity based work schedules. Audit observed that whileexecuting the works, there was no system of putting into place specific timelines whileplanning for completion of any project. Records for 279 works, were made availableto Audit. An analysis of time taken in respect of 169 projects completed during2012-13 to 2016-17 and 110 projects ongoing as of March 2017 is given in Figure 2.3:
Figure 2.3: Range of delays in completed and ongoing projects
(Source: Records of the PSUs and information furnished to Audit)
48 Notification No. 5400-(Y) dated 25 June 2012 of the Budget Branch, Finance Department,GoWB.
49 These PSUs do not have their own manual/ standard operating procedure (SOP) for executionhence, in cases where PSUs execute works as contractors, they followed the West BengalPublic Works Code.
50 Payment to workers made on output basis where materials and tools were supplied to theworker by the PSUs.
Audit Report (PSUs) for the year ended 31 March 2017
26
Audit observed that –
(i) The PSUs completed only 8 to 33 per cent of the works within schedule.The remaining works were completed after delays of 51 (MBL), 38 (WSFL)and 36 months (BEL).
(ii) As of March 2017, ` 62.44 crore51 was overdue for payment against86 works52 of three PSUs, completed beyond their scheduled dates ofcompletion. The delays in payments ranged from one day to over threeyears. Out of the total amount overdue, ̀ 43.41 crore was due for morethan a year from the dates of completion of works. There were no recordedreasons for non-payment by clients. However, there was no extension ofcompletion dates and balance confirmation from clients, which may beindicative of these amounts being withheld due to delay in completion.Government stated (November 2017) that there was no communication fromthe clients to suggest that the realisability of debts of WSFL and BEL wasdoubtful.
(iii) In addition, 28 (30 per cent), three (33 per cent) and one (11 per cent)ongoing works of MBL, WSFL and BEL respectively, were in progresseven after two years of scheduled completion. The reasons for delay hadnot been furnished to Audit (November 2017).
(iv) During the scrutiny of the records made available by the PSUs in respect of279 delayed works, it was observed that 134 works53 (value: ` 911.49 crore)were behind schedule for reasons depicted in the following Table 2.2:
Table 2.2: Causes of delay
Particulars No of Valuecases (`̀̀̀̀ in crore)
1. Delay in taking over work sites, free from all 101 648.78encumbrances
2. Delay in receipt of approved design drawings 29 252.76 3. Where both of the above causes existed 4 9.95
Total 134 911.49
The Government accepted (November 2017) the audit observation.
2.9.2 Impact of delays
Completion of works in time obviates the risk of cost overruns, imposition of liquidateddamages on the PSUs and cancellation of contracts by clients. Delays in completionof works resulted in losses aggregating to ̀ 11.13 crore during 2012-13 to 2016-17as discussed given in Table 2.3:51 ` 25.41 crore (MBL)+ ̀ 17.83 crore (WSFL)+ ̀ 19.20 crore (BEL).52 13 (MBL)+40(WSFL)+33(BEL).53 MBL : 12 works (` 198.34 crore), WSFL : 44 works (` 293.37 crore), BEL : 45 works
(` 157.07 crore).
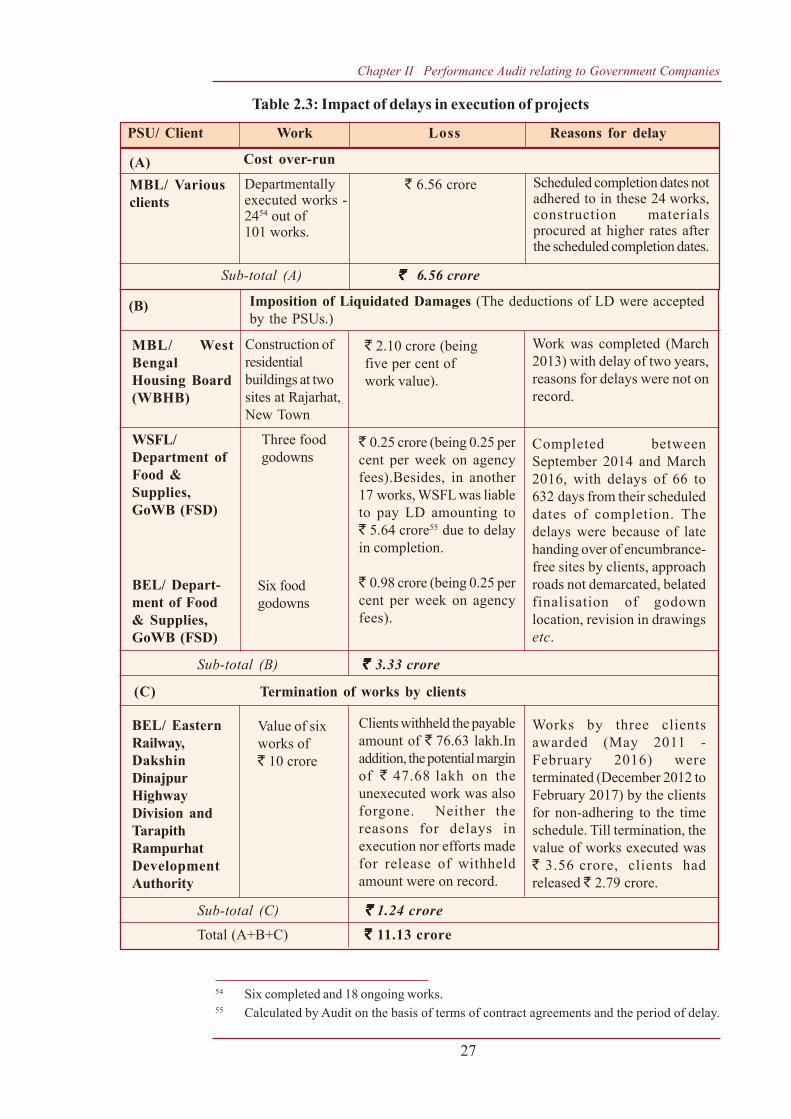
Chapter II Performance Audit relating to Government Companies
27
` 0.25 crore (being 0.25 percent per week on agencyfees).Besides, in another17 works, WSFL was liableto pay LD amounting to` 5.64 crore55 due to delayin completion.
` 0.98 crore (being 0.25 percent per week on agencyfees).
Clients withheld the payableamount of ` 76.63 lakh.Inaddition, the potential marginof ` 47.68 lakh on theunexecuted work was alsoforgone. Neither thereasons for delays inexecution nor efforts madefor release of withheldamount were on record.
Six foodgodowns
Value of sixworks of` 10 crore
Completed betweenSeptember 2014 and March2016, with delays of 66 to632 days from their scheduleddates of completion. Thedelays were because of latehanding over of encumbrance-free sites by clients, approachroads not demarcated, belatedfinalisation of godownlocation, revision in drawingsetc.
Works by three clientsawarded (May 2011 -February 2016) wereterminated (December 2012 toFebruary 2017) by the clientsfor non-adhering to the timeschedule. Till termination, thevalue of works executed was` 3.56 crore, clients hadreleased ` 2.79 crore.
Sub-total (C) `̀̀̀̀ 1.24 croreTotal (A+B+C) `̀̀̀̀ 11.13 crore
Imposition of Liquidated Damages (The deductions of LD were acceptedby the PSUs.)
(B)
Construction ofresidentialbuildings at twosites at Rajarhat,New Town
` 2.10 crore (beingfive per cent ofwork value).
Work was completed (March2013) with delay of two years,reasons for delays were not onrecord.
Three foodgodowns
MBL/ WestBengalHousing Board(WBHB)
WSFL/Department ofFood &Supplies,GoWB (FSD)
BEL/ Depart-ment of Food& Supplies,GoWB (FSD)
BEL/ EasternRailway,DakshinDinajpurHighwayDivision andTarapithRampurhatDevelopmentAuthority
Sub-total (B) `̀̀̀̀ 3.33 crore
(C) Termination of works by clients
54 Six completed and 18 ongoing works.55 Calculated by Audit on the basis of terms of contract agreements and the period of delay.
(A)MBL/ Variousclients
Departmentallyexecuted works -2454 out of101 works.
` 6.56 crore Scheduled completion dates notadhered to in these 24 works,construction materialsprocured at higher rates afterthe scheduled completion dates.
Sub-total (A) `̀̀̀̀ 6.56 crore
Table 2.3: Impact of delays in execution of projects
PSU/ Client Work Loss Reasons for delay
Cost over-run
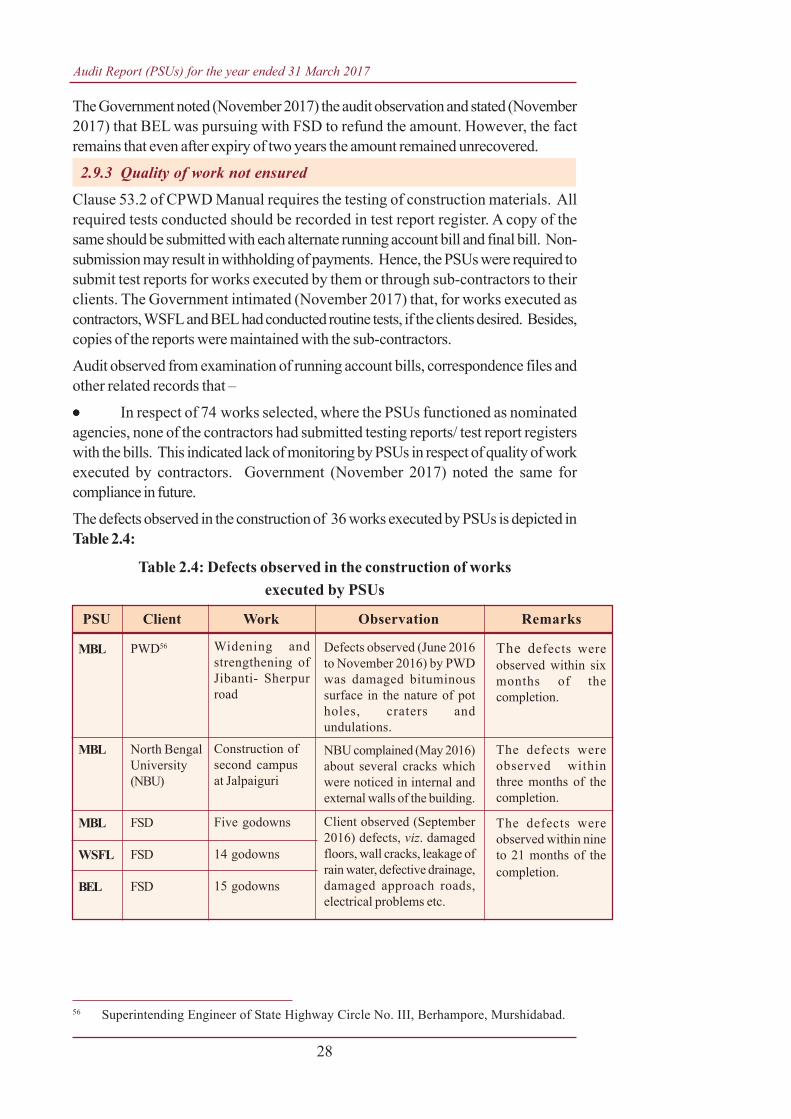
Audit Report (PSUs) for the year ended 31 March 2017
28
MBL
MBL
MBL
WSFL
BEL
PWD56
North BengalUniversity(NBU)
FSD
FSD
FSD
Widening andstrengthening ofJibanti- Sherpurroad
Construction ofsecond campusat Jalpaiguri
Five godowns
14 godowns
15 godowns
The defects wereobserved within sixmonths of thecompletion.
The defects wereobserved withinthree months of thecompletion.
The defects wereobserved within nineto 21 months of thecompletion.
Defects observed (June 2016to November 2016) by PWDwas damaged bituminoussurface in the nature of potholes, craters andundulations.
NBU complained (May 2016)about several cracks whichwere noticed in internal andexternal walls of the building.
Client observed (September2016) defects, viz. damagedfloors, wall cracks, leakage ofrain water, defective drainage,damaged approach roads,electrical problems etc.
56 Superintending Engineer of State Highway Circle No. III, Berhampore, Murshidabad.
The Government noted (November 2017) the audit observation and stated (November2017) that BEL was pursuing with FSD to refund the amount. However, the factremains that even after expiry of two years the amount remained unrecovered.
2.9.3 Quality of work not ensuredClause 53.2 of CPWD Manual requires the testing of construction materials. Allrequired tests conducted should be recorded in test report register. A copy of thesame should be submitted with each alternate running account bill and final bill. Non-submission may result in withholding of payments. Hence, the PSUs were required tosubmit test reports for works executed by them or through sub-contractors to theirclients. The Government intimated (November 2017) that, for works executed ascontractors, WSFL and BEL had conducted routine tests, if the clients desired. Besides,copies of the reports were maintained with the sub-contractors.
Audit observed from examination of running account bills, correspondence files andother related records that –
••••• In respect of 74 works selected, where the PSUs functioned as nominatedagencies, none of the contractors had submitted testing reports/ test report registerswith the bills. This indicated lack of monitoring by PSUs in respect of quality of workexecuted by contractors. Government (November 2017) noted the same forcompliance in future.
The defects observed in the construction of 36 works executed by PSUs is depicted inTable 2.4:
Table 2.4: Defects observed in the construction of worksexecuted by PSUs
PSU Client Work Observation Remarks
Chapter II Performance Audit relating to Government Companies
29
The three PSUs had not provided the information about costs involved in rectification.
In case of widening and strengthening of Jibanti- Sherpur road, Government stated(November 2017) that the damage was due to plying of overloaded vehicles andopening the road to traffic in phases, as and when completed. However, damageswithin the defect liability period supports the fact that quality of work needed closemonitoring.
In case of construction of second campus at Jalpaiguri, Government attributed(November 2017) the defects to technology used for the first time in the region, notbeing according to Indian Standard code. It further stated that such defects wererectified by MBL and additional cost of rectification was approved by the clientDepartment. However, management could not furnish acceptance of claim for additionalcost of rectification.
In case of food godowns, Government stated (November 2017) that the FSD tookover the works long after their completion. The reply is not tenable as late taking overcannot be a reason for defects. It reflects that the quality of construction was notmonitored resulting in defects.
2.9.4 Non-adoption of e-tendering
2.9.4.1 Selection of sub-contractors
GoWB had directed57 (February 2014) that all entities under its’ administrative controlincluding PSUs float e-tenders for works/ purchases exceeding ̀ five lakh. Moreover,MBL’s delegation of financial powers (April 2005) specified that procurements above` 10 lakh were to be made through open tenders in each case.
Audit test checked the selection process of sub-contractors for works tendered byMBL, with value exceeding ̀ one crore for the period 2014-15 to 2016-1758. It wasseen that in none of the cases pertaining to this period, e-tendering process was followedfor sub-contracting the works. In 13 cases out of 137 sub-contracted cases valuing` 33.17 crore, the sub-contractors were selected based on single bids. Hence,competitiveness of the bid could not be ensured.
Further, GoWB had mandated59 (June 2012) e-tendering process to be followed fortenders exceeding ̀ 50 lakh in value for agency works. That limit was reduced to` five lakh in February 201460. Audit observed that two61 PSUs entrusted with worksas nominated agencies had during 2012-13 to 2016-17, engaged contractors in16 works valued at ̀ 34.57 crore without inviting e-tenders.
57 Memorandum No. 1160-F(Y) dated 28 February 2014.58 Data regarding 2012-13 to 2013-14 was not available.59 Notification No. 5400-(Y) dated 25 June 2012 of the Budget Branch, Finance Department,
GoWB.60 Memorandum No. 1160-F(Y) dated 28 February 2014.61 MBL and WSFL.
Audit Report (PSUs) for the year ended 31 March 2017
30
2.9.4.2 Non-revision of panel of sub-contractors
GoWB observed62 (February 2014) that organisations opting for limited tender werenot periodically updating their lists of contractors. Further, MBL’s delegation of authorityand policy/ procedure (April 2005) required periodical review of its’ panel of sub-contractors. Audit observed that MBL had not reviewed and modified its panel ofsub-contractors during 2012-17. Further, Audit noticed that out of 2,639 enlisted sub-contractors, MBL had placed orders only on 548 sub-contractors (20.77 per cent)during 2012-13 to 2016-17. In the absence of records, Audit could not examinewhether the remaining sub-contractors were in existence. It was also seen that WSFLand BEL had not framed any policy for empanelment of sub-contractors. However,the sub-contractors were empanelled annually on payment of fees.
Government stated (November 2017) that MBL had considered the profiles of theenlisted sub-contractors and the requirements of works to select a particular sub-contractor for a specific work. However, the facts remain that it had not reviewed itssub-contractors profile periodically as required in terms of its own policy which wouldhave ensured a wider base of contractors to choose from.
2.9.4.3 Procurement of goods
For procurement of goods also, Audit observed that the MBL had not adopted e-tendering. Eighty orders (out of 173 orders63) valued at ̀ 18.27 crore, (exceeding` 10 lakh) issued by MBL during July 2014 to March 2017, were through singlequotations i.e. 46.24 per cent. Purchases of material on the basis of single quotationand from hand-picked suppliers was highly irregular. There was no assurance that theprices were competitive or reasonable. MBL stated (November 2017) that in someinstances, if specified by the client, procurement had been made from a particularvendor. Also materials were procured from the nearest approved sources throughlocal vendors to reduce other local hazards. However, Audit observed that the fact ofclient specification was not mentioned in any purchase indent. Further, managementdid not specify the purchase proposals where the client specifically stated any vendorpreference. Justification of awarding orders to local vendors to avoid local hazardsdoes not hold good. Moreover, this increased the chances of higher rates and supplyof inferior quality of materials, as discussed in Paragraph 2.9.5.
2.9.5 Economy in material procurement
Out of the three PSUs, only MBL purchased construction materials for executingworks departmentally. During 2012-13 to 2015-16, the cost incurred on purchase ofmaterial in MBL was 41.74 per cent of the cost of construction. Under the purchasepolicy framed (April 2005) by MBL, it maintained a list of empanelled suppliers ofmaterials like cement, steel, bricks etc. Based on indents from work sites, MBLinvited limited tenders from these empanelled suppliers and selected the lowest bidder,from a minimum of three bids.
62 Memorandum No. 1177-F(Y) dated 28 February 2014.63 Records of which were made available to Audit.
Chapter II Performance Audit relating to Government Companies
31
The following points emerged after audit scrutiny:
(a) MBL’s purchase policy stated that the list of suppliers maintained by PurchaseDepartment of MBL should be reviewed by an internal committee and registration ofnew suppliers should be invited through press tenders, preferably once in a year. Itwas observed that this was not done by MBL during 2012-13 to 2016-17.
(b) The PWD-SOR, 2013 classified the costs of building works in West Bengal intosix zones. According to PWD-SOR, the maximum variation in rates observed acrossthe zones was within 40 per cent64. It was observed that MBL did not fix zone-wisenorms for procurement of materials which would have provided an opportunity tocompare actual purchase prices with the PWD SOR rates prevailing in that zone.Audit compared the rates of three items viz. sand, bricks and grit/ stone chips whichwere procured across West Bengal on the same day. It was observed that in202 instances during 2012-13 to 2016-17, variations in procurement rates were 41to 1,727 per cent i.e. more than 40 per cent. This indicated that MBL had notprocured materials at competitive rates. The value of these variations resulted in extraexpenditure of ̀ 1.93 crore on procurement of these materials by MBL.
(c) In 143 instances on the same date, MBL had placed purchase orders forprocurement of the same construction materials like grits/ stone chips, brick and sandat different rates for work sites in the same/ adjacent locations. The variation in ratesor the materials purchased on same date and same location ranged between 1 to270 per cent. Consequently, during 2012-13 to 2016-17, MBL had incurred extraexpenditure of ̀ 0.53 crore on their procurement.
Government stated (November 2017) that in some instances, if specified by the clients,MBL had procured materials from a particular vendor. Also materials were procuredfrom the nearest approved sources through local vendors to reduce other local hazards.It was observed that vendor preference made by the client was not available in recordsand thus, was unverifiable. Also the fact remains that awarding orders to local vendorsto avoid local hazards led to procurement of commonly available building materials atan additional cost of ̀ 2.46 crore as pointed out by Audit which imposed an additionalfinancial burden on MBL. Further, the same was not brought into the notice of theGovernment.
2.9.6 Variations in executed quantity
According to Section 24, read with Clause 12 of the General Conditions of Contract,of the CPWD Works Manual 2014, the contractor should send to the client once inevery three months, an up to date account giving complete details of all claims foradditional payments. This should also contain list of all the additional works orderedby the client. The contractor shall be deemed to have waived his right to claim theamount, if this was not complied. Instances of extra works and additional items ofwork undertaken by MBL without prior approval of clients and their impact are statedin Table 2.5:
64 Based on variance in rates for Composite Brick work as per SOR 2013 of Building Works.
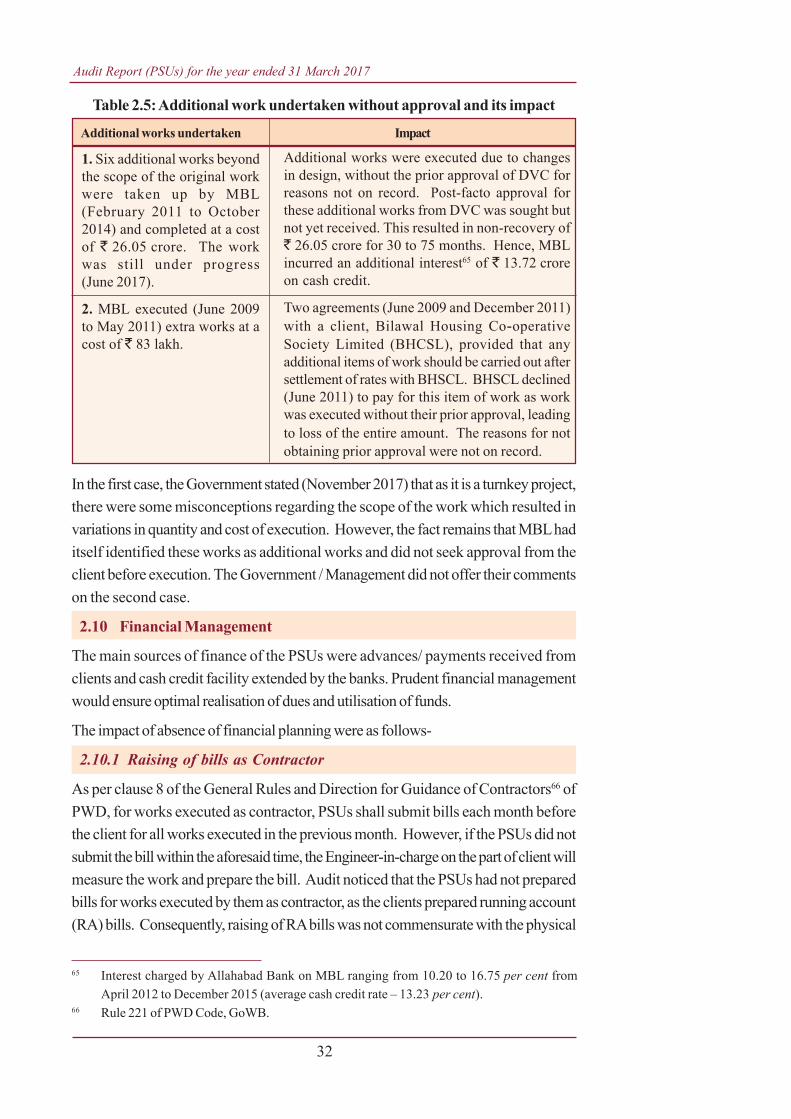
Audit Report (PSUs) for the year ended 31 March 2017
32
Table 2.5: Additional work undertaken without approval and its impact
Additional works undertaken Impact
In the first case, the Government stated (November 2017) that as it is a turnkey project,there were some misconceptions regarding the scope of the work which resulted invariations in quantity and cost of execution. However, the fact remains that MBL haditself identified these works as additional works and did not seek approval from theclient before execution. The Government / Management did not offer their commentson the second case.
2.10 Financial Management
The main sources of finance of the PSUs were advances/ payments received fromclients and cash credit facility extended by the banks. Prudent financial managementwould ensure optimal realisation of dues and utilisation of funds.
The impact of absence of financial planning were as follows-
2.10.1 Raising of bills as Contractor
As per clause 8 of the General Rules and Direction for Guidance of Contractors66 ofPWD, for works executed as contractor, PSUs shall submit bills each month beforethe client for all works executed in the previous month. However, if the PSUs did notsubmit the bill within the aforesaid time, the Engineer-in-charge on the part of client willmeasure the work and prepare the bill. Audit noticed that the PSUs had not preparedbills for works executed by them as contractor, as the clients prepared running account(RA) bills. Consequently, raising of RA bills was not commensurate with the physical
65 Interest charged by Allahabad Bank on MBL ranging from 10.20 to 16.75 per cent fromApril 2012 to December 2015 (average cash credit rate – 13.23 per cent).
66 Rule 221 of PWD Code, GoWB.
1. Six additional works beyondthe scope of the original workwere taken up by MBL(February 2011 to October2014) and completed at a costof ` 26.05 crore. The workwas still under progress(June 2017).
2. MBL executed (June 2009to May 2011) extra works at acost of ` 83 lakh.
Additional works were executed due to changesin design, without the prior approval of DVC forreasons not on record. Post-facto approval forthese additional works from DVC was sought butnot yet received. This resulted in non-recovery of` 26.05 crore for 30 to 75 months. Hence, MBLincurred an additional interest65 of ` 13.72 croreon cash credit.
Two agreements (June 2009 and December 2011)with a client, Bilawal Housing Co-operativeSociety Limited (BHCSL), provided that anyadditional items of work should be carried out aftersettlement of rates with BHSCL. BHSCL declined(June 2011) to pay for this item of work as workwas executed without their prior approval, leadingto loss of the entire amount. The reasons for notobtaining prior approval were not on record.
Chapter II Performance Audit relating to Government Companies
33
progress of works. The Government noted (November 2017) the audit observationin respect of WSF and BEL. Government stated (November 2017) that as per GoWBnorms, MBL as the contractor would submit a statement of work done. The clientwas to draw the corresponding RA bills in the Measurement Books. Government’sreply was not correct as the General Rules and Direction for Guidance of Contractorsof PWD specifies that it was the responsibility of the contractors to raise bills.
The three PSUs could furnish status reports for 8667 out of 139 ongoing works as ofMarch 2017. From the status reports, it was observed that the stage of completionranged between five to 99 per cent of the work value. Accordingly, the amount to bebilled as on March 2017 stood at ̀ 886.20 crore, against which the PSUs had billed` 752.05 crore. The value of bills not raised against these works by the three PSUswas ̀ 134.15 crore.
As PSUs depend on borrowed capital for meeting their working capital requirements,belated raising of bills led to payment of additional interest on cash credit. In absenceof periodic progress reports, the periods for which this amount had not been billedcould not be quantified in audit.
The Government stated (November 2017) that in respect of WSFL and BEL, RA billswere prepared by the clients’ subject to availability of fund in the Departments. However,timely raising of bills is an integral part of credit management and the PSUs shouldadhere to the rules in raising bills as per PWD norms.
2.10.2 Advance for agency works
GoWB notified68 (February/ June 2013) the procedure for drawing of advances anddisbursement of funds to PSUs by non-works departments against agency worksexecuted by the PSUs. Release of advances by the departments to PSUs was againstthe funds requisitioned by the PSUs, based on different stages of execution of works69.The PSUs did not keep the details of date wise requisitions of funds placed by them tomonitor that such requisitions were made on time as-well-as keeping parity with thework progress. The reasons were not on record. From the work status report ofagency works furnished by WSFL and BEL, it was seen that for 70 works70 the amountof funds receivable was ̀ 180.97 crore, according to payment procedure approvedby the Government upto March 2017. However, the actual funds received by thePSUs from the departments were ̀ 149.28 crore. Since timely receipt of funds fromdepartments is essential for execution of work, short receipt of funds amounting to` 31.69 crore hindered the progress of agency jobs.
67 Seventy works for MBL, nine works for WSFL and seven works for BEL.68 Nos. 1240 –F(Y) dated 18 February 2013 modified by 4470-F(Y) dated 05 June 2013.69 On signing of agreement – 10 per cent, start of construction – further 40 per cent,
50 per cent completion – further 25 per cent and on full completion – further 20 per cent.70 WSFL : 44 works and BEL : 26 works.
Audit Report (PSUs) for the year ended 31 March 2017
34
71 No. 5400-F(Y) dated 25 June 2012.72 Notification No. 5400-(Y) dated 25 June 2012 of the Budget branch, Finance Department,
GoWB.
The Government assured (November 2017) that timely placement of requisition wouldbe ensure for funds corresponding to physical progress and according to the Governmentnotification.
2.10.3 Agency fees not claimed by PSUs
In terms of GoWB’s notification71 (June 2012), every nominated agency was responsiblefor selection/ appointment of contractors, monitoring of the works, vetting of bills,compliance of statutory norms, release of payments etc. In order to carry out thework, the agency was entitled to get agency fees, which was a percentage of the valueof works entrusted by the client. As of March 2017, the following issues were observed:
••••• During 2012-13 to 2016-17, MBL had completed 38 agency works, yet it hadnot billed agency fees valued at ̀ 5.35 crore.
••••• During 2012-13 to 2016-17, WSFL had completed 71 agency works, it had notyet billed agency fees valued at ̀ 17.56 crore for 63 works.
Government stated (November 2017) that WSFL would take steps for necessarycompliance by way of (i) timely recording the completion and handing over date and(ii) intimation to its Accounts Department. Government did not reply (November 2017)with regard to MBL.
2.10.4 Under-recovery of Agency fees
GoWB notified72 (June 2012) that the nominated agencies were entitled to agencyfees of 5.50 per cent of the value of works with two per cent was for tendering andthree and half per cent for monitoring and supervision.
Audit observed that during 2012-13 to 2016-17:
• MBL had completed seven agency works wherein it had kept margins at 4.75 percent i.e. below the admissible 5.50 per cent, resulting in under charging of agencyfees of ̀ 27.43 lakh. Government stated (November 2017) that MBL had to acceptlower rates on the request of client in few specific cases. However, the fact remainsthat both the PSU and its clients had deviated from the criteria fixed by the Government.
• WSFL had completed 42 works wherein it had kept margins of three to five percent which was lower than the admissible 5.50 per cent. This resulted in under chargingof agency fees of ̀ 3.02 crore.
• BEL had executed 71 works where margins were 3.50 to five per cent that waslower than the allowable 5.50 per cent. This resulted in under charging of agency feesof ̀ 1.09 crore.
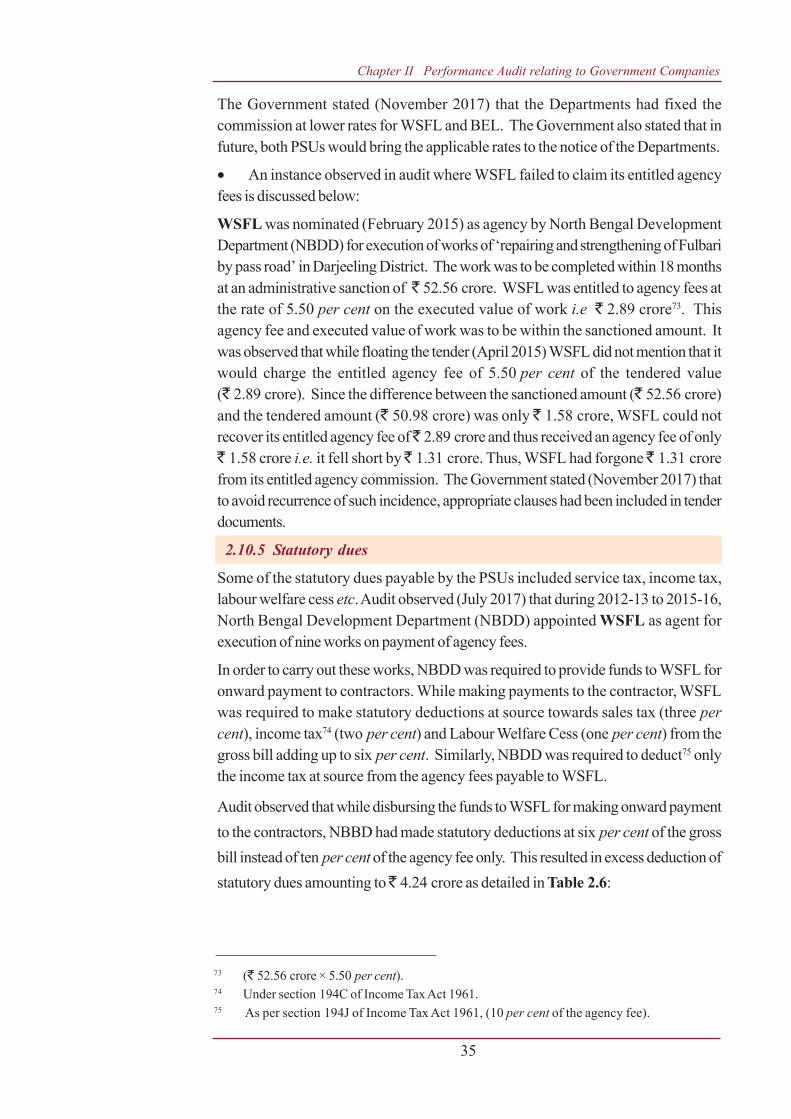
Chapter II Performance Audit relating to Government Companies
35
The Government stated (November 2017) that the Departments had fixed thecommission at lower rates for WSFL and BEL. The Government also stated that infuture, both PSUs would bring the applicable rates to the notice of the Departments.
• An instance observed in audit where WSFL failed to claim its entitled agencyfees is discussed below:
WSFL was nominated (February 2015) as agency by North Bengal DevelopmentDepartment (NBDD) for execution of works of ‘repairing and strengthening of Fulbariby pass road’ in Darjeeling District. The work was to be completed within 18 monthsat an administrative sanction of ̀ 52.56 crore. WSFL was entitled to agency fees atthe rate of 5.50 per cent on the executed value of work i.e ` 2.89 crore73. Thisagency fee and executed value of work was to be within the sanctioned amount. Itwas observed that while floating the tender (April 2015) WSFL did not mention that itwould charge the entitled agency fee of 5.50 per cent of the tendered value(` 2.89 crore). Since the difference between the sanctioned amount (` 52.56 crore)and the tendered amount (` 50.98 crore) was only ̀ 1.58 crore, WSFL could notrecover its entitled agency fee of ̀ 2.89 crore and thus received an agency fee of only` 1.58 crore i.e. it fell short by ̀ 1.31 crore. Thus, WSFL had forgone ̀ 1.31 crorefrom its entitled agency commission. The Government stated (November 2017) thatto avoid recurrence of such incidence, appropriate clauses had been included in tenderdocuments.
2.10.5 Statutory dues
Some of the statutory dues payable by the PSUs included service tax, income tax,labour welfare cess etc. Audit observed (July 2017) that during 2012-13 to 2015-16,North Bengal Development Department (NBDD) appointed WSFL as agent forexecution of nine works on payment of agency fees.
In order to carry out these works, NBDD was required to provide funds to WSFL foronward payment to contractors. While making payments to the contractor, WSFLwas required to make statutory deductions at source towards sales tax (three percent), income tax74 (two per cent) and Labour Welfare Cess (one per cent) from thegross bill adding up to six per cent. Similarly, NBDD was required to deduct75 onlythe income tax at source from the agency fees payable to WSFL.
Audit observed that while disbursing the funds to WSFL for making onward paymentto the contractors, NBBD had made statutory deductions at six per cent of the grossbill instead of ten per cent of the agency fee only. This resulted in excess deduction ofstatutory dues amounting to ̀ 4.24 crore as detailed in Table 2.6:
73 (` 52.56 crore × 5.50 per cent).74 Under section 194C of Income Tax Act 1961.75 As per section 194J of Income Tax Act 1961, (10 per cent of the agency fee).
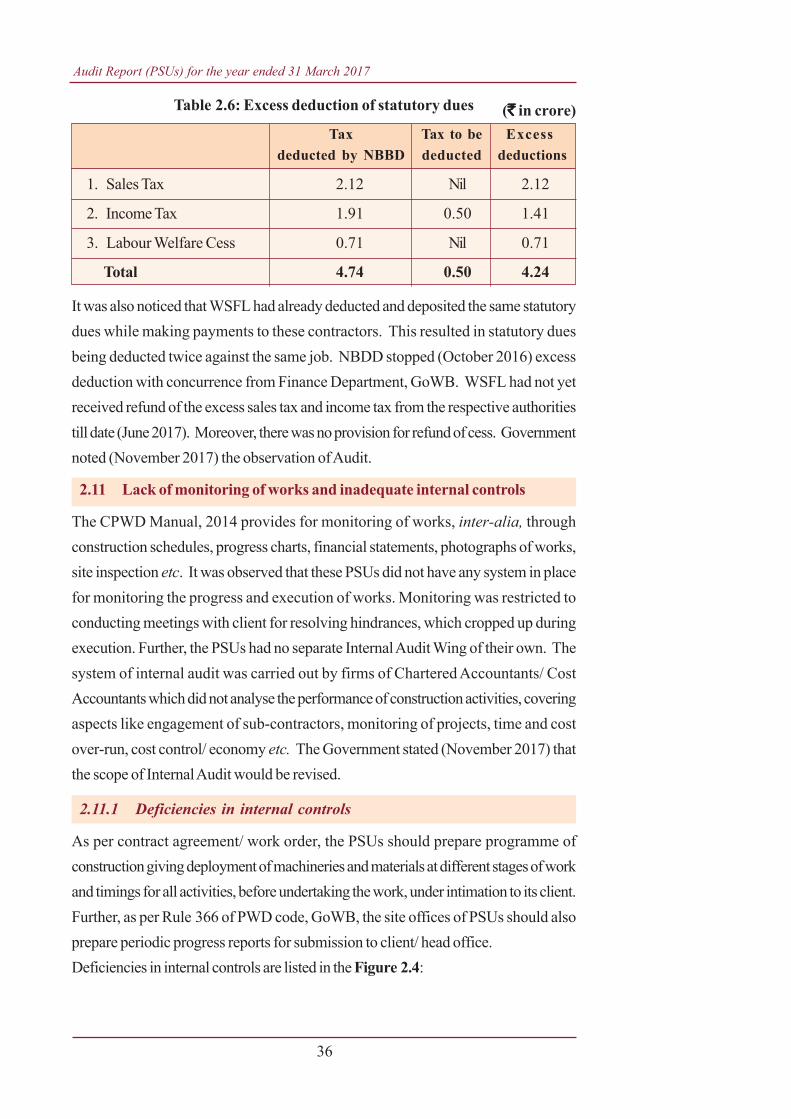
Audit Report (PSUs) for the year ended 31 March 2017
36
Table 2.6: Excess deduction of statutory dues
Tax Tax to be Excessdeducted by NBBD deducted deductions
1. Sales Tax 2.12 Nil 2.12
2. Income Tax 1.91 0.50 1.41
3. Labour Welfare Cess 0.71 Nil 0.71
Total 4.74 0.50 4.24
It was also noticed that WSFL had already deducted and deposited the same statutorydues while making payments to these contractors. This resulted in statutory duesbeing deducted twice against the same job. NBDD stopped (October 2016) excessdeduction with concurrence from Finance Department, GoWB. WSFL had not yetreceived refund of the excess sales tax and income tax from the respective authoritiestill date (June 2017). Moreover, there was no provision for refund of cess. Governmentnoted (November 2017) the observation of Audit.
2.11 Lack of monitoring of works and inadequate internal controls
The CPWD Manual, 2014 provides for monitoring of works, inter-alia, throughconstruction schedules, progress charts, financial statements, photographs of works,site inspection etc. It was observed that these PSUs did not have any system in placefor monitoring the progress and execution of works. Monitoring was restricted toconducting meetings with client for resolving hindrances, which cropped up duringexecution. Further, the PSUs had no separate Internal Audit Wing of their own. Thesystem of internal audit was carried out by firms of Chartered Accountants/ CostAccountants which did not analyse the performance of construction activities, coveringaspects like engagement of sub-contractors, monitoring of projects, time and costover-run, cost control/ economy etc. The Government stated (November 2017) thatthe scope of Internal Audit would be revised.
2.11.1 Deficiencies in internal controls
As per contract agreement/ work order, the PSUs should prepare programme ofconstruction giving deployment of machineries and materials at different stages of workand timings for all activities, before undertaking the work, under intimation to its client.Further, as per Rule 366 of PWD code, GoWB, the site offices of PSUs should alsoprepare periodic progress reports for submission to client/ head office.Deficiencies in internal controls are listed in the Figure 2.4:
(`̀̀̀̀ in crore)

Chapter II Performance Audit relating to Government Companies
37
Figure 2.4: PSU-wise deficiencies in internal controls
Government stated (November 2017) that usually MBL received monthly progressreports from project sites at regular intervals with exception of some sites. Further,WSFL and BEL would consider preparation of monthly progress reports.
MBL
WSFL
BEL
• As a contractor, had prepared monthly progress reports for only 23 per centongoing works ( March 2017).
• No monthly progress reports prepared for agency works.• Work programme omitted information regarding deployment of men,
machineries and material.• Project monitoring committee not constituted, Board rarely discussed
implementation of works at its Meetings, no directions on follow-up issued.• None of the site offices (four works) maintained required registers which resulted
in formal extension of implementation period sparingly sought for by the PSUsas they could not be supported by chronological noting of cessation of work/reasons thereof, impact included cost overrun and liquidated damages.
• MIS lacked date of commencement/ completion, valid time extensions, statusof bill drawn/ realized, withheld/ retention amount, defect liability period, etc.
• Reconciliation of stocks with consumption norms not undertaken; workscompletion certificates (including handing over taking over records)/ runningaccount bills not maintained; and capacity/ performance of empaneledcontractors not evaluated.
• Monthly progress reports for ongoing projects not prepared.• Work programme omitted information regarding deployment of men,
machineries and material.• Monitoring committee for civil engineering projects, met six times in three
months and held no meetings thereafter (March 2017).• No registers maintained at site offices.• Formal extension of implementation schedule beyond the stipulated time
not available, impact included cost overrun.• No Information Technology cell.• Reconciliation of stocks with consumption norms not undertaken; works
completion certificates (including handing over taking over records)/ runningaccount bills not maintained; and capacity/ performance of empaneledcontractors not evaluated.
• Monthly progress reports for ongoing projects not prepared.• Work programme omitted information regarding deployment of men,
machineries and material.• Monitoring committee to oversee progress constituted in August 2012,
met only twice as no periodicity prescribed.• No registers maintained at site offices. Formal extension of implementation
schedule beyond the stipulated time not available, as such, impactsincluded liquidated damages and termination of projects.
• No Information Technology cell.• Reconciliation of stocks with consumption norms not undertaken; works
completion certificates (including handing over taking over records)/ runningaccount bills not maintained; and capacity/ performance of empaneledcontractors not evaluated.
Audit Report (PSUs) for the year ended 31 March 2017
38
2.11.2 Deployment of manpower
The Government notification for appointment of PSUs as nominated agencies forsupervision and monitoring of works provided for the deployment of one graduateengineer along with two diploma engineers for each work. Management of MBLstated (November 2016) that at least one Engineer was deployed at all sites; WSFLand BEL did not fix any criteria for posting of engineers at site. During 2012-17, theratio of jobs to manpower for MBL was 1.49. In the same period, the correspondingratios for BEL and WSFL were 2.24 and 3.96 respectively.
Thus, MBL, WSFL and BEL had not deployed adequate staff at site offices forsupervision as per the norm fixed by GoWB. Government stated (November 2017)that MBL manoeuvred its work force in such a manner that two or more projectslocated within near vicinity are entrusted to a particular engineer so as to optimise theirutilisation. However the reply itself is contradictory to the Government order. Further,the following points emerged –
• BEL’s site office at Malda had one person managing 27 works valuing` 57.55 crore spread over entire North Bengal covering eight districts. The distancefrom work sites to site office in 27 cases ranged between 38 km to 285 km.
• Similarly, WSFL’s site office at Bankura had one person managing 75 projectsvaluing ̀ 232.86 crore spread over entire South Bengal. The distance from worksites to site office in 75 cases ranged between 45 Km to 275 Km.
Government noted (November 2017) the audit observation and also stated that afterrestructuring work, needful action would be taken with regard to WSFL and BEL.
2.11.3 Inspection at site offices
Clause 5.2 of CPWD manual prescribes inspection of work at various stages bydifferent levels of officers. The officers conducting inspection, should make recordingsof inspection notes in the inspection register before passing the bill of the contractor. Itwas observed that there was no system of recording of inspections at site offices andthe findings were not documented. As a result, adequacy and effectiveness of inspectionby the PSUs could not be evaluated.
Government stated (November 2017) that inspections were conducted by the PSUsat regular intervals. However, there was no system of notings. In this regard it may bestated that recordings of Inspection notes should be maintained for follow-up measures.
2.12 Conclusion
The Performance Audit on management of works by three PSUs-MBL, BEL andWSFL noted that due diligence was not observed in preparing estimates and finalisingcontracts for various construction works/ projects. Deficiencies were noticed in makingrealistic estimation of tender price.
Chapter II Performance Audit relating to Government Companies
39
The PSUs violated guiding principles in framing terms and conditions in contractdocuments, viz. absence of provisions for defect liability period, ensuring deploymentof adequate men and machinery and takeover of completed works by clients.
With regard to execution of works, Audit found that the works were not completedwithin schedule, which resulted in time overrun in most works. This had imposedadditional financial burden on the PSUs by way of cost overrun, imposition of liquidateddamages and termination of works by clients which were mostly avoidable. Moreover,quality of works executed was not ensured. Besides, contractors and sub-contractorswere selected through limited tenders without ensuring wide publicity and the e-tenderingprocess was not followed. As a result, additional expenditure was incurred on materialprocurement and extra expenditure incurred on executing additional works withoutprior approval.
Financial management did not ensure maximisation of revenue as bills were belatedlyraised, advances were not recovered in time and agency fees were not claimed by thePSUs.
Deficiencies in monitoring of works, preparation of reports and deployment ofmanpower at work sites were observed. Internal controls were inadequate due toabsence of internal audit and non-preparation of documents/ reports to ensure bettermanagement control over the performance of the PSUs.
Recommendations:
It is recommended that the PSUs may -
• Maintain a database of their bids with rates.
• Prepare a checklist of terms and conditions that should invariably beincluded in each contract.
• Ensure that the tenders are given wide publicity.
• Update and revise periodically the database of material suppliers andsub-contractors.
• Obtain prior approval before undertaking additional works.
• Update their lists of on-going works and monitor payments to be receivedas per laid down timelines and actually received against these works.

CHAPTER III

Chapter III Compliance Audit
41
CHAPTER III
3. Compliance Audit
Important audit findings arising out of test check of transactions made by theState Government companies/ corporations are included in this chapter.
STATE TRANSPORT UNDERTAKINGS
3.1 Vehicular Emission by State Transport Undertakings in West Bengalduring the period from 2012-13 to 2016-17
3.1.1 Introduction
According to the State of Environment Report, air pollution is proving to be anissue of concern in India. Air pollution and its resultant impacts can be attributedto emissions from vehicular, industrial and domestic activities. According to theCentral Pollution Control Board (CPCB), transport sector contributes to 70 percent of total pollution in Metros. Around 32 per cent of West Bengal’s populationlives76 in locations, where the air quality is affected by emissions from industrialsources and road traffic.
By reducing air pollution levels, the burden of disease from stroke, heart disease,lung cancer and both chronic and acute respiratory diseases, including asthma,can be reduced.
CPCB77 and West Bengal Pollution Control Board (WBPCB) pointed out78 thatvehicular emission is caused by (i) high average age of vehicles, (ii) increase inthe number of vehicles, (iii) congestion, (iv) excessive fuel consumption,(v) adulteration of fuel and fuel products, (vi) absence of mass rapid transportsystems etc. in operation of vehicles. CPCB observed (March 2010) that vehicularemissions can be controlled/ reduced through a combination of technical andnon-technical measures. The technical measures include (i) improving fuelquality, (ii) enforcing vehicle emission norms, (iii) monitoring issue of PollutionUnder Control (PUC) Certificates, (iv) using vehicles with advanced emissioncontrol devices, (v) issuing ‘Certificate of Fitness’(CF) for ‘in-use’ vehicles onlyafter inspection and requisite maintenance etc. Non-technical measures includebuilding capacity for monitoring of vehicular emissions as well as ensuringenvironmental accounting and reporting.
76 Source: State of Environment Report of West Bengal 2016, P/243.77 Source: Para-1.0 of the Report of CPCB on Status of the vehicular pollution control
programme in India-March 2010.78 Source: Annual Report (2012-13), Page-31
Audit Report (PSUs) for the year ended 31 March 2017
42
In West Bengal, five State Transport Undertakings (STUs)79, owned by theGovernment of West Bengal (GoWB), run bus services across the state as wellas in the neighbouring states. These STUs function under the overall guidance,control and policy of the Transport Department, GoWB.
Operational Performance
As of March 2017, these five STUs held 2,821 buses operating from 55 depots.In addition, they operated nine workshops80. The status of performances of theSTUs in 2016-17 is given in Annexure 5.
3.1.2 Objective, Scope and Methodology of Audit
This thematic audit on impact of vehicular emissions by these five STUs wasconducted between April 2017 and June 2017. It covered the period from April2012 to March 2017 to evaluate:
• The Environment Plan and Policy outlined by the Government formitigation of vehicular emissions by the STUs, and
• Environment Management System for reduction of emissionsimplemented by the STUs and the impact of vehicular emissions.
Audit methodology involved scrutiny of records maintained at the Head Officesof the five STUs and 1681 depots (out of 55 depots). The related records of(i) WBPCB; (ii) Environment Department, GoWB; (iii) Public Vehicles Department(PVD), (iv) Kolkata/ West Bengal Police: Traffic Sections and (v) TransportDepartment, GoWB were also checked. Joint inspections at different locations ofSTUs were done. Testing of smoke emitted by STU-owned buses with smokemeters was carried out in the presence of officials of the STUs, etc.
Audit findings were reported to the (i) Transport Department, GoWB,(ii) the Environment Department, GoWB, (iii) WBPCB and (iv) the respectiveSTUs in July 2017. Views/ replies82 of the Transport Department, GoWB,WBPCB had duly been considered while finalising this Thematic Audit Report.
79 Calcutta State Transport Corporation (CSTC), West Bengal Transport CorporationLimited (WBTCL) and West Bengal Surface Transport Corporation Limited (WBSTCL)cater to the passengers of Kolkata and its suburbs. South Bengal State TransportCorporation (SBSTC) caters to the passengers of South Bengal while North Bengal StateTransport Corporation (NBSTC) caters to the passengers of North Bengal. Operationareas are after route rationalisation in June 2014 by GoWB.
80 Central Workshops-2 (CSTC-1 and WBTCL-1), Divisional Workshops-7 (SBSTC-2 andNBSTC-5).
81 CSTC: Nilgunge, Paikpara, Lake and Taratala; WBTCL: Ghasbagan and Tollygunge;WBSTCL: Howrah; SBSTC: Arambag, Haldia, Belghoria and Durgapur; NBSTC: Suri,Dinhata, Berhampore, Cooch Behar and Siliguri.
82 The STUs did not submit their views/ replies till January 2018.
Chapter III Compliance Audit
43
3.1.3 Audit Criteria
The audit criteria adopted for assessing the achievement of audit objectives werederived from-
• Environment Policies of Government of India (GoI) and GoWB, plansand performance of the STUs;
• Acts, rules, regulations and notifications issued by the Central/ StatePollution Control Boards and Ministry of Environment and Forests, GoIand GoWB;
• Original Equipment Manufacturer’s Manual (OEM) on repair andmaintenance of buses;
• Guidelines of the Ministry of Road Transport and Highways (MORTH),GoI; orders of the Hon’ble Supreme Court of India/ Hon’ble CalcuttaHigh Court/ Hon’ble National Green Tribunal (NGT), benchmarksapplicable in other countries as well as good practices followed by otherSTUs.
Audit findings
The thematic audit brought out the deficiencies relating to control of vehicularemissions by the five STUs which are discussed in the succeeding paragraphs:
3.1.4 Planning for reduction of emissions
3.1.4.1 Non-preparation of plans
Government of India (GoI) had brought out National Conservation Strategy andPolicy Statement on Environment and Development in 1992. Based on this, theGovernment of West Bengal (GoWB) had adopted (June 1995) the PolicyStatement on Environmental Protection and Conservation of Natural Resources.Subsequently, GoWB framed (April 2012) the West Bengal State Action Plan onClimate Change. Specific roles were assigned to different departments, includingthe Transport Department. The policy and action plan included actions that wereto be taken by concerned departments in order to mitigate green-house gasemissions. These were (i) encourage shifting from use of private to publictransport, (ii) reduce use of fossil fuel through increased transmission efficiency,(iii) replace significant share of current stock of para-transit83 and non-motorisedvehicles modes with electric/solar powered vehicles.
83 Para transit includes auto-rickshaws and cycle-rickshaws.
Audit Report (PSUs) for the year ended 31 March 2017
44
Audit observed (April to June 2017) that there was a time lag of about 17 yearsbetween the adoption of Policy Statement and framing of State Action Plan.However, there were no recorded reasons. The Transport Department had alsonot prepared requisite action plans to (i) protect and safeguard the environmentfrom pollution, and (ii) mitigate green-house gas emissions arising out ofvehicular emissions in operation of its STUs as stated in the EnvironmentalPolicy Statement and the State Action Plan. Moreover, the Government of WestBengal (GoWB) had also not chalked out an overall air-quality managementplan. The Transport Department while accepting (November 2017) theobservation did not intimate any reason for non-preparation of such action plans.
The Transport Department stated that the Environment Department, GoWB,looked after (November 2017) the overall environmental management and controlof environmental pollution. The Environment Department, in its’ reply(December 2017) had not responded to the audit findings. However, the TransportDepartment was silent about its own role in reduction of emission from STUslike preparation of action plans etc.
3.1.4.2 Non-creation of infrastructure for supply of CNG/ CBM
The Transport Department, GoWB held (July 2011) a meeting with WBPCB,oil marketing companies (OMCs) and coal bed methane (CBM)84 producingcompanies. It was decided to (i) make available CBM as a clean fuel for publictransport vehicles in Kolkata by December 2011 and (ii) OMCs would install aCBM dispensing station at either Kasba or Salt Lake depots of CSTC to ensuresupply of CBM for proposed CNG driven State Government buses. Besides,CBM producing companies would furnish information regarding the productionand availability of CBM for transport sector in Kolkata.
Audit observed that no action on the issues above had yet been taken by GoWB.Audit further observed that during 2011-12 to 2015-16, the production of CBMin West Bengal rose from 79.106 to 389.423 MMSCM85 i.e., the State’s share ofIndia’s total production expanded from 94 to 99 per cent. This could have beenused to lower release of air emissions. Besides, a CBM distribution networkwas operational since 2010 in the Asansol-Durgapur area. Mass transport vehiclesin that area consumed approximately 1.80 tonnes of CNG daily in 2010-11 ascompared to 0.51 tonnes by STUs in Asansol and Durgapur during Februaryand March 2017.
84 According to Directorate General of Hydrocarbons, Coal Bed Methane (CBM), a non-conventional source of natural gas is now considered as an alternative source foraugmenting India’s energy resource. The vast majority of the best prospective areas forCBM development are in eastern India, situated in Damodar Coal valley and Son valley.
85 Million metric standard cubic metres.
Chapter III Compliance Audit
45
CPCB had identified (December 2009) Kolkata, Howrah, Durgapur and Haldiaas critically polluted areas. Production of CBM in West Bengal was sufficientand a distribution network also existed. However, the Transport Department hadnot chalked out plans to set-up CBM stations in those areas. Besides, GoWB’sfailure to create infrastructure had led to flaring of 2.81 lakh tonnes of CBM i.e.,39.12 per cent of production in 2015-16 and 2016-17. This CBM could havebeen utilised for operation of 7,812 CNG buses annually.Thus, due to GoWB’s failure to ensure CNG/ CBM distribution network inKolkata, Howrah and Haldia, CNG buses could not be operated. This inactionled to continued release of air pollutants that was avoidable/could have beenaverted.The Government responded (November 2017) that the Transport Departmentwould provide space at their depots for setting up the CNG and CBM dispensingstations. The oil marketing companies (OMCs), which were mostly Central PSUshad not set up those dispensing stations in Kolkata, Howrah and other urbanareas.The reply is not tenable as the NGT, Eastern Zone, observed that GoWB hadobjected in 2005 to the joint venture proposal of GAIL (India) Limited. Accordingto this, GAIL was to supply CNG to Greater Calcutta Gas Supply CorporationLimited, a GoWB PSU. These objections had delayed introduction of CNG inKolkata by 12 years. NGT had directed (October 2017) the Chief Secretary,GoWB to resolve the matter immediately.Good Practice: Audit noticed that besides Delhi Transport Corporation had beenoperating CNG buses 97 per cent of its total fleet of 4,913 buses, 10 STUs86 hadoperated 6,648 CNG buses as of March 2015.3.1.4.3 CNG buses not introduced
The Report of the Expert Committee on Auto Fuel Vision and Policy 2025 (May2014), GoI, refers to the use of CNG as an alternative fuel to diesel. Use of CNGresults in reduction in emissions of (i) PM87 by 97 per cent, (ii) carbon monoxide(CO) by 84 per cent and (iii) oxides of nitrogen (NOX) by 58 per cent. Further,the Standing Committee of XVI Lok Sabha on Petroleum and Natural Gas(2015-16), observed (August 2016) that coal-bed methane (CBM)88 can beconverted to CNG and utilised for local transportation.
86 (1) Andhra Pradesh State Road Transport Corporation, (2) Telangana State Road TransportCorporation, (3) Maharashtra State Road Transport Corporation, (4) Gujarat State RoadTransport Corporation, (5) Uttar Pradesh State Road Transport Corporation, (6) StateTransport of Haryana, (7) Bombay Electric Supply and Transport Undertaking, (8) PuneMahanagar Parivahan Mahamandal Ltd., (9) Thane Municipal Transport Undertaking and(10) Ahmedabad Municipal Transport Services.
87 Particulate matter.88 Coal Bed Methane is a form of natural gas extracted from coal blocks through drilling
during underground mining.
Audit Report (PSUs) for the year ended 31 March 2017
46
In November 2016, WBPCB released a grant of ` 7.46 crore to SBSTC forprocurement of 20 CNG buses in February 2017. These buses were to operatein Asansol-Durgapur area.Audit observed that SBSTC procured (January 2017) only 10 CNG (BS-IV)buses from Ashok Leyland at a cost of ` 3.62 crore till June 2017. Analysis ofoperational performance of these buses in February and March 2017, showedaverage 14,802.40 Km run. They released lower quantities of CO2 (24,091 Kg),as compared to diesel vehicles (31,085 Kg). As such, the CNG buses causedlesser pollution than diesel vehicles (reduction of 6,994 Kg CO2).Out of a total 2,821 buses with the five STUs, only 10 CNG buses (0.35 percent) were in operation. The STUs did not take any major steps for increasingthe fleet of CNG buses in the State despite availability of funds.The Transport Department stated (November 2017) that the Government wasvery keen to introduce CNG and CBM operated buses, especially, in Kolkataand its neighbourhood and other urban areas with a view to curb the vehicularemission related environment pollution. However, it was silent about the timelinesregarding introduction of CNG buses. Further, it had also not created theinfrastructure (gas dispensing station, supply of CBM etc.) for introduction ofCNG buses in Kolkata. As such, its professed keenness to introduce CNG buseswas not reflected in its actions.
3.1.4.4 Expansion of services of trams not undertaken
According to the report89 (June 2012) of the Institute of Urban Transport, GoI,trams are environment friendly and energy efficient transport system90. It hadthe potential to play an important role in the urban transport system of Kolkata.Further, the report also highlighted the lack of an integrated multi-modal publictransport network91 for the city. The report found that there was ample scope forimprovement and rejuvenation of the tram operation system. It suggestedinterventions both at planning and strategic level, to be implemented within three92
years.Audit observed that WBTCL93, the only STU operating trams, had an averagefleet strength of 269 trams with track length of 114.34 Km as of March 2016.The average number of trams put on road during the year had reduced from 91 in2013-14 to 80 in 2015-16. As the availability of trams had come down, theeffective Km travelled per passenger/ day reduced by 20 per cent during2013-16.
89 Renovation of Kolkata Tram to Light Rail Transit and the Tram Train Concept, June2012.
90 Report of the Institute of Urban Transport, Ministry of Urban Development, GoI, P/ 10.91 Integrated multi-modal transport system comprises of one trip that involves two or more
than two different modes of transportations like bus, metro, car, tram etc., eitherGovernment or Privately operated; wherein – between passengers have to transfer intoother modes.
92 Report of the Institute of Urban Transport, Ministry of Urban Development, GoI, P/ 24.93 Incorporated (October 1982) with the main object of laying of tramways tracks and running
of trams, the construction, maintenance and use of tramways and trolley buses in or nearKolkata, 24 Parganas, Behala and Howrah, carrying on the business of mechanicalengineers and to undertake and carry out the overhaul and repair of trams, trolley buses,motors, motorcars, motor vehicles of all kinds.
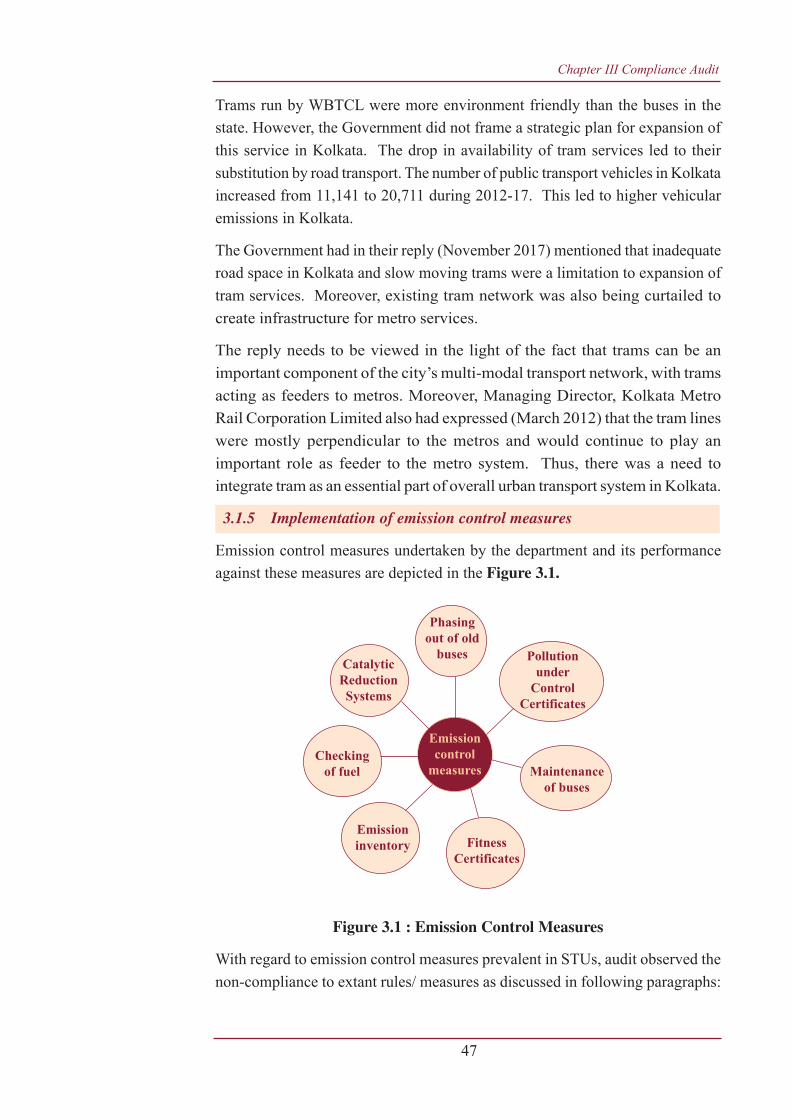
Chapter III Compliance Audit
47
Trams run by WBTCL were more environment friendly than the buses in thestate. However, the Government did not frame a strategic plan for expansion ofthis service in Kolkata. The drop in availability of tram services led to theirsubstitution by road transport. The number of public transport vehicles in Kolkataincreased from 11,141 to 20,711 during 2012-17. This led to higher vehicularemissions in Kolkata.
The Government had in their reply (November 2017) mentioned that inadequateroad space in Kolkata and slow moving trams were a limitation to expansion oftram services. Moreover, existing tram network was also being curtailed tocreate infrastructure for metro services.
The reply needs to be viewed in the light of the fact that trams can be animportant component of the city’s multi-modal transport network, with tramsacting as feeders to metros. Moreover, Managing Director, Kolkata MetroRail Corporation Limited also had expressed (March 2012) that the tram lineswere mostly perpendicular to the metros and would continue to play animportant role as feeder to the metro system. Thus, there was a need tointegrate tram as an essential part of overall urban transport system in Kolkata.
3.1.5 Implementation of emission control measures
Emission control measures undertaken by the department and its performanceagainst these measures are depicted in the Figure 3.1.
Figure 3.1 : Emission Control Measures
With regard to emission control measures prevalent in STUs, audit observed thenon-compliance to extant rules/ measures as discussed in following paragraphs:
Emissioncontrol
measures
Phasingout of old
buses Pollutionunder
ControlCertificates
Maintenanceof buses
FitnessCertificates
Emissioninventory
Checkingof fuel
CatalyticReductionSystems
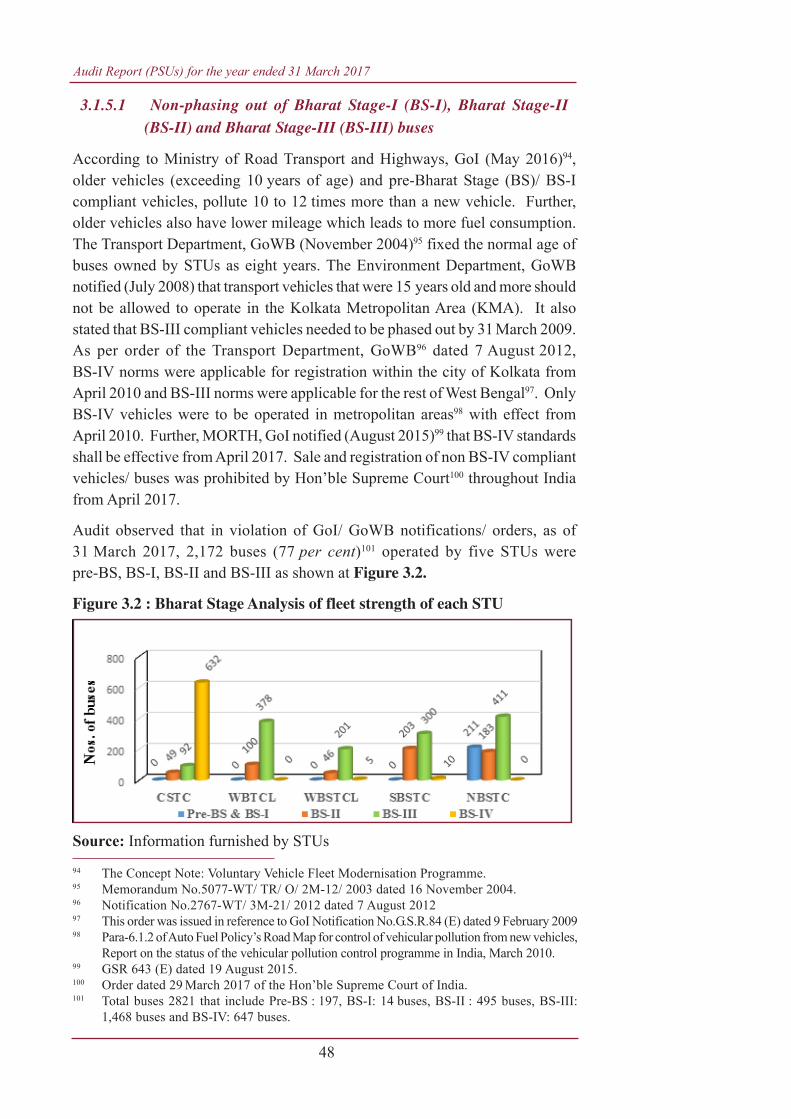
Audit Report (PSUs) for the year ended 31 March 2017
48
3.1.5.1 Non-phasing out of Bharat Stage-I (BS-I), Bharat Stage-II(BS-II) and Bharat Stage-III (BS-III) buses
According to Ministry of Road Transport and Highways, GoI (May 2016)94,older vehicles (exceeding 10 years of age) and pre-Bharat Stage (BS)/ BS-Icompliant vehicles, pollute 10 to 12 times more than a new vehicle. Further,older vehicles also have lower mileage which leads to more fuel consumption.The Transport Department, GoWB (November 2004)95 fixed the normal age ofbuses owned by STUs as eight years. The Environment Department, GoWBnotified (July 2008) that transport vehicles that were 15 years old and more shouldnot be allowed to operate in the Kolkata Metropolitan Area (KMA). It alsostated that BS-III compliant vehicles needed to be phased out by 31 March 2009.As per order of the Transport Department, GoWB96 dated 7 August 2012,BS-IV norms were applicable for registration within the city of Kolkata fromApril 2010 and BS-III norms were applicable for the rest of West Bengal97. OnlyBS-IV vehicles were to be operated in metropolitan areas98 with effect fromApril 2010. Further, MORTH, GoI notified (August 2015)99 that BS-IV standardsshall be effective from April 2017. Sale and registration of non BS-IV compliantvehicles/ buses was prohibited by Hon’ble Supreme Court100 throughout Indiafrom April 2017.
Audit observed that in violation of GoI/ GoWB notifications/ orders, as of31 March 2017, 2,172 buses (77 per cent)101 operated by five STUs werepre-BS, BS-I, BS-II and BS-III as shown at Figure 3.2.
Figure 3.2 : Bharat Stage Analysis of fleet strength of each STU
Source: Information furnished by STUs
94 The Concept Note: Voluntary Vehicle Fleet Modernisation Programme.95 Memorandum No.5077-WT/ TR/ O/ 2M-12/ 2003 dated 16 November 2004.96 Notification No.2767-WT/ 3M-21/ 2012 dated 7 August 201297 This order was issued in reference to GoI Notification No.G.S.R.84 (E) dated 9 February 200998 Para-6.1.2 of Auto Fuel Policy’s Road Map for control of vehicular pollution from new vehicles,
Report on the status of the vehicular pollution control programme in India, March 2010.99 GSR 643 (E) dated 19 August 2015.100 Order dated 29 March 2017 of the Hon’ble Supreme Court of India.101 Total buses 2821 that include Pre-BS : 197, BS-I: 14 buses, BS-II : 495 buses, BS-III:
1,468 buses and BS-IV: 647 buses.
-

Chapter III Compliance Audit
49
Audit further observed that -(i) One STU102 was operating 27 buses which were more than fifteen years old asof March 2017.(ii) Three STUs103 were operating only 647 (22.94 per cent of the total fleet ofSTUs) BS-IV compliant buses as of March 2017.(iii) Age analysis of all buses at these five STUs (Annexure 6) showed that676 buses were more than eight years of age i.e., beyond their normative usefullife of eight years as prescribed by Transport Department.(iv) CSTC, WBTCL and WBSTCL were operating within and around Kolkatasince June 2014. BS-IV norms were applicable for Kolkata since April 2010.Yet, these three STUs had purchased 213 BS-III buses from July 2014 to March2017. It was further observed, that to bypass requirement of purchase andregistration of BS-IV buses, these buses were registered at Howrah and DurgapurRegional Transport offices. As the sanction cum allotment order issued by GoWBon release of funds did not contain any clause regarding compliance ofprocurement of BS-IV buses, STUs were escaping the compliance. This defeatedthe objective of reducing emission norms since BS-III buses emitted 38.11 to486.42 per cent higher emissions than BS-IV buses104.Therefore, by continuing to use these over aged and non-compliant buses, theSTUs had not only wilfully violated the BS norms but also contributed to higherpollution.The Government accepted (November 2017) the observations. They added thatall non-BS-IV compliant buses would be replaced within next two to three years.Further, battery operated/ electric buses/ e-rickshaws were being introduced. Thereply was, however, silent about the introduction of non-BS IV compliant busesin KMA, in deviation of notifications.
3.1.5.2 Pollution under Control (PUC) Certificate and testing of buses
Rule 116 (7) of the Central Motor Vehicles Rules (CMVR) 1989 and CentralPollution Control Board’s Report (March 2010) specify that after expiry of oneyear from the date of registration, every vehicle shall obtain “Pollution underControl” (PUC) certificate every six months. Also, the vehicles more than 15 yearshave to obtain re-registration certificate. Operation of vehicles without PUCcertificate is liable to a penalty105 of ` 1,000 in the first instance with ` 2,000 foreach subsequent default. Audit noticed that only 23 per cent of the total vehiclesregistered with the Public Vehicles Department106 (PVD) had undergone PUCtest every year. The remaining 77 per cent of vehicles were plying without PUC.
102 Pre-BS and BS-I buses: NBSTC.103 CSTC: 632 buses (79 per cent of the total fleet), WBSTCL: five buses (2.42 per cent of
the total fleet) and SBSTC: 10 buses (1.39 per cent of the total fleet).104 Source: Emission factor developed (2011) by Automotive Research Association of India,
Ministry of Heavy Industries and Public Enterprises, GoI.105 Section 190 (2) of the Motor Vehicles Act.106 The Regional Transport Authority for Kolkata functioning under the Transport Department,
GoWB that among other responsibilities undertakes registration of motor vehicles andrelated functions.
Audit Report (PSUs) for the year ended 31 March 2017
50
According to the norms fixed (March 1996) by CPCB, four mass emissionparameters107 were to be met by each vehicle in respect of (i) carbon monoxide,(ii) oxides of nitrogen/ sulphur, (iii) particulate matter and (iv) smoke density108.Audit observed from PUC certificates of all five STUs that only one parameteri.e., smoke density test was conducted as per aforesaid rule. However, it wasseen from the show cause notices issued by Transport Department, GoWB (May2010 to June 2016) to 78 buses109 of CSTC, WBTCL and SBSTC (outsideHowrah) that all the above mentioned four parameters were checked. WhileCSTC conducted the smoke density test in-house, the other four STUs hadoutsourced them to automobile emission testing centres (AETCs).
The Environment Department replied (December 2017) that PUC standards foron-road diesel driven vehicles was only smoke density. The reply is not acceptableas WBPCB’s standard was based on the direction (April 2009) of MORTH, GoIwhich took into account other three parameters (viz. carbon monoxide, oxides ofnitrogen/sulphur, particulate matter) also for measuring emission. The norms ofCPCB, which were primary, had also specified the checking of the four massemission parameters. Moreover, CSE110 had observed (December 2016) that thecurrent density tests were archaic and not a good practice for measuring particulatematter emission.
In this connection, Audit observed the following:
(i) Test check of records relating to testing pollution (smoke density) by buses at16 depots111 out of 55 depots of five STUs during 2016-17 is given at Annexure 7.It would be seen from the Annexure that 16 depots of five STUs conducted smokedensity test on 952 occasions in 2016-17 as against requirement of 2,251. Itamounted to only 42.29 per cent of the statutory requirement.
(ii) WBSTCL did not obtain any PUC certificate for 85 buses at Howrah Depot.These included 24 buses that were more than 10 years old. Similarly, theBelghoria, Arambag and Durgapur depots of SBSTC had never conducted smoketests for 149 buses (100 per cent). Consequently, compliance of emissionstandards by these 234 buses were not ascertained.
107 For BS-II buses- CO (g/km hr), HC (g/km hr), NOx (g/km hr) and PM (g/km hr) and forBS-III buses CO (g/km hr), HC (g/km hr), NOx (g/km hr) and PM (g/km hr).
108 Maximum emission norms of up to 65 Hartridge Smoke Units (HSU) for BS-III and50 HSU for BS-IV.
109 CSTC – 54; WBTCL– three; SBSTC – 23.110 Centre for Science and Environment, a public interest research and advocacy organisation
based in New Delhi. It had submitted, on the directions of the Hon’ble Supreme Court ofIndia, an Action Taken Report: Examination of the Pollution Under Control (PUC) systemas submitted by the Union Government on 2 December 2016 to the Hon’ble SupremeCourt and recommendations to improve compliance, enforcement and effectiveness ofthe system.
111 CSTC: Nilgunge, Paikpara, Lake and Taratala; WBTCL: Ghasbagan and Tollygunge;WBSTCL: Howrah; SBSTC: Arambag, Haldia, Belghoria and Durgapur; NBSTC: Suri,Dinhata, Berhampore, Cooch Behar and Siliguri.
Chapter III Compliance Audit
51
(iii) CSTC’s depots had not calibrated their Smoke Testing Machines within thedue date (27 March 2017). As a result, the readings obtained by CSTC by itssmoke testing machines were not reliable.
(iv) At Siliguri and Suri depots of NBSTC, the readings for all types of buses(non-BS: one bus, BS-II: 39 buses, and BS-III: 120 buses), which were registeredbetween October 2002 and December 2016 were found the same during the entireperiod of 2016-17. Further, in the 952 instances of smoke density tests, it wasseen that PUC was invariably granted in all the instances. This was despite thepaucity of testing, non-functioning of test machines, non-calibration of testingmachines etc. This cast doubt on the veracity of the PUC testing by the STUs.
(v) Transport Department, GoWB in its notification112 (July 2004) stated that allthe AETCs of the State should upgrade their testing facilities, among othermeasures, with a provision for networking among the AETCs and with the RTAsby 31 August 2004.
The Transport Department, GoWB had (i) not implemented networking of AETCswith the RTAs for monitoring and control of ambient air quality and containmentof air pollution till March 2017 i.e., almost 13 years from the date of issue ofnotification (ii) not ensured upgradation of machineries with BS-IV compliantmachineries/ software etc., by the AETCs. Four STUs excluding CSTC hadobtained PUC certificates from AETCs. This had brought down the level ofassurance regarding the ‘PUC’ issued to the STUs.
The Environment Department responded (December 2017) that WBPCB wasresponsible for checking and technically evaluating applications for AETCs interms of Transport Department’s notification of July 2004. The reply was notjustified since WBPCB is also empowered113 to monitor and control the AETCsby periodic inspection of their records and verify equipment.
Further, the National Green Tribunal (NGT) had directed114 (May 2015) theCommissioners of Police of Kolkata and Howrah to check all vehicles plying inthe twin cities for valid ‘PUC’ certificate. Action was to be taken against thevehicle owners who are running vehicles without valid ‘PUC’ certificate. Auditobserved that the Kolkata Police operated an anti-pollution cell under the Trafficdepartment. However, Howrah Police had no such anti-pollution cell.
The Government accepted the observations (November 2017). It added that IITKharagpur had been engaged to study and work out a standard equipment andservice protocol for automatic testing, networking of AETCs etc. Further, effortswould be taken to closely monitor the pollution levels of the STUs’ bus fleets,especially with respect of old buses.
112 No.3357-WT/3M- 7/2003- 2004 dated 28 July 2004.113 Terms and conditions to the AETCs’ application (Clause 21).114 Miscellaneous Appeal No. 86/ 2015/ EW dated 6 May 2015.
Audit Report (PSUs) for the year ended 31 March 2017
52
3.1.5.3 Improper and irregular maintenance of buses led to adverse effecton emission performance
According to Operators’ Manual of buses prepared by the bus manufacturers,emission performance of a vehicle is dependent upon scheduled maintenance115
of vehicles after operating it for a specified number of Kms. It is possible toreduce 30 to 40 per cent pollution116 generated by vehicles by proper inspectionand maintenance through periodic checking of the fuel system, air-chargingsystem, exhaust system, brakes and tyres, and engine of a vehicle. For reductionof emission, air filters, oil filters and fuel filters of a vehicle are to be regularly117
cleaned/ replaced as prescribed in the respective manuals.
Test check of records for the period 2015-16 and 2016-17 related to preventivemaintenance by four STUs118 (viz. CSTC, WBTCL, SBSTC and NBSTC) showedinadequate maintenance of buses (Annexure 8) with shortfall ranging between10.94 to 100 per cent. The impact of inadequate maintenance/ non-replacementof different components such as air filters (AF)119, fuel filters (FF)120, fuel injectionpumps (FIPs), injectors121, change lubricants and oil filters122 was that :
• the air/ fuel filters got dirty/ were clogged by accumulated dirt/contaminants,
• the fuel pump and injectors rapidly wore out, causing untidy injectionand excessive nozzle cavity volume, and
115 Maintenance of injectors, fuel injection pump, fuel filters, injection timing, electronicdiesel control system, cleanliness of diesel and diesel tank, valve clearance, air clearance,engine breather, silencer, piston/ ring/ valve of engine. Proper/ routine maintenance ofvehicles reduces pollution by 30 to 40 per cent.
116 Para-6.1.3.1 of the report of CPCB on ‘Status of the Vehicular Pollution Control Programmein India’ (March 2010).
117 Air Pollution through Vehicular Emissions in Urban India and Preventive Measures byP.R. Sood – 2012 International Conference on Environment, Energy and Biotechnology,Singapore.
118 WBSTCL, in its Howrah depot did not produce records related to preventive maintenanceof buses.
119 An air filter is a device composed of fibrous materials which removes solid particulatessuch as dust, pollen, mould and bacteria from the air. Filters containing an absorbent/ catalyst such as charcoal (carbon) may also remove gaseous pollutants such as volatileorganic compounds or ozone.
120 A fuel filter is a filter in the fuel line that screens out dirt and rust particles from the fuel,normally made into cartridges containing a filter paper.
121 Fuel Injection is the introduction of fuel in an internal combustion engine by the means ofan injector. Fuel injection atomises the fuel through a small nozzle (injectors) under highpressure into the airstream which results in complete combustion of fuel.
122 Various oil are used for lubrication of internal combustion engines and it helps to reducewear on moving parts, cleaning of sludge, inhibits corrosion and cools the engine bycarrying heat away from moving parts. Oil filter is a filter designed to remove contaminantsfrom engine oil.
Chapter III Compliance Audit
53
• there was improper lubrication of moving components leading to excessiveengine friction.
These resulted in incomplete combustion/ higher consumption of fuel withincreased emission of smoke.The Government in their reply (November 2017) stated that all STUs had acuteshortage of technical staff. Action was underway to fill up some of the criticalvacancies. Besides, some STUs had started outsourcing of maintenance jobswhich resulted significant improvement in running the buses. The reply is notacceptable as environmental issues were not to be compromised for administrativereasons.3.1.5.4 Failure to issue Certificate of Fitness (CF)
Rule 62 of CMVR 1989 specified that the validity of CF of new vehicle is twoyears. CF is to be renewed every year after fulfilling 15 parameters which alsoincludes exhaust emissions/ PUC norms. MoRTH, GoI observed123 (June 2014)that an increasing number of vehicles in India were not in a roadworthy state.Poor maintenance and servicing of old in-use vehicles damaged the environmentand posed great safety hazard on road.It was seen that GoWB authorised (October 1998/ August 1999) all the STUs toinspect and annually grant/ renew CF for their own buses. Subsequently, GoWBamended (June 2016) the provisions requiring that CF be issued by an engineerof the STU not below the rank of Assistant Engineer. It was observed that theSTUs were also required to file the CFs annually along with requisite fees to theconcerned registering authority. In this regard, Audit observed the following:• Only NBSTC had complied with this requirement of filing CFs annually.• From April 2012 to October 2016, CSTC conducted CF tests of the busesbased on eye estimation as the Smoke Testing Machine was out of order.• In WBSTCL, WBTCL and SBSTC there was no mechanism for annualinspection and issue of CF for their buses. Thus, SBSTC, WBSTCL and WBTCLoperated buses without even certifying their fitness. These led to additionalemissions as seen by spot testing reports/ show cause notices of PVD, TransportDepartment which showed that emissions by STU buses exceeded permissiblelimits.The Government accepted the audit observation and stated (November 2017)that STUs had been requested to ensure close monitoring of fitness. Monitoringwould be improved with filling up of technical staff of the STUs.
3.1.5.5 Emission Inventory124
Emission inventory is the accounting of the quantity of the pollutants dischargedin the air. According to CPCB, estimation of emission loads is essential toascertain the share of various emitting sources to the total emission load generated
123 Source: Project for establishment of inspection and certification centre for motor vehicles,Ministry Of Road Transport and Highways, Government of India of 26 June 2016.
124 Report on Status of pollution generated from road transport in six megacities, CPCB,March 2015
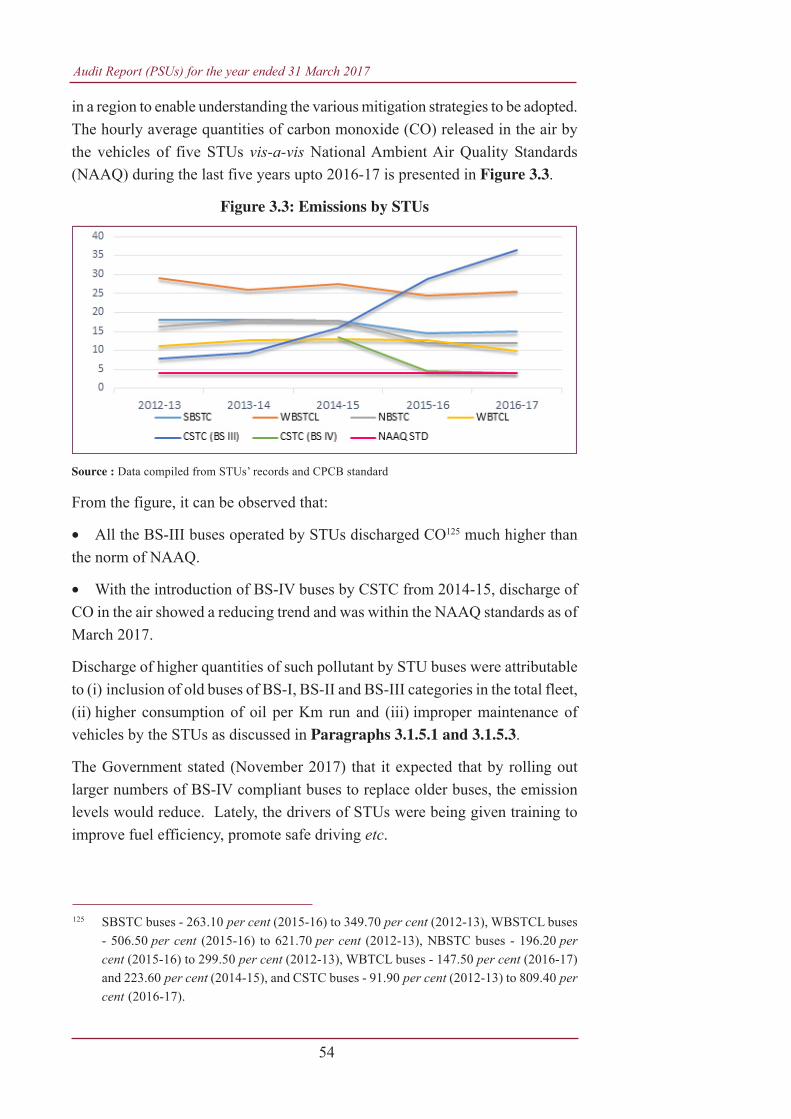
Audit Report (PSUs) for the year ended 31 March 2017
54
in a region to enable understanding the various mitigation strategies to be adopted.The hourly average quantities of carbon monoxide (CO) released in the air bythe vehicles of five STUs vis-a-vis National Ambient Air Quality Standards(NAAQ) during the last five years upto 2016-17 is presented in Figure 3.3.
Figure 3.3: Emissions by STUs
Source : Data compiled from STUs’ records and CPCB standard
From the figure, it can be observed that:
• All the BS-III buses operated by STUs discharged CO125 much higher thanthe norm of NAAQ.
• With the introduction of BS-IV buses by CSTC from 2014-15, discharge ofCO in the air showed a reducing trend and was within the NAAQ standards as ofMarch 2017.
Discharge of higher quantities of such pollutant by STU buses were attributableto (i) inclusion of old buses of BS-I, BS-II and BS-III categories in the total fleet,(ii) higher consumption of oil per Km run and (iii) improper maintenance ofvehicles by the STUs as discussed in Paragraphs 3.1.5.1 and 3.1.5.3.
The Government stated (November 2017) that it expected that by rolling outlarger numbers of BS-IV compliant buses to replace older buses, the emissionlevels would reduce. Lately, the drivers of STUs were being given training toimprove fuel efficiency, promote safe driving etc.
125 SBSTC buses - 263.10 per cent (2015-16) to 349.70 per cent (2012-13), WBSTCL buses- 506.50 per cent (2015-16) to 621.70 per cent (2012-13), NBSTC buses - 196.20 percent (2015-16) to 299.50 per cent (2012-13), WBTCL buses - 147.50 per cent (2016-17)and 223.60 per cent (2014-15), and CSTC buses - 91.90 per cent (2012-13) to 809.40 percent (2016-17).
Chapter III Compliance Audit
55
3.1.5.6 Absence of quality checking of fuel
According to CPCB (March 2010)126, adulteration of fuel and fuel products is areason for air pollution. STUs procured fuel from oil companies directly as wellas from the retail suppliers. It was seen that the agreements between the STUsand oil market companies (OMCs) provided that if there were any anomalies inthe quality at the time of delivery to the STUs, the STUs would be compensatedby the OMCs accordingly. During 2012-17, Audit observed that these STUshad consumed 2.02 lakh Kilolitres (Kls) High Speed Diesel (HSD)127. This wouldhave caused discharge of 104.76 lakh Kgs of CO2 in the air128. STUs had notchecked quality and quantity of HSD procured in bulk from OMCs in theexpectation that they had properly monitored at their end.Audit observed from the correspondence with Indian Oil Corporation Limitedby NBSTC that, at the Central Bus Terminus (CBT), Cooch Behar, water wasfound (May 2017) mixed with HSD. The mixing of water with HSD wasattributable to leakages in the fuel dispensing pipe. This led to suspension of80 trips, damage to 34 fuel oil filters and discarding three Kl of HSD mixedwith water. This indicated that the quality of HSD was not regularly checked.The Government stated (November 2017) that STUs had been directed to monitorthe quality of fuel supplied by the OMCs.3.1.5.7 Excess emissions of NOx gases due to non-functioning of Selective
Catalytic Reduction system
Selective Catalytic Reduction (SCR) system129 is required to treat engine exhaustto meet BS-IV emission norms. The SCR system is used for reducing oxides ofnitrogen by dosing with an additive. As per the Operators’ Manual, for an additive,in the ratio of three litres for every 100 litres of HSD, is required for dosing.As of March 2017, CSTC operated 234 BS-IV buses and consumed 2.09 lakhlitres of additive and 100.90 lakh litres of HSD. Mixing of the additive inreduced130 proportion could neutralize NOX emissions in respect of 69.65 lakhlitres of HSD only. Resultantly, 31.24 lakh litres of HSD released 8,375.50 Kgof NOX in the atmosphere. Further, the SCR systems of 43 vehicles in fourselected depots131 were not functioning properly due to defect in dosing units ofSCR system leading to higher emissions of NOX even after dosing with theadditive.
126 Para-6.4 of Status of the Vehicular Pollution Control Programme in India, March 2010.127 As per Mangalore Refinery and Petrochemicals Limited, HSD is a complex mixture of
hydrocarbon normally used as a fuel in medium and high speed compression ignition enginesof vehicles.
128 Calculated as per India Green House Gas programme 2015 (India Specific Road TransportEmission Factor) at Page/ 30.
129 As per operators’ manual SCR, is a compact system/ unit installed inside the exhaust silencerhousing of a vehicle. This system is provided to treat engine exhaust to meet the BS-IVemission norms.
130 2.07 litres of additive for every 100 litres of HSD.131 Taratala Depot-22, Lake Depot-08, Paikpara Depot-11 and Nilgunje Depot-02.
Audit Report (PSUs) for the year ended 31 March 2017
56
The Government had directed (November 2017) the STUs to look into the matterand take appropriate action at the earliest.
3.1.6 Environmental Reporting
The Environmental Protection Act, 1986 enforces132 adoption of environmentalreporting in India. According to Generally Accepted Accounting Principles(GAAP) of India, Chapter-2, Environmental Accounting133 forms that part ofaccounting which deals with the environmental concerns. Audit observed thatnone of the STUs had adopted environmental reporting134 and costing system135.Further, the Transport Department had also not issued any directives on theGreen Gross Domestic Product (GDP) Accounting.
The Government stated (November 2017) that the STUs had been directed totake appropriate action at the earliest. But reasons for non-compliance werenot stated.
3.1.7 Lack of adherence to statutory requirements
Workshops and depots of STUs conduct various maintenance and overhaulingactivities. Water, Air and Sound pollution arises while performing these activities.Under the prevailing legislative enactments136, STUs must take initiatives tocontrol pollution and tackle environmental challenges.
3.1.7.1 Consent to Establish and Consent to Operate not obtained:Pollution Control Board Norms
WBPCB had periodically137 issued orders under Water (Prevention and Controlof Pollution) Act, 1974 or under Air (Prevention and Control of Pollution) Act,1981 regarding classification of industries. These orders specified that automobileworkshops and service centres were required to obtain consents to establish andoperate from WBPCB. Section 21 of the Air (Prevention and Control of Pollution)Act, 1981, specified that no person shall, except with the previous consent of
132 Section-20.133 According to Environmental Agency of UK “Environmental Accounting is the collection,
analysis and assessment of environmental and financial performance data obtained fromBusiness Management Information System (BMIS)”.
134 Karnataka State Road Transport Corporation discloses environmental information in itsAnnual Report.
135 Lifecycle Costing, Activity-Based Costing, Strategic cost accounting systems to evaluatethe ‘whole-of-life’ costs in terms of carbon emissions, Hierarchical Cost Analysis, BalancedScored Card etc.
136 Environment (Protection) Act, 1986, The Air (Prevention and Control of Pollution) Act,1981, The Water (Prevention and Control of Pollution) Act, 1974, The Water (Preventionand Control of Pollution) Cess Act, 1977 and the Noise Pollution (Regulation and Controls)Rules, 2000.
137 No. 1512/4A-18/2010 (Pt.I) dated 14 June 2016.
Chapter III Compliance Audit
57
the State Pollution Control Board (SPCB), establish or operate any industrialplant in an air pollution control area. Further, Sections 24, 25 and 26 of theWater (Prevention and Control of Pollution) Act, 1974 provide that no personshall knowingly cause or permit flow of any poisonous, toxic or polluting matterinto any stream, well, sewer and land without treating it.
Audit observed that while five138 STUs had operated 65 workshops withoutobtaining consents to establish/ operate, two139 workshops of WBTCL hadobtained (September 2004 and January 2009) consents to operate but failed torenew them for 138 and 80 months as of March 2017. Reasons for thesedeficiencies were not on record.
Moreover, the five STUs operating nine central/divisional workshops140 wererequired141 to submit to WBPCB annually, an Environmental Statement inForm V142. Audit observed that none of the STUs had submitted EnvironmentalStatements to WBPCB during the last five years.
The Government had instructed (November 2017) the STUs to obtain clearancesfor operation of their workshops/ depots etc.
3.1.7.2 Air Quality of Howrah and Kolkata: NGT’s directions
Under the directions of NGT143 (November 2015) WBPCB constituted (November2015) an Expert Committee to deal with the problem of ambient air pollution inKolkata and Howrah due to heavy traffic movement. The Expert Committeeobserved (January 2016) that the annual average values of the air pollutants inKolkata during last three years up to November 2015 were above the respectivestandards. The committee proposed (February 2016) 21 recommendations(Annexure 9) for containment of air pollution caused due to heavy trafficmovement in Kolkata and Howrah. These recommendations were to beimplemented by GoWB within six months144. With regard to compliance withNGT orders, Audit observed the following:
• GoWB claimed to have implemented two recommendations viz., it had(i) engaged (September 2016) NEERI145 for source apportionment study to be
138 CSTC, WBSTCL, SBSTC, NBSTC and WBTCL.139 Park Circus and Ghasbagan.140 SBSTC: One Central/ two Divisional and 12 Depot workshops, NBSTC: One Central/
four Divisional and 21 Depot workshops, WBSTCL: Six Depot workshops (includingthree Marine Depots), WBTCL: one Central and nine Depot workshops, CSTC: OneCentral and 12 Depot workshops.
141 Under Rule-14 of the Environment (Protection) Rules, 1986.142 The statement discloses water and raw material consumption, pollutants discharged
to the environment and quantum of solid wastes and hazardous wastes generated bythe units.
143 In its order dated 17 November 2015 on Original Application No.33/ 2014/ EZ (SubhasDutta Vs. State of West Bengal).
144 According to order of NGT dated 11 August 2016, Para 40.145 National Environment Engineering Research Institute under Council of Scientific
and Industrial Research.
Audit Report (PSUs) for the year ended 31 March 2017
58
submitted in two years, (ii) integrated (January 2016) data from automatic ambientair-quality stations at Kolkata and Howrah with the National Air Quality IndexSystem.
• Four recommendations were not implemented.
• Status of remaining 15 recommendations as of March 2017 was not known.NGT attributed (August 2017) non-implementation/ non compliance with itsorders to laxity on the part of the Government.
The Government stated (November 2017) that appropriate action had been takento comply with NGT’s instructions. The reply is not acceptable as even in August2017, NGT had found Transport and Environment Departments, GoWB’scompliance with the directions unsatisfactory.
3.1.7.3 Zero Tolerance Pollution free Zone: Hon’ble Supreme Court’sdirections
The Hon’ble Apex Court ordered (September 2011) the State to relocate theEsplanade Bus Terminus in Kolkata which was a cause of pollution and threat tothe greenery within the heart of the city. As per the recommendation (January2014) of the High Power Committee146, necessary steps would be taken so thatthe area around Esplanade Bus Terminus in Kolkata would be declared as ZeroTolerance Pollution free Zone.
Audit observed that the Transport Department decided (May 2013) to shift theEsplanade and Babughat bus Terminus to Santragachi, Howrah. The Departmenthad developed (May 2015) the bus terminus at Satragachi at a cost of` 22.92 crore. Audit observed that (i) CSTC had shifted (June 2013) their busterminus from Esplanade area, (ii) NBSTC had not shifted bus operations147
from the Esplanade area, despite availability of an alternative at depot in Kolkata,(iii) SBSTC, WBSTCL and WBTCL had also not shifted their buses from theEsplanade area and (iv) private buses operators had also not relocated toSantragachi.
The Government elucidated (November 2017) that action was being taken inphases to shift bus terminus from Esplanade.
3.1.8 Conclusion
Air pollution and its impact is an issue of concern in India. Air pollution iscaused by emissions from vehicular, industrial and domestic activities.Despite this, the Transport Department, being the nodal departmentconcerned for vehicular issues –
146 Constituted by order of the Hon’ble Division Bench of Calcutta High Court in WP No.7987(W) of 2002 dated 13 September 2013.
147 NBSTC: 50 buses, SBSTC: 133 buses, WBSTCL:30 buses and WBTCL: 50 buses ply atan average time interval of 15 minutes to 60 minutes daily.
Chapter III Compliance Audit
59
• Had not prepared action plans (i) to protect and safeguard theenvironment from pollution and (ii) mitigate green-house gas emissionsarising out of vehicular emissions in operation of its STUs.
• Had not chalked out an air-quality management plan for vehicles.
Consequently, attempts to introduce (i) environment-friendlier CNG vehiclesand (ii) revive operations of trams in highly polluted urban areas had notmaterialised.
The STUs did not comply with extant regulations with regard to air pollution.It was seen that majority of buses operated were non-BS compliant andtheir road worthiness was suspect due to inadequacies in the system of issueof PUCs and CFs. Further, the STUs failed to adopt the manufacturers’maintenance schedules to restrict emissions and fuel consumption. Therewere shortfalls in testing the actual emissions according to the definedparameters. Many of the auto emissions testing centres from whichcertificates were obtained were operating without valid licenses. As such,the actual emissions being released by these STUs in the state wereunderestimated, having serious implications on health and environment. Itwas also seen that all the STUs were running buses which were found to beviolating the air quality norms defined by CPCB. No EMS to address airpollution issues on a sustained basis was seen in any of the STUs. Further,requisite consents to establish and operate workshops had not been obtained.In its operations, the STUs violated Hon’ble Supreme Court, Hon’ble HighCourt and NGT’s directions regarding measures to control air pollution inthe state.
West Bengal Mineral Development and Trading Corporation Limited
3.2 Compliance with rules made under Mines and Minerals(Development and Regulation) Act, 1957
3.2.1 Introduction
West Bengal Mineral Development and Trading Corporation Limited(WBMDTCL) was established in 1973 as a State Government Company. Itfunctions under the Industry, Commerce and Enterprises Department, Governmentof West Bengal (GoWB). WBMDTCL’s goals148 are to (i) develop and exploitcoal and other minerals; (ii) facilitate the growth and development of miningand mineral based industries; (iii) acquire land, mines and mining rights in WestBengal and outside; and (iv) explore, mine, process and market minerals andmineral-based products.
148 Mentioned in WBMDTCL’s Mission Statement.
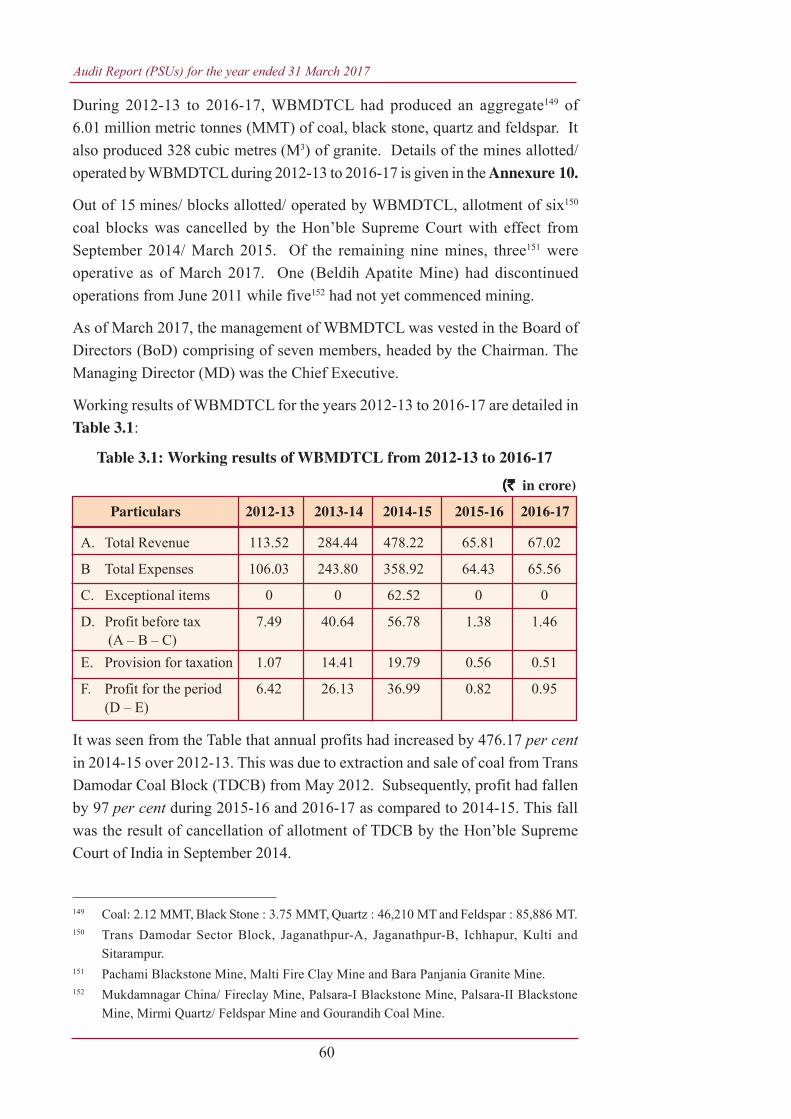
Audit Report (PSUs) for the year ended 31 March 2017
60
During 2012-13 to 2016-17, WBMDTCL had produced an aggregate149 of6.01 million metric tonnes (MMT) of coal, black stone, quartz and feldspar. Italso produced 328 cubic metres (M3) of granite. Details of the mines allotted/operated by WBMDTCL during 2012-13 to 2016-17 is given in the Annexure 10.
Out of 15 mines/ blocks allotted/ operated by WBMDTCL, allotment of six150
coal blocks was cancelled by the Hon’ble Supreme Court with effect fromSeptember 2014/ March 2015. Of the remaining nine mines, three151 wereoperative as of March 2017. One (Beldih Apatite Mine) had discontinuedoperations from June 2011 while five152 had not yet commenced mining.
As of March 2017, the management of WBMDTCL was vested in the Board ofDirectors (BoD) comprising of seven members, headed by the Chairman. TheManaging Director (MD) was the Chief Executive.
Working results of WBMDTCL for the years 2012-13 to 2016-17 are detailed inTable 3.1:
It was seen from the Table that annual profits had increased by 476.17 per centin 2014-15 over 2012-13. This was due to extraction and sale of coal from TransDamodar Coal Block (TDCB) from May 2012. Subsequently, profit had fallenby 97 per cent during 2015-16 and 2016-17 as compared to 2014-15. This fallwas the result of cancellation of allotment of TDCB by the Hon’ble SupremeCourt of India in September 2014.
Table 3.1: Working results of WBMDTCL from 2012-13 to 2016-17
149 Coal: 2.12 MMT, Black Stone : 3.75 MMT, Quartz : 46,210 MT and Feldspar : 85,886 MT.150 Trans Damodar Sector Block, Jaganathpur-A, Jaganathpur-B, Ichhapur, Kulti and
Sitarampur.151 Pachami Blackstone Mine, Malti Fire Clay Mine and Bara Panjania Granite Mine.152 Mukdamnagar China/ Fireclay Mine, Palsara-I Blackstone Mine, Palsara-II Blackstone
Mine, Mirmi Quartz/ Feldspar Mine and Gourandih Coal Mine.
A. Total Revenue 113.52 284.44 478.22 65.81 67.02
B Total Expenses 106.03 243.80 358.92 64.43 65.56
C. Exceptional items 0 0 62.52 0 0
D. Profit before tax 7.49 40.64 56.78 1.38 1.46 (A – B – C)
E. Provision for taxation 1.07 14.41 19.79 0.56 0.51
F. Profit for the period 6.42 26.13 36.99 0.82 0.95(D – E)
Particulars 2012-13 2013-14 2014-15 2015-16 2016-17
(`(`(`(`(` in crore)
Chapter III Compliance Audit
61
3.2.2 Scope and methodology of Audit
Audit conducted from April 2017 to June 2017 and in October 2017 to assessWBMDTCL’s compliance with rules153 under the Mines and Minerals(Development and Regulation) (MMDR) Act, 1957. The audit covered the periodbetween 2012-13 and 2016-17. Audit methodology involved the scrutiny ofrecords at Head Office of WBMDTCL and one Unit office154 in Purulia. Theexamination included Board Agenda/ Minutes, mining/ closure plans, environmentimpact assessment (EIA)/ environment management system (EMS) reports, actualmining data relating to mines worked during 2012-17, management informationreports, credit policy and internal controls.
The audit criteria were derived from (i) Mining Leases (Modification of Terms)Rules155, 1956 (MLMTR 56), (ii) Mineral Concession Rules, 1960 (MCR 60),(iii) Mineral (Conservation & Development) Rules, 1988 (MCDR 88),(iv) Granite (Conservation & Development) Rules, 1999 (GCDR 99), (v) WestBengal Minor Minerals Rules, 2002 (WBMMR 02), (vi) West Bengal Minerals(Prevention of Illegal Mining, Transportation and Storage) Rules, 2002(WBMPR 02) and (vii) Environment (Protection) Act, 1986 including rules madethereunder.
Audit Findings
The life cycle of every mine involves five stages: (i) identifying potential mininglocations; (ii) undertaking of prospecting and detailed exploration; (iii) grantingof mining leases; (iv) undertaking mining operations; and (v) closing down ofthe mine when it can no longer be exploited including reclamation of the area. InIndia, survey of minerals156, done by the Geological Survey of India, is the mainbasis for geological mapping, regional mineral resource assessment, identifyingareas bearing mineral deposits and evaluation of quantity of reserves of minerals.As such, WBMDTCL’s area of operation extends to only the last four stages oflife cycle of a mine. Compliance with these have been discussed in the succeedingparagraphs. The observations have been segregated into two categories i.e., coaland non-coal mining activities.
3.2.3 Prospecting and detailed exploration
Prospecting and detailed exploration is an invasive process involving close spaceddrilling157 (depending on the mineral) and substantial testing158 to establish
153 Issued by the Government of India (GoI) and Government of West Bengal (GoWB).154 One factory office in Purulia and another Unit office in Birbhum not covered.155 Section 29 of Mines and Minerals (Development and Regulation) Act, 1957 specifies that
rules made under the Mines and Minerals (Regulation and Development) Act, 1948 shallcontinue till being superseded.
156 Source: E-Book on Mineral Sector, Ministry of Mines, Government of India (February 2016).157 Closed space drilling is a grid where boreholes are drilled in close proximity to delineate
- with a high degree of accuracy - size, shape, structure, grade and other relevantcharacteristics of a mineral deposit.
158 A method of detailed prospecting to establish economic viability of a mineral reserve.
Audit Report (PSUs) for the year ended 31 March 2017
62
159 Section 4A (4) of the MMDR Act 1957.160 Vide order/ notification/ circular F.No. 13016/5/2002-CA dated 14 January 2005 for Trans
Damodar, F.No. 13016/23/2006-CA-I dated 02 August 2006 for Ichhapur and Kulti, F.No.13016/8/2007-CA-I dated 25 July 2007 for Jaganathpur-A and B, F.No. 13016/23/2006-CA-I dated 27 December 2007 for Sitarampur.
161 A document required to be prepared under Mining Concession Rules 1960 {Rule 22(4)}.It, inter alia includes location, physiography, geology, mine boundary and estimation ofreserves, method of mining, mine development and dumping strategy, projectimplementation schedule, environment management and progressive mine closure.
162 Permissions from the appropriate Government under the Forest (Conservation) Act, 1980and related rules, for diversion of forest land to non-forest purposes such as cultivation oftea, coffee, spices, rubber, palms, oil-bearing plants, horticultural crops or medicinal plants,construction of infrastructure/ industrial projects, mining etc.
163 Under-ground coal mine (A basic method of mining an underground mineral deposit, bydigging shafts to the mineral-bearing depth) - not requiring forest clearance : 48 months,requiring forest clearance : 54 months.
164 Only one came into production during audit period, however, all were taken back byMoC in Sept 2014 and March 2015.
165 In terms of the allotment letters of January 2005 to December 2007.166 Six GRs to be prepared, one for each block.
commercially exploitable mineral ore deposits located either at or below thesurface of the earth.
Coal
3.2.3.1 Delay in achieving milestones
The MMDR Act, 1957159 mandates that operations should commence withintwo years from execution of a mining lease, else the lease shall lapse. To maintainthis timeline, the Ministry of Coal (MoC), Government of India (GoI) hadspecified160 14 to 18 milestones (total 95 milestones) to be achieved for each ofthe six coal blocks allotted (January 2005 to December 2007) in West Bengal.These milestones were with regard to obtaining prospecting license, geological report(GR), mining plan161, forest clearance162, environment clearance, mining lease,land acquisition etc. These milestones provide for production to start within 48to 54163 months from allotment of blocks. Hence, it was imperative forWBMDTCL to achieve the milestones and begin coal production164 by February2009 to February 2015, failing which allotments of the blocks could have beencancelled165.
Audit observed that WBMDTCL had met only 15 milestones on time,achievement of 38 were delayed and 42 were not achieved till cancellation ofallotment by the Hon’ble Supreme Court of India in August/ September 2014.
According to the milestones, the geological reports (GRs)166 were to be preparedwithin 27 months from date of allocation. WBMDTCL decided (May 2005) toentrust the entire exploration including preparation of GRs to Mineral Exploration
Chapter III Compliance Audit
63
Corporation Limited (MECL), a Central Government Company. The reasonwas that MECL would take only seven months as compared to 14 months byCentral Mine Planning and Design Institute Limited (CMPDIL), another CentralGovernment Company. Audit observed that out of the six GRs, MECL couldprepare only three GRs in time, three167 GRs were belatedly prepared betweenDecember 2011 and March 2012 i.e., after delays of 24 to 40 months. The reasonfor delays was that MECL had accepted assignments in excess of its availabledrilling equipment. However, WBMDTCL had not monitored the preparation ofthe GRs or considered the appointment of another agency to prepare GRs intime. Delay in achieving milestones for preparation of GRs had a cascadingeffect and subsequent milestones relating to submission of mining plan, forestclearance, environment clearance etc., were also delayed. As a result, thesethree blocks scheduled to produce coal from November 2012 to March 2014 didnot commence production.
The Management stated (September 2017) that WBMDTCL had engaged privateagencies called Raising Contractors for Coal (RCCs) to carry out explorationworks and import foreign technologies. The reply is irrelevant to the issue asMECL is a Central Government Company and not an RCC which would be aprivate company. Further, WBMDTCL was the allottee and was therefore requiredto monitor the performance of MECL to ensure that the desired timelines weremet. Due to its failure to do so, production of coal could not begin.
Non-coal
3.2.3.2 Non-exploration of granite and blackstone bearing areas reservedfor WBMDTCL
In 1992 and 1993, GoWB had reserved granite and blackstone-bearing areas forexploitation by WBMTDCL. WBMDTCL, however, decided not exploit theseareas reserved for it. Accordingly, GoWB de-reserved (November 2002) allexcept 12 granite and five blackstone-bearing areas. WBMDTCL had broughtinto operation only two, viz., Bara Panjania and Pachami, out of these 17 areastill March 2017. Reasons for non-exploration of the remaining areas were noton record.
3.2.4 Grant of mining lease
When a mineral deposit is found to be economically viable, an applicant willapply to the State Government for a mining lease. The mining lease would begranted only if there is an approved mining plan (by the prescribed Authority)for the development of the mine.
Coal
3.2.4.1 Appointment of Raising Contractors
The Coal Mines (Nationalisation) Act, 1973168 required that no person other thanthe Central Government/ Government Company/ Corporation owned by Central
167 Ichhapur, Kulti and Sitarampur.168 Section 3(3)(a)(i) of Coal Mines (Nationalisation) Act, 1973.
Audit Report (PSUs) for the year ended 31 March 2017
64
Government or the sub-lease (any other Government Company) of any suchGovernment Company/ Corporation can carry on coal mining activities.
WBMDTCL decided (September 2003) to develop coal blocks through ‘RaisingContractors for Coal169 (RCC). For this purpose, Government of West Bengalconstituted (September 2004) a committee , on whose recommendation, an RCCwas appointed (May 2006) for Trans Damodar Coal Block. For the remainingfive blocks, two RCCs were appointed (March 2010) on nomination basis withapproval of the Standing Committee on Industries of the Cabinet of theGovernment of West Bengal.
Appointment of RCCs itself was a violation of the Coal Mines (Nationalisation)Act, 1973. This was compounded by not going in for open tender in contraventionof the directions170 of the Hon’ble Supreme Court of India and Central VigilanceCommission.
The Management stated (September 2017) that the RCCs were selected as perthe decision of the Standing Committee and it had the concurrence of theCommerce and Industries department, WBMDTCL and West Bengal IndustrialDevelopment Corporation Limited171. Audit did not find anything inWBMDTCL’s records to show that it had appraised the Government regardingthe provisions that prevented the appointment of private parties as RCCs, thattoo on nomination basis. As such, the reply seeks to shift the burden ofresponsibility to GoWB.
Non-coal
3.2.4.2 Execution of lease deed in Bara Panjania Granite Project delayed
According to the provisions172 of the MMDR Act 1957 read with WBMMR 02,on receipt of a lease application, GoWB may with regard to the provisions ofthe Act and rules, grant or reject the mining lease within one year. Besides,GCDR 99 specified173 that granite mines had to be leased for a minimum of20 years. Further, WBMMR 02 stated that quarry permits should not be givenfor short-term quarrying of granite.
It was observed that WBMDTCL had submitted (June 1998) lease applicationfor extraction of granite at Bara Panjania, Purulia. No follow-up regardinggrant of lease was done by WBMDTCL. Audit observed that WBMDTCL
169 A contractor for the working of any mine or part thereof, who is responsible for complyingwith the legal provisions but not so as to exempt the owner from any liability –Section 2(1)(i) of the Mines Act, 1952.
170 SLP (Civil) No. 10174 of 2006 (Nagar Nigam, Meerut versus A1 Faheem Meat ExportPrivate Limited) and CVC’s Office order No. 23/7/07 dated 5 July 2007.
171 GoWB PSU.172 Section 10(3) and Rule 7(1).173 Rule 6(1) of GCDR99 and Rule 27(1) and 27(2) of WBMMR 02.
Chapter III Compliance Audit
65
resubmitted the application in November 2003 and GoWB granted (March 2004)20 years lease. Instead of taking immediate action, after a delay of 12 years,WBMDTCL submitted draft lease deed in May 2016 which was executed inJuly 2017. Audit further observed that WBMDTCL had started extraction ofgranite from the mine since July 2016, based on permit of 90 days issued byDistrict Land and Land Reforms Officer (DL&LRO), Purulia. This permit wasextended on three174 occasions for further periods of 90 days, which was incontravention of the relevant rules. The Management’s reply (September 2017)was silent as to reasons for delay of 12 years in submitting lease deed and aboutshort-term lease. Due to delay in submission of lease deed, WBMDTCL hadforgone revenue opportunity of ` 14.81 crore175 from the date of grant of lease(March 2004) upto the date of start of actual quarrying i.e. July 2016.
3.2.5 Mining Operations
Mining operations are associated with actual recovery of minerals from the earthin quantity, their beneficiation176 and commercial exploitation. Deviating fromrules and codal provisions, WBMDTCL had allowed waivers aggregating to` 61.98 crore to contractors (RCCs), as discussed in the succeeding paragraphs.
Coal
3.2.5.1 Undue benefit to RCC of Trans Damodar Coal Block (TDCB)
WBMDTCL had applied to the Ministry of Coal, Government of India, throughGoWB, for allotment of Trans Damodar Coal Block (TDCB) in August 2002.This was allotted to WBMDTCL in January 2005. Even before the allotment,WBMDTCL had called (April 2003) for, through newspapers, Expressions ofInterest for Joint Venture/Contractual/ Sub Lease participation with WBMDTCLfor exploitation of TDCB. GoWB had (June 2003) constituted a committee tomonitor the coal-mining activities of WBMDTCL including evaluation of offers.Out of 20 offers received, offer of M/s Godavari Commodities Limited (GCL)was (September 2004) the highest, based on two parameters i.e. (I) rate ofretention charge offered per ton and (II) minimum guaranteed quantity ofproduction. After WBMDTCL got the allotment (January 2005), GCL formed(May 2006) a JV company177 called Trans Damodar Coal Mining Project Limited(TDCMPL). TDCMPL was to undertake coal-mining for WBMDTCL.
174 December 2016, April and August 2017.175 Quantity: 56,700 cubic metres at the rate of ` 2,612 per cubic metre.176 Beneficiation is the process in the mining industry that improves (benefits) the economic
value of the ore by removing the gangue minerals, which results in a higher grade product(concentrate) and a waste stream.
177 A joint venture company promoted by Godavari Commodities Limited (GCL), BanowariLal Agarwalla Private Limited (BLAPL) and Calcutta Industrial Supply Corporation (CISC)by entering into Contract Agreement dated 31 May 2006.
Audit Report (PSUs) for the year ended 31 March 2017
66
In this connection, Audit observed that:-
(i) As per section 5(2)(b) of Mines and Minerals (Development and Regulation)(MMDR) Act, 1957, a mining plan was required to be prepared and approved bythe GoI/ GoWB for the development of mineral deposits in the area concerned.Mining plan inter alia includes location, mine boundary, estimation of reserves,method of mining, etc., required to assess the mining cost to estimate retentioncharge. It was seen that in September 2003, GCL offered ` 403 per MT asretention charge whereas the mining plan was approved only in December 2006.In absence of the Mining Plan, WBMDTCL would not have been in a position in2003 to determine either the mining costs or the retention charge. However,WBMDTCL accepted the retention charge offered by GCL without analysis ofcost effectiveness.
(ii) Before formation of JV178 in May 2006, GCL had offered, in the biddocument, (September 2003), retention charge of ̀ 403 per metric tonne (MT) toWBMDTCL. This was based on the prevailing selling price179 of ` 1,190 perMT for ‘C’ Grade coal. After finalisation of the tender, WBMDTCL enteredinto agreement (May 2006) with GCL led JV for extraction of coal with thesame retention charge of ` 403 per MT, without considering the rise in coalprices over 32 months. The prices of coal of similar quality had increased by52.94 per cent i.e. from ` 1,190 in September 2003 to ̀ 1,820 per MT in March2010. Hence, WBMDTCL amended the agreement with JV (March 2010)wherein the retention charge was raised. The increased retention charge wasfixed at ` 403 per MT (fixed when selling price of coal was ` 1,190 per MT)plus an additional 25 per cent of the selling prices of coal in excess of ̀ 1,820 perMT (base selling price180). Consequently, no share of revenue for selling pricesbetween ` 1,190 per MT and ` 1,820 per MT was received by WBMDTCL.The basis of fixation of base selling price at ` 1,820 per MT instead of ` 1,190per MT was not on record. Thus, WBMDTCL had extended undue favour toGCL led JV by fixing the base selling price of coal at ̀ 1,820 and not ̀ 1,190 perMT to determine the increase in retention charge. As a result, WBMDTCL hadforgone retention charge of, at least, ` 33.38 crore181 on 2.12 MMT coal minedbetween May 2012 and March 2015. This had affected its financial interests.
178 GCL, BLAPL and CISC. Later known as Trans Damodar Coal Mining Private Limited.179 Price list of Eastern Coalfields Limited as mentioned in the calculation sheet of GCL.180 Derived from Coal India Limited’s notification dated 16 October 2009. It represented
the selling price up to which retention charge was to continue to remain fixed at ̀ 403 perMT. If the actual selling price rises above the base selling price, 25 per cent of thedifferential amount was to be added to the retention charge of ` 403 per MT.
181 Calculated at 25 per cent of the difference between ` 1,820 and ` 1,190 per MT for21,19,358.80 MT.
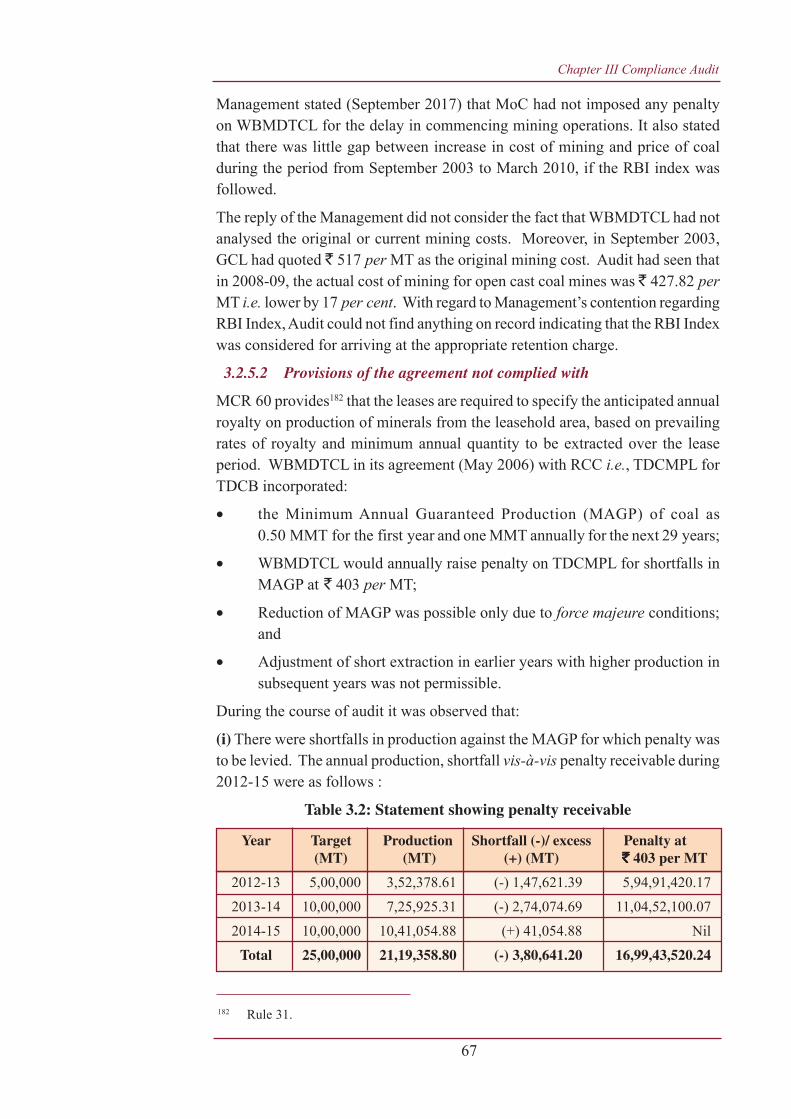
Chapter III Compliance Audit
67
Management stated (September 2017) that MoC had not imposed any penaltyon WBMDTCL for the delay in commencing mining operations. It also statedthat there was little gap between increase in cost of mining and price of coalduring the period from September 2003 to March 2010, if the RBI index wasfollowed.
The reply of the Management did not consider the fact that WBMDTCL had notanalysed the original or current mining costs. Moreover, in September 2003,GCL had quoted ` 517 per MT as the original mining cost. Audit had seen thatin 2008-09, the actual cost of mining for open cast coal mines was ` 427.82 perMT i.e. lower by 17 per cent. With regard to Management’s contention regardingRBI Index, Audit could not find anything on record indicating that the RBI Indexwas considered for arriving at the appropriate retention charge.
3.2.5.2 Provisions of the agreement not complied with
MCR 60 provides182 that the leases are required to specify the anticipated annualroyalty on production of minerals from the leasehold area, based on prevailingrates of royalty and minimum annual quantity to be extracted over the leaseperiod. WBMDTCL in its agreement (May 2006) with RCC i.e., TDCMPL forTDCB incorporated:
• the Minimum Annual Guaranteed Production (MAGP) of coal as0.50 MMT for the first year and one MMT annually for the next 29 years;
• WBMDTCL would annually raise penalty on TDCMPL for shortfalls inMAGP at ` 403 per MT;
• Reduction of MAGP was possible only due to force majeure conditions;and
• Adjustment of short extraction in earlier years with higher production insubsequent years was not permissible.
During the course of audit it was observed that:
(i) There were shortfalls in production against the MAGP for which penalty wasto be levied. The annual production, shortfall vis-à-vis penalty receivable during2012-15 were as follows :
Table 3.2: Statement showing penalty receivable
182 Rule 31.
Year Target Production Shortfall (-)/ excess Penalty at(MT) (MT) (+) (MT) `̀̀̀̀ 403 per MT
2012-13 5,00,000 3,52,378.61 (-) 1,47,621.39 5,94,91,420.17
2013-14 10,00,000 7,25,925.31 (-) 2,74,074.69 11,04,52,100.07
2014-15 10,00,000 10,41,054.88 (+) 41,054.88 Nil
Total 25,00,000 21,19,358.80 (-) 3,80,641.20 16,99,43,520.24
Audit Report (PSUs) for the year ended 31 March 2017
68
(ii) During 2012-13, TDCMPL extracted coal of 3.52 lakh MT against MAGP offive lakh MT. WBMDTCL deducted penalty amounting to ̀ 5.95 crore from thepayable amount. TDCMPL requested WBMDTCL to reduce (February 2013)the MAGP for the year 2012-13 from five lakh MT to 3.25 lakh MT on groundsof low initial demand for sale of coal through e-auction and to prevent thepossibility of fire incidents from stacks of unsold coal. WBMDTCL acceptedthe request of TDCMPL and refunded ` 5.95 crore (March 2016) for shortfallagainst MAGP for the year 2012-13. This decision was not justifiable as reducingthe output to avoid accumulation of unsold stocks was not a force majeurecondition, admissible under the agreement.
(iii) In 2013-14, shortfall in production vis-à-vis MAGP was 2.74 lakh MT, forwhich a penalty of ` 11.05 crore was deducted from the payables to TDCMPL.In 2014-15, production had exceeded MAGP by 0.41 lakh MT. On the requestof TDCMPL, WBMDTCL adjusted the excess quantity of coal produced againstthe shortfall in production in 2013-14 and reduced the penalty amount by` 1.65 crore. Despite absence of provisions in the RCC agreement for carryforward of short extraction, WBMDTCL refunded ` 1.65 crore (March 2016).
(iv) Though WBMDTCL deducted ̀ 16.99 crore towards penalty for shortfall inproduction of coal against MAGP during 2012-13 and 2013-14, an amount of` 7.60 crore was refunded (March 2016) as waivers. Moreover, scrutiny ofFinancial Statement for the year 2016-17 revealed that the balance amount afterwaivers i.e., ` 9.39 crore was not shown in accounts as amount received. Thepossibility of this amount being subsequently refunded cannot be discounted.
(v) WBMDTCL had originally fixed (May 2006) retention charge and penalty at` 403 per MT based on selling price of ` 1,190 per MT of coal. Subsequently,in the revised (March 2010) agreement, both parties mutually agreed to increaseonly the retention charge by 25 per cent of the selling price in excess of` 1,820 per MT. As selling price of coal in 2013-14 was ` 3,490 per MT,WBMDTCL’s incremental share of retention charge worked out to ̀ 417.50 perMT183. However, WBMDTCL’s failure to similarly enhance the amount of penaltyin the revised agreement led to loss of revenue of ` 11.44 crore184 in 2013-14.
(vi) GoWB was also deprived of royalty185 revenue of ̀ 18.13 lakh during 2012to 2014 due to shortfall in production as compared to MAGP.
183 ` (3,490-1,820) per MT of coal x 25 per cent.184 2013-14 : 2,74,074.69 MT multiplied by ` 417.50 per MT.185 As per Rule 9 of the MMDR Act, 1957, royalty at the rate specified by appropriate authority
has to be paid for the quantity of mineral removed from the leased area.
Chapter III Compliance Audit
69
Management stated (September 2017) that the agreement was amended with theapproval of GoWB. Further, penalty was not subject to any escalation anddifficulties in mining and selling coal had not been foreseen while signing theagreement.
The reply of the Management is not acceptable as it was decided by WBMDTCLthat if coal was sold above the base price, WBMDTCL would be eligible toreceive an additional retention charge of 25 per cent of the incremental sellingprice. Thus, the rate of penalty should have been revised in tandem with theincrease (March 2010) in the retention charge. Moreover, as per the agreement,WBMDTCL had withheld (August 2015) penalty for short production in2012-13 but had subsequently refunded (March 2016) the same. There were norecords to indicate that TDCMPL had pointed out any difficulties during2012-13 or made any request for reduction of MAGP. WBMDTCL brought theissue to the knowledge of its BoD only when TDCMPL had approached(February 2016) for refund. This indicated that the unforeseen difficulties inmining and selling coal were not really significant to adversely impact the miningof coal. Further, the penalty for 2013-14 had not been claimed.
Thus, WBMDTCL’s violation of the provisions of the agreement and irregularcarrying forward of short extraction led to loss of ` 19.04 crore186.
Non- coal
3.2.5.3 Environment clearance not obtained
WBMDTCL was required to obtain requisite environmental clearance (EC) formining black stone from the State Environment Impact Assessment Agency interms of the Environmental Impact Assessment (EIA) Notification, 2006 readwith Rule 31 of the MCDR 88. It was observed that WBMDTCL was miningblack stone at Pachami in Birbhum, without obtaining requisite environmentalclearance. Further, the National Green Tribunal, Eastern Zonal Bench, Kolkatadirected (January 2016) GoWB to act against those quarries which had noEnvironmental Clearance in terms of the EIA Notification 2006. Accordingly,District Land & Land Reforms Officer, Birbhum, GoWB (DLLRO) ordered(February 2016) WBMDTCL to cease operation of the quarries for violating theEnvironment (Protection) Act, 1986; The Air (Prevention and Control ofPollution) Act, 1981 and rules of MCDR88. WBMDTCL had not yetdiscontinued production (October 2017).
Management stated (September 2017) that under the said notification, minormineral mines, for which leases had been executed prior to the notification,were required to obtain environment clearance only on renewal of mining leases.At Pachami, this was due in 2018.
186 ` 5.95 crore + ` 1.65 crore + ` 11.44 crore.
Audit Report (PSUs) for the year ended 31 March 2017
70
The reply was not tenable as the Expert Appraisal Committee for EnvironmentalAppraisal of Mining Projects had observed (February 2017) that WBMDTCLhad, in violation of the notification, carried out mining until date without requisiteEC. Besides, the reply was silent DLLRO’s notice to cease operation.
3.2.5.4 Mining of black stone at Palsara-I and Palsara II
The extant provisions require award of contracts by any Government agencyonly through tendering process or public auction. Yet, WBMDTCL, with approvalof GoWB, nominated JSW Natural Resources India Ltd (JSWNRL) to mineblack stone deposits at Palsara-I and Palsara-II in Purulia district and entered(June 2012) into an agreement with JSWNRL for the same. Audit observed thatas of date, JSWNRL had failed to commence production due to (a) local agitationand (b) non-mobilisation of machinery by JSWNRL. The agreement was finallyterminated in December 2013. Subsequently, WBMDTCL entered intoagreements (March/ December 2015) with two agencies187 (selected throughopen tender) for mining blackstone at Palsara-I and Palsara-II respectively.
Meanwhile, DLLRO, Purulia had claimed (July 2014) dead rent188 (` 3.69 lakh)from WBMDTCL, cess for dead rent (` 3.17 lakh) and royalty (` 0.56 lakh) forthe period from January 2005 to December 2013. In addition, DLLRO, Puruliaimposed penalty of ` 2.67 crore for shortfall in production of black stone anddelay in submission of monthly returns. In November 2012 and November 2014,WBMDTCL paid ` 2.57 lakh towards dead rent and cess for dead rent alongwith ` 92.81 lakh towards penalty. WBMDTCL had also applied (April 2016)to GoWB for waiver of penalty on the ground that JSWNRL had not mobilisedmachinery at site.
Further, WBMDTCL was holder of the lease. To prevent illegal mining, Rule 6of WBMPR02, required WBMDTCL to intimate to GoWB details of the locationwhere it proposed to store blackstone, at least, 15 days before commencementof production. Audit observed that neither WBMDTCL nor its two miningagencies had issued the required intimation. Instead, production could notcommence till date (June 2017) as illegal mining was being carried out byoutsiders since May 2013. There was nothing on record to indicate thatWBMDTCL had taken action to stop illegal mining.
As such, had the mining commenced in time, WBMDTCL would have earned aminimum guaranteed retention money from contractors of ` 3.80 crore for
187 M/s Anusandhan Commo Trade (P) Limited (ACPL) and M/s IRC Natural ResourcesPrivate Ltd (IRCNRPL)
188 Dead rent is the minimum amount fixed as revenue, irrespective of whether the mine isoperational or not. It is not dependent on the actual quantities of minerals extracted fromthe mines.
Chapter III Compliance Audit
71
Palsara-I and ` 1.71 crore from Palsara-II. Besides, GoWB would have earnedrevenue by way of royalty, cess, VAT etc.
Management accepted the facts (September 2017) and stated that that claims ofdead rent was paid and request for waiver of penalty was under consideration byGoWB. The reply was, however, silent on failure to stop illegal mining as requiredunder WBMPR02.
3.2.5.5 Mining apatite (rock phosphate) at Beldih
WBMDTCL operated an apatite mine (33.28 hectares) at Beldih, Purulia since1975 by engaging departmental manpower. The apatite (rock phosphate) waspowdered at the Rangadih Grinding unit for sale as phosphatic fertilizer in tea/coffee plantations. The Commerce and Industries (C&I) Department, GoWBrenewed (May 2009) the mining lease in favour of WBMDTCL for 20 years.WBMDTCL discontinued manual mining from June 2011 as the mine’s depthhad exceeded 50 feet. Further, the crushing unit at Rangadih, was not operationalsince May 2011 with machinery in worn out condition. Bulk connection ofpower had been discontinued (July/ August 2016) and converted to low tensionconnection. The land at Rangadih (crushing plant) was on hire but no rent hasbeen paid by WBMDTCL since 1995.
A JV agreement was signed (August 2014) between IRC Natural ResourcesPrivate Ltd (IRCNRPL)189 and WBMDTCL, however the production from themine had not yet begun (October 2017). In this regard, Audit observed thefollowing:
(a) As per section 18(1) of the MMDR Act, 1957, for the protection ofenvironment by preventing or controlling any pollution caused by prospectingor mining operations, conservation and systematic development of mineralsshould be followed. Further as per section 18(2) of the MMDR Act, 1957 for thedevelopment of mineral resources in any area, the regulation for storage ofminerals and stocks thereof, disposal or discharge of waste arising from anymine should be followed properly. Audit, during physical inspection, observedthat in contravention of above sections, the mine was exploited unsystematicallyby WBMDTCL from 1975 to 2000. This had led to the mine becoming steep‘funnel-shaped’ with high ore to overburden ratio. This could not be remediedby WBMDTCL because of financial stringency. As per the mining plan, theestablished (September 2011) existing mineable reserves was 4.92 lakh MT. Butthese reserves could not be exploited unless WBMDTCL, as the mine operator,removed both the water accumulated at the site and the dumped overburden.Consequently, production had been stopped since May 2011. WBMDTCL could
189 A private agency.
Audit Report (PSUs) for the year ended 31 March 2017
72
not fruitfully utilise the 78 workers and 14 staff at Beldih and Rangadih. DuringMay 2011 to March 2017, WBMDTCL paid ` 7.70 crore towards idle salariesand wages and overtime of ` 2.50 lakh without any production.
(b) Section 9A (1) of the MMDR Act, 1957 requires the holder of a mininglease to pay either dead rent or royalty for any mineral removed or consumedfrom the leased area to the State Government every year at specified rates,whichever is greater. Audit observed that WBMDTCL had not paid outstandingdead rent of ` 11.65 lakh to GoWB for the period from June 2011 to March2017, in violation of aforesaid provisions since GoWB had not raised any claim.
(c) Beldih Apatite Mine had no valid ‘Consent to Operate’ from WBPCB inviolation of the statutory provision of the Water (Prevention & Control ofPollution) Act 1974, Air (Prevention & Control of Pollution) Act 1981 andEnvironment Protection Act, 1986. Consequently, WBPCB issued (March 2017)notice to WBMDTCL against their application for non-compliance with pollutionrequirements. Failure to comply within 15 days attracted closure of the mine.Further, WBMDTCL had operated the mine for many decades, which hadcontaminated the groundwater with fluoride in nine out of 12 blocks in Puruliadistrict.
Management was silent on all the issues raised by Audit in the above paragraph.
3.2.6 Closure
When the economic mineral resource is exhausted and mining ceases, minefacilities and the site are required to be reclaimed and closed. The goal of minesite reclamation and closure is to return the site to a condition that most resemblesthe pre-mining condition.
Coal
3.2.6.1 Rules and Government order relating to mine closure not compliedwith
According to Rule 29A of Mineral Concession (MC) Rules, 1960, the lesseeshall not determine the lease or part thereof unless there was an approved finalMine Closure Plan (MCP). A Mine Closure Deposit (MCD) equal to the annualcost was to be deposited into an escrow account each year throughout the minelife compounded at the rate of five per cent annually. Further, MoC had fixed(August 2009/ January 2013) annual cost of mine closure at rupees six lakh perhectare for an open cast mine, to be computed for total project area.
In this regard, it was observed that –
(i) No amount was deposited by TDCMPL with WBMDTCL as Mine ClosureDeposit (MCD) which was to be retained in an escrow account. As perrequirements, it should have deposited ` 75.87 lakh per year as MCD from 2012-13 to 2014-15. i.e., a total of ` 2.28 crore.
Chapter III Compliance Audit
73
(ii) WBMDTCL had not obtained bank guarantees (BGs) for this amount, asprovided in the contract. Consequently, WBMDTCL had become entirely liablefor MCD as the original allottee.
Management stated (September 2017) that provision for MCD with escrowaccount was added during amendment of mining agreement in May 2010.However, since the mine was operational from May 2012, WBMDTCL shouldhave collected the yearly requirement of MCD from TDCMPL, 2013 onwards.
3.2.7 Other issues
3.2.7.1 District Mineral Foundation (DMF) and National MineralExploration Trust (NMET)-implementation
Section 9B of the Mines and Minerals (Development and Regulation) AmendmentAct, 2015190, specifies establishment by GoWB of District Mineral Foundation(DMF) in any district affected by mining related operations with effect from12 January 2015. DMF was to work for the interest and benefit of persons andareas affected by mining related operations. The Mines and Minerals (Contributionto District Mineral Foundation) Rules, 2015 prescribed (September 2015)contribution to DMF191. It was seen that DMFs have not been set up in WestBengal. Further, Audit observed from the accounts of 2016-17, that WBMDTCLhad (i) not paid ̀ 63 lakh to GoWB towards DMF during January 2015 to March2017, and (ii) not realised ̀ 59.60 lakh of the unpaid amount from its contractorsas contribution to DMF.
Management stated (September 2017) that WBMDTCL had already raised claimsfor DMF to be recovered from the contractors. However, recovery of DMF fromcontractors, whose contract periods were over, was difficult. The fact remainsthat DMF was to be realised from January 2015 and WBMDTCL should haverecovered the amount from the contractors from January 2015 itself.
3.2.7.2 Avoidable liability of towards service tax
West Bengal Power Development Corporation Limited (WBPDCL) and TheDurgapur Projects Limited (DPL) appointed (March and April 2015) WBMDTCLas Advisor-cum-Mining Agent192 under the Mines Act, 1952 for their six coalmines. WBMDTCL then entered into agreements with WBPDCL (November
190 Inserted by MMDR Amendment Act, 2015, vide G.O.I. Ext. Part II, Section 1, No. 13,dated 27 March 2015 (No. 10 of 2015).
191 (a) 10 per cent of the royalty in respect of mining leases or prospecting license-cum-mining leases granted on or after 12 January 2015, and (b) 30 per cent of the royalty inrespect of mining leases granted before 12 January 2015.
192 Functions of an agent are to (i) ensure security of the coal mines and coal reserves, (ii)continue with de-watering in the coal mines, (iii) continue with minimum CSR activities,(iv) posting personnel in all coal mines and (v) payments to the employees and workers.
Audit Report (PSUs) for the year ended 31 March 2017
74
2016) and DPL (March 2017). Since April 2015 to December 2016, WBMDTCLincurred expenditure towards security expenses, salaries, wages, power/ fueletc. aggregating to ` 84.07 crore on behalf of WBPDCL and DPL. Thereafter,in accordance with the agreements, WBMDTCL had obtained monthlyreimbursement of these expenses from WBPDCL and DPL.
In this regard, Audit observed that reimbursement of expenses attracts servicetax under Rule 5(1) of the Service Tax (Determination of Value) Rules, 2006.Thus, though WBMDTCL was liable to recover and deposit service tax onreimbursement of these expenses, it had not collected and paid the service tax of` 12.13 crore for this period within due date as required under the Service TaxRule, 1994. This resulted in avoidable liability of WBMDTCL towards servicetax and interest on belated deposit.
Management stated (September 2017) that WBMDTCL had incurred expenditureon behalf of WBPDCL and DPL to continue serving of employees of prior allottee,maintain security services, social services in villages, power supply etc. As peragreements, all this expenditure was part of reimbursement only for whichWBMDTCL received consultancy fees. Moreover, some judgements hadexcluded reimbursable expenditure from the taxable value. Thus, any expenditureincurred on behalf of WBPDCL and DPL did not attract service tax.
The reply was contrary to the provisions of the Finance Act, 1994. Anyreimbursable expenditure or cost incurred by the service provider and chargedwas liable to tax. Besides, WBMDTCL did not fulfill the conditions of ‘pureagent’ under Service Tax (Determination of Value) Rules, 2006. Consequently,it was liable to pay service tax on reimbursement of expenses.
3.2.8 Conclusion
WBMDTCL had failed to achieve prescribed milestones for development ofthe allotted coal blocks resulting in non-commencement of mining in threecoal blocks and lost opportunity to earn revenue. Similarly, in respect of agranite project, extraction was taken through 90 day quarry permits incontravention of rules. There were irregularities in tendering procedurefor selection of RCC in case of TDCB. Moreover, undue benefit was extendedto the contractor while fixing the retention charge and penalty towards shortextraction of coal. WBMDTCL had not complied with statutory provisionsof mine closure, minimum guaranteed production, maintenance of records,payment of statutory dues including royalties/ cesses and recovery of duesfrom contractors. Moreover, it had failed to obtain requisite environmentclearances and to undertake mitigation measures leading to the ever presentpossibility of stoppage of mining activities. All these violations led to lostopportunity to earn revenue as well as direct losses to the Company.
These matters were brought to the notice of the Government in July 2017, theirreplies are awaited (January 2018).
Chapter III Compliance Audit
75
Saraswaty Press Limited
3.3 Follow-up Audit: Performance Audit on production and marketingperformance
3.3.1. Introduction
Saraswaty Press Limited193 (SPL) was incorporated (January 1987) as aGovernment Company with the objective of carrying on the business of variousprinting activities like photo offset, packing and book binding, computertypesetting, image processing, security designing and printing, etc.
A Performance Audit (PA) on the ‘Production and Marketing performance ofSaraswaty Press Limited’ was incorporated as Paragraph 2.3 in the Report of theComptroller and Auditor General of India (Commercial), Government of WestBengal for the year ended 31 March 2008. That PA covered the period from2003-04 to 2007-08. The PA pointed out 35 audit observations and made sixrecommendations. The Report was laid in the West Bengal Legislative Assemblyin July 2009. Government of West Bengal (GoWB) accepted (July 2012) all theobservations/recommendations and assured to take action for improvement ofperformance. The Committee on Public Undertakings (COPU) had not discussedthe PA till date.
By the time the PA was conducted, a subsidiary viz., West Bengal Text BookCorporation Limited (WBTBCL) dedicated to textbook printing was formed(March 2008) in order to avail excise exemption194. WBTBCL did not haveseparate employees, infrastructure or fixed assets. Its day-to-day managementand operations are carried on by SPL. At present, these two PSUs execute onlyGovernment jobs at SPL’s printing press as well as through outsourcing.
The Management of both the PSUs is vested in the same Board of Directors(BoD) with the same Managing Director (MD) as the Chief Executive. TheProduction Controller who supervises the entire printing activity and the MarketingManager responsible for obtaining job orders are common to both the PSUs.
3.3.2. Scope, methodology and criteria of Audit
A Follow-up Audit was conducted during October to December 2016. Theobjectives were to assess the extent to which the efforts were made forimplementation of Performance Audit recommendations and monitoring thereofduring the period from 2012-13 to 2016-17.
193 SPL under the name ‘Sree Saraswaty Press Limited’ (SSPL) was established in the year1923 and was taken over (1984) by State Government under Sree Saraswaty Press Ltd(Acquisition and Transfer of Undertakings) Act 1984 and was renamed in the style of‘Saraswaty Press Limited’ (SPL) with effect from 25 June 1993.
194 This exemption was withdrawn vide notification no. 4/2011-Central Excise (NT) dated1 March 2011.
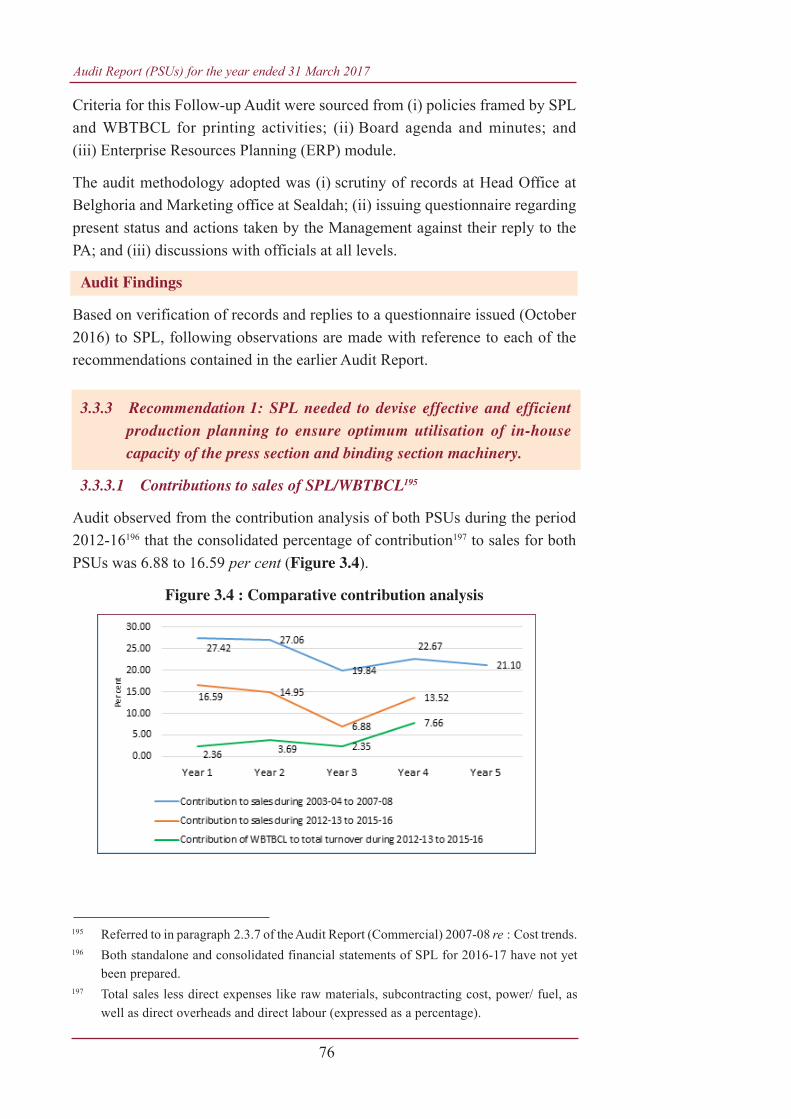
Audit Report (PSUs) for the year ended 31 March 2017
76
Criteria for this Follow-up Audit were sourced from (i) policies framed by SPLand WBTBCL for printing activities; (ii) Board agenda and minutes; and(iii) Enterprise Resources Planning (ERP) module.
The audit methodology adopted was (i) scrutiny of records at Head Office atBelghoria and Marketing office at Sealdah; (ii) issuing questionnaire regardingpresent status and actions taken by the Management against their reply to thePA; and (iii) discussions with officials at all levels.
Audit Findings
Based on verification of records and replies to a questionnaire issued (October2016) to SPL, following observations are made with reference to each of therecommendations contained in the earlier Audit Report.
3.3.3 Recommendation 1: SPL needed to devise effective and efficientproduction planning to ensure optimum utilisation of in-housecapacity of the press section and binding section machinery.
3.3.3.1 Contributions to sales of SPL/WBTBCL195
Audit observed from the contribution analysis of both PSUs during the period2012-16196 that the consolidated percentage of contribution197 to sales for bothPSUs was 6.88 to 16.59 per cent (Figure 3.4).
Figure 3.4 : Comparative contribution analysis
195 Referred to in paragraph 2.3.7 of the Audit Report (Commercial) 2007-08 re : Cost trends.196 Both standalone and consolidated financial statements of SPL for 2016-17 have not yet
been prepared.197 Total sales less direct expenses like raw materials, subcontracting cost, power/ fuel, as
well as direct overheads and direct labour (expressed as a percentage).
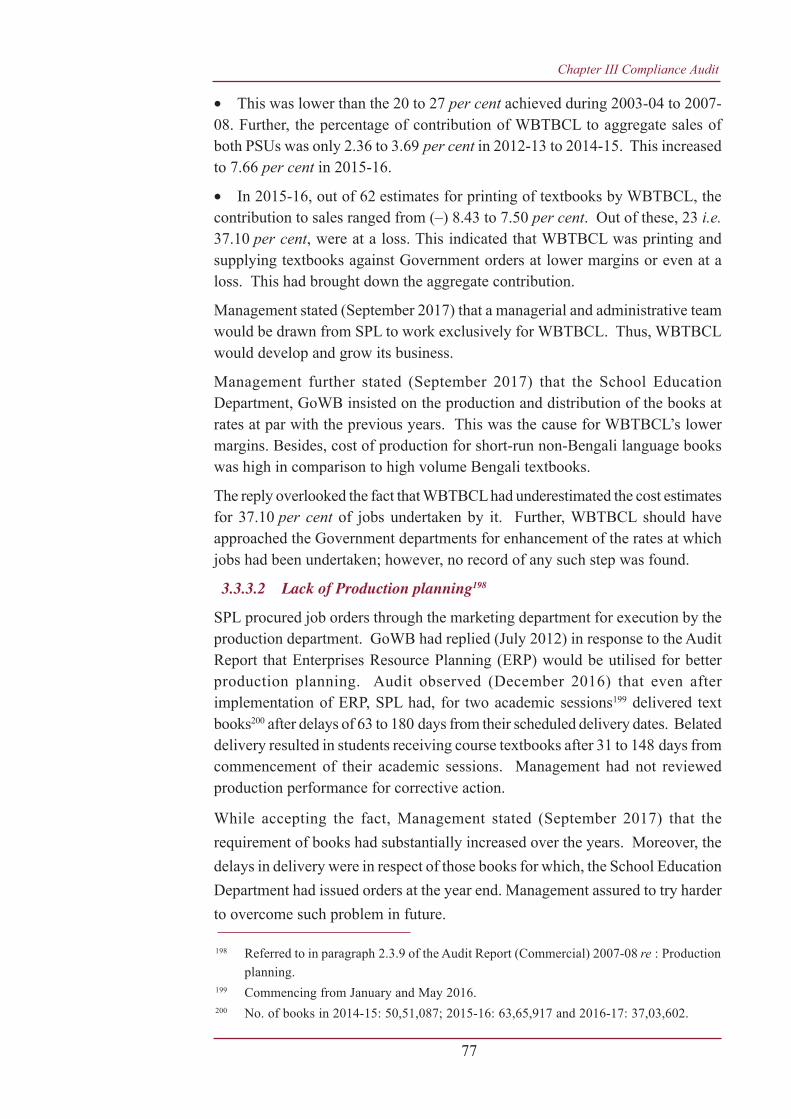
Chapter III Compliance Audit
77
• This was lower than the 20 to 27 per cent achieved during 2003-04 to 2007-08. Further, the percentage of contribution of WBTBCL to aggregate sales ofboth PSUs was only 2.36 to 3.69 per cent in 2012-13 to 2014-15. This increasedto 7.66 per cent in 2015-16.
• In 2015-16, out of 62 estimates for printing of textbooks by WBTBCL, thecontribution to sales ranged from (–) 8.43 to 7.50 per cent. Out of these, 23 i.e.37.10 per cent, were at a loss. This indicated that WBTBCL was printing andsupplying textbooks against Government orders at lower margins or even at aloss. This had brought down the aggregate contribution.
Management stated (September 2017) that a managerial and administrative teamwould be drawn from SPL to work exclusively for WBTBCL. Thus, WBTBCLwould develop and grow its business.
Management further stated (September 2017) that the School EducationDepartment, GoWB insisted on the production and distribution of the books atrates at par with the previous years. This was the cause for WBTBCL’s lowermargins. Besides, cost of production for short-run non-Bengali language bookswas high in comparison to high volume Bengali textbooks.
The reply overlooked the fact that WBTBCL had underestimated the cost estimatesfor 37.10 per cent of jobs undertaken by it. Further, WBTBCL should haveapproached the Government departments for enhancement of the rates at whichjobs had been undertaken; however, no record of any such step was found.
3.3.3.2 Lack of Production planning198
SPL procured job orders through the marketing department for execution by theproduction department. GoWB had replied (July 2012) in response to the AuditReport that Enterprises Resource Planning (ERP) would be utilised for betterproduction planning. Audit observed (December 2016) that even afterimplementation of ERP, SPL had, for two academic sessions199 delivered textbooks200 after delays of 63 to 180 days from their scheduled delivery dates. Belateddelivery resulted in students receiving course textbooks after 31 to 148 days fromcommencement of their academic sessions. Management had not reviewedproduction performance for corrective action.
While accepting the fact, Management stated (September 2017) that therequirement of books had substantially increased over the years. Moreover, thedelays in delivery were in respect of those books for which, the School EducationDepartment had issued orders at the year end. Management assured to try harderto overcome such problem in future.
198 Referred to in paragraph 2.3.9 of the Audit Report (Commercial) 2007-08 re : Productionplanning.
199 Commencing from January and May 2016.200 No. of books in 2014-15: 50,51,087; 2015-16: 63,65,917 and 2016-17: 37,03,602.
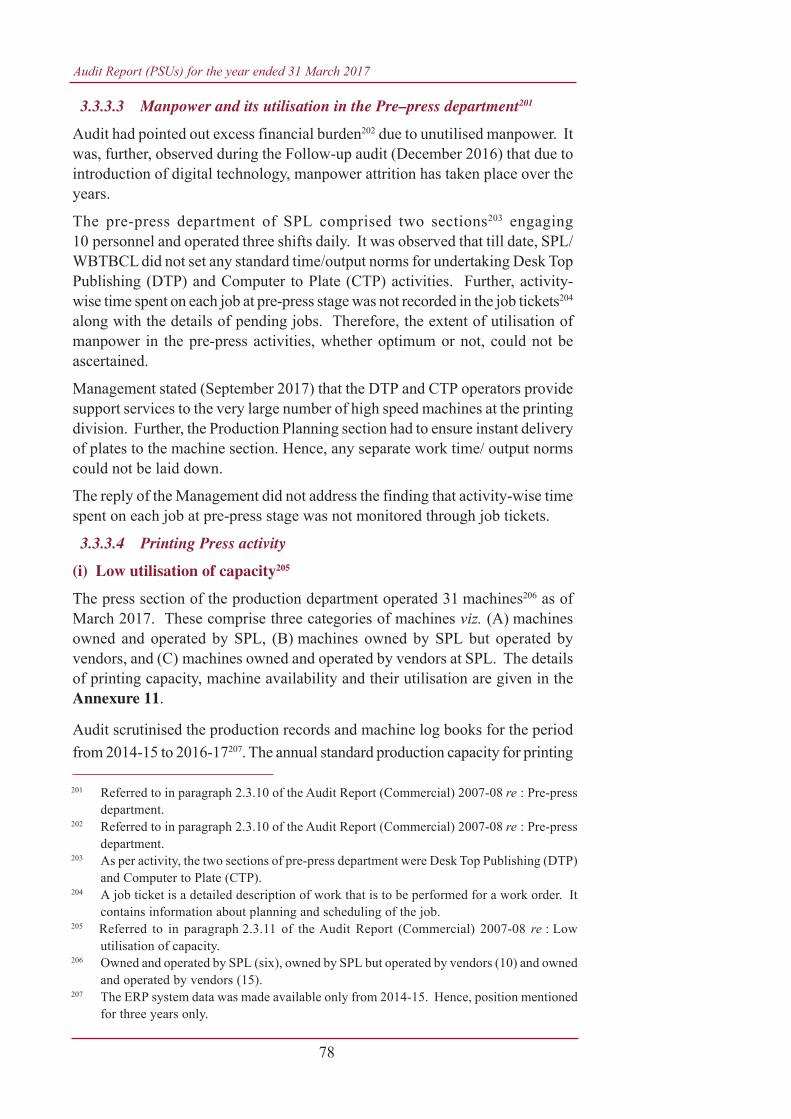
Audit Report (PSUs) for the year ended 31 March 2017
78
3.3.3.3 Manpower and its utilisation in the Pre–press department201
Audit had pointed out excess financial burden202 due to unutilised manpower. Itwas, further, observed during the Follow-up audit (December 2016) that due tointroduction of digital technology, manpower attrition has taken place over theyears.
The pre-press department of SPL comprised two sections203 engaging10 personnel and operated three shifts daily. It was observed that till date, SPL/WBTBCL did not set any standard time/output norms for undertaking Desk TopPublishing (DTP) and Computer to Plate (CTP) activities. Further, activity-wise time spent on each job at pre-press stage was not recorded in the job tickets204
along with the details of pending jobs. Therefore, the extent of utilisation ofmanpower in the pre-press activities, whether optimum or not, could not beascertained.
Management stated (September 2017) that the DTP and CTP operators providesupport services to the very large number of high speed machines at the printingdivision. Further, the Production Planning section had to ensure instant deliveryof plates to the machine section. Hence, any separate work time/ output normscould not be laid down.
The reply of the Management did not address the finding that activity-wise timespent on each job at pre-press stage was not monitored through job tickets.
3.3.3.4 Printing Press activity
(i) Low utilisation of capacity205
The press section of the production department operated 31 machines206 as ofMarch 2017. These comprise three categories of machines viz. (A) machinesowned and operated by SPL, (B) machines owned by SPL but operated byvendors, and (C) machines owned and operated by vendors at SPL. The detailsof printing capacity, machine availability and their utilisation are given in theAnnexure 11.
Audit scrutinised the production records and machine log books for the periodfrom 2014-15 to 2016-17207. The annual standard production capacity for printing
201 Referred to in paragraph 2.3.10 of the Audit Report (Commercial) 2007-08 re : Pre-pressdepartment.
202 Referred to in paragraph 2.3.10 of the Audit Report (Commercial) 2007-08 re : Pre-pressdepartment.
203 As per activity, the two sections of pre-press department were Desk Top Publishing (DTP)and Computer to Plate (CTP).
204 A job ticket is a detailed description of work that is to be performed for a work order. Itcontains information about planning and scheduling of the job.
205 Referred to in paragraph 2.3.11 of the Audit Report (Commercial) 2007-08 re : Lowutilisation of capacity.
206 Owned and operated by SPL (six), owned by SPL but operated by vendors (10) and ownedand operated by vendors (15).
207 The ERP system data was made available only from 2014-15. Hence, position mentionedfor three years only.
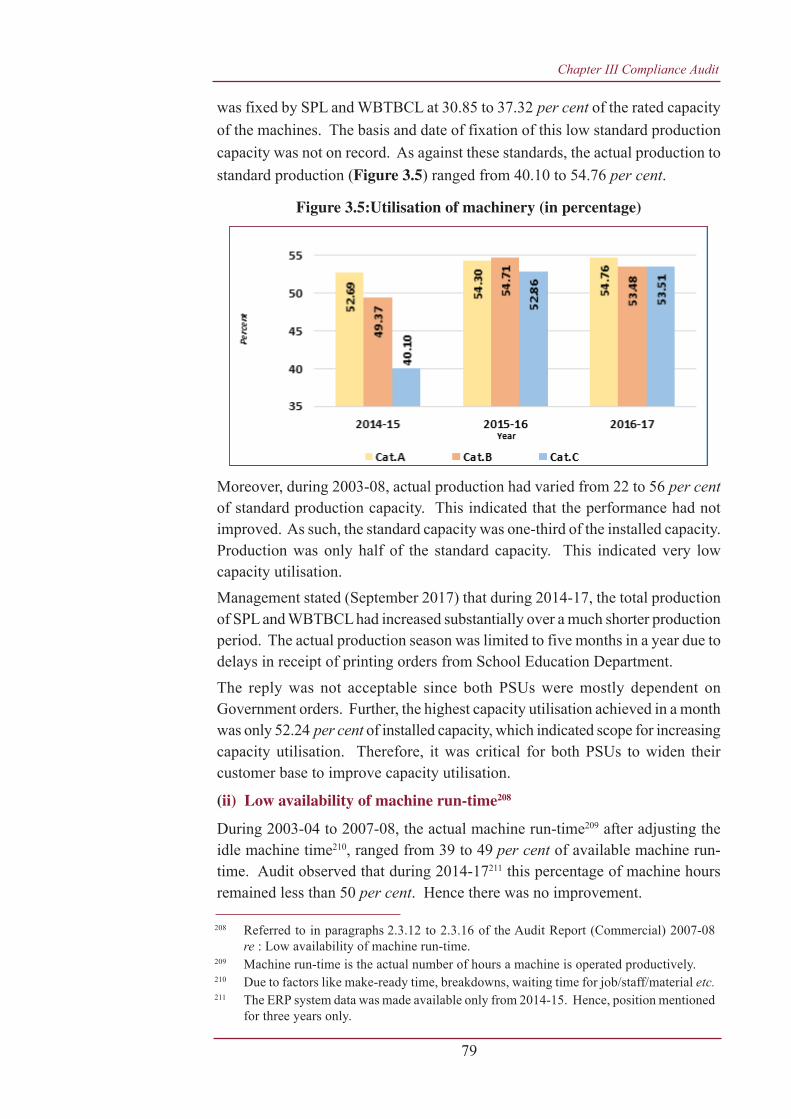
Chapter III Compliance Audit
79
was fixed by SPL and WBTBCL at 30.85 to 37.32 per cent of the rated capacityof the machines. The basis and date of fixation of this low standard productioncapacity was not on record. As against these standards, the actual production tostandard production (Figure 3.5) ranged from 40.10 to 54.76 per cent.
Figure 3.5:Utilisation of machinery (in percentage)
Moreover, during 2003-08, actual production had varied from 22 to 56 per centof standard production capacity. This indicated that the performance had notimproved. As such, the standard capacity was one-third of the installed capacity.Production was only half of the standard capacity. This indicated very lowcapacity utilisation.Management stated (September 2017) that during 2014-17, the total productionof SPL and WBTBCL had increased substantially over a much shorter productionperiod. The actual production season was limited to five months in a year due todelays in receipt of printing orders from School Education Department.The reply was not acceptable since both PSUs were mostly dependent onGovernment orders. Further, the highest capacity utilisation achieved in a monthwas only 52.24 per cent of installed capacity, which indicated scope for increasingcapacity utilisation. Therefore, it was critical for both PSUs to widen theircustomer base to improve capacity utilisation.
(ii) Low availability of machine run-time208
During 2003-04 to 2007-08, the actual machine run-time209 after adjusting theidle machine time210, ranged from 39 to 49 per cent of available machine run-time. Audit observed that during 2014-17211 this percentage of machine hoursremained less than 50 per cent. Hence there was no improvement.
208 Referred to in paragraphs 2.3.12 to 2.3.16 of the Audit Report (Commercial) 2007-08re : Low availability of machine run-time.
209 Machine run-time is the actual number of hours a machine is operated productively.210 Due to factors like make-ready time, breakdowns, waiting time for job/staff/material etc.211 The ERP system data was made available only from 2014-15. Hence, position mentioned
for three years only.
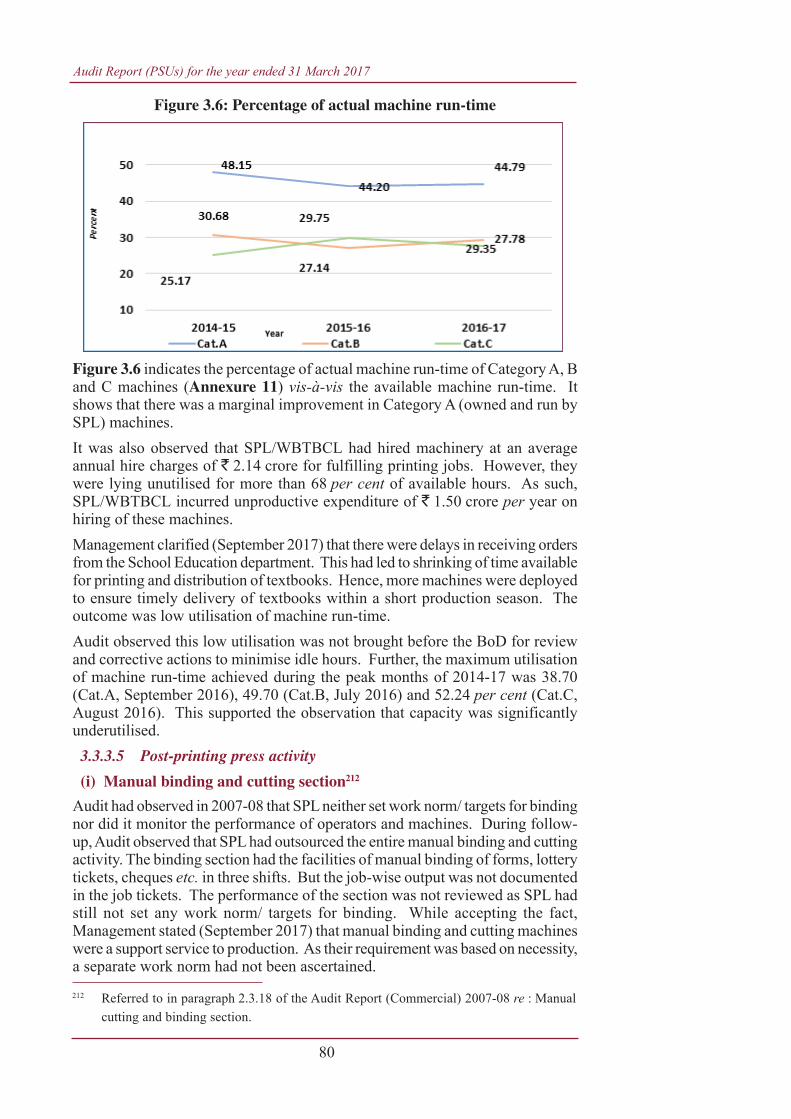
Audit Report (PSUs) for the year ended 31 March 2017
80
Figure 3.6: Percentage of actual machine run-time
Figure 3.6 indicates the percentage of actual machine run-time of Category A, Band C machines (Annexure 11) vis-à-vis the available machine run-time. Itshows that there was a marginal improvement in Category A (owned and run bySPL) machines.It was also observed that SPL/WBTBCL had hired machinery at an averageannual hire charges of ` 2.14 crore for fulfilling printing jobs. However, theywere lying unutilised for more than 68 per cent of available hours. As such,SPL/WBTBCL incurred unproductive expenditure of ` 1.50 crore per year onhiring of these machines.Management clarified (September 2017) that there were delays in receiving ordersfrom the School Education department. This had led to shrinking of time availablefor printing and distribution of textbooks. Hence, more machines were deployedto ensure timely delivery of textbooks within a short production season. Theoutcome was low utilisation of machine run-time.Audit observed this low utilisation was not brought before the BoD for reviewand corrective actions to minimise idle hours. Further, the maximum utilisationof machine run-time achieved during the peak months of 2014-17 was 38.70(Cat.A, September 2016), 49.70 (Cat.B, July 2016) and 52.24 per cent (Cat.C,August 2016). This supported the observation that capacity was significantlyunderutilised.3.3.3.5 Post-printing press activity
(i) Manual binding and cutting section212
Audit had observed in 2007-08 that SPL neither set work norm/ targets for bindingnor did it monitor the performance of operators and machines. During follow-up, Audit observed that SPL had outsourced the entire manual binding and cuttingactivity. The binding section had the facilities of manual binding of forms, lotterytickets, cheques etc. in three shifts. But the job-wise output was not documentedin the job tickets. The performance of the section was not reviewed as SPL hadstill not set any work norm/ targets for binding. While accepting the fact,Management stated (September 2017) that manual binding and cutting machineswere a support service to production. As their requirement was based on necessity,a separate work norm had not been ascertained.
212 Referred to in paragraph 2.3.18 of the Audit Report (Commercial) 2007-08 re : Manualcutting and binding section.
Chapter III Compliance Audit
81
The reply was not acceptable, as these requirements had been evaluated earlierstage. Based on this evaluation, their norms could have been worked out.(ii) Auto binding section213
It was observed that SPL had installed (February 1992) an imported automaticflow-line binding machine at a cost of ` 77 lakh. The machine’s achievablecapacity was binding 8,000 books per hour. Subsequently, the machine developeda problem with its sensor and went out of order from 2011. It was restored backonly in July 2016. Instead of getting the machine repaired in time, SPL purchasedand installed (July 2013- November 2013) three214 auto Binding Machines.Between 2011-2016, SPL resorted to outsourcing of binding work to privateentities and incurred extra costs despite availability of new machines from 2013.Audit observed from the information made available that SPL/WBTBCL hadprinted 10.34 crore and 11.91 crore books during 2015-16 and 2016-17respectively. All the books printed were required to be bound but the targetswere fixed at 5.22 crore and 4.46 crore respectively. The basis for these lowertargets was not on record. Moreover, only 3.37 crore (64.56 per cent) and2.71 crore books (60.76 per cent) were bound in these two years. Hence, theactual number of books bound did not even achieve the lower targets fixed.While accepting the fact, Management stated (September 2017) that due to changein specifications of books, work load of the binding machines had reduced.Besides, the machines had remained idle for long time due to non-availability ofspare parts.3.3.4 Recommendation 2: The Company needs to introduce a
sub-contracting policy detailing the procedure to be followed forsub-contracting the jobs after evaluating the economics of suchsub-contracting.
3.3.4.1 Extent of outsourcing215
Expenditure on sub-contracting of printing and binding charges was 65 per centof its total cost during 2003-08. Audit observed that both PSUs had undertakensub-contracting work totalling to ̀ 101.31 crore during 2014-17. This represented8.70 per cent of their sales and 9.53 per cent of their cost in the same period.The value of work outsourced had increased from ` 28.30 crore (2014-15) to` 38.14 crore (2015-16). In 2016-17, it reduced to ` 34.86 crore. Yet, SPL hadno documented sub-contracting policy/ guidelines. SPL formulated a procurementmanual only in July 2016. This manual included the binding work to the sub-contractors as a part of normal range of procurement. However, the detailedprocedure to be followed for subcontracting jobs was not specified. Rate contractwas the only basis for binding work.Job-wise details of the total sub-contracted jobs of ̀ 101.31 crore during the years2014-15 to 2016-17 were not made available. Audit could not ascertain theprofitability of each job as well as the economics of sub-contracting of jobs.
213 Referred to in paragraph 2.3.19 of the Audit Report (Commercial) 2007-08 re : Auto bindingsection.
214 Muller Martin Binding and Trimming, Kolbus Martín Binding and Trimming, WellboundBinding and Trimming machines.
215 Referred to in paragraphs 2.3.28 to 2.3.32 of the Audit Report (Commercial) 2007-08re : Sub-contracting.
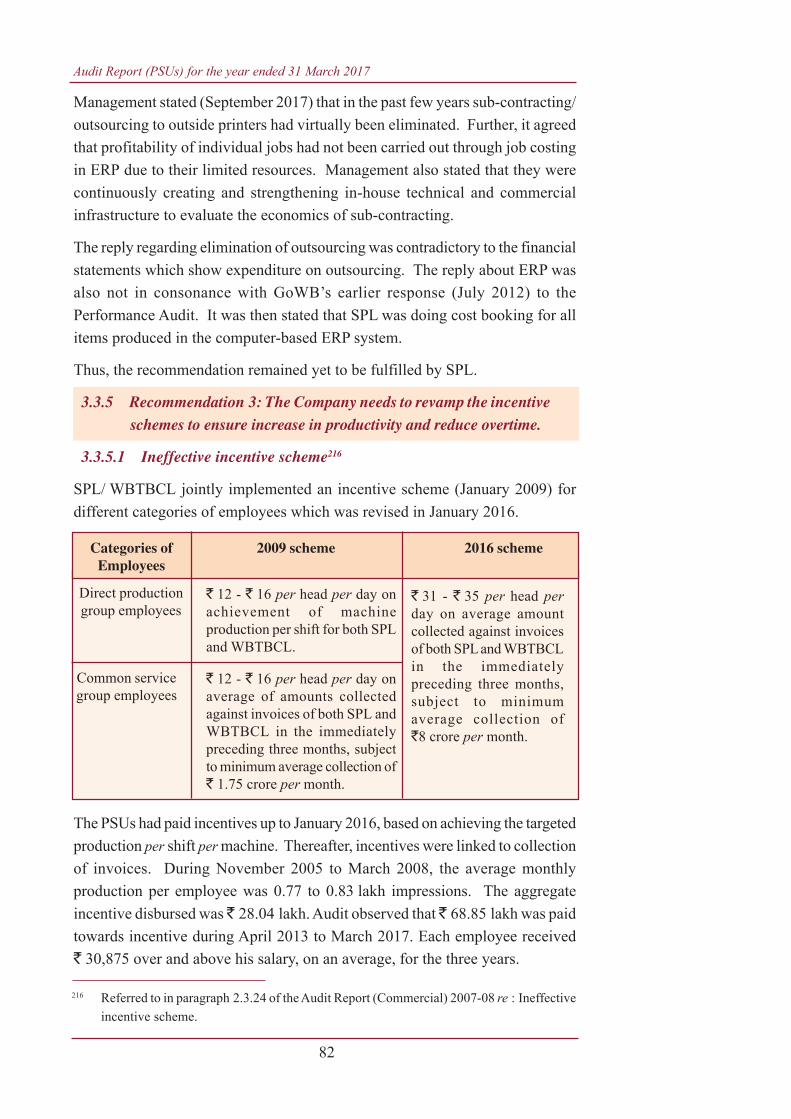
Audit Report (PSUs) for the year ended 31 March 2017
82
Management stated (September 2017) that in the past few years sub-contracting/outsourcing to outside printers had virtually been eliminated. Further, it agreedthat profitability of individual jobs had not been carried out through job costingin ERP due to their limited resources. Management also stated that they werecontinuously creating and strengthening in-house technical and commercialinfrastructure to evaluate the economics of sub-contracting.
The reply regarding elimination of outsourcing was contradictory to the financialstatements which show expenditure on outsourcing. The reply about ERP wasalso not in consonance with GoWB’s earlier response (July 2012) to thePerformance Audit. It was then stated that SPL was doing cost booking for allitems produced in the computer-based ERP system.
Thus, the recommendation remained yet to be fulfilled by SPL.
3.3.5 Recommendation 3: The Company needs to revamp the incentiveschemes to ensure increase in productivity and reduce overtime.
3.3.5.1 Ineffective incentive scheme216
SPL/ WBTBCL jointly implemented an incentive scheme (January 2009) fordifferent categories of employees which was revised in January 2016.
The PSUs had paid incentives up to January 2016, based on achieving the targetedproduction per shift per machine. Thereafter, incentives were linked to collectionof invoices. During November 2005 to March 2008, the average monthlyproduction per employee was 0.77 to 0.83 lakh impressions. The aggregateincentive disbursed was ̀ 28.04 lakh. Audit observed that ̀ 68.85 lakh was paidtowards incentive during April 2013 to March 2017. Each employee received` 30,875 over and above his salary, on an average, for the three years.
216 Referred to in paragraph 2.3.24 of the Audit Report (Commercial) 2007-08 re : Ineffectiveincentive scheme.
Categories of 2009 scheme 2016 schemeEmployees
Direct productiongroup employees
` 12 - ` 16 per head per day onachievement of machineproduction per shift for both SPLand WBTBCL.
Common servicegroup employees
` 12 - ` 16 per head per day onaverage of amounts collectedagainst invoices of both SPL andWBTBCL in the immediatelypreceding three months, subjectto minimum average collection of` 1.75 crore per month.
` 31 - ` 35 per head perday on average amountcollected against invoicesof both SPL and WBTBCLin the immediatelypreceding three months,subject to minimumaverage collection of`8 crore per month.
Chapter III Compliance Audit
83
Audit analysis showed that even though standard production targets were setlower by 62.68 to 69.15 per cent than the installed production capacity during2014-17, SPL paid incentives to production staff. It was also seen that despitepayment of sales incentives, the percentage of realisation of dues to sales hadshown a fluctuating trend. Consequently, the aggregate amount due fromGovernment written off as ‘bad debt’ during 2012-16 was ` 9.61 crore. TheManagement stated (September 2017) that incentives were to increase productivityand reduce overtime. However, their customers had delayed payment of dues.The PSUs were “continuously trying to overcome this situation through more,more and more effort”.
The reply was not acceptable since the gains in productivity were the result ofutilising vendors’ manpower/ machines by the PSUs. Moreover, Audit could notsee the result of those efforts stated to have been taken, in terms of increase inproductivity.
3.3.5.2 High incidence of overtime217
Audit observed that SPL and WBTBCL paid overtime (OT) of ` 1.66 crore,` 1.70 crore and ` 2.39 crore in 2014-15, 2015-16 and 2016-17 respectively to106 to 145 employees. According to the Factory Act 1948, the total overtimehours shall not exceed fifty hours for any quarter for any employee. Audit observedfrom test check of pay roll registers, attendance registers and pay sheets that:
• During April 2014 to September 2016, an average of 120 out of 130 employeeswere engaged in overtime work of more than fifty hours in a quarter.
• An average of 22 out of above 120 employees had worked continuously in amonth for an average period of 50.23 hours i.e. more than two days at a stretch,which is inhuman.
• On 10 occasions, overtime of ̀ 2.23 lakh was paid to 27 workers where therewas no production.
Management stated (September 2017) that, on a regular basis, large numbers ofGovernment printing orders arrived at SPL after working hours. These materialswere to be printed and delivered before the start of the next working day, ifnecessary, by working on holidays. This resulted in high OT. The reply was,however, silent about the violations of the Factory Act 1948 and measures, ifany, to curb the incidence of OT.
As such, this recommendation was also not implemented by the Management.
217 Referred to in paragraph 2.3.25 of the Audit Report (Commercial) 2007-08 re : Highincidence of overtime.
Audit Report (PSUs) for the year ended 31 March 2017
84
3.3.6 Recommendation 4: The Company needs to strengthen the controlmechanism in regard to the maintenance of job tickets, job-wiseprofitability and utilisation of paper with reference to the norms.
3.3.6.1 Costing218
It was observed that after introduction of ERP in April 2012, SPL and WBTBCLhad neither prepared any costing manual nor maintained a Costing Department.The job-wise estimates prepared by the marketing wing were, therefore, notsubject to any oversight process. Moreover, as (i) job-wise actual cost of materialconsumed, (ii) machine and manpower utilised were not synchronised, job-wiseactual cost and profitability thereof could not be ascertained in audit.
Management stated (September 2017) that the job-wise costing was done asongoing basis in the ERP system. The reply was contradictory, as Managementhad stated in reply to an earlier observation (Paragraph 3.3.3.2) that profitabilityof individual jobs had not been carried out through job costing in ERP due totheir limited resources. As such, Management was unaware about the actualprofitability of its various operations.
3.3.6.2 Deficiencies in Internal Control system219
Internal Control system is an essential pre-requisite for efficient and effectivemanagement of an organisation. Audit observed the following deficiencies inthe Internal Control system :-
• Paper cost, ink cost and other direct costs were not recorded job-wise inERP. Consequently, any deviation from the purchase proposals and actual materialpurchased could not be identified.
• Job cost estimates as prepared by marketing section after receipt of job orderswere not fed into ERP system. Therefore, actual expenditure incurred was notcompared with cost estimates. Audit observed that overhead costs were notincluded in test checked 62 cost estimates.
• Machine- wise binding activities were not recorded in ERP.
The Management had accepted the observation in March 2017. Subsequently, itattributed (September 2017) the deficiencies in internal controls to difficulty inindividually linking the cost of paper and ink to a particular job. It was silent onrest of the points raised by Audit.
218 Referred to in paragraph 2.3.39 of the Audit Report (Commercial) 2007-08 re : Costing.219 Referred to in paragraph 2.3.40 of the Audit Report (Commercial) 2007-08 re : Internal
control.

Chapter III Compliance Audit
85
3.3.7 Recommendation 5: The Company needs to introduce the salesand realisation target for the marketing agents.
3.3.7.1 Marketing set-up220
SPL and WBTBCL shared a marketing wing, headed by the Marketing Managerwho was assisted by ten sales executives. Besides, SPL and WBTBCL hadappointed two marketing agents for securing sales orders from the Governmentsof two adjacent States viz. Bihar and Jharkhand as well as from Central PSUs ata commission on a rated scale on sales value to be paid after realisation of dues.
In this connection, the following issues were noticed in audit:
Management stated (September 2017) that the Government departments had notinformed their requirements in advance. This had made it difficult to assess therequirements of different departments for preparation of sales budget.
The reply was not tenable since the nature of printing jobs undertaken by bothPSUs were predominantly repetitive. They comprised of textbooks, cause lists,holograms, lottery tickets, question papers, blank answer scripts etc. Hence, thePSUs were in a position to draw up tentative sales budgets, without any specificinputs of Government departments. These could be firmed up on receipt of actualorders.
3.3.7.2 Flawed and outdated estimates
Audit observed that SPL had drawn up estimates with defects as well as hadcontinued with obsolete estimates prepared in 1999 and 2006 leading to lossesof ` 12.84 crore221 as follows:
Issue Management
1. Mentioned during 2003-2008 PerformanceAudit report: (i) absence of documentedmarketing strategy; (ii) business development;(iii) database of competitors’ pricing; (iv) job-wise profitability; etc.
2. Preparation of sales budget during 2012-17
3. Jobs amounting to ` 9.56 crore (printing ofbooks for academic session 2016-17)performed without any formal order oragreement.
No action taken to rectifythese issues
Not prepared
No realisation againstthese jobs till completionof audit. (December2016).
220 Referred to in paragraph 2.3.26 and 2.3.27 of the Audit Report (Commercial) 2007-08re : Marketing set-up and Sales performance.
221 ` 12.84 crore (` 1.22 crore plus ` 68.14 lakh plus ` 10.94 crore).
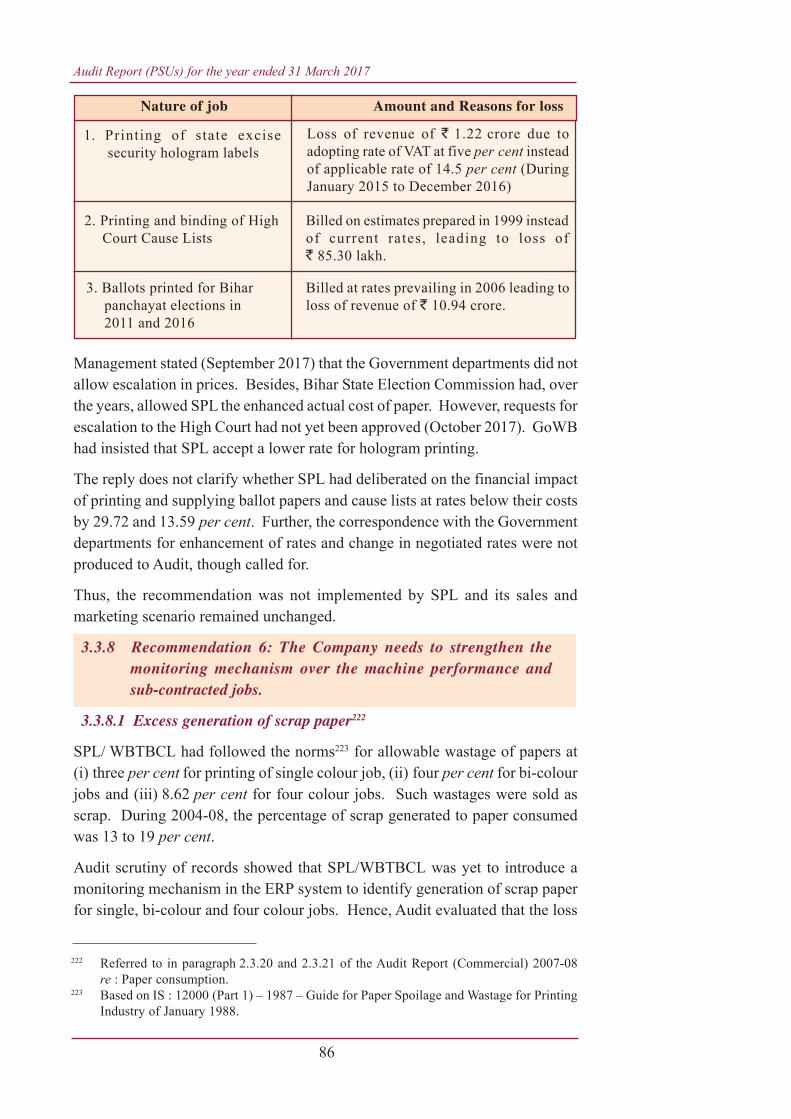
Audit Report (PSUs) for the year ended 31 March 2017
86
Management stated (September 2017) that the Government departments did notallow escalation in prices. Besides, Bihar State Election Commission had, overthe years, allowed SPL the enhanced actual cost of paper. However, requests forescalation to the High Court had not yet been approved (October 2017). GoWBhad insisted that SPL accept a lower rate for hologram printing.
The reply does not clarify whether SPL had deliberated on the financial impactof printing and supplying ballot papers and cause lists at rates below their costsby 29.72 and 13.59 per cent. Further, the correspondence with the Governmentdepartments for enhancement of rates and change in negotiated rates were notproduced to Audit, though called for.
Thus, the recommendation was not implemented by SPL and its sales andmarketing scenario remained unchanged.
3.3.8 Recommendation 6: The Company needs to strengthen themonitoring mechanism over the machine performance andsub-contracted jobs.
3.3.8.1 Excess generation of scrap paper222
SPL/ WBTBCL had followed the norms223 for allowable wastage of papers at(i) three per cent for printing of single colour job, (ii) four per cent for bi-colourjobs and (iii) 8.62 per cent for four colour jobs. Such wastages were sold asscrap. During 2004-08, the percentage of scrap generated to paper consumedwas 13 to 19 per cent.
Audit scrutiny of records showed that SPL/WBTBCL was yet to introduce amonitoring mechanism in the ERP system to identify generation of scrap paperfor single, bi-colour and four colour jobs. Hence, Audit evaluated that the loss
Nature of job Amount and Reasons for loss
1. Printing of state excisesecurity hologram labels
Loss of revenue of ` 1.22 crore due toadopting rate of VAT at five per cent insteadof applicable rate of 14.5 per cent (DuringJanuary 2015 to December 2016)
2. Printing and binding of HighCourt Cause Lists
3. Ballots printed for Biharpanchayat elections in2011 and 2016
Billed on estimates prepared in 1999 insteadof current rates, leading to loss of` 85.30 lakh.
Billed at rates prevailing in 2006 leading toloss of revenue of ` 10.94 crore.
222 Referred to in paragraph 2.3.20 and 2.3.21 of the Audit Report (Commercial) 2007-08re : Paper consumption.
223 Based on IS : 12000 (Part 1) – 1987 – Guide for Paper Spoilage and Wastage for PrintingIndustry of January 1988.
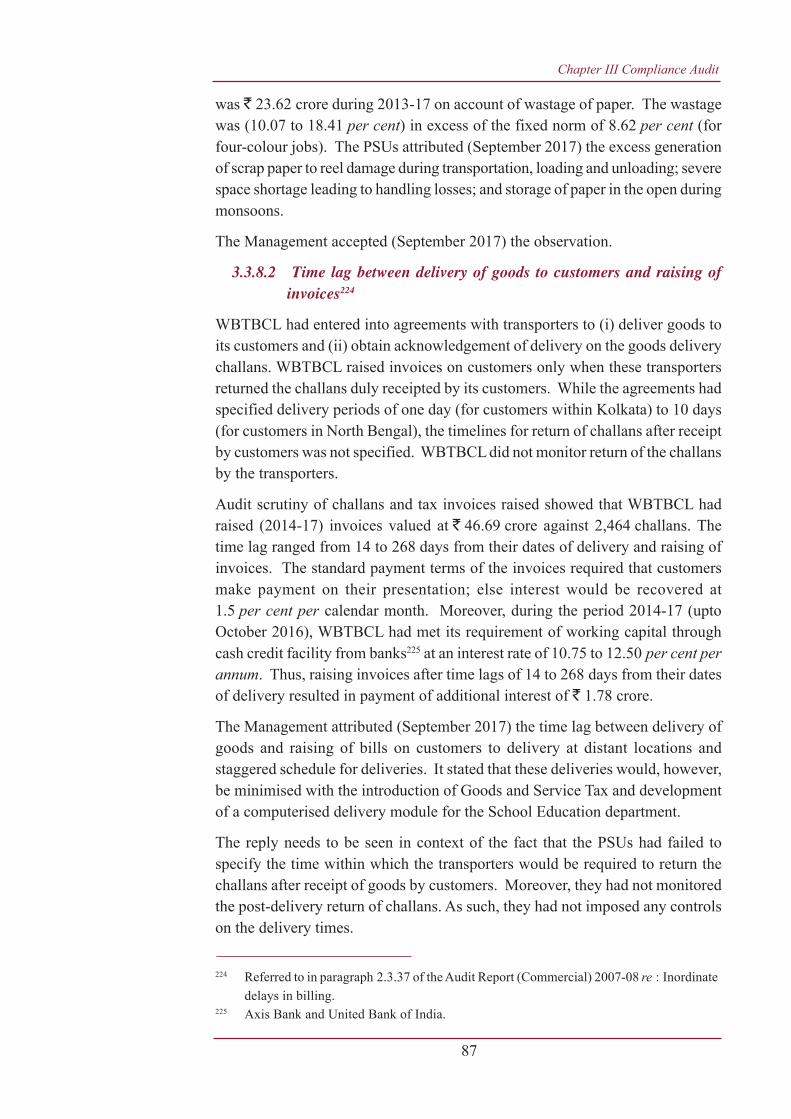
Chapter III Compliance Audit
87
was ` 23.62 crore during 2013-17 on account of wastage of paper. The wastagewas (10.07 to 18.41 per cent) in excess of the fixed norm of 8.62 per cent (forfour-colour jobs). The PSUs attributed (September 2017) the excess generationof scrap paper to reel damage during transportation, loading and unloading; severespace shortage leading to handling losses; and storage of paper in the open duringmonsoons.
The Management accepted (September 2017) the observation.
3.3.8.2 Time lag between delivery of goods to customers and raising ofinvoices224
WBTBCL had entered into agreements with transporters to (i) deliver goods toits customers and (ii) obtain acknowledgement of delivery on the goods deliverychallans. WBTBCL raised invoices on customers only when these transportersreturned the challans duly receipted by its customers. While the agreements hadspecified delivery periods of one day (for customers within Kolkata) to 10 days(for customers in North Bengal), the timelines for return of challans after receiptby customers was not specified. WBTBCL did not monitor return of the challansby the transporters.
Audit scrutiny of challans and tax invoices raised showed that WBTBCL hadraised (2014-17) invoices valued at ` 46.69 crore against 2,464 challans. Thetime lag ranged from 14 to 268 days from their dates of delivery and raising ofinvoices. The standard payment terms of the invoices required that customersmake payment on their presentation; else interest would be recovered at1.5 per cent per calendar month. Moreover, during the period 2014-17 (uptoOctober 2016), WBTBCL had met its requirement of working capital throughcash credit facility from banks225 at an interest rate of 10.75 to 12.50 per cent perannum. Thus, raising invoices after time lags of 14 to 268 days from their datesof delivery resulted in payment of additional interest of ` 1.78 crore.
The Management attributed (September 2017) the time lag between delivery ofgoods and raising of bills on customers to delivery at distant locations andstaggered schedule for deliveries. It stated that these deliveries would, however,be minimised with the introduction of Goods and Service Tax and developmentof a computerised delivery module for the School Education department.
The reply needs to be seen in context of the fact that the PSUs had failed tospecify the time within which the transporters would be required to return thechallans after receipt of goods by customers. Moreover, they had not monitoredthe post-delivery return of challans. As such, they had not imposed any controlson the delivery times.
224 Referred to in paragraph 2.3.37 of the Audit Report (Commercial) 2007-08 re : Inordinatedelays in billing.
225 Axis Bank and United Bank of India.

Audit Report (PSUs) for the year ended 31 March 2017
88
3.3.9 Conclusion
The Follow-up audit showed that out of six recommendations included inthe earlier Performance Audit, SPL had not yet implemented any of therecommendations in their entirety. There was insignificant or no progresson implementation of two recommendations (recommendations - two andfour) while four (recommendations - one, three, five and six) had been partlyimplemented. SPL continued with its out-dated production and marketing/sales practices, low capacity utilisation of machines etc., resulting in sustainedlosses over the years. Its’ monitoring and control mechanisms remainedweak, which provided no assurance of management oversight over itsoperations. There were no further findings in respect of other issues includedin the earlier Performance Audit.
The Management added (September 2017) that SPL had made substantialprogress in the past few years. Moreover, it was working very hard tominimise the limitations imposed by the commercial and operationaldifficulties, which were part of its business profile.
WEST BENGAL POWER DEVELOPMENT CORPORATION LIMITED
3.4 Extra expenditure on Exchange Rate Variation due to contractual flaw
West Bengal Power Development Corporation Limited (WBPDCL) is a state-owned electricity generation company. It operates five thermal power stationsat Kolaghat, Bandel, Bakreshwar, Sagardighi and Santaldih.
WBPDCL notified (November 2009) a tender for the supply of equipment andmaterials for Units 3 and 4 of its Sagardighi Thermal Power Project (SgTPP)Phase II. M/s Bharat Heavy Electricals Limited (Contractor), was awarded(February 2011) the contract for supply and erection at a total firm price226 of` 3,220 crore (including USD and Euro for imported materials). The Letter ofAward (LOA) specified a completion schedule of 45 months (Unit 3) and48 months (Unit 4) from the zero date (February 2011). The contract price wasalso to remain firm throughout the execution period and any extension thereof,as per the LOA. Moreover, the bid documents provided (November 2009) for
West Bengal Power Development Corporation Limited had not included anExchange Rate Variation (ERV) clause in the tender document as it was fora firm price. Yet, subsequently it had included an ERV clause in theagreement. This led to extra expenditure of `̀̀̀̀ 156.76 crore.
226 A firm-price contract is a type of contract in which there is no uncertain or indefinite elementin the price. The amount paid does not depend on resources used or time expended.
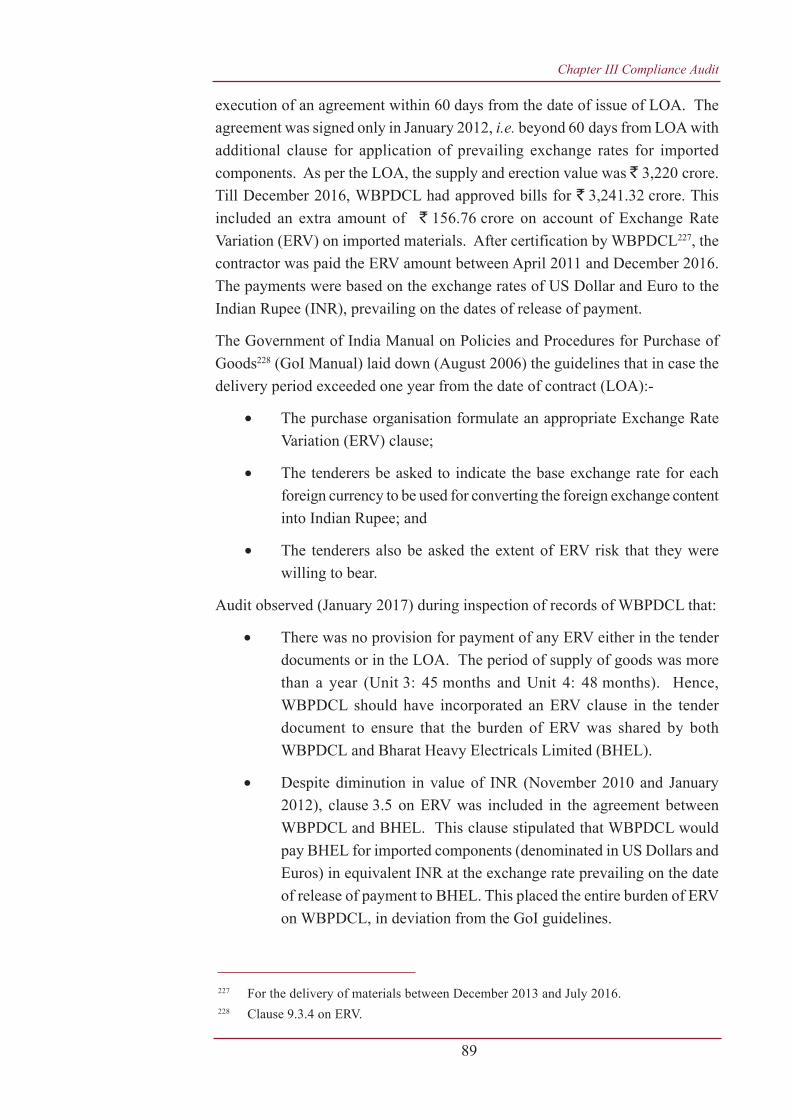
Chapter III Compliance Audit
89
execution of an agreement within 60 days from the date of issue of LOA. Theagreement was signed only in January 2012, i.e. beyond 60 days from LOA withadditional clause for application of prevailing exchange rates for importedcomponents. As per the LOA, the supply and erection value was ` 3,220 crore.Till December 2016, WBPDCL had approved bills for ` 3,241.32 crore. Thisincluded an extra amount of ` 156.76 crore on account of Exchange RateVariation (ERV) on imported materials. After certification by WBPDCL227, thecontractor was paid the ERV amount between April 2011 and December 2016.The payments were based on the exchange rates of US Dollar and Euro to theIndian Rupee (INR), prevailing on the dates of release of payment.
The Government of India Manual on Policies and Procedures for Purchase ofGoods228 (GoI Manual) laid down (August 2006) the guidelines that in case thedelivery period exceeded one year from the date of contract (LOA):-
• The purchase organisation formulate an appropriate Exchange RateVariation (ERV) clause;
• The tenderers be asked to indicate the base exchange rate for eachforeign currency to be used for converting the foreign exchange contentinto Indian Rupee; and
• The tenderers also be asked the extent of ERV risk that they werewilling to bear.
Audit observed (January 2017) during inspection of records of WBPDCL that:
• There was no provision for payment of any ERV either in the tenderdocuments or in the LOA. The period of supply of goods was morethan a year (Unit 3: 45 months and Unit 4: 48 months). Hence,WBPDCL should have incorporated an ERV clause in the tenderdocument to ensure that the burden of ERV was shared by bothWBPDCL and Bharat Heavy Electricals Limited (BHEL).
• Despite diminution in value of INR (November 2010 and January2012), clause 3.5 on ERV was included in the agreement betweenWBPDCL and BHEL. This clause stipulated that WBPDCL wouldpay BHEL for imported components (denominated in US Dollars andEuros) in equivalent INR at the exchange rate prevailing on the dateof release of payment to BHEL. This placed the entire burden of ERVon WBPDCL, in deviation from the GoI guidelines.
227 For the delivery of materials between December 2013 and July 2016.228 Clause 9.3.4 on ERV.
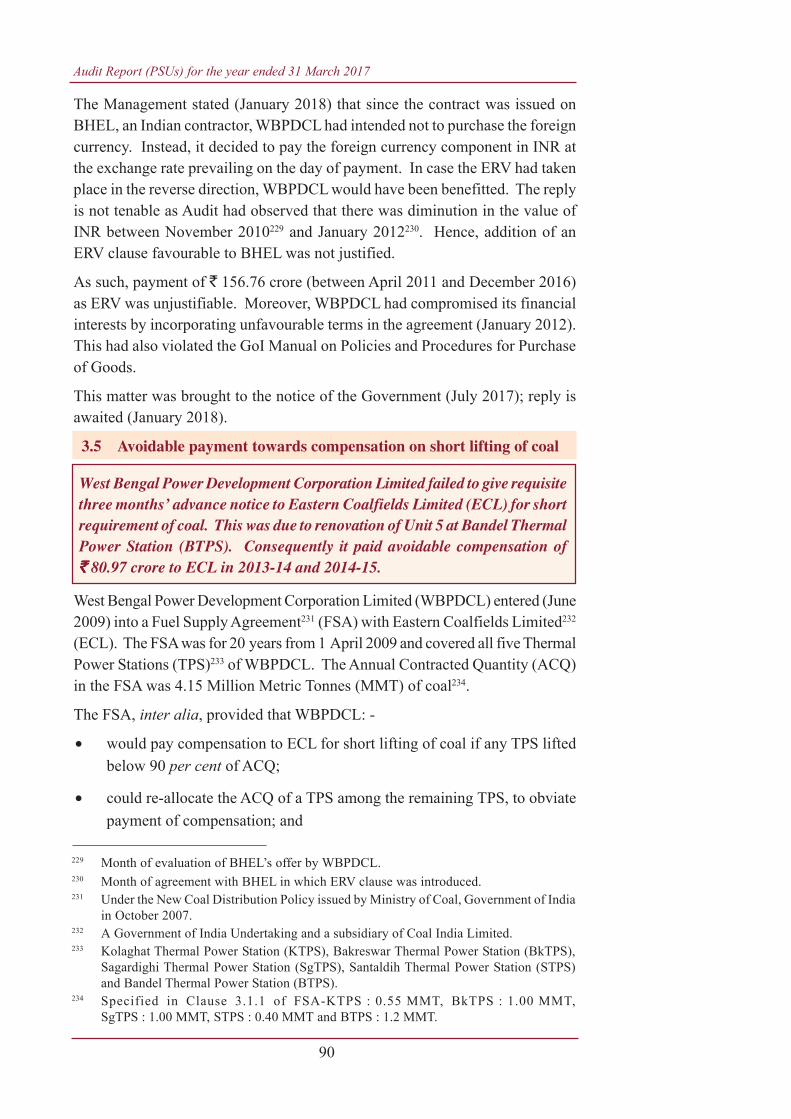
Audit Report (PSUs) for the year ended 31 March 2017
90
The Management stated (January 2018) that since the contract was issued onBHEL, an Indian contractor, WBPDCL had intended not to purchase the foreigncurrency. Instead, it decided to pay the foreign currency component in INR atthe exchange rate prevailing on the day of payment. In case the ERV had takenplace in the reverse direction, WBPDCL would have been benefitted. The replyis not tenable as Audit had observed that there was diminution in the value ofINR between November 2010229 and January 2012230. Hence, addition of anERV clause favourable to BHEL was not justified.
As such, payment of ` 156.76 crore (between April 2011 and December 2016)as ERV was unjustifiable. Moreover, WBPDCL had compromised its financialinterests by incorporating unfavourable terms in the agreement (January 2012).This had also violated the GoI Manual on Policies and Procedures for Purchaseof Goods.
This matter was brought to the notice of the Government (July 2017); reply isawaited (January 2018).
3.5 Avoidable payment towards compensation on short lifting of coal
West Bengal Power Development Corporation Limited (WBPDCL) entered (June2009) into a Fuel Supply Agreement231 (FSA) with Eastern Coalfields Limited232
(ECL). The FSA was for 20 years from 1 April 2009 and covered all five ThermalPower Stations (TPS)233 of WBPDCL. The Annual Contracted Quantity (ACQ)in the FSA was 4.15 Million Metric Tonnes (MMT) of coal234.
The FSA, inter alia, provided that WBPDCL: -
• would pay compensation to ECL for short lifting of coal if any TPS liftedbelow 90 per cent of ACQ;
• could re-allocate the ACQ of a TPS among the remaining TPS, to obviatepayment of compensation; and
West Bengal Power Development Corporation Limited failed to give requisitethree months’ advance notice to Eastern Coalfields Limited (ECL) for shortrequirement of coal. This was due to renovation of Unit 5 at Bandel ThermalPower Station (BTPS). Consequently it paid avoidable compensation of`̀̀̀̀ 80.97 crore to ECL in 2013-14 and 2014-15.
229 Month of evaluation of BHEL’s offer by WBPDCL.230 Month of agreement with BHEL in which ERV clause was introduced.231 Under the New Coal Distribution Policy issued by Ministry of Coal, Government of India
in October 2007.232 A Government of India Undertaking and a subsidiary of Coal India Limited.233 Kolaghat Thermal Power Station (KTPS), Bakreswar Thermal Power Station (BkTPS),
Sagardighi Thermal Power Station (SgTPS), Santaldih Thermal Power Station (STPS)and Bandel Thermal Power Station (BTPS).
234 Specified in Clause 3.1.1 of FSA-KTPS : 0.55 MMT, BkTPS : 1.00 MMT,SgTPS : 1.00 MMT, STPS : 0.40 MMT and BTPS : 1.2 MMT.
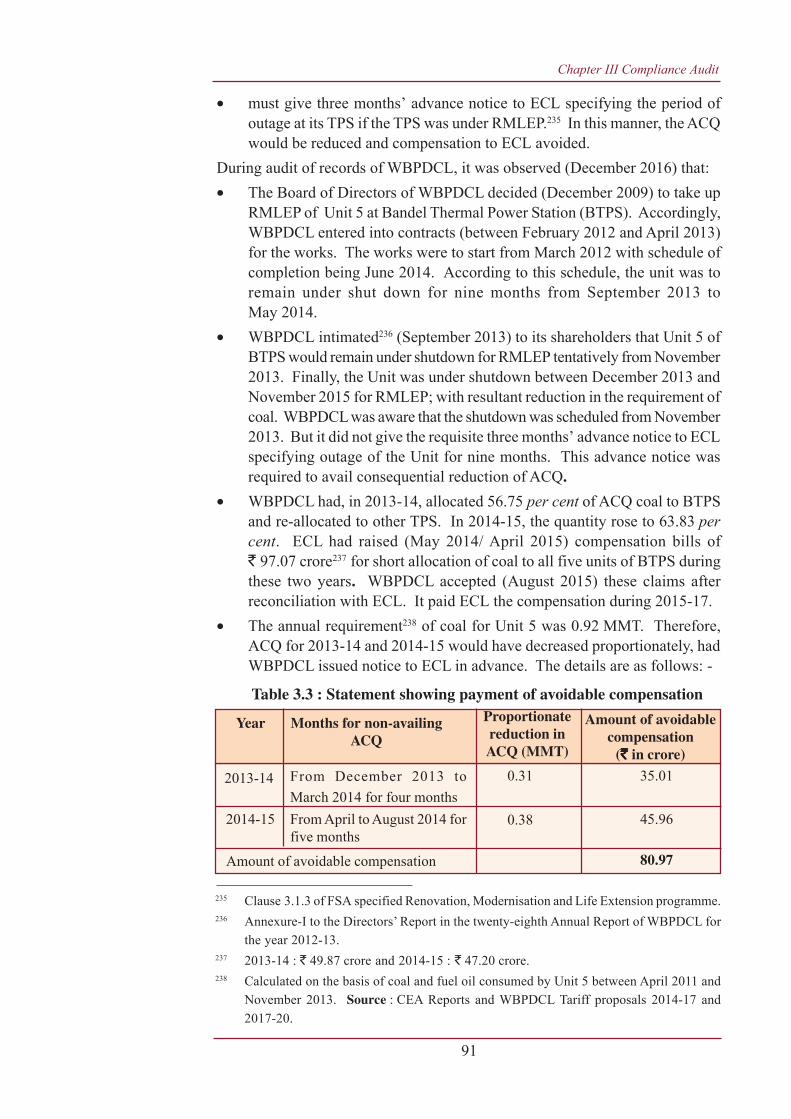
Chapter III Compliance Audit
91
• must give three months’ advance notice to ECL specifying the period ofoutage at its TPS if the TPS was under RMLEP.235 In this manner, the ACQwould be reduced and compensation to ECL avoided.
During audit of records of WBPDCL, it was observed (December 2016) that:• The Board of Directors of WBPDCL decided (December 2009) to take up
RMLEP of Unit 5 at Bandel Thermal Power Station (BTPS). Accordingly,WBPDCL entered into contracts (between February 2012 and April 2013)for the works. The works were to start from March 2012 with schedule ofcompletion being June 2014. According to this schedule, the unit was toremain under shut down for nine months from September 2013 toMay 2014.
• WBPDCL intimated236 (September 2013) to its shareholders that Unit 5 ofBTPS would remain under shutdown for RMLEP tentatively from November2013. Finally, the Unit was under shutdown between December 2013 andNovember 2015 for RMLEP; with resultant reduction in the requirement ofcoal. WBPDCL was aware that the shutdown was scheduled from November2013. But it did not give the requisite three months’ advance notice to ECLspecifying outage of the Unit for nine months. This advance notice wasrequired to avail consequential reduction of ACQ.
• WBPDCL had, in 2013-14, allocated 56.75 per cent of ACQ coal to BTPSand re-allocated to other TPS. In 2014-15, the quantity rose to 63.83 percent. ECL had raised (May 2014/ April 2015) compensation bills of` 97.07 crore237 for short allocation of coal to all five units of BTPS duringthese two years. WBPDCL accepted (August 2015) these claims afterreconciliation with ECL. It paid ECL the compensation during 2015-17.
• The annual requirement238 of coal for Unit 5 was 0.92 MMT. Therefore,ACQ for 2013-14 and 2014-15 would have decreased proportionately, hadWBPDCL issued notice to ECL in advance. The details are as follows: -
Table 3.3 : Statement showing payment of avoidable compensation
235 Clause 3.1.3 of FSA specified Renovation, Modernisation and Life Extension programme.236 Annexure-I to the Directors’ Report in the twenty-eighth Annual Report of WBPDCL for
the year 2012-13.237 2013-14 : ` 49.87 crore and 2014-15 : ` 47.20 crore.238 Calculated on the basis of coal and fuel oil consumed by Unit 5 between April 2011 and
November 2013. Source : CEA Reports and WBPDCL Tariff proposals 2014-17 and2017-20.
Year Months for non-availingACQ
Proportionatereduction inACQ (MMT)
Amount of avoidablecompensation
(`̀̀̀̀ in crore)
2013-14
2014-15
From December 2013 toMarch 2014 for four monthsFrom April to August 2014 forfive months
0.31
0.38
35.01
45.96
Amount of avoidable compensation 80.97
Audit Report (PSUs) for the year ended 31 March 2017
92
WBPDCL stated (June 2017) that under the FSA, ECL was entitled to regulateor suspend coal supply for non-payment of dues in time. The quantities soregulated or suspended would be treated as Deemed Delivery Quantity (DDQ)by ECL. WBPDCL had delayed payments against dues and ECL had exercisedthe option of regulating/ suspending supplies. Consequently, ECL had claimedcompensation based on DDQ.
The reply is not relevant to audit observation since WBPDCL had not respondedto the observation on failure to give timely notice. WBPDCL had failed to givethree months’ advance notice to ECL specifying the scheduled period of shutdownof Unit-5, BTPS. Consequently, the reduction in ACQ had not materialised. Thisled to avoidable payment of compensation of ` 80.97 crore to ECL.
This matter was brought to the notice of the Government (June 2017); reply isawaited (January 2018).
3.6 Additional expenditure on purchase of coal at higher rates
The Ministry of Power (MoP), Government of India fixed the targets each year(since May 2005), for the annual239 quantities of imported coal to be utilised byeach generating company. This was to meet shortages in the availability ofindigenous coal. In respect of West Bengal Power Development CorporationLimited (WBPDCL), the annual quantity of coal that had to be imported rangedfrom 0.36 Million Metric Tonnes (MMT) in 2005-06 to 1.5 MMT in 2012-13. Itwas reduced to one MMT for the year 2013-14.
(i) During the compliance audit at Head Office of WBPDCL, Audit observed(January 2017) the following:
• In August 2012, WBPDCL awarded a contract to M/s Adani EnterpriseLimited (AEL) for supply of 1.5 Million Metric Tonnes (MMT) ofimported non-coking Indonesian coal240. Supply was to be made at a rateof ̀ 5,439 per Metric Tonne241 (MT) for delivery by September 2013. Asper the contract, WBPDCL had the option to buy an additional quantityof 0.375 MMT upto March 2014, at same rate, if AEL’s performance wasfound satisfactory. This placement of order on AEL was approved for
West Bengal Power Development Corporation Limited purchased coalabove the prevailing market rates. As a result, it had incurred additionalexpenditure of `̀̀̀̀ 23.46 crore.
239 Amended every year keeping in mind requirements and availability of coal.240 Gross Calorific Value (GCV) of 5,400 – 5,600 kcal/kg.241 Rate is Free On Rail (F.O.R.) at Paradip and Haldia ports i.e. excluding cost of loading,
unloading and railway freight with Free On Board (F.O.B.) rate at originating port of` 4,656.60 per MT i.e. excluding shipping freight, insurance, import duties, local taxes etc.

Chapter III Compliance Audit
93
adoption by the Board of Directors (BoD) in September 2012. FromAugust 2012 to October 2013, WBPDCL received 1.5 MMT of importedcoal from AEL. It also had the option to buy additional quantities asspecified above.
• WBPDCL’s Contract, Purchase and Procurement Committee (CPPC)proposed (March 2013) to initiate a fresh tender for purchase of 1.5 MMTcoal in 2013-14 as the prices of Indonesian coal had plunged by 11 to23 per cent over the previous price. Accordingly, the BoD approved(March 2013) the proposal and sanctioned (September 2013) the purchaseof 1.5 to 2 MMT of imported coal, through open tender.
• Despite BoD’s recommendations for fresh tender, WBPDCL had extended(October 2013) the order on AEL for supply of an additional quantity of0.375 MMT, at the same rate. After receiving 0.322 MMT (October 2013to January 2014) of imported coal from AEL, WBPDCL terminated(February 2014) the contract due to supply of inferior242 quality of coal.
The BoD had decided to call for fresh tender to take advantage of the decliningprices. Yet, WBPDCL had extended the supply order. This led to an additionalexpenditure of ̀ 7.51 crore on purchase of 0.322 MMT of imported coal as givenin Annexure 12.
The Management stated (January 2018) that it was advised by the appropriatehigher authority that no further tender would be floated for procurement ofimported coal by WBPDCL. The reply was not acceptable as the BoD hadgranted approval for inviting fresh tender to procure imported coal. No proposalto change this order was brought before the BoD. In light of the facts, it was notclear as to which appropriate higher authority advised against the orders of BoD.
(ii) With regard to purchase of indigenous coal, Audit observed the following:
• BoD of WBPDCL approved (July 2013) procurement of indigenous non-coking coal243 from West Bengal Mineral Development and TradingCorporation Limited (WBMDTCL), a state PSU. The purchase wasapproved on the condition that the base price of coal procured fromWBMDTCL should be equal to the notified price of CIL/ ECL244 forequivalent grade of coal. WBPDCL entered (August 2013) into anagreement with WBMDTCL to purchase 0.35 MMT coal245 fromSeptember 2013 to March 2014 at the rate of ` 5,159.94 per MT. Later,WBPDCL extended (April 2014) the period till September 2014 asWBMDTCL could not complete the supply on time.
242 Wet and sticky coal as specified in termination letter no. WBPDCL/ DGM(FM)/ IMPORT-XIII/ 6526 dated 20 February 2014.
243 Trans-Damodar coal mined by Trans-Damodar Coal Mining Private Limited.244 Coal India Limited/ Eastern Coalfields Limited, both central public sector undertakings.245 Gross calorific value of 6,101 – 6,400 kcal/kg.
Audit Report (PSUs) for the year ended 31 March 2017
94
The contract was terminated (June 2014) due to disagreement upon sharingof under/ over-loading charges. Till June 2014, WBPDCL had purchased0.243 MMT from WBMDTCL.
• While submitting the proposal for BoD’s approval, WBPDCL hadcompared the rates of non-coking coal from WBMDTCL with the pricesof imported coal procured (August 2012 to January 2014) from AEL.However, it did not compare these with the prices246 of imported coalprevailing worldwide, which were in fact cheaper than the prevailingrates of indigenous coal.
Thus, despite being aware that the prices of imported coal had declined, WBPDCLwent in for procurement of indigenous coal. This led to additional expenditureof ` 15.95 crore on purchase of 0.243 MMT coal from WBMDTCL as given inAnnexure 12.
The Management stated (January 2018) that the landed cost of coal fromWBMDTCL was lower than the landed cost of imported coal.
The reply is not factual since the prevailing market price of imported coal in2013-14 was lower than the price of August 2012. Yet, WBPDCL had consideredthe prices of August 2012.
Thus, WBPDCL failed to reap the benefits of declining prices of imported coal,resulting in additional expenditure of ̀ 23.46 crore247 (Annexure 12). This alsoled to higher fuel cost, which was ultimately passed on to consumers by way ofhigher energy charges.
The matter was brought to the notice of the Government (June 2017); reply isawaited (January 2018).
WEST BENGAL STATE ELECTRICITY TRANSMISSION COMPANYLIMITED
3.7 Loss due to delay in recovery of interest free advances
West Bengal State Electricity Transmission Company Limited (WBSETCL) isthe state transmission utility. It awarded (April 2011 to March 2016)
246 ` 4,423.38 per metric tonne.247 ` 7.51 crore + ` 15.95 crore.
West Bengal State Electricity Transmission Company Limited hadawarded construction contracts for sub-stations and transmission lines.It had disbursed noninterest bearing advances of `̀̀̀̀ 195.36 crore to18 contractors. In violation of CVC guidelines, their recovery was noteffected in time-based manner, thereby resulting in loss of interest of`̀̀̀̀ 4.06 crore.
Chapter III Compliance Audit
95
106 contracts248 to 18 contractors for supply, erection, commissioning etc. of25 sub-stations and 20 transmission lines on turn- key basis.
The Central Vigilance Commission (CVC) had issued249 (April 2007) guidelinesstipulating that recovery of non-interest bearing advances should be time-basedand not linked with the progress of work.
Audit examined (November 2016) 58250 out of 106 contracts executed betweenJanuary 2012 and March 2016. It was observed that WBSETCL had grantednon-interest bearing advances aggregating to ` 121.28 crore251. These advanceswere disbursed from cash credit accounts of WBSETCL, which carried interestat rates ranging from 9.65 to 12.60 per cent per annum. Further, WBSETCL hadnot specified any time frame in the contracts for recovery of advances. Due toslow progress of works, WBSETCL could recover only ` 49.59 crore throughadjustment of running account bills. These recoveries were made after delays ofeight to 26 months beyond the scheduled dates of completion of the contracts.This resulted in loss of interest of ` 4.06 crore (at the rate of 9.65 per cent perannum) to WBSETCL. As in November 2017, the remaining amount of` 71.69 crore is still unadjusted and WBSETCL continued to bear interest on it.
The Management accepted (July 2017) the audit observation. It added (September2017) that WBSETCL’s Board of Directors (BoD) had amended (July 2017) theexisting policy and General Conditions of Contract in line with the CVCguidelines. However, the fact remains that an action taken earlier would havesaved WBSETCL from the loss of interest which arose due to delayed recoveryof advances.
Thus, due to disbursement of non-interest bearing advances by WBSETCL tocontractors, without providing for their time bound recovery, WBSETCL had toincur loss of interest of ` 4.06 crore252.
The matter was brought to the notice of the Government (June 2017); reply isawaited (January 2018).
248 Aggregate value : ` 2,792.82 crore (sub-stations : ` 915.80 crore, lines : ` 1,877.02 crore).249 Office Memorandum/ Circular No. 10/4/07.250 Aggregate value : ` 1,617.36 crore (sub-stations : ` 480.12 crore, lines : ` 1,137.24 crore).251 Sub-stations: ` 38.63 crore, lines: ` 82.65 crore.252 The payments were initially made from WBSETCL’s cash credit accounts and subsequently
recouped from Rural Electrification Corporation Limited through transfer of loans. Hence,loss has been calculated at the lowest rate of interest at 9.65 per cent per annum on cashcredit during this period.
Audit Report (PSUs) for the year ended 31 March 2017
96
WEST BENGAL STATE ELECTRICITY DISTRIBUTION COMPANYLIMITED
3.8 Loss of revenue due to short-billing and grant of unjustified exemption
West Bengal State Electricity Distribution Company Limited (WBSEDCL) is astate-owned electricity distribution company. The West Bengal ElectricityRegulatory Commission approves tariff orders annually. These tariff ordersspecify the rates at which electricity was to be charged by WBSEDCL fromdifferent categories of consumers. Prior to 2007-08, the power used by theconsumer for construction works used to be billed at rates as applicable forindustries. From 2007-08, separate tariff category for “construction power” wasintroduced. Further, Section 5 of Bengal Electricity Duty Act 1935 (Act) requiresthat WBSEDCL collect electricity duty from all consumers, except fromexempted253 consumers. Thereafter, WBSEDCL was to remit the electricity dutycollected to the Government of West Bengal (GoWB).
West Bengal Power Development Corporation Limited (WBPDCL), a powergenerating state public sector undertaking, applied (April 2011) to WBSEDCLfor reviving a dormant service connection. This service connection was effectedfrom September 2011. WBPDCL’s contractors, i.e. Bharat Heavy ElectricalsLimited (BHEL) and its associates utilised the power for construction of Unit 3and 4 of the Sagardighi Thermal Power Project (SgTPP), Stage-II.
It was observed (June 2017) during the audit of WBSEDCL that: -
• Specific tariff rates254 were applicable for the supply of power forconstruction works at SgTPP. Yet, during the period 2011-17, WBSEDCLhad raised electricity bills on WBPDCL for construction power at ratesapplicable to industries255. Since the rates levied were much lower thanthe rates actually applicable, this led to under-billing. The short-collectionof revenue was ` 1.73 crore (Annexure 13).
• WBPDCL was not in the list of entities exempted from payment ofelectricity duty. But, in the same period (2011-17), WBSEDCL hadwaived electricity duty realisable from WBPDCL for no recorded reasons.This exemption of electricity duty had led to loss of revenue of ` 2.78crore (Annexure 13).
253 The Second Schedule of the Bengal Electricity Duty Act 1935 exempts entities such asgovernment organisations, hospitals/ dispensaries, any licensee or private generator etc.from payment of electricity duty.
254 Ranging between ` 7.07 per kwh (kilowatt hour) and ` 7.20 per kwh.255 Ranging between ` 3.61 per kwh and ` 7.20 per kwh.
West Bengal State Electricity Distribution Company Limited incurred lossof revenue aggregating to ̀̀̀̀̀ 1.56 crore on supply of power due to applicationof incorrect tariff rates. It had also forgone revenue of `̀̀̀̀ 2.15 crore of theGovernment of West Bengal by allowing unjustified exemption fromelectricity duty.
Chapter III Compliance Audit
97
The Government accepted (December 2017) the audit observation. The tariffcode for WBPDCL had been changed with effect from July 2017. Moreover,WBSEDCL had claimed ̀ 0.87 crore256 (Annexure 13) from July 2015 to March2017 as arrears in the energy bill for September 2017. This amount had beenreceived by WBSEDCL by way of adjustment.Under the Electricity Act 2003, no claims shall be raised on any consumer beyondtwo years from the date, when such sum became first due. Therefore, the balancearrears of ` 3.71 crore in respect of the period prior to July 2015 had becometime-barred.Thus, WBSEDCL, (i) sustained loss of revenue aggregating to ` 1.56 crore dueto billing at rates below the applicable tariff; (ii) caused loss of revenue to GoWBaggregating to ` 2.15 crore by allowing unjustified exemption from electricityduty.
WEST BENGAL HIGHWAY DEVELOPMENT CORPORATIONLIMITED
3.9 Avoidable loss of revenue due to non-collection of toll charges
The Kolkata Metropolitan Development Authority (KMDA) had outsourced thecollection of toll charges on the Dumdum-Barrackpore Kalyani Expressway sinceNovember 1998 to private agencies. The Public Works Department (PWD),GoWB directed (February 2015) West Bengal Highway Development CorporationLimited (WBHDCL) to take over the expressway from KMDA with the objectiveof maintaining and upgrading it. KMDA decided (March 2015) to hand over theexpressway in phases. In the first phase, PWD took over (April 2015) possessionof a stretch of 39 km. PWD concurrently handed it over to WBHDCL. WBHDCLtook over (January 2016) the balance portion of the expressway, excluding thetoll collection infrastructure. The toll collection infrastructure remained underthe control of KMDA.During audit of transactions of WBHDCL for 2015-16, it was observed(March 2017): -• KMDA had entrusted (December 2012) the toll collection from the
expressway to SAE257, a private agency. KMDA was to receive` 8.19 crore258 over three years. According to the asset handing over/takingover report (April 2015), the collection agency was to remain under thecontrol of KMDA until 17 December 2015.
West Bengal Highway Development Corporation Limited (WBHDCL)sustained an avoidable loss of revenue of at least, `̀̀̀̀ 2.56 crore. This was dueto absence of proper planning for timely appointment of toll chargescollection agency for the Dumdum-Barrackpore-Kalyani Expressway.
256 This is the amount calculated by WBSEDCL by multiplying unit consumption and averagerate difference between construction power and Industrial (11 KV).
257 Sahakar Aakash Enterprise (SAE).258 In three yearly instalments of ` 2.52 crore (17 December 2012 to 16 December 2013),
` 2.70 crore (17 December 2013 to 16 December 2014) and ` 2.97 crore (17 December2014 to 16 December 2015).
Audit Report (PSUs) for the year ended 31 March 2017
98
• KMDA requested (7 January 2016) WBHDCL to take over toll collectionas the agreement with SAE was to expire on 26 January 2016. WBHDCLapproached (January 2016) KMDA to continue with collection of tollcharges for further six months. This was because the appointment of anagency would require time. Hence, KMDA and WBHDCL decided(25 January 2016) that the toll collection agency, SAE, would continue toremain under the control of KMDA until further orders.
• KMDA communicated (17 February 2016) that SAE had declined anyfurther extension to the agreement. SAE would discontinue collection oftoll charges from 19 February 2016. Despite this, WBHDCL reiterated(19 February 2016) that KMDA continue toll collection for the next fourmonths due to paucity of time for inviting fresh quotations.
• SAE stopped the collection of toll charges from 19 February 2016. Assuch, the expressway remained unattended and no toll charges werecollected.
• Meanwhile, WBHDCL had undertaken (August-September 2015) trafficsurvey on the expressway. Based on the existing toll charges, WBHDCLcould have earned an annual revenue of ` 3.55 crore. It decided (August2016) to initiate e-tendering for collection of toll charges on the expressway,after lapse of six months since cessation of collection of toll charges.
• WBHDCL did not receive any bids. Therefore, they re-tendered(September 2016) and received a single bid259 for ` 9.17 crore for oneyear. Based on the sole offer, WBHDCL issued (December 2016) a letterof award for an annual toll revenue of ` 9.17 crore on the sole bidder.Finally, that collection agency commenced collecting toll charges from30 December 2016.
WBHDCL failed to float and finalise the tender well in advance for the collectionof toll charges. This was despite being aware of timelines regarding expiry ofcontract. Thereby, such failure led to non-collection of toll charges on theexpressway between 19 February and 29 December 2016260. This non-collectionresulted in loss of revenue of, at least, ` 2.56 crore (Annexure 14).
Government admitted (August/ November 2017) to the loss of revenue due todelay. They ascribed it to observing proper procedural formalities in invitingtenders and selecting a collection agency. Moreover, the loss of revenue wasmade up through substantial higher toll revenue in subsequent period. However,Audit reiterated WBHDCL was aware that it would have to take over tollcollection on expiry of the contract (December 2015). Yet, WBHDCL had
259 Barjora Alert Co-operative Labour Contract and Construction Society Limited.260 For a period of 315 days.
Chapter III Compliance Audit
99
initiated action to appoint new collection agency only in August 2016. Besides,timely action would have led to earning of higher toll revenue since February2016 instead of December 2016.
Thus, WBHDCL’s failure to exercise requisite due diligence regarding collectionof toll charges led to avoidable loss of revenue of, at least, ` 2.56 crore.
CALCUTTA STATE TRANSPORT CORPORATION
3.10 Additional expenditure on procurement of buses due to non-compliance with contractual terms
Calcutta State Transport Corporation (CSTC) awarded (February 2014) a contractto Tata Motors Limited (TML) for the supply of 120 buses261. The contract pricewas ̀ 64.75 lakh per bus including excise duty262 at 12 per cent. The delivery ofall the 120 buses was to take place between May and November 2014 as per theagreement signed (March 2014) with TML. The agreement also provided forpayment of five per cent of contract value as mobilisation advance within 15 daysof issue of Purchase Order (PO), subject to submission of bank guarantee byTML. Further, the second mobilisation advance was to be paid by CSTC toTML within 15 days of approval of prototype buses to be supplied by TML. Thedelivery schedule commenced after disbursement of the second mobilisationadvance. According to the agreement263, TML was not entitled to any increase induties and levies after expiry of contracted delivery schedule. CSTC receivedthese 120 buses only between December 2014 and March 2016.
Audit observed (October 2016) during audit of transactions of CSTC at Belghoria(Main) for 2015-16, the following:
• According to CSTC’s records, it had received (December 2013 andFebruary 2014) ` 103.97 crore from the Transport Department for thepurchase of buses under the Jawaharlal Nehru National Urban RenewalMission (JnNURM) scheme. CSTC delayed release of the twomobilisation advances to TML despite having sufficient funds. Analysisshowed that the first mobilisation advance was required to be disbursed
261 Under the JnNURM scheme.262 Central Excise Notification 12/2012 dated 17 March 2012, effective from March 2012.263 Clause 24.2 of Request for Proposal (No. 002/80 dated 30 January 2014) that was part of
the agreement.
Calcutta State Transport Corporation had not complied with contractualprovisions. It had incurred additional expenditure of `̀̀̀̀ 1.92 crore byreimbursing to Tata Motors Limited excise duty at higher rate of 12 percent on 81 out of 120 buses.
Audit Report (PSUs) for the year ended 31 March 2017
100
by CSTC to TML by 25 March 2014 but only after receipt of bankguarantee. TML had submitted the bank guarantee for the first advanceon 02 April 2014, but CSTC paid the amount only on 05 May 2014.Similarly, in respect of the second mobilisation advance, CSTC hadapproved the prototype on 30 June 2014. Hence, advance was to be paidto TML by 15 July 2014. Although, CSTC had formally sanctionedpayment on 06 August 2014, after receiving the bank guarantee on 21 July2014. The advance was paid to TML on 10 December 2014. Theadvances were belatedly released in May and December 2014 i.e., afterdelays of two and five months respectively. As such, the contractualdelivery schedule, which was staggered, got pushed back. Hence,112 buses were actually delivered only between December 2014 and April2015, with the remaining eight buses arriving only in December 2015 toMarch 2016. The reasons for delays in release of the mobilisationadvances were not on record nor made available, though called for inAudit.
• The Department of Revenue, Ministry of Finance, Government of Indiahad reduced the rate of excise duty264. Therefore, for the period between17 February and 31 December 2014, excise duty had dipped from 12 toeight per cent. Consequently, the price of each bus had reduced by` 2.37 lakh. Yet, the agreement (04 March 2014) and purchase order(10 March 2014) between CSTC and TML had included excise duty of12 per cent instead of eight per cent.
• Between March 2015 and May 2015, CSTC had reimbursed excise dutyat eight per cent265 on 39 buses despatched by TML till December 2014.This was in line with the prevailing rates of excise duty. CSTC reimbursedexcise duty at 12 per cent266 on 81 buses delivered after December 2014.It was noticed that delayed payment of mobilisation advance had pushedback the delivery dates. Consequently, payment of excise duty was at12 per cent of the cost of the buses, instead of eight per cent. This led toadditional expenditure of ` 1.92 crore towards higher excise duty(Annexure 15) on 81 out of 120 buses.
The Management replied (July 2017) that the agreement provided for paymentof excise duty at 12.125 per cent. Consequently, CSTC had not imposedadditional financial burden on the Government Exchequer by reimbursing TMLat the higher rate of excise duty prevailing at the time of supply of 81 buses.
264 Central Excise Notifications 04/2014 and 06/2014 dated 17 February 2014 and 25 June2014 respectively, read with D.O.F. No.334/3/2014-TRU dated 17 February 2014.
265 ` 4.21 lakh per bus.266 ` 6.28 lakh per bus.
Chapter III Compliance Audit
101
Moreover, the amount paid as excise duty had been deposited by TML to theGovernment Exchequer. Besides, payments were released to TML after approvalfrom the Government and release of fund by it.
The reply of Management is not correct since the agreement envisaged that exciseduty was payable at the prevailing rates. The rate applicable was eight per centfor deliveries within the scheduled delivery period. Moreover, Government ofWest Bengal had provided sufficient fund to CSTC for the procurement of thesebuses under JnNURM.
Thus, CSTC’s failure to release mobilisation advance to TML within the timeprescribed in the contract, led to delivery of all buses beyond the delivery schedule.It had, thereby, incurred additional expenditure of ` 1.92 crore towards exciseduty on 81 buses at higher rate of 12 per cent.
This matter was brought to the notice of the Government (June 2017); reply isawaited (January 2018).
3.11 Undue favour extended to advertising agencies in deviation ofcontractual terms
Calcutta State Transport Corporation (CSTC), a state transport undertaking, wasestablished in 1960. It was entrusted with the development of road transport inthe areas comprising Calcutta and its adjacent districts.
CSTC wanted to increase revenue and reduce the subsidy burden on the State.So, it entered (August/ September 2014) into agreements for three years withtwo advertising agencies267, viz. SIPL and OADPL. The agreements were fordisplay of advertisements on 68 air-conditioned (AC) buses268 operated by CSTC.These agreements, inter alia, provided that:
• Agencies were to pay CSTC monthly license fees 15 days in advance forthe next month. The fees amounted ̀ 47,000 per bus per month from thedates of allotment of buses up to July/ August 2017.
• CSTC would grant rebate on payment of license fees only on those allottedbuses that remained out of service, for repair and/or for other reasons, inexcess of three days at a stretch.
• CSTC could either terminate the agreement or recover interest at 18 per centfor the period of delay, if the agencies remitted license fees belatedly.
267 M/s Signpost India Private Limited (SIPL) and M/s One AD Display Private Limited(OADPL).
268 To SIPL: 55 ‘Volvo’ buses; OADPL: Six ‘Volvo’ and seven ‘Ashok Leyland’ buses.
Calcutta State Transport Corporation had allowed reduction in license fees,rebate on license fees and not claimed interest on delayed payments fromtwo advertising agencies. This was in deviation from contractual provisions.Consequently, it was deprived of revenue of `̀̀̀̀ 1.31 crore.
Audit Report (PSUs) for the year ended 31 March 2017
102
• The advertisements would be displayed, among other areas, on the exteriorsurface of selected portion of glass panel and body surface by pastingvinyl film.
• CSTC would obtain bank guarantees as security deposit from both theagencies to be kept till expiry or revocation of the agreements.
SIPL prematurely closed (June 2016) the agreement on the pretext of reductionin advertising area by CSTC to comply with a Public Interest Litigation (PIL)filed in the Hon’ble High Court, Kolkata (September 2015). Further, CSTC didnot raise bills on OADPL beyond June 2016. Ultimately, in June 2016, CSTCfloated fresh notice inviting tender for advertisement on bus bodies.
During inspection of records at Belghoria (Main) office of CSTC for the period2015-16, Audit observed (October 2016) the following: -
• SIPL claimed (November 2015/ February 2016) that it was given lesserspace than that envisaged in the agreement for advertisement.Consequently, it sought proportionate reduction in the rate269 of monthlylicence fees to ` 43,540 per bus per month from inception. CSTCaccepted (March 2016) SIPL’s claim and reduced the aggregate billedamount by ` 40.34 lakh. In this context, the Hon’ble Supreme Court ofIndia had directed270 (April 2012) compliance with the provisions ofrule 100 of the Central Motor Vehicle Rules, 1989. Therefore, use ofblack film or any other materials upon safety glasses, front/ rearwindscreens and side glasses was prohibited. As such, this reduction wasnot admissible, as that space was never available for advertisement. Thededuction allowed by CSTC was also not justified since, in the agreement,CSTC had not specified the area per bus that would be available foradvertising. Hence, the question of increase/ decrease in advertising areadoes not arise.
• CSTC had claimed net license fees of ` 5.57 crore271 from September2014 to June 2016, after granting rebate of ̀ 1.46 crore272. CSTC allowedthis rebate for 9,844 days, i.e., for the total number of days, buses hadremained out of service. However, this rebate should have only beenallowed for only those 4,941 days when these buses had remained out ofservice for more than three days at a stretch. CSTC allowed rebate forall the days even when buses were out of service for one or two daysonly. Excess allowance of rebate due to excess calculation of non-operational days amounted to ̀ 0.65 crore273 as depicted in Annexure 16.
269 Advertisement area envisaged by SIPL: 326 sft per bus, rate: ` 47,000 per bus per month;actual advertisement area: 302 sft per bus, proportionate rate: ` 43,540 per bus per month.
270 Writ Petition (Civil) No. 265 of 2011, Avishek Goenka vs. Union of India and others.271 SIPL: ` 4.52 crore and OADPL: ` 1.05 crore.272 SIPL: ` 1.03 crore and OADPL: ` 0.43 crore.273 SIPL: ` 44.80 lakh and OADPL: ` 19.89 lakh.
Chapter III Compliance Audit
103
• Both the agencies in contravention to the terms of agreements, did notpay license fees 15 days in advance to CSTC for the subsequent month.CSTC received payments after delays of six to 360 days from SIPL andfive to 271 days from OADPL. CSTC had not claimed interest of` 0.26 crore274 as provided in the agreement on that belated payments.
• The agreements specified that CSTC should obtain security deposit validfor the contractual period of three years. However, both agencies hadsubmitted four bank guarantees275 valid for only one year and had notextended them thereafter. As a result, CSTC held no security deposit forrealisation of dues. At the end of May 2017, ` 0.82 crore was still duefrom SIPL and ` 0.13 crore from OADPL. Interest would continue toaccrue on the outstanding amount till their final realisation.
The Management accepted the audit observation and stated (July 2017) thatinvoices had been raised on SIPL and OADPL towards amounts of loss arisingfrom inadmissible rebates and interest on belated payments by both the agencies.
Thus, CSTC’s failure to follow contractual provisions resulted in it being deprivedof license fees aggregating to ` 1.31 crore.276
These matters were brought to the notice of the Government in June 2017, replyis awaited (January 2018).
SOUTH BENGAL STATE TRANSPORT CORPORATION
3.12 Loss due to inadmissible discount on route sale of tickets
The Government of West Bengal (GoWB) is empowered277 to issue directions tothe State and Regional Transport Authorities regarding setting fares for stagecarriages278. The Committee on Public Undertakings (COPU) in 2006-07recommended279 that once the fare chart/ table was issued, it should be
274 Interest calculated for the period from September 2014 to May 2017.275 SIPL : ` 51.70 lakh expiring in August 2015, OADPL : ` 13.16 lakh expiring between
September 2015 to March 2016.276 Inadmissible reduction in license fees : ` 0.40 crore, ineligible rebate on license
fees : ` 0.65 crore and interest on delayed of license fees : ` 0.26 crore.277 Under Section 67 of the Motor Vehicles Act, 1988.278 Motor vehicles constructed or adapted to carry more than six passengers excluding the
driver for hire or reward at separate fares paid by or for individual passengers, either forthe whole journey or for stages of the journey.
279 In 114 COPU Report, presented to the West Bengal Legislative Assembly on 9 July 2010.
South Bengal State Transport Corporation allowed discount on route salesof tickets. This was in deviation of fares statutorily fixed by the Governmentof West Bengal and directions issued to implement those fares. Therefore,it sustained a loss of `̀̀̀̀ 80.26 lakh.
Audit Report (PSUs) for the year ended 31 March 2017
104
immediately implemented. Accordingly, GoWB had directed (September 2011)all STUs to implement fares fixed by it. It laid down280 (August/ September2014) the fares for stage carriages operated by the five281 State TransportUndertakings (STUs) and private operators with effect from September 2014.Out of the five STUs, one STU, viz. South Bengal State Transport Corporation(SBSTC), operates 12 depots282. SBSTC had incurred total losses of` 209.70 crore from 2011-12 to 2015-16.
Audit inspected (January 2016/ February 2017) the transactions of SBSTC for2014-15 and 2015-16 at its Head office and depots. SBSTC bought (October/November 2014) 350 hand-held Electronic Ticket Vending Machines (ETVMs).The objectives was arresting leakage of revenue and keeping records of journey283
details.
Audit observed the following from the data generated by the ETVMs (January2015 to January 2017) that: -
• GoWB’s directions (August/ September 2014) did not provide for anydiscount on fares. Between January 2015 to January 2017, SBSTC had, however,allowed a discount of ` 80.26 lakh on route sales284 of tickets. This was incontravention of GoWB’s direction (August 2014) to all STUs to implement thefares fixed by it and the statutory provisions regarding fixing of fares by GoWB.
• No record seeking approval of GoWB or SBSTC’s Board of Directors(BoD) for allowing this discount was available. There was also no document onrecord to indicate the level at which the decision was taken to introduce thediscount.
• On being pointed out by Audit, SBSTC rolled back (April 2017) thisinadmissible discount on route sales of tickets from 1 May 2017. Thereafter,the BoD also decided (June 2017) that no discount would be allowed on sales oftickets, in future.
SBSTC replied (September 2017) that to compete with private transport operatorsoffering lower fares, it was compelled to offer discounts. The conductors of
280 Notification 3524-WT/3M-47/2008 of 26 August 2014 and Notification 3903-WT/3M-47/ 2008 of 16 September 2014.
281 Calcutta State Transport Corporation, South Bengal State Transport Corporation, NorthBengal State Transport Corporation, West Bengal Transport Corporation Limited andWest Bengal Surface Transport Corporation Limited.
282 Durgapur Division: Durgapur, Bankura, Kalna, Purulia, Burdwan, Asansol and Arambag;Belghoria Division: Digha, Midnapore, Belghoria, Haldia and Howrah.
283 Including time and date of issuing ticket(s) to passenger(s).284 Sale of tickets by conductors on the buses during their journeys.

Chapter III Compliance Audit
105
SBSTC faced problems in refunding the balance amount during collection ofactual fares. Therefore, even after introduction of ETVMs, discounts weremaintained. However, discounts were already discontinued from 1 May 2017,following the Managing Director’s order dated 24 April 2017.
The reply is not tenable as the directions of Government with regard to bus fareswere applicable throughout the State. Further, if shortage of coins was a reasonfor discounts, SBSTC had not sought approval from Government or BoD beforeintroduction of the discount.
Thus, SBSTC had contravened the mandate and directions of GoWB on thefares. It had allowed inadmissible discount on route sale of tickets resulting in aloss of revenue of ` 80.26 lakh. The Government may review the matter andtake necessary action to fix responsibility for this loss.
The matter was brought to the notice of Government (June 2017); reply is awaited
(January 2018).
(NAMEETA PRASAD)Accountant General
(Economic & Revenue Sector Audit)West Bengal
Countersigned
(RAJIV MEHRISHI)Comptroller and Auditor General of India
KOLKATAThe 07 May 2018
NEW DELHI The May 2018


ANNEXURES

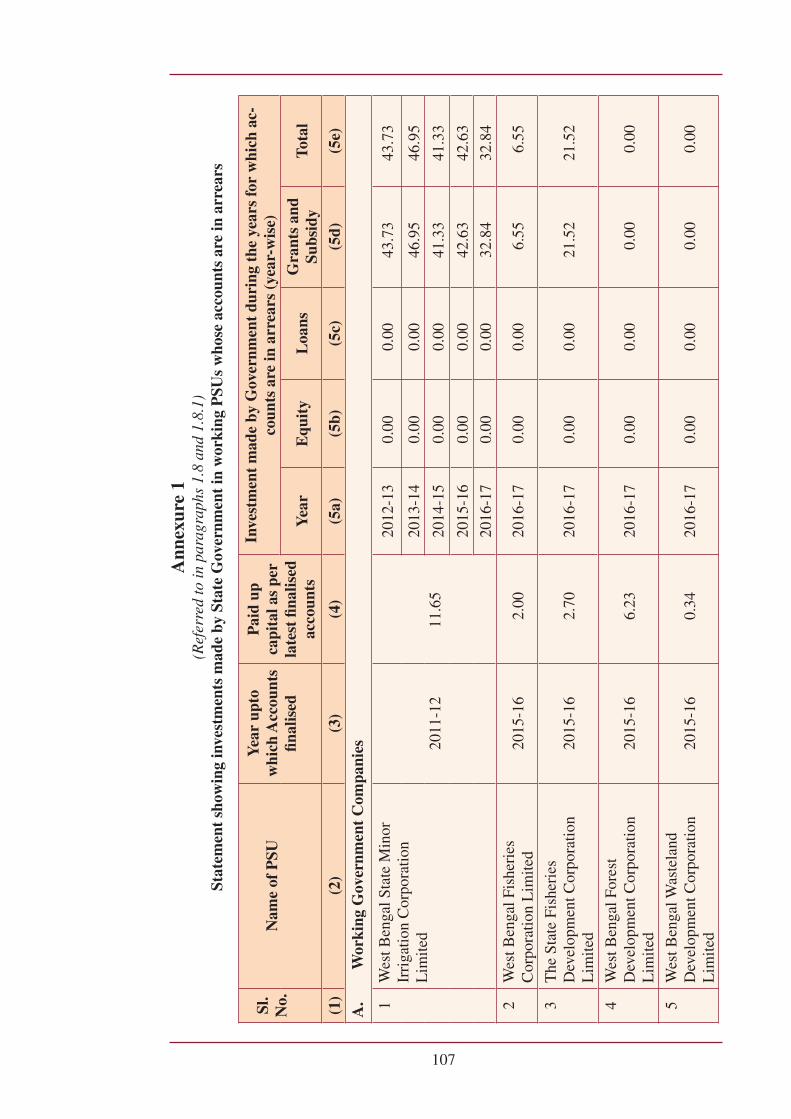
Ann
exur
e 1
(Ref
erre
d to
in p
arag
raph
s 1.
8 an
d 1.
8.1)
Stat
emen
t sh
owin
g in
vest
men
ts m
ade
by S
tate
Gov
ernm
ent
in w
orki
ng P
SUs
who
se a
ccou
nts
are
in a
rrea
rs
Sl.
No.
Nam
e of
PSU
Yea
r up
to
whi
ch A
ccou
nts
fi nal
ised
Pai
d up
ca
pita
l as
per
late
st fi
nalis
ed
acco
unts
Inve
stm
ent
mad
e by
Gov
ernm
ent
duri
ng t
he y
ears
for
whi
ch a
c-co
unts
are
in a
rrea
rs (
year
-wis
e)
Yea
rE
quit
yL
oans
Gra
nts
and
Subs
idy
Tota
l
(1)
(2)
(3)
(4)
(5a)
(5b)
(5c)
(5d)
(5e)
A.
Wor
king
Gov
ernm
ent
Com
pani
es
1W
est B
enga
l Sta
te M
inor
Ir
riga
tion
Cor
pora
tion
Lim
ited
2011
-12
11.6
5
2012
-13
0.00
0.00
43.7
343
.73
2013
-14
0.00
0.00
46.9
546
.95
2014
-15
0.00
0.00
41.3
341
.33
2015
-16
0.00
0.00
42.6
342
.63
2016
-17
0.00
0.00
32.8
432
.84
2W
est B
enga
l Fis
heri
es
Cor
pora
tion
Lim
ited
2015
-16
2.00
2016
-17
0.00
0.00
6.55
6.55
3T
he S
tate
Fis
heri
es
Dev
elop
men
t Cor
pora
tion
Lim
ited
2015
-16
2.70
2016
-17
0.00
0.00
21.5
221
.52
4W
est B
enga
l For
est
Dev
elop
men
t Cor
pora
tion
Lim
ited
2015
-16
6.23
2016
-17
0.00
0.00
0.00
0.00
5W
est B
enga
l Was
tela
nd
Dev
elop
men
t Cor
pora
tion
Lim
ited
2015
-16
0.34
2016
-17
0.00
0.00
0.00
0.00
107
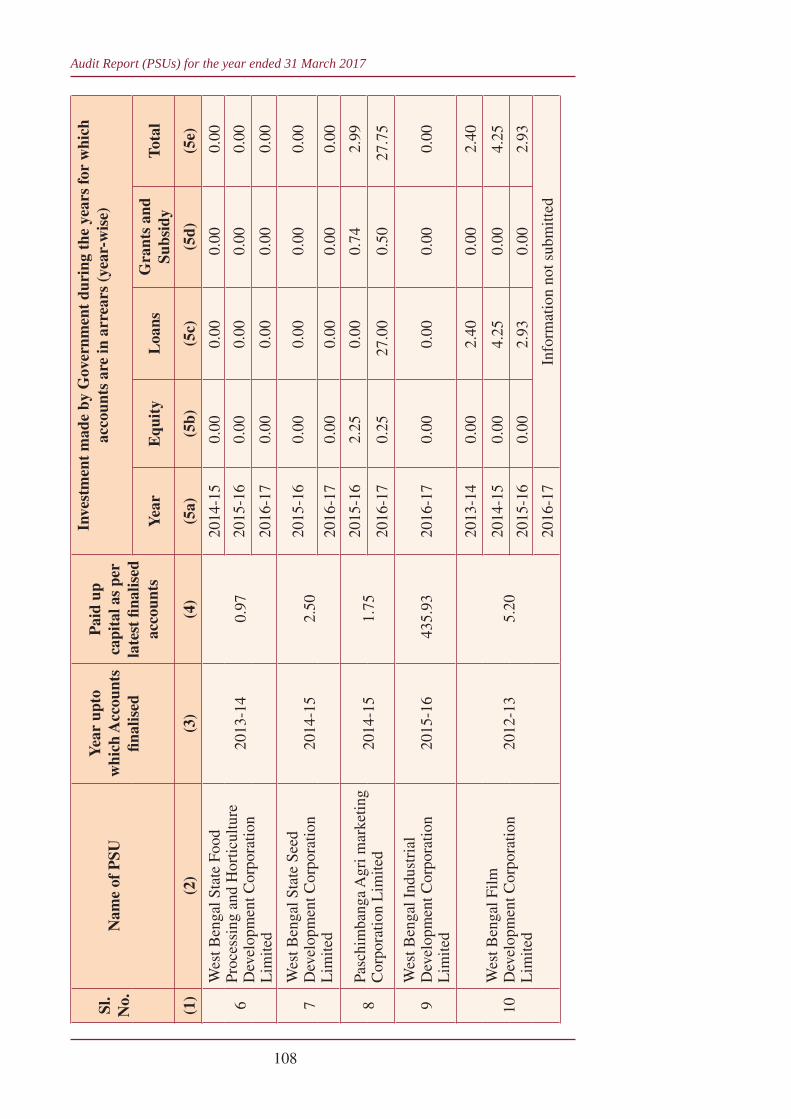
Sl.
No.
Nam
e of
PSU
Yea
r up
to
whi
ch A
ccou
nts
fi nal
ised
Pai
d up
ca
pita
l as
per
late
st fi
nalis
ed
acco
unts
Inve
stm
ent
mad
e by
Gov
ernm
ent
duri
ng t
he y
ears
for
whi
ch
acco
unts
are
in a
rrea
rs (
year
-wis
e)
Yea
rE
quit
yL
oans
Gra
nts
and
Subs
idy
Tota
l
(1)
(2)
(3)
(4)
(5a)
(5b)
(5c)
(5d)
(5e)
Audit Report (PSUs) for the year ended 31 March 2017
108
6
Wes
t Ben
gal S
tate
Foo
d Pr
oces
sing
and
Hor
ticul
ture
D
evel
opm
ent C
orpo
ratio
n L
imite
d
2013
-14
0.97
2014
-15
0.00
0.00
0.00
0.00
2015
-16
0.00
0.00
0.00
0.00
2016
-17
0.00
0.00
0.00
0.00
7W
est B
enga
l Sta
te S
eed
Dev
elop
men
t Cor
pora
tion
Lim
ited
2014
-15
2.50
2015
-16
0.00
0.00
0.00
0.00
2016
-17
0.00
0.00
0.00
0.00
8Pa
schi
mba
nga
Agr
i mar
ketin
g C
orpo
ratio
n L
imite
d20
14-1
51.
7520
15-1
62.
250.
000.
742.
99
2016
-17
0.25
27.0
00.
5027
.75
9W
est B
enga
l Ind
ustr
ial
Dev
elop
men
t Cor
pora
tion
Lim
ited
2015
-16
435.
9320
16-1
70.
000.
000.
000.
00
10W
est B
enga
l Film
D
evel
opm
ent C
orpo
ratio
n L
imite
d20
12-1
35.
20
2013
-14
0.00
2.40
0.00
2.40
2014
-15
0.00
4.25
0.00
4.25
2015
-16
0.00
2.93
0.00
2.93
2016
-17
Info
rmat
ion
not s
ubm
itted
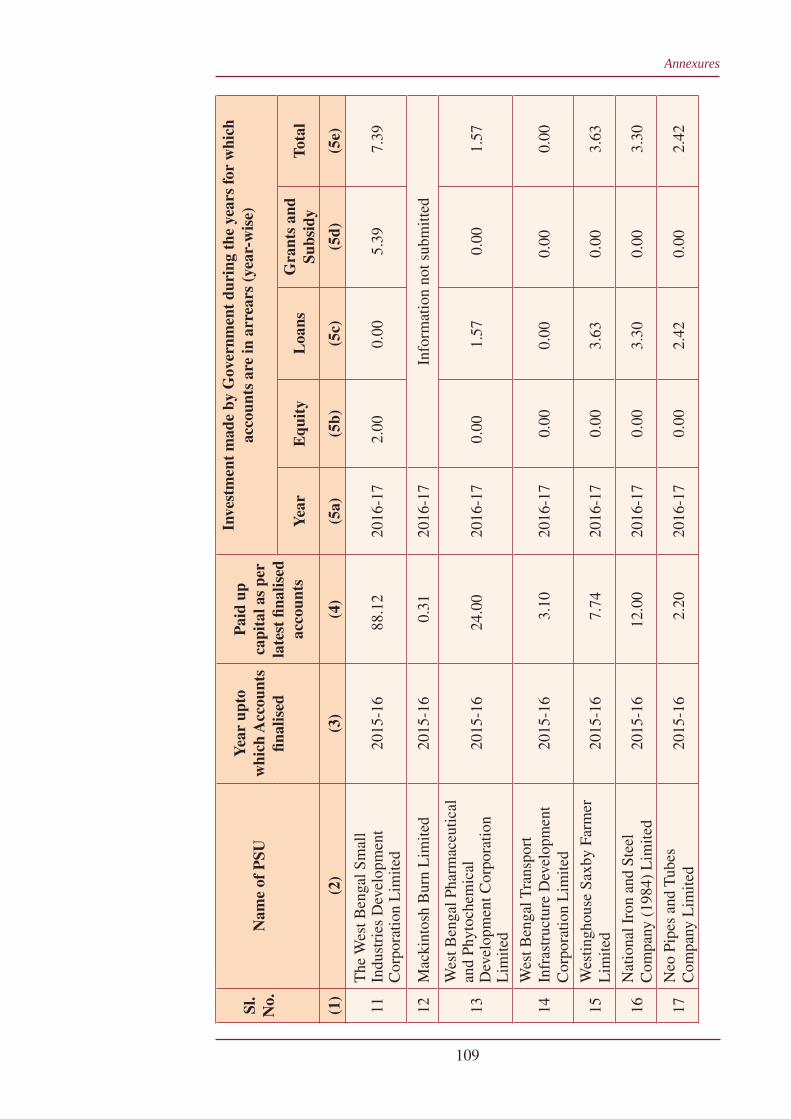
Annexures
109
Sl.
No.
Nam
e of
PSU
Yea
r up
to
whi
ch A
ccou
nts
fi nal
ised
Pai
d up
ca
pita
l as
per
late
st fi
nalis
ed
acco
unts
Inve
stm
ent
mad
e by
Gov
ernm
ent
duri
ng t
he y
ears
for
whi
ch
acco
unts
are
in a
rrea
rs (
year
-wis
e)
Yea
rE
quit
yL
oans
Gra
nts
and
Subs
idy
Tota
l
(1)
(2)
(3)
(4)
(5a)
(5b)
(5c)
(5d)
(5e)
11T
he W
est B
enga
l Sm
all
Indu
stri
es D
evel
opm
ent
Cor
pora
tion
Lim
ited
2015
-16
88.1
220
16-1
72.
000.
005.
397.
39
12M
acki
ntos
h B
urn
Lim
ited
2015
-16
0.31
2016
-17
Info
rmat
ion
not s
ubm
itted
13
Wes
t Ben
gal P
harm
aceu
tical
an
d Ph
ytoc
hem
ical
D
evel
opm
ent C
orpo
ratio
n L
imite
d
2015
-16
24.0
020
16-1
70.
001.
570.
001.
57
14W
est B
enga
l Tra
nspo
rt
Infr
astr
uctu
re D
evel
opm
ent
Cor
pora
tion
Lim
ited
2015
-16
3.10
2016
-17
0.00
0.00
0.00
0.00
15W
estin
ghou
se S
axby
Far
mer
L
imite
d20
15-1
67.
7420
16-1
70.
003.
630.
003.
63
16N
atio
nal I
ron
and
Stee
l C
ompa
ny (
1984
) L
imite
d20
15-1
612
.00
2016
-17
0.00
3.30
0.00
3.30
17N
eo P
ipes
and
Tub
es
Com
pany
Lim
ited
2015
-16
2.20
2016
-17
0.00
2.42
0.00
2.42
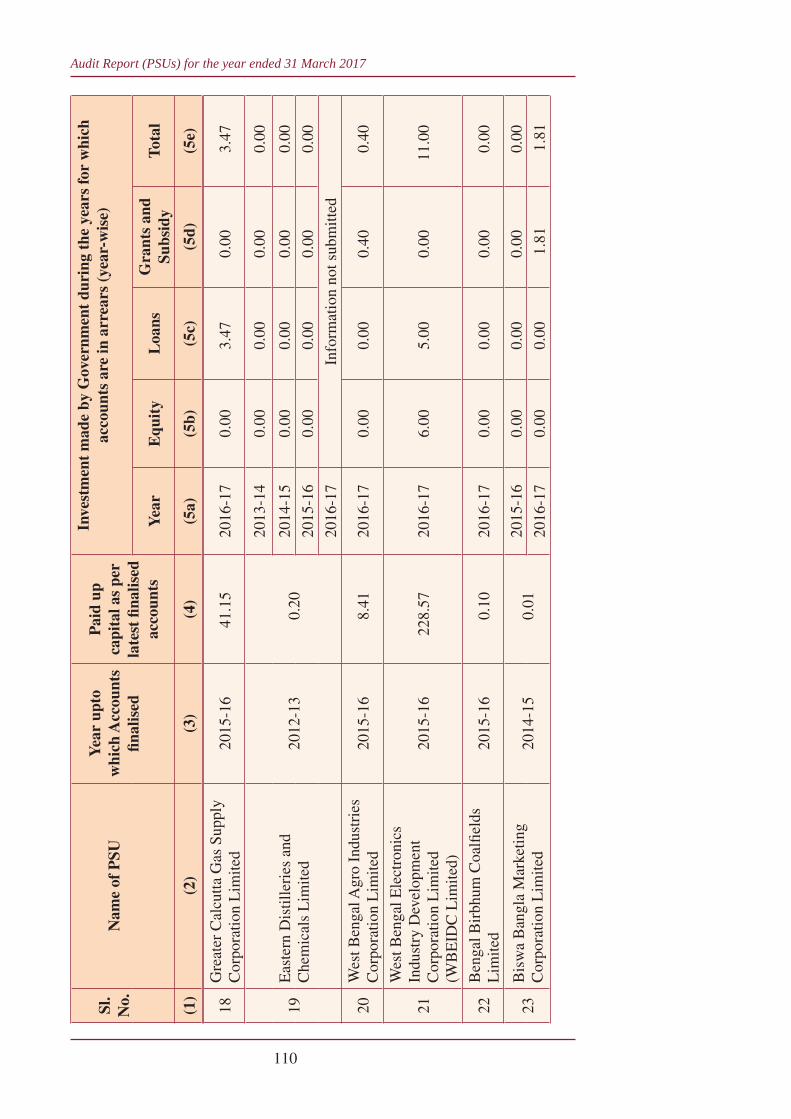
Sl.
No.
Nam
e of
PSU
Yea
r up
to
whi
ch A
ccou
nts
fi nal
ised
Pai
d up
ca
pita
l as
per
late
st fi
nalis
ed
acco
unts
Inve
stm
ent
mad
e by
Gov
ernm
ent
duri
ng t
he y
ears
for
whi
ch
acco
unts
are
in a
rrea
rs (
year
-wis
e)
Yea
rE
quit
yL
oans
Gra
nts
and
Subs
idy
Tota
l
(1)
(2)
(3)
(4)
(5a)
(5b)
(5c)
(5d)
(5e)
Audit Report (PSUs) for the year ended 31 March 2017
110
18G
reat
er C
alcu
tta G
as S
uppl
y C
orpo
ratio
n L
imite
d20
15-1
641
.15
2016
-17
0.00
3.47
0.00
3.47
19E
aste
rn D
istil
leri
es a
nd
Che
mic
als
Lim
ited
2012
-13
0.20
2013
-14
0.00
0.00
0.00
0.00
2014
-15
0.00
0.00
0.00
0.00
2015
-16
0.00
0.00
0.00
0.00
2016
-17
Info
rmat
ion
not s
ubm
itted
20W
est B
enga
l Agr
o In
dust
ries
C
orpo
ratio
n L
imite
d20
15-1
68.
4120
16-1
70.
000.
000.
400.
40
21
Wes
t Ben
gal E
lect
roni
cs
Indu
stry
Dev
elop
men
t C
orpo
ratio
n L
imite
d (W
BE
IDC
Lim
ited)
2015
-16
228.
5720
16-1
76.
005.
000.
0011
.00
22B
enga
l Bir
bhum
Coa
lfi el
ds
Lim
ited
2015
-16
0.10
2016
-17
0.00
0.00
0.00
0.00
23B
isw
a B
angl
a M
arke
ting
Cor
pora
tion
Lim
ited
2014
-15
0.01
2015
-16
0.00
0.00
0.00
0.00
2016
-17
0.00
0.00
1.81
1.81
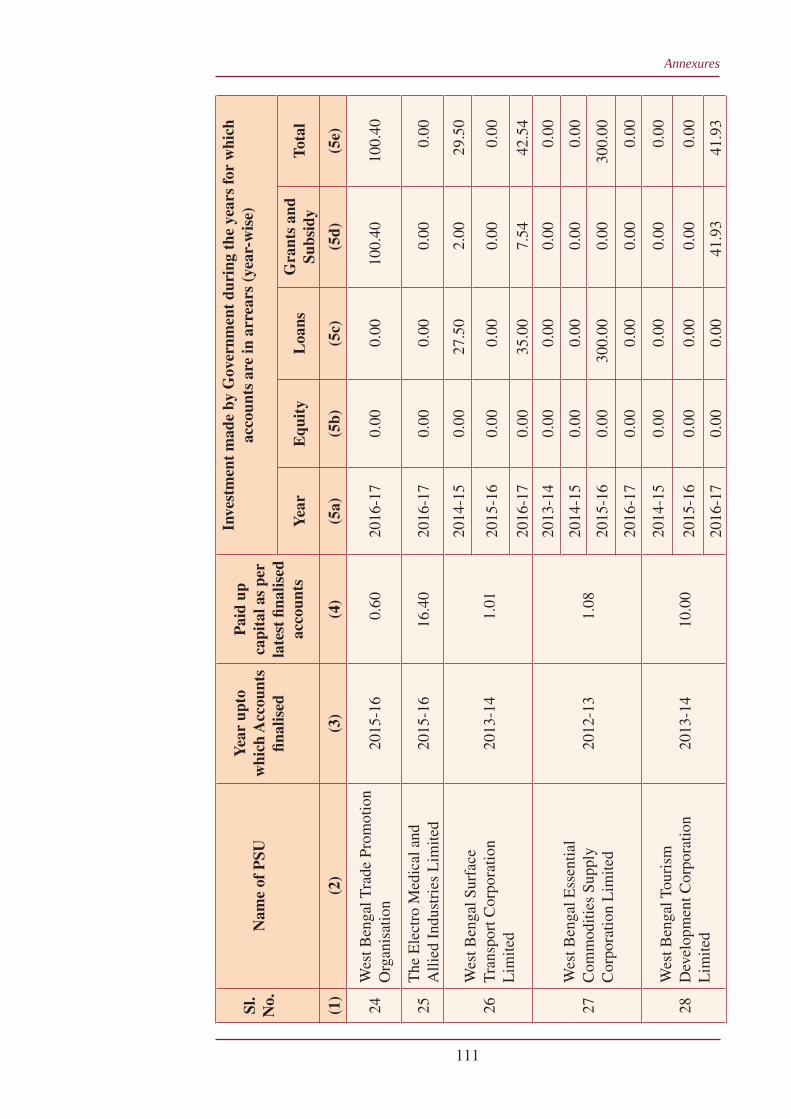
Annexures
111
Sl.
No.
Nam
e of
PSU
Yea
r up
to
whi
ch A
ccou
nts
fi nal
ised
Pai
d up
ca
pita
l as
per
late
st fi
nalis
ed
acco
unts
Inve
stm
ent
mad
e by
Gov
ernm
ent
duri
ng t
he y
ears
for
whi
ch
acco
unts
are
in a
rrea
rs (
year
-wis
e)
Yea
rE
quit
yL
oans
Gra
nts
and
Subs
idy
Tota
l
(1)
(2)
(3)
(4)
(5a)
(5b)
(5c)
(5d)
(5e)
24W
est B
enga
l Tra
de P
rom
otio
n O
rgan
isat
ion
2015
-16
0.60
2016
-17
0.00
0.00
100.
4010
0.40
25T
he E
lect
ro M
edic
al a
nd
Alli
ed I
ndus
trie
s L
imite
d20
15-1
616
.40
2016
-17
0.00
0.00
0.00
0.00
26W
est B
enga
l Sur
face
T
rans
port
Cor
pora
tion
Lim
ited
2013
-14
1.01
2014
-15
0.00
27.5
02.
0029
.50
2015
-16
0.00
0.00
0.00
0.00
2016
-17
0.00
35.0
07.
5442
.54
27W
est B
enga
l Ess
entia
l C
omm
oditi
es S
uppl
y C
orpo
ratio
n L
imite
d20
12-1
31.
08
2013
-14
0.00
0.00
0.00
0.00
2014
-15
0.00
0.00
0.00
0.00
2015
-16
0.00
300.
000.
0030
0.00
2016
-17
0.00
0.00
0.00
0.00
28W
est B
enga
l Tou
rism
D
evel
opm
ent C
orpo
ratio
n L
imite
d20
13-1
410
.00
2014
-15
0.00
0.00
0.00
0.00
2015
-16
0.00
0.00
0.00
0.00
2016
-17
0.00
0.00
41.9
341
.93
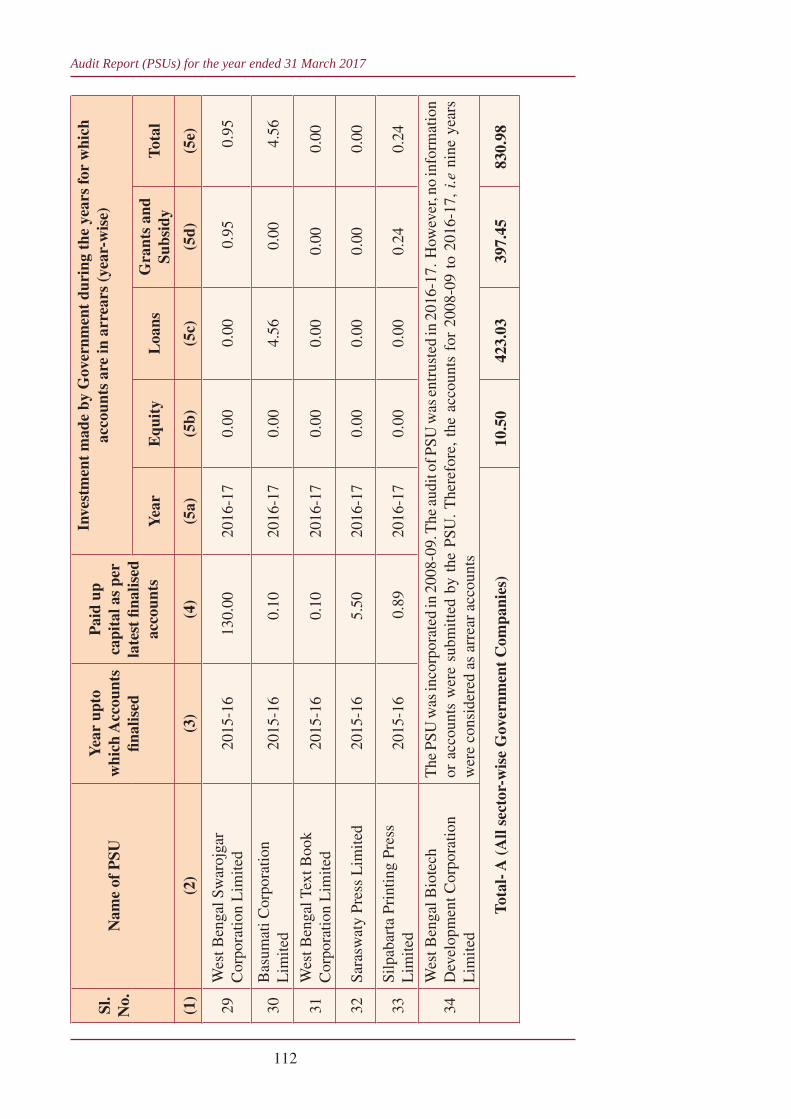
Sl.
No.
Nam
e of
PSU
Yea
r up
to
whi
ch A
ccou
nts
fi nal
ised
Pai
d up
ca
pita
l as
per
late
st fi
nalis
ed
acco
unts
Inve
stm
ent
mad
e by
Gov
ernm
ent
duri
ng t
he y
ears
for
whi
ch
acco
unts
are
in a
rrea
rs (
year
-wis
e)
Yea
rE
quit
yL
oans
Gra
nts
and
Subs
idy
Tota
l
(1)
(2)
(3)
(4)
(5a)
(5b)
(5c)
(5d)
(5e)
Audit Report (PSUs) for the year ended 31 March 2017
112
29W
est B
enga
l Sw
aroj
gar
Cor
pora
tion
Lim
ited
2015
-16
130.
0020
16-1
70.
000.
000.
950.
95
30B
asum
ati C
orpo
ratio
n L
imite
d20
15-1
60.
1020
16-1
70.
004.
560.
004.
56
31W
est B
enga
l Tex
t Boo
k C
orpo
ratio
n L
imite
d20
15-1
60.
1020
16-1
70.
000.
000.
000.
00
32Sa
rasw
aty
Pres
s L
imite
d20
15-1
65.
5020
16-1
70.
000.
000.
000.
00
33Si
lpab
arta
Pri
ntin
g Pr
ess
Lim
ited
2015
-16
0.89
2016
-17
0.00
0.00
0.24
0.24
34W
est B
enga
l Bio
tech
D
evel
opm
ent C
orpo
ratio
n L
imite
d
The
PSU
was
inco
rpor
ated
in 2
008-
09. T
he a
udit
of P
SU w
as e
ntru
sted
in 2
016-
17.
How
ever
, no
info
rmat
ion
or a
ccou
nts
wer
e su
bmitt
ed b
y th
e PS
U.
The
refo
re,
the
acco
unts
for
200
8-09
to
2016
-17,
i.e
nin
e ye
ars
wer
e co
nsid
ered
as
arre
ar a
ccou
nts
Tota
l- A
(A
ll se
ctor
-wis
e G
over
nmen
t C
ompa
nies
)10
.50
423.
0339
7.45
830.
98
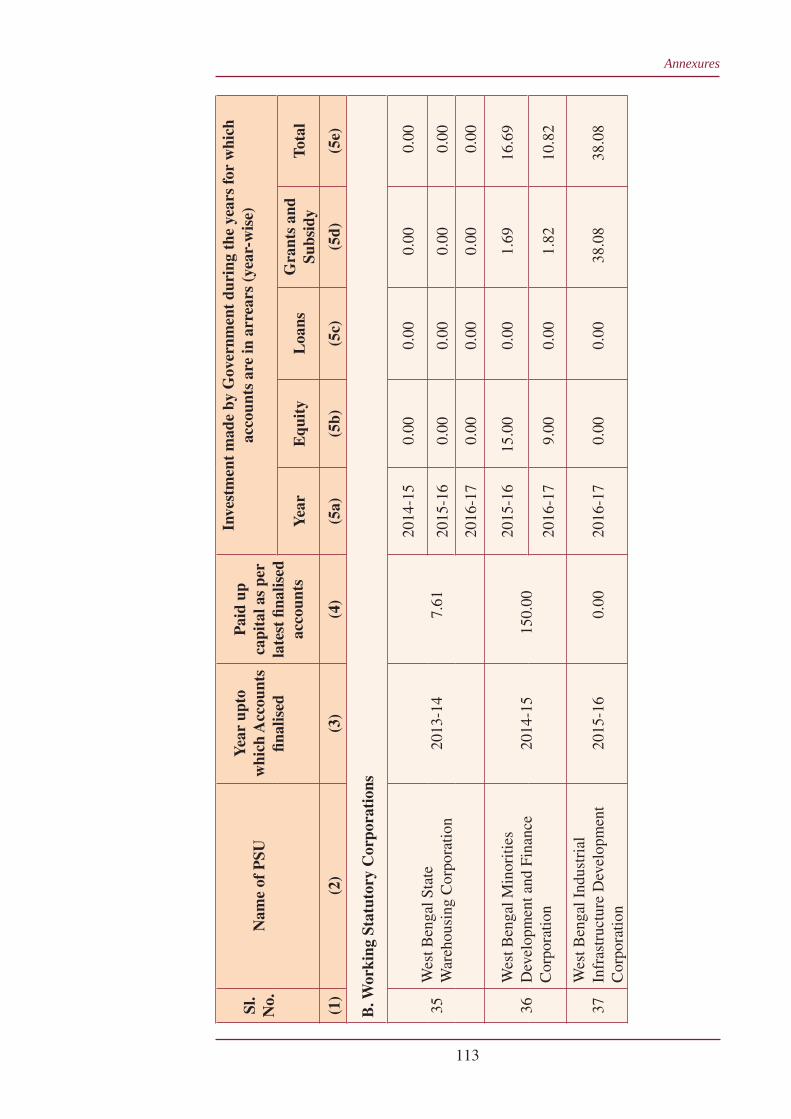
Annexures
113
Sl.
No.
Nam
e of
PSU
Yea
r up
to
whi
ch A
ccou
nts
fi nal
ised
Pai
d up
ca
pita
l as
per
late
st fi
nalis
ed
acco
unts
Inve
stm
ent
mad
e by
Gov
ernm
ent
duri
ng t
he y
ears
for
whi
ch
acco
unts
are
in a
rrea
rs (
year
-wis
e)
Yea
rE
quit
yL
oans
Gra
nts
and
Subs
idy
Tota
l
(1)
(2)
(3)
(4)
(5a)
(5b)
(5c)
(5d)
(5e)
B. W
orki
ng S
tatu
tory
Cor
pora
tion
s
35W
est B
enga
l Sta
te
War
ehou
sing
Cor
pora
tion
2013
-14
7.61
2014
-15
0.00
0.00
0.00
0.00
2015
-16
0.00
0.00
0.00
0.00
2016
-17
0.00
0.00
0.00
0.00
36W
est B
enga
l Min
oriti
es
Dev
elop
men
t and
Fin
ance
C
orpo
ratio
n20
14-1
515
0.00
2015
-16
15.0
00.
001.
6916
.69
2016
-17
9.00
0.00
1.82
10.8
2
37W
est B
enga
l Ind
ustr
ial
Infr
astr
uctu
re D
evel
opm
ent
Cor
pora
tion
2015
-16
0.00
2016
-17
0.00
0.00
38.0
838
.08
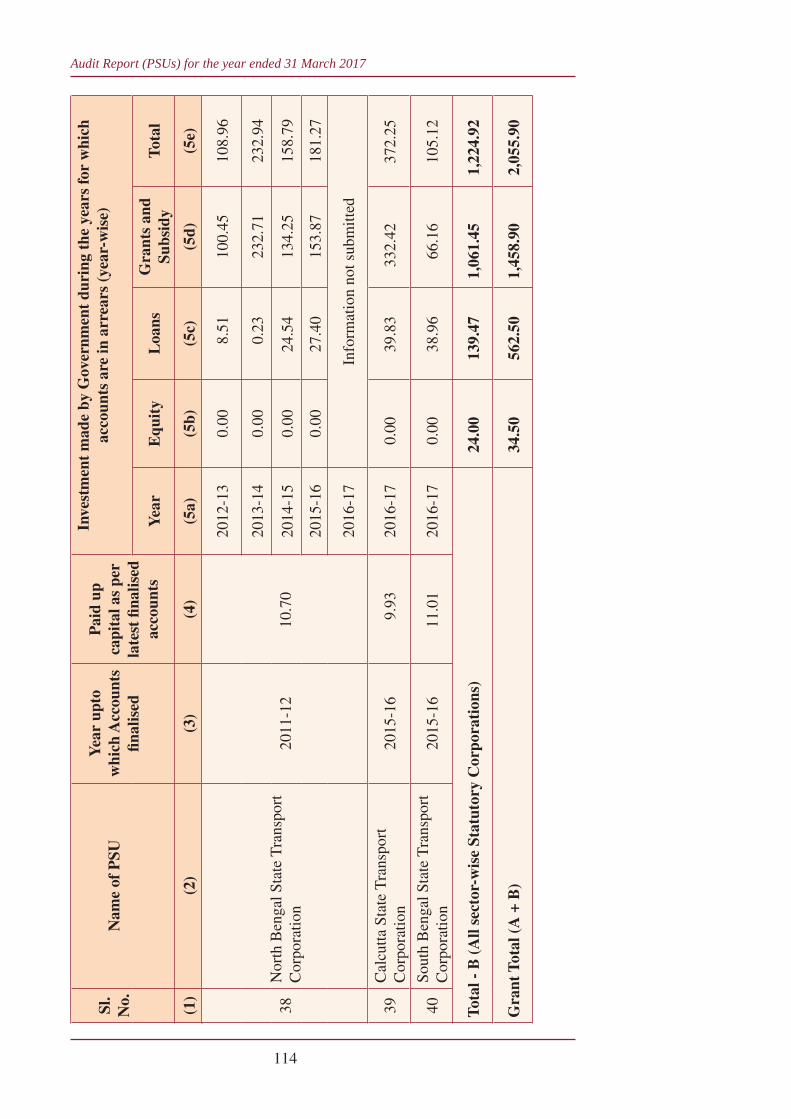
Sl.
No.
Nam
e of
PSU
Yea
r up
to
whi
ch A
ccou
nts
fi nal
ised
Pai
d up
ca
pita
l as
per
late
st fi
nalis
ed
acco
unts
Inve
stm
ent
mad
e by
Gov
ernm
ent
duri
ng t
he y
ears
for
whi
ch
acco
unts
are
in a
rrea
rs (
year
-wis
e)
Yea
rE
quit
yL
oans
Gra
nts
and
Subs
idy
Tota
l
(1)
(2)
(3)
(4)
(5a)
(5b)
(5c)
(5d)
(5e)
Audit Report (PSUs) for the year ended 31 March 2017
114
38N
orth
Ben
gal S
tate
Tra
nspo
rt
Cor
pora
tion
2011
-12
10.7
0
2012
-13
0.00
8.51
100.
4510
8.96
2013
-14
0.00
0.23
232.
7123
2.94
2014
-15
0.00
24.5
413
4.25
158.
79
2015
-16
0.00
27.4
015
3.87
181.
27
2016
-17
Info
rmat
ion
not s
ubm
itted
39C
alcu
tta S
tate
Tra
nspo
rt
Cor
pora
tion
2015
-16
9.93
2016
-17
0.00
39.8
333
2.42
372.
25
40So
uth
Ben
gal S
tate
Tra
nspo
rt
Cor
pora
tion
2015
-16
11.0
120
16-1
70.
0038
.96
66.1
610
5.12
Tota
l - B
(A
ll se
ctor
-wis
e St
atut
ory
Cor
pora
tion
s)24
.00
139.
471,
061.
451,
224.
92
Gra
nt T
otal
(A
+ B
)34
.50
562.
501,
458.
902,
055.
90
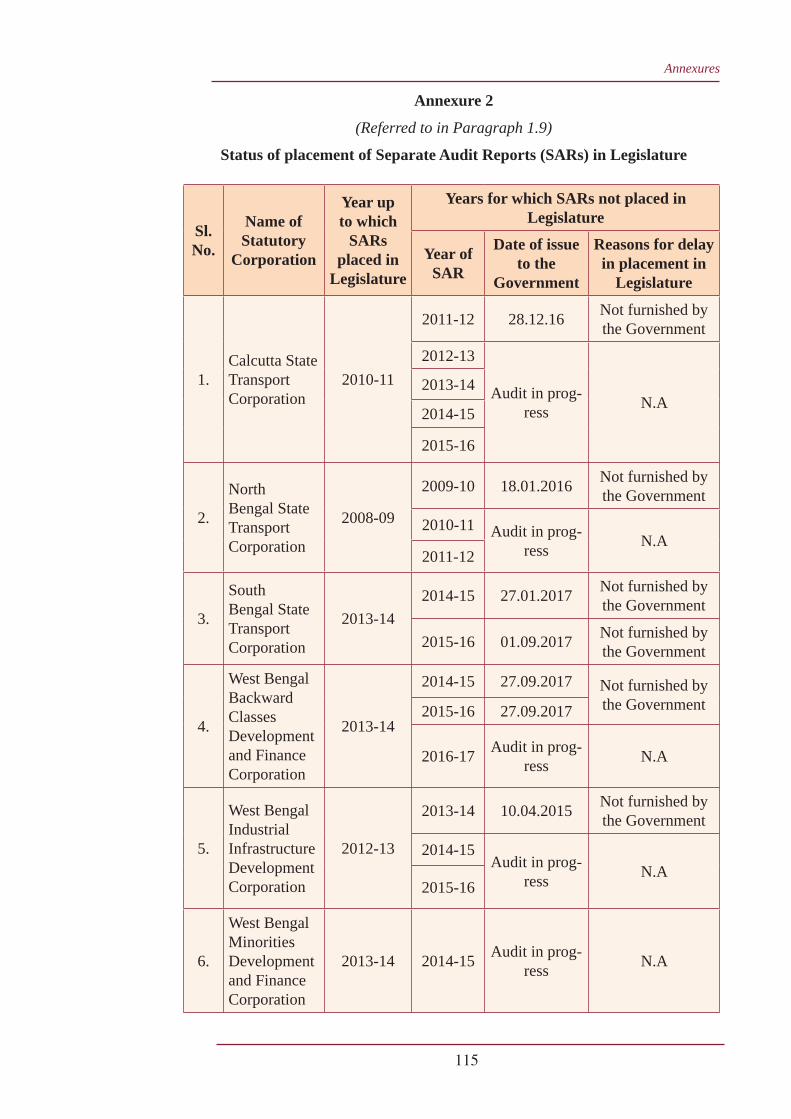
Annexures
115
Annexure 2
(Referred to in Paragraph 1.9)
Status of placement of Separate Audit Reports (SARs) in Legislature
Sl. No.
Name of Statutory
Corporation
Year up to which
SARs placed in
Legislature
Years for which SARs not placed in Legislature
Year of SAR
Date of issue to the
Government
Reasons for delay in placement in
Legislature
1.Calcutta State Transport Corporation
2010-11
2011-12 28.12.16 Not furnished by the Government
2012-13
Audit in prog-ress N.A
2013-14
2014-15
2015-16
2.
North Bengal State Transport Corporation
2008-09
2009-10 18.01.2016 Not furnished by the Government
2010-11 Audit in prog-ress N.A
2011-12
3.
South Bengal State Transport Corporation
2013-142014-15 27.01.2017 Not furnished by
the Government
2015-16 01.09.2017 Not furnished by the Government
4.
West Bengal Backward Classes Development and Finance Corporation
2013-14
2014-15 27.09.2017 Not furnished by the Government2015-16 27.09.2017
2016-17 Audit in prog-ress N.A
5.
West Bengal Industrial Infrastructure Development Corporation
2012-13
2013-14 10.04.2015 Not furnished by the Government
2014-15Audit in prog-
ress N.A2015-16
6.
West Bengal Minorities Development and Finance Corporation
2013-14 2014-15 Audit in prog-ress N.A
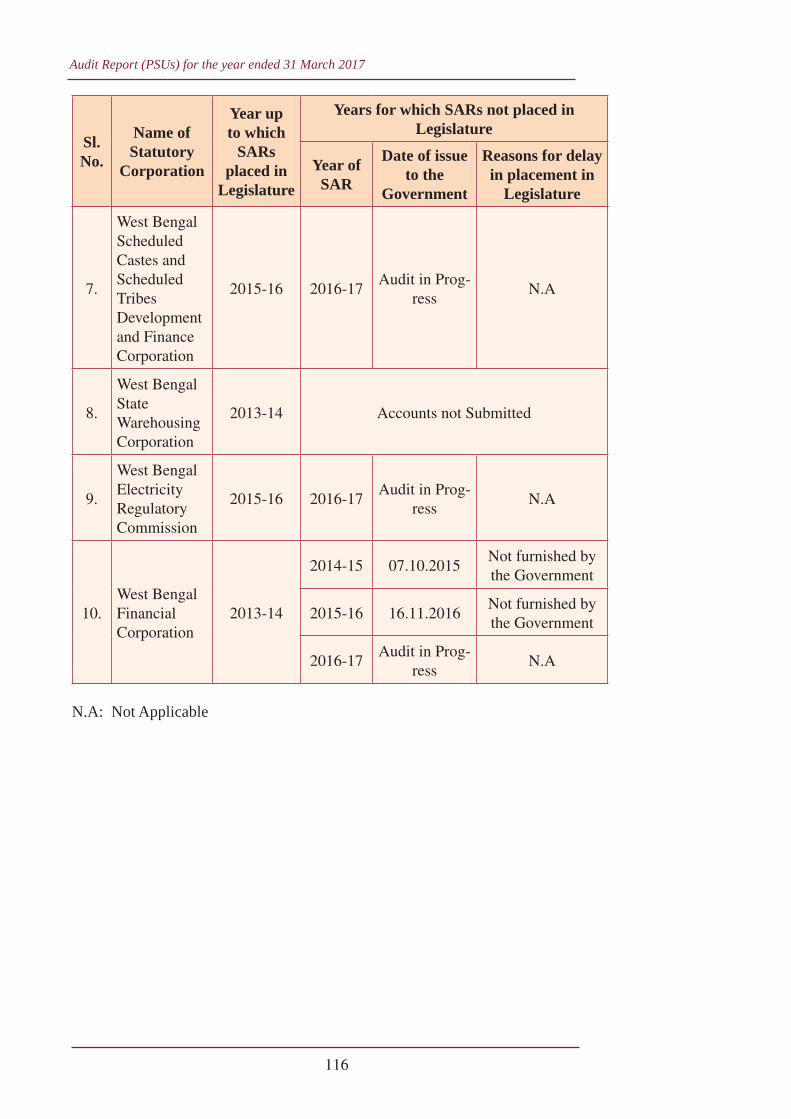
Audit Report (PSUs) for the year ended 31 March 2017
116
7.
West Bengal Scheduled Castes and Scheduled Tribes Development and Finance Corporation
2015-16 2016-17Audit in Prog-
ressN.A
8.
West Bengal State Warehousing Corporation
2013-14 Accounts not Submitted
9.
West Bengal Electricity Regulatory Commission
2015-16 2016-17Audit in Prog-
ressN.A
10.West Bengal Financial Corporation
2013-14
2014-15 07.10.2015Not furnished by the Government
2015-16 16.11.2016Not furnished by the Government
2016-17Audit in Prog-
ressN.A
N.A: Not Applicable
Sl. No.
Name of Statutory
Corporation
Year up to which
SARs placed in
Legislature
Years for which SARs not placed in Legislature
Year of SAR
Date of issue to the
Government
Reasons for delay in placement in
Legislature
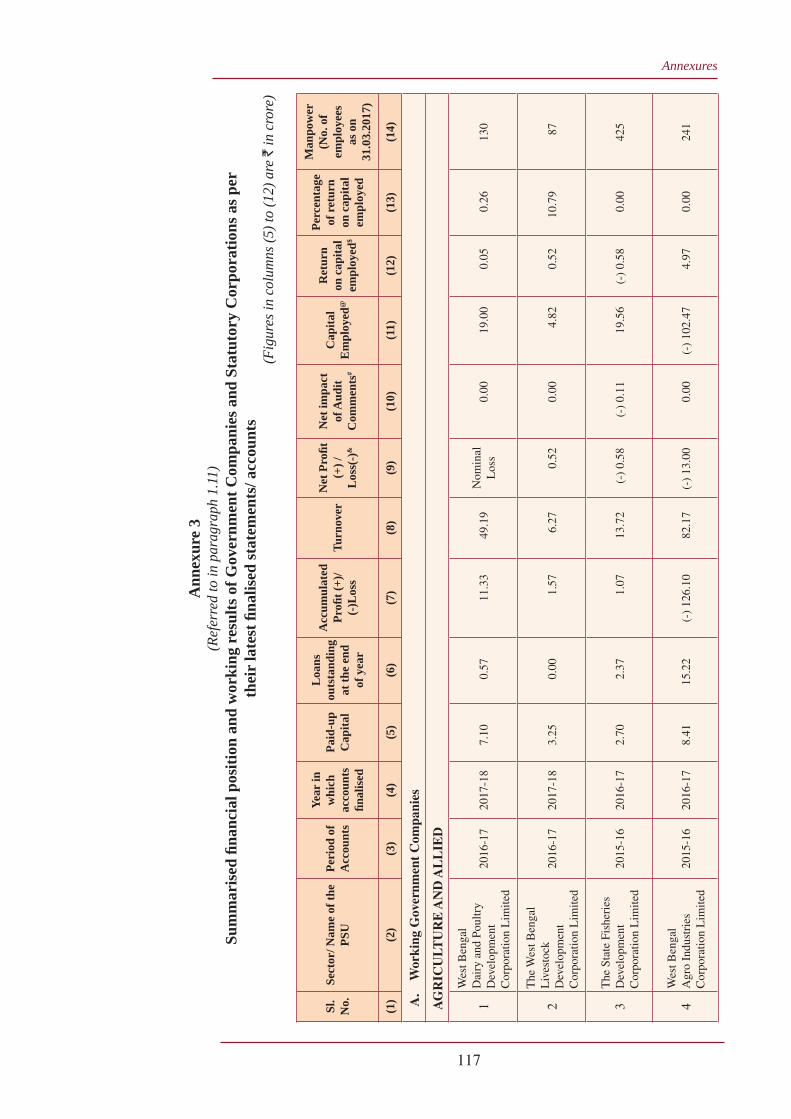
Ann
exur
e 3
(Ref
erre
d to
in p
arag
raph
1.1
1)Su
mm
aris
ed fi
nanc
ial p
ositi
on a
nd w
orki
ng r
esul
ts o
f Gov
ernm
ent C
ompa
nies
and
Sta
tuto
ry C
orpo
ratio
ns a
s per
th
eir
late
st fi
nalis
ed st
atem
ents
/ acc
ount
s (F
igur
es in
col
umns
(5) t
o (1
2) a
re `
in c
rore
)
Sl.
No.
Sect
or/ N
ame
of th
e PS
UPe
riod
of
Acc
ount
s
Year
in
whi
ch
acco
unts
fi n
alis
ed
Paid
-up
Cap
ital
Loa
ns
outs
tand
ing
at th
e en
d of
yea
r
Acc
umul
ated
Pr
ofi t
(+)/
(-)L
oss
Turn
over
Net
Pro
fi t
(+) /
L
oss(
-)&
Net
impa
ct
of A
udit
Com
men
ts#
Cap
ital
Em
ploy
ed@
Ret
urn
on c
apita
l em
ploy
ed$
Perc
enta
ge
of r
etur
n on
cap
ital
empl
oyed
Man
pow
er
(No.
of
empl
oyee
s as
on
31.0
3.20
17)
(1)
(2)
(3)
(4)
(5)
(6)
(7)
(8)
(9)
(10)
(11)
(12)
(13)
(14)
A
. W
orki
ng G
over
nmen
t C
ompa
nies
A
GR
ICU
LTU
RE
AN
D A
LL
IED
1
Wes
t Ben
gal
Dai
ry a
nd P
oultr
y D
evel
opm
ent
Cor
pora
tion
Lim
ited
2016
-17
2017
-18
7.10
0.57
11.3
349
.19
Nom
inal
L
oss
0.00
19.0
00.
050.
2613
0
2
The
Wes
t Ben
gal
Liv
esto
ck
Dev
elop
men
t C
orpo
ratio
n L
imite
d
2016
-17
2017
-18
3.25
0.00
1.57
6.27
0.52
0.00
4.82
0.52
10.7
987
3T
he S
tate
Fis
heri
es
Dev
elop
men
t C
orpo
ratio
n L
imite
d20
15-1
620
16-1
72.
702.
371.
0713
.72
(-)
0.58
(-)
0.11
19.5
6(-
) 0.
580.
0042
5
4W
est B
enga
l A
gro
Indu
stri
es
Cor
pora
tion
Lim
ited
2015
-16
2016
-17
8.41
15.2
2(-
) 12
6.10
82.1
7(-
) 13
.00
0.00
(-)
102.
474.
970.
0024
1
117
Annexures
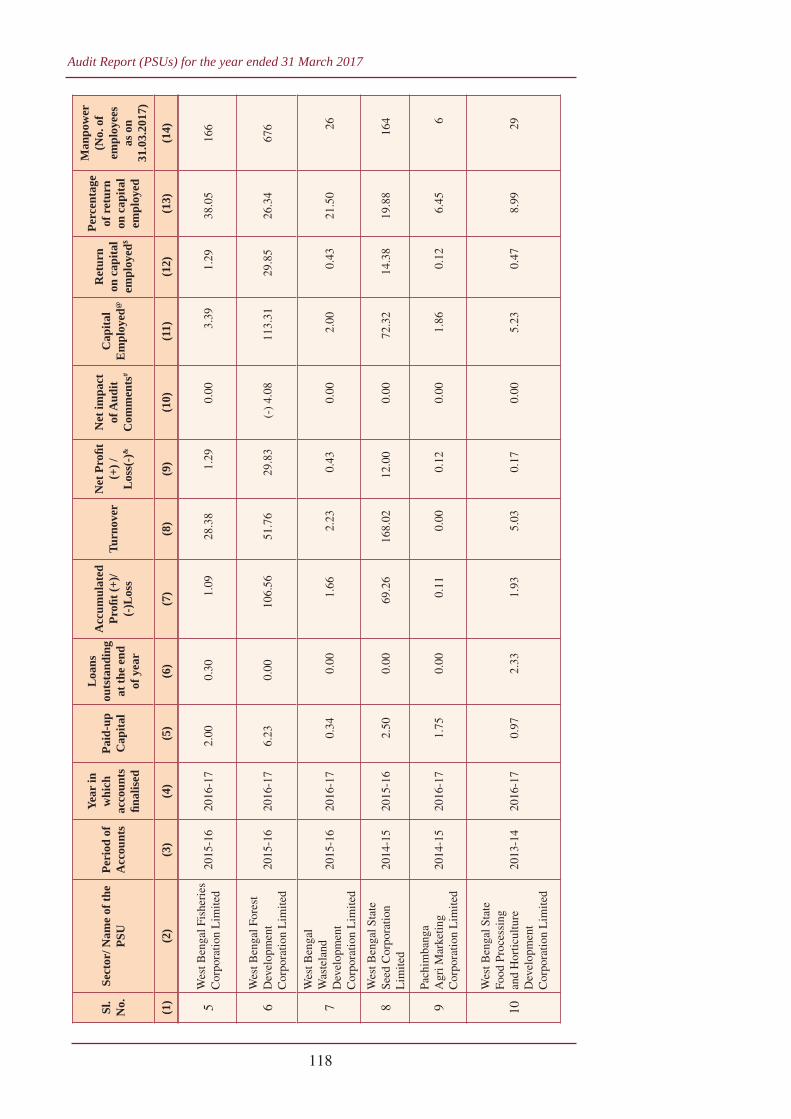
Audit Report (PSUs) for the year ended 31 March 2017
118
Sl.
No.
Sect
or/ N
ame
of th
e PS
UPe
riod
of
Acc
ount
s
Year
in
whi
ch
acco
unts
fi n
alis
ed
Paid
-up
Cap
ital
Loa
ns
outs
tand
ing
at th
e en
d of
yea
r
Acc
umul
ated
Pr
ofi t
(+)/
(-)L
oss
Turn
over
Net
Pro
fi t
(+) /
L
oss(
-)&
Net
impa
ct
of A
udit
Com
men
ts#
Cap
ital
Em
ploy
ed@
Ret
urn
on c
apita
l em
ploy
ed$
Perc
enta
ge
of r
etur
n on
cap
ital
empl
oyed
Man
pow
er
(No.
of
empl
oyee
s as
on
31.0
3.20
17)
(1)
(2)
(3)
(4)
(5)
(6)
(7)
(8)
(9)
(10)
(11)
(12)
(13)
(14)
5W
est B
enga
l Fis
heri
es
Cor
pora
tion
Lim
ited
2015
-16
2016
-17
2.00
0.30
1.09
28.3
81.
290.
003.
391.
2938
.05
166
6W
est B
enga
l For
est
Dev
elop
men
t C
orpo
ratio
n L
imite
d20
15-1
620
16-1
76.
230.
0010
6.56
51.7
629
.83
(-)
4.08
113.
3129
.85
26.3
467
6
7
Wes
t Ben
gal
Was
tela
nd
Dev
elop
men
t C
orpo
ratio
n L
imite
d
2015
-16
2016
-17
0.34
0.00
1.66
2.23
0.43
0.00
2.00
0.43
21.5
026
8W
est B
enga
l Sta
te
Seed
Cor
pora
tion
Lim
ited
2014
-15
2015
-16
2.50
0.00
69.2
616
8.02
12.0
00.
0072
.32
14.3
819
.88
164
9Pa
chim
bang
a A
gri M
arke
ting
Cor
pora
tion
Lim
ited
2014
-15
2016
-17
1.75
0.00
0.11
0.00
0.12
0.00
1.86
0.12
6.45
6
10
Wes
t Ben
gal S
tate
Fo
od P
roce
ssin
g an
d H
ortic
ultu
re
Dev
elop
men
t C
orpo
ratio
n L
imite
d
2013
-14
2016
-17
0.97
2.33
1.93
5.03
0.17
0.00
5.23
0.47
8.99
29
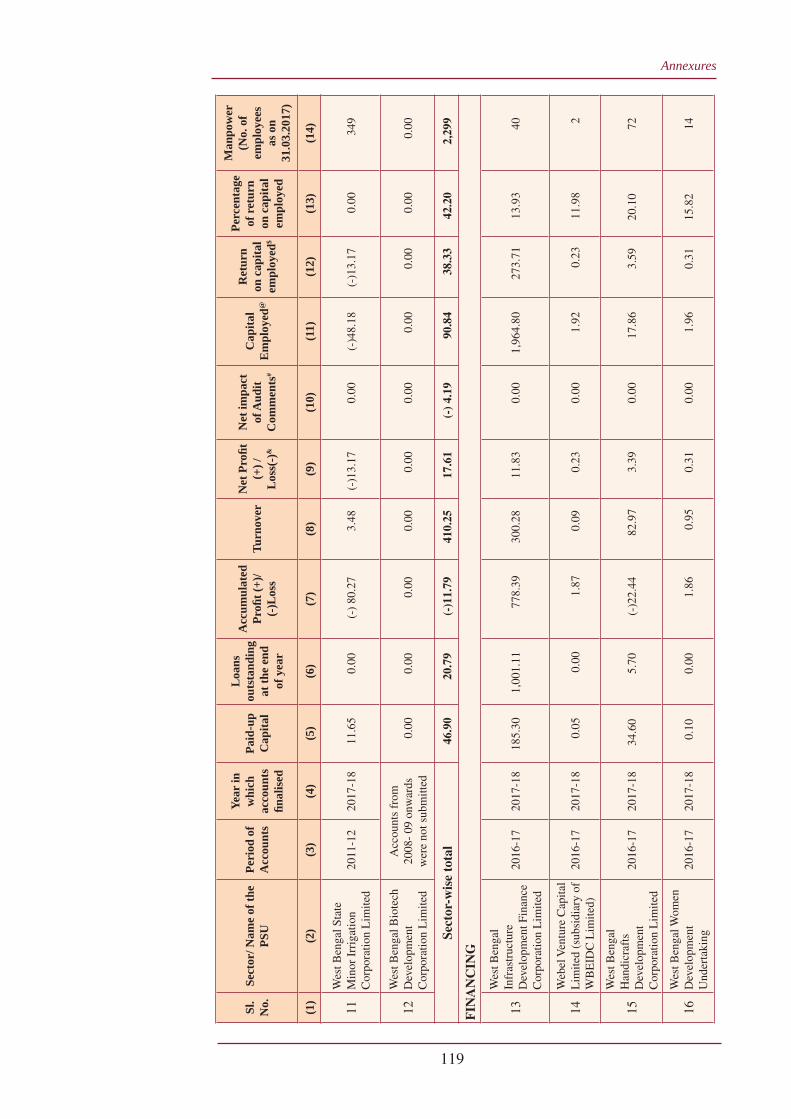
Annexures
119
Sl.
No.
Sect
or/ N
ame
of th
e PS
UPe
riod
of
Acc
ount
s
Year
in
whi
ch
acco
unts
fi n
alis
ed
Paid
-up
Cap
ital
Loa
ns
outs
tand
ing
at th
e en
d of
yea
r
Acc
umul
ated
Pr
ofi t
(+)/
(-)L
oss
Turn
over
Net
Pro
fi t
(+) /
L
oss(
-)&
Net
impa
ct
of A
udit
Com
men
ts#
Cap
ital
Em
ploy
ed@
Ret
urn
on c
apita
l em
ploy
ed$
Perc
enta
ge
of r
etur
n on
cap
ital
empl
oyed
Man
pow
er
(No.
of
empl
oyee
s as
on
31.0
3.20
17)
(1)
(2)
(3)
(4)
(5)
(6)
(7)
(8)
(9)
(10)
(11)
(12)
(13)
(14)
11W
est B
enga
l Sta
te
Min
or I
rrig
atio
n C
orpo
ratio
n L
imite
d20
11-1
220
17-1
811
.65
0.00
(-)
80.2
73.
48(-
)13.
170.
00(-
)48.
18(-
)13.
170.
0034
9
12W
est B
enga
l Bio
tech
D
evel
opm
ent
Cor
pora
tion
Lim
ited
Acc
ount
s fr
om
2008
- 09
onw
ards
w
ere
not s
ubm
itted
0.00
0.00
0.00
0.00
0.00
0.00
0.00
0.00
0.00
0.00
Sect
or-w
ise
tota
l46
.90
20.7
9(-
)11.
7941
0.25
17.6
1(-
) 4.
1990
.84
38.3
342
.20
2,29
9
FIN
AN
CIN
G
13
Wes
t Ben
gal
Infr
astr
uctu
re
Dev
elop
men
t Fin
ance
C
orpo
ratio
n L
imite
d
2016
-17
2017
-18
185.
301,
001.
1177
8.39
300.
2811
.83
0.00
1,96
4.80
273.
7113
.93
40
14W
ebel
Ven
ture
Cap
ital
Lim
ited
(sub
sidi
ary
of
WB
EID
C L
imite
d)20
16-1
720
17-1
80.
050.
001.
870.
090.
230.
001.
920.
2311
.98
2
15
Wes
t Ben
gal
Han
dicr
afts
D
evel
opm
ent
Cor
pora
tion
Lim
ited
2016
-17
2017
-18
34.6
05.
70(-
)22.
4482
.97
3.39
0.00
17.8
63.
5920
.10
72
16W
est B
enga
l Wom
en
Dev
elop
men
t U
nder
taki
ng20
16-1
720
17-1
80.
100.
001.
860.
950.
310.
001.
960.
3115
.82
14
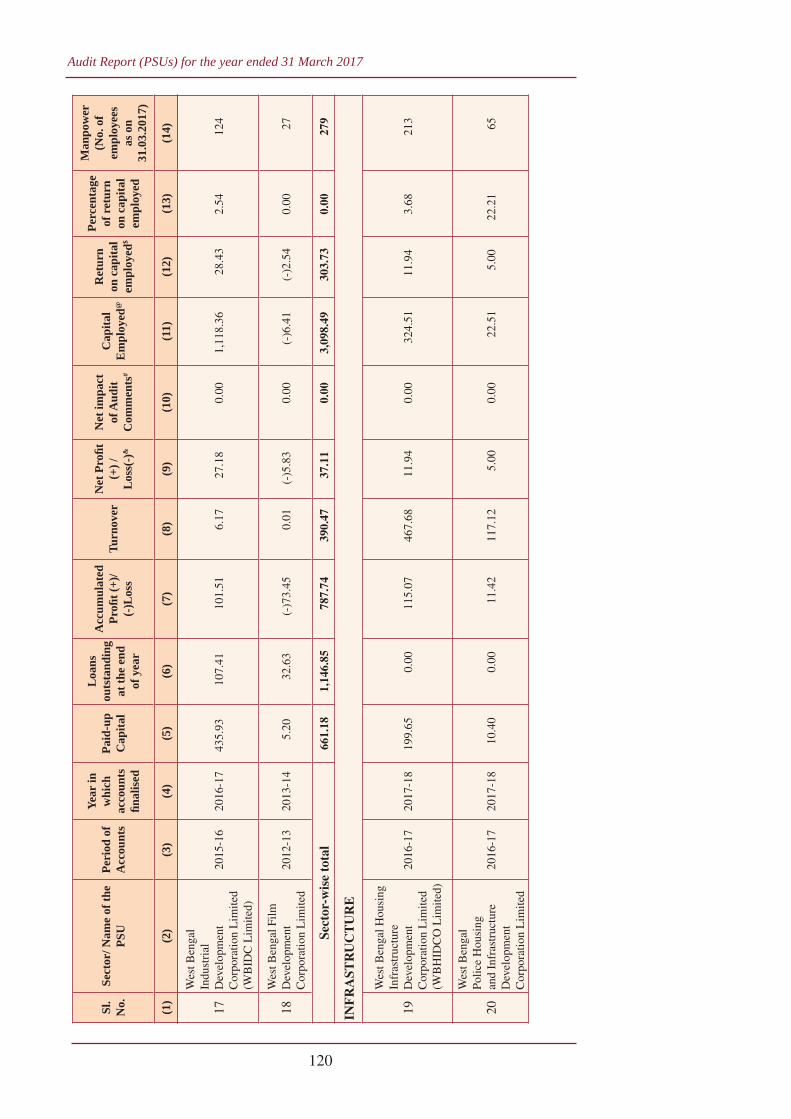
Audit Report (PSUs) for the year ended 31 March 2017
120
Sl.
No.
Sect
or/ N
ame
of th
e PS
UPe
riod
of
Acc
ount
s
Year
in
whi
ch
acco
unts
fi n
alis
ed
Paid
-up
Cap
ital
Loa
ns
outs
tand
ing
at th
e en
d of
yea
r
Acc
umul
ated
Pr
ofi t
(+)/
(-)L
oss
Turn
over
Net
Pro
fi t
(+) /
L
oss(
-)&
Net
impa
ct
of A
udit
Com
men
ts#
Cap
ital
Em
ploy
ed@
Ret
urn
on c
apita
l em
ploy
ed$
Perc
enta
ge
of r
etur
n on
cap
ital
empl
oyed
Man
pow
er
(No.
of
empl
oyee
s as
on
31.0
3.20
17)
(1)
(2)
(3)
(4)
(5)
(6)
(7)
(8)
(9)
(10)
(11)
(12)
(13)
(14)
17
Wes
t Ben
gal
Indu
stri
al
Dev
elop
men
t C
orpo
ratio
n L
imite
d (W
BID
C L
imite
d)
2015
-16
2016
-17
435.
9310
7.41
101.
516.
1727
.18
0.00
1,11
8.36
28.4
32.
5412
4
18W
est B
enga
l Film
D
evel
opm
ent
Cor
pora
tion
Lim
ited
2012
-13
2013
-14
5.20
32.6
3(-
)73.
450.
01(-
)5.8
30.
00(-
)6.4
1(-
)2.5
40.
0027
Sect
or-w
ise
tota
l66
1.18
1,14
6.85
787.
7439
0.47
37.1
10.
003,
098.
4930
3.73
0.00
279
INF
RA
STR
UC
TU
RE
19
Wes
t Ben
gal H
ousi
ng
Infr
astr
uctu
re
Dev
elop
men
t C
orpo
ratio
n L
imite
d (W
BH
IDC
O L
imite
d)
2016
-17
2017
-18
199.
650.
0011
5.07
467.
6811
.94
0.00
324.
5111
.94
3.68
213
20
Wes
t Ben
gal
Polic
e H
ousi
ng
and
Infr
astr
uctu
re
Dev
elop
men
t C
orpo
ratio
n L
imite
d
2016
-17
2017
-18
10.4
00.
0011
.42
117.
125.
000.
0022
.51
5.00
22.2
165
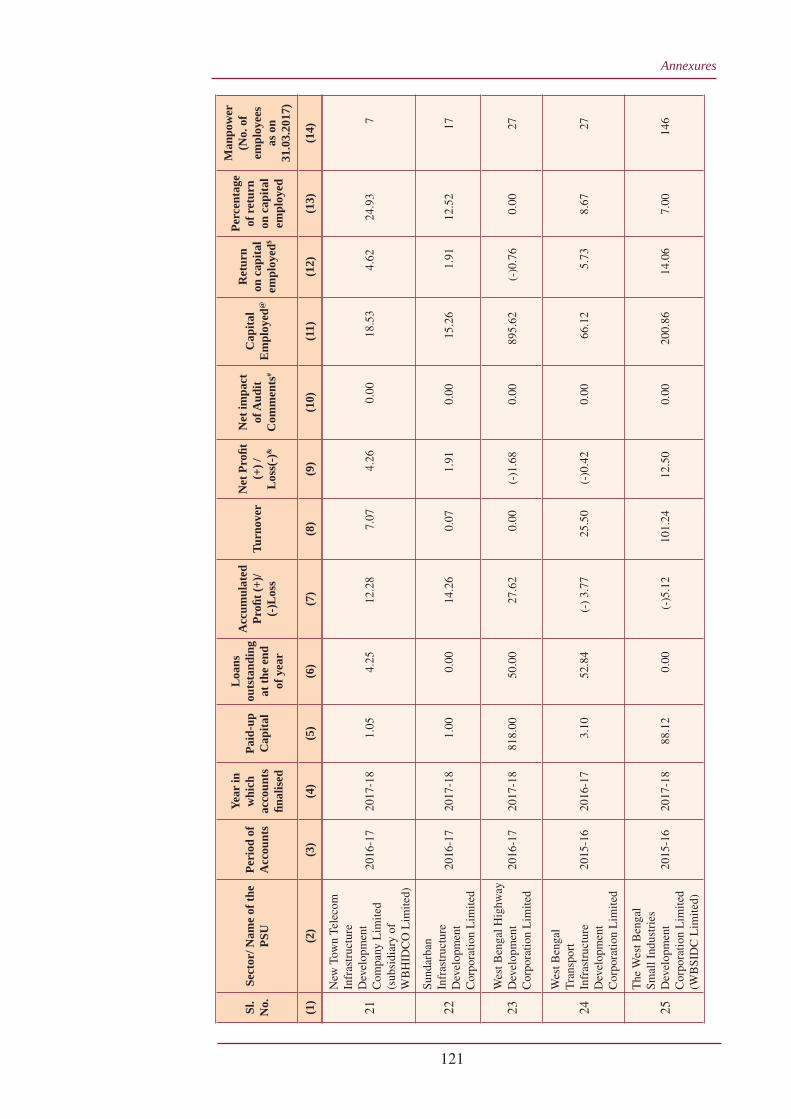
Annexures
121
Sl.
No.
Sect
or/ N
ame
of th
e PS
UPe
riod
of
Acc
ount
s
Year
in
whi
ch
acco
unts
fi n
alis
ed
Paid
-up
Cap
ital
Loa
ns
outs
tand
ing
at th
e en
d of
yea
r
Acc
umul
ated
Pr
ofi t
(+)/
(-)L
oss
Turn
over
Net
Pro
fi t
(+) /
L
oss(
-)&
Net
impa
ct
of A
udit
Com
men
ts#
Cap
ital
Em
ploy
ed@
Ret
urn
on c
apita
l em
ploy
ed$
Perc
enta
ge
of r
etur
n on
cap
ital
empl
oyed
Man
pow
er
(No.
of
empl
oyee
s as
on
31.0
3.20
17)
(1)
(2)
(3)
(4)
(5)
(6)
(7)
(8)
(9)
(10)
(11)
(12)
(13)
(14)
21
New
Tow
n Te
leco
m
Infr
astr
uctu
re
Dev
elop
men
t C
ompa
ny L
imite
d (s
ubsi
diar
y of
W
BH
IDC
O L
imite
d)
2016
-17
2017
-18
1.05
4.25
12.2
87.
074.
260.
0018
.53
4.62
24.9
37
22
Sund
arba
n In
fras
truc
ture
D
evel
opm
ent
Cor
pora
tion
Lim
ited
2016
-17
2017
-18
1.00
0.00
14.2
60.
071.
910.
0015
.26
1.91
12.5
217
23W
est B
enga
l Hig
hway
D
evel
opm
ent
Cor
pora
tion
Lim
ited
2016
-17
2017
-18
818.
0050
.00
27.6
20.
00(-
)1.6
80.
0089
5.62
(-)0
.76
0.00
27
24
Wes
t Ben
gal
Tra
nspo
rt
Infr
astr
uctu
re
Dev
elop
men
t C
orpo
ratio
n L
imite
d
2015
-16
2016
-17
3.10
52.8
4(-
) 3.
7725
.50
(-)0
.42
0.00
66.1
25.
738.
6727
25
The
Wes
t Ben
gal
Smal
l Ind
ustr
ies
Dev
elop
men
t C
orpo
ratio
n L
imite
d (W
BSI
DC
Lim
ited)
2015
-16
2017
-18
88.1
20.
00(-
)5.1
210
1.24
12.5
00.
0020
0.86
14.0
67.
0014
6
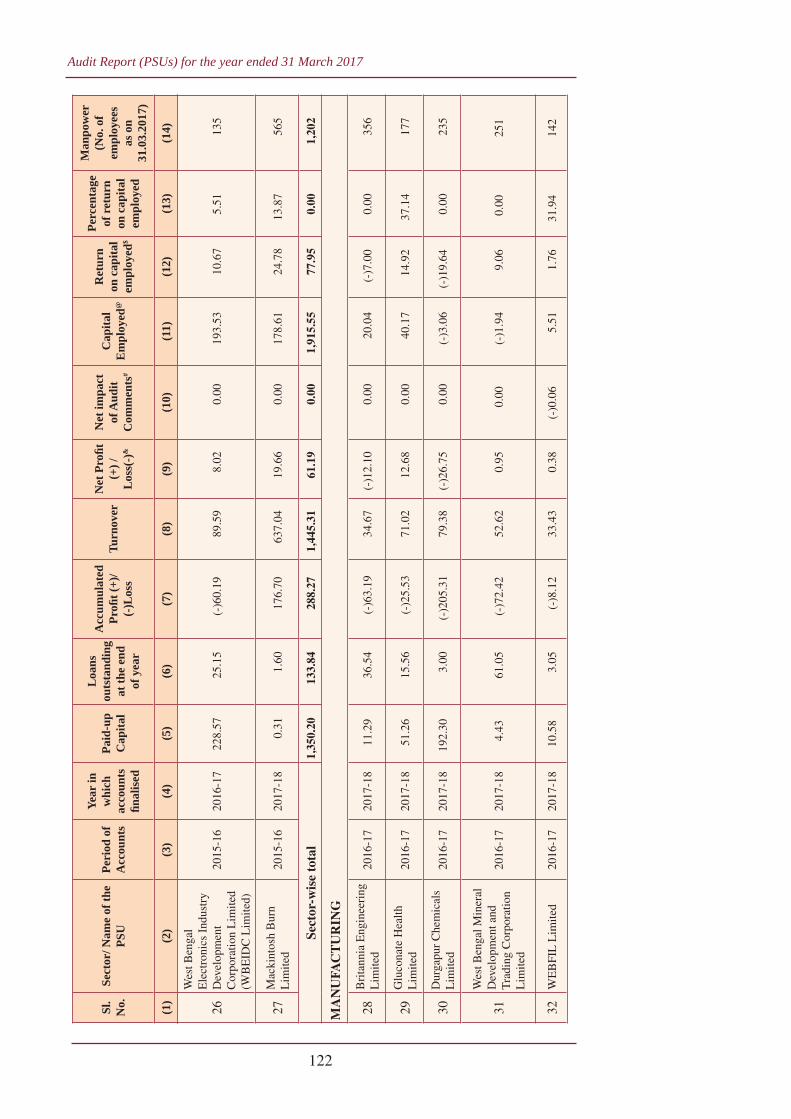
Audit Report (PSUs) for the year ended 31 March 2017
122
Sl.
No.
Sect
or/ N
ame
of th
e PS
UPe
riod
of
Acc
ount
s
Year
in
whi
ch
acco
unts
fi n
alis
ed
Paid
-up
Cap
ital
Loa
ns
outs
tand
ing
at th
e en
d of
yea
r
Acc
umul
ated
Pr
ofi t
(+)/
(-)L
oss
Turn
over
Net
Pro
fi t
(+) /
L
oss(
-)&
Net
impa
ct
of A
udit
Com
men
ts#
Cap
ital
Em
ploy
ed@
Ret
urn
on c
apita
l em
ploy
ed$
Perc
enta
ge
of r
etur
n on
cap
ital
empl
oyed
Man
pow
er
(No.
of
empl
oyee
s as
on
31.0
3.20
17)
(1)
(2)
(3)
(4)
(5)
(6)
(7)
(8)
(9)
(10)
(11)
(12)
(13)
(14)
26
Wes
t Ben
gal
Ele
ctro
nics
Ind
ustr
y D
evel
opm
ent
Cor
pora
tion
Lim
ited
(WB
EID
C L
imite
d)
2015
-16
2016
-17
228.
5725
.15
(-)6
0.19
89.5
98.
020.
0019
3.53
10.6
75.
5113
5
27M
acki
ntos
h B
urn
Lim
ited
2015
-16
2017
-18
0.31
1.60
176.
7063
7.04
19.6
60.
0017
8.61
24.7
813
.87
565
Sect
or-w
ise
tota
l1,
350.
2013
3.84
288.
271,
445.
3161
.19
0.00
1,91
5.55
77.9
50.
001,
202
MA
NU
FAC
TU
RIN
G
28B
rita
nnia
Eng
inee
ring
L
imite
d20
16-1
720
17-1
811
.29
36.5
4(-
)63.
1934
.67
(-)1
2.10
0.00
20.0
4(-
)7.0
00.
0035
6
29G
luco
nate
Hea
lth
Lim
ited
2016
-17
2017
-18
51.2
615
.56
(-)2
5.53
71.0
212
.68
0.00
40.1
714
.92
37.1
417
7
30D
urga
pur
Che
mic
als
Lim
ited
2016
-17
2017
-18
192.
303.
00(-
)205
.31
79.3
8(-
)26.
750.
00(-
)3.0
6(-
)19.
640.
0023
5
31
Wes
t Ben
gal M
iner
al
Dev
elop
men
t and
T
radi
ng C
orpo
ratio
n L
imite
d
2016
-17
2017
-18
4.43
61.0
5(-
)72.
4252
.62
0.95
0.00
(-)1
.94
9.06
0.00
251
32W
EB
FIL
Lim
ited
2016
-17
2017
-18
10.5
83.
05(-
)8.1
233
.43
0.38
(-)0
.06
5.51
1.76
31.9
414
2
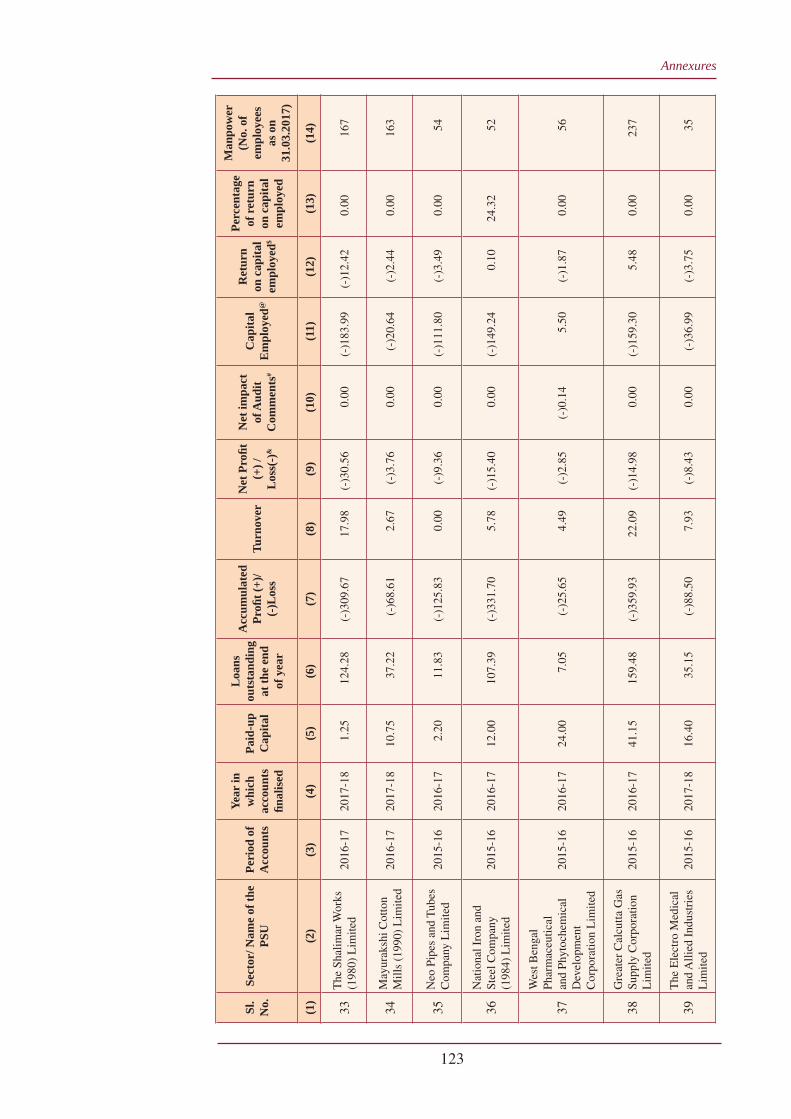
Annexures
123
Sl.
No.
Sect
or/ N
ame
of th
e PS
UPe
riod
of
Acc
ount
s
Year
in
whi
ch
acco
unts
fi n
alis
ed
Paid
-up
Cap
ital
Loa
ns
outs
tand
ing
at th
e en
d of
yea
r
Acc
umul
ated
Pr
ofi t
(+)/
(-)L
oss
Turn
over
Net
Pro
fi t
(+) /
L
oss(
-)&
Net
impa
ct
of A
udit
Com
men
ts#
Cap
ital
Em
ploy
ed@
Ret
urn
on c
apita
l em
ploy
ed$
Perc
enta
ge
of r
etur
n on
cap
ital
empl
oyed
Man
pow
er
(No.
of
empl
oyee
s as
on
31.0
3.20
17)
(1)
(2)
(3)
(4)
(5)
(6)
(7)
(8)
(9)
(10)
(11)
(12)
(13)
(14)
33T
he S
halim
ar W
orks
(1
980)
Lim
ited
2016
-17
2017
-18
1.25
124.
28(-
)309
.67
17.9
8(-
)30.
560.
00(-
)183
.99
(-)1
2.42
0.00
167
34M
ayur
aksh
i Cot
ton
Mill
s (1
990)
Lim
ited
2016
-17
2017
-18
10.7
537
.22
(-)6
8.61
2.67
(-)3
.76
0.00
(-)2
0.64
(-)2
.44
0.00
163
35N
eo P
ipes
and
Tub
es
Com
pany
Lim
ited
2015
-16
2016
-17
2.20
11.8
3(-
)125
.83
0.00
(-)9
.36
0.00
(-)1
11.8
0(-
)3.4
90.
0054
36N
atio
nal I
ron
and
Stee
l Com
pany
(1
984)
Lim
ited
2015
-16
2016
-17
12.0
010
7.39
(-)3
31.7
05.
78(-
)15.
400.
00(-
)149
.24
0.10
24.3
252
37
Wes
t Ben
gal
Phar
mac
eutic
al
and
Phyt
oche
mic
al
Dev
elop
men
t C
orpo
ratio
n L
imite
d
2015
-16
2016
-17
24.0
07.
05(-
)25.
654.
49(-
)2.8
5(-
)0.1
45.
50(-
)1.8
70.
0056
38G
reat
er C
alcu
tta G
as
Supp
ly C
orpo
ratio
n L
imite
d20
15-1
620
16-1
741
.15
159.
48(-
)359
.93
22.0
9(-
)14.
980.
00(-
)159
.30
5.48
0.00
237
39T
he E
lect
ro M
edic
al
and
Alli
ed I
ndus
trie
s L
imite
d20
15-1
620
17-1
816
.40
35.1
5(-
)88.
507.
93(-
)8.4
30.
00(-
)36.
99(-
)3.7
50.
0035
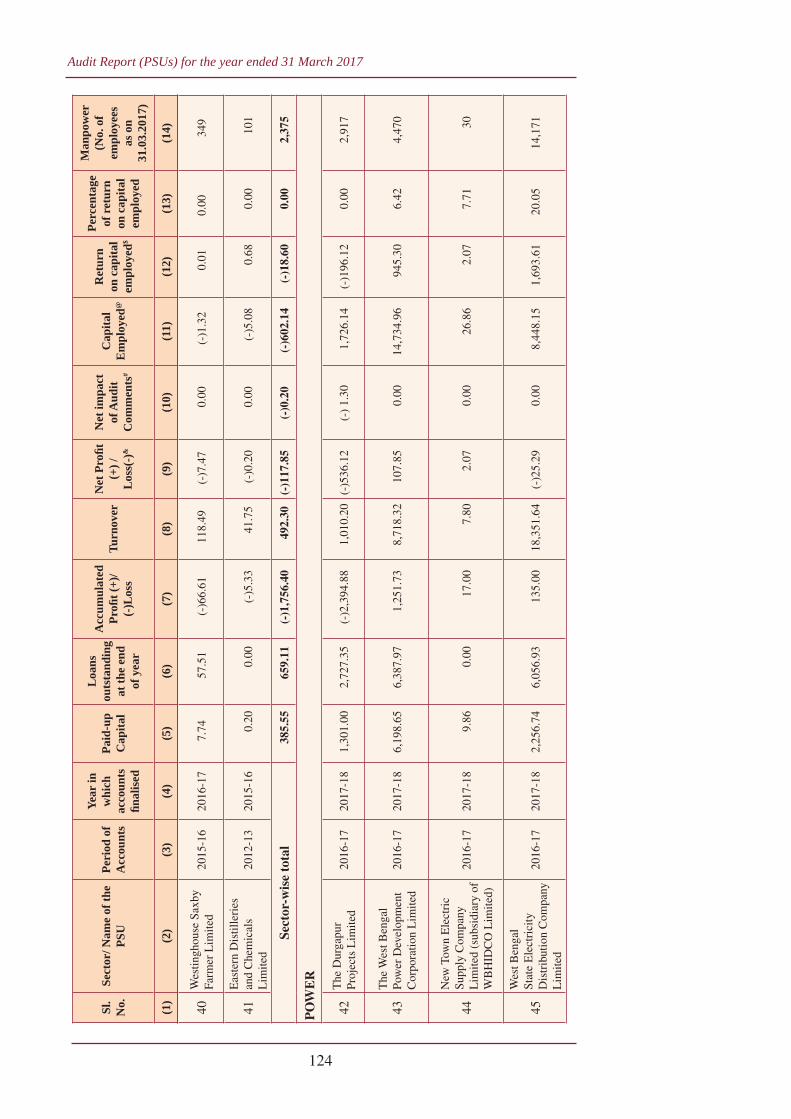
Audit Report (PSUs) for the year ended 31 March 2017
124
Sl.
No.
Sect
or/ N
ame
of th
e PS
UPe
riod
of
Acc
ount
s
Year
in
whi
ch
acco
unts
fi n
alis
ed
Paid
-up
Cap
ital
Loa
ns
outs
tand
ing
at th
e en
d of
yea
r
Acc
umul
ated
Pr
ofi t
(+)/
(-)L
oss
Turn
over
Net
Pro
fi t
(+) /
L
oss(
-)&
Net
impa
ct
of A
udit
Com
men
ts#
Cap
ital
Em
ploy
ed@
Ret
urn
on c
apita
l em
ploy
ed$
Perc
enta
ge
of r
etur
n on
cap
ital
empl
oyed
Man
pow
er
(No.
of
empl
oyee
s as
on
31.0
3.20
17)
(1)
(2)
(3)
(4)
(5)
(6)
(7)
(8)
(9)
(10)
(11)
(12)
(13)
(14)
40W
estin
ghou
se S
axby
Fa
rmer
Lim
ited
2015
-16
2016
-17
7.74
57.5
1(-
)66.
6111
8.49
(-)7
.47
0.00
(-)1
.32
0.01
0.00
349
41E
aste
rn D
istil
leri
es
and
Che
mic
als
Lim
ited
2012
-13
2015
-16
0.20
0.00
(-)5
.33
41.7
5(-
)0.2
00.
00(-
)5.0
80.
680.
0010
1
Sect
or-w
ise
tota
l38
5.55
659.
11(-
)1,7
56.4
049
2.30
(-)1
17.8
5(-
)0.2
0(-
)602
.14
(-)1
8.60
0.00
2,37
5
PO
WE
R
42T
he D
urga
pur
Proj
ects
Lim
ited
2016
-17
2017
-18
1,30
1.00
2,72
7.35
(-)2
,394
.88
1,01
0.20
(-)5
36.1
2(-
) 1.
301,
726.
14(-
)196
.12
0.00
2,91
7
43T
he W
est B
enga
l Po
wer
Dev
elop
men
t C
orpo
ratio
n L
imite
d20
16-1
720
17-1
86,
198.
656,
387.
971,
251.
738,
718.
3210
7.85
0.00
14,7
34.9
694
5.30
6.42
4,47
0
44
New
Tow
n E
lect
ric
Supp
ly C
ompa
ny
Lim
ited
(sub
sidi
ary
of
WB
HID
CO
Lim
ited)
2016
-17
2017
-18
9.86
0.00
17.0
07.
802.
070.
0026
.86
2.07
7.71
30
45
Wes
t Ben
gal
Stat
e E
lect
rici
ty
Dis
trib
utio
n C
ompa
ny
Lim
ited
2016
-17
2017
-18
2,25
6.74
6,05
6.93
135.
0018
,351
.64
(-)2
5.29
0.00
8,44
8.15
1,69
3.61
20.0
514
,171
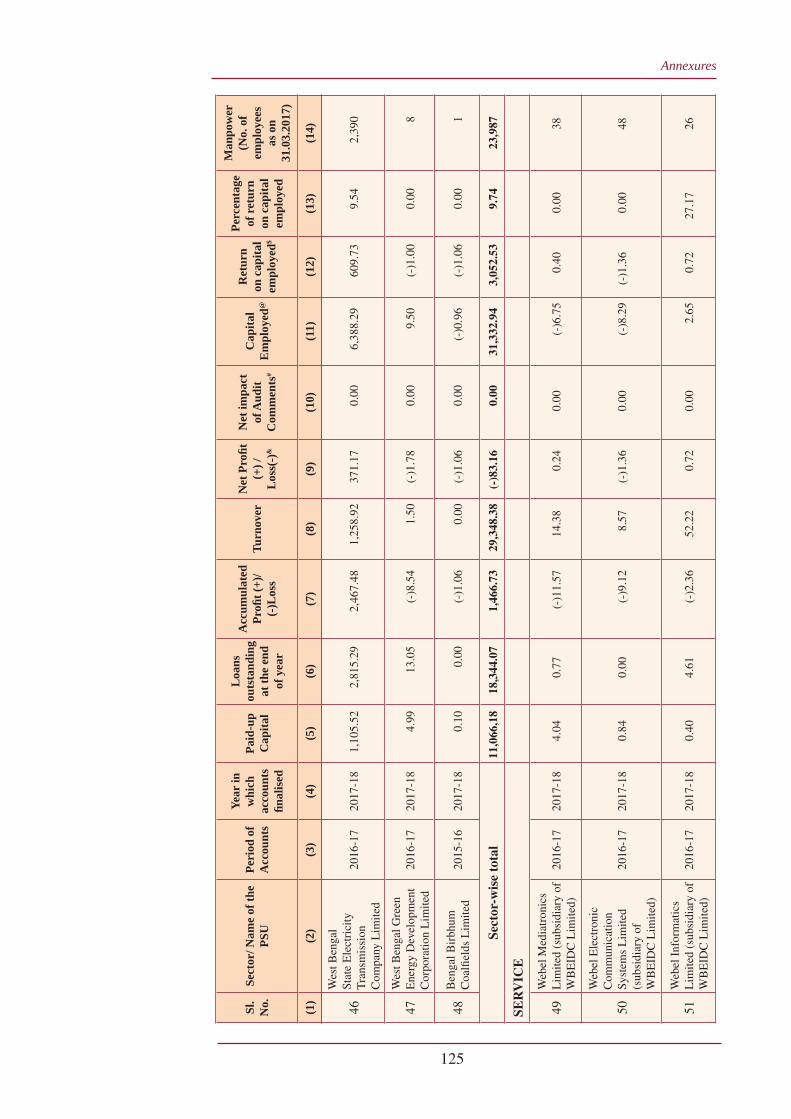
Annexures
125
Sl.
No.
Sect
or/ N
ame
of th
e PS
UPe
riod
of
Acc
ount
s
Year
in
whi
ch
acco
unts
fi n
alis
ed
Paid
-up
Cap
ital
Loa
ns
outs
tand
ing
at th
e en
d of
yea
r
Acc
umul
ated
Pr
ofi t
(+)/
(-)L
oss
Turn
over
Net
Pro
fi t
(+) /
L
oss(
-)&
Net
impa
ct
of A
udit
Com
men
ts#
Cap
ital
Em
ploy
ed@
Ret
urn
on c
apita
l em
ploy
ed$
Perc
enta
ge
of r
etur
n on
cap
ital
empl
oyed
Man
pow
er
(No.
of
empl
oyee
s as
on
31.0
3.20
17)
(1)
(2)
(3)
(4)
(5)
(6)
(7)
(8)
(9)
(10)
(11)
(12)
(13)
(14)
46
Wes
t Ben
gal
Stat
e E
lect
rici
ty
Tra
nsm
issi
on
Com
pany
Lim
ited
2016
-17
2017
-18
1,10
5.52
2,81
5.29
2,46
7.48
1,25
8.92
371.
170.
006,
388.
2960
9.73
9.54
2,39
0
47W
est B
enga
l Gre
en
Ene
rgy
Dev
elop
men
t C
orpo
ratio
n L
imite
d20
16-1
720
17-1
84.
9913
.05
(-)8
.54
1.50
(-)1
.78
0.00
9.50
(-)1
.00
0.00
8
48B
enga
l Bir
bhum
C
oalfi
elds
Lim
ited
2015
-16
2017
-18
0.10
0.00
(-)1
.06
0.00
(-)1
.06
0.00
(-)0
.96
(-)1
.06
0.00
1
Sect
or-w
ise
tota
l11
,066
,18
18,3
44.0
71,
466.
7329
,348
.38
(-)8
3.16
0.00
31,3
32.9
43,
052.
539.
7423
,987
SE
RV
ICE
49W
ebel
Med
iatr
onic
s L
imite
d (s
ubsi
diar
y of
W
BE
IDC
Lim
ited)
2016
-17
2017
-18
4.04
0.77
(-)1
1.57
14.3
80.
240.
00(-
)6.7
50.
400.
0038
50
Web
el E
lect
roni
c C
omm
unic
atio
n Sy
stem
s L
imite
d (s
ubsi
diar
y of
W
BE
IDC
Lim
ited)
2016
-17
2017
-18
0.84
0.00
(-)9
.12
8.57
(-)1
.36
0.00
(-)8
.29
(-)1
.36
0.00
48
51W
ebel
Inf
orm
atic
s L
imite
d (s
ubsi
diar
y of
W
BE
IDC
Lim
ited)
2016
-17
2017
-18
0.40
4.61
(-)2
.36
52.2
20.
720.
002.
650.
7227
.17
26
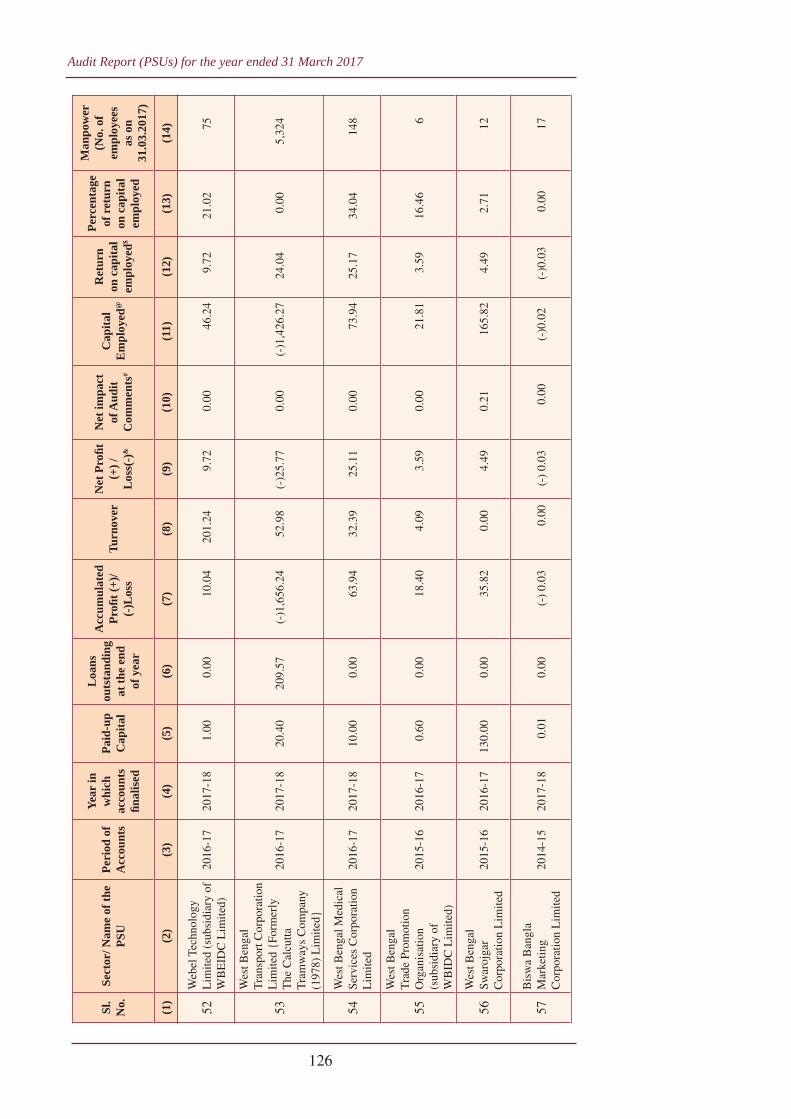
Audit Report (PSUs) for the year ended 31 March 2017
126
Sl.
No.
Sect
or/ N
ame
of th
e PS
UPe
riod
of
Acc
ount
s
Year
in
whi
ch
acco
unts
fi n
alis
ed
Paid
-up
Cap
ital
Loa
ns
outs
tand
ing
at th
e en
d of
yea
r
Acc
umul
ated
Pr
ofi t
(+)/
(-)L
oss
Turn
over
Net
Pro
fi t
(+) /
L
oss(
-)&
Net
impa
ct
of A
udit
Com
men
ts#
Cap
ital
Em
ploy
ed@
Ret
urn
on c
apita
l em
ploy
ed$
Perc
enta
ge
of r
etur
n on
cap
ital
empl
oyed
Man
pow
er
(No.
of
empl
oyee
s as
on
31.0
3.20
17)
(1)
(2)
(3)
(4)
(5)
(6)
(7)
(8)
(9)
(10)
(11)
(12)
(13)
(14)
52W
ebel
Tec
hnol
ogy
Lim
ited
(sub
sidi
ary
of
WB
EID
C L
imite
d)20
16-1
720
17-1
81.
000.
0010
.04
201.
249.
720.
0046
.24
9.72
21.0
275
53
Wes
t Ben
gal
Tra
nspo
rt C
orpo
ratio
n L
imite
d {F
orm
erly
T
he C
alcu
tta
Tra
mw
ays
Com
pany
(1
978)
Lim
ited}
2016
-17
2017
-18
20.4
020
9.57
(-)1
,656
.24
52.9
8(-
)25.
770.
00(-
)1,4
26.2
724
.04
0.00
5,32
4
54W
est B
enga
l Med
ical
Se
rvic
es C
orpo
ratio
n L
imite
d20
16-1
720
17-1
810
.00
0.00
63.9
432
.39
25.1
10.
0073
.94
25.1
734
.04
148
55
Wes
t Ben
gal
Tra
de P
rom
otio
n O
rgan
isat
ion
(sub
sidi
ary
of
WB
IDC
Lim
ited)
2015
-16
2016
-17
0.60
0.00
18.4
04.
093.
590.
0021
.81
3.59
16.4
66
56W
est B
enga
l Sw
aroj
gar
Cor
pora
tion
Lim
ited
2015
-16
2016
-17
130.
000.
0035
.82
0.00
4.49
0.21
165.
824.
492.
7112
57B
isw
a B
angl
a M
arke
ting
Cor
pora
tion
Lim
ited
2014
-15
2017
-18
0.01
0.00
(-)
0.03
0.00
(-)
0.03
0.00
(-)0
.02
(-)0
.03
0.00
17
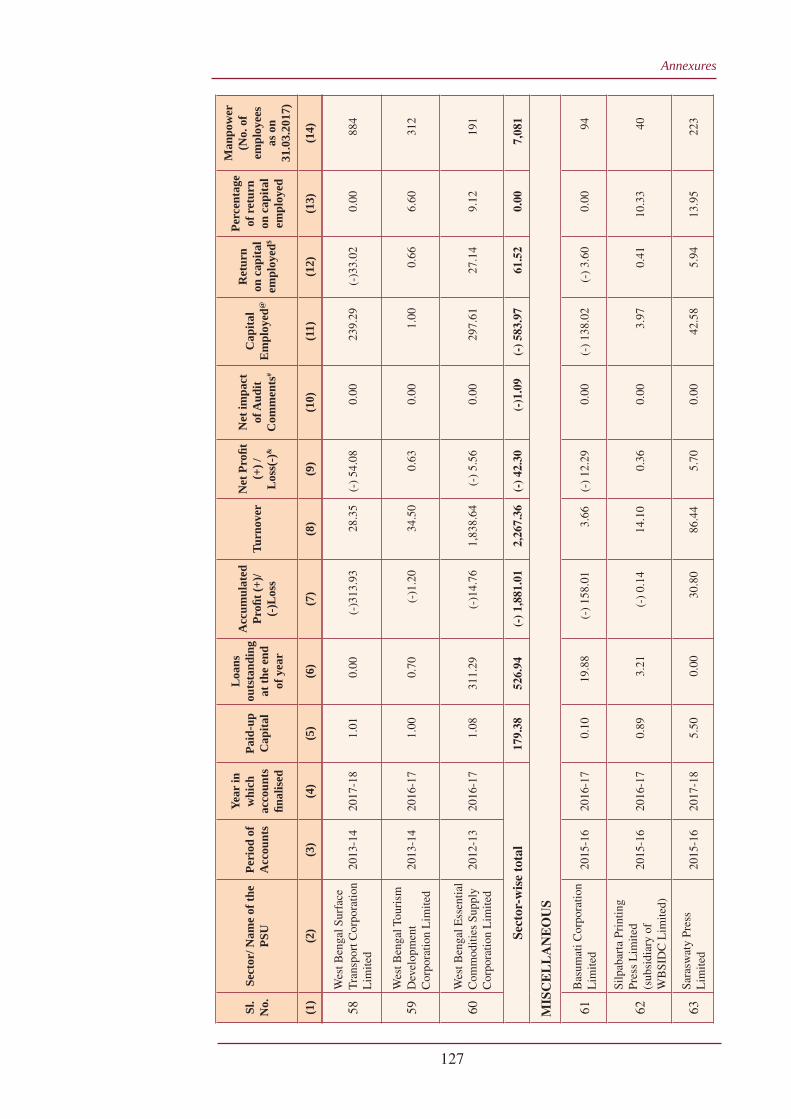
Annexures
127
Sl.
No.
Sect
or/ N
ame
of th
e PS
UPe
riod
of
Acc
ount
s
Year
in
whi
ch
acco
unts
fi n
alis
ed
Paid
-up
Cap
ital
Loa
ns
outs
tand
ing
at th
e en
d of
yea
r
Acc
umul
ated
Pr
ofi t
(+)/
(-)L
oss
Turn
over
Net
Pro
fi t
(+) /
L
oss(
-)&
Net
impa
ct
of A
udit
Com
men
ts#
Cap
ital
Em
ploy
ed@
Ret
urn
on c
apita
l em
ploy
ed$
Perc
enta
ge
of r
etur
n on
cap
ital
empl
oyed
Man
pow
er
(No.
of
empl
oyee
s as
on
31.0
3.20
17)
(1)
(2)
(3)
(4)
(5)
(6)
(7)
(8)
(9)
(10)
(11)
(12)
(13)
(14)
58W
est B
enga
l Sur
face
T
rans
port
Cor
pora
tion
Lim
ited
2013
-14
2017
-18
1.01
0.00
(-)3
13.9
328
.35
(-)
54.0
80.
0023
9.29
(-)3
3.02
0.00
884
59W
est B
enga
l Tou
rism
D
evel
opm
ent
Cor
pora
tion
Lim
ited
2013
-14
2016
-17
1.00
0.70
(-)1
.20
34.5
00.
630.
001.
000.
666.
6031
2
60W
est B
enga
l Ess
entia
l C
omm
oditi
es S
uppl
y C
orpo
ratio
n L
imite
d20
12-1
320
16-1
71.
0831
1.29
(-)1
4.76
1,83
8.64
(-)
5.56
0.00
297.
6127
.14
9.12
191
Sect
or-w
ise
tota
l17
9.38
526.
94(-
) 1,
881.
012,
267.
36(-
) 42
.30
(-)1
.09
(-)
583.
9761
.52
0.00
7,08
1
MIS
CE
LL
AN
EO
US
61B
asum
ati C
orpo
ratio
n L
imite
d20
15-1
620
16-1
70.
1019
.88
(-)
158.
013.
66(-
) 12
.29
0.00
(-)
138.
02(-
) 3.
600.
0094
62
Silp
abar
ta P
rint
ing
Pres
s L
imite
d (s
ubsi
diar
y of
W
BSI
DC
Lim
ited)
2015
-16
2016
-17
0.89
3.21
(-)
0.14
14.1
00.
360.
003.
970.
4110
.33
40
63Sa
rasw
aty
Pres
s L
imite
d20
15-1
620
17-1
85.
500.
0030
.80
86.4
45.
700.
0042
.58
5.94
13.9
522
3
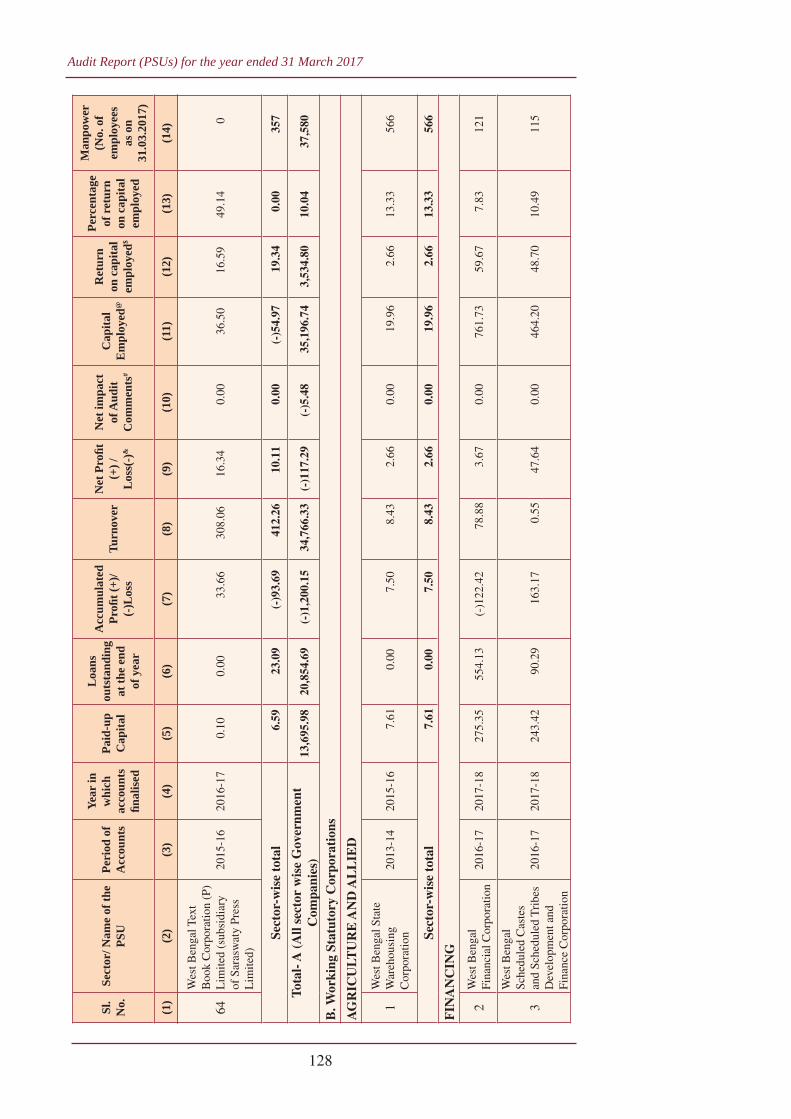
Audit Report (PSUs) for the year ended 31 March 2017
128
Sl.
No.
Sect
or/ N
ame
of th
e PS
UPe
riod
of
Acc
ount
s
Year
in
whi
ch
acco
unts
fi n
alis
ed
Paid
-up
Cap
ital
Loa
ns
outs
tand
ing
at th
e en
d of
yea
r
Acc
umul
ated
Pr
ofi t
(+)/
(-)L
oss
Turn
over
Net
Pro
fi t
(+) /
L
oss(
-)&
Net
impa
ct
of A
udit
Com
men
ts#
Cap
ital
Em
ploy
ed@
Ret
urn
on c
apita
l em
ploy
ed$
Perc
enta
ge
of r
etur
n on
cap
ital
empl
oyed
Man
pow
er
(No.
of
empl
oyee
s as
on
31.0
3.20
17)
(1)
(2)
(3)
(4)
(5)
(6)
(7)
(8)
(9)
(10)
(11)
(12)
(13)
(14)
64
Wes
t Ben
gal T
ext
Boo
k C
orpo
ratio
n (P
) L
imite
d (s
ubsi
diar
y of
Sar
asw
aty
Pres
s L
imite
d)
2015
-16
2016
-17
0.10
0.00
33.6
630
8.06
16.3
40.
0036
.50
16.5
949
.14
0
Sect
or-w
ise
tota
l6.
5923
.09
(-)9
3.69
412.
2610
.11
0.00
(-)5
4.97
19.3
40.
0035
7
Tota
l- A
(A
ll se
ctor
wis
e G
over
nmen
t C
ompa
nies
)13
,695
.98
20,8
54.6
9(-
)1,2
00.1
534
,766
.33
(-)1
17.2
9(-
)5.4
835
,196
.74
3,53
4.80
10.0
437
,580
B. W
orki
ng S
tatu
tory
Cor
pora
tion
s
AG
RIC
ULT
UR
E A
ND
AL
LIE
D
1W
est B
enga
l Sta
te
War
ehou
sing
C
orpo
ratio
n20
13-1
420
15-1
67.
610.
007.
508.
432.
660.
0019
.96
2.66
13.3
356
6
Sect
or-w
ise
tota
l7.
610.
007.
508.
432.
660.
0019
.96
2.66
13.3
356
6
FIN
AN
CIN
G
2W
est B
enga
l Fi
nanc
ial C
orpo
ratio
n20
16-1
720
17-1
827
5.35
554.
13(-
)122
.42
78.8
83.
670.
0076
1.73
59.6
77.
8312
1
3
Wes
t Ben
gal
Sche
dule
d C
aste
s an
d Sc
hedu
led
Tri
bes
Dev
elop
men
t and
Fi
nanc
e C
orpo
ratio
n
2016
-17
2017
-18
243.
4290
.29
163.
170.
5547
.64
0.00
464.
2048
.70
10.4
911
5
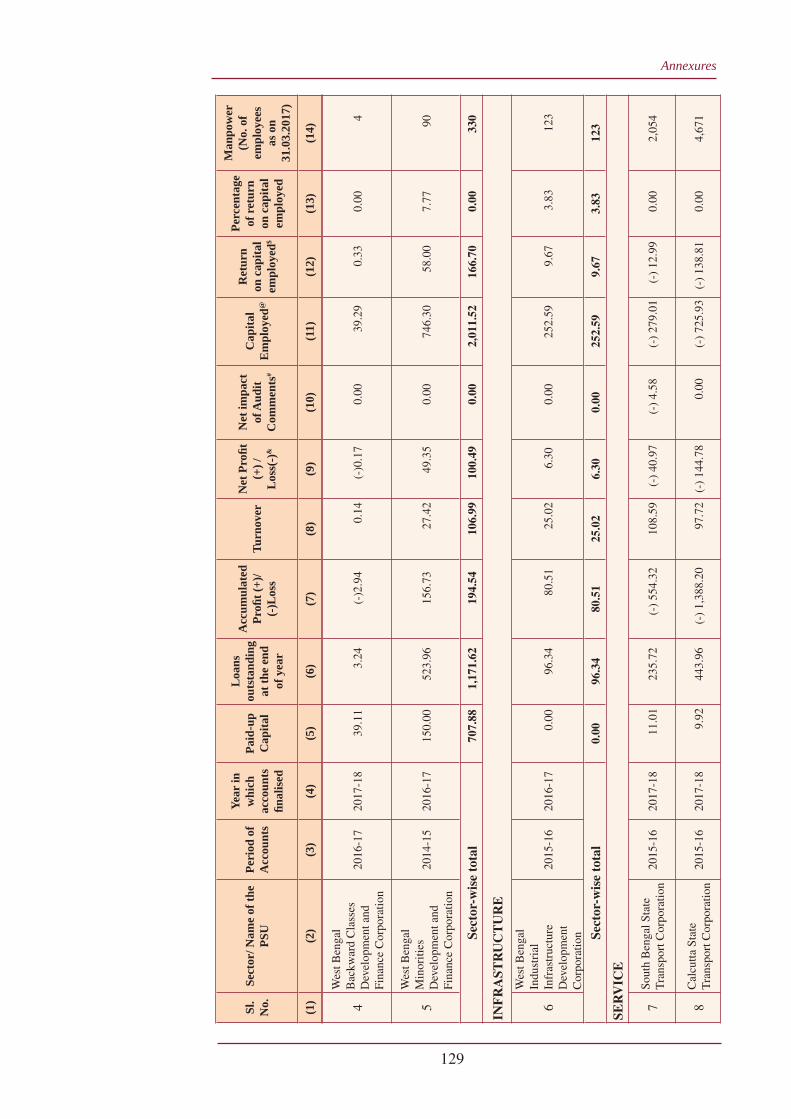
Annexures
129
Sl.
No.
Sect
or/ N
ame
of th
e PS
UPe
riod
of
Acc
ount
s
Year
in
whi
ch
acco
unts
fi n
alis
ed
Paid
-up
Cap
ital
Loa
ns
outs
tand
ing
at th
e en
d of
yea
r
Acc
umul
ated
Pr
ofi t
(+)/
(-)L
oss
Turn
over
Net
Pro
fi t
(+) /
L
oss(
-)&
Net
impa
ct
of A
udit
Com
men
ts#
Cap
ital
Em
ploy
ed@
Ret
urn
on c
apita
l em
ploy
ed$
Perc
enta
ge
of r
etur
n on
cap
ital
empl
oyed
Man
pow
er
(No.
of
empl
oyee
s as
on
31.0
3.20
17)
(1)
(2)
(3)
(4)
(5)
(6)
(7)
(8)
(9)
(10)
(11)
(12)
(13)
(14)
4
Wes
t Ben
gal
Bac
kwar
d C
lass
es
Dev
elop
men
t and
Fi
nanc
e C
orpo
ratio
n
2016
-17
2017
-18
39.1
13.
24(-
)2.9
40.
14(-
)0.1
70.
0039
.29
0.33
0.00
4
5
Wes
t Ben
gal
Min
oriti
es
Dev
elop
men
t and
Fi
nanc
e C
orpo
ratio
n
2014
-15
2016
-17
150.
0052
3.96
156.
7327
.42
49.3
50.
0074
6.30
58.0
07.
7790
Sect
or-w
ise
tota
l70
7.88
1,17
1.62
194.
5410
6.99
100.
490.
002,
011.
5216
6.70
0.00
330
INF
RA
STR
UC
TU
RE
6
Wes
t Ben
gal
Indu
stri
al
Infr
astr
uctu
re
Dev
elop
men
t C
orpo
ratio
n
2015
-16
2016
-17
0.00
96.3
480
.51
25.0
26.
300.
0025
2.59
9.67
3.83
123
Sect
or-w
ise
tota
l0.
0096
.34
80.5
125
.02
6.30
0.00
252.
599.
673.
8312
3
SER
VIC
E
7So
uth
Ben
gal S
tate
T
rans
port
Cor
pora
tion
2015
-16
2017
-18
11.0
123
5.72
(-)
554.
3210
8.59
(-)
40.9
7(-
) 4.
58(-
) 27
9.01
(-)
12.9
90.
002,
054
8C
alcu
tta S
tate
T
rans
port
Cor
pora
tion
2015
-16
2017
-18
9.92
443.
96(-
) 1,
388.
2097
.72
(-)
144.
780.
00(-
) 72
5.93
(-)
138.
810.
004,
671

Audit Report (PSUs) for the year ended 31 March 2017
130
Sl.
No.
Sect
or/ N
ame
of th
e PS
UPe
riod
of
Acc
ount
s
Year
in
whi
ch
acco
unts
fi n
alis
ed
Paid
-up
Cap
ital
Loa
ns
outs
tand
ing
at th
e en
d of
yea
r
Acc
umul
ated
Pr
ofi t
(+)/
(-)L
oss
Turn
over
Net
Pro
fi t
(+) /
L
oss(
-)&
Net
impa
ct
of A
udit
Com
men
ts#
Cap
ital
Em
ploy
ed@
Ret
urn
on c
apita
l em
ploy
ed$
Perc
enta
ge
of r
etur
n on
cap
ital
empl
oyed
Man
pow
er
(No.
of
empl
oyee
s as
on
31.0
3.20
17)
(1)
(2)
(3)
(4)
(5)
(6)
(7)
(8)
(9)
(10)
(11)
(12)
(13)
(14)
9N
orth
Ben
gal S
tate
T
rans
port
Cor
pora
tion
2011
-12
2016
-17
10.7
026
3.77
(-)
507.
2415
8.83
3.70
0.00
(-)
220.
683.
980.
002,
053
Sect
or-w
ise
tota
l31
.64
943.
45(-
) 2,
449.
7636
5.14
(-)
182.
05(-
) 4.
58(-
) 1,
225.
62(-
) 14
7.82
0.00
8,77
8
Tota
l - B
(A
ll se
ctor
-wis
e St
atut
ory
Cor
pora
tion
s)74
7.12
2,21
1.41
(-)
2,16
7.21
505.
58(-
) 72
.60
(-)
4.58
1,05
8.45
31.2
12.
959,
797
Gra
nd T
otal
(A
+B)
14,4
43.1
023
,066
.10
(-)
3,36
7.36
35,2
71.9
1(-
) 18
9.89
(-)
10.0
636
,255
.19
3,56
6.01
9.84
47,3
77
C.
Non
-wor
king
Gov
ernm
ent
Com
pani
es
AG
RIC
ULT
UR
E A
ND
AL
LIE
D
1W
est B
enga
l Tea
D
evel
opm
ent
Cor
pora
tion
Lim
ited
2016
-17
2017
-18
47.2
210
7.73
(-)
374.
380.
00(-
) 0.
670.
00(-
) 21
9.43
(-)
0.67
0.00
17
Sect
or-w
ise
tota
l47
.22
107.
73(-
) 37
4.38
0.00
(-)
0.67
0.00
(-)
219.
43(-
) 0.
670.
0017
FIN
AN
CIN
G
2
Wes
t Ben
gal
Han
dloo
m a
nd
Pow
erlo
om
Dev
elop
men
t C
orpo
ratio
n L
imite
d
2012
-13
2016
-17
46.7
78.
36(-
) 56
.27
0.00
(-)
0.17
(-)
0.41
0.65
(-)
0.08
0.00
9
Sect
or-w
ise
tota
l46
.77
8.36
(-)5
6.27
0.00
(-)
0.17
(-)
0.41
0.65
(-)
0.08
0.00
9
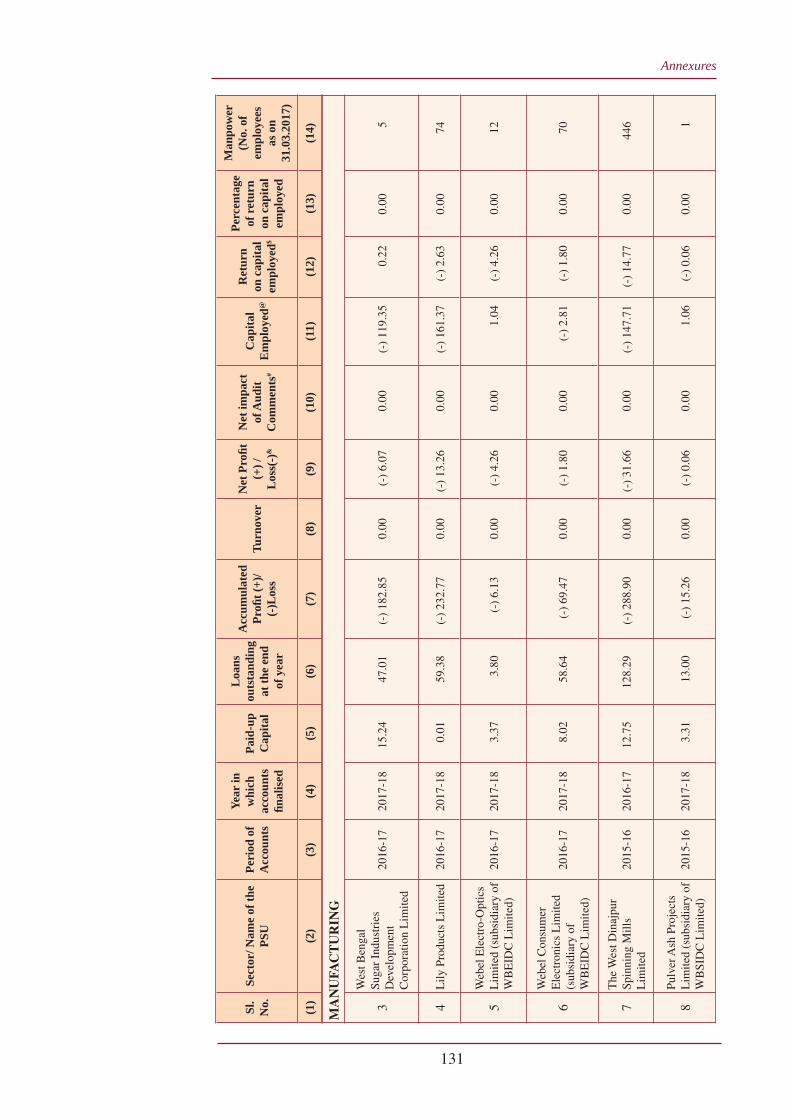
Annexures
131
Sl.
No.
Sect
or/ N
ame
of th
e PS
UPe
riod
of
Acc
ount
s
Year
in
whi
ch
acco
unts
fi n
alis
ed
Paid
-up
Cap
ital
Loa
ns
outs
tand
ing
at th
e en
d of
yea
r
Acc
umul
ated
Pr
ofi t
(+)/
(-)L
oss
Turn
over
Net
Pro
fi t
(+) /
L
oss(
-)&
Net
impa
ct
of A
udit
Com
men
ts#
Cap
ital
Em
ploy
ed@
Ret
urn
on c
apita
l em
ploy
ed$
Perc
enta
ge
of r
etur
n on
cap
ital
empl
oyed
Man
pow
er
(No.
of
empl
oyee
s as
on
31.0
3.20
17)
(1)
(2)
(3)
(4)
(5)
(6)
(7)
(8)
(9)
(10)
(11)
(12)
(13)
(14)
MA
NU
FAC
TU
RIN
G
3
Wes
t Ben
gal
Suga
r In
dust
ries
D
evel
opm
ent
Cor
pora
tion
Lim
ited
2016
-17
2017
-18
15.2
447
.01
(-)
182.
850.
00(-
) 6.
070.
00(-
) 11
9.35
0.22
0.00
5
4L
ily P
rodu
cts
Lim
ited
2016
-17
2017
-18
0.01
59.3
8(-
) 23
2.77
0.00
(-)
13.2
60.
00(-
) 16
1.37
(-)
2.63
0.00
74
5W
ebel
Ele
ctro
-Opt
ics
Lim
ited
(sub
sidi
ary
of
WB
EID
C L
imite
d)20
16-1
720
17-1
83.
373.
80(-
) 6.
130.
00(-
) 4.
260.
001.
04(-
) 4.
260.
0012
6
Web
el C
onsu
mer
E
lect
roni
cs L
imite
d (s
ubsi
diar
y of
W
BE
IDC
Lim
ited)
2016
-17
2017
-18
8.02
58.6
4(-
) 69
.47
0.00
(-)
1.80
0.00
(-)
2.81
(-)
1.80
0.00
70
7T
he W
est D
inaj
pur
Spin
ning
Mill
s L
imite
d20
15-1
620
16-1
712
.75
128.
29(-
) 28
8.90
0.00
(-)
31.6
60.
00(-
) 14
7.71
(-)
14.7
70.
0044
6
8Pu
lver
Ash
Pro
ject
s L
imite
d (s
ubsi
diar
y of
W
BSI
DC
Lim
ited)
2015
-16
2017
-18
3.31
13.0
0(-
) 15
.26
0.00
(-)
0.06
0.00
1.06
(-)
0.06
0.00
1
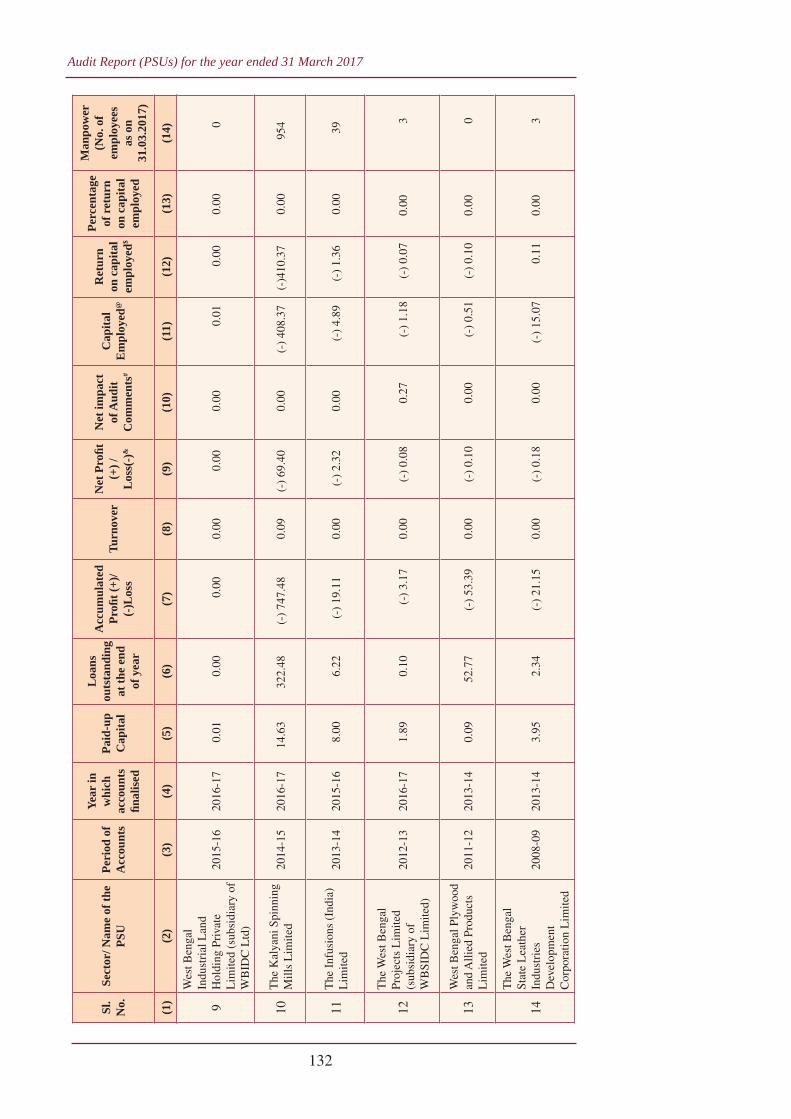
Audit Report (PSUs) for the year ended 31 March 2017
132
Sl.
No.
Sect
or/ N
ame
of th
e PS
UPe
riod
of
Acc
ount
s
Year
in
whi
ch
acco
unts
fi n
alis
ed
Paid
-up
Cap
ital
Loa
ns
outs
tand
ing
at th
e en
d of
yea
r
Acc
umul
ated
Pr
ofi t
(+)/
(-)L
oss
Turn
over
Net
Pro
fi t
(+) /
L
oss(
-)&
Net
impa
ct
of A
udit
Com
men
ts#
Cap
ital
Em
ploy
ed@
Ret
urn
on c
apita
l em
ploy
ed$
Perc
enta
ge
of r
etur
n on
cap
ital
empl
oyed
Man
pow
er
(No.
of
empl
oyee
s as
on
31.0
3.20
17)
(1)
(2)
(3)
(4)
(5)
(6)
(7)
(8)
(9)
(10)
(11)
(12)
(13)
(14)
9
Wes
t Ben
gal
Indu
stri
al L
and
Hol
ding
Pri
vate
L
imite
d (s
ubsi
diar
y of
W
BID
C L
td)
2015
-16
2016
-17
0.01
0.00
0.00
0.00
0.00
0.00
0.01
0.00
0.00
0
10T
he K
alya
ni S
pinn
ing
Mill
s L
imite
d20
14-1
520
16-1
714
.63
322.
48(-
) 74
7.48
0.09
(-)
69.4
00.
00(-
) 40
8.37
(-)4
10.3
70.
0095
4
11T
he I
nfus
ions
(In
dia)
L
imite
d20
13-1
420
15-1
68.
006.
22(-
) 19
.11
0.00
(-)
2.32
0.00
(-)
4.89
(-)
1.36
0.00
39
12
The
Wes
t Ben
gal
Proj
ects
Lim
ited
(sub
sidi
ary
of
WB
SID
C L
imite
d)
2012
-13
2016
-17
1.89
0.10
(-)
3.17
0.00
(-)
0.08
0.27
(-)
1.18
(-)
0.07
0.00
3
13W
est B
enga
l Ply
woo
d an
d A
llied
Pro
duct
s L
imite
d20
11-1
220
13-1
40.
0952
.77
(-)
53.3
90.
00(-
) 0.
100.
00(-
) 0.
51(-
) 0.
100.
000
14
The
Wes
t Ben
gal
Stat
e L
eath
er
Indu
stri
es
Dev
elop
men
t C
orpo
ratio
n L
imite
d
2008
-09
2013
-14
3.95
2.34
(-)
21.1
50.
00(-
) 0.
180.
00(-
) 15
.07
0.11
0.00
3
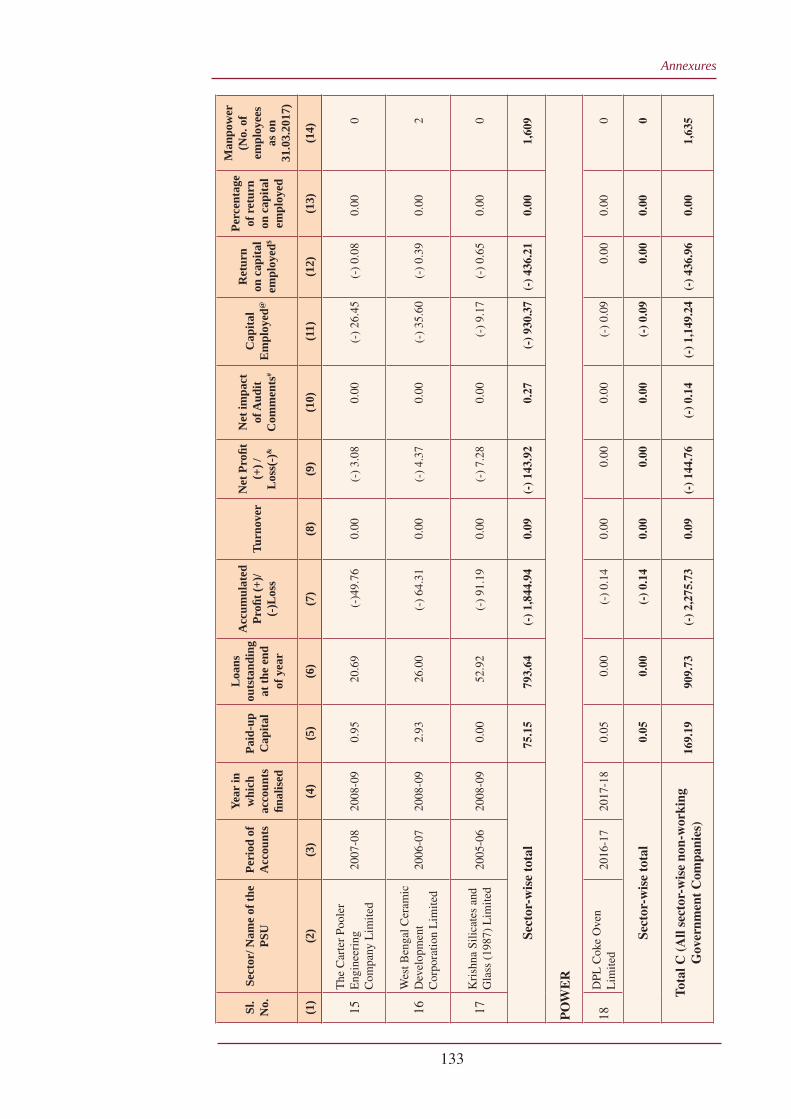
Annexures
133
Sl.
No.
Sect
or/ N
ame
of th
e PS
UPe
riod
of
Acc
ount
s
Year
in
whi
ch
acco
unts
fi n
alis
ed
Paid
-up
Cap
ital
Loa
ns
outs
tand
ing
at th
e en
d of
yea
r
Acc
umul
ated
Pr
ofi t
(+)/
(-)L
oss
Turn
over
Net
Pro
fi t
(+) /
L
oss(
-)&
Net
impa
ct
of A
udit
Com
men
ts#
Cap
ital
Em
ploy
ed@
Ret
urn
on c
apita
l em
ploy
ed$
Perc
enta
ge
of r
etur
n on
cap
ital
empl
oyed
Man
pow
er
(No.
of
empl
oyee
s as
on
31.0
3.20
17)
(1)
(2)
(3)
(4)
(5)
(6)
(7)
(8)
(9)
(10)
(11)
(12)
(13)
(14)
15T
he C
arte
r Po
oler
E
ngin
eeri
ng
Com
pany
Lim
ited
2007
-08
2008
-09
0.95
20.6
9(-
)49.
760.
00(-
) 3.
080.
00(-
) 26
.45
(-)
0.08
0.00
0
16W
est B
enga
l Cer
amic
D
evel
opm
ent
Cor
pora
tion
Lim
ited
2006
-07
2008
-09
2.93
26.0
0(-
) 64
.31
0.00
(-)
4.37
0.00
(-)
35.6
0(-
) 0.
390.
002
17K
rish
na S
ilica
tes
and
Gla
ss (
1987
) L
imite
d20
05-0
620
08-0
90.
0052
.92
(-)
91.1
90.
00(-
) 7.
280.
00(-
) 9.
17(-
) 0.
650.
000
Sect
or-w
ise
tota
l75
.15
793.
64(-
) 1,
844.
940.
09(-
) 14
3.92
0.27
(-)
930.
37(-
) 43
6.21
0.00
1,60
9
PO
WE
R
18D
PL C
oke
Ove
n L
imite
d20
16-1
720
17-1
80.
050.
00(-
) 0.
140.
000.
000.
00(-
) 0.
090.
000.
000
Sect
or-w
ise
tota
l0.
050.
00(-
) 0.
140.
000.
000.
00(-
) 0.
090.
000.
000
Tota
l C (
All
sect
or-w
ise
non-
wor
king
G
over
nmen
t C
ompa
nies
)16
9.19
909.
73(-
) 2,
275.
730.
09(-
) 14
4.76
(-)
0.14
(-)
1,14
9.24
(-)
436.
960.
001,
635

Audit Report (PSUs) for the year ended 31 March 2017
134
Sl.
No.
Sect
or/ N
ame
of th
e PS
UPe
riod
of
Acc
ount
s
Year
in
whi
ch
acco
unts
fi n
alis
ed
Paid
-up
Cap
ital
Loa
ns
outs
tand
ing
at th
e en
d of
yea
r
Acc
umul
ated
Pr
ofi t
(+)/
(-)L
oss
Turn
over
Net
Pro
fi t
(+) /
L
oss(
-)&
Net
impa
ct
of A
udit
Com
men
ts#
Cap
ital
Em
ploy
ed@
Ret
urn
on c
apita
l em
ploy
ed$
Perc
enta
ge
of r
etur
n on
cap
ital
empl
oyed
Man
pow
er
(No.
of
empl
oyee
s as
on
31.0
3.20
17)
(1)
(2)
(3)
(4)
(5)
(6)
(7)
(8)
(9)
(10)
(11)
(12)
(13)
(14)
D
. Non
-wor
king
Sta
tuto
ry C
orpo
rati
on
SE
RV
ICE
1G
reat
Eas
tern
Hot
el
Aut
hori
ty20
15-1
620
16-1
70.
0016
.34
(-)
37.1
60.
000.
010.
00(-
) 20
.74
0.04
0.00
3
Sect
or-w
ise
tota
l0.
0016
.34
(-)
37.1
60.
000.
010.
00(-
) 20
.74
0.04
0.00
3
Tota
l D (
All
sect
or-w
ise
non-
wor
king
St
atut
ory
Cor
pora
tion
)0.
0016
.34
(-)
37.1
60.
000.
010.
00(-
) 20
.74
0.04
0.00
3
Gra
nd t
otal
(C+D
)16
9.19
926.
07(-
) 2,
312.
890.
09(-
) 14
4.75
(-)
0.14
(-)
1,16
9.98
(-)
436.
920.
001,
638
Gra
nd t
otal
(A+B
+C+D
)14
,612
.29
23,9
92.1
7(-
) 5,
680.
2535
,272
.00
(-)
334.
64(-
) 10
.20
35,0
85.2
13,
129.
098.
9249
,015
&
Net
pro
fi t/L
oss
afte
r ta
x in
clud
e ad
just
men
t for
pri
or p
erio
d in
com
e/ e
xpen
ses.
# N
et i
mpa
ct o
f au
dit
com
men
ts i
s ca
lcul
ated
and
den
oted
by
(+)
incr
ease
in
profi
t/ d
ecre
ase
in l
osse
s an
d (-
) de
crea
se i
n pr
ofi t/
in
crea
se in
loss
es.
It c
ompr
ised
of
the
net i
mpa
ct o
f co
mm
ents
of
Stat
utor
y A
udito
rs a
nd C
AG
.@
C
apita
l E
mpl
oyed
rep
rese
nts
Shar
ehol
ders
’ Fu
nds
plus
Lon
g Te
rm B
orro
win
gs e
xcep
t in
cas
e of
fi n
ance
sec
tor
corp
orat
ions
w
here
cap
ital
empl
oyed
is
wor
ked
out
as a
mea
n of
agg
rega
te o
f th
e op
enin
g an
d cl
osin
g ba
lanc
es o
f sh
areh
olde
rs’
fund
plu
s lo
ng-t
erm
bor
row
ings
$
Ret
urn
on C
apita
l Em
ploy
ed h
as b
een
wor
ked
out b
y ad
ding
net
pro
fi t/ l
oss
and
inte
rest
cha
rged
to p
rofi t
and
loss
acc
ount
.
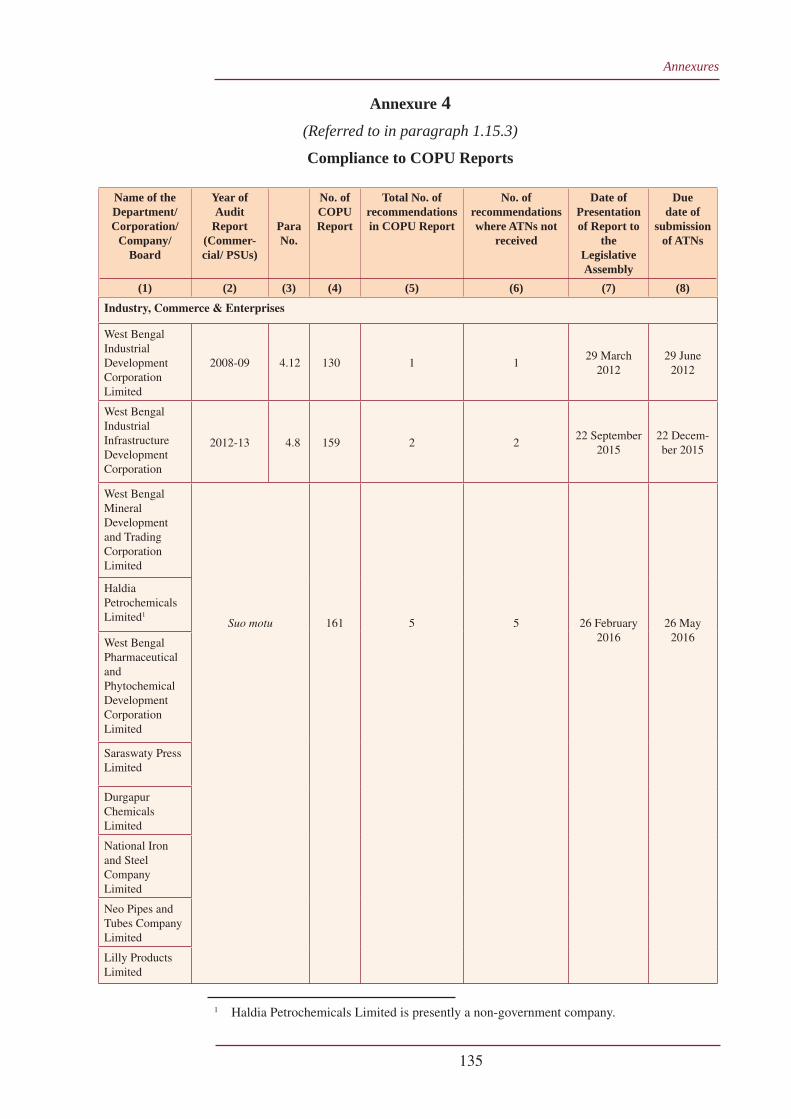
Annexures
135
Annexure 4(Referred to in paragraph 1.15.3)
Compliance to COPU Reports
Name of the Department/ Corporation/
Company/Board
Year of Audit
Report (Commer-cial/ PSUs)
Para No.
No. of COPU Report
Total No. of recommendations in COPU Report
No. of recommendations where ATNs not
received
Date of Presentation of Report to
the Legislative Assembly
Due date of
submission of ATNs
(1) (2) (3) (4) (5) (6) (7) (8)
Industry, Commerce & Enterprises
West Bengal Industrial Development Corporation Limited
2008-09 4.12 130 1 129 March
201229 June
2012
West Bengal Industrial Infrastructure Development Corporation
2012-13 4.8 159 2 222 September
201522 Decem-ber 2015
West Bengal Mineral Development and Trading Corporation Limited
Suo motu 161 5 5 26 February 2016
26 May 2016
Haldia Petrochemicals Limited1
West Bengal Pharmaceutical and Phytochemical Development Corporation Limited
Saraswaty Press Limited
Durgapur Chemicals Limited
National Iron and Steel Company Limited
Neo Pipes and Tubes Company Limited
Lilly Products Limited
1 Haldia Petrochemicals Limited is presently a non-government company.
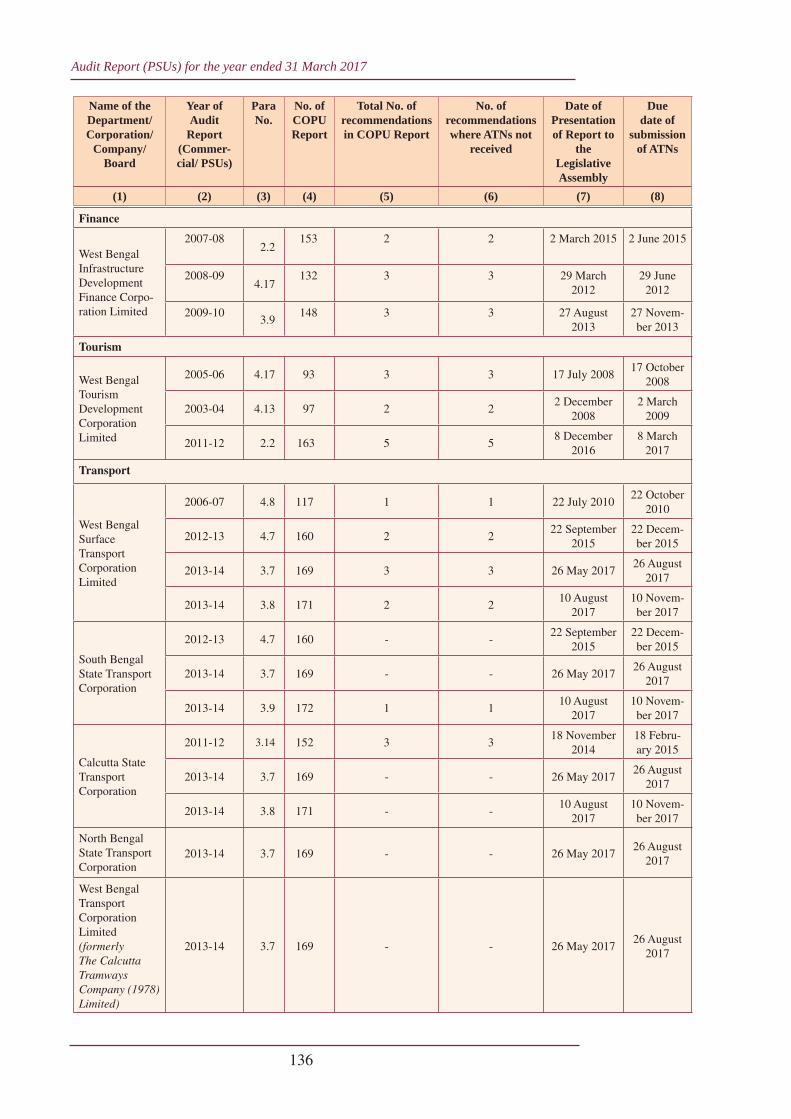
Audit Report (PSUs) for the year ended 31 March 2017
136
Finance
West Bengal Infrastructure Development Finance Corpo-ration Limited
2007-082.2
153 2 2 2 March 2015 2 June 2015
2008-094.17
132 3 3 29 March 2012
29 June 2012
2009-103.9
148 3 3 27 August 2013
27 Novem-ber 2013
Tourism
West Bengal Tourism Development Corporation Limited
2005-06 4.17 93 3 3 17 July 200817 October
2008
2003-04 4.13 97 2 22 December
20082 March
2009
2011-12 2.2 163 5 58 December
20168 March
2017
Transport
West Bengal Surface Transport Corporation Limited
2006-07 4.8 117 1 1 22 July 201022 October
2010
2012-13 4.7 160 2 222 September
201522 Decem-ber 2015
2013-14 3.7 169 3 3 26 May 201726 August
2017
2013-14 3.8 171 2 210 August
201710 Novem-ber 2017
South Bengal State Transport Corporation
2012-13 4.7 160 - -22 September
201522 Decem-ber 2015
2013-14 3.7 169 - - 26 May 201726 August
2017
2013-14 3.9 172 1 110 August
201710 Novem-ber 2017
Calcutta State Transport Corporation
2011-12 3.14 152 3 318 November
201418 Febru-ary 2015
2013-14 3.7 169 - - 26 May 201726 August
2017
2013-14 3.8 171 - -10 August
201710 Novem-ber 2017
North Bengal State Transport Corporation
2013-14 3.7 169 - - 26 May 201726 August
2017
West Bengal Transport Corporation Limited (formerly The Calcutta Tramways Company (1978) Limited)
2013-14 3.7 169 - - 26 May 201726 August
2017
Name of the Department/ Corporation/
Company/Board
Year of Audit
Report (Commer-cial/ PSUs)
Para No.
No. of COPU Report
Total No. of recommendations in COPU Report
No. of recommendations where ATNs not
received
Date of Presentation of Report to
the Legislative Assembly
Due date of
submission of ATNs
(1) (2) (3) (4) (5) (6) (7) (8)
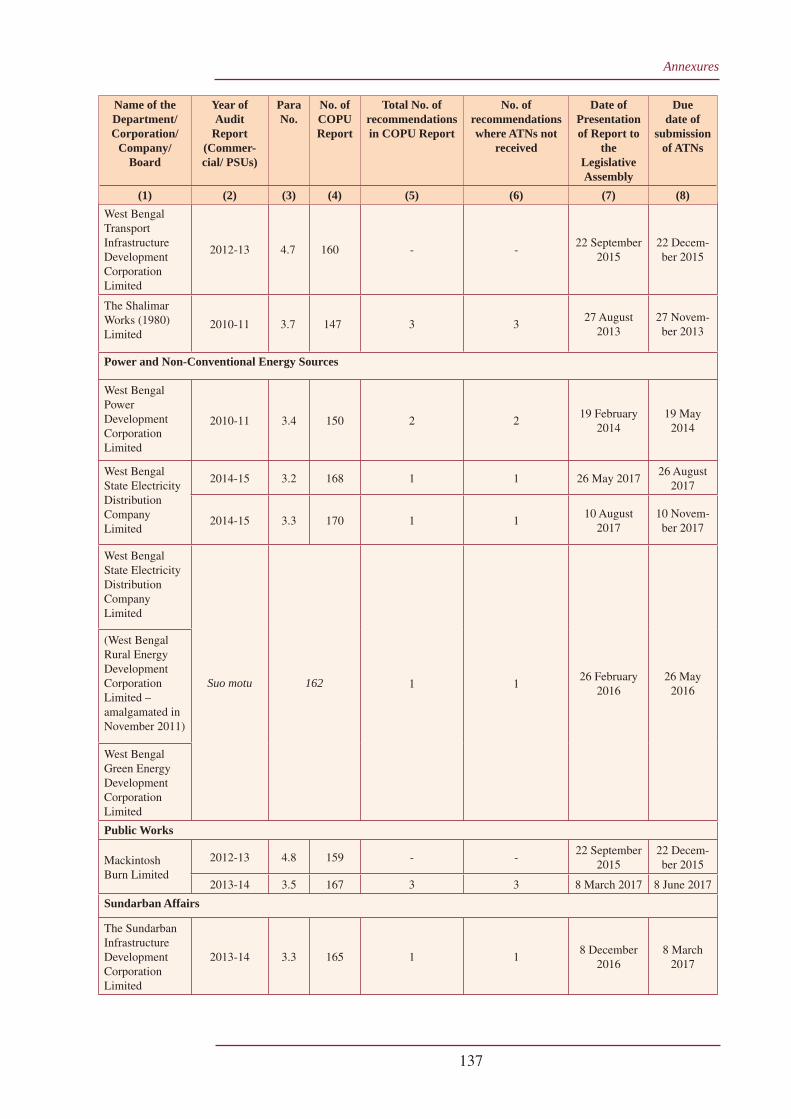
Annexures
137
West Bengal Transport Infrastructure Development Corporation Limited
2012-13 4.7 160 - -22 September
201522 Decem-ber 2015
The Shalimar Works (1980) Limited
2010-11 3.7 147 3 327 August
201327 Novem-ber 2013
Power and Non-Conventional Energy Sources
West Bengal Power Development Corporation Limited
2010-11 3.4 150 2 219 February
201419 May
2014
West Bengal State Electricity Distribution Company Limited
2014-15 3.2 168 1 1 26 May 201726 August
2017
2014-15 3.3 170 1 110 August
201710 Novem-ber 2017
West Bengal State Electricity Distribution Company Limited
Suo motu 162 1 126 February
201626 May
2016
(West Bengal Rural Energy Development Corporation Limited – amalgamated in November 2011)
West Bengal Green Energy Development Corporation Limited
Public Works
Mackintosh Burn Limited
2012-13 4.8 159 - -22 September
201522 Decem-ber 2015
2013-14 3.5 167 3 3 8 March 2017 8 June 2017
Sundarban Affairs
The Sundarban Infrastructure Development Corporation Limited
2013-14 3.3 165 1 18 December
20168 March
2017
Name of the Department/ Corporation/
Company/Board
Year of Audit
Report (Commer-cial/ PSUs)
Para No.
No. of COPU Report
Total No. of recommendations in COPU Report
No. of recommendations where ATNs not
received
Date of Presentation of Report to
the Legislative Assembly
Due date of
submission of ATNs
(1) (2) (3) (4) (5) (6) (7) (8)
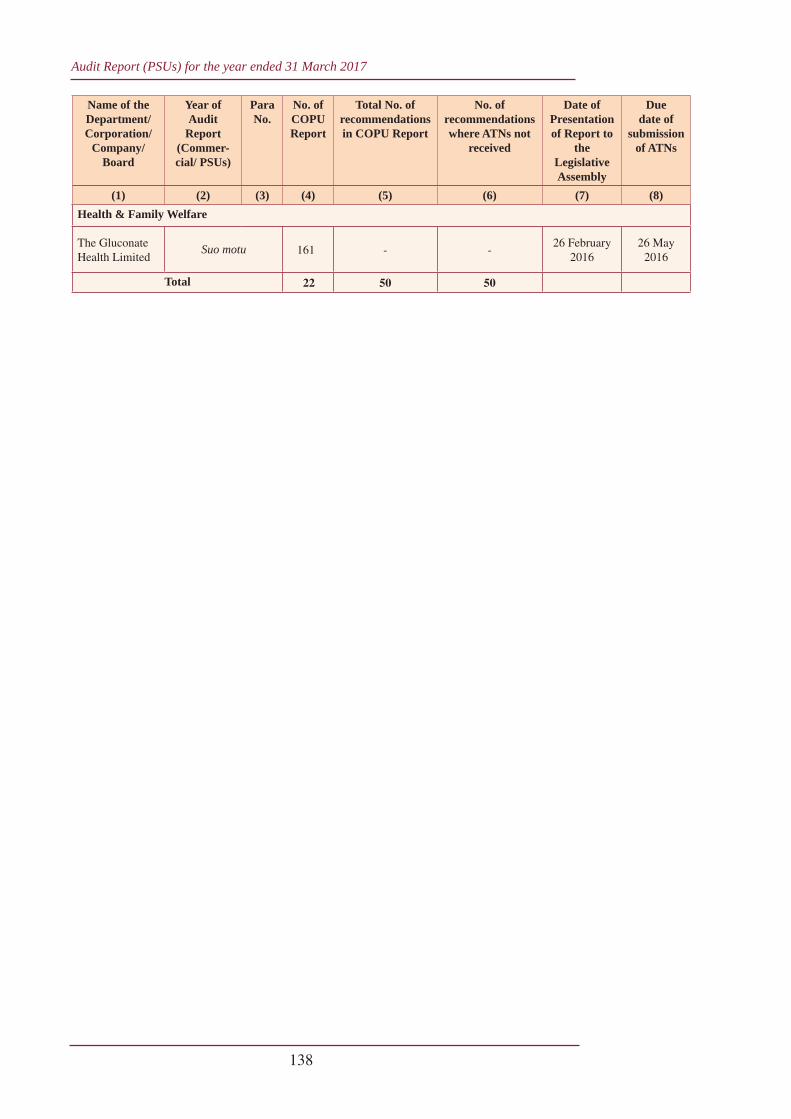
Audit Report (PSUs) for the year ended 31 March 2017
138
Health & Family Welfare
The Gluconate Health Limited
Suo motu 161 - -26 February
201626 May
2016
Total 22 50 50
Name of the Department/ Corporation/
Company/Board
Year of Audit
Report (Commer-cial/ PSUs)
Para No.
No. of COPU Report
Total No. of recommendations in COPU Report
No. of recommendations where ATNs not
received
Date of Presentation of Report to
the Legislative Assembly
Due date of
submission of ATNs
(1) (2) (3) (4) (5) (6) (7) (8)
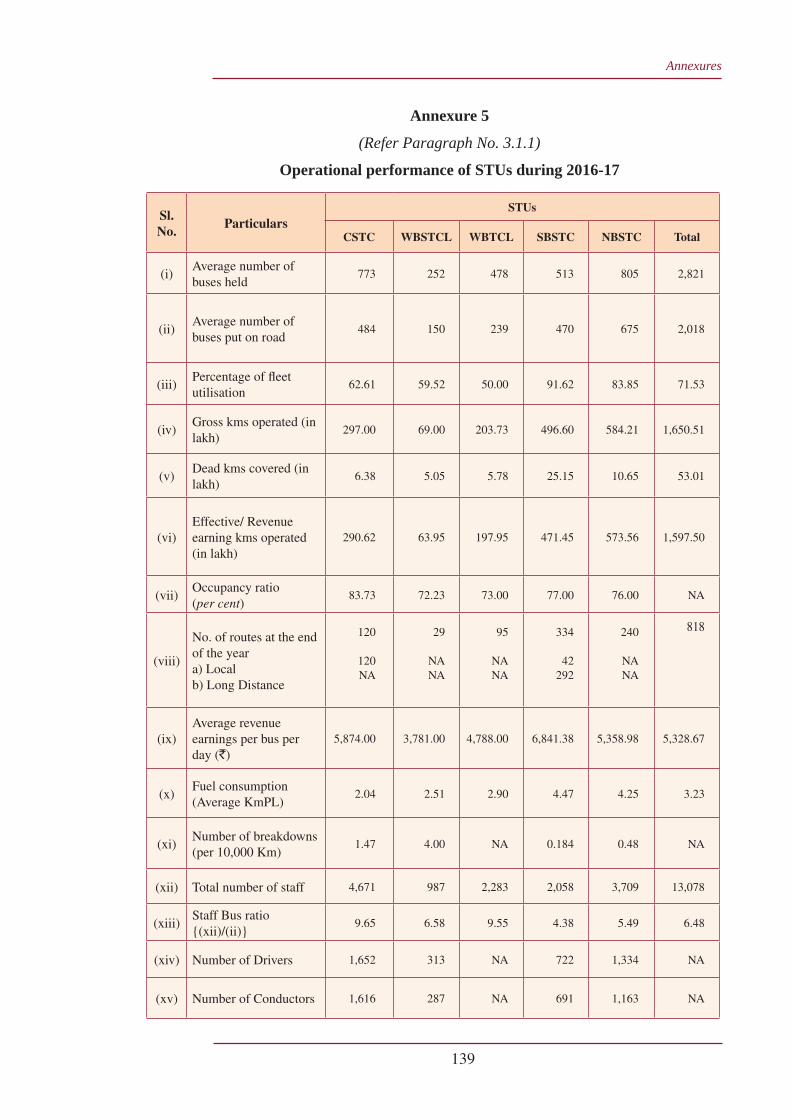
Annexures
139
Annexure 5
(Refer Paragraph No. 3.1.1)
Operational performance of STUs during 2016-17
Sl. No.
ParticularsSTUs
CSTC WBSTCL WBTCL SBSTC NBSTC Total
(i)Average number of buses held
773 252 478 513 805 2,821
(ii)Average number of buses put on road
484 150 239 470 675 2,018
(iii)Percentage of fl eet utilisation
62.61 59.52 50.00 91.62 83.85 71.53
(iv)Gross kms operated (in lakh)
297.00 69.00 203.73 496.60 584.21 1,650.51
(v)Dead kms covered (in lakh)
6.38 5.05 5.78 25.15 10.65 53.01
(vi)Effective/ Revenue earning kms operated (in lakh)
290.62 63.95 197.95 471.45 573.56 1,597.50
(vii)Occupancy ratio (per cent)
83.73 72.23 73.00 77.00 76.00 NA
(viii)
No. of routes at the end of the yeara) Localb) Long Distance
120
120NA
29
NANA
95
NANA
334
42292
240
NANA
818
(ix)Average revenue earnings per bus per day (`)
5,874.00 3,781.00 4,788.00 6,841.38 5,358.98 5,328.67
(x)Fuel consumption (Average KmPL)
2.04 2.51 2.90 4.47 4.25 3.23
(xi)Number of breakdowns (per 10,000 Km)
1.47 4.00 NA 0.184 0.48 NA
(xii) Total number of staff 4,671 987 2,283 2,058 3,709 13,078
(xiii)Staff Bus ratio {(xii)/(ii)}
9.65 6.58 9.55 4.38 5.49 6.48
(xiv) Number of Drivers 1,652 313 NA 722 1,334 NA
(xv) Number of Conductors 1,616 287 NA 691 1,163 NA
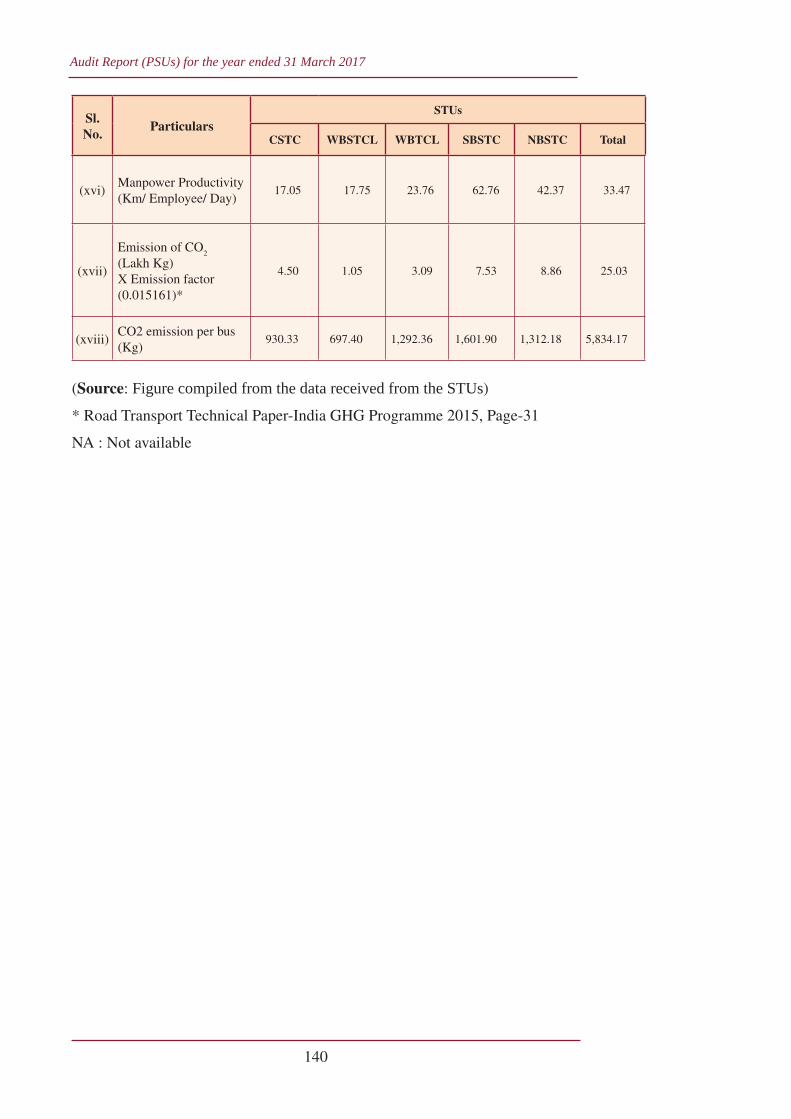
Audit Report (PSUs) for the year ended 31 March 2017
140
(xvi)Manpower Productivity (Km/ Employee/ Day)
17.05 17.75 23.76 62.76 42.37 33.47
(xvii)
Emission of CO2
(Lakh Kg)X Emission factor (0.015161)*
4.50 1.05 3.09 7.53 8.86 25.03
(xviii)CO2 emission per bus (Kg)
930.33 697.40 1,292.36 1,601.90 1,312.18 5,834.17
(Source: Figure compiled from the data received from the STUs)
* Road Transport Technical Paper-India GHG Programme 2015, Page-31
NA : Not available
Sl. No.
ParticularsSTUs
CSTC WBSTCL WBTCL SBSTC NBSTC Total
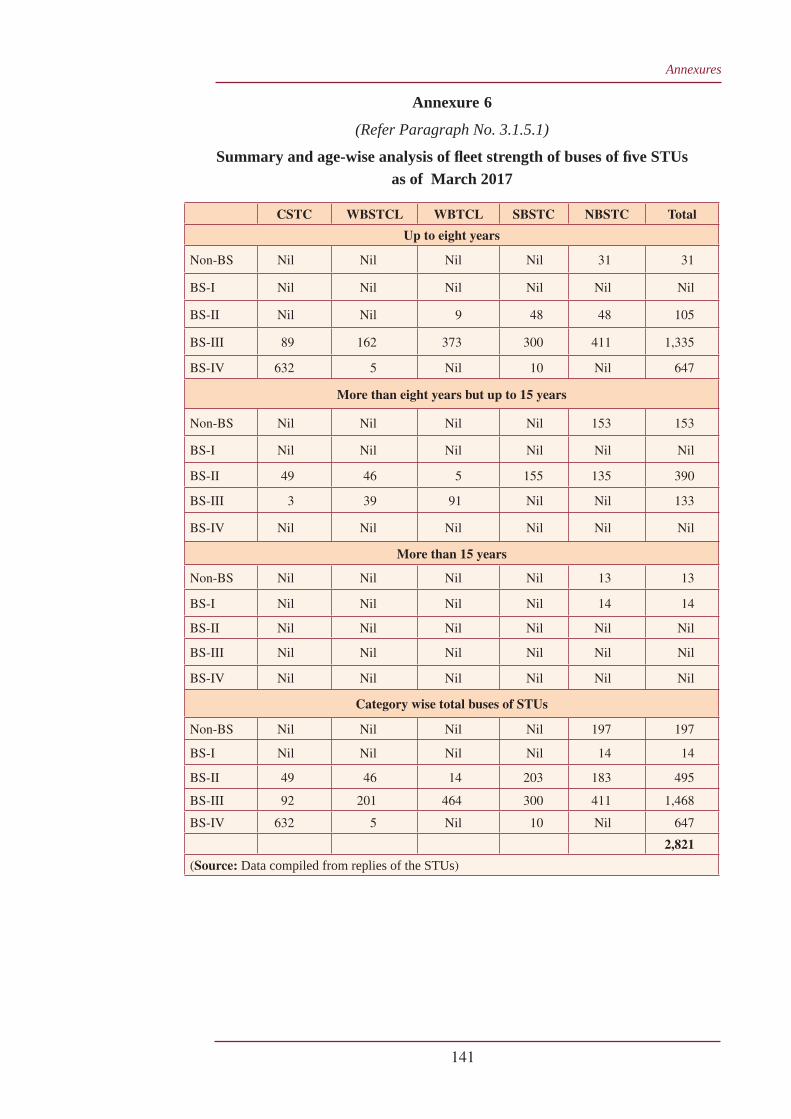
Annexures
141
Annexure 6(Refer Paragraph No. 3.1.5.1)
Summary and age-wise analysis of fl eet strength of buses of fi ve STUs as of March 2017
CSTC WBSTCL WBTCL SBSTC NBSTC Total
Up to eight years
Non-BS Nil Nil Nil Nil 31 31
BS-I Nil Nil Nil Nil Nil Nil
BS-II Nil Nil 9 48 48 105
BS-III 89 162 373 300 411 1,335
BS-IV 632 5 Nil 10 Nil 647
More than eight years but up to 15 years
Non-BS Nil Nil Nil Nil 153 153
BS-I Nil Nil Nil Nil Nil Nil
BS-II 49 46 5 155 135 390
BS-III 3 39 91 Nil Nil 133
BS-IV Nil Nil Nil Nil Nil Nil
More than 15 years
Non-BS Nil Nil Nil Nil 13 13
BS-I Nil Nil Nil Nil 14 14
BS-II Nil Nil Nil Nil Nil Nil
BS-III Nil Nil Nil Nil Nil Nil
BS-IV Nil Nil Nil Nil Nil Nil
Category wise total buses of STUs
Non-BS Nil Nil Nil Nil 197 197
BS-I Nil Nil Nil Nil 14 14
BS-II 49 46 14 203 183 495
BS-III 92 201 464 300 411 1,468
BS-IV 632 5 Nil 10 Nil 647
2,821
(Source: Data compiled from replies of the STUs)
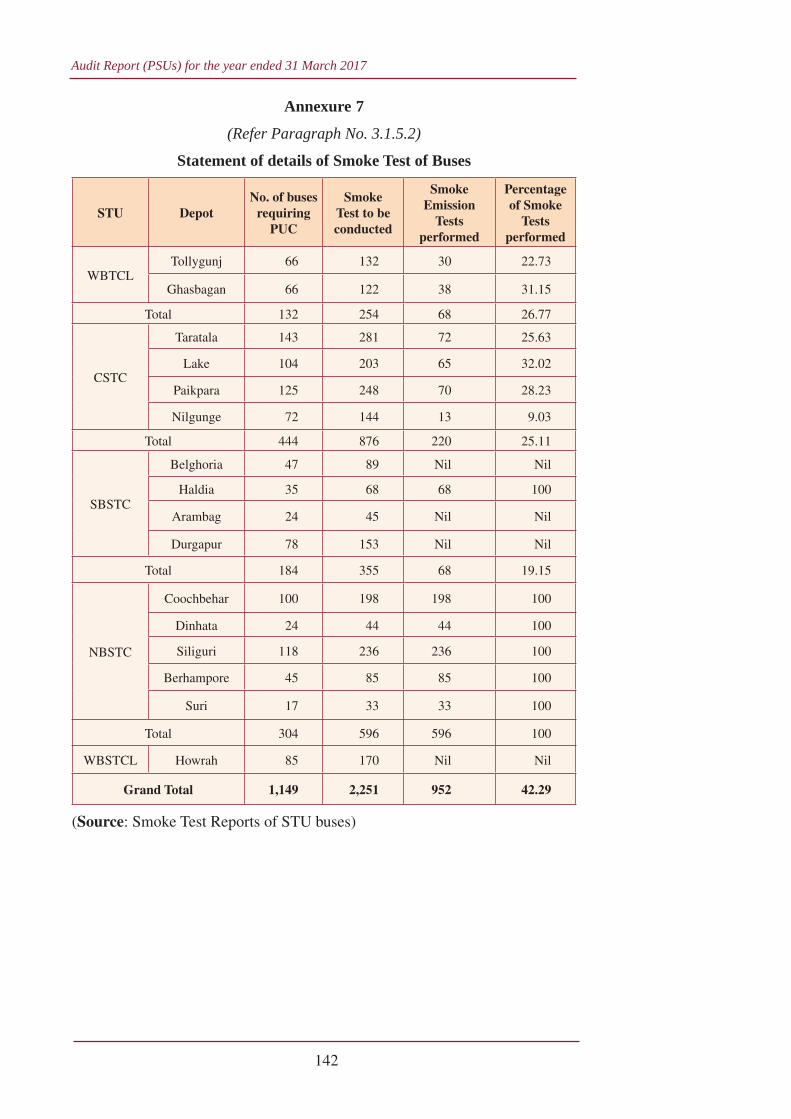
Audit Report (PSUs) for the year ended 31 March 2017
142
Annexure 7(Refer Paragraph No. 3.1.5.2)
Statement of details of Smoke Test of Buses
STU DepotNo. of buses
requiring PUC
Smoke Test to be conducted
Smoke Emission
Tests performed
Percentage of Smoke
Tests performed
WBTCLTollygunj 66 132 30 22.73
Ghasbagan 66 122 38 31.15
Total 132 254 68 26.77
CSTC
Taratala 143 281 72 25.63
Lake 104 203 65 32.02
Paikpara 125 248 70 28.23
Nilgunge 72 144 13 9.03
Total 444 876 220 25.11
SBSTC
Belghoria 47 89 Nil Nil
Haldia 35 68 68 100
Arambag 24 45 Nil Nil
Durgapur 78 153 Nil Nil
Total 184 355 68 19.15
NBSTC
Coochbehar 100 198 198 100
Dinhata 24 44 44 100
Siliguri 118 236 236 100
Berhampore 45 85 85 100
Suri 17 33 33 100
Total 304 596 596 100
WBSTCL Howrah 85 170 Nil Nil
Grand Total 1,149 2,251 952 42.29
(Source: Smoke Test Reports of STU buses)
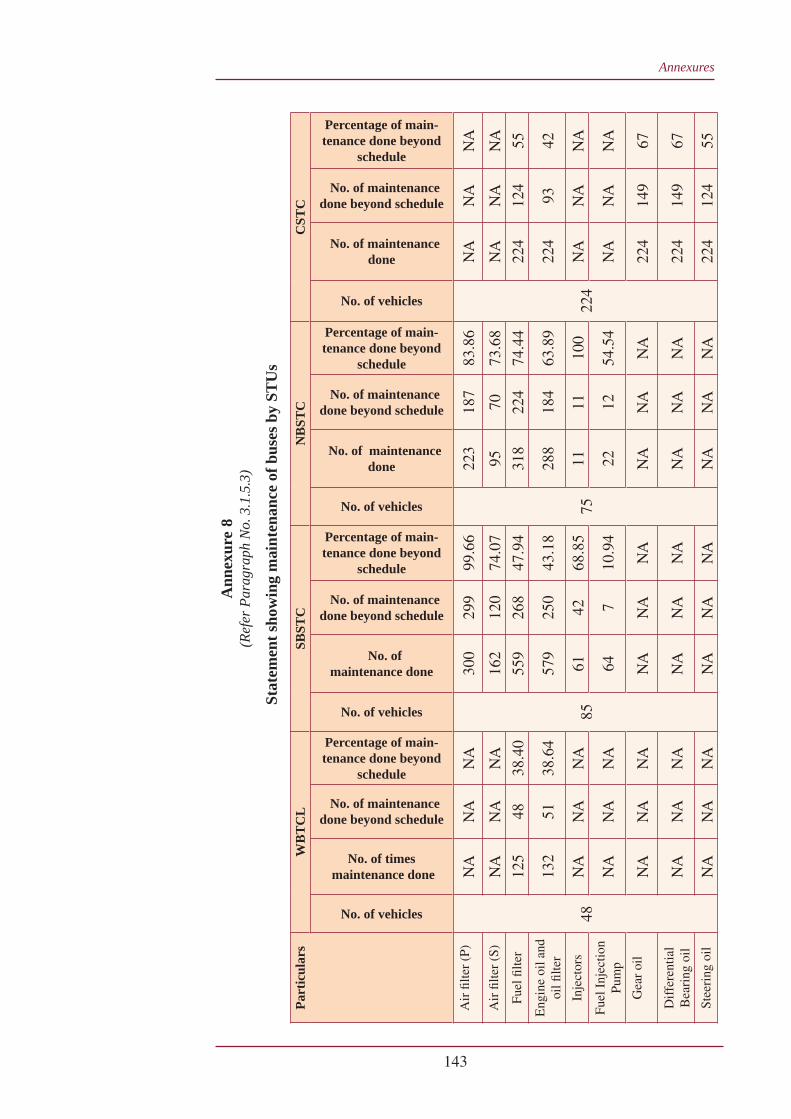
Annexures
143
Ann
exur
e 8(R
efer
Par
agra
ph N
o. 3
.1.5
.3)
Stat
emen
t sho
win
g m
aint
enan
ce o
f bus
es b
y ST
Us
Part
icul
ars
WB
TC
LSB
STC
NB
STC
CST
C
No. of vehicles
No. of times maintenance done
No. of maintenance done beyond schedule
Percentage of main-tenance done beyond
schedule
No. of vehicles
No. of maintenance done
No. of maintenance done beyond schedule
Percentage of main-tenance done beyond
schedule
No. of vehicles
No. of maintenance done
No. of maintenance done beyond schedule
Percentage of main-tenance done beyond
schedule
No. of vehicles
No. of maintenance done
No. of maintenance done beyond schedule
Percentage of main-tenance done beyond
schedule
Air
fi lte
r (P
)
48
NA
NA
NA
85
300
299
99.6
6
75
223
187
83.8
6
224
NA
NA
NA
Air
fi lte
r (S
)N
AN
AN
A16
212
074
.07
9570
73.6
8N
AN
AN
AFu
el fi
lter
125
4838
.40
559
268
47.9
431
822
474
.44
224
124
55E
ngin
e oi
l and
oi
l fi lt
er
132
5138
.64
579
250
43.1
828
818
463
.89
224
9342
Inje
ctor
sN
AN
AN
A61
4268
.85
1111
100
NA
NA
NA
Fuel
Inj
ectio
n Pu
mp
NA
NA
NA
647
10.9
422
1254
.54
NA
NA
NA
Gea
r oi
lN
AN
AN
AN
AN
AN
AN
AN
AN
A22
414
967
Dif
fere
ntia
l B
eari
ng o
ilN
AN
AN
AN
AN
AN
AN
AN
AN
A22
414
967
Stee
ring
oil
NA
NA
NA
NA
NA
NA
NA
NA
NA
224
124
55
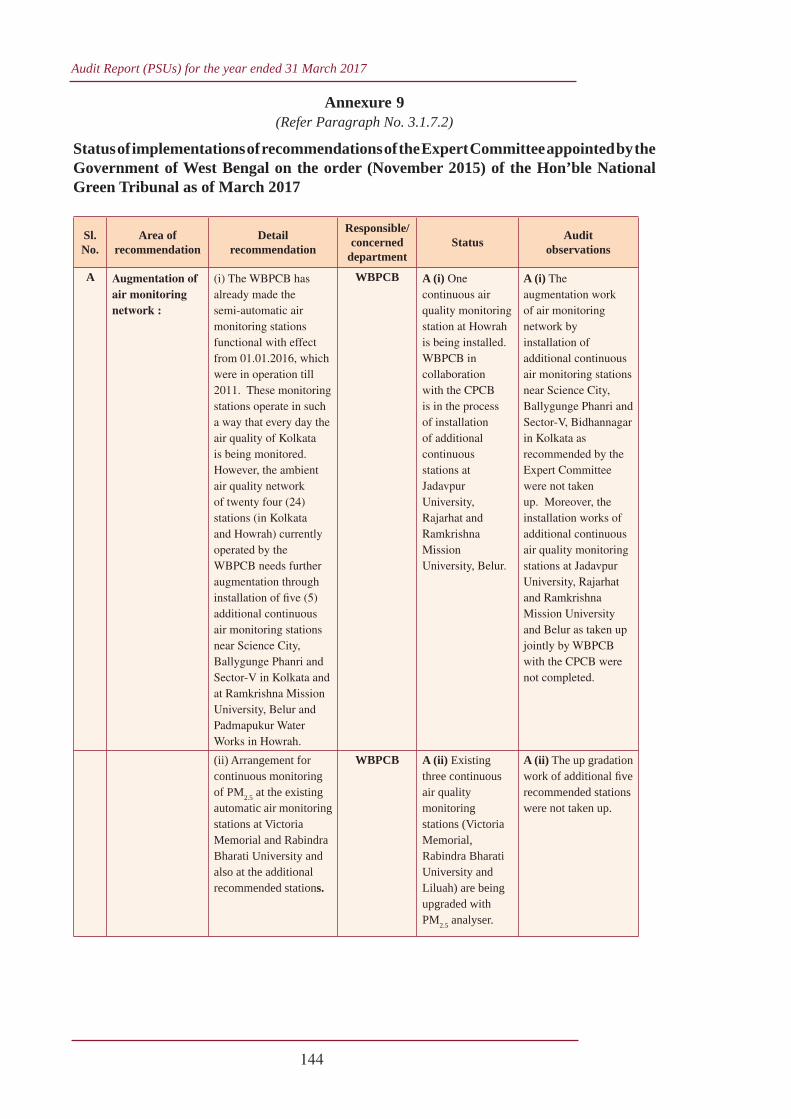
Audit Report (PSUs) for the year ended 31 March 2017
144
Annexure 9(Refer Paragraph No. 3.1.7.2)
Status of implementations of recommendations of the Expert Committee appointed by the Government of West Bengal on the order (November 2015) of the Hon’ble National Green Tribunal as of March 2017
Sl. No.
Area of recommendation
Detail recommendation
Responsible/ concerned
departmentStatus Audit
observations
A Augmentation of air monitoring network :
(i) The WBPCB has already made the semi-automatic air monitoring stations functional with effect from 01.01.2016, which were in operation till 2011. These monitoring stations operate in such a way that every day the air quality of Kolkata is being monitored. However, the ambient air quality network of twenty four (24) stations (in Kolkata and Howrah) currently operated by the WBPCB needs further augmentation through installation of fi ve (5) additional continuous air monitoring stations near Science City, Ballygunge Phanri and Sector-V in Kolkata and at Ramkrishna Mission University, Belur and Padmapukur Water Works in Howrah.
WBPCB A (i) One continuous air quality monitoring station at Howrah is being installed. WBPCB in collaboration with the CPCB is in the process of installation of additional continuous stations at Jadavpur University, Rajarhat and Ramkrishna Mission University, Belur.
A (i) The augmentation work of air monitoring network by installation of additional continuous air monitoring stations near Science City, Ballygunge Phanri and Sector-V, Bidhannagar in Kolkata as recommended by the Expert Committee were not taken up. Moreover, the installation works of additional continuous air quality monitoring stations at Jadavpur University, Rajarhat and Ramkrishna Mission University and Belur as taken up jointly by WBPCB with the CPCB were not completed.
(ii) Arrangement for continuous monitoring of PM2.5 at the existing automatic air monitoring stations at Victoria Memorial and Rabindra Bharati University and also at the additional recommended stations.
WBPCB A (ii) Existing three continuous air quality monitoring stations (Victoria Memorial, Rabindra Bharati University and Liluah) are being upgraded with PM2.5 analyser.
A (ii) The up gradation work of additional fi ve recommended stations were not taken up.
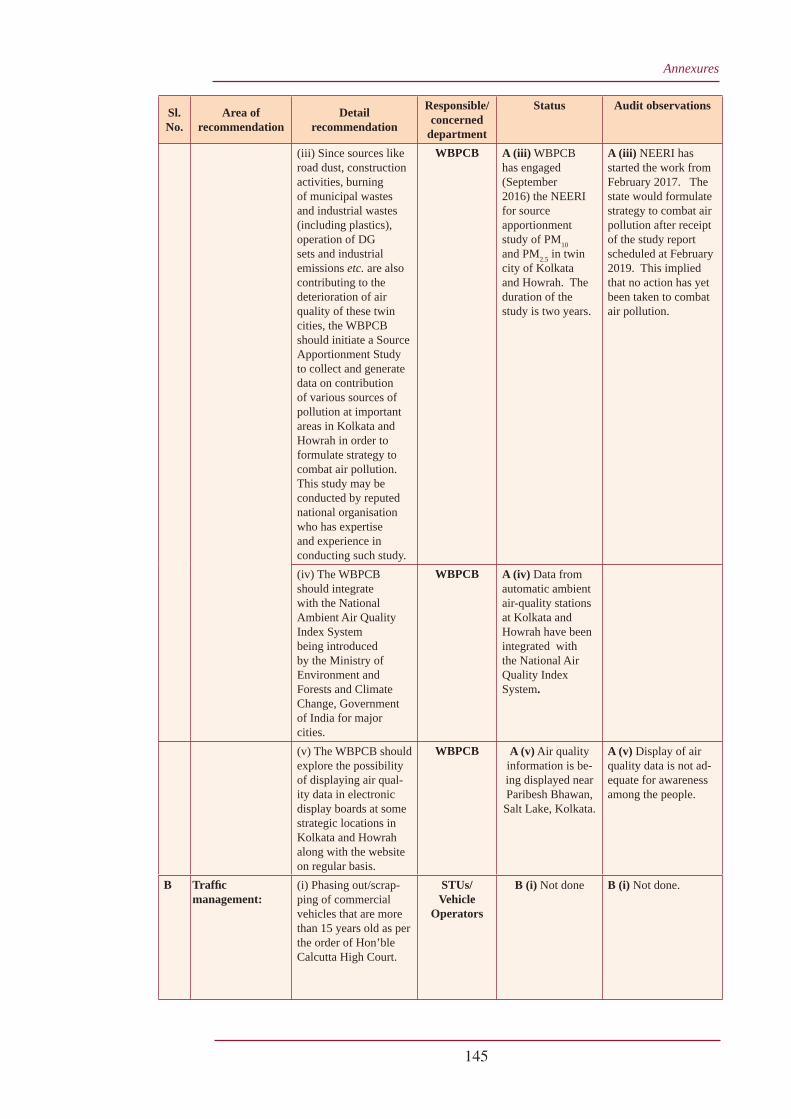
Annexures
145
Sl. No.
Area of recommendation
Detail recommendation
Responsible/ concerned
department
Status Audit observations
(iii) Since sources like road dust, construction activities, burning of municipal wastes and industrial wastes (including plastics), operation of DG sets and industrial emissions etc. are also contributing to the deterioration of air quality of these twin cities, the WBPCB should initiate a Source Apportionment Study to collect and generate data on contribution of various sources of pollution at important areas in Kolkata and Howrah in order to formulate strategy to combat air pollution. This study may be conducted by reputed national organisation who has expertise and experience in conducting such study.
WBPCB A (iii) WBPCB has engaged (September 2016) the NEERI for source apportionment study of PM10 and PM2.5 in twin city of Kolkata and Howrah. The duration of the study is two years.
A (iii) NEERI has started the work from February 2017. The state would formulate strategy to combat air pollution after receipt of the study report scheduled at February 2019. This implied that no action has yet been taken to combat air pollution.
(iv) The WBPCB should integrate with the National Ambient Air Quality Index System being introduced by the Ministry of Environment and Forests and Climate Change, Government of India for major cities.
WBPCB A (iv) Data from automatic ambient air-quality stations at Kolkata and Howrah have been integrated with the National Air Quality Index System.
(v) The WBPCB should explore the possibility of displaying air qual-ity data in electronic display boards at some strategic locations in Kolkata and Howrah along with the website on regular basis.
WBPCB A (v) Air quality information is be-ing displayed near Paribesh Bhawan, Salt Lake, Kolkata.
A (v) Display of air quality data is not ad-equate for awareness among the people.
B Traffi c management:
(i) Phasing out/scrap-ping of commercial vehicles that are more than 15 years old as per the order of Hon’ble Calcutta High Court.
STUs/ Vehicle
Operators
B (i) Not done B (i) Not done.
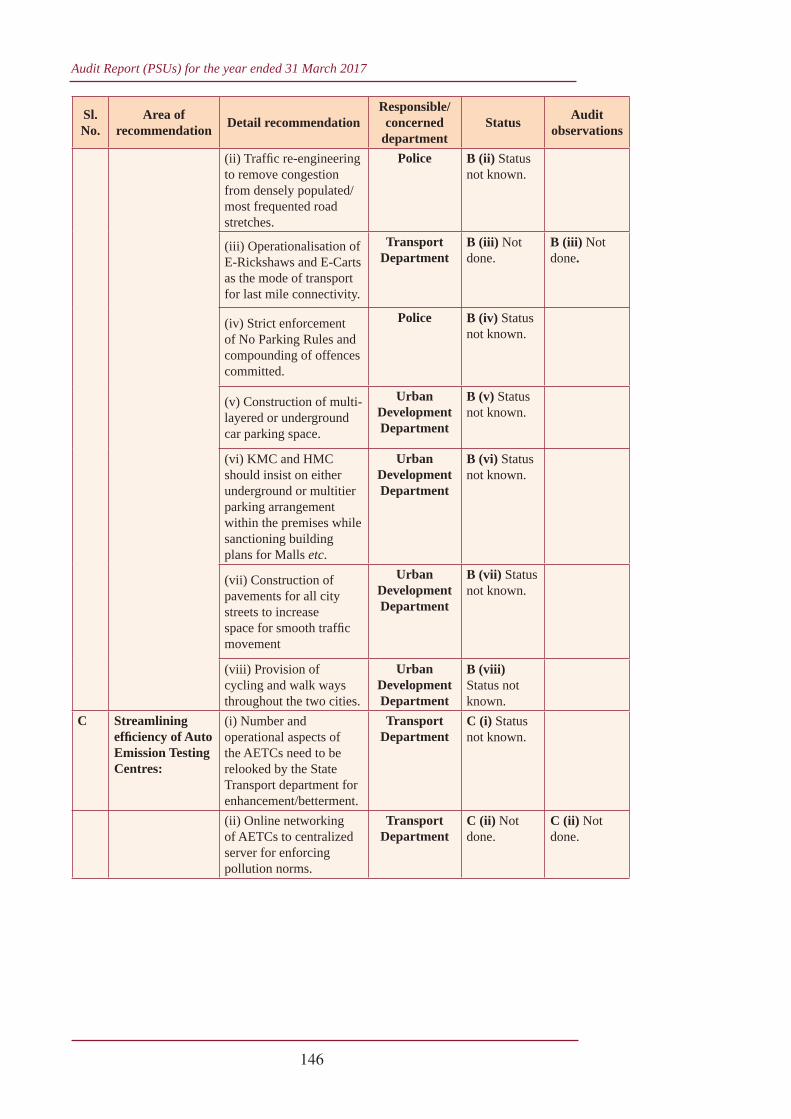
Audit Report (PSUs) for the year ended 31 March 2017
146
Sl. No.
Area of recommendation Detail recommendation
Responsible/ concerned
departmentStatus Audit
observations
(ii) Traffi c re-engineering to remove congestion from densely populated/most frequented road stretches.
Police B (ii) Status not known.
(iii) Operationalisation of E-Rickshaws and E-Carts as the mode of transport for last mile connectivity.
Transport Department
B (iii) Not done.
B (iii) Not done.
(iv) Strict enforcement of No Parking Rules and compounding of offences committed.
Police B (iv) Status not known.
(v) Construction of multi-layered or underground car parking space.
Urban Development Department
B (v) Status not known.
(vi) KMC and HMC should insist on either underground or multitier parking arrangement within the premises while sanctioning building plans for Malls etc.
Urban Development Department
B (vi) Status not known.
(vii) Construction of pavements for all city streets to increase space for smooth traffi c movement
Urban Development Department
B (vii) Status not known.
(viii) Provision of cycling and walk ways throughout the two cities.
Urban Development Department
B (viii) Status not known.
C Streamlining effi ciency of Auto Emission Testing Centres:
(i) Number and operational aspects of the AETCs need to be relooked by the State Transport department for enhancement/betterment.
Transport Department
C (i) Status not known.
(ii) Online networking of AETCs to centralized server for enforcing pollution norms.
Transport Department
C (ii) Not done.
C (ii) Not done.
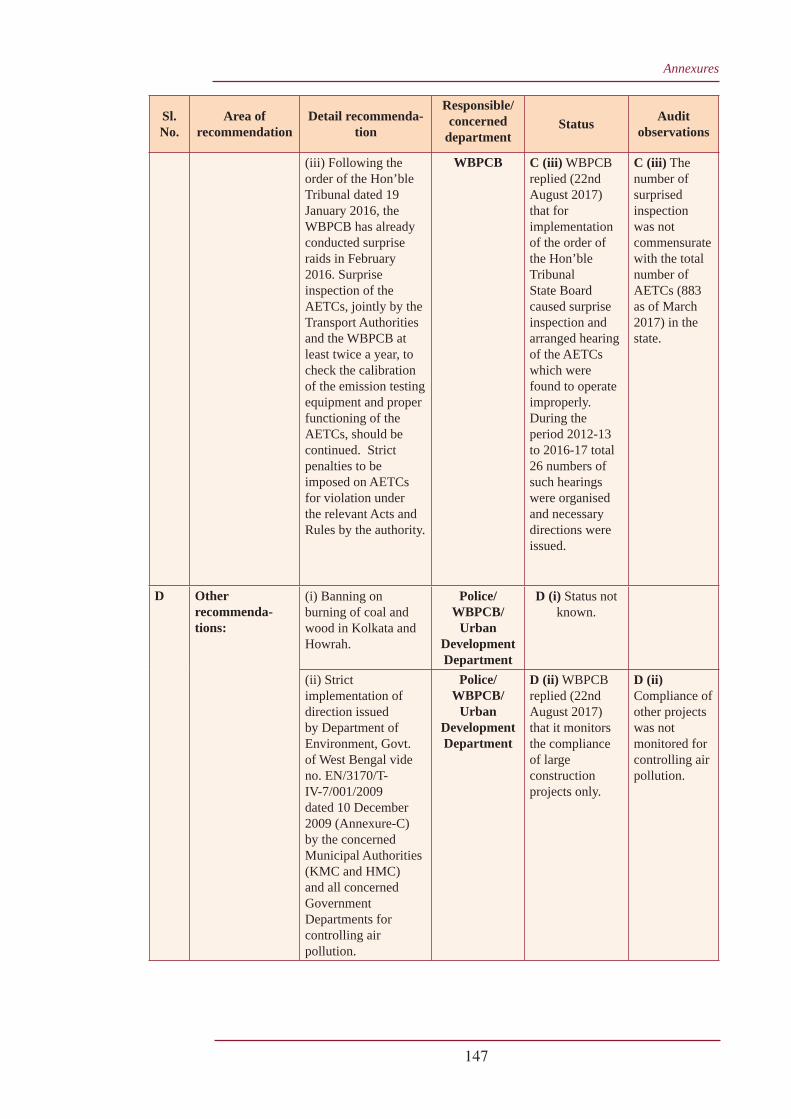
Annexures
147
Sl. No.
Area of recommendation
Detail recommenda-tion
Responsible/ concerned
departmentStatus Audit
observations
(iii) Following the order of the Hon’ble Tribunal dated 19 January 2016, the WBPCB has already conducted surprise raids in February 2016. Surprise inspection of the AETCs, jointly by the Transport Authorities and the WBPCB at least twice a year, to check the calibration of the emission testing equipment and proper functioning of the AETCs, should be continued. Strict penalties to be imposed on AETCs for violation under the relevant Acts and Rules by the authority.
WBPCB C (iii) WBPCB replied (22nd August 2017) that for implementation of the order of the Hon’ble Tribunal State Board caused surprise inspection and arranged hearing of the AETCs which were found to operate improperly. During the period 2012-13 to 2016-17 total 26 numbers of such hearings were organised and necessary directions were issued.
C (iii) The number of surprised inspection was not commensurate with the total number of AETCs (883 as of March 2017) in the state.
D Other recommenda-tions:
(i) Banning on burning of coal and wood in Kolkata and Howrah.
Police/ WBPCB/
Urban Development Department
D (i) Status not known.
(ii) Strict implementation of direction issued by Department of Environment, Govt. of West Bengal vide no. EN/3170/T-IV-7/001/2009 dated 10 December 2009 (Annexure-C) by the concerned Municipal Authorities (KMC and HMC) and all concerned Government Departments for controlling air pollution.
Police/ WBPCB/
Urban Development Department
D (ii) WBPCB replied (22nd August 2017) that it monitors the compliance of large construction projects only.
D (ii) Compliance of other projects was not monitored for controlling air pollution.
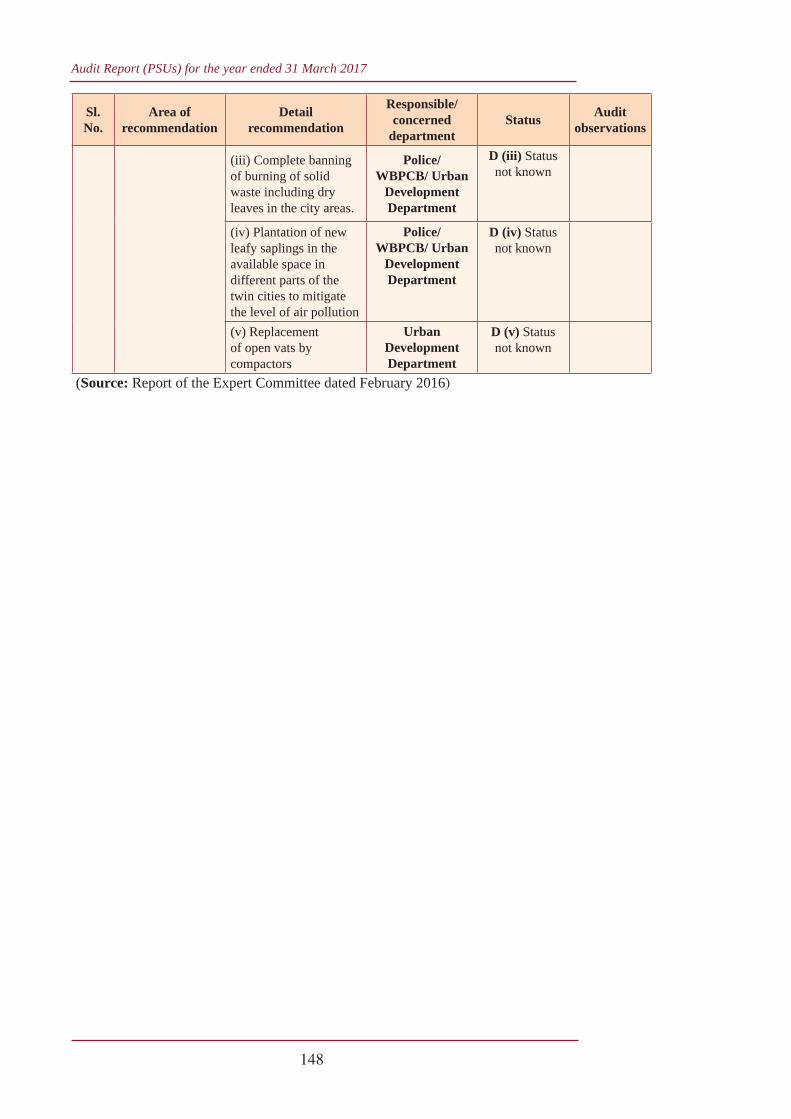
Audit Report (PSUs) for the year ended 31 March 2017
148
Sl. No.
Area of recommendation
Detail recommendation
Responsible/ concerned
departmentStatus Audit
observations
(iii) Complete banning of burning of solid waste including dry leaves in the city areas.
Police/ WBPCB/ Urban
Development Department
D (iii) Status not known
(iv) Plantation of new leafy saplings in the available space in different parts of the twin cities to mitigate the level of air pollution
Police/ WBPCB/ Urban
Development Department
D (iv) Status not known
(v) Replacement of open vats by compactors
Urban Development Department
D (v) Status not known
(Source: Report of the Expert Committee dated February 2016)
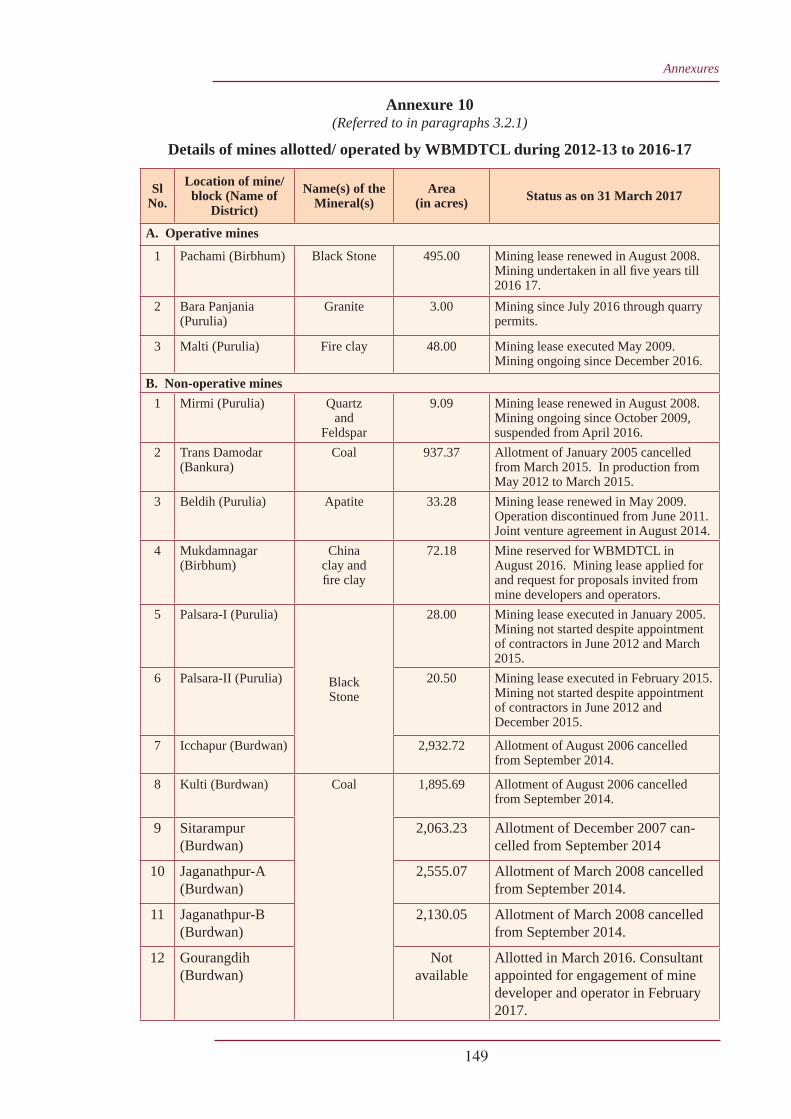
Annexures
149
Annexure 10(Referred to in paragraphs 3.2.1)
Details of mines allotted/ operated by WBMDTCL during 2012-13 to 2016-17
Sl No.
Location of mine/ block (Name of
District)Name(s) of the
Mineral(s)Area
(in acres) Status as on 31 March 2017
A. Operative mines
1 Pachami (Birbhum) Black Stone 495.00 Mining lease renewed in August 2008. Mining undertaken in all fi ve years till 2016 17.
2 Bara Panjania (Purulia)
Granite 3.00 Mining since July 2016 through quarry permits.
3 Malti (Purulia) Fire clay 48.00 Mining lease executed May 2009. Mining ongoing since December 2016.
B. Non-operative mines1 Mirmi (Purulia) Quartz
andFeldspar
9.09 Mining lease renewed in August 2008. Mining ongoing since October 2009, suspended from April 2016.
2 Trans Damodar (Bankura)
Coal 937.37 Allotment of January 2005 cancelled from March 2015. In production from May 2012 to March 2015.
3 Beldih (Purulia) Apatite 33.28 Mining lease renewed in May 2009. Operation discontinued from June 2011. Joint venture agreement in August 2014.
4 Mukdamnagar (Birbhum)
China clay and fi re clay
72.18 Mine reserved for WBMDTCL in August 2016. Mining lease applied for and request for proposals invited from mine developers and operators.
5 Palsara-I (Purulia)
Black Stone
28.00 Mining lease executed in January 2005. Mining not started despite appointment of contractors in June 2012 and March 2015.
6 Palsara-II (Purulia) 20.50 Mining lease executed in February 2015. Mining not started despite appointment of contractors in June 2012 and December 2015.
7 Icchapur (Burdwan) 2,932.72 Allotment of August 2006 cancelled from September 2014.
8 Kulti (Burdwan) Coal 1,895.69 Allotment of August 2006 cancelled from September 2014.
9 Sitarampur (Burdwan)
2,063.23 Allotment of December 2007 can-celled from September 2014
10 Jaganathpur-A (Burdwan)
2,555.07 Allotment of March 2008 cancelled from September 2014.
11 Jaganathpur-B (Burdwan)
2,130.05 Allotment of March 2008 cancelled from September 2014.
12 Gourangdih (Burdwan)
Not available
Allotted in March 2016. Consultant appointed for engagement of mine developer and operator in February 2017.
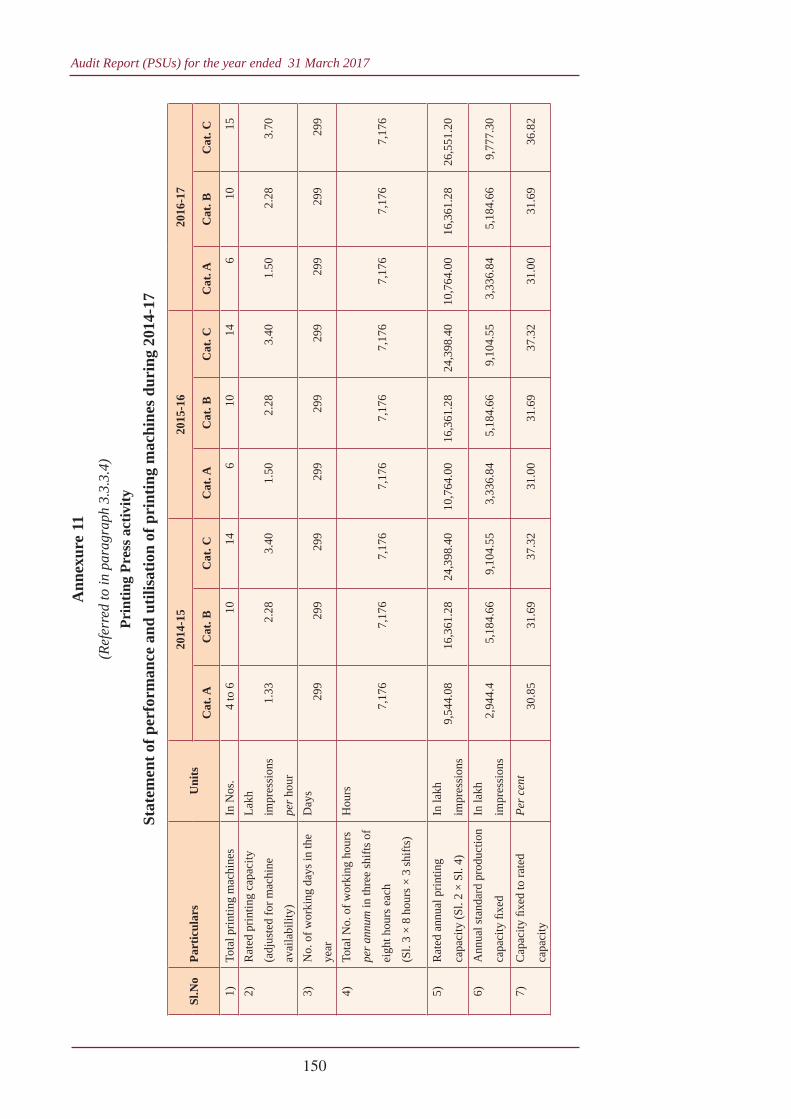
Audit Report (PSUs) for the year ended 31 March 2017
150
Ann
exur
e 11
(Ref
erre
d to
in p
arag
raph
3.3
.3.4
)Pr
intin
g Pr
ess a
ctiv
itySt
atem
ent o
f per
form
ance
and
util
isat
ion
of p
rint
ing
mac
hine
s dur
ing
2014
-17
Sl.N
oPa
rtic
ular
sU
nits
2014
-15
2015
-16
2016
-17
Cat
. AC
at. B
Cat
. CC
at. A
Cat
. BC
at. C
Cat
. AC
at. B
Cat
. C
1)To
tal p
rintin
g m
achi
nes
In N
os.
4 to
610
146
1014
610
152)
Rat
ed p
rintin
g ca
paci
ty
(adj
uste
d fo
r mac
hine
avai
labi
lity)
Lakh
impr
essi
ons
per h
our
1.33
2.28
3.40
1.50
2.28
3.40
1.50
2.28
3.70
3)N
o. o
f wor
king
day
s in
the
year
Day
s29
929
929
929
929
929
929
929
929
9
4)To
tal N
o. o
f wor
king
hou
rs
per a
nnum
in th
ree
shift
s of
eigh
t hou
rs e
ach
(Sl.
3 ×
8 ho
urs ×
3 sh
ifts)
Hou
rs
7,17
67,
176
7,17
67,
176
7,17
67,
176
7,17
67,
176
7,17
6
5)R
ated
ann
ual p
rintin
g
capa
city
(Sl.
2 ×
Sl. 4
)
In la
kh
impr
essi
ons
9,54
4.08
16,3
61.2
824
,398
.40
10,7
64.0
016
,361
.28
24,3
98.4
010
,764
.00
16,3
61.2
826
,551
.20
6)A
nnua
l sta
ndar
d pr
oduc
tion
capa
city
fi xe
d
In la
kh
impr
essi
ons
2,94
4.4
5,18
4.66
9,10
4.55
3,33
6.84
5,18
4.66
9,10
4.55
3,33
6.84
5,18
4.66
9,77
7.30
7)C
apac
ity fi
xed
to ra
ted
capa
city
Per c
ent
30.8
531
.69
37.3
231
.00
31.6
937
.32
31.0
031
.69
36.8
2
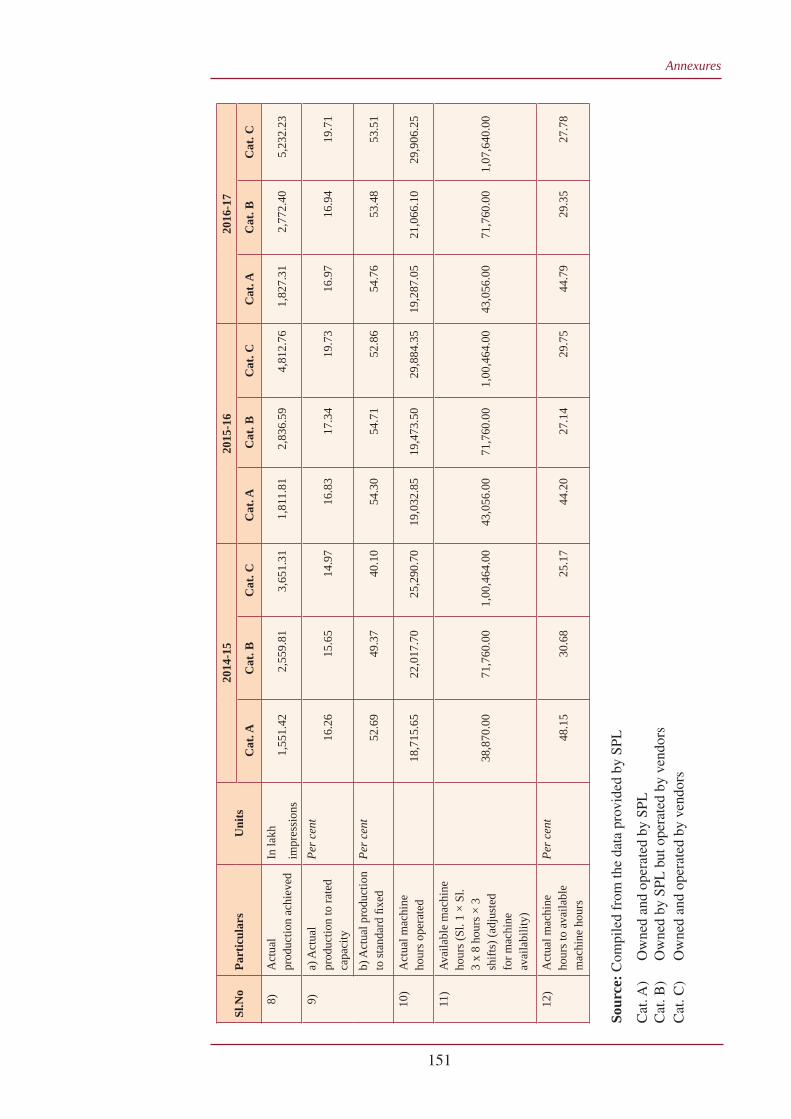
Annexures
151
Sl.N
oPa
rtic
ular
sU
nits
2014
-15
2015
-16
2016
-17
Cat
. AC
at. B
Cat
. CC
at. A
Cat
. BC
at. C
Cat
. AC
at. B
Cat
. C
8)A
ctua
lpr
oduc
tion
achi
eved
In la
kh
impr
essi
ons
1,55
1.42
2,55
9.81
3,65
1.31
1,81
1.81
2,83
6.59
4,81
2.76
1,82
7.31
2,77
2.40
5,23
2.23
9)a)
Act
ual
prod
uctio
n to
rate
dca
paci
ty
Per c
ent
16.2
615
.65
14.9
716
.83
17.3
419
.73
16.9
716
.94
19.7
1
b) A
ctua
l pro
duct
ion
to st
anda
rd fi
xed
Per c
ent
52.6
949
.37
40.1
054
.30
54.7
152
.86
54.7
653
.48
53.5
1
10)
Act
ual m
achi
neho
urs o
pera
ted
18,7
15.6
522
,017
.70
25,2
90.7
019
,032
.85
19,4
73.5
029
,884
.35
19,2
87.0
521
,066
.10
29,9
06.2
5
11)
Avai
labl
e m
achi
neho
urs (
Sl. 1
× S
l.3
x 8
hour
s × 3
shift
s) (a
djus
ted
for m
achi
neav
aila
bilit
y)
38,8
70.0
071
,760
.00
1,00
,464
.00
43,0
56.0
071
,760
.00
1,00
,464
.00
43,0
56.0
071
,760
.00
1,07
,640
.00
12)
Act
ual m
achi
neho
urs t
o av
aila
ble
mac
hine
hou
rs
Per c
ent
48.1
530
.68
25.1
744
.20
27.1
429
.75
44.7
929
.35
27.7
8
Sour
ce: C
ompi
led
from
the
data
pro
vide
d by
SPL
Cat
. A)
O
wne
d an
d op
erat
ed b
y SP
LC
at. B
)
Ow
ned
by S
PL b
ut o
pera
ted
by v
endo
rsC
at. C
)
Ow
ned
and
oper
ated
by
vend
ors
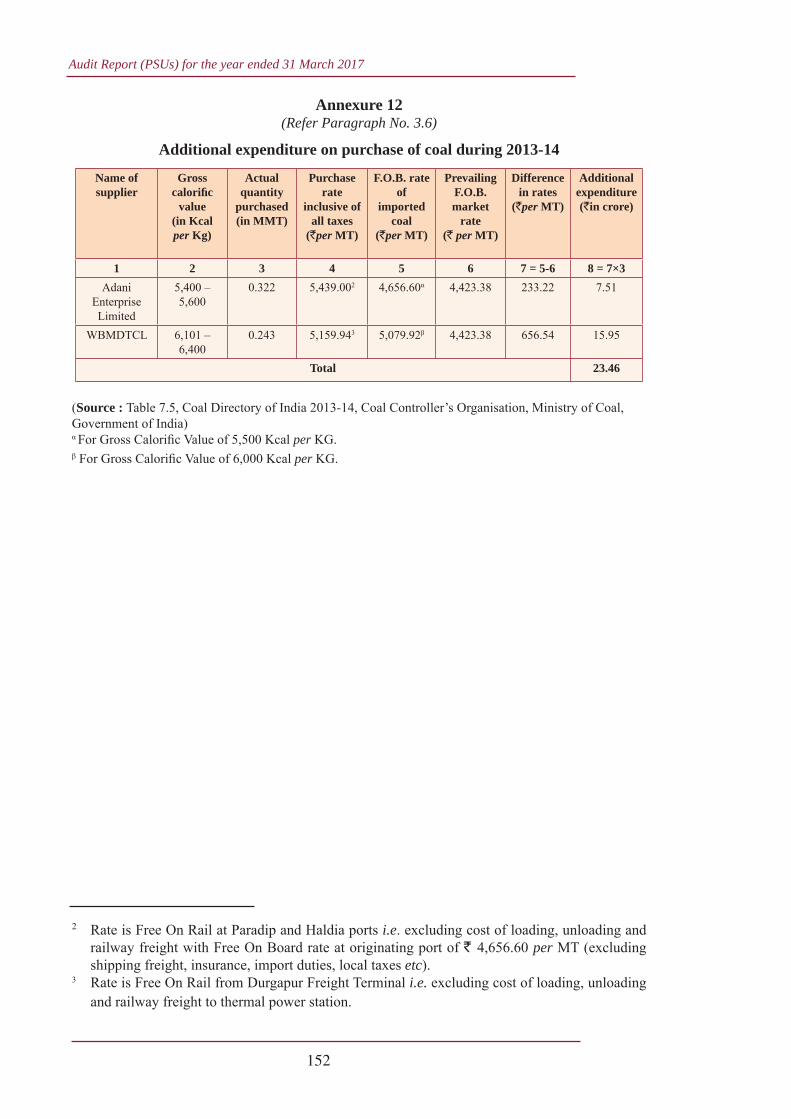
Audit Report (PSUs) for the year ended 31 March 2017
152
Annexure 12(Refer Paragraph No. 3.6)
Additional expenditure on purchase of coal during 2013-14
Name of supplier
Gross calorifi c
value (in Kcal per Kg)
Actual quantity
purchased(in MMT)
Purchase rate
inclusive of all taxes
(`per MT)
F.O.B. rate of
imported coal
(`per MT)
Prevailing F.O.B. market
rate (` per MT)
Difference in rates
(`per MT)
Additional expenditure(`in crore)
1 2 3 4 5 6 7 = 5-6 8 = 7×3 Adani
Enterprise Limited
5,400 – 5,600
0.322 5,439.002 4,656.60α 4,423.38 233.22 7.51
WBMDTCL 6,101 – 6,400
0.243 5,159.943 5,079.92β 4,423.38 656.54 15.95
Total 23.46
(Source : Table 7.5, Coal Directory of India 2013-14, Coal Controller’s Organisation, Ministry of Coal, Government of India)α For Gross Calorifi c Value of 5,500 Kcal per KG.β For Gross Calorifi c Value of 6,000 Kcal per KG.
2 Rate is Free On Rail at Paradip and Haldia ports i.e. excluding cost of loading, unloading and railway freight with Free On Board rate at originating port of ` 4,656.60 per MT (excluding shipping freight, insurance, import duties, local taxes etc).
3 Rate is Free On Rail from Durgapur Freight Terminal i.e. excluding cost of loading, unloading and railway freight to thermal power station.
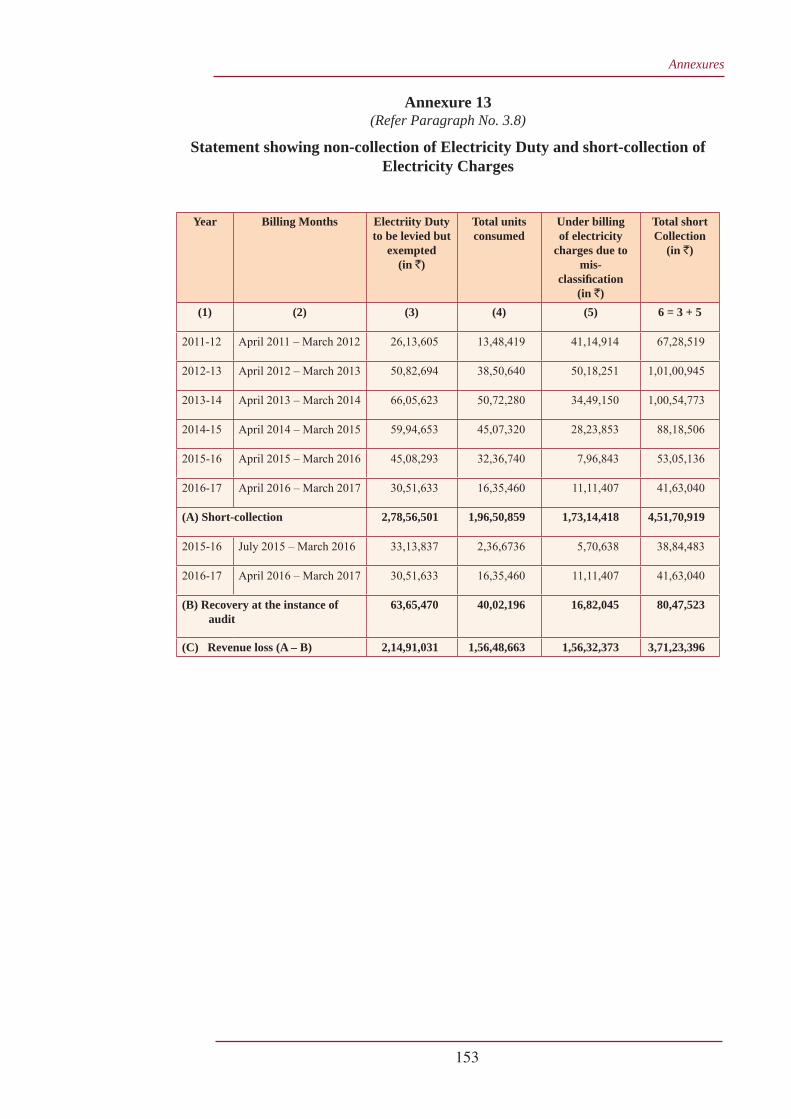
Annexures
153
Annexure 13(Refer Paragraph No. 3.8)
Statement showing non-collection of Electricity Duty and short-collection of Electricity Charges
Year Billing Months Electriity Duty to be levied but
exempted(in `)
Total units consumed
Under billing of electricity
charges due to mis-
classifi cation (in `)
Total short Collection
(in `)
(1) (2) (3) (4) (5) 6 = 3 + 5
2011-12 April 2011 – March 2012 26,13,605 13,48,419 41,14,914 67,28,519
2012-13 April 2012 – March 2013 50,82,694 38,50,640 50,18,251 1,01,00,945
2013-14 April 2013 – March 2014 66,05,623 50,72,280 34,49,150 1,00,54,773
2014-15 April 2014 – March 2015 59,94,653 45,07,320 28,23,853 88,18,506
2015-16 April 2015 – March 2016 45,08,293 32,36,740 7,96,843 53,05,136
2016-17 April 2016 – March 2017 30,51,633 16,35,460 11,11,407 41,63,040
(A) Short-collection 2,78,56,501 1,96,50,859 1,73,14,418 4,51,70,919
2015-16 July 2015 – March 2016 33,13,837 2,36,6736 5,70,638 38,84,483
2016-17 April 2016 – March 2017 30,51,633 16,35,460 11,11,407 41,63,040
(B) Recovery at the instance of audit
63,65,470 40,02,196 16,82,045 80,47,523
(C) Revenue loss (A – B) 2,14,91,031 1,56,48,663 1,56,32,373 3,71,23,396
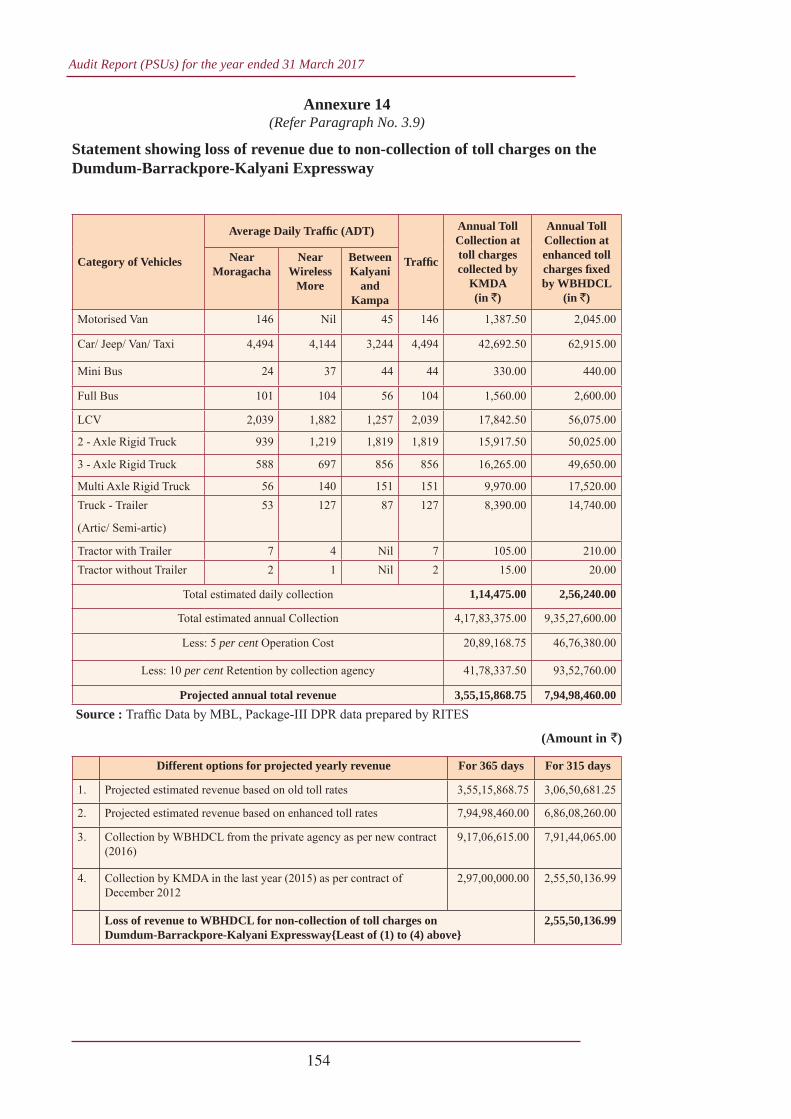
Audit Report (PSUs) for the year ended 31 March 2017
154
Annexure 14(Refer Paragraph No. 3.9)
Statement showing loss of revenue due to non-collection of toll charges on the Dumdum-Barrackpore-Kalyani Expressway
Category of Vehicles
Average Daily Traffi c (ADT)
Traffi c
Annual Toll Collection at toll charges collected by
KMDA(in `)
Annual Toll Collection at enhanced toll charges fi xed by WBHDCL
(in `)
Near Moragacha
Near Wireless
More
Between Kalyani
and Kampa
Motorised Van 146 Nil 45 146 1,387.50 2,045.00
Car/ Jeep/ Van/ Taxi 4,494 4,144 3,244 4,494 42,692.50 62,915.00
Mini Bus 24 37 44 44 330.00 440.00
Full Bus 101 104 56 104 1,560.00 2,600.00
LCV 2,039 1,882 1,257 2,039 17,842.50 56,075.00
2 - Axle Rigid Truck 939 1,219 1,819 1,819 15,917.50 50,025.00
3 - Axle Rigid Truck 588 697 856 856 16,265.00 49,650.00
Multi Axle Rigid Truck 56 140 151 151 9,970.00 17,520.00 Truck - Trailer
(Artic/ Semi-artic)
53 127 87 127 8,390.00 14,740.00
Tractor with Trailer 7 4 Nil 7 105.00 210.00 Tractor without Trailer 2 1 Nil 2 15.00 20.00
Total estimated daily collection 1,14,475.00 2,56,240.00
Total estimated annual Collection 4,17,83,375.00 9,35,27,600.00
Less: 5 per cent Operation Cost 20,89,168.75 46,76,380.00
Less: 10 per cent Retention by collection agency 41,78,337.50 93,52,760.00
Projected annual total revenue 3,55,15,868.75 7,94,98,460.00 Source : Traffi c Data by MBL, Package-III DPR data prepared by RITES
(Amount in `)
Different options for projected yearly revenue For 365 days For 315 days
1. Projected estimated revenue based on old toll rates 3,55,15,868.75 3,06,50,681.25
2. Projected estimated revenue based on enhanced toll rates 7,94,98,460.00 6,86,08,260.00
3. Collection by WBHDCL from the private agency as per new contract (2016)
9,17,06,615.00 7,91,44,065.00
4. Collection by KMDA in the last year (2015) as per contract of December 2012
2,97,00,000.00 2,55,50,136.99
Loss of revenue to WBHDCL for non-collection of toll charges on Dumdum-Barrackpore-Kalyani Expressway{Least of (1) to (4) above}
2,55,50,136.99
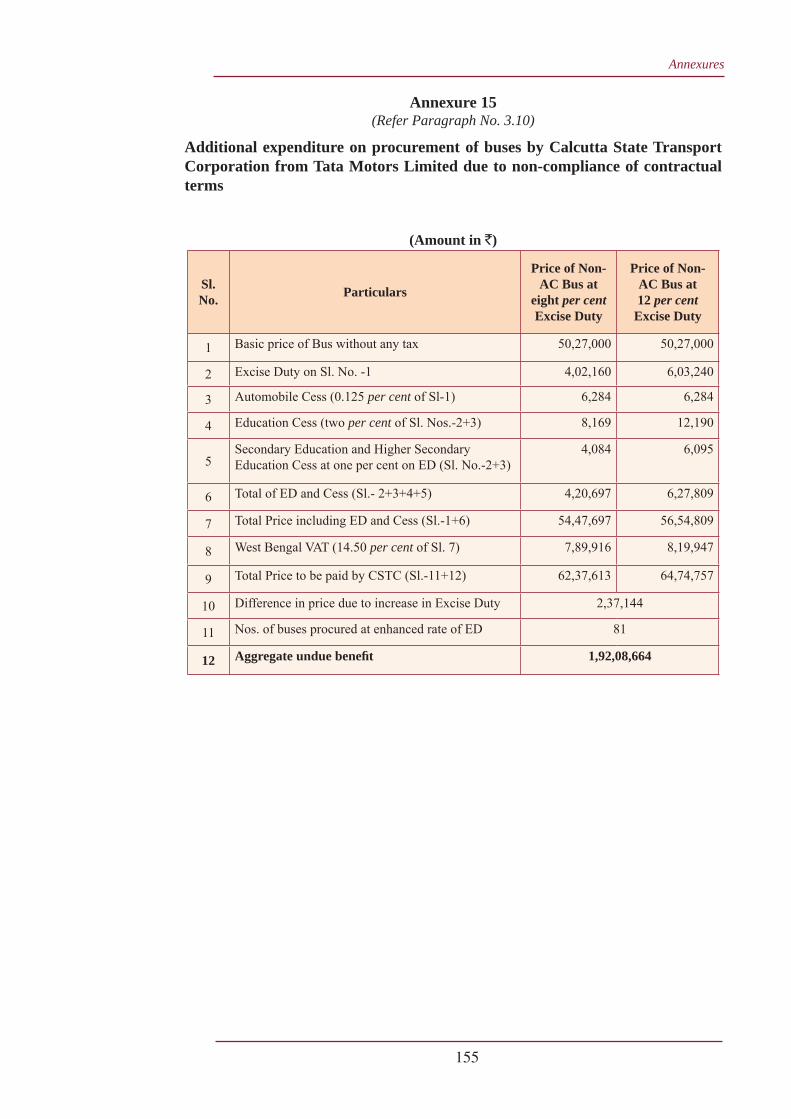
Annexures
155
Annexure 15(Refer Paragraph No. 3.10)
Additional expenditure on procurement of buses by Calcutta State Transport Corporation from Tata Motors Limited due to non-compliance of contractual terms
(Amount in `)
Sl. No. Particulars
Price of Non- AC Bus at
eight per cent Excise Duty
Price of Non- AC Bus at 12 per cent
Excise Duty
1 Basic price of Bus without any tax 50,27,000 50,27,000
2 Excise Duty on Sl. No. -1 4,02,160 6,03,240
3 Automobile Cess (0.125 per cent of Sl-1) 6,284 6,284
4 Education Cess (two per cent of Sl. Nos.-2+3) 8,169 12,190
5Secondary Education and Higher Secondary Education Cess at one per cent on ED (Sl. No.-2+3)
4,084 6,095
6 Total of ED and Cess (Sl.- 2+3+4+5) 4,20,697 6,27,809
7 Total Price including ED and Cess (Sl.-1+6) 54,47,697 56,54,809
8 West Bengal VAT (14.50 per cent of Sl. 7) 7,89,916 8,19,947
9 Total Price to be paid by CSTC (Sl.-11+12) 62,37,613 64,74,757
10 Difference in price due to increase in Excise Duty 2,37,144
11 Nos. of buses procured at enhanced rate of ED 81
12 Aggregate undue benefi t 1,92,08,664
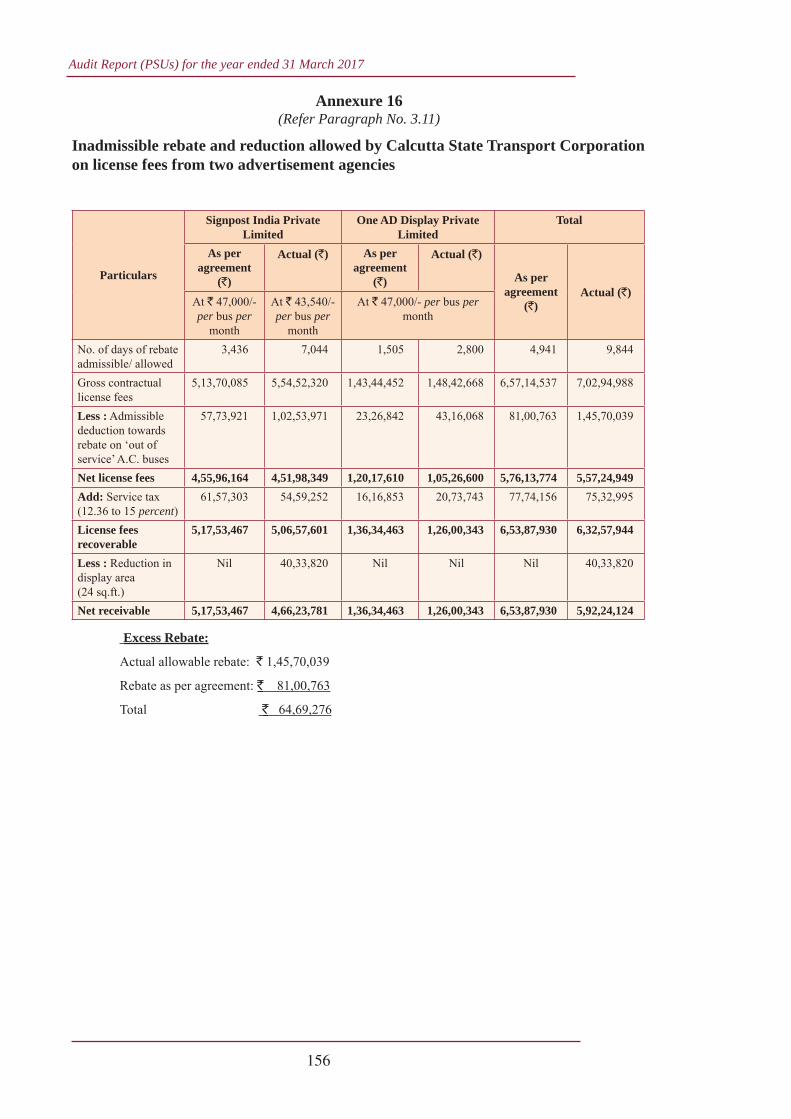
Audit Report (PSUs) for the year ended 31 March 2017
156
Annexure 16(Refer Paragraph No. 3.11)
Inadmissible rebate and reduction allowed by Calcutta State Transport Corporation on license fees from two advertisement agencies
Particulars
Signpost India Private Limited
One AD Display Private Limited
Total
As per agreement
(`)
Actual (`) As per agreement
(`)
Actual (`)
As per agreement
(`)Actual (`)
At ` 47,000/- per bus per
month
At ` 43,540/- per bus per
month
At ` 47,000/- per bus per month
No. of days of rebate admissible/ allowed
3,436 7,044 1,505 2,800 4,941 9,844
Gross contractual license fees
5,13,70,085 5,54,52,320 1,43,44,452 1,48,42,668 6,57,14,537 7,02,94,988
Less : Admissible deduction towards rebate on ‘out of service’ A.C. buses
57,73,921 1,02,53,971 23,26,842 43,16,068 81,00,763 1,45,70,039
Net license fees 4,55,96,164 4,51,98,349 1,20,17,610 1,05,26,600 5,76,13,774 5,57,24,949Add: Service tax (12.36 to 15 percent)
61,57,303 54,59,252 16,16,853 20,73,743 77,74,156 75,32,995
License fees recoverable
5,17,53,467 5,06,57,601 1,36,34,463 1,26,00,343 6,53,87,930 6,32,57,944
Less : Reduction in display area (24 sq.ft.)
Nil 40,33,820 Nil Nil Nil 40,33,820
Net receivable 5,17,53,467 4,66,23,781 1,36,34,463 1,26,00,343 6,53,87,930 5,92,24,124
Excess Rebate:
Actual allowable rebate: ` 1,45,70,039
Rebate as per agreement: ` 81,00,763
Total ` 64,69,276
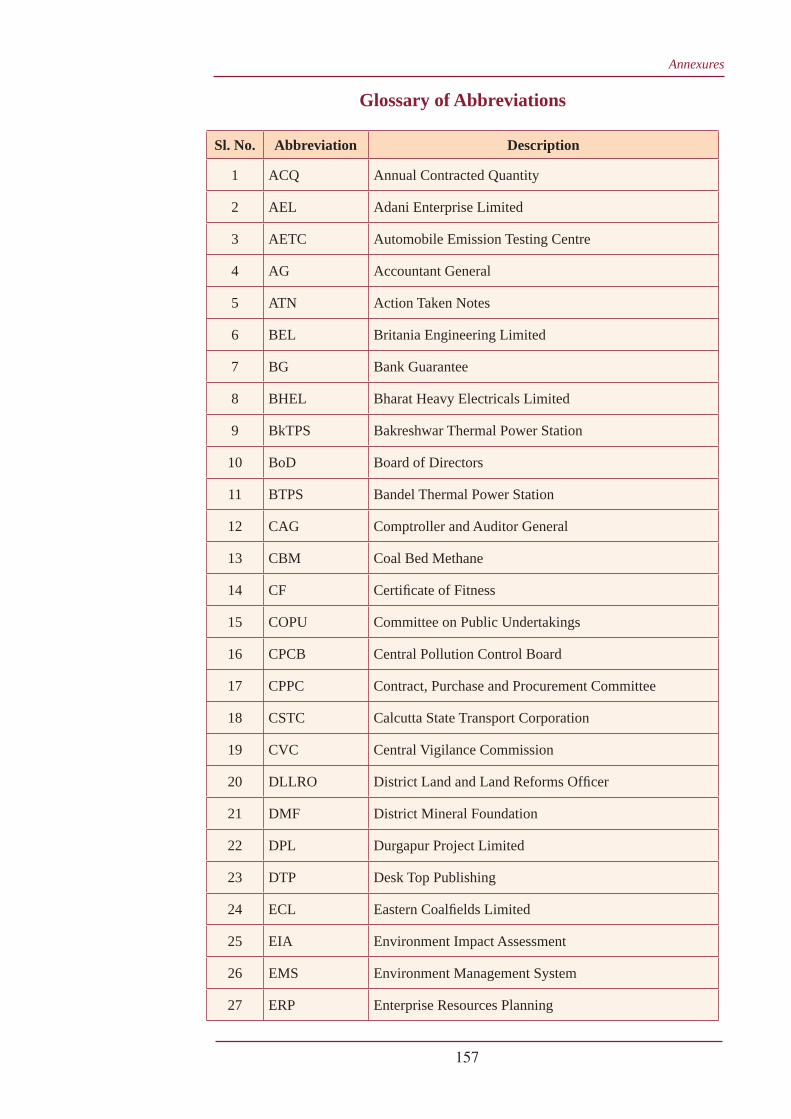
Annexures
157
Glossary of Abbreviations
Sl. No. Abbreviation Description
1 ACQ Annual Contracted Quantity
2 AEL Adani Enterprise Limited
3 AETC Automobile Emission Testing Centre
4 AG Accountant General
5 ATN Action Taken Notes
6 BEL Britania Engineering Limited
7 BG Bank Guarantee
8 BHEL Bharat Heavy Electricals Limited
9 BkTPS Bakreshwar Thermal Power Station
10 BoD Board of Directors
11 BTPS Bandel Thermal Power Station
12 CAG Comptroller and Auditor General
13 CBM Coal Bed Methane
14 CF Certifi cate of Fitness
15 COPU Committee on Public Undertakings
16 CPCB Central Pollution Control Board
17 CPPC Contract, Purchase and Procurement Committee
18 CSTC Calcutta State Transport Corporation
19 CVC Central Vigilance Commission
20 DLLRO District Land and Land Reforms Offi cer
21 DMF District Mineral Foundation
22 DPL Durgapur Project Limited
23 DTP Desk Top Publishing
24 ECL Eastern Coalfi elds Limited
25 EIA Environment Impact Assessment
26 EMS Environment Management System
27 ERP Enterprise Resources Planning
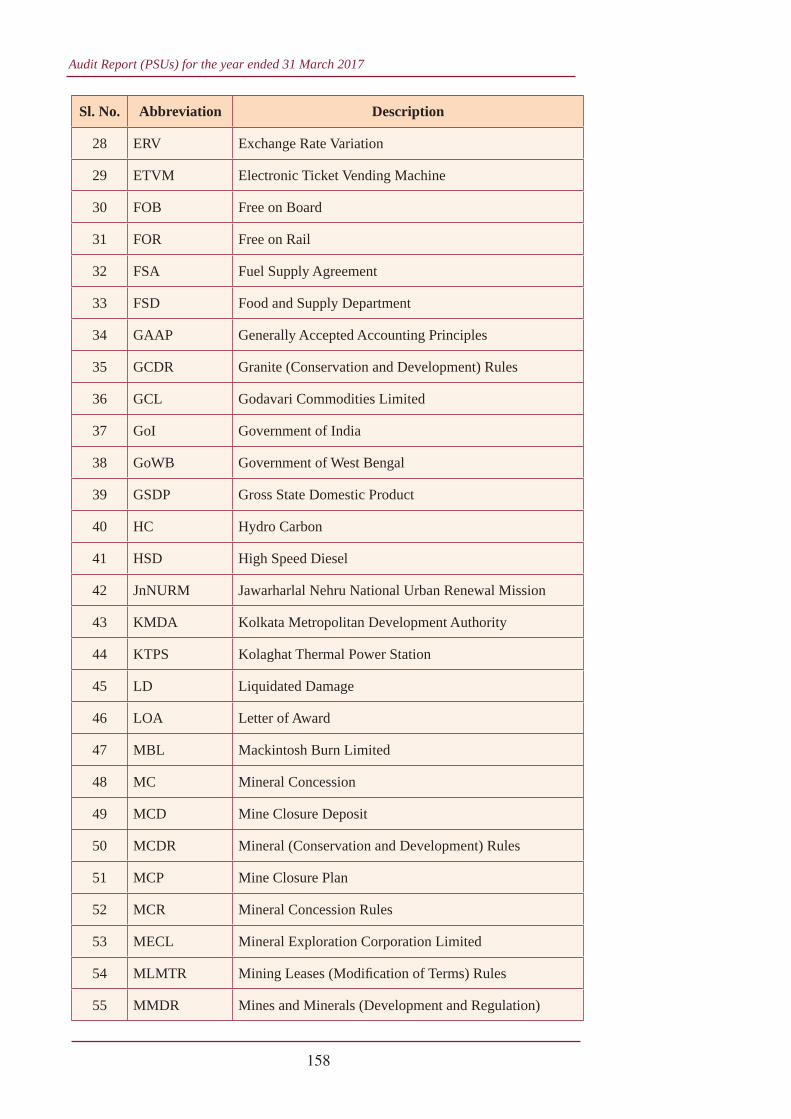
Audit Report (PSUs) for the year ended 31 March 2017
158
Sl. No. Abbreviation Description
28 ERV Exchange Rate Variation
29 ETVM Electronic Ticket Vending Machine
30 FOB Free on Board
31 FOR Free on Rail
32 FSA Fuel Supply Agreement
33 FSD Food and Supply Department
34 GAAP Generally Accepted Accounting Principles
35 GCDR Granite (Conservation and Development) Rules
36 GCL Godavari Commodities Limited
37 GoI Government of India
38 GoWB Government of West Bengal
39 GSDP Gross State Domestic Product
40 HC Hydro Carbon
41 HSD High Speed Diesel
42 JnNURM Jawarharlal Nehru National Urban Renewal Mission
43 KMDA Kolkata Metropolitan Development Authority
44 KTPS Kolaghat Thermal Power Station
45 LD Liquidated Damage
46 LOA Letter of Award
47 MBL Mackintosh Burn Limited
48 MC Mineral Concession
49 MCD Mine Closure Deposit
50 MCDR Mineral (Conservation and Development) Rules
51 MCP Mine Closure Plan
52 MCR Mineral Concession Rules
53 MECL Mineral Exploration Corporation Limited
54 MLMTR Mining Leases (Modifi cation of Terms) Rules
55 MMDR Mines and Minerals (Development and Regulation)
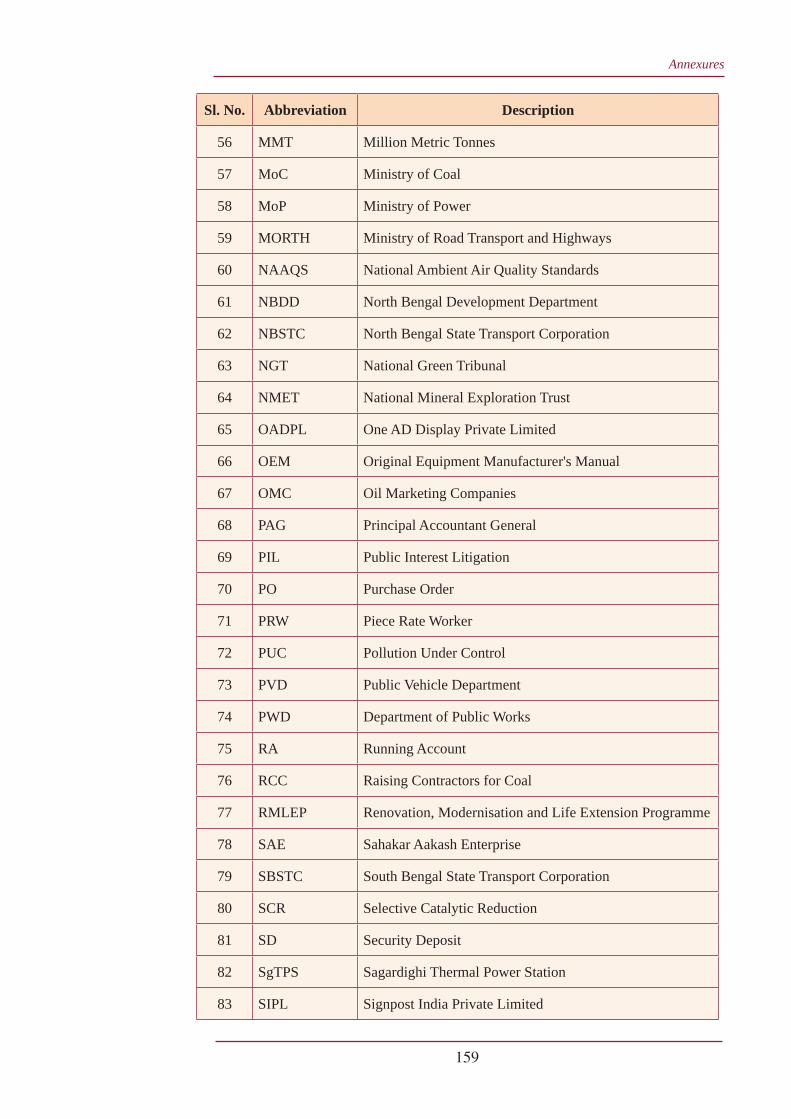
Annexures
159
Sl. No. Abbreviation Description
56 MMT Million Metric Tonnes
57 MoC Ministry of Coal
58 MoP Ministry of Power
59 MORTH Ministry of Road Transport and Highways
60 NAAQS National Ambient Air Quality Standards
61 NBDD North Bengal Development Department
62 NBSTC North Bengal State Transport Corporation
63 NGT National Green Tribunal
64 NMET National Mineral Exploration Trust
65 OADPL One AD Display Private Limited
66 OEM Original Equipment Manufacturer's Manual
67 OMC Oil Marketing Companies
68 PAG Principal Accountant General
69 PIL Public Interest Litigation
70 PO Purchase Order
71 PRW Piece Rate Worker
72 PUC Pollution Under Control
73 PVD Public Vehicle Department
74 PWD Department of Public Works
75 RA Running Account
76 RCC Raising Contractors for Coal
77 RMLEP Renovation, Modernisation and Life Extension Programme
78 SAE Sahakar Aakash Enterprise
79 SBSTC South Bengal State Transport Corporation
80 SCR Selective Catalytic Reduction
81 SD Security Deposit
82 SgTPS Sagardighi Thermal Power Station
83 SIPL Signpost India Private Limited
Audit Report (PSUs) for the year ended 31 March 2017
160
Sl. No. Abbreviation Description
84 SoP Standard Operating Procedure
85 SPL Saraswati Press Limited
86 STPS Santaldih Thermal Power Station
87 STUs State Transport Undertakings
88 TDCMPL Trans Damodar Coal Mining Project Limited
89 TML Tata Motors Limited
90 TPS Thermal Power Station
91 WBHB West Bengal Housing Board
92 WBHDCL West Bengal Highway Development Corporation Limited
93 WBMDTCL West Bengal Mineral Development and Trading Corporation Limited
94 WBMMR West Bengal Minor Minerals Rules
95 WBPCB West Bengal Pollution Control Board
96 WBPDCL West Bengal Power Development Corporation Limited
97 WBSEDCL West Bengal State Electricity Distribution Company Limited
98 WBSETCL West Bengal State Electricity Transmission Company Limited
99 WBSTCL West Bengal Surface Transport Corporation Limited
100 WBTBCL West Bengal Text Book Corporation Limited
101 WBTCL West Bengal Transport Corporation Limited
102 WSFL Westinghouse Saxby Farmer Limited
Governm
ent of West B
engal Report N
o. 2 of the year 2018
Ó�COMPTROLLER AND AUDITOR GENERAL OF INDIA
www.cag.gov.in
agwb.cag.gov.in
Report of theComptroller and Auditor General of India
onPublic Sector Undertakings
for the year ended 31 March 2017
Government of West BengalReport No. 2 of the year 2018