Embed Size (px)
Citation preview
Grade Dropping, Strategic Behavior, and Student Satisficing
Lester Hadsell Department of Economics
State University of New York, College at Oneonta Oneonta, NY 13820
Raymond MacDermott 331 Scott Shipp Hall
Virginia Military Institute Lexington, VA 24450
ABSTRACT An extensive database of exam scores is studied to determine the effects of a grading policy that drops the lowest exam score. We find evidence that some students engage in strategic behavior, either by understudying for one of the exams or missing one altogether, but the vast majority of students show no evidence of strategic behavior. We also find evidence that many students “satisfice”, showing how a large percentage of students passed up an expected improvement in their course grade. We find that the probability a student will choose to complete an optional final exam is inversely related to their grade going into the final. Further, the likelihood of a student completing the final exam rises with the spread between prior exam scores and falls with the points needed to raise their course grade. Key words: Grade dropping, student behavior, introductory finance
Grade Dropping, Strategic Behavior, and Student Satisficing
ABSTRACT An extensive database of exam scores is studied to determine the effects of a grading policy that drops the lowest exam score. We find evidence that some students engage in strategic behavior, either by understudying for one of the exams or missing one altogether, but the vast majority of students show no evidence of strategic behavior. We also find evidence that many students “satisfice”, showing how a large percentage of students passed up an expected improvement in their course grade. We find that the probability a student will choose to complete an optional final exam is inversely related to their grade going into the final. Further, the likelihood of a student completing the final exam rises with the spread between prior exam scores and falls with the points needed to raise their course grade. I. INTRODUCTION Even though it is common for faculty to drop the lowest exam score when
computing a course grade, the effects of such policies on student performance and
behavior are not well documented. In this paper, we examine five semesters of grade data
covering 1,945 students to learn more about students’ choices regarding completing an
optional cumulative final exam. We investigate how students react to a grade-dropping
policy and how such a policy affects students’ course grade. In particular, we address
such questions as:
• Is there a tendency for students to under prepare for an exam when the lowest
exam is dropped?
• How does a student’s grade going into an optional, comprehensive final exam
affect the probability of a student taking the final?
1
• How does the spread between scores on in-term exams affect the probability of a
student taking the comprehensive final exam?
• Does the number of points a student needs to “step up” to the next course (letter)
grade affect the probability of their taking the final?
• How does a grade dropping policy affect a course’s final grade distribution?
A grade dropping policy, in which one bad exam grade no longer guarantees a
poor course grade, has several potential benefits for students and instructors.1 It may
increase persistence (i.e. lessen the dropout rate) and class attendance (when the last
exam is not an in-term exam that can be dropped). Students may have a more positive
attitude toward the course, leading to further pursuit of the subject and more positive
student course evaluations. Fewer students are likely to ask for a make-up exam, leading
to fewer disputes between faculty and student over acceptable excuses for missing an
exam. While our data set does not allow us to evaluate these benefits, we are able to
identify factors affecting students’ decisions regarding completion of an optional final
exam. Further, we are able infer whether students systematically underperform on in-term
exams. A grade dropping policy may encourage strategic behavior in some students.
Some may under prepare for or even miss an exam when they know that a poor score can
be dropped. Others may put forth more effort to ensure that they reach their desired
course grade without having to take all the exams (dropping the final exam, for example).
1 There are other options available to faculty such as scheduling an optional replacement test, usually the last week of class, which can be used to replace the lowest score for the semester or an oral exam as a substitute. In addition, some instructors allow students to choose their grading structure from a list of alternatives where one of these alternatives is dropping an exam, or the instructor places greater weight on higher scores. See Davis (1993) and McKechie (1999) for discussions of these and other approaches.
2
We explain in the next section how strategic behavior can be inferred from students’
performance on the exams, without the need for a control group.
How students react to the explicit and implicit choices available to them as a
result of a policy of dropping the lowest exam score is an interesting and important
question. Understanding these choices can lead to better grading policies and improved
learning. In general, policies that allow students multiple chances to show their
competence will increase student learning, and will encourage students to continue
working toward an attainable goal (Chickering and Gamson, 1991; Biehler and
Snowman, 1982; Deci and Ryan, 1987; Pintrich and Schunk, 1996; Davis, 1993;
Johnson, 1996). A grade-dropping policy is one way to allow multiple chances (Nelson,
1996).
Few studies of the finance or economics classrooms have examined grade
dropping policies. Sewell (2004) examines four sections of Introductory Microeconomics
over one semester. Two sections (133 students) were allowed to drop their lowest score
while two (130) were not.2 She finds that students who were allowed to drop their lowest
test score fared worse on the comprehensive final. While the difference was statistically
significant, it was small in magnitude (about 4 points on a 100 point scale). She also
found that very few students in either group missed an exam (7 out of 130 in the no drop
sections; 11/133 in the grade drop sections). Sewell also investigated the effect of under
preparation for an exam and found “no evidence that a significantly low grade, relative to
the student’s other grades, is anything more than a random effect” (p. 30). Finally,
2 As the author acknowledges, by assigning entire classes to one group or the other, the experiment is not randomized. For instance, athletes and student workers may have more rigid schedules and end up in a morning class.
3
students’ risk attitude as measured by a five-question survey did not appear to play a
significant role in students’ decisions to miss exams or prepare adequately.
MacDermott (2009) looks at the impact of dropping the lowest exam on final
course grade using six semesters of data (180 students) from Intermediate
Macroeconomics. While the policy does not seem to affect students’ grades, it does
appear to alter their behavior. A substantial portion of the class, when given the option,
chose to skip the last exam.3 Of the 134 students in the grade drop sections, 56 missed the
last exam and an additional 23 missed a prior exam. Almost half of all students who sat
for the last exam improved their grade as a result.4
Our study adds to the empirical research in several ways. First, we show how
evidence of strategic behavior can be inferred by comparing actual to expected scores.
We also analyze how prior exam performance affects the likelihood a student will take an
optional final exam. We analyze five semesters of a large-enrollment Principles of
Finance course in which two in-term exams (the first at the mid-way point, the second
during the last week of classes) and a comprehensive final (one week after the second
exam) were given. In all, the decisions of 1,945 students are examined. Among our
findings: There is some evidence of strategic behavior by a small number of students, but
the vast majority of students appear to put forth at least as much effort under a grade
dropping policy as they otherwise would. We also find that the likelihood that a student
will complete the final exam is negatively associated with both the student’s grade going
into the final exam and the points needed for improvement of the student’s course grade,
but that it is positively associated with the difference between scores on the in-term
3 The last exam was not a comprehensive final, simply a fourth exam. 4 We refer the reader to Sewell (2004) for a summary of the related literature (on grading policies generally), including additional pros and cons of grade dropping policies.
4
exams. Lastly, we find that about half of students who take the final raised their course
letter grade as a result, and, consequently, the course grade distribution shifts up slightly.
The analysis and findings in this paper will be of interest to faculty contemplating
a grade-dropping policy and to faculty and administrators interested in the effects of a
grade-dropping policy on grade distribution and student behavior. The next section
provides a framework for considering the effects of a grade dropping policy. The section
that follows describes the course and data used in the empirical work. Results and
concluding comments are then presented.
II. ACTUAL AND EXPECTED SCORES UNDER A GRADE DROPPING POLICY
A grading policy that drops the lowest score from a set of exams which includes a
comprehensive final exam has an implicit weighting of course topics that is important to
consider when evaluating its effects on students’ choices about studying for exams and
completing an optional final. To illustrate, we begin with the assertion that when faculty
create an exam they necessarily, due to time and space limitations, chose a subset of
questions from all of those available. For example, the faculty may select 30 questions to
place on an exam (the sample) from a pool of 60 potential questions (the population). The
30 questions chosen for the exam presumably reflect a fair sample from the 60 possible
and students’ performance on the exam presumably will be an accurate reflection of their
true understanding at that time.5 That is, if students would correctly answer 90% of the
questions in the population then one would expect that they would correctly answer 90%
5 If the questions on the exam do not fairly reflect the population of questions (are over-weighted toward a particular subset) then the exam score may not accurately reflect students’ knowledge (of the population of questions). We know this happens, of course. One may attribute it to sampling error. Such sampling error may lead students to take the final, in an effort to replace an unduly low score.
5
of the questions in the sample chosen for the exam. It follows that any sample of
questions from the same population will produce the same expected percentage correct,
although, of course, there will be natural variation in the actual percentage from sample
to sample.
Now consider a course in which two in-term exams (the 1st given at the mid-point,
the 2nd at the end of the semester) and a comprehensive final (during finals week) are
provided, with the lowest grade dropped and the two remaining scores weighted equally
when calculating students’ exam average. In this system, since the final is
comprehensive, with half of the final exam questions covering topics from the first half
of the course (call the expected percentage of correct answers to these questions E1) and
half of the questions covering topics from the from the second half of the course (E2), the
expected final exam score will reflect the weighted performance on these two sets of
questions: E3 = 0.5E1 + 0.5E2.
E1 also represents the expected score (percentage correct) on exam 1 and E2
represents the expected score on exam 2, since, as argued above, any sample of questions
from the 1st half of the course is expected to produce E1 and any sample of questions
from the 2nd half of the course is expected to produce E2. Consequently, one would
expect the grade on such a final exam to be between the grades on exam 1 and exam 2.6
For example, if a student scores 70 (=E1) on the first exam and 90 (=E2) on the second
6 Consider the scenario in which the same questions on each of the in-term exams appear on the final exam. One would reasonably expect that, on average, a student will correctly answer the same percentage of those questions both times they are asked. An important exception would be the case in which the student studied (prepared) more for the final exam and so increased his score. If the same questions are not asked on both exams, but a similar sample is chosen, then the same result should apply. The ability to answer 70% on the first subset of questions will be replicated when an equivalent subset of questions is asked.
6
exam, then the grade on the final should be 80.7 Examination of data for the course being
studied indicates that this is a reasonable expectation (supporting details are presented
later). Consequently, the score on the final exam is expected to replace a prior low score,
raising the student’s exam average.
In summary, if the lowest of the three exam scores is dropped and the remaining
two scores are weighted equally then the implicit weighting of topics in the exam average
will be either:
Exam average = 0.5E1+0.5E2 if E3 is dropped (or not taken); or (1)
Exam average = 0.5E1+0.5E3 if E2 is dropped (lowest)8. (2)
Of course, equation 2 can be thought of as:
Exam average = 0.5E1 + 0.5E3, (3)
= 0.5E1 + 0.5(0.5E1 + 0.5E2), (4)
= 0.75E1 + 0.25 E2. (5)
Equation 5 simply states that the exam average is based on 75% of the students’
knowledge of exam 1 topics and 25% of exam 2 topics. So dropping a grade under this
scenario has an implicit weighting that favors a student’s strength.9
Notably, by dropping the lowest grade, students who do not take the final exam or
who do poorly on it (equation 1) receive a grade that weights their knowledge of the
course topics differently than students whose score replaces one of the prior two exams
7 If a student’s knowledge is not constant over time (e.g., when a student forgets what s/he had learned, or when a student learns the material after the first exam) then the third exam score will not be an average of the first two. There is evidence of this type of learning in only about 10 percent of students in our sample (fourth and fifth group of students in Table 1 – those who scored at least 10 points better than expected on the final exam (excluding those who did not take either exam 1 or 2)). 8 Similarly, Exam average = 0.5E2 + 0.5 E3 if E1 is dropped (lowest). 9A policy of counting either the two in-terms (50%-50%) or the final exam (100%) will remove this bias.
7
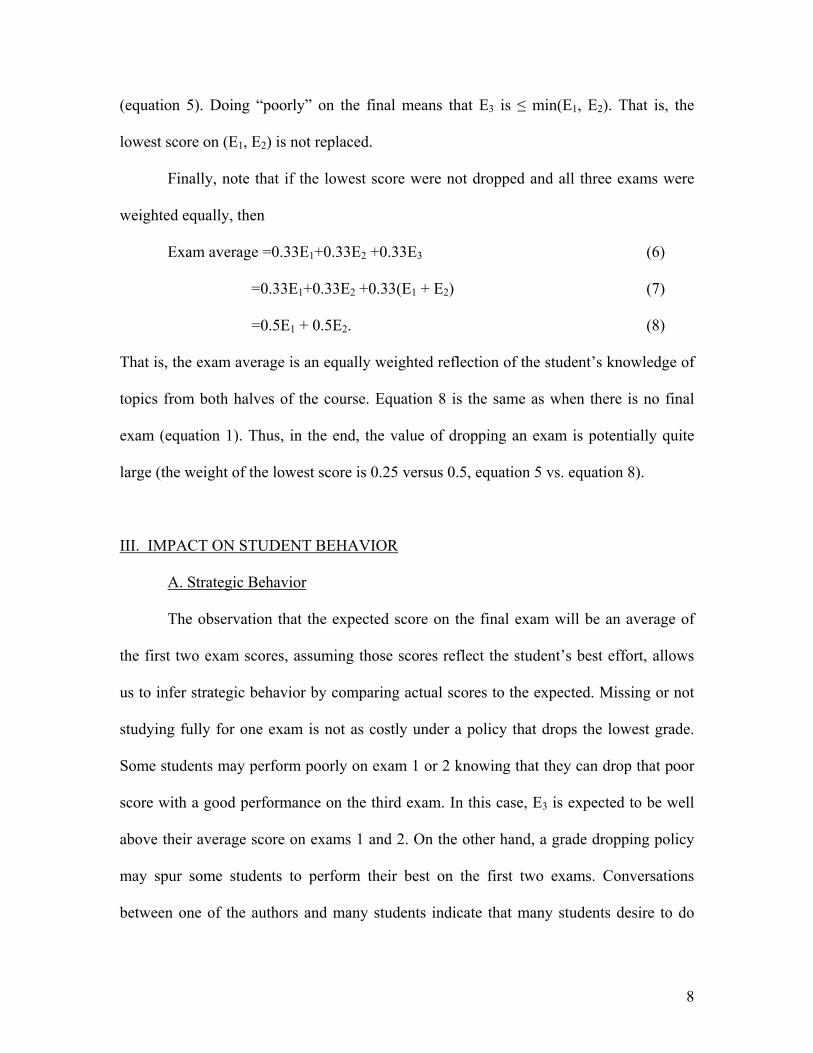
(equation 5). Doing “poorly” on the final means that E3 is ≤ min(E1, E2). That is, the
lowest score on (E1, E2) is not replaced.
Finally, note that if the lowest score were not dropped and all three exams were
weighted equally, then
Exam average =0.33E1+0.33E2 +0.33E3 (6)
=0.33E1+0.33E2 +0.33(E1 + E2) (7)
=0.5E1 + 0.5E2. (8)
That is, the exam average is an equally weighted reflection of the student’s knowledge of
topics from both halves of the course. Equation 8 is the same as when there is no final
exam (equation 1). Thus, in the end, the value of dropping an exam is potentially quite
large (the weight of the lowest score is 0.25 versus 0.5, equation 5 vs. equation 8).
III. IMPACT ON STUDENT BEHAVIOR
A. Strategic Behavior
The observation that the expected score on the final exam will be an average of
the first two exam scores, assuming those scores reflect the student’s best effort, allows
us to infer strategic behavior by comparing actual scores to the expected. Missing or not
studying fully for one exam is not as costly under a policy that drops the lowest grade.
Some students may perform poorly on exam 1 or 2 knowing that they can drop that poor
score with a good performance on the third exam. In this case, E3 is expected to be well
above their average score on exams 1 and 2. On the other hand, a grade dropping policy
may spur some students to perform their best on the first two exams. Conversations
between one of the authors and many students indicate that many students desire to do
8
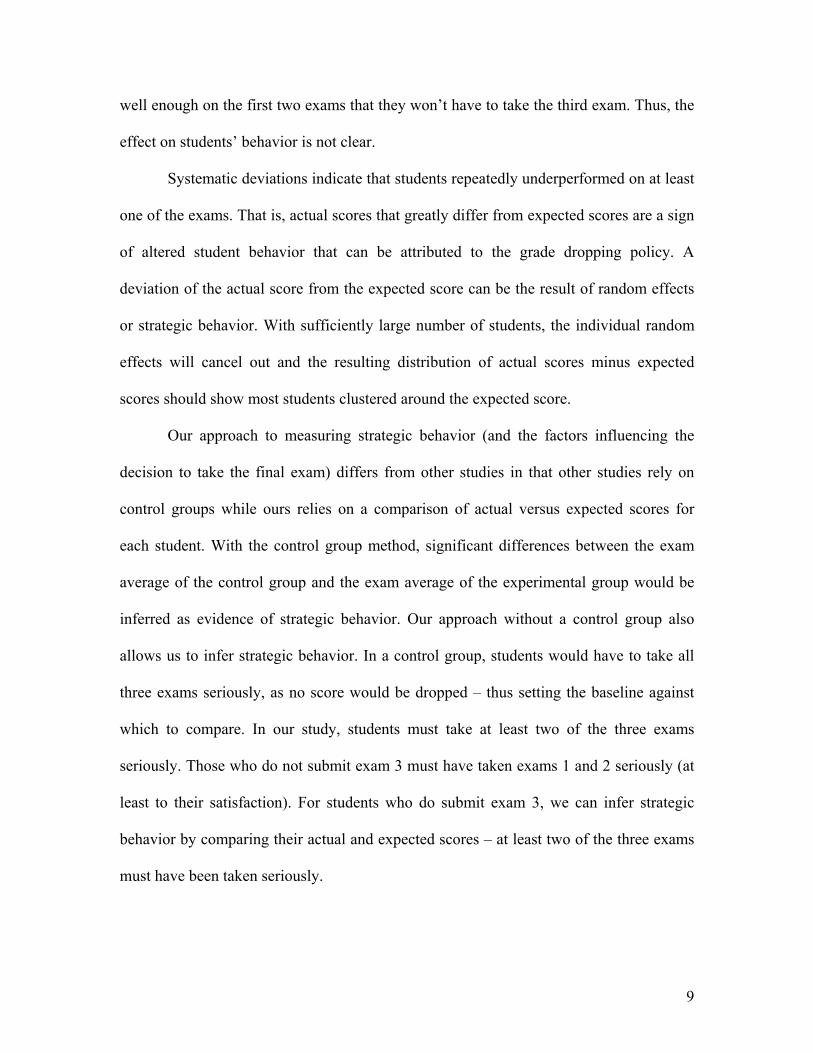
well enough on the first two exams that they won’t have to take the third exam. Thus, the
effect on students’ behavior is not clear.
Systematic deviations indicate that students repeatedly underperformed on at least
one of the exams. That is, actual scores that greatly differ from expected scores are a sign
of altered student behavior that can be attributed to the grade dropping policy. A
deviation of the actual score from the expected score can be the result of random effects
or strategic behavior. With sufficiently large number of students, the individual random
effects will cancel out and the resulting distribution of actual scores minus expected
scores should show most students clustered around the expected score.
Our approach to measuring strategic behavior (and the factors influencing the
decision to take the final exam) differs from other studies in that other studies rely on
control groups while ours relies on a comparison of actual versus expected scores for
each student. With the control group method, significant differences between the exam
average of the control group and the exam average of the experimental group would be
inferred as evidence of strategic behavior. Our approach without a control group also
allows us to infer strategic behavior. In a control group, students would have to take all
three exams seriously, as no score would be dropped – thus setting the baseline against
which to compare. In our study, students must take at least two of the three exams
seriously. Those who do not submit exam 3 must have taken exams 1 and 2 seriously (at
least to their satisfaction). For students who do submit exam 3, we can infer strategic
behavior by comparing their actual and expected scores – at least two of the three exams
must have been taken seriously.
9
We presents evidence later that shows that a small number of students appear to
engage in such strategic behavior, but for the most part students perform as expected on
the final exam, showing no signs of strategic behavior. A large fraction of students do,
however, perform well-enough on exams 1 and 2 that they elect to skip the final
(dropping that score).
B. Factors Influencing The Decision To Take The Final
Our analysis also examines the decision to take the final by determining the
student’s course grade going into the final exam, which is their course grade if they
choose not to take the final (or, if their grade on the final is the one that is dropped). This
allows us to calculate the percentage of students in each grade category who decide to
complete the final exam, providing information about how dropping the lowest score
affects the probability of a student taking the final. We employ a Probit model to measure
the marginal effects of average score on the first two exams and the spread between exam
1 and 2 scores on the likelihood that a student will complete a final exam.
To mirror the decision that students made regarding whether or not to take the
final exam, we calculated the student’s course grade based on information available at the
time students had to decide whether to take the final (all scores except the final were
known). We then compared that grade to the one necessary for the student to increase
their course grade one “step” (for example, from B to B+ or from B+ to A-). The
difference between “current” and “potential” course grade is our “potential
improvement.” Of course, some students could expect to increase their grade by more
10
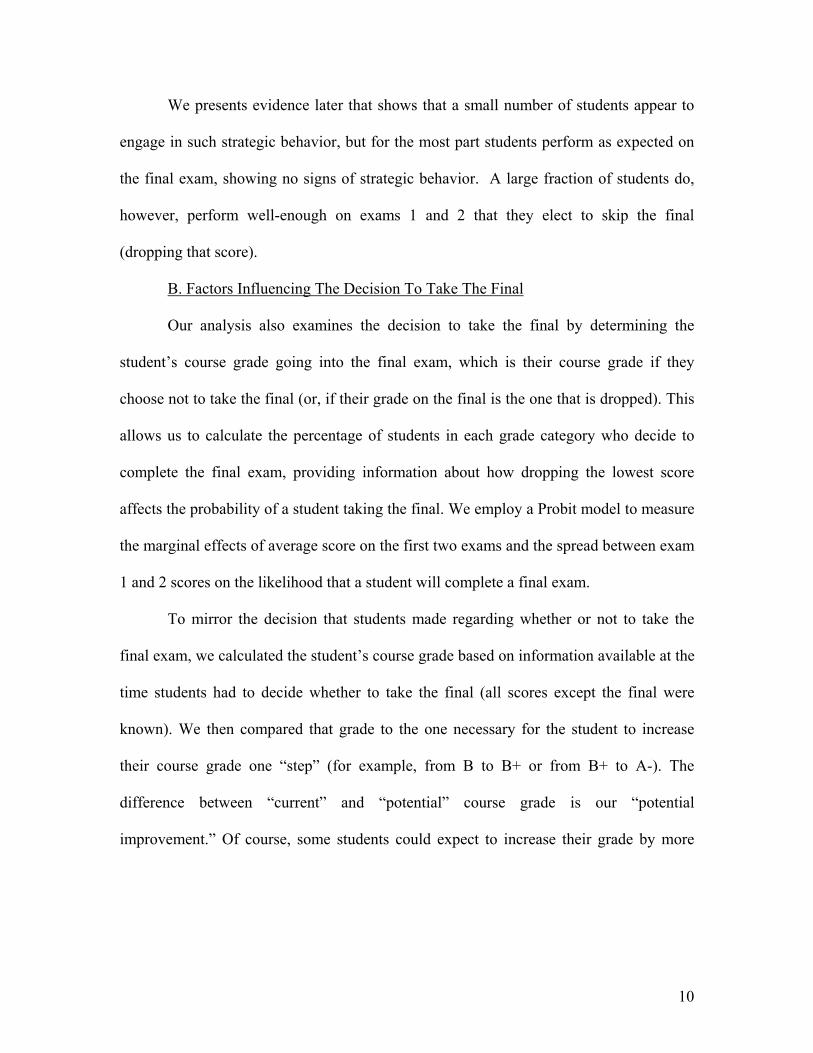
than one step, for example, those who did particularly poor on one of the first two exams,
but one step was the greatest reasonable improvement within reach for most students.10
When students who already have two exam grades consider whether to attempt a
final exam when the lowest of the 3 exams is dropped, they consider the probability of
replacing the lowest exam score with the score on the final exam and the effect of this
replacement on their course grade. In particular, we will assume that they consider the
score necessary to increase their current course letter grade by one “step.” This necessary
improvement in score on the final exam over their lowest grade on the first two exams is
I = Z – (E1 + E2), (9)
where I represents the improvement (points) necessary on the final above the student’s
prior lowest grade (I = E3 – min(E1,E2)); Z is the total points necessary to reach the next
cut-off (e.g., an average of 86.5 Z = 173 points for a B+); and E1 and E2 represent the
scores on the first two exams (and the expected percentage of correct answers to
questions on the final that are on the same topics). For example, a student with an 80 on
the first exam and a 90 on the second (a “B” average), could replace the 80 and get a
“B+” for the course if the student earns an 83 (given a minimum average of 86.5
necessary for a B+).
If quizzes (or other outcomes) are required for the course grade, as they were for
four of the five semesters in the study, then equation 9 becomes
I = (Z – 2Q)/w - (E1 + E2), (10)
10 A two-step increase is more likely if a poor score on exam 1 or 2 does not reflect the student’s true ability. This might be the case if the student did not study properly or for an appropriate amount of time; or if the student needed more time to “digest” the material.
11
where Q represents the points from the quizzes (etc.) such that if quizzes are 10% of the
final grade then max(Q) = 10, and w is the weight given to the exam average (e.g., 0.9 for
90%).
Since scores on all coursework except the final exam are known before students
decide whether to complete the final exam, students base their decision on I from
equation 10. Thus, we use this value for our analysis below. Among the empirical
questions we address is whether a higher value for I means that a student is less likely to
take the final. We might also expect that the higher the average on the first two exams the
lower the likelihood that the student will take the final – as improvement on an already
good score is progressively more difficult.
Additionally, we will examine whether the difference between scores on exams 1
and 2 influences the likelihood that a student will take the final. This is based on the
observation that the final exam consists of material equally weighted from the two halves
of the course. So if a student scored 90 and 80 on the first two exams and those grades are
reflective of their true abilities then the student should expect to get an 85 on the final, an
improvement of 5 points over the lowest exam score. A greater spread in the scores on
the first two exams leads to a greater expected improvement on the final over the lowest
grade.11
It may have been interesting to incorporate a variety of related variables into the
analysis, similar to those utilized in Sewell (2004) and MacDermott (2009). However,
this study was conducted retrospectively, before a particular research question was in
11 If one or both scores on the first two exams is/are not reflective of the student’s true ability then the student has greater (true ability above actual score) or less (true ability below actual score) incentive to take the final. If learning occurs after the exam (e.g. after exam 1 but before exam 3) then the exam 1 score does not reflect the student’s true ability as we define it while exam 3 does. See footnote 7.
12
mind. As a result, it is not possible to collect information on student risk attitudes,
demographic characteristics, or academic data.
C. Satisficing
Because the expected outcome on the final exam is a grade higher than the prior
lowest score, as shown in equation 5, if the student chooses not to take the final they are
giving up an expected improvement in their course grade.12 This improvement should
come with a modicum of additional effort. In the course being examined, one half of E3 is
based on E2, which was just completed, and the other half on E1 from seven weeks prior.
The earlier material should be easily recalled, unless we assume that knowledge has a
very short half-life – i.e. what was learned in the beginning of the course was forgotten
by the end of the course and thus had to be relearned (and not simply refreshed).
A student’s decision not to take the final may reflect that the student has a high
opportunity cost of studying for the final or the student is satisfied with the grade they
have (having no need for improvement). Each of these could be described as a form of
“satisficing”. According to Herbert Simon (1957), to “satisfice” means to decide that
something (a choice) is “good enough” – satisfactory – while not necessarily optimal.
The term has been applied in economics to consumer searches, profit maximization, and
financial decision making. In the case of grades, students may evaluate a certain course
grade as sufficient for their goals, even though it is not maximal (in the sense that they
could achieve a higher grade if they wanted).13
12 It is presumed that optimizing students seek to maximize their expected course grade. It is altogether reasonable to believe students may have some other focus such as overall GPA or even utility. While interesting, the absence of related data such as concurrent course load and grade point average make this line of investigation impossible. 13 We recognize that colleges may differ in their grading policies in a way that will influence students’ choices in this regard. At the university where the grades being studied were produced, if a student repeats a course (takes the same course more than once) then the all course grades are averaged. So students always
13
IV. DATA
Data for this study come from five semesters of a large section Principles of
Finance course taught by one of the authors at a medium-sized public research university
in the northeastern U.S. from Fall 2003 to Fall 2005. Each semester, 350 to 400 students
were enrolled in the only two sections of the course offered, 1,945 students in all for the
period of the study. All the sections studied were taught by the same instructor and used
the same syllabus, text, topics, and teaching methods. Based on a survey done during one
of the semesters, we know that students were almost entirely upperclassmen (99%) and
either business majors (49%) or minors (48%). More than half (56%) were male and
more than half (58%) had a cumulative GPA above 3.00.14
Each semester, three exams, including two in-terms and a comprehensive final,
were administered, with an equal weighting of the highest two scores constituting the
student’s exam average. All exams were multiple choice, with each in-term containing
between 30 and 40 questions and the final containing 50 to 60 questions. The in-terms
each covered half the course content. The first exam was administered at the mid-point of
the semester, the second during the last week of classes. The final was an equal mix of
questions based on topics from the two halves and was administered during final exams
have reason to maximize their grade. However, we know that at some schools if a student earns an F and repeats the course (earning a higher grade) the F is not calculated in the student’s GPA. However, if they earned a D initially and repeated the course, both the D and the higher grade are included. Thus, at the university being studied, but not necessarily elsewhere, a student with an F going into the final has every reason to take the final. Furthermore, at some colleges, but not the one being studied here, if a student needs at least a C for the course to count toward their major and they currently have an F, they might not take the final, even if a D is possible, if it does them no good in the long run. At the university being studied, students need to maintain a B- average in all Business School courses (of which the course being studied is one). Thus, again, these students have every incentive to take the final exam. 14 We do not have demographic information for each semester. As a result, we cannot determine the effects of major, GPA, or course load on students’ choices.
14
week, within about one week of the second exam. Course letter grades with plus and
minus modifiers were assigned based on numerical grades ranging from 0 to 100. For all
semesters the final numerical course grade was rounded to the nearest integer before a
letter grade was determined. The minimum rounded score necessary for each letter grade
was A:93, A-:90, B+:87, B:83, B-:80, C+:77, C:73, C-:70, D+:67, D:60. D- was not
given. These cut-offs were known to students when they decided whether to take the final
exam.
V. RESULTS
A. Strategic Behavior
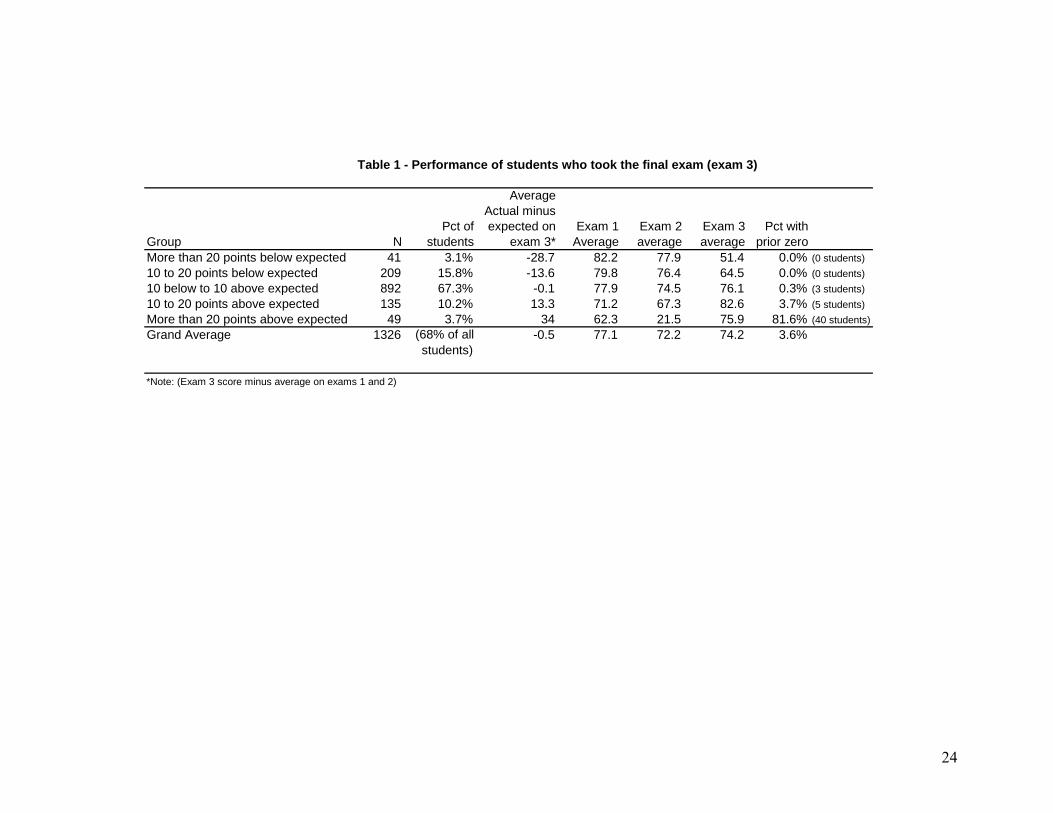
Table 1 presents summary statistics of students who took the third (final) exam.
The students are grouped according to their performance on exam 3 relative to their
expected score. Comparing the distribution of scores in Table 1 to the normal
distribution, as shown in Figure 1, we see that actual scores closely resemble what would
be expected given their prior scores (as explained in section II). Yet, normality of actual
scores is rejected, using the standard criteria15, because of the high frequency of scores
around the expected score and the larger than ‘normal’ (although still relatively small)
share of scores above expected. Thus, some strategic behavior is occurring – as
evidenced by the fat tails – even though it appears that most students fall near the
expected value (are not engaging in strategic behavior).
[Figure 1 goes about here]
15 The Cramer-von Mises statistic is 1.35 (p=0.0000); Watson = 1.28 (p=0.0000); and Anderson-Darling = 10.42 (p=0.0000), as calculated in EViews 6.
15
Looking at Table 1, evidence of strategic behavior is clear for some students but
not apparent for most. Two thirds of students scored within 10 percentage points of their
expected score on exam 3, and the mean difference between actual and expected is less
than one point. Thus, the bulk of students appeared to put forth consistent effort on all
three exams. Only 13.9% of students scored 10 or more points above their expected score
(indicating that they seriously underperformed on exam 1 or 2). In addition, one-third of
all students did well enough on the first two exams that they did not even take the final.
Thus, more than 80% of all students show no sign of strategic behavior that represents
underprovision of effort on the first two exams.
[Table 1 goes about here]
The fat tails are indicators of students who may have engaged in strategic
behavior: 3.1% of students scored more than 20 points above their expected score and
3.7% scored more than 20 points below their expected score. But this is a quite small
portion of students. Of students who scored more than 20 points above their expected
score, 81 percent had missed a prior exam (40 students out of 1945). Most of the strategic
behavior in this group consisted of missing an exam entirely, making up the missed score
later.
The students who scored more than 20 points below their expected score by and
large simply took the final exam lightly. Students in this group generally had very good
scores on the first two exams but scored very poorly on the final.16 (Their strategic
approach appears to have been to take the final exam without much studying since the
score on the exam could always be dropped (or, in the case of the student who scored
3.33%, showing up for the exam and concluding that they were unprepared and unlikely 16 One student scored as low as 3.33%.
16
to improve their score [this particular student had scores of 75 and 80 on the first two
exams]).
Of the 344 students who scored 10 to 20 points above or below their expected
score (209 and 105, respectively), only 5 (1.5 percent) missed a prior exam. For the rest,
the improvement/decline can be attributed to either improved/poorer studying or
better/worse luck than they had on a prior exam (i.e., being asked the subset of questions
to which they knew/did not know the answer).
Thus, the type of strategic behavior that could negatively affect student learning
(e.g., reduced studying for the first two exams) appears to be practiced by only a small
subset of students.17 The bulk of students show signs of either increased effort on the first
two exams (so as to avoid an additional exam, which could be considered a form of
strategic behavior) or no change in effort.
B. The Decision to Take the Final
Table 2 shows, by semester and course grade entering the final, the number of
students who completed the final exam. Table 3 shows the percentage in each category.
Overall, 68% of students submitted a final exam. Of the 193 students who had an A-
going into the final, just over half, 52%, decided to take the final exam. This percentage
increased as the grade going into the final decreased: 70% of those with a B+ completed
17 Of course, students who reduce their study effort for one of the first two exams have to make up for it by studying for a comprehensive final.
17
a final exam, 75% of those with a B, and so on, until it declines slightly for those with a
D, and more dramatically for those failing the course going into the final.18
[Tables 2 and 3 go about here]
The less than 100% rate may be evidence of “satisficing.” It appears in our study
that a great many students are happy to have a certain grade less than the maximum
attainable (whatever that may be for the particular student), as they forego the
opportunity to improve their course letter grade. Almost 50 percent of students with an
A- forego the opportunity to earn an A, which for some meant scoring less than two
points higher on E3 than their prior lowest score -- which was mathematically likely, as
we discussed earlier. This is true for all other grade categories, as well.
Students may be evaluating the cost of attaining the higher grade, measured
mostly by study time, against the benefits. If higher performance on exams requires an
increasingly higher study time, i.e., increasing marginal cost of studying (Grade =
f(Studytimeb), b<1), then raising one’s score from 90 to 95 requires more study time than
raising one’s score 5 points from 85 to 90. Given that the student may have exams in
other courses, the additional time studying could be spent elsewhere and so has real cost.
Students were more likely to take the final the greater the difference between
exam one and exam two scores. We see this in Figure 2, which shows the percentage of
students who took the final exam for each level of difference between exam 1 and exam 2
scores. A large spread might be the result of a “bad exam day” or poor preparation for
one of the exams, leading students to think they can improve upon that poor score (with
better luck or more effort, as the case may be). The likelihood that a student will
18 The improvement necessary to raise one’s grade one “step” (I from equation 10) rises for D & F because the course did not use a “-“ modifier for the D letter grade and modifiers are eliminated on the F. This might explain the drop off in the percentage of students who take the final.
18
complete the final exam is strongly related to the spread, but appears to be strongest if the
first exam score is higher than the second.
[Figure 2 goes about here]
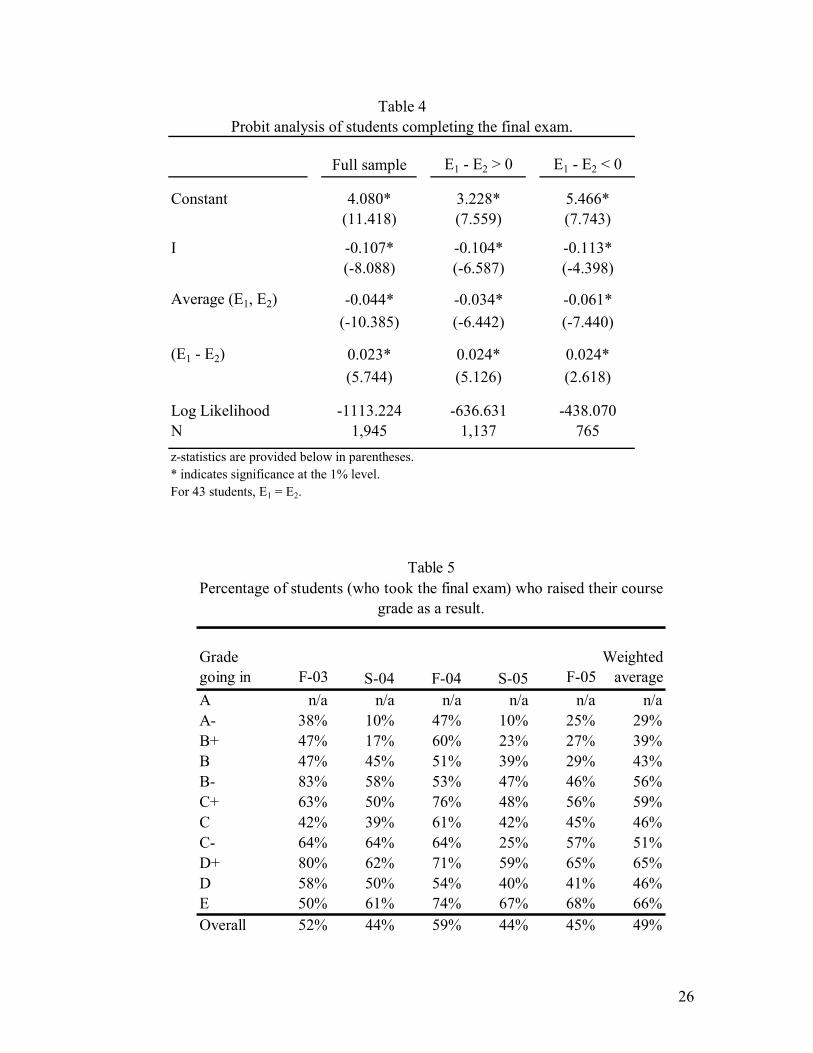
To examine these possibilities more closely we use a probit model to measure the
factors that influence a student’s decision to take the final exam. The following probit
equation is tested:
( ) ( )E - (E ),E ,average(E I,1final take Prob 2121f== )
(11)
where I is the number of points needed on the final exam to improve the final grade in the
class, average(E1, E2) is the average of the in-term exams, and (E1 – E2) is the difference
in the scores on the two in-term exams.19 We perform this analysis on the full sample
using the absolute value of the difference in the exam scores (|E1 – E2|).
The results, found in Table 4, show each of these factors significantly contributed
to the student’s decision. The greatest effect was from the number of points needed to
improve their final grade in the class (value for I in equation 10). As the challenge of
improving their course grade increased, students were less likely to sit for the final exam.
In addition, students appear to become satisfied with their grade. As their performance on
the first two exams (and, in turn, their course grade) rises they are less likely to take the
final, regardless of how close or far the next grade might be. Lastly, students view the
final as an opportunity to make up for a poor performance, or simply recognize the
implicit expected improvement (equation 5 vs. equation 1). As the difference between the
two exam scores rises, students are more likely to take the final exam.
[Table 4 goes about here]
19 The results do not change appreciably if we replace ‘average of in-term exams’ with ‘course grade going in to the final.’ These results are available on request.
19
Based upon visual inspection of Figure 2, we speculate that students were less
responsive to difference in exam score when exam 2 was higher. We investigate this by
breaking the data into two subsets: E1 – E2 > 0 (Column 2) and E1 – E2 < 0 (Column 3). It
shows the results are virtually identical. While the difference in exam performance is an
important factor when deciding to take the final exam, which exam was higher was not.
Additional analysis could have been performed if we had complete student
demographic and academic data, but they were not available. While the lack of such data
limits the questions we can address (e.g., do business students behave differently than
others?) the absence of variables such as course load, major, and GPA will not affect the
findings significantly. Excluding variables such as course load, which are uncorrelated
with the other explanatory variables, has minor effect. According to Wooldridge (2002, p.
470), while the estimates of the coefficients (β) in a probit are inconsistent given an
omitted variable, β/σ is not, and “we should remember that, in nonlinear models, we
usually want to estimate partial effects and not just parameters. For the purposes of
obtaining the directions of the effects or the relative effects of the explanatory variables,
estimating β/σ is just as good as estimating β.” Further, “probit of y on x consistently
estimates the average partial effects, which is usually what we want.” Certainly, "absolute
value of the difference in exam performance" and "points needed for higher grade" (from
equation 11) are not correlated with missing demographic information such as major,
gender, and SAT. "Average of in-term exams" may, on the other hand, be correlated with
variables such as GPA and major, with an effect that is less clear but likely is small
(Cramer, 2005). The signs will be unchanged and the conclusions (based on the signs) are
the same.
20
C. Grade Inflation
Lastly, we compare the distribution of course grades with and without the grade
dropping. One concern with the practice of dropping the lowest grade is the potential for
grade inflation. We find that, on average, scores on the final exam are three and a half
points above the lowest of the first two exam scores, as expected (ignoring students who
missed one of the first two exams). As Fig 1 shows, most scores on the final exam were
near the exam 1 and 2 average (the expected score). Overall, 803 students who took the
final replaced a low score on one of the first two exams. This represents 60.6% of those
who took the final and 41.3% of the entire class. 650 students (49% of students who took
the final and 33.4% of all students) improved their course grade as a result (details in
Table 5). Those most likely to replace a low score with their final exam score were, of
course, the ones who did very poorly on one of the first two exams, as shown in Figure 3.
Nevertheless, excluding students who missed either exam 1 or 2, the class GPA with the
grade dropping policy was 2.87, compared to 2.66 without dropping the lowest score
(based on the average of the first two exams and no third exam). That is, the class GPA of
actual course grades was 2.87, while the GPA of grades going into the final (based on just
exams 1 and 2) was 2.66. Thus, grade inflation seems small.
[Table 5 goes about here]
[Figure 3 goes about here]
VI. CONCLUSIONS
Our examination of the choices of 1,945 students over five semesters in a class in
which the lowest exam score is dropped provides evidence that a small number of
students engage in strategic behavior by under preparing for or altogether missing an
21
exam whose score they know can be dropped. The performance of most students, though,
shows no evidence of strategic behavior. We do find evidence that students satisfice –
that is, achieve a level of performance that is satisfactory (or sufficient) but less than
optimal.
We also find that students were less likely to take the final exam the higher their
performance on the first two exams and the greater the number of points required to
achieve a higher course letter grade, while they were more likely to sit for the final exam
the greater the difference between the first two exam scores.
Dropping the lowest grade leads to a modest upward shift in the grade
distribution, but the bulk of the increase in grades occurs at the lower end of the
distribution – the dropping policy provides students who did poorly on one of the prior
exams a second chance to demonstrate their understanding of the course material.
No doubt, more research can be done on the topics of grade dropping, student
satisficing, and strategic behavior by students generally. While there is no reason to
believe that findings in this paper are not generalizable, future research might broaden the
analysis to other universities and courses. Future research could also measure some of the
other benefits that may be associated with a grade-dropping policy that we were unable to
with our data set.20 Of particular interest is the relative importance of satisificing,
opportunity cost of studying, and risk attitudes, and mis-measurement on prior exams as
reasons for taking or not taking the final. Greater understanding of these and related
issues will not only lead to improved grading policies, but improved instruction and
greater learning.
20 We also no longer teach the large lecture courses examined in this paper and so are unable to engage in some of the suggestions.
22
23
REFERENCES
Davis, B. 1993. Tools for Teaching. San Francisco: Jossey-Bass.
Biehler, R. F. and J. Snowman. 1982. Psychology Applied to Teaching. 4th edition. Boston: Houghton Mifflin Company.
Chickering, A. and Z. F. Gamson. 1991. Applying the Seven Principles for Good Practice in Undergraduate Education. New Directions for Teaching and Learning. Number 47, Fall. San Francisco: Jossey-Bass Inc.
Cramer, J.S. (2005) “Omitted Variables and Misspecified Distrubances in the Logit Model.” Tinbergen Institute Discussion Paper. Accessed December 2008 at http://www.tinbergen.nl/discussionpapers/05084.pdf.
Deci, E. L., and R. Richard. 1987. “The Support of Autonomy and the Control of Behavior.” Journal of Personality and Social Psychology 53: 1024-1037.
Johnson, J. 1996. "Individualization of Instruction." Faculty Focus, Fall.
MacDermott, R. 2009. “The Effects of Dropping a Grade in Intermediate Macroeconomics.” New York Economic Review, forthcoming. McKeachie, W. J. 1999. Teaching Tips. Houghton Mifflin Company. Nelson, C. 1996. “Student Diversity Requires Different Approaches to College Teaching, Even in Math and Science.” American Behavioral Scientist 40(2): 165-176. Pintrich, P. R. and D. H. Schunk. 1996. Motivation in Education: Theory, Research, and Applications. Englewood Cliffs, NJ: Prentice Hall Sewell, E. 2004. “Grade Dropping: An Empirical Analysis.” Journal of Economic Education 35(1): 24-34. Simon, H. A. 1957. Models of Man: Social and Rational. New York: Wiley. Wooldridge, Jeffery M. (2002). Econometric Analysis of Cross Section and Panel Data. Cambridge, MA. MIT Press.
24
Table 1 - Performance of students who took the final exam (exam 3)
Group NPct of
students
Average Actual minus expected on
exam 3*Exam 1
AverageExam 2 average
Exam 3 average
Pct with prior zero
More than 20 points below expected 41 3.1% -28.7 82.2 77.9 51.4 0.0% (0 students)10 to 20 points below expected 209 15.8% -13.6 79.8 76.4 64.5 0.0% (0 students)10 below to 10 above expected 892 67.3% -0.1 77.9 74.5 76.1 0.3% (3 students)10 to 20 points above expected 135 10.2% 13.3 71.2 67.3 82.6 3.7% (5 students)More than 20 points above expected 49 3.7% 34 62.3 21.5 75.9 81.6% (40 students)Grand Average 1326 (68% of all -0.5 77.1 72.2 74.2 3.6%
students)
*Note: (Exam 3 score minus average on exams 1 and 2)
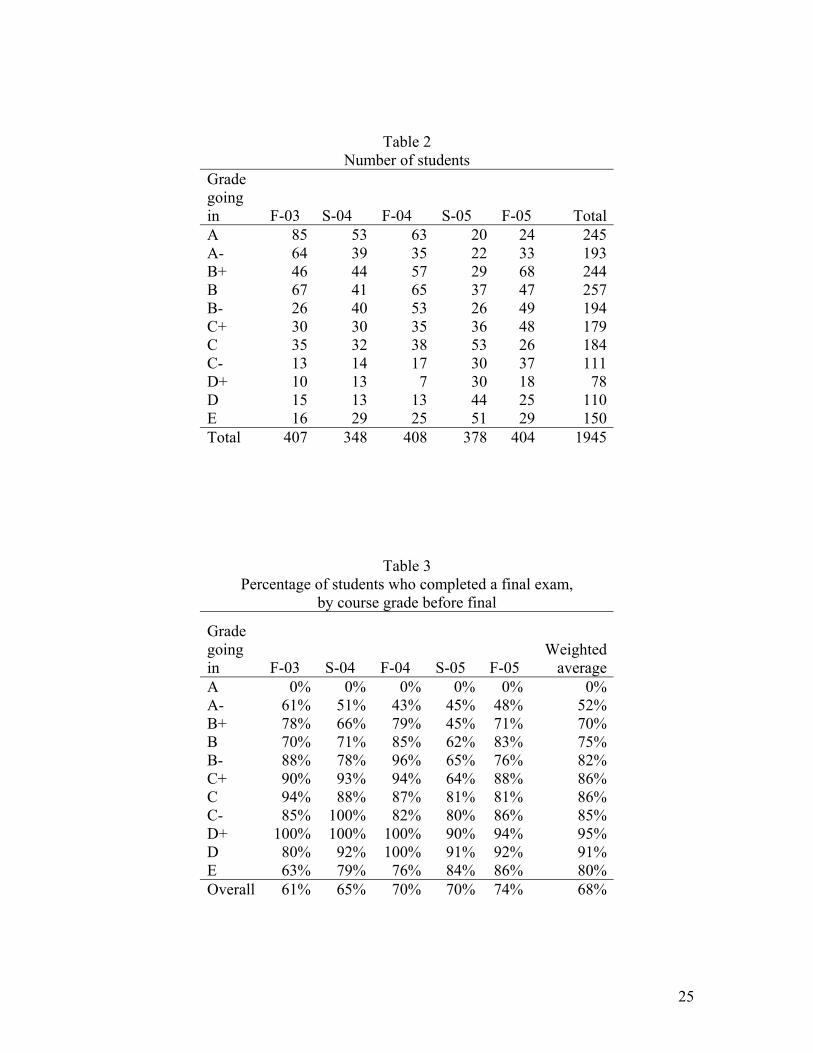
Table 2 Number of students
Grade going in F-03 S-04 F-04 S-05 F-05 Total A 85 53 63 20 24 245 A- 64 39 35 22 33 193 B+ 46 44 57 29 68 244 B 67 41 65 37 47 257 B- 26 40 53 26 49 194 C+ 30 30 35 36 48 179 C 35 32 38 53 26 184 C- 13 14 17 30 37 111 D+ 10 13 7 30 18 78 D 15 13 13 44 25 110 E 16 29 25 51 29 150 Total 407 348 408 378 404 1945
Table 3 Percentage of students who completed a final exam,
by course grade before final
Grade going in F-03 S-04 F-04 S-05 F-05
Weighted average
A 0% 0% 0% 0% 0% 0% A- 61% 51% 43% 45% 48% 52% B+ 78% 66% 79% 45% 71% 70% B 70% 71% 85% 62% 83% 75% B- 88% 78% 96% 65% 76% 82% C+ 90% 93% 94% 64% 88% 86% C 94% 88% 87% 81% 81% 86% C- 85% 100% 82% 80% 86% 85% D+ 100% 100% 100% 90% 94% 95% D 80% 92% 100% 91% 92% 91% E 63% 79% 76% 84% 86% 80% Overall 61% 65% 70% 70% 74% 68%
25
Full sample E1 - E2 > 0 E1 - E2 < 0
Constant 4.080* 3.228* 5.466*(11.418) (7.559) (7.743)
I -0.107* -0.104* -0.113*(-8.088) (-6.587) (-4.398)
Average (E1, E2) -0.044* -0.034* -0.061*(-10.385) (-6.442) (-7.440)
(E1 - E2) 0.023* 0.024* 0.024*(5.744) (5.126) (2.618)
Log Likelihood -1113.224 -636.631 -438.070N 1,945 1,137 765z-statistics are provided below in parentheses.* indicates significance at the 1% level.For 43 students, E1 = E2.
Table 4Probit analysis of students completing the final exam.
Grade going in F-03 S-04 F-04 S-05 F-05
Weighted average
A n/a n/a n/a n/a n/a n/aA- 38% 10% 47% 10% 25% 29%B+ 47% 17% 60% 23% 27% 39%B 47% 45% 51% 39% 29% 43%B- 83% 58% 53% 47% 46% 56%C+ 63% 50% 76% 48% 56% 59%C 42% 39% 61% 42% 45% 46%C- 64% 64% 64% 25% 57% 51%D+ 80% 62% 71% 59% 65% 65%D 58% 50% 54% 40% 41% 46%E 50% 61% 74% 67% 68% 66%Overall 52% 44% 59% 44% 45% 49%
Table 5Percentage of students (who took the final exam) who raised their course
grade as a result.
26
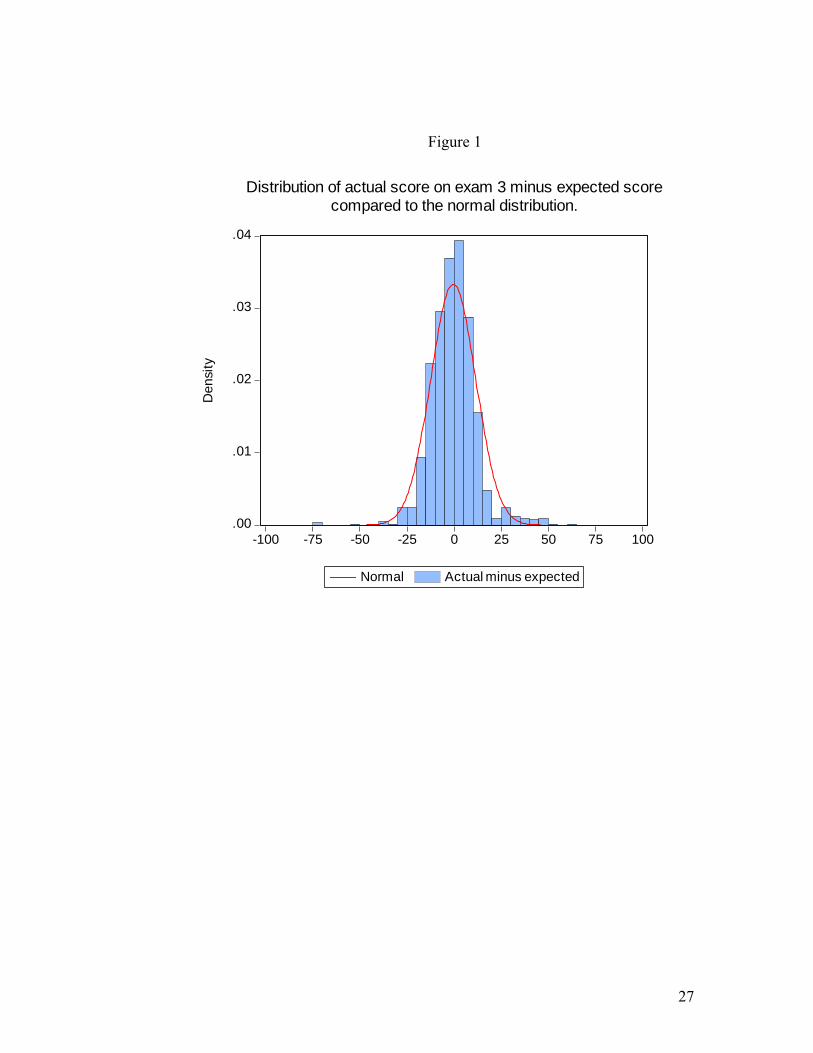
Figure 1
.00
.01
.02
.03
.04
-100 -75 -50 -25 0 25 50 75 100
Normal Actual minus expected
Den
sity
Distribution of actual score on exam 3 minus expected scorecompared to the normal distribution.
27
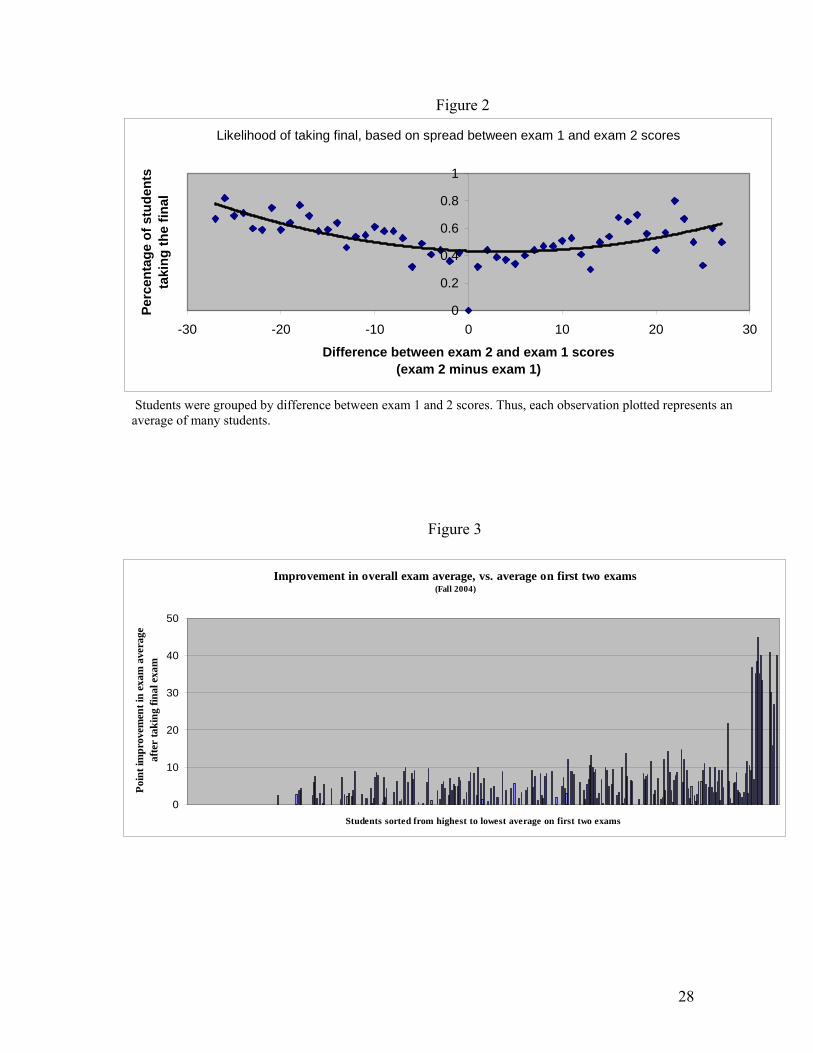
Figure 2
Likelihood of taking final, based on spread between exam 1 and exam 2 scores
0
0.2
0.4
0.6
0.8
1
-30 -20 -10 0 10 20 30
Difference between exam 2 and exam 1 scores (exam 2 minus exam 1)
Perc
enta
ge o
f stu
dent
s ta
king
the
final
Students were grouped by difference between exam 1 and 2 scores. Thus, each observation plotted represents an average of many students.
Figure 3
Improvement in overall exam average, vs. average on first two exams(Fall 2004)
0
10
20
30
40
50
Students sorted from highest to lowest average on first two exams
Poin
t im
prov
emen
t in
exam
ave
rage
afte
r ta
king
fina
l exa
m
28


![Visker, Rudi [1994] Dropping- The](https://img.pdfslide.net/doc/110x75/577cd0841a28ab9e78927851/visker-rudi-1994-dropping-the.jpg)