Embed Size (px)
Citation preview

Southern Outlook Conference September 27, 2016
Mark Welch Extension Economist—Grain Marketing
[email protected] (979)845-8011
Grain Outlook
390
300
310
320
330
340
350
360
370
380
390
400
+3.7 kg per person per year (about 8 lbs)
Corn for fuel 2006: 2 billion bu 2010: 5 billion bu
World Per Capita Grain Use
barley, corn, millet, mixed grains, oats, rice, rye, sorghum, soybeans, and wheat
kg
USDA, Foreign Agricultural Service, PSD, 9/14/2016

BRIC Countries, Average Income
0
2,000
4,000
6,000
8,000
10,000
12,000
14,000
16,00019
8019
8219
8419
8619
8819
9019
9219
9419
9619
9820
0020
0220
0420
0620
0820
1020
1220
1420
1620
1820
20
Brazil Russia India China
World Bank, GNI per capita, 9/14/2016 http://data.worldbank.org/indicator/
Current US$
Rank, GDP #13, $1.3T #9, $1.8T #2, $10.9T #7, $2.1T
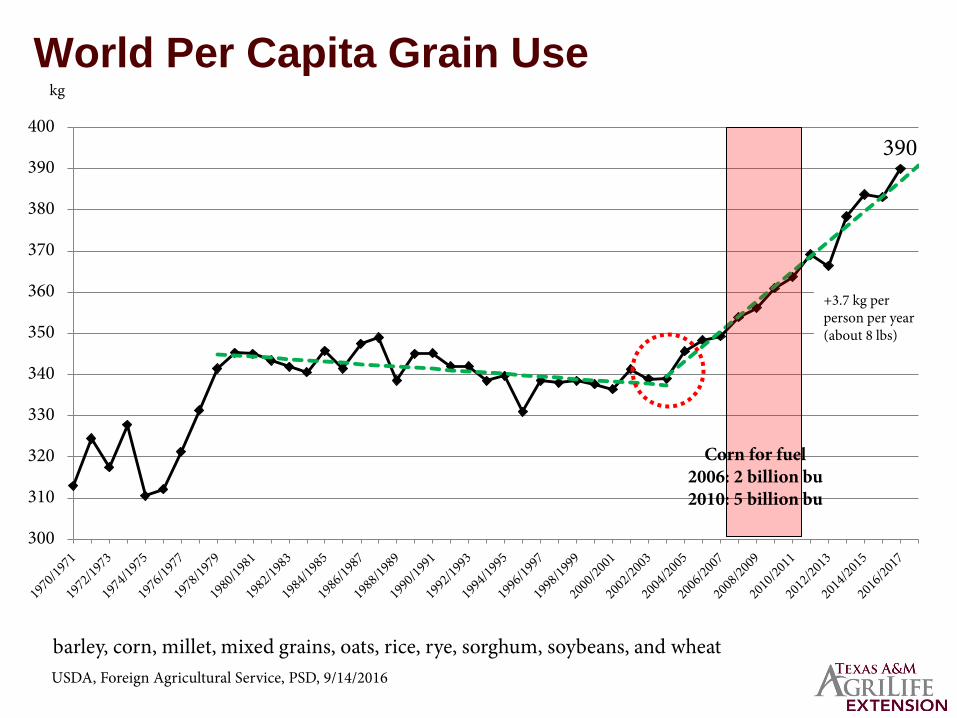
World Days of Use on Hand, 9/12/2016
79 78
0
20
40
60
80
100
120
140
Days of Use 20-yr avg
80 79
020406080
100120140
Days of Use 20-yr avg
123
106
0
20
40
60
80
100
120
140
Days of Use 20-yr avg
88 92
0
20
40
60
80
100
120
140
Days of Use 20-yr avg
Corn
Rice Wheat
Soybeans
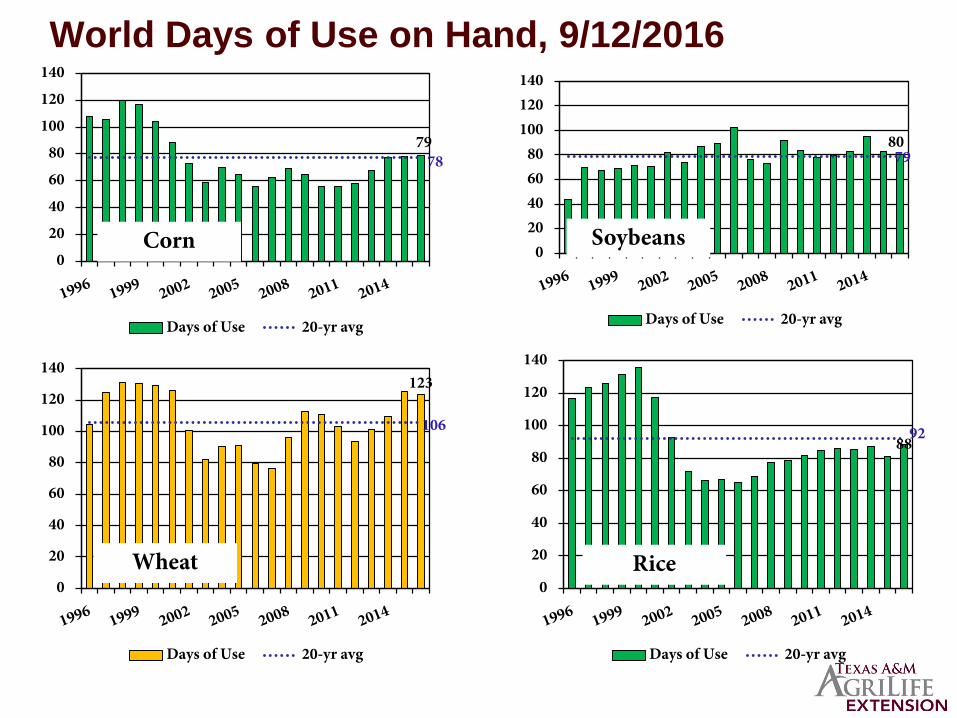
Marketing Year Average Corn Prices
3.24
6.89
3.20
0.46 0.78
1.29
2.38
4.65
0.00
1.00
2.00
3.00
4.00
5.00
6.00
7.00
8.00
1866
1870
1874
1878
1882
1886
1890
1894
1898
1902
1906
1910
1914
1918
1922
1926
1930
1934
1938
1942
1946
1950
1954
1958
1962
1966
1970
1974
1978
1982
1986
1990
1994
1998
2002
2006
2010
2014
SAFP Pre WWI WWI to WWIIPost WWII World Trade Biofuel Era
$/bu
WASDE, Updated 9/12/2016
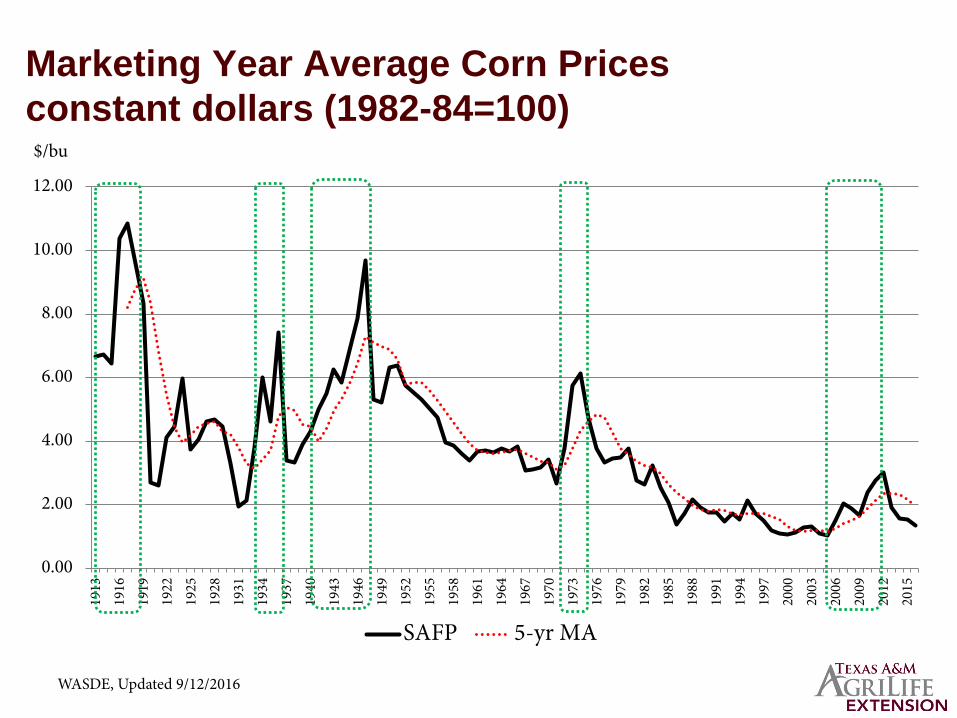
Marketing Year Average Corn Prices constant dollars (1982-84=100)
0.00
2.00
4.00
6.00
8.00
10.00
12.00
1913
1916
1919
1922
1925
1928
1931
1934
1937
1940
1943
1946
1949
1952
1955
1958
1961
1964
1967
1970
1973
1976
1979
1982
1985
1988
1991
1994
1997
2000
2003
2006
2009
2012
2015
SAFP 5-yr MA
$/bu
WASDE, Updated 9/12/2016

U.S. Corn: Disappearance
0
1,000
2,000
3,000
4,000
5,000
6,000
7,000
80/8
181
/82
82/8
383
/84
84/8
585
/86
86/8
787
/88
88/8
989
/90
90/9
191
/92
92/9
393
/94
94/9
595
/96
96/9
797
/98
98/9
999
/00
00/0
101
/02
02/0
303
/04
04/0
505
/06
06/0
707
/08
08/0
909
/10
10/1
111
/12
12/1
313
/14
14/1
515
/16
16/1
7
Million Bushels
Feed & Residual
Exports Food Seed Industrial
Source: USDA WASDE, 9/12/2016
Fuel
Ending Stocks

U.S. Sorghum Disappearance
0
100
200
300
400
500
600
700
800
1980
/198
119
81/1
982
1982
/198
319
83/1
984
1984
/198
519
85/1
986
1986
/198
719
87/1
988
1988
/198
919
89/1
990
1990
/199
119
91/1
992
1992
/199
319
93/1
994
1994
/199
519
95/1
996
1996
/199
719
97/1
998
1998
/199
919
99/2
000
2000
/200
120
01/2
002
2002
/200
320
03/2
004
2004
/200
520
05/2
006
2006
/200
720
07/2
008
2008
/200
920
09/2
010
2010
/201
120
11/2
012
2012
/201
320
13/2
014
2014
/201
520
15/2
016
2016
/201
7
Ending Stocks Food, Seed, and Industrial Feed and Residual Exports
Million bushels
USDA, WASDE, 9/12/2016

Corn and Grain Sorghum Consumed for Fuel Alcohol, 2015/16 Marketing Year
050
100150200250300350400450500
Sep-
15
Oct
-15
Nov
-15
Dec
-15
Jan-
16
Feb-
16
Mar
-16
Apr
-16
May
-16
Jun-
16
Jul-1
6
Grain Sorghum
Corn
USDA, NASS, Grain Crushings and Co-Products Production
Mil bu

2016 December Corn Futures and Seasonal Index Patterns
9092949698100102104106108110
300320340360380400420440460
2016-C 20-yr avg 10-yr avg
Price Index
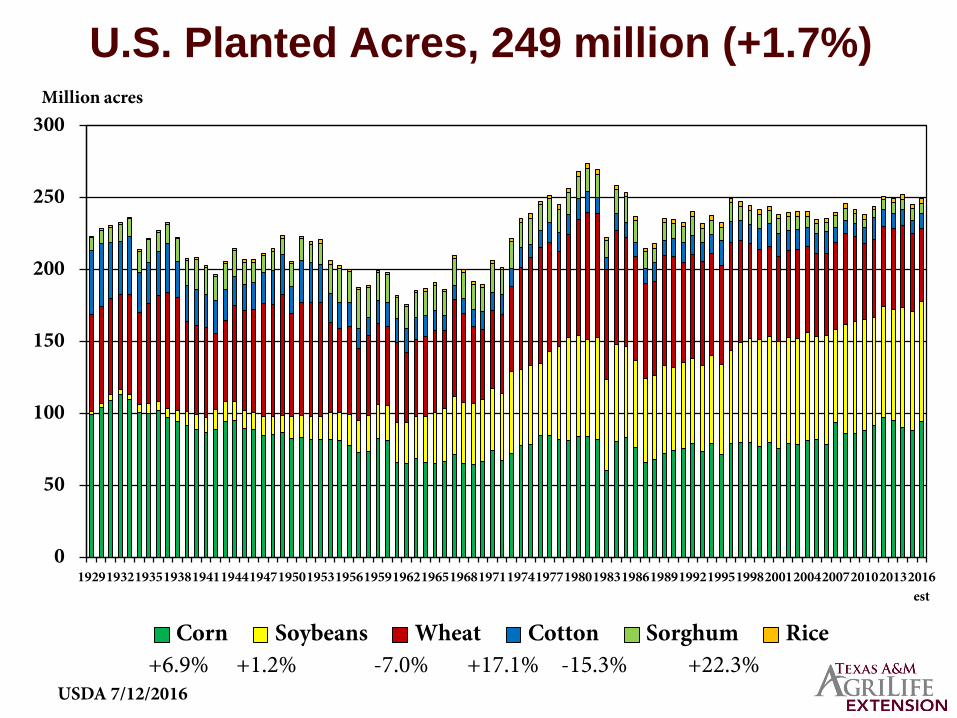
U.S. Planted Acres, 249 million (+1.7%)
0
50
100
150
200
250
300
192919321935193819411944194719501953195619591962196519681971197419771980198319861989199219951998200120042007201020132016est
Corn Soybeans Wheat Cotton Sorghum Rice
Million acres
USDA 7/12/2016 +6.9% +1.2% -7.0% +17.1% -15.3% +22.3%
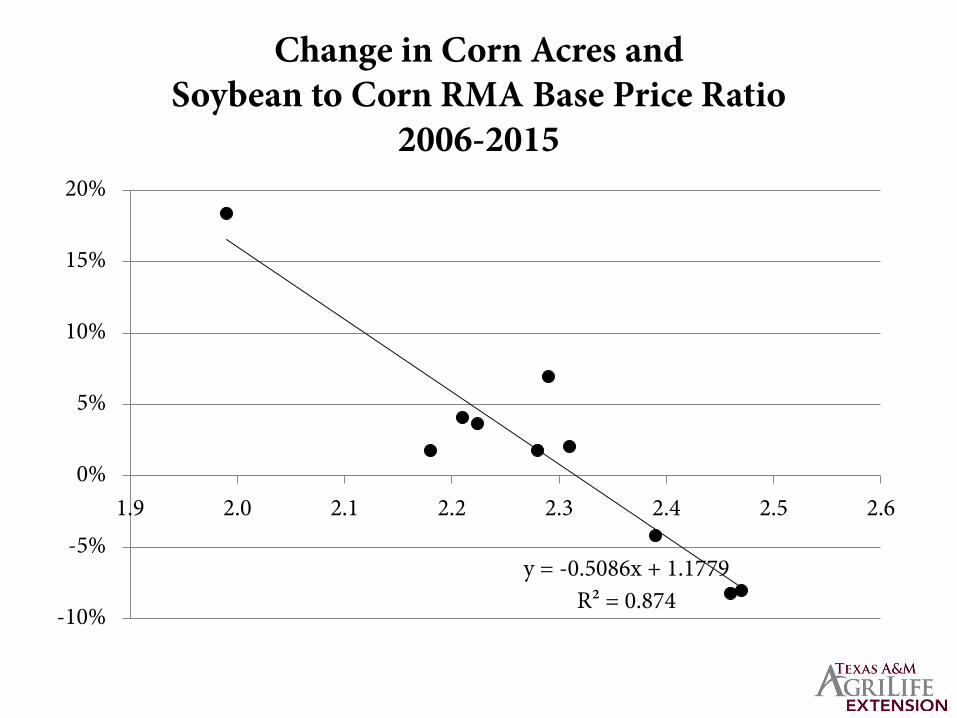
y = -0.5086x + 1.1779 R² = 0.874
-10%
-5%
0%
5%
10%
15%
20%
1.9 2.0 2.1 2.2 2.3 2.4 2.5 2.6
Change in Corn Acres and Soybean to Corn RMA Base Price Ratio
2006-2015
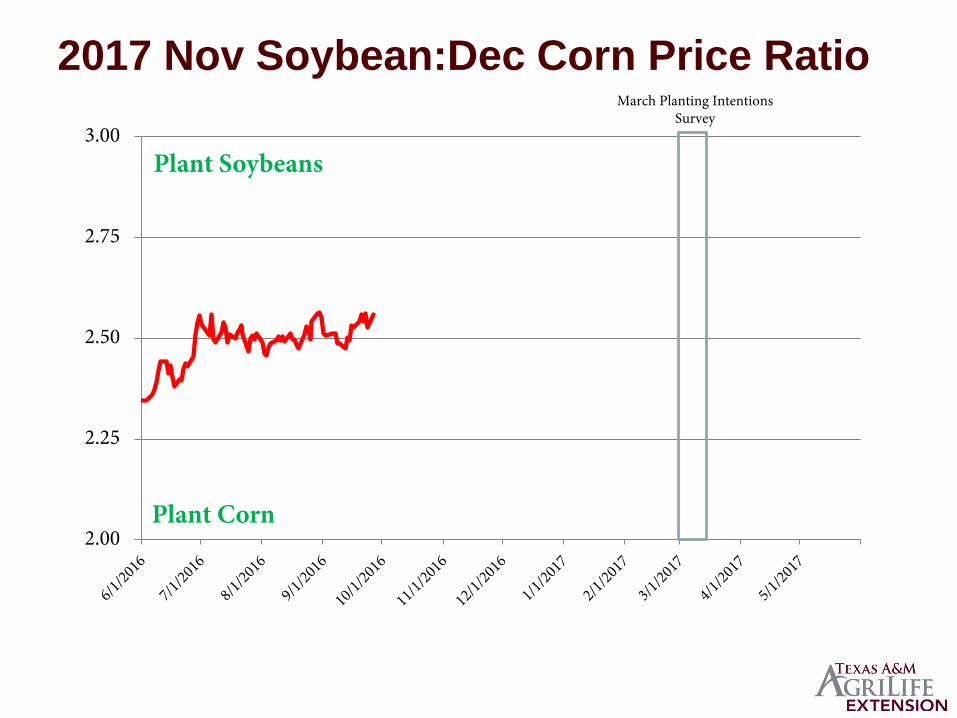
2017 Nov Soybean:Dec Corn Price Ratio
2.00
2.25
2.50
2.75
3.00Plant Soybeans
Plant Corn
March Planting Intentions Survey

ARC Program Texas High Plains Corn Example, $/base acre
ARC: Agricultural Risk Coverage
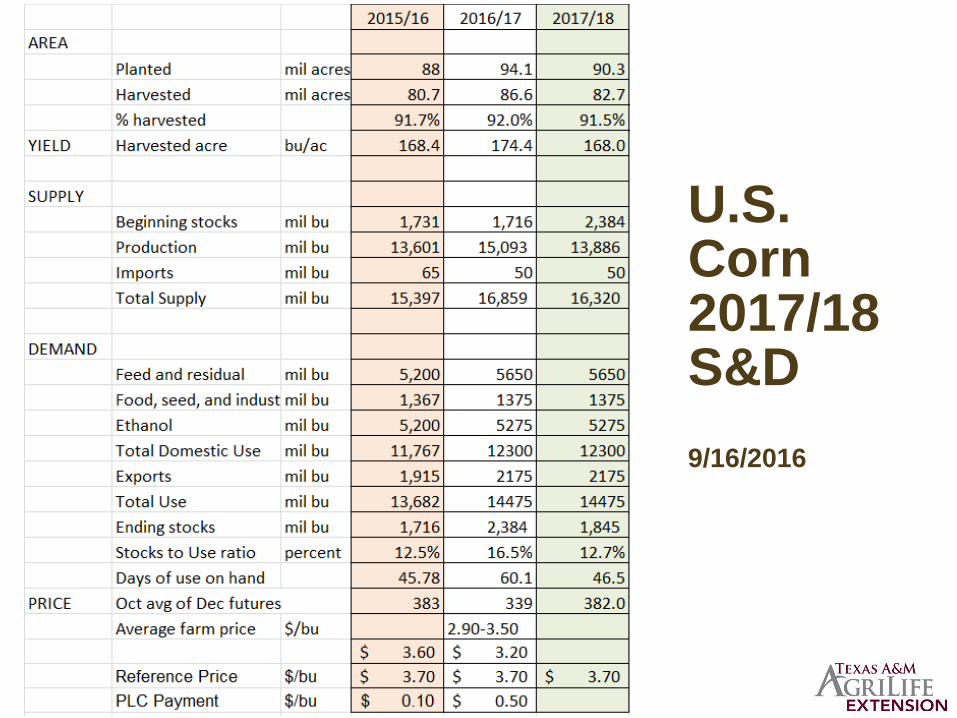
U.S. Corn 2017/18 S&D 9/16/2016

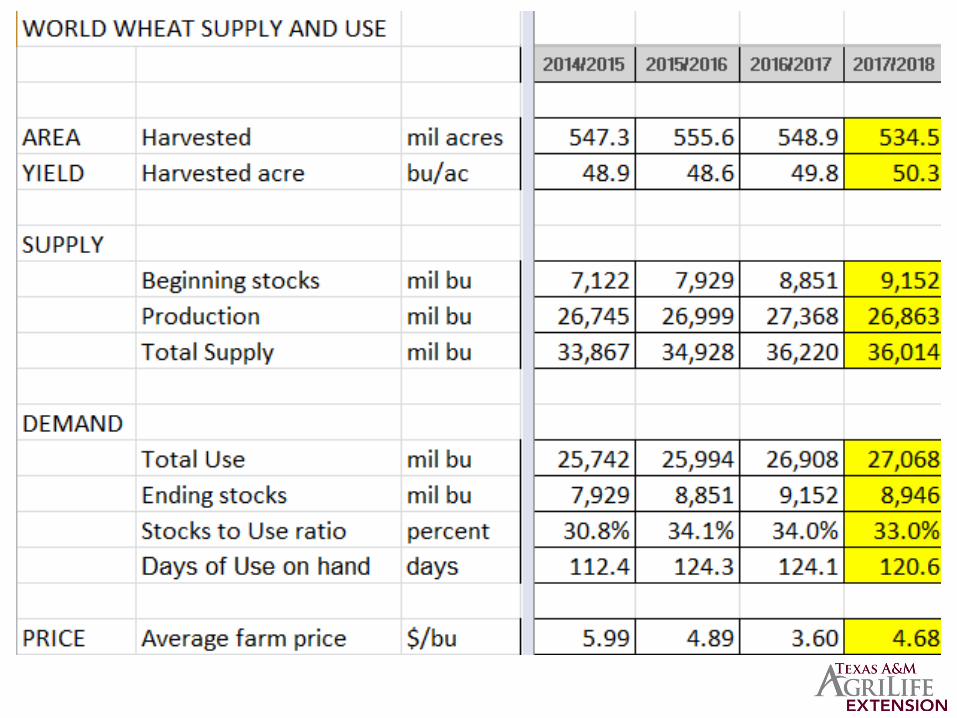
World Wheat Production
0
5
10
15
20
25
30
U.S. Foreign
Billion bushels
WASDE 9/12/2016
4 record wheat crops in row


U.S. Wheat Use
0
250
500
750
1,000
1,250
1,500
1,750
2,000
80/81
81/82
82/83
83/84
84/85
85/86
86/87
87/88
88/89
89/90
90/91
91/92
92/93
93/94
94/95
95/96
96/97
97/98
98/99
99/00
00/01
01/02
02/03
03/04
04/05
05/06
06/07
07/08
08/09
09/10
10/11
11/12
12/13
13/14
14/15
15/16
16/17
Million Bushels
Ending Stocks Feed and Residual Exports Food and Seed
WASDE, 9/12/2016
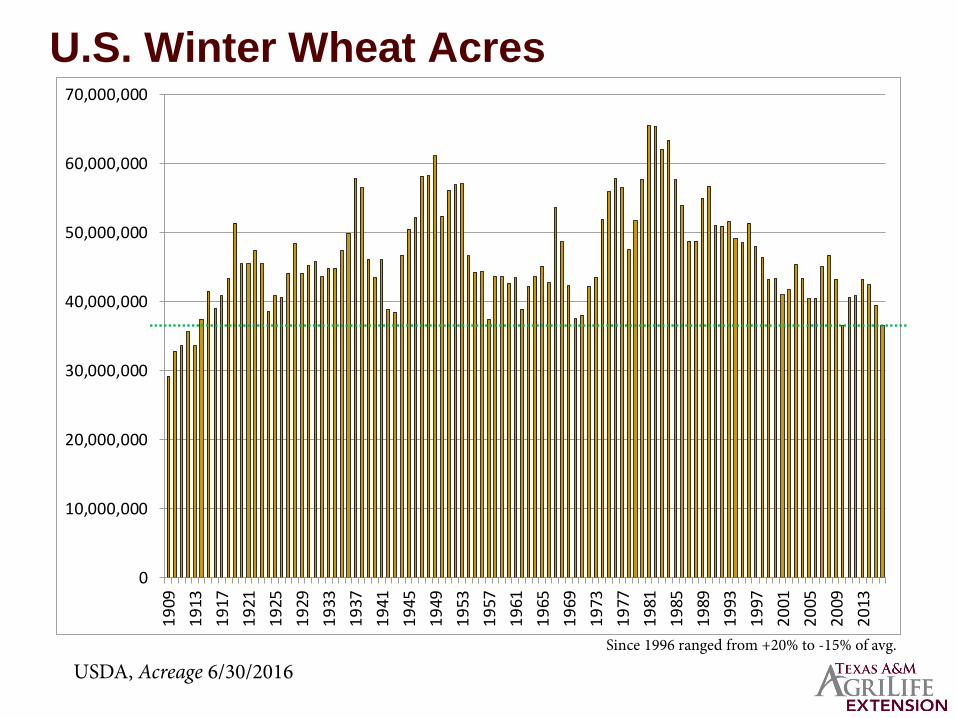
U.S. Winter Wheat Acres
0
10,000,000
20,000,000
30,000,000
40,000,000
50,000,000
60,000,000
70,000,000
1909
1913
1917
1921
1925
1929
1933
1937
1941
1945
1949
1953
1957
1961
1965
1969
1973
1977
1981
1985
1989
1993
1997
2001
2005
2009
2013
USDA, Acreage 6/30/2016 Since 1996 ranged from +20% to -15% of avg.

RMA Wheat Price
3.52
4.52
5.88
8.77
5.42
7.14
8.62 8.78
7.02
6.30
5.20
4.59 4.81
5.62
8.87
6.35
4.79
8.18
6.75
7.22 7.17
5.31
4.50
0.00
1.00
2.00
3.00
4.00
5.00
6.00
7.00
8.00
9.00
10.00
2006 2007 2008 2009 2010 2011 2012 2013 2014 2015 2016 2017
Base Price Harvest Price
$/bu
Base price setting period: August 15 through September 14 Harvest price setting period: June 1 through June 30
70% RP: $3.21 price floor

U.S. Wheat Planted Acres
40.0
45.0
50.0
55.0
60.0
65.0
70.0
75.0
80.0
Model Actual
Million acres
Planted acres = f(last year’s wheat, corn, soybean prices, and trend R^2 = 0.92
Updated 9/19/2016

World Wheat Area Harvested and previous year’s SAFP
0123456789
0
100
200
300
400
500
600
Area Harvested Average Area SAFP
Rarely varies by +/- 5%
Source: USDA, FAS, PSD 9/15/16
Mil acres $/bu

ENSO Alert System Status: Not Active ENSO-neutral conditions are present. Equatorial sea surface temperature (SST) are near or below average in the east-central and eastern Pacific Ocean. ENSO-neutral conditions are slightly favored (between 55-60%) during the upcoming Northern Hemisphere fall and winter 2016-17.
-2.0
-1.5
-1.0
-0.5
0.0
0.5
1.0
1.5
2.0
2.5
3.0
Actual Measurements Predicted
°C
El Niño/Southern Oscillation (ENSO) Diagnostic Discussion, 19 September 2016 http://www.cpc.ncep.noaa.gov/products/analysis_monitoring/enso_advisory/
El Nino Neutral La Nina
Oceanic Nino Index (ONI)
Latest actual weekly SST departure
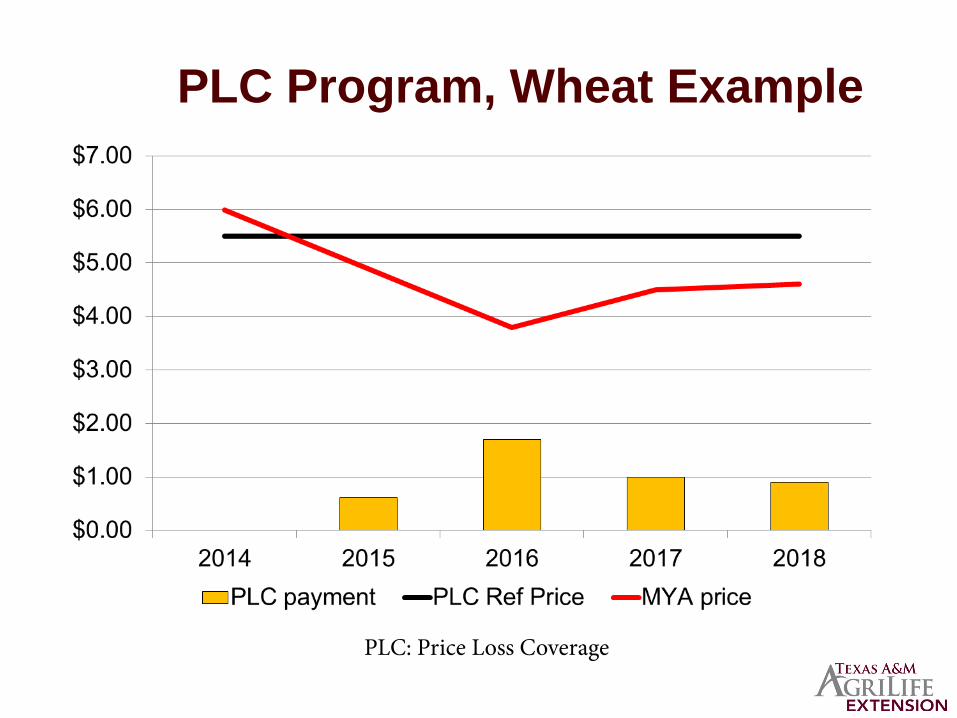
PLC Program, Wheat Example
PLC: Price Loss Coverage

PLC Program for Wheat Dryland farm, 22 bu avg yield, $/base acre
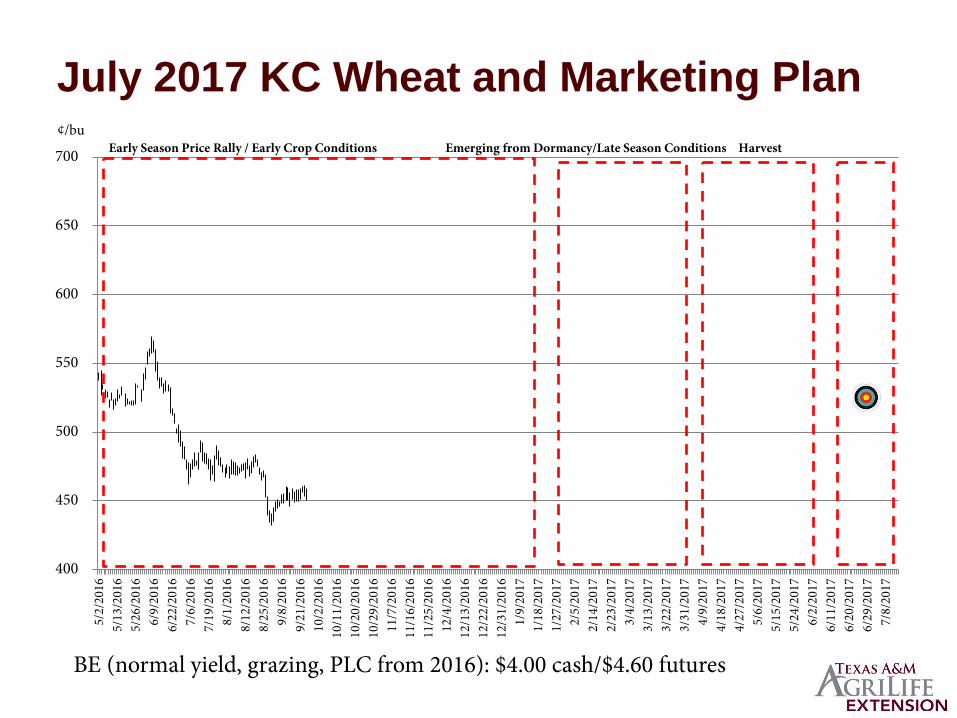
July 2017 KC Wheat and Marketing Plan
400
450
500
550
600
650
700
5/2/
2016
5/13
/201
65/
26/2
016
6/9/
2016
6/22
/201
67/
6/20
167/
19/2
016
8/1/
2016
8/12
/201
68/
25/2
016
9/8/
2016
9/21
/201
610
/2/2
016
10/1
1/20
1610
/20/
2016
10/2
9/20
1611
/7/2
016
11/1
6/20
1611
/25/
2016
12/4
/201
612
/13/
2016
12/2
2/20
1612
/31/
2016
1/9/
2017
1/18
/201
71/
27/2
017
2/5/
2017
2/14
/201
72/
23/2
017
3/4/
2017
3/13
/201
73/
22/2
017
3/31
/201
74/
9/20
174/
18/2
017
4/27
/201
75/
6/20
175/
15/2
017
5/24
/201
76/
2/20
176/
11/2
017
6/20
/201
76/
29/2
017
7/8/
2017
Early Season Price Rally / Early Crop Conditions Emerging from Dormancy/Late Season Conditions Harvest ¢/bu
BE (normal yield, grazing, PLC from 2016): $4.00 cash/$4.60 futures

[email protected], (979)845-8011 Mark Welch, Extension Economist--Grain Marketing