Embed Size (px)
Citation preview
Grain Price Outlook
China
A picture of China
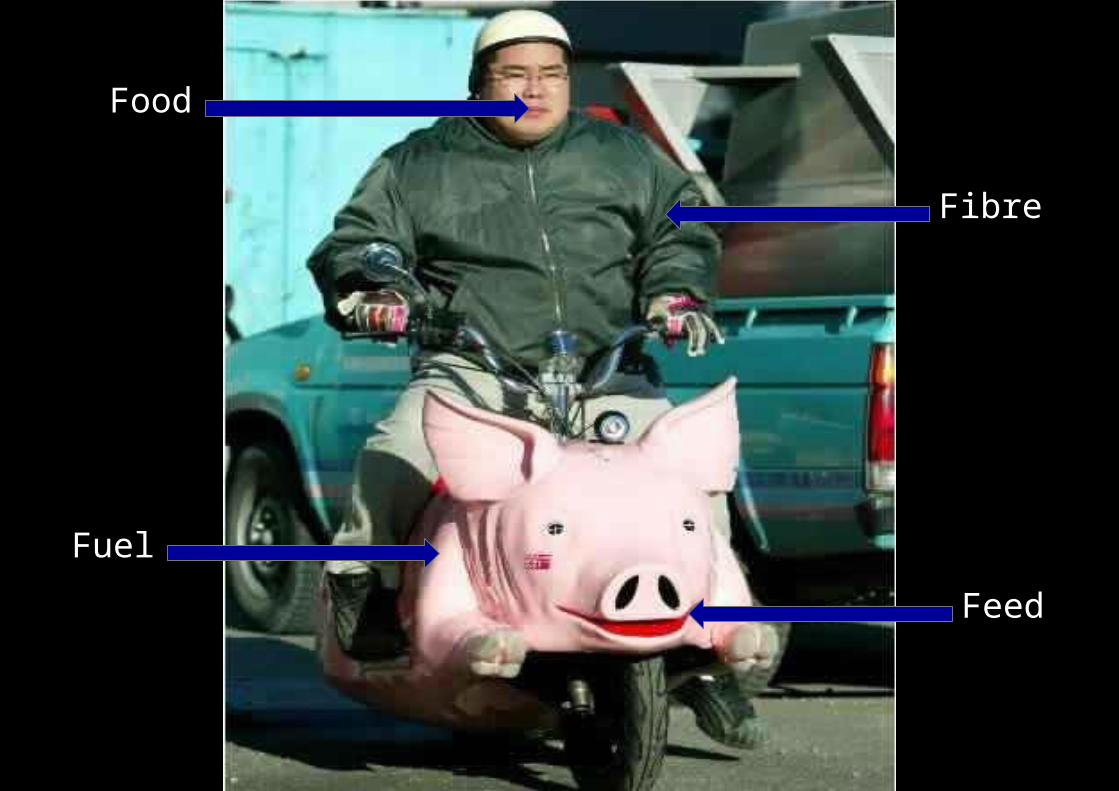
Food
Fuel
Feed
Fibre
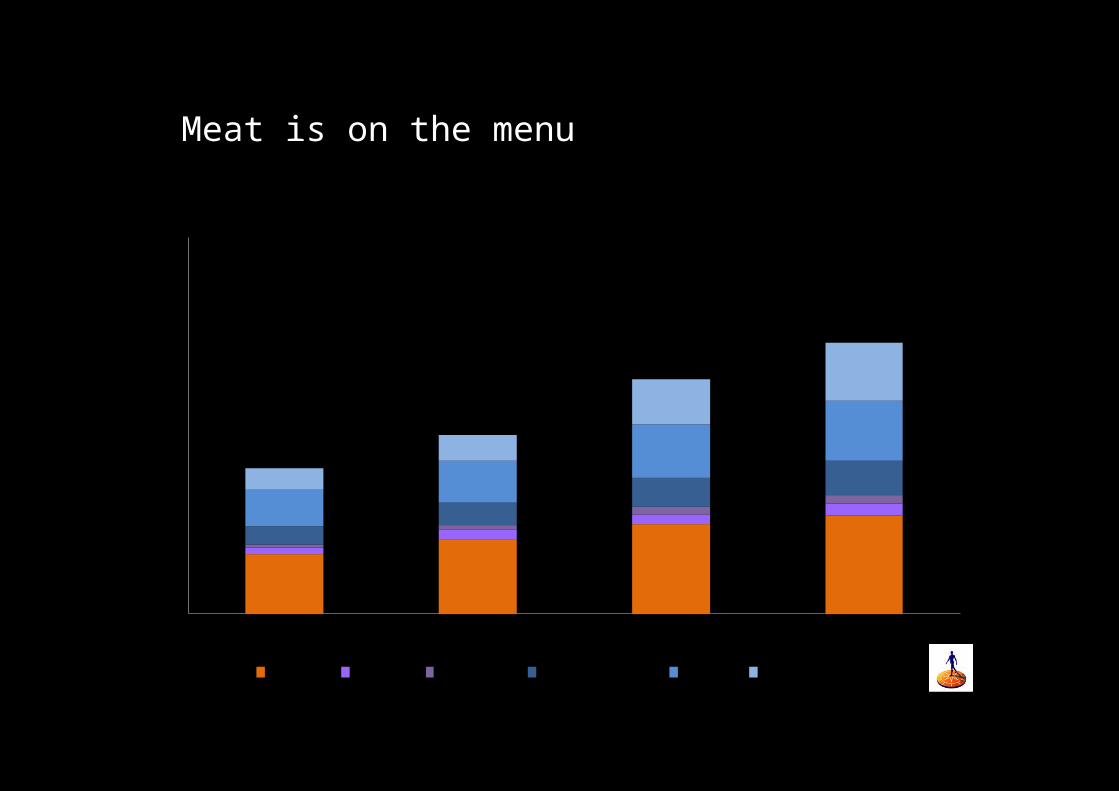
Meat is on the menu
0
20
40
60
80
100
120
140
160
180
200
1996 2000 2010 2015
Pork Beef Mutton Poultry meat Egg Aquatic product
Animal Protein Consumption in China
Source: FAO, Rabobank
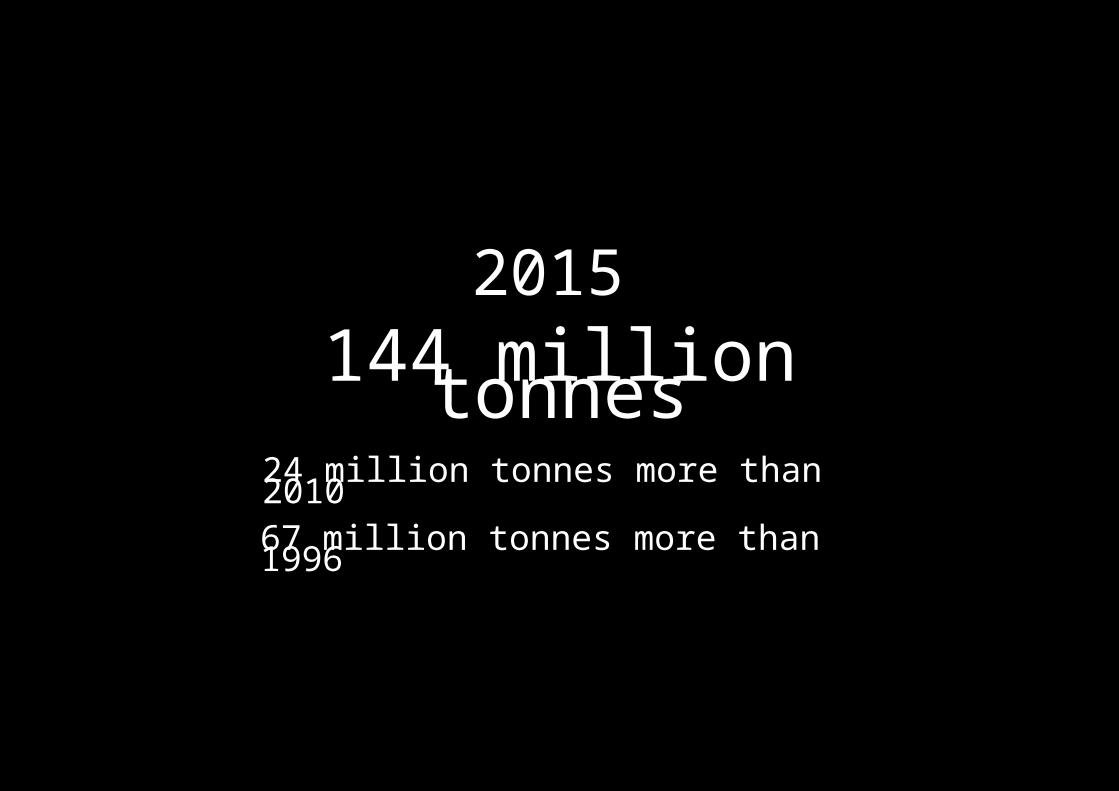
144 million tonnes2015
24 million tonnes more than 2010
67 million tonnes more than 1996
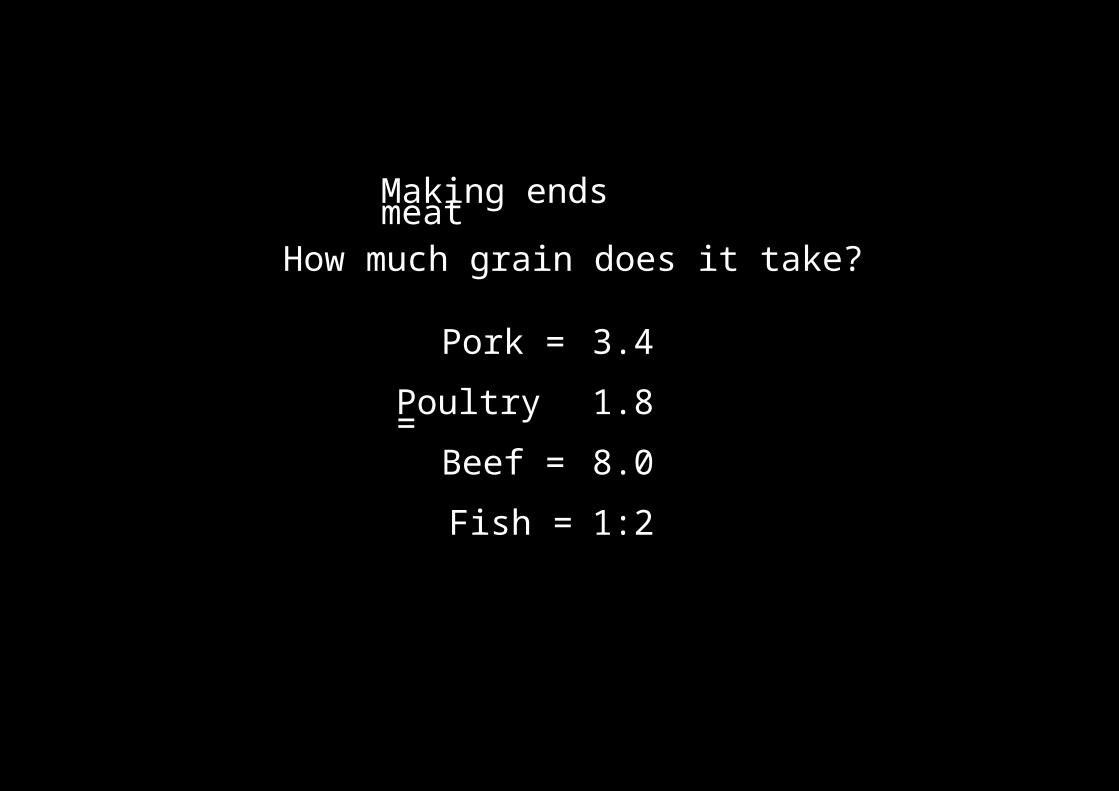
Making ends meat
How much grain does it take?
Pork =
Poultry =
Beef =
3.4
1.8
8.0
Fish = 1:2
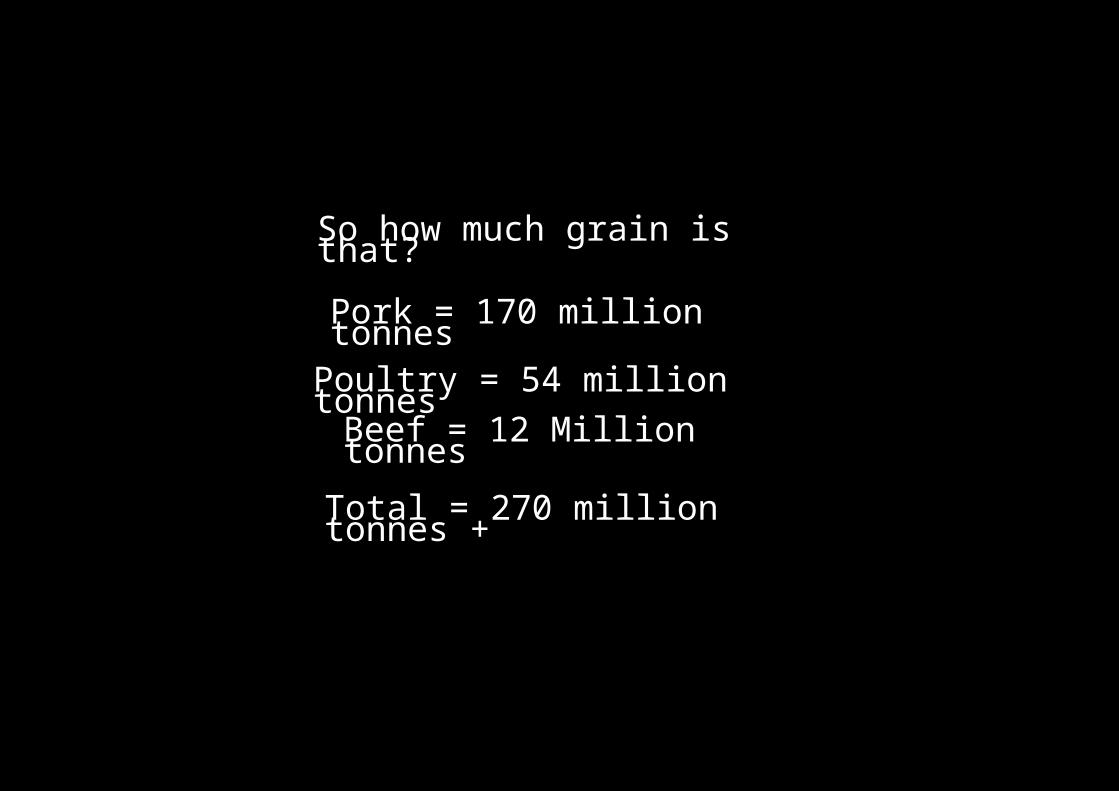
So how much grain is that?
Pork = 170 million tonnes
Poultry = 54 million tonnes
Beef = 12 Million tonnes
Total = 270 million tonnes +
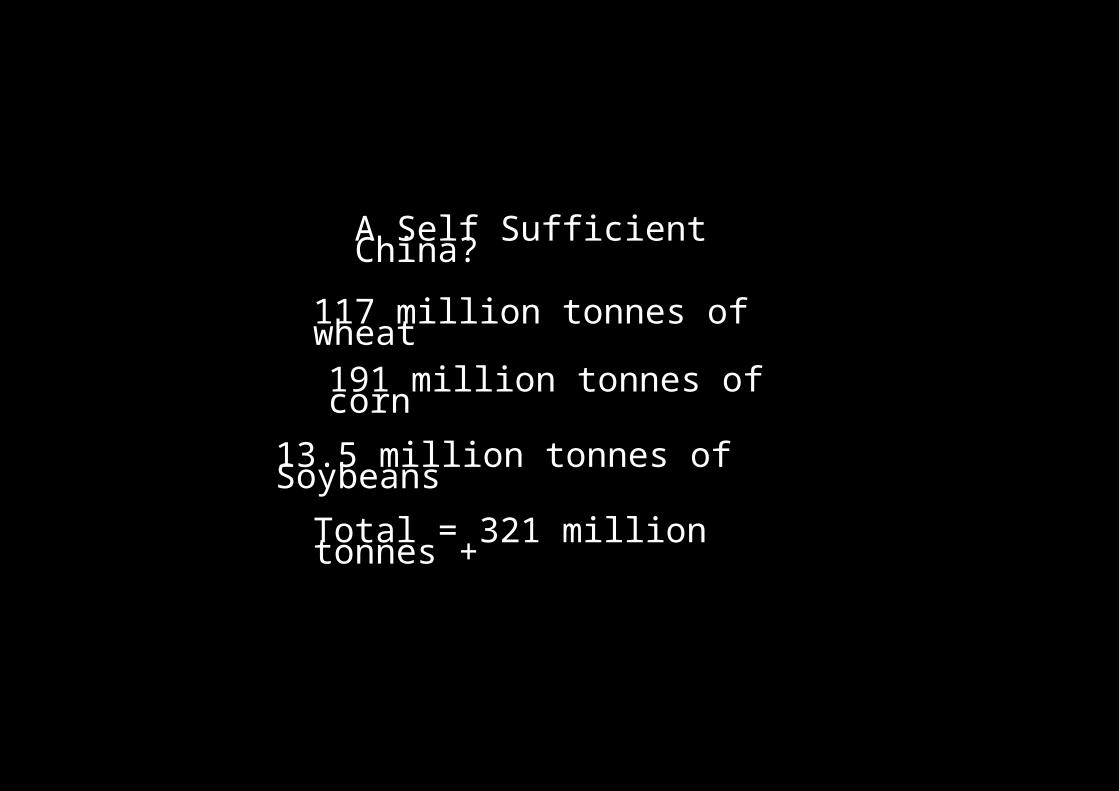
A Self Sufficient China?
117 million tonnes of wheat
191 million tonnes of corn
13.5 million tonnes of Soybeans
Total = 321 million tonnes +
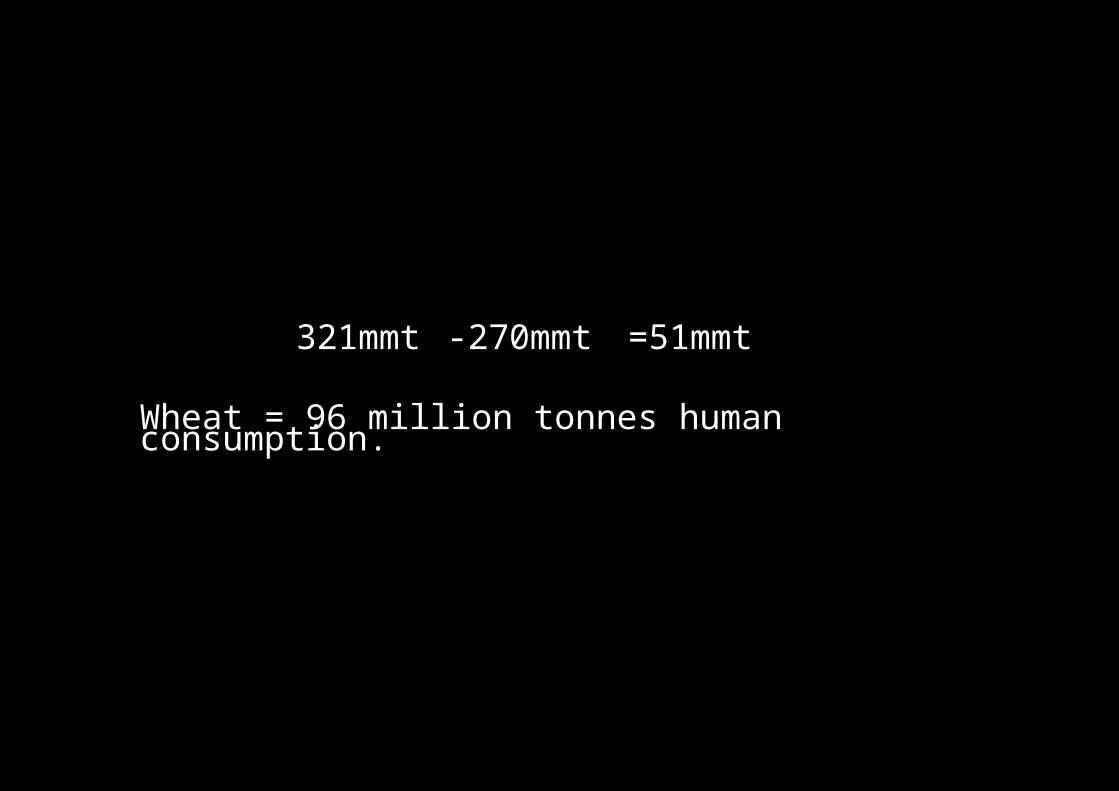
321mmt
Wheat = 96 million tonnes human consumption.
-270mmt
=51mmt

China’s Plan
1995-1997: More investment on agriculture to increase
grain production, to avoid the reoccurrence of former ag-in-
flation during 1993-1995;
1993
1994
1995
1996
1997
1998
1999
2000
2001
2002
2003
2004
2005
2006
2007
2008
2009
2010
2011
050
100150200250300350
0
100
200
300
400
500
600
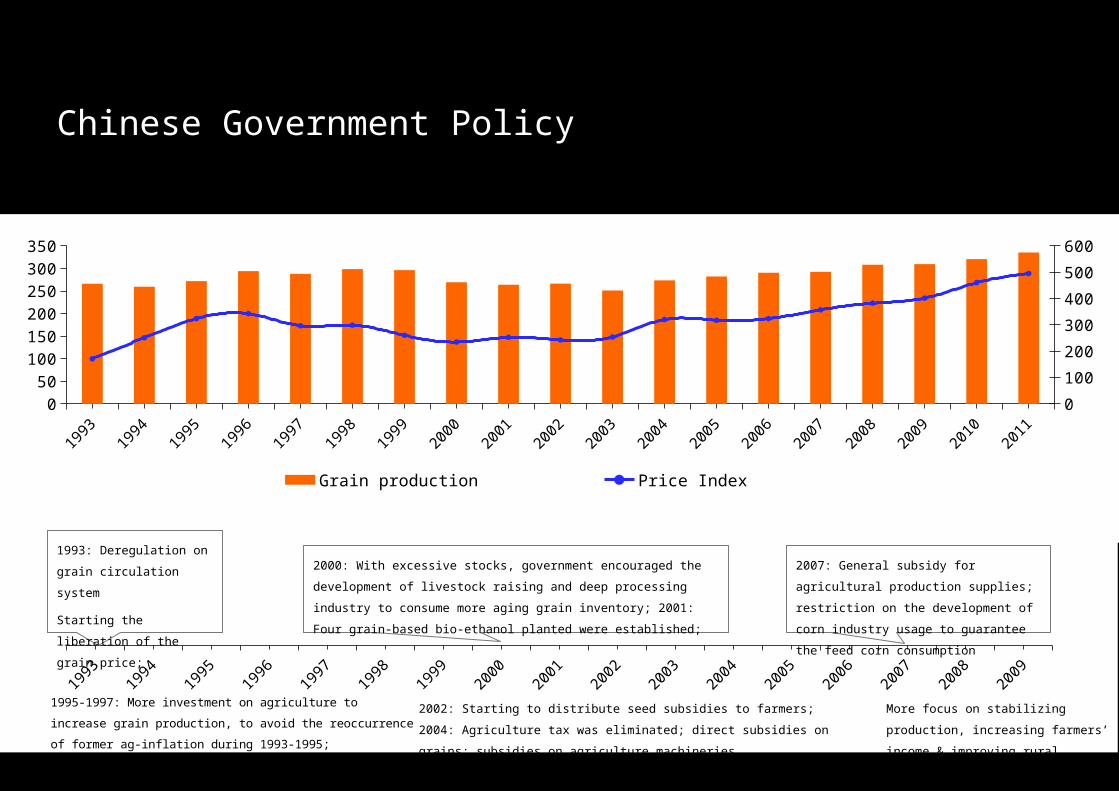
Grain production Price Index
1993: Deregulation on
grain circulation system
Starting the liberation of
the grain price;
2000: With excessive stocks, government encouraged the
development of livestock raising and deep processing industry to
consume more aging grain inventory; 2001: Four grain-based bio-
ethanol planted were established;
2002: Starting to distribute seed subsidies to farmers;
2004: Agriculture tax was eliminated; direct subsidies on grains; subsidies
on agriculture machineries
More focus on stabilizing production,
increasing farmers’ income &
improving rural infrastructures
2007: General subsidy for agricultural
production supplies; restriction on the
development of corn industry usage to
guarantee the feed corn consumption
Chinese Government Policy
1965
1966
1967
1968
1969
1970
1971
1972
1973
1974
1975
1976
1977
1978
1979
1980
1981
1982
1983
1984
1985
1986
1987
1988
1989
1990
1991
1992
1993
1994
1995
1996
1997
1998
1999
2000
2001
2002
2003
2004
2005
2006
2007
2008
2009
2010
-2%
-1%
0%
1%
2%
3%
4%
5%
6%
7%
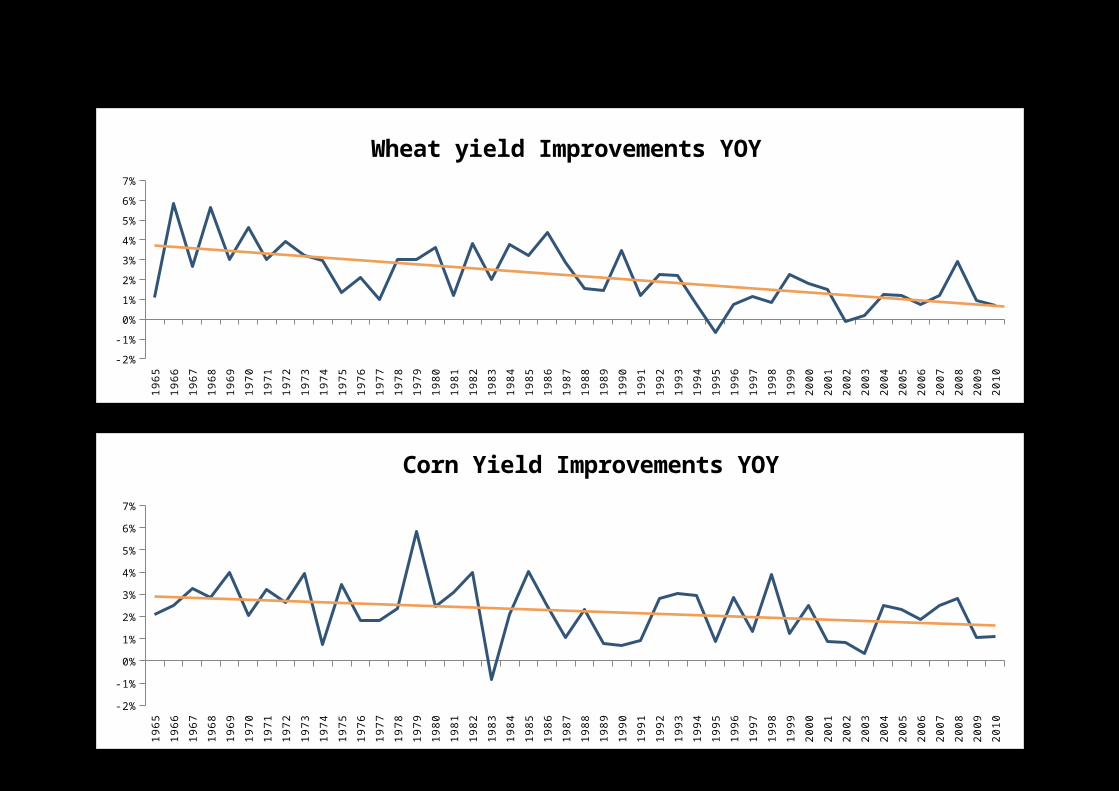
Corn Yield Improvements YOY
Is it working?
1965
1966
1967
1968
1969
1970
1971
1972
1973
1974
1975
1976
1977
1978
1979
1980
1981
1982
1983
1984
1985
1986
1987
1988
1989
1990
1991
1992
1993
1994
1995
1996
1997
1998
1999
2000
2001
2002
2003
2004
2005
2006
2007
2008
2009
2010
-2%
-1%
0%
1%
2%
3%
4%
5%
6%
7%
Wheat yield Improvements YOY
1996 1997 1998 1999 2000 2001 2002 2003 2004 2005 2006 2007 2008 2009 2010 2011116
118
120
122
124
126
128
130
132
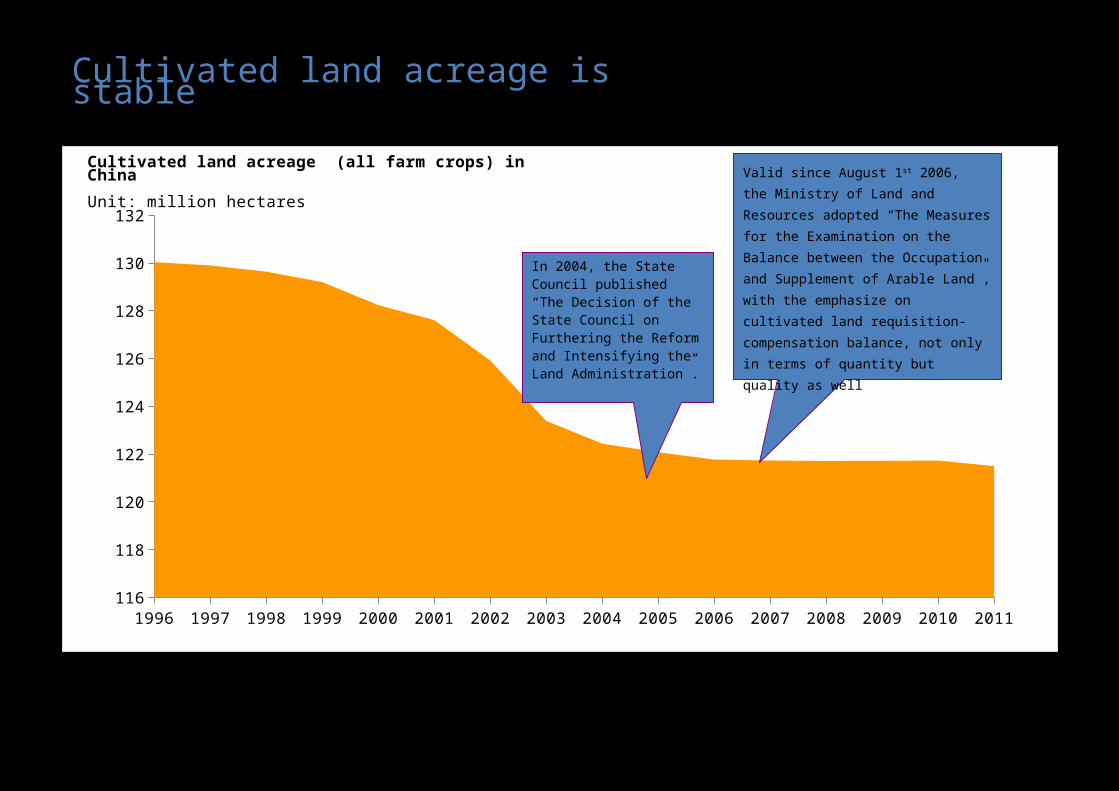
In 2004, the State Council published “The Decision of the State Council on Furthering the Reform and Intensifying the Land Ad-ministration”.
Cultivated land acreage (all farm crops) in China
Unit: million hectaresValid since August 1st 2006, the
Ministry of Land and Resources
adopted “The Measures for the
Examination on the Balance between
the Occupation and Supplement of
Arable Land”, with the emphasize on
cultivated land requisition-
compensation balance, not only in
terms of quantity but quality as well
Cultivated land acreage is stable
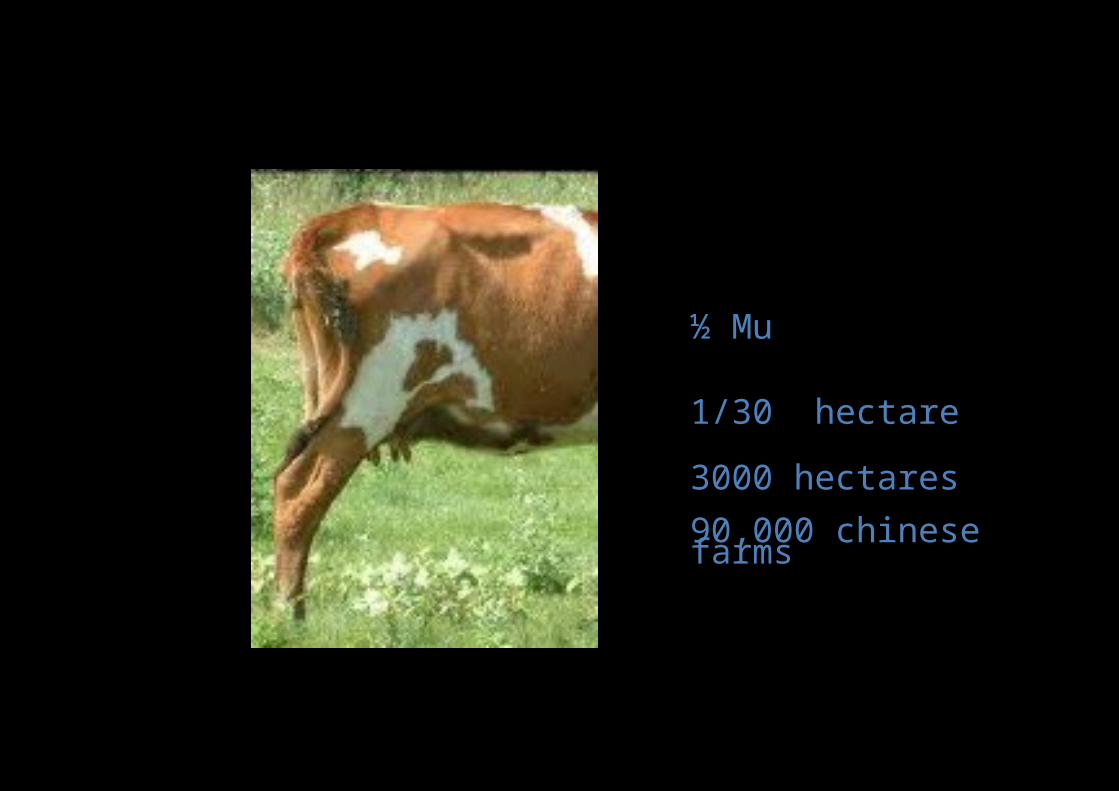
½ Mu
1/30 hectare
3000 hectares
90,000 chinese farms
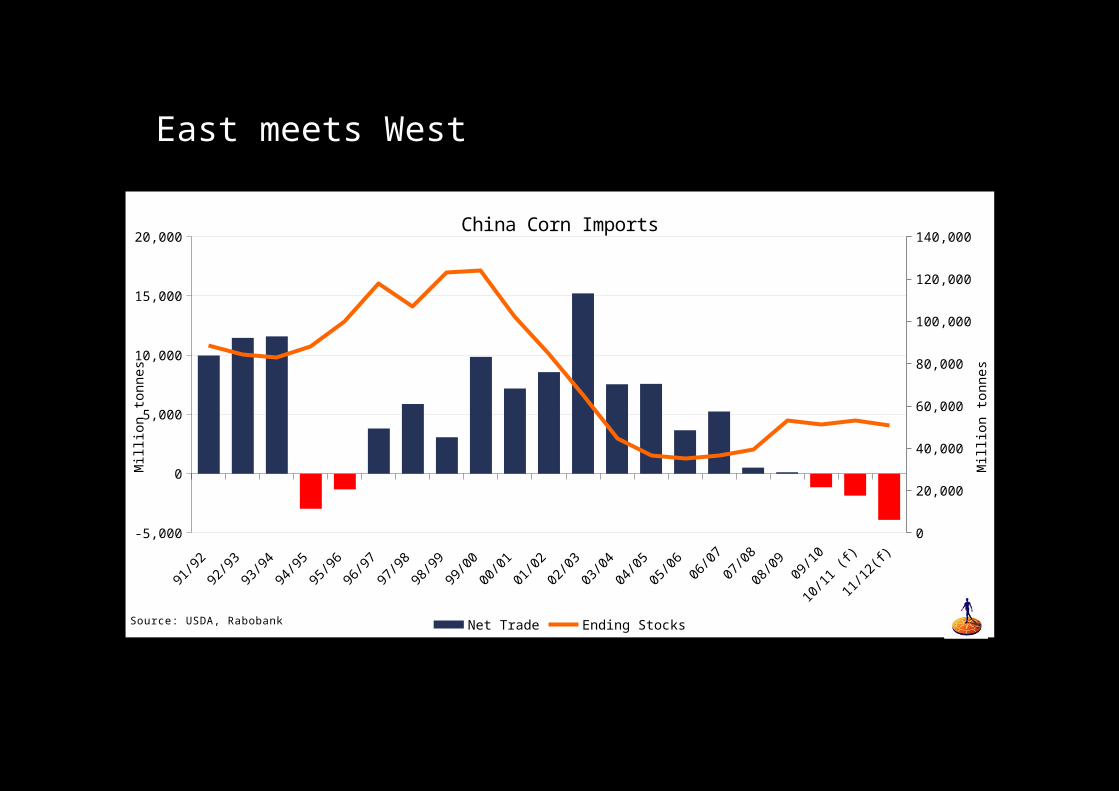
East meets West
91/9
2
92/9
3
93/9
4
94/9
5
95/9
6
96/9
7
97/9
8
98/9
9
99/0
0
00/0
1
01/0
2
02/0
3
03/0
4
04/0
5
05/0
6
06/0
7
07/0
8
08/0
9
09/1
0
10/1
1 (f)
11/1
2(f)
-5,000
0
5,000
10,000
15,000
20,000
0
20,000
40,000
60,000
80,000
100,000
120,000
140,000China Corn Imports
Net Trade Ending Stocks
Million t
onnes
Million t
onnes
Source: USDA, Rabobank
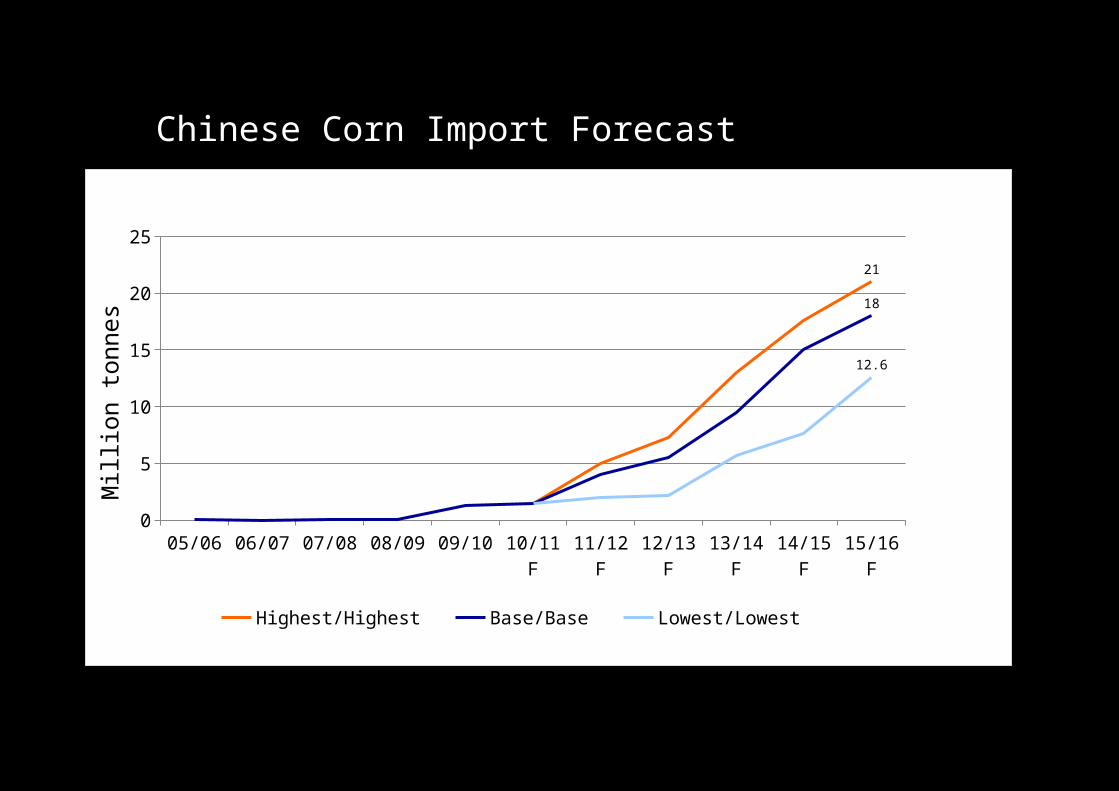
Chinese Corn Import Forecast
05/06 06/07 07/08 08/09 09/10 10/11 F
11/12 F
12/13 F
13/14 F
14/15 F
15/16 F
0
5
10
15
20
25
21
18
12.6
Highest/Highest Base/Base Lowest/Lowest
Million t
onnes
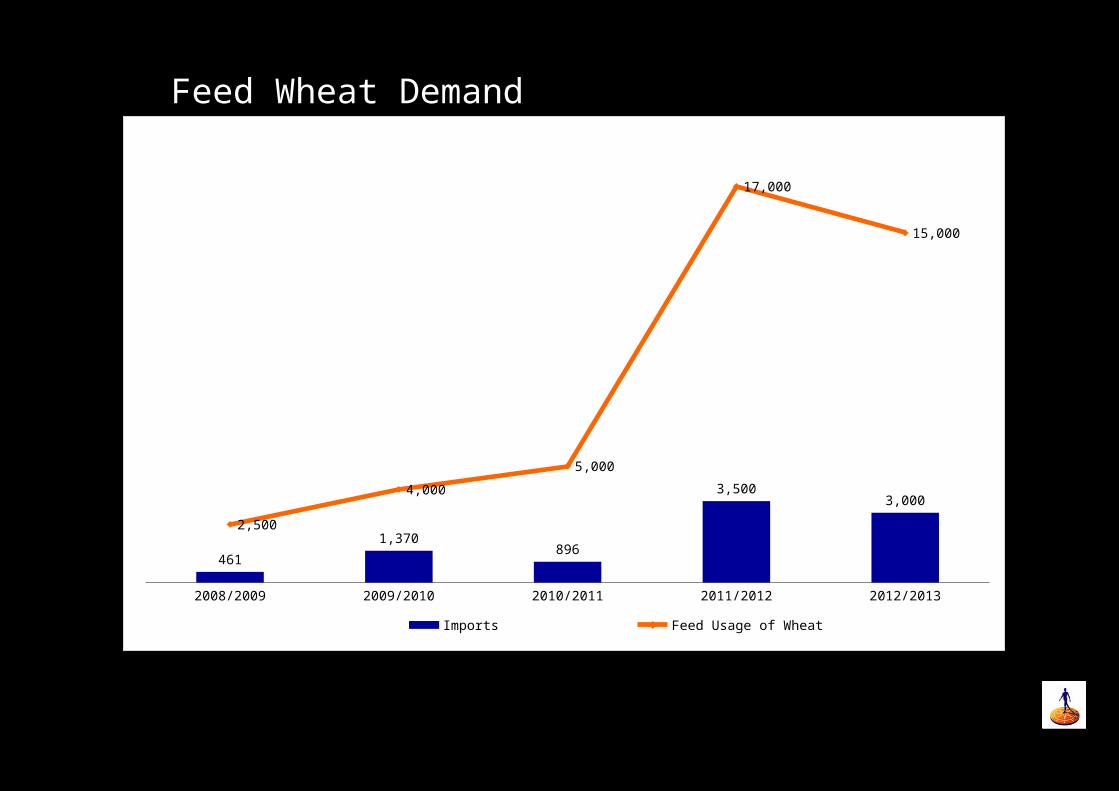
Feed Wheat Demand
2008/2009 2009/2010 2010/2011 2011/2012 2012/2013
461
1,370896
3,5003,000
2,500
4,000
5,000
17,000
15,000
Imports Feed Usage of Wheat
我餐麥

Grain Prices
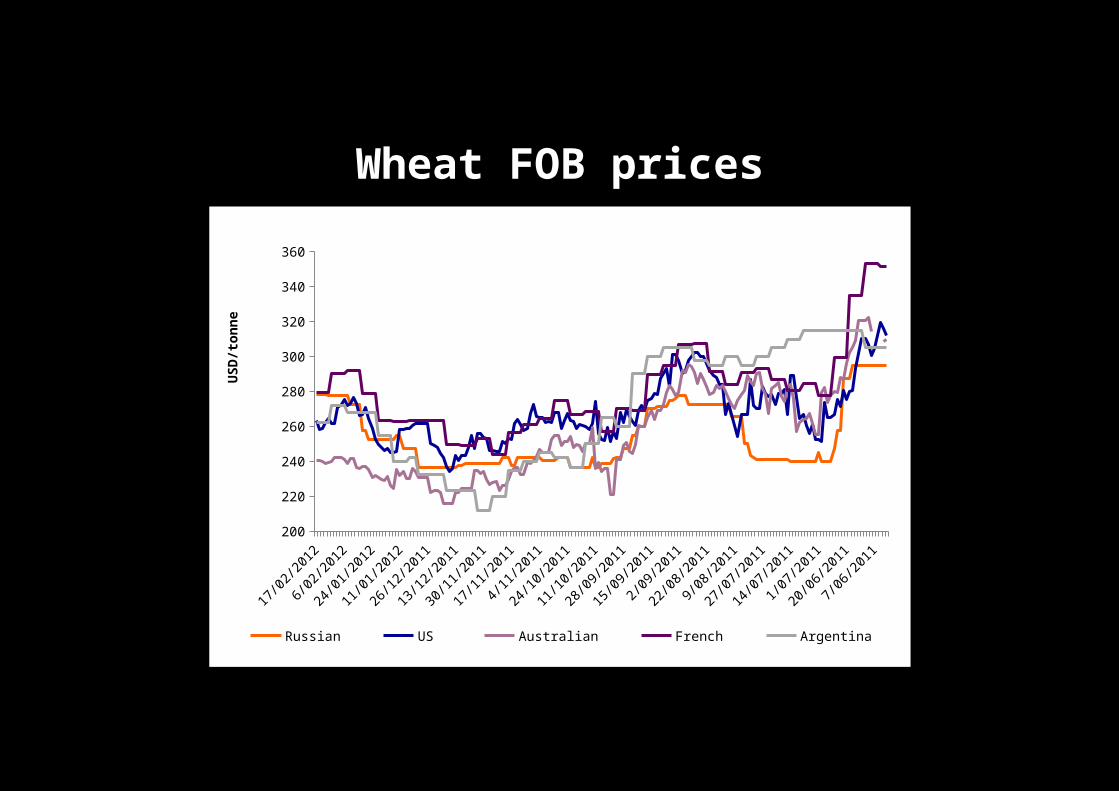
Wheat FOB prices
Jun-
11
Jun-
11
Jun-
11
Jul-1
1
Jul-1
1
Jul-1
1
Jul-1
1
Aug-1
1
Aug-1
1
Aug-1
1
Sep-
11
Sep-
11
Sep-
11
Oct-1
1
Oct-1
1
Oct-1
1
Nov-1
1
Nov-1
1
Nov-1
1
Dec-1
1
Dec-1
1
Dec-1
1
Jan-
12
Jan-
12
Jan-
12
Feb-
12
Feb-
12200
220
240
260
280
300
320
340
360
Russian US Australian French Argentina
USD
/tonne

What went wrong?
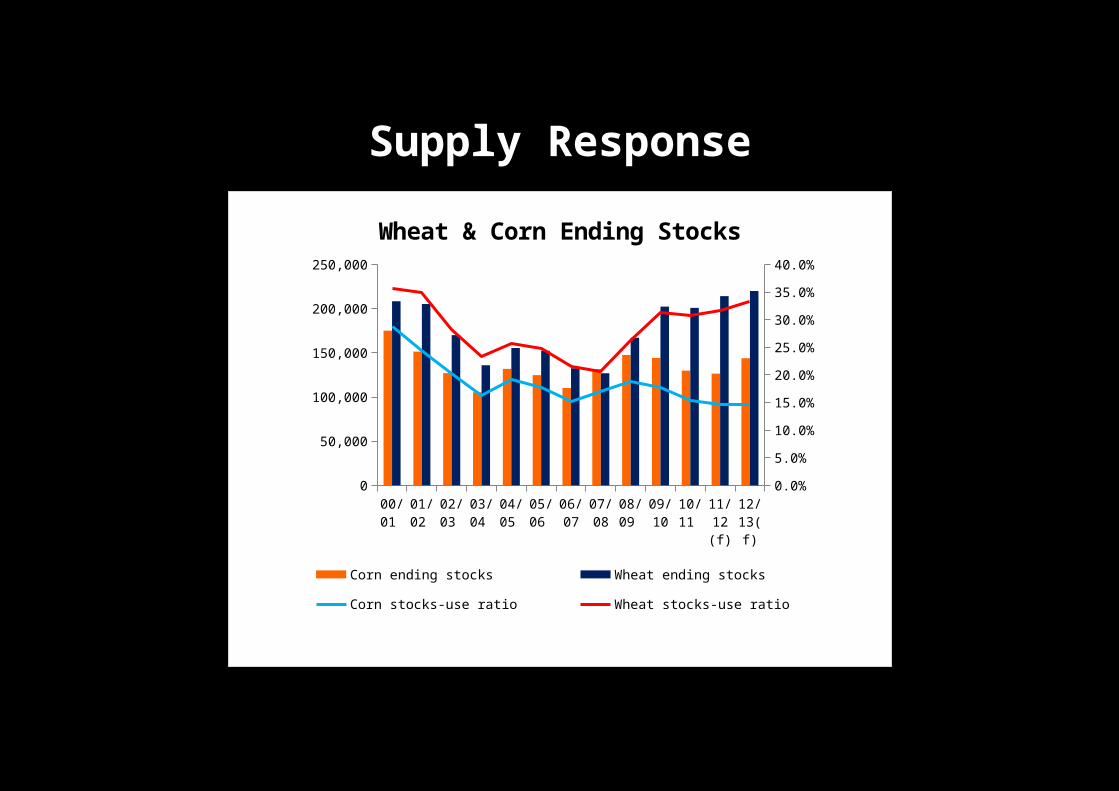
Supply Response
00/0
1
01/0
2
02/0
3
03/0
4
04/0
5
05/0
6
06/0
7
07/0
8
08/0
9
09/1
0
10/1
1
11/1
2 (f)
12/1
3(f)
0
50,000
100,000
150,000
200,000
250,000
0.0%
5.0%
10.0%
15.0%
20.0%
25.0%
30.0%
35.0%
40.0%
Wheat & Corn Ending Stocks
Corn ending stocks Wheat ending stocks Corn stocks-use ratio
Wheat stocks-use ratio
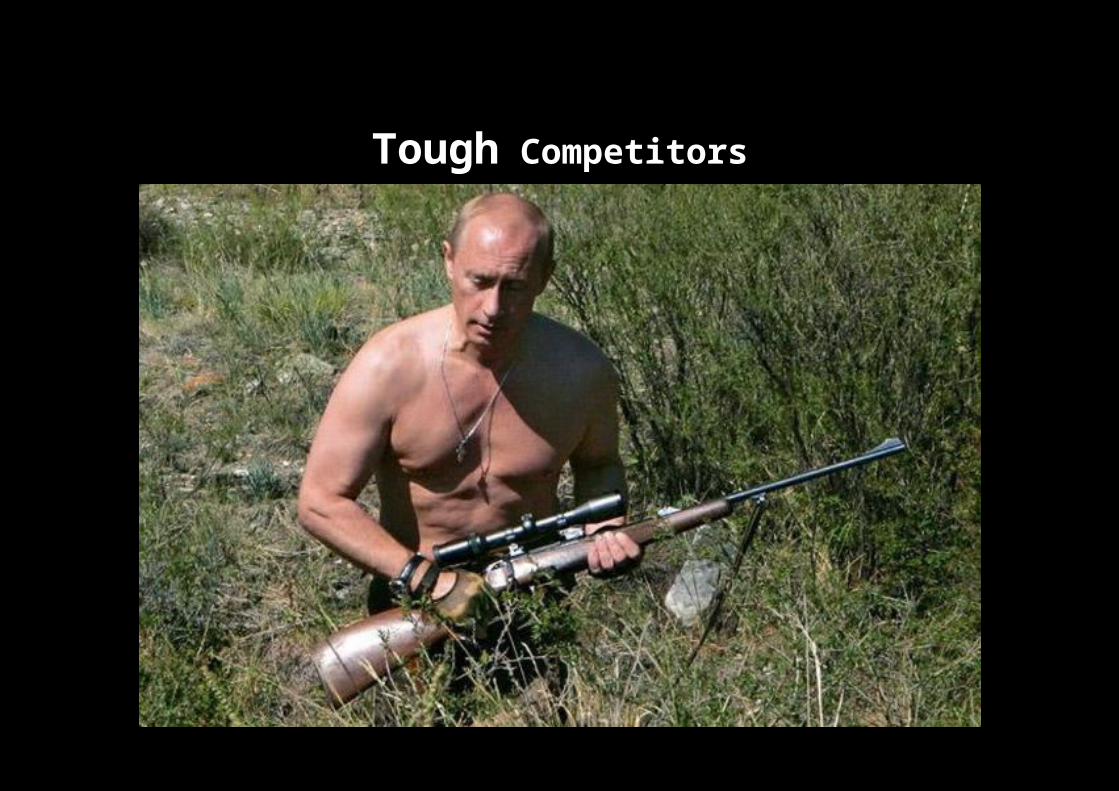
Tough Competitors
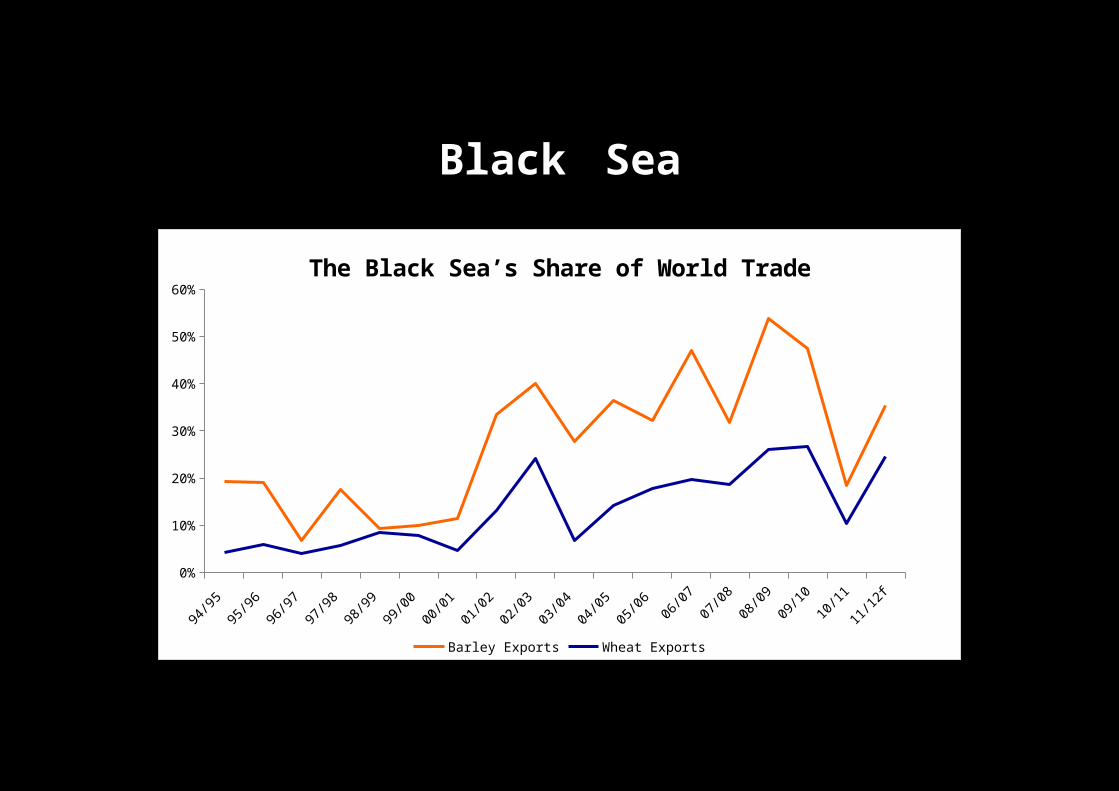
Black Sea
94/9
5
95/9
6
96/9
7
97/9
8
98/9
9
99/0
0
00/0
1
01/0
2
02/0
3
03/0
4
04/0
5
05/0
6
06/0
7
07/0
8
08/0
9
09/1
0
10/1
1
11/1
2f0%
10%
20%
30%
40%
50%
60%
The Black Sea’s Share of World Trade
Barley Exports Wheat Exports
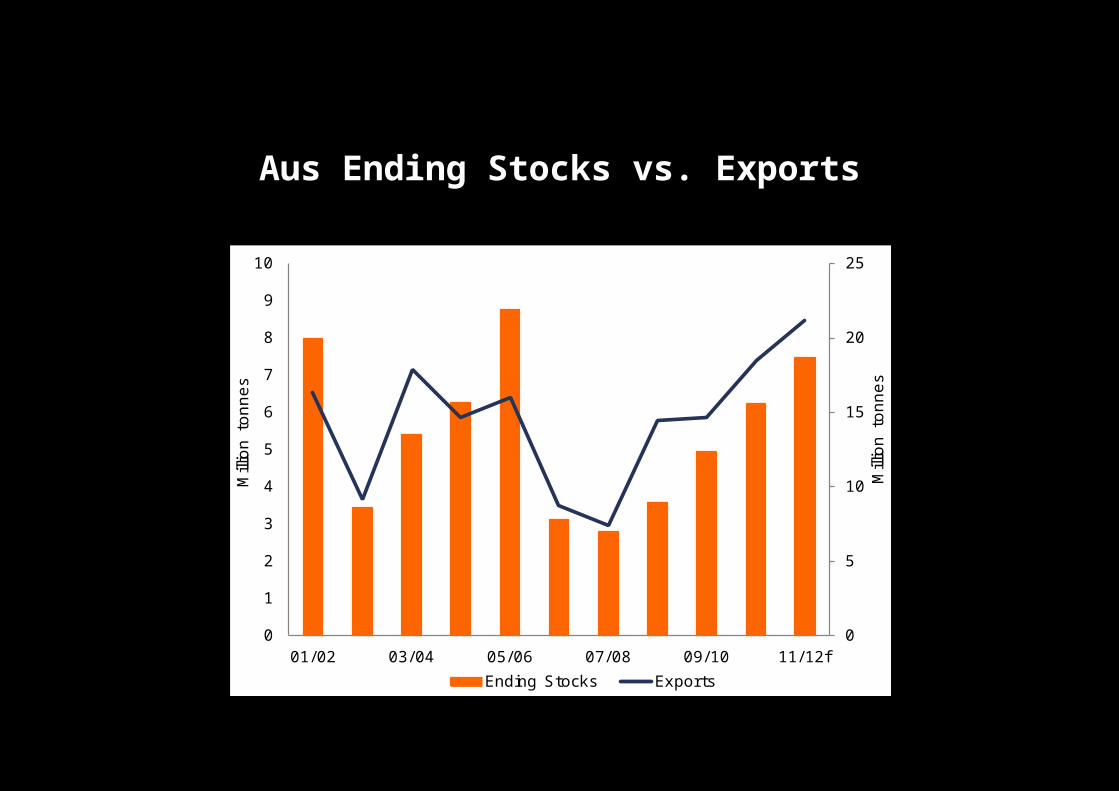
Aus Ending Stocks vs. Exports
0
5
10
15
20
25
0
1
2
3
4
5
6
7
8
9
10
01/02 03/04 05/06 07/08 09/10 11/12f
Mill
ion t
onnes
Mill
ion t
onnes
Ending Stocks Exports
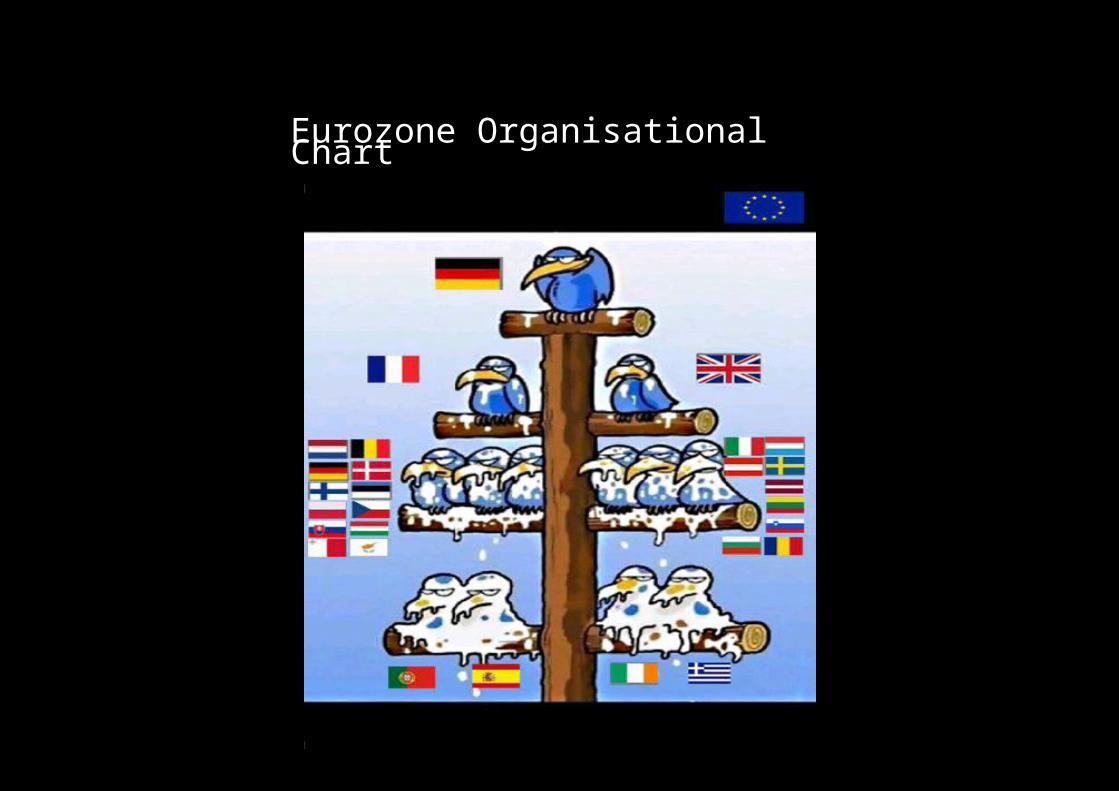
Eurozone Organisational Chart
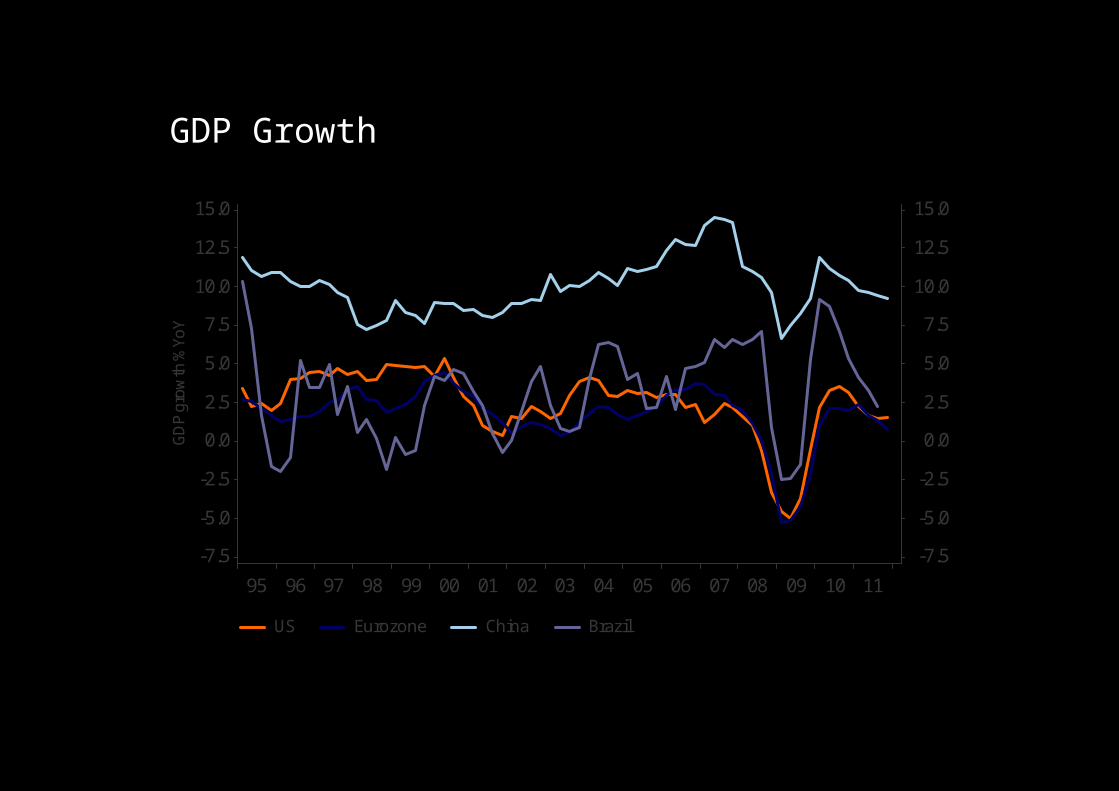
GDP Growth
US Eurozone China Brazil
95 96 97 98 99 00 01 02 03 04 05 06 07 08 09 10 11
-7.5
-5.0
-2.5
0.0
2.5
5.0
7.5
10.0
12.5
15.0
GD
P gr
owth
%Yo
Y
-7.5
-5.0
-2.5
0.0
2.5
5.0
7.5
10.0
12.5
15.0
0
10
20
30
40
50
60
70
80
2001 2003 2005 2007 2009 2011 2013
China's GDP, % of US
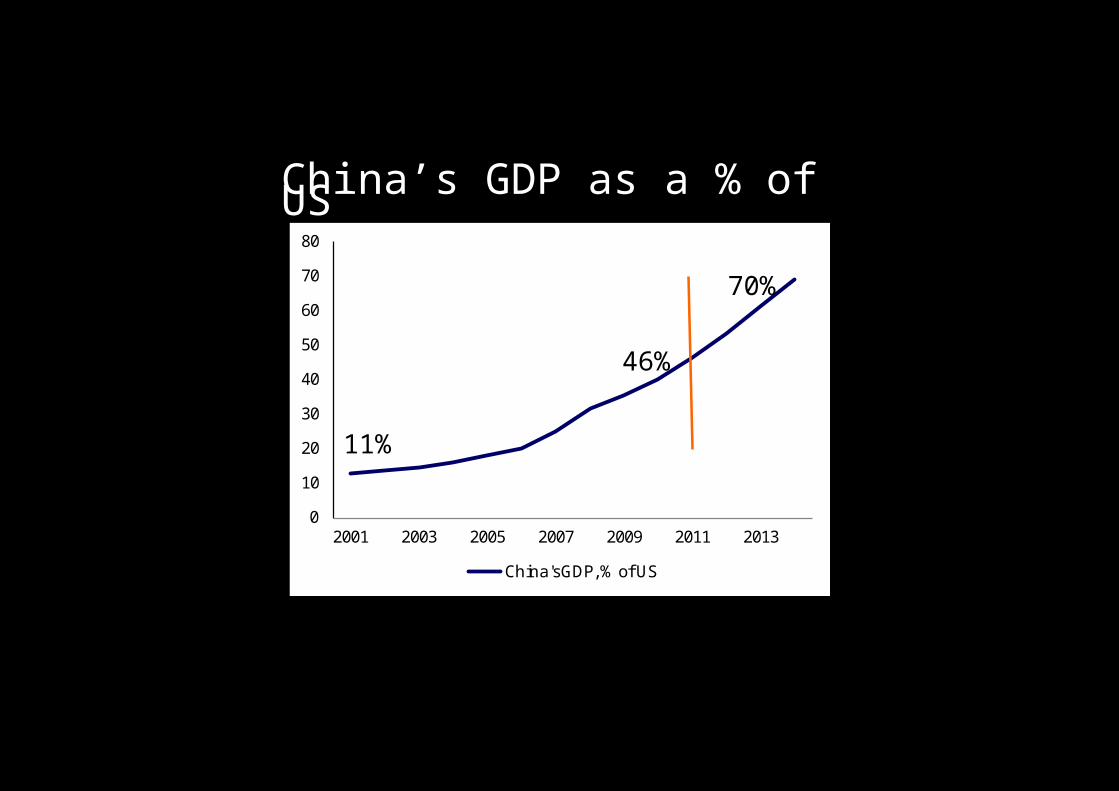
China’s GDP as a % of US
46%
11%
70%
When written in Chinese the word “crisis” is composed of two characters.
On represents danger and the other opportunity.
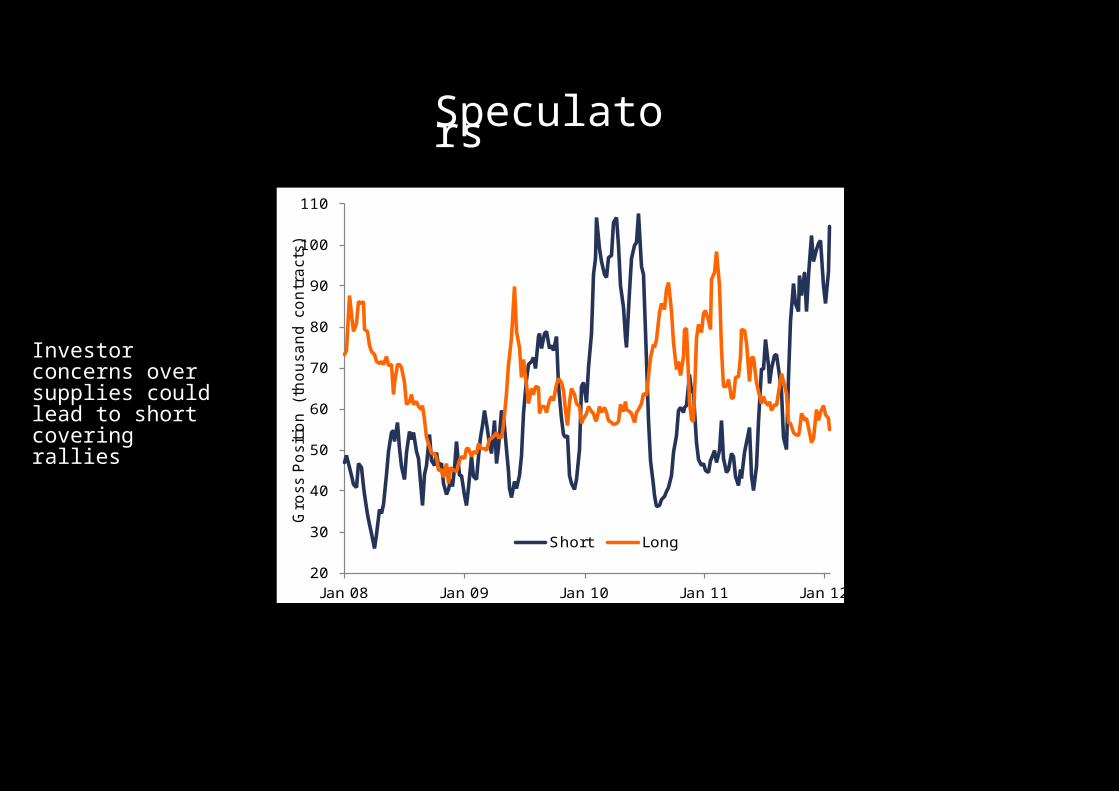
Speculators
46%
11%
70%
20
30
40
50
60
70
80
90
100
110
J an 08 J an 09 J an 10 J an 11 J an 12
Gro
ss P
osi
tion (
thousa
nd c
ontr
act
s)
Short Long
Investor concerns over supplies could lead to short covering rallies
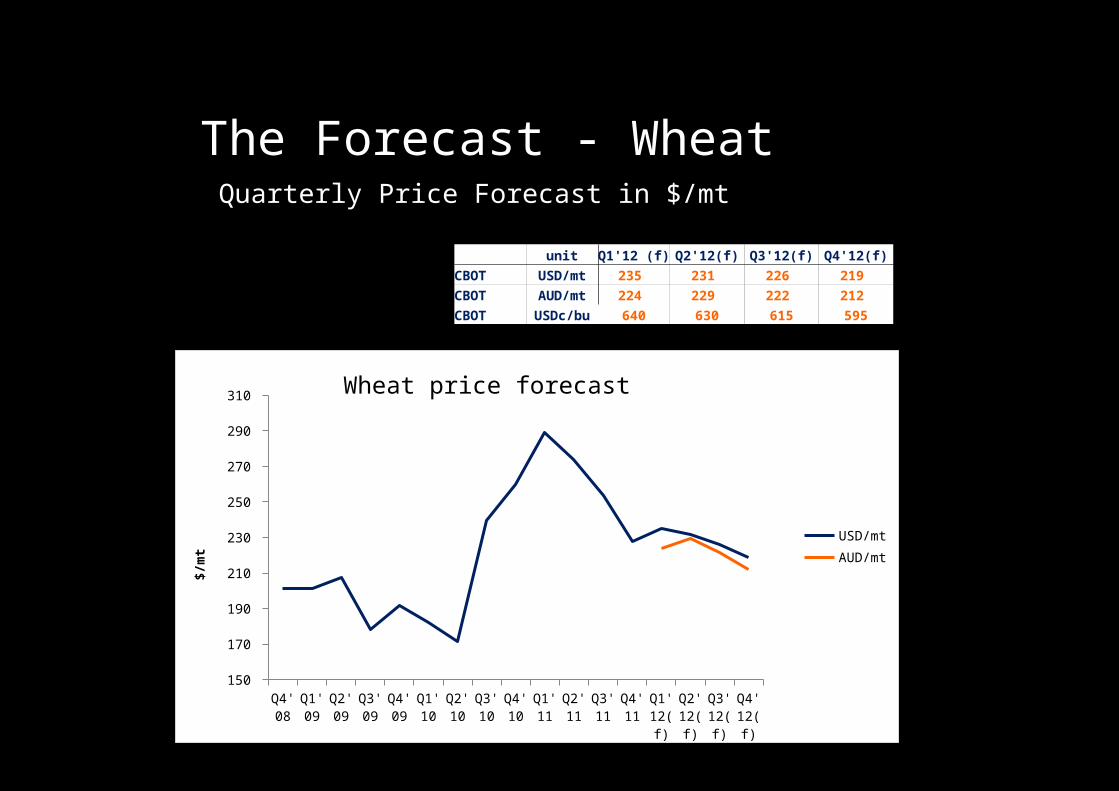
The Forecast - Wheat
387% increase
Q4'08
Q1'09
Q2'09
Q3'09
Q4'09
Q1'10
Q2'10
Q3'10
Q4'10
Q1'11
Q2'11
Q3'11
Q4'11
Q1'12(f
)
Q2'12(f
)
Q3'12(f
)
Q4'12(f
)
150
170
190
210
230
250
270
290
310
USD/mtAUD/mt
$/m
t
unit Q1'12 (f) Q2'12(f) Q3'12(f) Q4'12(f)
CBOT USD/mt 235 231 226 219
CBOT AUD/mt 224 229 222 212
CBOT USDc/bu 640 630 615 595
Quarterly Price Forecast in $/mt
Wheat price forecast
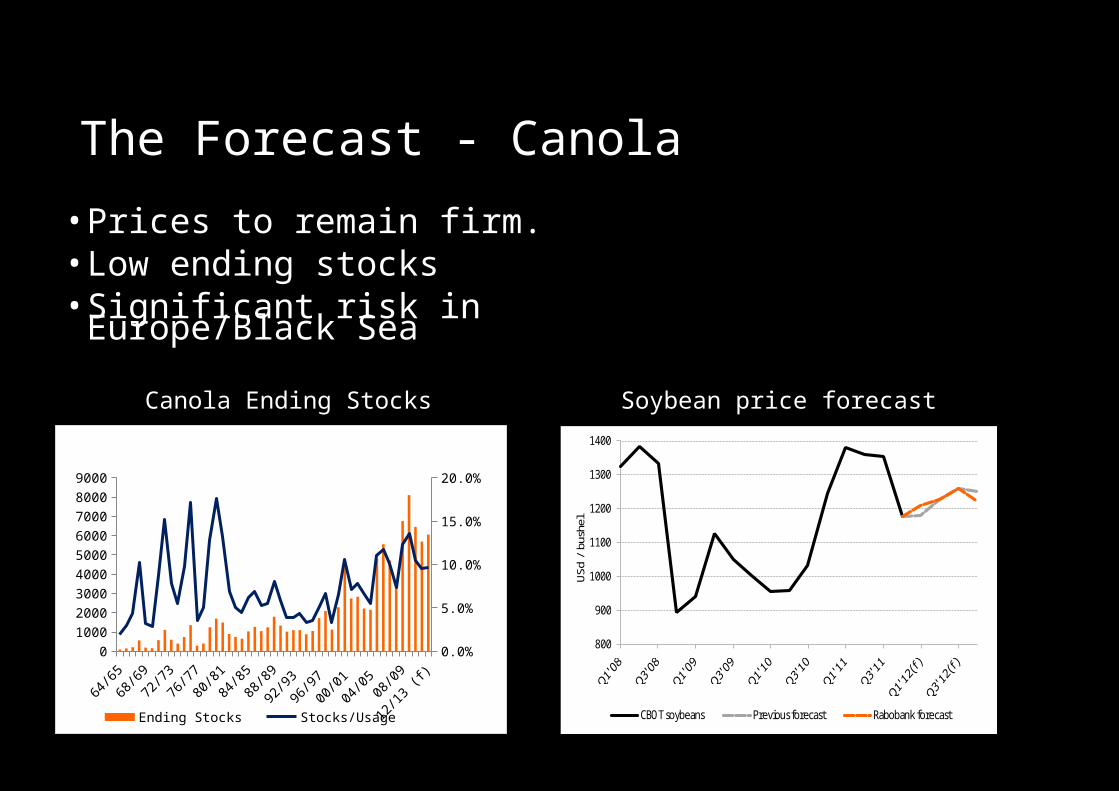
The Forecast - Canola
387% increase
Wheat price forecast
64/6
5
68/6
9
72/7
3
76/7
7
80/8
1
84/8
5
88/8
9
92/9
3
96/9
7
00/0
1
04/0
5
08/0
9
12/1
3 (f)
0100020003000400050006000700080009000
0.0%2.0%4.0%6.0%8.0%10.0%12.0%14.0%16.0%18.0%20.0%
Ending Stocks Stocks/Usage
800
900
1000
1100
1200
1300
1400
USd
/ bu
shel
CBOT soybeans Previous forecast Rabobank forecast
Soybean price forecastCanola Ending Stocks
• Prices to remain firm.• Low ending stocks• Significant risk in Europe/Black Sea
Filling the bucket
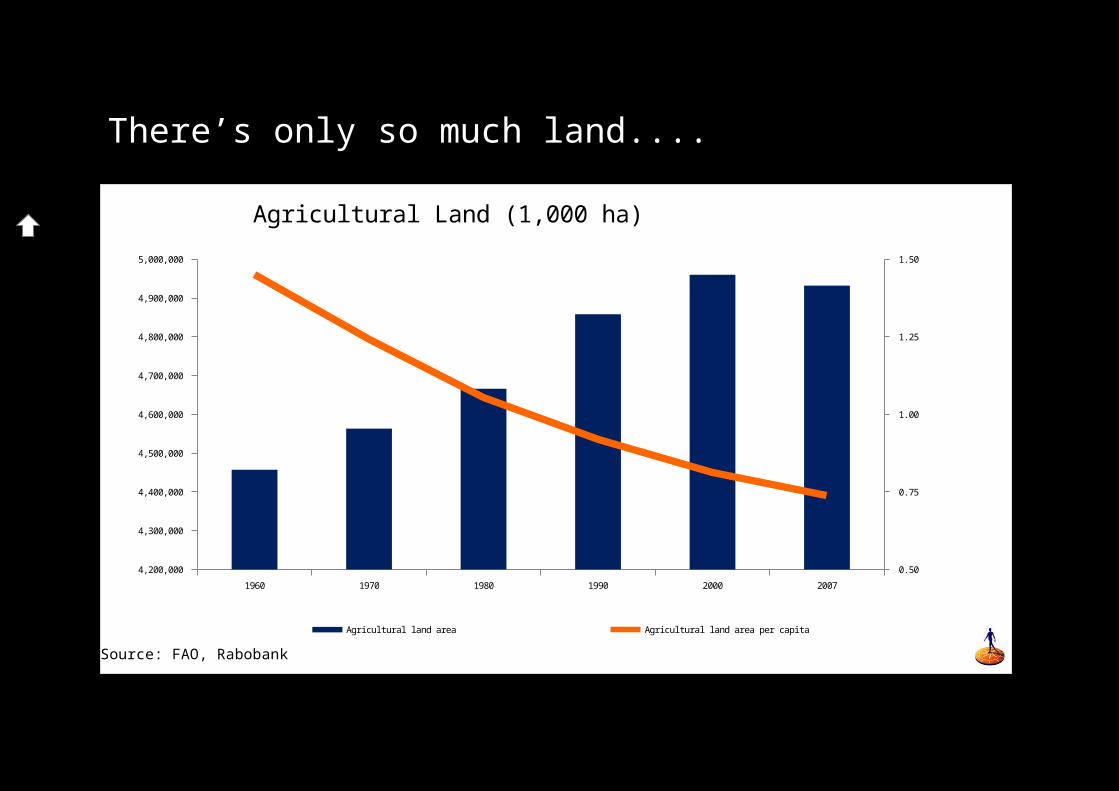
There’s only so much land....
1960 1970 1980 1990 2000 2007
4,200,000
4,300,000
4,400,000
4,500,000
4,600,000
4,700,000
4,800,000
4,900,000
5,000,000
0.50
0.75
1.00
1.25
1.50
Agricultural land area Agricultural land area per capita
Agricultural Land (1,000 ha)
Source: FAO, Rabobank
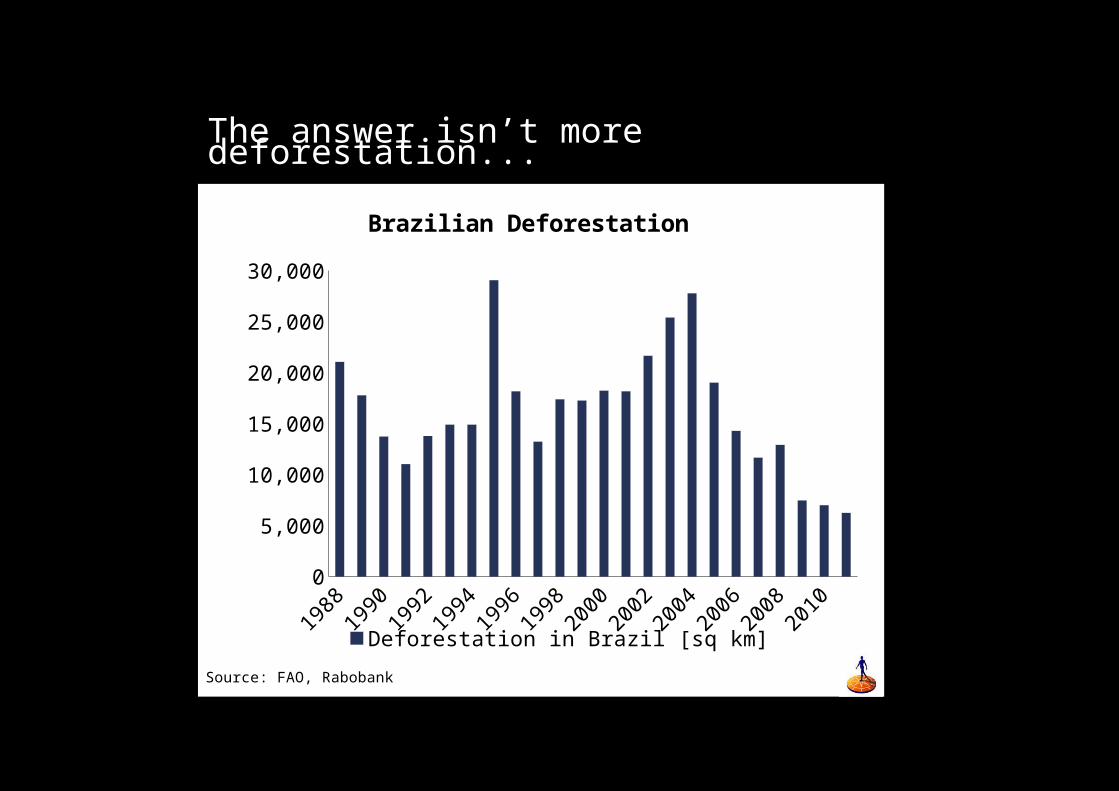
The answer isn’t more deforestation...
1988
1990
1992
1994
1996
1998
2000
2002
2004
2006
2008
2010
0
5,000
10,000
15,000
20,000
25,000
30,000
Brazilian Deforestation
Deforestation in Brazil [sq km]
Source: FAO, Rabobank
Meat Consumption in China
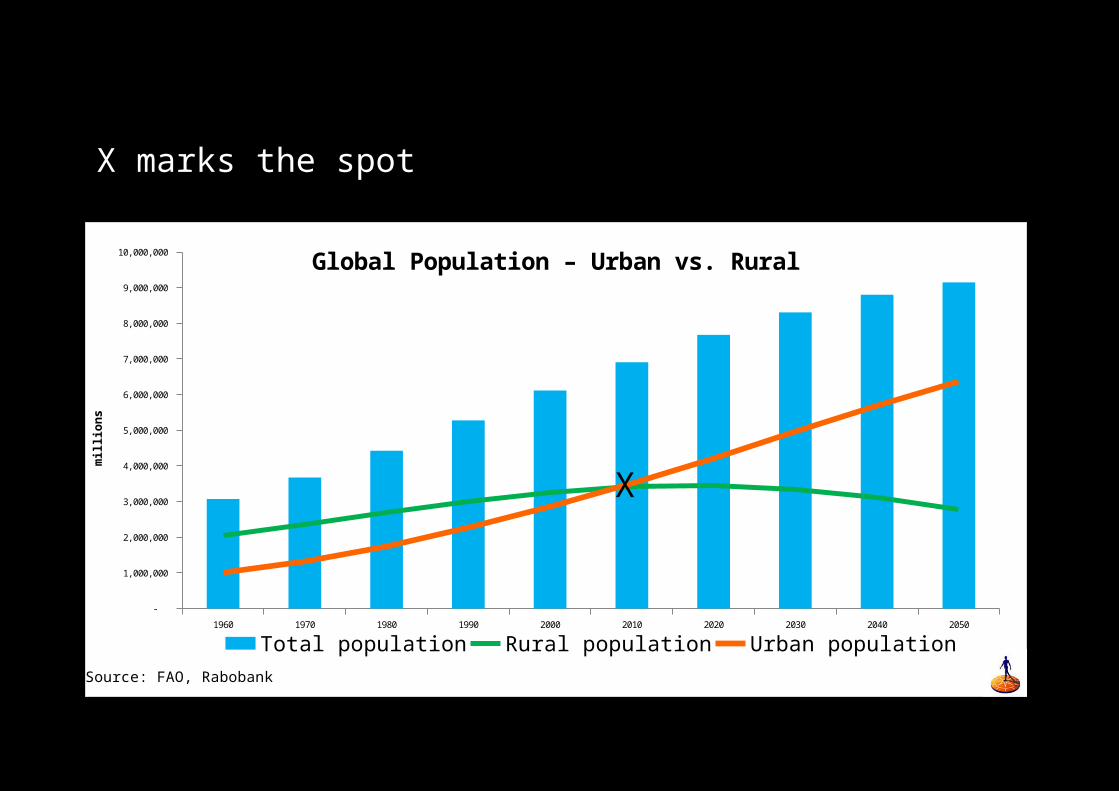
1960 1970 1980 1990 2000 2010 2020 2030 2040 2050
-
1,000,000
2,000,000
3,000,000
4,000,000
5,000,000
6,000,000
7,000,000
8,000,000
9,000,000
10,000,000 Global Population – Urban vs. Rural
Total population Rural population Urban population
million
s
Source: FAO, Rabobank
X marks the spot
X

VolatilityHigher PricesCrisis Point
Thank you for your time

Contact Details
Dean SmithSenior Grains Analyst, Food & Agribusiness Research and Advisory
t. 02 8115 2368
DISCLAIMER
Professional advice is recommended for all financial and strategic decisions. However, this information is not professional advice and has not been
prepared to be used as the basis for, and should not be used as the basis for, any such decisions. This information is general in nature only and does not
take into account an individual’s personal circumstances. No representation is made that any forecast or projected information is correct or will
eventuate. Although reasonable efforts have been taken to ensure the accuracy of the contents of this publication, no warranty is given in regard to the
total accuracy of the printed contents. The persons involved in the preparation and distribution of this information and their related persons disclaim all
liability for any loss or damage suffered due to any use of or reliance on the information