Embed Size (px)
Citation preview
December 5, 2015 • Vol. 43, No. 48
United We Stand
Grains kick off December with gains — Corn and soybean futures rallied solidly with the flip of the calendar. Traders covered short positions in the soybean market last week, with funds leading the corrective buying. In addition to short-covering, corn saw some fresh buying enter the market as open interest rose along with futures. That’s a potential positive sign, though traders will likely need a fundamental reason to remain buyers. Wheat futures were choppy with a slight upside bias amid corrective buying. While grain and soy futures started the new month with gains, the cattle market faced fresh selling pressure. Live and feeder cattle futures slumped to new lows as traders who added long positions the second half of November in hopes that lows were in place exited those longs. Heavy pressure on cattle futures triggered lower cash cattle trade in the Plains. Lean hog futures worked higher amid corrective buying to kick off December.profarmer.com
Visit your Member website www.profarmer.com
for additional perspective and breaking news.
FJM buys Vance’s ag properties.Farm Journal Media, parent company of Pro Farmer, purchased Vance Publishing’s Ag Division, including Doane Advisory Services. This puts two of ag’s best known newsletters, Pro Farmer and Doane’s Agricultural Report, under the same ownership.
Canadian crop pegs bigger than expected.Stats Canada estimates the Canadian all-wheat crop at 27.6 million metric tons (MMT), up 1.5 MMT from October. The canola crop esti-mate was increased a huge 2.9 MMT from the previous forecast, to 17.2 MMT.
ARC/PLC enrollment starts this week. You can start enrolling for Ag Risk Coverage or Price Loss Coverage for 2016 crops at your FSA office Dec. 7.
Odds of December rate hike buildingNon-farm payrolls rose 211,000 in November. In addition, September and October payrolls were revised up a combined 35,000 from previ-ous reportings and hourly earnings rose again last month. With another strong jobs report, the Fed is expected to raise interest rates fol-lowing the Dec. 15-16 Federal Open Market Committee meeting. Fed fund futures signal nearly 80% odds of a December rate hike.
Currencies focused on monetary policyThe U.S. dollar plunged Dec. 3 after European Central Bank (ECB) monetary easing mea-sures fell short of expectations. The ECB cut its deposit rate and extended its bond-buy-ing program to March 2017, but the market expected more. The dollar bounced Friday following the strong jobs report, but could recoup only a fraction of the Dec. 3 plunge.
Increased volatility in the dollar may sig-nal the greenback is topping. If foreign buy-ers sense a short-term easing of the dollar, they could get more aggressive with grain purchases — especially with the Baltic Dry Freight Index near historical lows — since they are basically running hand-to-mouth.
COOL issues take center stageThe World Trade Organization (WTO) is expected to issue its decision by Dec. 7 on retaliation levels that Canada and Mexico can take unless there is an agreement with the U.S. to repeal the country of origin label-ing (COOL) rule. The House passed a repeal bill this summer, but the Senate has yet to act. Senate Ag Chair Pat Roberts (R-Kan.) doesn’t have the votes to get repeal out of his panel, even though the full Senate would likely go along. Some sources are looking for language to repeal COOL to be included in the coming omnibus spending bill, the details of which should be unveiled early this week.
USDA reports out Dec. 9USDA’s December crop reports should be rather tame. There will be no new corn and soybean crop estimates this month. And after wide-spread changes to usage projections last month, just minor fine tuning is expected on the demand side of the balance sheets. Therefore, we aren’t expecting major changes to U.S. corn or soybean carryover forecasts. The bigger focus will be on global production forecasts.
EPA adjusts 2016 RFS mandates higherThe Environmental Protection Agency (EPA) set the total Renewable Fuel Standard (RFS) for 2016 at 18.11 billion gallons, up from its origi-nally proposed 17.40 billion gallons. EPA raised its usage requirement for corn-based ethanol by 500 million gallons to 14.5 billion gallons for 2016. EPA also slightly raised its 2016 and 2017 biodiesel mandates from its original proposals.
RFS category 2014 2015 2016 2017Cellulosic (mil. gallons) 33 123 230 N/A
Biodiesel (bil. gallons) 1.63 1.73 1.90 2.00
Advanced biofuel (bil. gallons) 2.67 2.88 3.61 N/A
Total renewable fuels (bil. gallons) 16.28 16.93 18.11 N/A
* Total renewable fuels - advanced biofuel = corn ethanol
For perspective on the RFS, see News page 4.
Crop insurance cuts repealedThe Senate and House approved a $305-billion five-year highway and transit reauthorization bill last week. President Barack Obama will sign the bill that includes provisions to repeal $3 billion in crop insurance cuts. The crop insurance cuts had been part of a two-year budget deal for FY 2016. The bill also includes hours-of-service rule for livestock and poultry, which permanently removes the 30-minute break after eight hours-of-service requirement.
News this week...Page 2: Big changes likely for Argy agriculture.Page 3: Fate of biodiesel tax credit still murky. Page 4: EPA finally releases RFS mandates.

December 5, 2015 / News page 2
Follow your Pro Farmer editors
on Twitter:Search for
#pfnews.@ChipFlory
@BGrete@Rich_Posson@JuliJohnston
@MeghanVick@WalstenM
@DavisMichaelsen
Crop Comments from Twitter and
AgWeb.com:
Marion Co., (NC) Kansas:
“Finished sowing wheat a while back.
Not sure why we did it... I guess it’s
just a bad habit. Wheat is not a cash
crop anymore, but more of a cover
crop. If we’re sup-posed to feed the world, maybe we should get paid a little for doing it.”
Nance Co., (EC) Nebraska:
“I’m thankful for a great year of farm-
ing this year, and thankful I’ll have many more. I’m
also thankful cash corn isn’t $1.60 to
$2.00 with beans that were $3.75 to
$4.50. I’ve seen those prices
before, and I’ve sold at those pric-
es before. For over 10 years I might add. Be
thankful, it can always be worse.”
Cayuga Co., (NC) New York:“Beans were aver-age to a few bush-els above normal.
Corn was 10 bu. to 15 bu. below aver-
age. We had 10.5 inches of rain in
June and it definite-ly hurt corn, but the rest of the year was
great weather.”
Minnehaha Co., (EC) S. Dakota:
“Our piles are already being
picked up here where we had
record yields.”
71.43¢
Longer-term Analysis — WheatU.S. wheat carryover is projected to bulge to its highest level since 2009-10 and global wheat supplies are forecast to be record-large at the end of 2015-16. On the demand side, a strong U.S. dollar is limiting export prospects for U.S. wheat at a time when all of our competitors have plenty of wheat to sell. In ample supply situations like this, the rest of the world typically needs to get rid of its excess supplies before demand for U.S. wheat picks up. The combination of hefty supplies along with a strong U.S. dollar are expected to keep them under pressure through 2015-16. If there are any U.S. or global crop-scare rallies, they will be short-lived and should be seen as an opportunity to advance sales.
Monthly SRW Wheat Futures The last three strong rally attempts have stopped short of the long-term downtrend,
marking it as key resistance. Bulls need to violate thedowntrend and the last
reaction high at $6.17 1/2 to
signal a trend change.
Aussie wheat crop loweredMonths of drought across east-ern and southern Australia trimmed wheat yields. As a result, the Australian Bureau of Agricultural and Resource Economics and Sciences (ABARES) cut its Aussie wheat crop estimate by 1.3 million metric tons (MMT), to 23.98 MMT. Despite the weather struggles, Australian wheat production is forecast up 1.3% from 23.67 MMT in 2014-15.
Ethanol production, soybean crush surgeEthanol production surged to a record 1.008 million barrels per day (bpd) the week ended Nov. 20. Output slowed to 956,000 bpd for the week that included Thanksgiving.
Ethanol grind totaled 444.1 million bu. in October, a 4% increase from September 2015 and October 2014, according to USDA’s Grain Crushings and Co-Products Production Report. A total of 495.8 million bu. of corn were consumed for ethanol and other uses in October.
Meanwhile, U.S. soy proces-sors crushed 5.10 million short tons (169.98 million bu.) of soy-beans in October, according to USDA’s Fats and Oils Report. That was up 26.2% from September crush.
Winter wheat ratings riseIn its final winter wheat ratings until next spring, USDA pegged 55% of the crop as “good” to “excellent” and 9% as “poor” to “very poor.” When those ratings are plugged into the weighted Pro Farmer Crop Condition Index (0 to 500 point scale, with 500 being perfect), the HRW crop climbed 3.35 points to 355.36, while the SRW crop inched 0.61 point higher to 366.98. The HRW crop enters dormancy 8 points lower than year-ago, while the SRW crop is roughly 2.5 points higher than last year.
Ukraine wheat crop strugglesOnly 91% of Ukraine’s winter wheat crop was planted as of Nov. 30, and just 80% was emerged. Additionally, 36% of the crop is rated as poor. While recent warm, wet conditions have helped, Ukraine’s wheat crop is still showing the effects of months of drought.
$4.60 3/4
If the May low at $4.60 3/4 is violated, the next level of strong chart support is the 2010 low at $4.25 1/2.
$6.17 1/2
Big changes coming for Argentine agricultureAs expected, opposition candi-date Mauricio Macri won Argentina’s presidential runoff election. The change in leader-ship is favorable news for agri-culture in Argentina, as Macri is expected to cut currency controls that would lead to a devaluation in the country’s peso. Argentina’s new government says it will also eliminate export taxes on corn and wheat and lower the soy-bean export tax by five percent-age points on Dec. 11, one day after Macri takes office.
The result of these moves for Argentine farmers will be high-er prices for corn, soybeans and wheat. Therefore, a pickup on farmer sales is anticipated.
Pro Farmer South American Consultant Dr. Michael Cordonnier says the crop that will benefit most is corn. While this could lead to slightly more corn (and soybeans) being plant-ed this year than originally intended, the biggest impact will be longer-term. Cordonnier says Argentine corn acreage could climb by as much as one-third, to 4 million hectares in 2016-17. He also expects wheat acreage and exports to increase next year. Soybean acreage and exports are likely to rise, but not as fast as corn and wheat.
$4.25 1/2
Given record global wheat supplies, a challenge of the long-term trendline would be a selling opportunity.
26-O
ct
8-N
ov
22-N
ov
11-A
pr
25-A
pr
9-M
ay
23-M
ay
6-Ju
n
20-J
un
4-Ju
l300
320
340
360
3802016 HRW
2016 SRW
2015 HRW
2015 SRW
PF Winter Wheat CCI

December 5, 2015 / News page 3
CRP enrollment underway.General signup for the Conservation Reserve Program (CRP) started Dec. 1 and will run through Feb. 26. Those with con-tracts maturing Sept. 30, 2016, (around 1.65 mil-lion acres) and producers seeking to enroll new acres in the program can submit offers. There has been strong interest — a record number of acres were enrolled via the continuous signup for FY 2016.
ERS trims food inflation forecast.USDA’s Economic Research Service trimmed its fore-cast for supermar-ket food price inflation to a range of 1% to 2% for 2015 from its previous estimate for a 2% to 3% rise this year. ERS expects supermar-ket prices to rise 2% to 3% in 2016.
World food prices drop.The Food and Agriculture Organization (FAO) food price index declined 1.6% in November. Prices for grains, meats, vegoils and dairy all declined, while sugar prices rose. The world food price index is down around 18% from year-ago.
EPA pulls back on Enlist Duo.EPA has with-drawn approval for Dow’s Enlist Duo herbicide. The decision was based on new information Dow provided regard-ing the “synergis-tic effects” between glypho-sate and 2,4-D, the active ingredients in Enlist Duo.
Farm income at 13-year lowUSDA now forecasts net farm income at $55.9 billion for 2015. That would be down $2.4 billion from its previous estimate, 38% below 2014 and the lowest level since 2002 in real and nominal terms. Net cash farm income is expected to slide 28% from 2014 levels to $93 billion, which is down $7.3 billion from USDA’s August forecast.
Crop receipts are expected to fall 8.7% this year, with corn receipts leading the decline. Livestock receipts are expected to fall 12% from 2014. But while USDA notes the balance sheet shows an increasingly leveraged farm sector, it says measured risk remains low.
Ag trade surplus forecast at 10-year low for FY 2016USDA now forecasts the value of U.S. ag exports at $131.5 billion for fiscal year (FY) 2016, down $7 billion from its August projec-tion and down more than $8 bil-lion from FY 2015. Ag imports are expected to hit a record $122 billion in FY 2016, down $500 million from its August outlook and up $8 billion from FY 2015. This would yield a new trade surplus of $9.5 billion, down $16.2 billion from FY 2015 and the lowest since FY 2006.
CFTC seeks HFT controlsStricter risk controls for electronic high frequency trading (HFT) have been proposed by the Commodity Futures Trading Commission (CFTC). Traders who use automated algorithmic systems would be required to reg-ister with CFTC and keep records of the source code for their algo-rithms and make them available to CFTC upon request. Futures exchanges would be required to limit order sizes and have the abil-ity to cancel existing orders. Exchanges would also be required to monitor their members’ com-pliance with the new rules. CFTC will take public comments on the proposed new rules for 90 days.
As expected Cattle on FeedNov. 20 Cattle on Feed Report
USDA Trade actual expected (percent of year-ago)On Feed Nov. 1 102% 102.2%Placed in Oct. 96% 96.0%Mkted in Oct. 97% 96.0%
Red meat, chicken stocks continue to mount Total red meat and chicken sup-plies were both record-large for October, according to USDA’s Cold Storage Report. As has been the case, there continues to be a lot of competition as beef, pork and poultry battle for con-sumer dollars.
Total beef stocks at 511.576 million lbs. rose 2.7% from September and were up 34.3% from year-ago. Beef stocks were the second highest on record for October, behind 2002.
Pork stocks at 602.656 million lbs. fell 8.1% from September, but were up 13.1% from year-ago. The drop in pork stocks during October came despite a 2% increase in production, sig-naling improving demand.
Poultry stocks as of Oct. 31 totaled 1.224 billion lbs., which was down 2.7% from September, but up 16.5% from year-ago. Chicken stocks at 862.685 mil-lion lbs. were record-large for October and up 31.0% from year-ago. Turkey stocks were down 8.9% from year-ago.
Biodiesel tax credit shift?The fate of a bill initially pushed by Sen. Chuck Grassley (R-Iowa) to convert the biodiesel tax incen-tive to the producer rather than the blender is still very much up in the air. Such a bill would deny countries like Argentina access to the tax incentive. Of course, this is all dependent on the lapsed biodiesel tax incentive being ret-roactively extended for 2015 and possibly through 2016.
One Capitol Hill veteran says, “I think it will be a simple exten-sion for 2015, retroactively, and then it will move to a producer incentive in 2016... I would give 60/40 odds for a change begin-ning in 2016.” If so, any such change must be included on must-pass legislation before Congress adjourns this session — reportedly by Dec. 18.
What Grassley says is key. Several of our sources note he has built up good will in the Finance Committee that could help him get the shift, barring strong opposition from House Republicans. But another contact notes one must also consider Grassley’s own priorities, as “Grassley is also a big champion of the wind and solar production tax credits, which most House Republicans revile. So, which is highest on Grassley’s list? Make no mistake: this is less about sound tax policy or fuel policy and very much about blocking imports, especially from Argentina.”
There could also be implica-tions for the home heating oil market because the initial bill language would treat it as tax-able fuel. But as winter approach-es, this could be a tough sell to lawmakers from the Northeast.
Late last week, lawmakers in the House and Senate introduced updated bills to reinstate the bio-diesel credit. The new bills include an important update ensuring that biodiesel used in off-road applications will not incur excise tax. Lawmakers are negotiating the details of a tax extender pack-age with some form of a biodiesel extension a part of it.
Jan
Feb
Mar
Apr
May Jun Jul
Aug
Sep
Oct
Nov
Dec340
360
380
400
420
440
460
480
500
520
2013 2014 2015
Frozen Beef Stocks
Million lbs.
Jan
Feb
Mar
Apr
May Jun
Jul
Aug
Sep
Oct
Nov
Dec
475500525550575600625650675700725
2013 2014 2015
Frozen Pork StocksMillion lbs.

December 5, 2015 / News page 4
News alert and analysis exclusively for Members of Professional Farmers of America® 6612 Chancellor Dr. Ste. 300, Cedar Falls, Iowa 50613-9985Sr. Vice President, Chuck Roth • Publisher/Editorial Director, Chip Flory • Editor, Brian Grete • Editor Emeritus, Jerry Carlson
Sr. Market Analyst, Rich Posson • Digital Managing Editor, Julianne Johnston • News Editor, Meghan Vick • Inputs Monitor Editor, Davis Michaelsen Member Relations Manager, Shelley Eilderts • Washington Consultants, Jim Wiesemeyer and Roger Bernard, Informa Economics
Subscription Services: 1-800-772-0023 • Editorial: 319-277-1278 • To record your news alert for PF editors: 1-800-PFA-NEWS (1-800-732-6397)©2015 Professional Farmers of America, Inc. • E-mail address: [email protected]
CEO, Andrew Weber • President, Jeff Pence
A pin prick in the ethanol blend wallby Editorial Director Chip Flory and Washington Consultant Jim Wiesemeyer
It was two years in the making, but the Environmental Protection Agency finally released the final rule on
Renewable Volume Obligations (RVOs) under the Renewable Fuels Standard (RFS) for 2014, 2015 and 2016. Biodiesel also got RVOs for 2017.
RVOs are what we commonly refer to as the man-dated usage levels for different grades of renewable fuels — corn-based ethanol, cellulosic-based ethanol, advanced biofuels and biodiesel.
EPA hits ‘reset button’ on RFS for 2014 and 2015In May of 2015, EPA issued proposed RVOs for 2014
corn-based ethanol of 13.25 billion gallons (BG). However, after adjusting for some errors in tracking ethanol exports, the 2014 RVO was raised to 13.61 BG. The 13.61 BG is based on actual corn-based ethanol use during the year.
The corn-based RVO for 2015 is also based on the most current data on gasoline consumption and projections that cheaper fuel prices will increase total use, providing more opportunities for 10% ethanol blend (E10) sales. While the 2007 energy law included corn-based RVOs of 15.00 BG for 2015, EPA set the tally at 14.05 BG.
The 2014 and 2015 RVOs generally track the “blend wall” argument — that no more renewable fuels could be used because “most cars” on the road can’t handle blends higher than E10 without risking engine damage. However, EPA nearly five years ago approved E15 (15% ethanol blends) for cars and light trucks manufactured in 2001 and later. Still, of the 16 auto brands available in the U.S., half do not list E15 as an approved fuel in their 2016 models; two approved E15 in “most” new cars; six (including Chrysler, Ford and GM) approve E15.
Simply put, EPA approved E15 for model years 2001 and newer, but automakers aren’t giving consumers the confidence they need to use blends higher than E10.
‘Blend wall’ remains a battle groundThe oil industry is using the so-called “blend wall” as
the base of its argument against higher RVOs for etha-nol. Jack Gerard, president of the American Petroleum Institute (API) says, “EPA’s final rule relies on unrealis-tic increases in sales of higher ethanol fuel blends despite the fact that most cars cannot use them.”
Those “unrealistic increases” Gerard refers to are the RVOs for 2016 when the country is required to use 14.5 BG of corn-based ethanol. There is no question gasoline consumption was lower in 2008 through 2014 than esti-mated when the RFS was updated in 2007. However, the lower-use trends (driven by high gas prices and improved miles per gallon) of 2013 to 2014 have reversed. Total fuel consumption is on the rise (driven by lower gas prices) in 2015 and is projected to increase again in 2016. Still, the 14.5-BG ethanol RVO for 2016 would crest the
“blend wall.” Total gasoline consumption in 2016 is pro-jected to be nearly 140 BG. To reach 14.5 BG of ethanol use, the blend rate would have to average 10.36%, according to Mike Irmen, VP and General Manager for the Ethanol Group at The Andersons, Inc. API still wants the blend requirement set at 9.7%.
2016 RFS ‘stretch’ boosts RIN prices“EPA used 2014 and 2015 consumption to project
2016 consumption and RVOs... and stretched it a little. I think it’s the right combination,” says Irmen.
That bit of a “stretch” apparently caught some obli-gated parties (those required to blend ethanol with gasoline under the RFS) by surprise. For each gallon of ethanol (or other renewable fuel) obligated parties blend and sell, they receive a RIN (a Renewable Identification Number). If an obligated party blends more ethanol than required in times when it financially benefits them to sell higher blends, they can accumulate those RINs and use them to comply with blending requirements at times when selling higher blends does not provide financial benefits.
Or they can sell “extra” RINs to other obligated parties. The buyer of those RINs can then submit the purchased RINs to satisfy their blending requirements. This structure puts the obligation of reaching the RVOs on the entire industry instead of individual obligated parties.
Almost immediately after EPA revealed the new RVOs, the value of RINs doubled. Ahead of the announcement, RINs were trading at about 30¢. They traded as high as 95¢, then settled back to about 60¢. “And E85 (85% ethanol blend) prices fell about 30¢ in two days (following the EPA announcement),” says Irmen. “The higher ethanol blends should get cheaper so the obligated parties can sell more ethanol and accumulate RINs.”
The supply of RINs in the marketplace also help determine value, but Irmen cautions, “It’s difficult to determine the total supply. Obligated parties didn’t have to comply with ‘no rule’ in 2014 and to this point in 2015. Once obligated parties comply with 2014 and 2015 RVOs, then we’ll have a better idea of the supply of RINs. Right now, it looks like there will be about a 1.5-billion gallon RIN carryover available.” That RIN carryover is in high demand.
2017 RVO could be pointed toward 15 BG
It’s the combination of RVOs and the “pressure-valve function” of the RINs that give the RFS the abil-ity to increase market access to ethanol blends higher than E10. If fuel consumption estimates are right for next year, the 2016 RVOs will put a pin prick in the blend wall and clear the way for a 15.0-BG corn-based ethanol RVO in 2017.
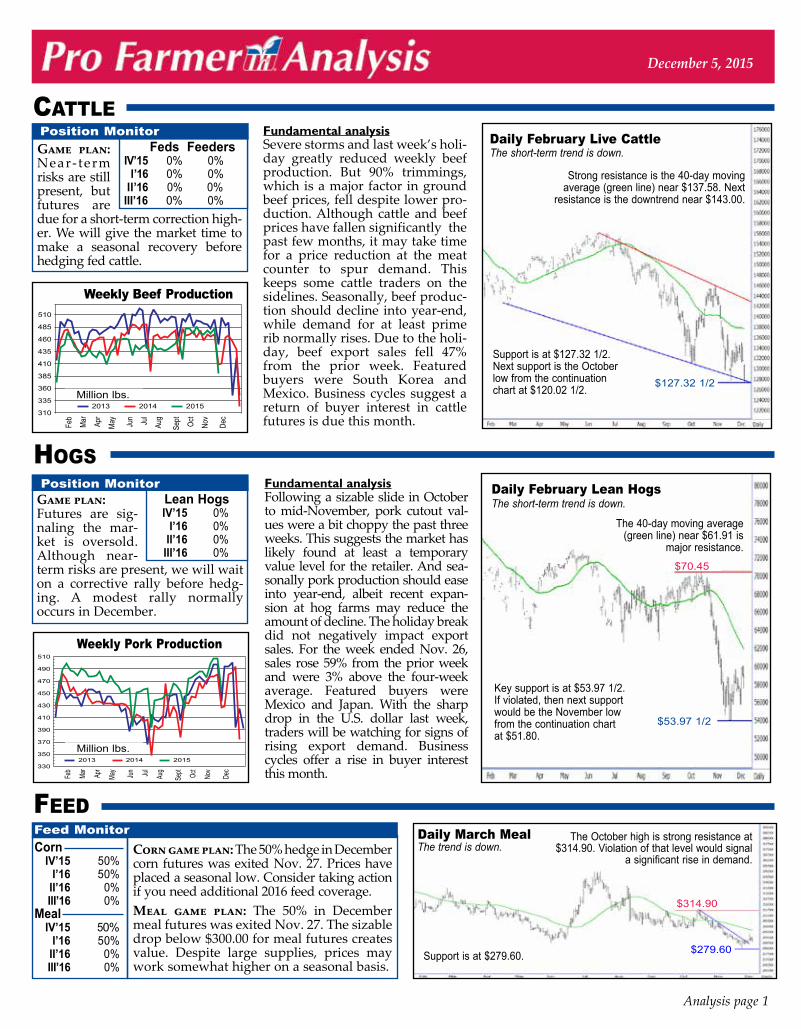
Game plan: Near- term risks are still present, but futures are due for a short-term correction high-er. We will give the market time to make a seasonal recovery before hedging fed cattle.
Corn IV’15 50% I’16 50% II’16 0% III’16 0%Meal IV’15 50% I’16 50% II’16 0% III’16 0%
Analysis page 1
December 5, 2015
hoGs
Cattle
FeedFeed Monitor
Position Monitor
Game plan:Futures are sig-naling the mar-ket is oversold. Although near-term risks are present, we will wait on a corrective rally before hedg-ing. A modest rally normally occurs in December.
Position Monitor Lean Hogs
IV’15 0% I’16 0% II’16 0% III’16 0%
Corn game plan: The 50% hedge in December corn futures was exited Nov. 27. Prices have placed a seasonal low. Consider taking action if you need additional 2016 feed coverage.Meal game plan: The 50% in December meal futures was exited Nov. 27. The sizable drop below $300.00 for meal futures creates value. Despite large supplies, prices may work somewhat higher on a seasonal basis.
Daily March MealThe trend is down.
Fundamental analysisFollowing a sizable slide in October to mid-November, pork cutout val-ues were a bit choppy the past three weeks. This suggests the market has likely found at least a temporary value level for the retailer. And sea-sonally pork production should ease into year-end, albeit recent expan-sion at hog farms may reduce the amount of decline. The holiday break did not negatively impact export sales. For the week ended Nov. 26, sales rose 59% from the prior week and were 3% above the four-week average. Featured buyers were Mexico and Japan. With the sharp drop in the U.S. dollar last week, traders will be watching for signs of rising export demand. Business cycles offer a rise in buyer interest this month.
Feds Feeders IV’15 0% 0% I’16 0% 0% II’16 0% 0% III’16 0% 0%
Feb
Mar Apr
May Jun Jul
Aug
Sept Oct
Nov
Dec310
335
360
385
410
435
460
485
510
2013 2014 2015
Weekly Beef Production
Feb
Mar
Apr
May
Jun Jul
Aug
Sept Oct
Nov
Dec330
350
370
390
410
430
450
470
490
510
2013 2014 2015
Weekly Pork Production
Daily February Live CattleThe short-term trend is down.
Daily February Lean HogsThe short-term trend is down.
Support is at $127.32 1/2.Next support is the October low from the continuation chart at $120.02 1/2.
Fundamental analysisSevere storms and last week’s holi-day greatly reduced weekly beef production. But 90% trimmings, which is a major factor in ground beef prices, fell despite lower pro-duction. Although cattle and beef prices have fallen significantly the past few months, it may take time for a price reduction at the meat counter to spur demand. This keeps some cattle traders on the sidelines. Seasonally, beef produc-tion should decline into year-end, while demand for at least prime rib normally rises. Due to the holi-day, beef export sales fell 47% from the prior week. Featured buyers were South Korea and Mexico. Business cycles suggest a return of buyer interest in cattle futures is due this month.
The October high is strong resistance at $314.90. Violation of that level would signal
a significant rise in demand.
Strong resistance is the 40-day moving average (green line) near $137.58. Next
resistance is the downtrend near $143.00.
Support is at $279.60.
Key support is at $53.97 1/2.If violated, then next support would be the November low from the continuation chart at $51.80.
The 40-day moving average (green line) near $61.91 is
major resistance.
$314.90
$127.32 1/2
$70.45
$53.97 1/2
$279.60
Million lbs.
Million lbs.
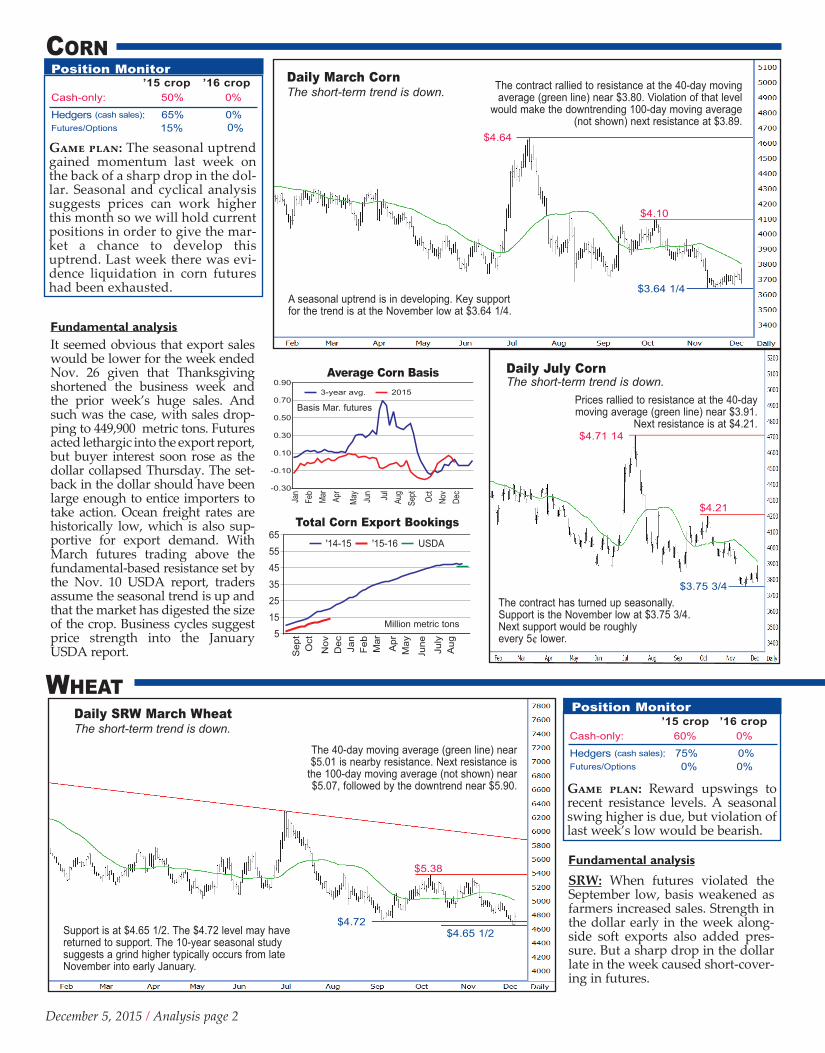
Position Monitor — All Wheat ’15 crop ’16 cropCash-only: 60% 0%
Hedgers (cash sales): 75% 0%Futures/Options 0% 0%
Game plan: Reward upswings to recent resistance levels. A seasonal swing higher is due, but violation of last week’s low would be bearish.
December 5, 2015 / Analysis page 2
Corn
Jan
Feb
Mar Apr
May Jun Jul
Aug
Sept Oct
Nov
Dec-0.30
-0.10
0.10
0.30
0.50
0.70
0.903-year avg. 2015
Sep
tO
ct
Nov
Dec Jan
Feb
Mar
Apr
May
June
July
Aug
5152535455565
'14-15 '15-16 USDA
Total Corn Export Bookings
Average Corn Basis
The short-term trend is down.Daily SRW March Wheat
Daily March CornThe short-term trend is down.
Position Monitor ’15 crop ’16 cropCash-only: 50% 0% Hedgers (cash sales): 65% 0% Futures/Options 15% 0%
Wheat
Fundamental analysisIt seemed obvious that export sales would be lower for the week ended Nov. 26 given that Thanksgiving shortened the business week and the prior week’s huge sales. And such was the case, with sales drop-ping to 449,900 metric tons. Futures acted lethargic into the export report, but buyer interest soon rose as the dollar collapsed Thursday. The set-back in the dollar should have been large enough to entice importers to take action. Ocean freight rates are historically low, which is also sup-portive for export demand. With March futures trading above the fundamental-based resistance set by the Nov. 10 USDA report, traders assume the seasonal trend is up and that the market has digested the size of the crop. Business cycles suggest price strength into the January USDA report.
Fundamental analysis
SRW: When futures violated the September low, basis weakened as farmers increased sales. Strength in the dollar early in the week along-side soft exports also added pres-sure. But a sharp drop in the dollar late in the week caused short-cover-ing in futures.
Game plan: The seasonal uptrend gained momentum last week on the back of a sharp drop in the dol-lar. Seasonal and cyclical analysis suggests prices can work higher this month so we will hold current positions in order to give the mar-ket a chance to develop this uptrend. Last week there was evi-dence liquidation in corn futures had been exhausted.
Basis Mar. futures
Position Monitor
Million metric tons
The 40-day moving average (green line) near $5.01 is nearby resistance. Next resistance is
the 100-day moving average (not shown) near $5.07, followed by the downtrend near $5.90.
The contract rallied to resistance at the 40-day moving average (green line) near $3.80. Violation of that level
would make the downtrending 100-day moving average (not shown) next resistance at $3.89.
Daily July CornThe short-term trend is down.
Prices rallied to resistance at the 40-day moving average (green line) near $3.91.
Next resistance is at $4.21.
$4.21
Support is at $4.65 1/2. The $4.72 level may have returned to support. The 10-year seasonal study suggests a grind higher typically occurs from late November into early January.
The contract has turned up seasonally. Support is the November low at $3.75 3/4.Next support would be roughly every 5¢ lower.
A seasonal uptrend is in developing. Key support for the trend is at the November low at $3.64 1/4.
$4.71 14
$5.38
$4.65 1/2
$3.75 3/4
$4.64
$4.10
$3.64 1/4
$4.72

Game plan: Traders are encour-aged a seasonal rally is underway for soybeans. They are watching Brazilian weather for signs of additional crop risk. And the lower dollar provided support to the uptrend that began Nov. 23. With seasonal and cyclical studies offering support to prices this month, we will follow the uptrend at this time.
December 5, 2015 / Analysis page 3
Daily March SoybeansThe short-term trend is down.
Average Soybean Basis
Position Monitor ’15 crop ’16 cropCash-only: 50% 0% Hedgers (cash sales): 65% 0% Futures/Options 30% 0%
Fundamental analysisWith January futures roughly 32¢ per bu. above the high of the Nov. 10 USDA reports, which were bearish, the market has made a statement that the 2015-crop has been dialed in. Typically prices work higher into July with a cor-rection in March. But large global supplies may alter this behavior. Weekly export sales have been strong, though cumulative book-ings lag due to the dollar causing a delay of a seasonal return of export demand. So last week’s drop in the dollar was welcomed by soybean bulls. Given that European rape-seed prices have been working higher since late 2014 and Chinese soybean futures turned higher the past two weeks, there are signs of strong global demand for soy-beans. Business cycles suggest price support into January.
SoybeanS
Sept
Oct
Nov
Dec
Jan
Feb
Mar
Apr
May Jun
July
Aug10
152025303540455055
'14-15 '15-16 USDA
Total Soybean Export Bookings
Jan
Feb Mar
Apr
May
June
July
Aug
Sep
t
Oct
Nov
Dec
-0.70
-0.60
-0.50
-0.40
-0.30
-0.20
-0.10
0.002015 SRW
2015 HRW
3-yearSRW avg.
3-yearHRW avg.
Average Wheat Basis
Total Wheat Export Bookings
HRW: Basis for HRW wheat turned sharply lower last week as farmers stepped up sales, while export demand was light. Farmers stepped up sales on news global competi-tion is likely to increase given that political change in Argentina favors easier exports for its producers. The futures market was not as weak as cash due to traders thinking the downtrend since early October had been overdone.
HRS: Ratios suggest HRS wheat is relatively stronger than the other wheats. This is partially due to less seller interest. Traders are watching world weather issues that may provide global price sta-bility this winter.
Daily HRW March Wheat
Daily HRS March Wheat
Basis March futures
$12.42 1/2
The short-term trend is down.Daily January Soybeans
Million metric tons
Last week, the contract rallied into resistance at the 100-day moving average (not shown) near $9.02. Next resistance is at $9.26, followed by the 200-day moving average (not shown) around $9.33.
May
June
July
Aug
Sep
tO
ct
Nov
Dec Jan
Feb Mar
Apr
May
June
0
5
10
15
20
25
30'14-15 '15-16 USDA
Resistance is the 40-day moving average (green line) near $5.20,
followed by $5.56.
Jan
Feb
Mar Apr
May Jun
Jul
Aug
Sept
Oct
Nov
Dec-0.40
0.00
0.40
0.80
1.20
1.603-year avg. 2015
Million metric tons
The contract rallied to resistance at the downtrending 40-day moving average (green line) near $9.01. If
violated, traders will consider next resistance at $9.23 1/2, followed by the eroding 200-day moving average (not
shown) near $9.31.
Basis Jan. futures
Support is layered every 5¢ lower from $4.63 3/4.
$9.23 1/2
$9.26
Support is the September low at $5.00.
Nearby support is the 40-day moving average (green line) near $8.81. Next support is at $8.57, followed by the November low at $8.44 1/4.
Support is at the 40-day moving average (green line) near $8.92, followed by $8.58 1/2 and $8.47.
$10.50 1/4
$8.44 1/4
$8.58 1/2
$10.44 1/4
$5.00
$4.63 3/4
$5.35
$5.56
Nearby resistance is the 40-day moving average (green line)
near $4.90.
$8.57
$8.47

December 5, 2015 / Analysis page 4
From the Bullpen
Average Cotton Basis
CottonPosition Monitor ’15 crop ’16 cropCash-only: 35% 0% Hedgers (cash sales): 35% 0% Futures/Options 0% 0%
Fundamental analysisIn its final Crop Progress Report for 2015, USDA showed 80% of cotton was harvested compared to 88% on average. Weather has caused a delay, but on balance, traders are now focused on demand and how tight-fisted farmers are given that the crop is smaller than last year.
Total Cotton Export Bookings
General outlook
Game plan: Futures normally bot-tom in November and rally into March. With the smaller crop, be patient on a post-harvest rally.
by Sr. Market Analyst Rich Posson
Read Pro Farmer on Friday!Put the news and analysis of Pro Farmer newsletter to work for
you as early as Friday afternoon — before it hits the mail. Get Pro Farmer newsletter via e-mail.
Call 1-800-772-0023 for details.
Investors also recognized a rate hike by the Fed does not necessarily relate to problems for the stock market and economy. Instead, a Fed rate hike is a greenlight that it believes risks to the U.S. economy have abated or are sufficiently reduced.
December has long been one of the best performing months for the stock market. The 10-year seasonal study shows the DJIA index usually rallied from Nov. 20 to Dec. 26 and rose 3.3% on average.
Stock market: Equities have strug-gled this year. The Dow Jones Industrial Average (DJIA) index fell nearly 12.5% during July and August on fears about China’s economic sta-bility, geopolitical unrest and a lack of confidence as to the impact of a potential rate hike this year.
During October investors realized fears about China were likely over-done and the U.S. economy was not falling apart, though it was experi-encing a slower pace of growth.
May
June July
Aug
Sept Oct
Nov
Dec
Jan
Feb
Mar
April
May
June July
1000
3000
5000
7000
9000
11000
13000'14-15 '15-16 USDA
’000 running bales
Manage Fertilizer Price Risk! Pro Farmer’s Inputs Monitor gives you the tools to make informed
decisions when booking fertilizers and fuels. Visit: InputsMonitor.com to check your local pricing and follow price trends.
Call 1-800-772-0023 for details.
Key Market Items on My ‘To Watch’ List
1) USDA Crop Production, S&D Reports — Wednesday, Dec. 9, 11:00 a.m. CTUSDA will update its supply and demand balance sheet. There will be no corn and soybean crop estimates this month.
2) USDA Export Sales Report — Thursday, Dec. 10, 7:30 a.m. CTThe weekly export sales report will provide insight as to export demand for 2015-16.3) Consumer Sentiment — Friday, Dec. 11, 9:00 a.m. CT Consumer sentimet is viewed as a major factor in economic growth.
Jan
Feb
Mar Apr
May Jun Jul
Aug
Sept Oct
Nov
Dec-800.00
-700.00-600.00-500.00-400.00-300.00-200.00-100.00
0.003-year avg. 2015
Basis March futures
On Dec. 16, the Federal Reserve (Fed) is due to vote as to whether to change its rate poli-cy relative to the latest data on the condition and the sustainability of the U.S. economy.
Unemployment has declined at an exponential pace since 2010 to the point of achieving the Fed’s goal of maximum employment. But its other goal, the rate of inflation, is far from 2%, which does not make it a guarantee the Fed will raise rates. And a delay of a hike may relate to a manufacturing index for November that showed a contraction in the U.S. econo-my, which is contradictive of strength in job creation and improving gross domes-tic product.
Commodity traders and farmers are con-cerned with what the result of a Fed rate hike will be. I discovered that during past
decades when the Fed raised rates following a recession, that commodities and the stock market were usually well supported.
Dollar traders assume a Fed rate hike should cause a stronger currency. But history shows that the dollar fell at times during a Fed rate hike. On average, I found for the first year of Fed rate hikes in 1977, 1986, 1988, 1994, 1999 and 2004, the dollar declined dur-ing the first year of higher rates by 3%. And years when the dollar was lower, the decline averaged 11%.
A Fed rate hike may cause a jump in the dollar, but history shows there is potential for a sizable correction in the currency, which would assist U.S. agricultural exports. Last week, the dollar violently breached an uptrend since October, suggesting a correc-tion may be underway.
Daily March CottonThe trend is choppy.
Resistance is at 64.50¢. Violation of that level would increase odds the seasonal
trend is up. Major resistance is at the July high at 67.90¢.
Monthly Dow Jones Industrial Average
Nearby support is the 40-day moving average (green line) near 62.68¢.Key support is the September low at 59.45¢.
59.45¢
Key resistance is at 18,351.36. Next resistance is the uptrend near 20,000.00.
67.90¢
64.50¢
18,351.36
15,370.33
Strong support is at 15,370.33.


![doane chapter 13 [โหมดความเข้ากันได้] · Doane’s Rule(relaxed): n/k > 5 5 (at least ... • Test each fitted coefficient to see whether it is](https://img.pdfslide.net/doc/110x75/5afa0d977f8b9aac248f4bf1/doane-chapter-13-s-rulerelaxed.jpg)