Embed Size (px)
Citation preview

ACOUSTICAL STUDY
Gravel Pit Solar 120 MW Solar Photovoltaic Energy Generation Project in East Windsor, Connecticut
PREPARED FOR
Gravel Pit Solar, LLC Gravel Pit Solar II, LLC Gravel Pit Solar III, LLC Gravel Pit Solar IV, LLC
1166 Avenue of the Americas, 9th Floor New York, NY 10036
PREPARED BY
100 Great Meadow Road Suite 200 Wethersfield, Connecticut 06109
May 2020; Updated July 2020

Acoustical Study
i Table of Contents\\vhb\gbl\proj\Wethersfield\42569.00\tech\Acoustic_Assessment\Report\Gravel Pit Solar Acoustical Study_05 19 2020.docx
Table of Contents
Introduction ................................................................................................................................................. 1
Project Description ...................................................................................................................................................................... 1 Fundamentals of Noise .............................................................................................................................................................. 2 Noise Impact Criteria .................................................................................................................................................................. 4
Acoustical Assessment ................................................................................................................................ 5
Methodology ................................................................................................................................................................................. 5 Receptor Locations ......................................................................................................................................................... 6
Existing Conditions ...................................................................................................................................................................... 9 Future Conditions ........................................................................................................................................................................ 9
Findings ...................................................................................................................................................... 12
Conclusion of Acoustical Assessment ............................................................................................................................... 12 Construction Activities ............................................................................................................................................................ 12

Acoustical Study
ii Table of Contents\\vhb\gbl\proj\Wethersfield\42569.00\tech\Acoustic_Assessment\Report\Gravel Pit Solar Acoustical Study_05 19 2020.docx
List of Tables
Table No. Description Page
Table 1 Common Outdoor and Indoor Sound Levels ................................................................................ 3
Table 2 Noise Zone Standards ............................................................................................................................ 4
Table 3 Existing Ambient Sound Levels, dB(A) .............................................................................................. 9
Table 4 Sound Levels at Receptor Locations, dB(A) ................................................................................. 10
Acoustical Study
iii Table of Contents\\vhb\gbl\proj\Wethersfield\42569.00\tech\Acoustic_Assessment\Report\Gravel Pit Solar Acoustical Study_05 19 2020.docx
List of Figures
Figure No. Description Page
Figure 1 Monitoring and Receptor Locations ................................................................................................. 8

Acoustical Study
1 Acoustical Assessment
1 Introduction The purpose of this acoustical study is to evaluate the potential noise impacts associated with the construction and operation of the proposed Gravel Pit Solar Project located in East Windsor, Connecticut. This acoustical assessment evaluated the potential sound levels generated by the mechanical equipment, including the inverters, transformers, and single-axis tracking panel rack systems, that will be part of the Project. The sound levels were compared to the Connecticut Department of Energy and Environmental Protection’s (CT DEEP) noise control regulations (Regulations of Connecticut State Agencies (RCSA), Title 22a, Section 22a-69-1 to 22a-69-7).
Project Description The Gravel Pit Solar Project (the Project) proposed by Gravel Pit Solar, LLC, Gravel Pit Solar II, LLC, Gravel Pit Solar III, LLC, and Gravel Pit Solar IV, LLC (collectively Gravel Pit Solar or the Petitioners) is located on approximately 485 acres and will be sited on eight parcels of land in the Town of East Windsor, Connecticut. The eight parcels of land proposed for the Project are identified by the Town of East Windsor Tax Assessor as 01160500, 01161000, 01424500, 00896507, 01424000, 00196000, 01977500 and 00197500, collectively referred to herein as the Project Site.

Acoustical Study
2 Acoustical Assessment
Fundamentals of Noise Noise is defined as unwanted or excessive sound. Sound becomes unwanted when it interferes with normal activities such as sleep, communication, work, or recreation. How people perceive sound depends on several measurable physical characteristics, which include the following:
› Intensity – Sound intensity is often equated to loudness.
› Frequency – Sounds are comprised of acoustic energy distributed over a varietyof frequencies. Acoustic frequencies, commonly referred to as tone or pitch, aretypically measured in Hertz. Pure tones have all their energy concentrated in anarrow frequency range.
Sound levels are most often measured on a logarithmic scale of decibels (dB). The decibel scale compresses the audible acoustic pressure levels which can vary from the threshold of hearing (zero dB) to the threshold of pain (120 dB). Because sound levels are measured in dB, the addition of two sound levels is not linear. Adding two equal sound levels creates a 3 dB increase in the overall level. Research indicates the following general relationships between sound level and human perception:
› A 3 dB increase is a doubling of acoustic energy and is the threshold ofperceptibility to the average person.
› A 10 dB increase is a tenfold increase in acoustic energy but is perceived as adoubling in loudness to the average person.
The human ear does not perceive sound levels from each frequency as equally loud. To compensate for this phenomenon in perception, a frequency filter known as A weighted [dB(A)] is used to evaluate environmental noise levels. Table 1 presents a list of common outdoor and indoor sound levels.

Acoustical Study
3 Acoustical Assessment
Table 1. Common Outdoor and Indoor Sound Levels
Outdoor Sound Levels
Sound Pressure (µPa)*
Sound Level
dB(A)** Indoor Sound Levels 6,324,555 - 110 Rock Band at 5 m Jet Over Flight at 300 m - 105 2,000,000 - 100 Inside New York Subway Train Gas Lawn Mower at 1 m - 95 632,456 - 90 Food Blender at 1 m Diesel Truck at 15 m - 85 Noisy Urban AreaDaytime 200,000 - 80 Garbage Disposal at 1 m - 75 Shouting at 1 m Gas Lawn Mower at 30 m 63,246 - 70 Vacuum Cleaner at 3 m Suburban Commercial Area - 65 Normal Speech at 1 m 20,000 - 60 Quiet Urban AreaDaytime - 55 Quiet Conversation at 1 m 6,325 - 50 Dishwasher Next Room Quiet Urban AreaNighttime - 45 2,000 - 40 Empty Theater or Library Quiet SuburbNighttime - 35 632 - 30 Quiet Bedroom at Night Quiet Rural AreaNighttime - 25 Empty Concert Hall Rustling Leaves 200 - 20 - 15 Broadcast and Recording Studios 63 - 10 - 5 Reference Pressure Level 20 - 0 Threshold of Hearing
Source: Highway Noise Fundamentals. Federal Highway Administration, September 1980. * mPA – MicroPascals, which describe pressure. The pressure level is what sound level monitors measure. ** dB(A) – A weighted decibels, which describe sound pressure logarithmically with respect to 20 mPa (the reference
pressure level).
A variety of sound level indicators can be used for environmental noise analysis. These indicators describe the variations in intensity and sequential pattern of the sound levels. The indicators used in this analysis are defined as follows:
› Leq is the A-weighted sound level, which averages the background sound levels with short-term transient sound levels and provides a uniform method for comparing sound levels that vary over time.
› L10 is the A-weighted sound level, which is exceeded for 10 percent of the time during the time period.
› L90 is the A-weighted sound level, which is exceeded for 90 percent of the time during the time period. The L90 is generally considered to be the background sound level. It should be noted that the L90 eliminates the highest 10 percent of the sound levels that occur in the study area.

Acoustical Study
4 Acoustical Assessment
Noise Impact Criteria The Connecticut Department of Energy and Environmental Protection (CT DEEP) has developed noise impact criteria that establish sound level thresholds deemed to result in adverse impacts. The acoustic analysis for the Project used these criteria to evaluate whether the Project will generate sound levels that result in adverse impacts.
The CT DEEP’s noise control regulations identify the limits of sound that can be emitted from specific premises and what activities are exempt. The noise control regulations (Title 22a, §§ 22a-69-1 to 22a 69-7) are contained in the RCSA. Even though the proposed Project would be considered a Class C (Industrial) emitter by the CT DEEP, the acoustic analysis for the Project assumed the more stringent noise standard for a Class B (Commercial) Emitter Zone and a Class A (Residential) Receptor Noise Zone for the residential receptor locations. A Class C land use is defined as generally industrial where protection against damage to hearing is essential, and the necessity for conversation is limited. The land use for Class B is defined as generally commercial in nature, where human beings converse and such conversations are essential to the intended use of the land. The land use in Class A is defined as generally residential where human beings sleep or areas where serenity and tranquility are essential to the intended use of the land.
The CT DEEP policy states that a source (emitter) located in the various zones shall not emit noise exceeding the levels stated in Table 2 at the adjacent noise zones.
Table 2. Noise Zone Standards
Emitter Zone
Receptor Noise Zone Class A
(Daytime) Class A
(Nighttime) Class B Class C Class A (Residential) 55 45 55 62 Class B (Commercial) 55 45 62 62 Class C (Industrial) 61 51 66 70
Source: Control of Noise (Title 22a, Section 22a-69-1 to 22a-69-7.4), RCSA, Revised 2015-3-6.

Acoustical Study
5 Acoustical Assessment
2 Acoustical Assessment
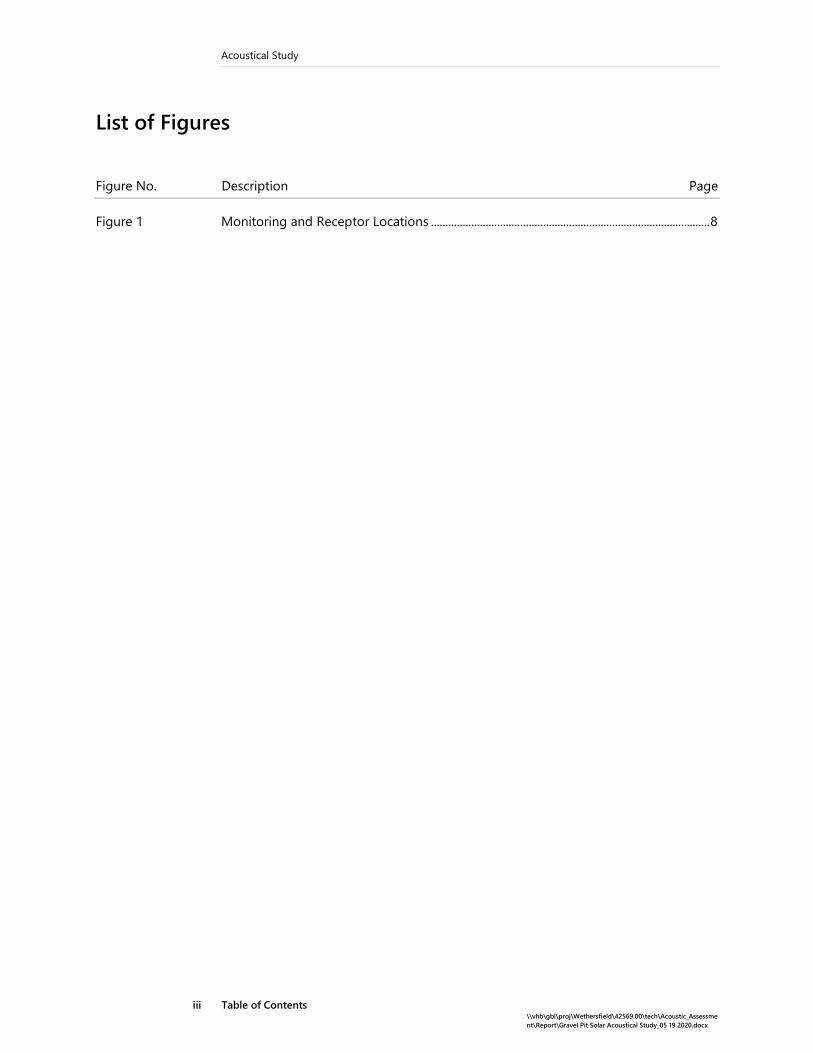
Methodology This acoustical study evaluated the sound levels from the Project’s proposed mechanical equipment. The Project’s noise sources consist of 36 electrical inverters used to convert the solar energy to usable electricity, two transformers at the Project (GPS) Switchyard, and 1,133 small actuator motors that move the single-axis panel tracking system to follow the sun. The noise analysis consists of two components: existing ambient sound levels and Project contributions. The existing condition sound levels were determined by conducting sound level measurements at representative property line locations surrounding the Project Site. Refer to Figure 1: Monitoring and Receptor Locations. The Project-generated sound levels were calculated using manufacturer’s sound data and the principles of acoustical propagation of sound over distance.
Sound level measurements were conducted to determine the existing ambient sound levels in the vicinity of the Project Site. Measurements were conducted at six locations that were selected as representative of the residential neighborhoods surrounding the Project Site. The measurements were conducted for a 24-hour period to capture typical weekday daytime and nighttime sound levels.
The Project-generated sound levels were calculated for each sensitive receptor location based on manufacturer-provided reference sound level data. The reference sound level data included the following:
• TMEiC Solar Ware Ninja Inverters - 82.5 dBA at 3.3 feet;
• Transformers – 79 dB to 80 dB at 6 feet; and
• NEXTracker’s Horizon Single Axis Tracker motor – 69.6 dB at 3.3 feet.

Acoustical Study
6 Acoustical Assessment
The reference sound level data for the inverters and tracking system motor were obtained from the manufacturer’s testing of the equipment. The reference sound levels for the transformers are based on data obtained from the National Electrical Manufacturers Association (NEMA) TR1 publication. These reference sound levels were adjusted to reflect the distances and path to the sensitive receptor locations. The Project-generated sound levels were projected to the receptor locations using the properties of sound propagation for soft ground terrain in the acoustic modeling software CadnaA1 (Computer Aided Noise Abatement). CadnaA is an internationally accepted sound prediction program that implements the International Standards Organization (ISO) 9613-2 sound propagation standard. This model takes in to account the sound emissions of equipment, the ground cover, and terrain geometry of the project area. The assessment assumed all equipment operating simultaneously during the daytime period. The results were compared to the CT DEEP noise impact criteria for determining compliance.
Receptor Locations
Fifty-six receptor locations were identified in the vicinity of the Project Site. The receptor locations were selected based on their proximity to the Site and their land use. These receptor locations represent the most sensitive locations in the immediate area that may experience changes in sound levels once the Project is in operation. These receptor locations, shown in Figure 1, represent the residential parcels that surround the Project Site and include:
R1 – 363 Rye St R16 – 259 Rye St
R2 – 359 Rye St R17 – 257 Rye St
R3 – 357 Rye St R18 – 247 Rye St
R4 – 353 Rye St R19 – 169 Rye St
R5 – 351 Rye St R20 – Rye St
R6 – 349 Rye St R21 – 30 Apothecaries Hall Rd
R7 – 345 Rye St R22 – 45 Apothecaries Hall Rd
R8 – 341 Rye St R23 – 47 Apothecaries Hall Rd
R9 – 20 Plantation Rd R24 – 51 Apothecaries Hall Rd
R10 – 25 Plantation Rd R25 – 53 Apothecaries Hall Rd
R11 – 295 Rye St R26 – 57 Apothecaries Hall Rd
R12 – 281 Rye St R27 – 141-79 Windsorville Rd
R13 – 271 Rye St R28 – 85 Apothecaries Hall Rd
R14 – 265 Rye St R29 – 87 Apothecaries Hall Rd
R15 – 263 Rye St R30 – 89 Apothecaries Hall Rd 1 DataKustik GmbH, 2018. Computer Aided Noise Abatement Model.

Acoustical Study
7 Acoustical Assessment
R31 – 91 Apothecaries Hall Rd R42 – 22 Wapping Rd
R32 – 93 Apothecaries Hall Rd R43 – 36 Wapping Rd
R33 – 95 Apothecaries Hall Rd R44 – 20 Wapping Rd
R34 – 97 Apothecaries Hall Rd R45 – 40 Wapping Rd
R35 – 99 Apothecaries Hall Rd R46 – 60-134 Wapping Rd
R36 – 142 Windsorville Rd R47 – 80 Wapping Rd
R37 – 145 Windsorville Rd R48 – Rye St
R38 – 147 Windsorville Rd R49 – Rye St
R39 – 153 Windsorville Rd R50 – Rye St
R39A – 159 Windsorville Rd R51 – 140 Wapping Rd
R40 – 166 Windsorville Rd R52 – 223-169 Wapping Rd
R40A – 169 Windsorville Rd R53 – 46 Plantation Rd
R41 – 176 Windsorville Rd R54 – 47 Plantation Rd

Acoustical Study
8 Acoustical Assessment
Figure 1. Monitoring and Receptor Locations

Fox
Meadow
Ln
Lewis
Dr
King's Ct
Ste
ppin
gSto
ne
Dr
Fieldstone
Ln
WView
Dr
Joseph
Farm
Rd
Abbe R
d
Thomas
St
Windsorville
Rd
Cobble
stone
Dr
NapoleonDr
Pettico
atLn
Deerfield Dr
Pin
e D
r
Dempse
yRd
Norton R
d
AllenDr
Ellsworth
Rd
Rye S
t
Deerfie
ldDr
Rye
St
MorrisRd
Griffin Rd
Omelia Rd
Cham
berla
in Rd
Plantation Rd
Win
dso
rville
Rd
ApothecariesHall
Rd
Gra
ham R
d
Mille
r Rd
Rye
St
Wappin
gRd
Source: Esri, DigitalGlobe, GeoEye, Earthstar Geographics, CNES/Airbus DS, USDA, USGS, AeroGRID, IGN, and the GIS User Community
Gravel Pit Solar East Windsor, CT
FIGURE 1
Acoustical Assessment
i 0 0.1 0.20.05 Miles
May 14, 2020
Inverters
Transformers
Receptor Locations
Project Site
Tracking Panels
Monitoring Locations
Fixed-Panels

Acoustical Study
9 Acoustical Assessment
Existing Conditions Sound level measurements were conducted to determine existing ambient conditions in the area surrounding the Project Site. The existing sound levels were measured using Type 1 sound analyzers (Larson Davis SoundExpert LxT and 831). Measurements were conducted for a 24-hour period at each monitoring location from approximately 10:00 AM on March 2, 2020 to approximately 10:00 AM on March 3, 2020. During the daytime period, the measured sound level data under existing conditions were composed of noise from the nearby active gravel pit and vehicles on local roadways in the vicinity of the monitoring locations. The existing measured sound level data are presented in Table 3.
Table 3. Existing Ambient Sound Levels, dB(A)
CT DEEP Residential Zone Noise Standard
Measured L90 Sound Levels
Monitoring Location1 Daytime2 Nighttime3 Daytime Nighttime M1 – Windsorville Road 55 45 36-45 32-39 M2 – Wapping Road 55 45 36-46 34-41 M3 – Rye Street 55 45 32-41 35-41 M4 – Plantation Road 55 45 36-43 33-42 M5 – Quarry/Napoleon Drive 55 45 35-41 35-39 M6 – Apothecaries Hall Road North 55 45 34-45 33-39 1 Refer to Figure 1 for monitoring locations. 2 Daytime is from 7:00 AM to 10:00 PM. 3 Nighttime is from 10:00 PM to 7:00 AM.
The L90 sound levels range from 32 dB(A) to 46 dB(A) during the daytime period and from 32 dB(A) to 42 dB(A) during the nighttime period. The result of the monitoring program indicates that the daytime and nighttime sound levels within the study area are currently below the CT DEEP’s daytime and nighttime standard of 55 dB(A) and 45 dB(A), respectively.
Future Conditions VHB evaluated the potential sound level impacts associated with the Project’s proposed mechanical equipment at the nearby sensitive receptor locations. This analysis evaluated the potential sound level impacts from the 36 inverters, two transformers, and 1,133 tracking system motors operating simultaneously.
The potential sound level associated with the proposed equipment were determined by comparing existing and future sound levels to the CT DEEP’s noise standards. The existing sound levels were based upon sound level measurements. The sound levels were adjusted based upon distance, properties of sound propagation over terrain, and applicable blockage and obstructions.
The results of the acoustical analysis demonstrated that the operation of the proposed equipment will comply with CT DEEP’s noise standards at the sensitive

Acoustical Study
10 Acoustical Assessment
receptor locations. The sound levels attributed to the proposed equipment ranges from approximately 14 dB(A) to 42 dB(A). During the daytime period, the receptor locations will experience overall sound levels (ambient plus project contributions) ranging from approximately 33 dB(A) to 46 dB(A). These sound levels are below CT DEEP’s daytime criteria of 55 dB(A). Due to the nature of the Project, the equipment will not be operating during the nighttime period. Table 4 summarizes the sound levels at the receptor locations.
Table 4 Sound Levels at Receptor Locations, dB(A)
Receptor Locations
CT DEEP Noise
Standard Daytime*
Project Generated
Sound Levels
Overall Sound Levels
R1 – 363 Rye Street 55 27.0 33 - 41 R2 – 359 Rye Street 55 27.7 33 - 41 R3 – 357 Rye Street 55 28.1 33 - 41 R4 – 353 Rye Street 55 28.3 34 - 41 R5 – 351 Rye Street 55 28.3 34 - 41 R6 – 349 Rye Street 55 28.3 34 - 41 R7 – 345 Rye Street 55 28.3 34 - 41 R8 – 341 Rye Street 55 31.6 37 - 43 R9 – 20 Plantation Road 55 30.0 37 - 43 R10 – 25 Plantation Road 55 36.1 39 - 44 R11 – 295 Rye Street 55 40.4 42 - 45 R12 – 281 Rye Street 55 22.1 36 - 43 R13 – 271 Rye Street 55 14.1 36 - 43 R14 – 265 Rye Street 55 18.6 36 - 43 R15 – 263 Rye Street 55 18.3 36 - 43 R16 – 259 Rye Street 55 17.5 36 - 43 R17 – 257 Rye Street 55 22.2 36 - 43 R18 – 247 Rye Street 55 20.5 36 - 43 R19 – 169 Rye Street 55 20.6 36 - 43 R20 – Rye Street 55 27.5 36 - 42 R21 – 30 Apothecaries Hall Road 55 28.7 36 - 42 R22 – 45 Apothecaries Hall Road 55 30.6 36 - 46 R23 – 47 Apothecaries Hall Road 55 32.0 36 - 46 R24 – 51 Apothecaries Hall Road 55 33.3 37 - 46 R25 – 53 Apothecaries Hall Road 55 33.2 37 - 46 R26 – 57 Apothecaries Hall Road 55 31.3 36 - 46 R27 – 141-79 Windsorville Road 55 27.2 35 - 45 R28 – 85 Apothecaries Hall Road 55 25.9 35 - 45 R29 – 87 Apothecaries Hall Road 55 26.0 35 - 45 R30 – 89 Apothecaries Hall Road 55 26.1 35 - 45

Acoustical Study
11 Acoustical Assessment
Receptor Locations
CT DEEP Noise
Standard Daytime*
Project Generated
Sound Levels
Overall Sound Levels
R31 – 91 Apothecaries Hall Road 55 26.1 35 - 45 R32 – 93 Apothecaries Hall Road 55 26.2 35 - 45 R33 – 95 Apothecaries Hall Road 55 26.3 35 - 45 R34 – 97 Apothecaries Hall Road 55 26.3 35 - 45 R35 – 99 Apothecaries Hall Road 55 26.4 36 - 45 R36 – 142 Windsorville Road 55 26.3 36 - 45 R37 – 145 Windsorville Road 55 26.2 36 - 45 R38 – 147 Windsorville Road 55 26.5 36 - 45 R39 – 153 Windsorville Road 55 26.7 36 - 45 R39A – 159 Windsorville Road 55 26.3 36 - 45 R40 – 166 Windsorville Road 55 26.5 36 - 45 R40A – 169 Windsorville Road 55 25.6 36 - 45 R41 – 176 Windsorville Road 55 28.9 37 - 45 R42 – 22 Wapping Road 55 23.3 36 - 45 R43 – 36 Wapping Road 55 24.9 36 - 46 R44 – 20 Wapping Road 55 23.3 36 - 46 R45 – 40 Wapping Road 55 23.8 36 - 46 R46 – 60-134 Wapping Road 55 25.7 36 - 46 R47 – 80 Wapping Road 55 27.1 36 - 46 R48 – Rye Street 55 27.2 36 - 46 R49 – Rye Street 55 29.0 37 - 46 R50 – Rye Street 55 31.1 37 - 43 R51 – 140 Wapping Road 55 36.4 39 - 44 R52 – 223-169 Wapping Road 55 31.9 37 - 46 R53 – 46 Plantation Road 55 28.7 34 - 41 R54 – 47 Plantation Road ** 62 42.2 43 - 46
* Noise standard for Class B emitter and Class A receptor. ** Noise standard for Class B emitter and Class B receptor for commercial use location.

Acoustical Study
12 Acoustical Assessment
3 Findings
Conclusion of Acoustical Assessment In this acoustical analysis, VHB evaluated the sound levels associated with the Project’s mechanical equipment which includes 36 inverters, two transformers, and 1,133 tracking system motors. This analysis determined that the properties abutting the Project Site currently experience sound levels below CT DEEP’s daytime noise standards.
Due to the low noise equipment and siting of the proposed equipment central to the Project Site, the sound levels associated with the Project’s mechanical equipment are expected to comply with CT DEEP’s noise standards and have no adverse noise impacts at nearby sensitive receptor locations.
Construction Activities Construction activities, including the intermittent use of heavy machinery, may result in temporary increases in nearby sound levels at the proposed Project. The Project is expected to generate typical sound levels from construction activities, including truck movements, heavy equipment operations, and general construction activities. Heavy machinery, such as front-end loaders, graders, bull dozers, and backhoes, would be used intermittently throughout the proposed Project’s construction.
Section 22a-69-1.8(g) of the CT DEEP’s noise control regulation states that noise associated with construction activities are exempt from the regulation. However, even though construction noise is exempt from the regulation, construction activities such as site excavation/grading and installation of the solar panel systems would typically be limited to normal daytime working hours. Construction activities beyond normal daytime work hours would be minimized to the extent practicable.

Acoustical Study
13 Acoustical Assessment
If noise concerns arise during construction, the proponent will evaluate and implement appropriate noise abatement measures to reduce or minimize noise from the construction activities. The GPS Project plans to coordinate closely with the Town during construction. Construction vehicles and equipment would be required to maintain their original engine noise control equipment. Specific mitigation measures may include, but not limited to, the following:
› Implement appropriate traffic management techniques during the construction period to minimize roadway traffic noise impact;
› Implement procedures for proper operation and maintenance, and prohibition of excessive idling of construction equipment engines;
› Adjust construction activity timing to reduce impact of noise at certain times of day.