Embed Size (px)
Citation preview
J. Water Environ. Nanotechnol., 5(3): 191-203 Summer 2020
RESEARCH ARTICLE
Green Synthesis of TiO2 Nanoparticle: Its Characterization and Potential Application in Zoxamide Photodegradation*Pijushkanti Purkait1, Arijita Bhattacharyya2, Sankhajit Roy3, Saikat Maitra5, Gopes Chandra Das4, Mahua Ghosh Chaudhuri1*.
1 School of Materials Science & Nanotechnology, Jadavpur University,Kolkata-700032,West Bengal ,India.2 Department of Chemistry, University of Kalyani, Kalyani, Nadia, PIN- 741235, West Bengal, India.3 Department of Agricultural chemicals, Bidhan Chandra Krishi Viswavidyalaya, Mohanpur, Nadia, WestBengal, India.4 Metallurgical & Material Engineering Department, Jadavpur University, Kolkata-700032, West Bengal, India.5 Government College of Engineering & Ceramic Technology, Kolkata-700010,West Bengal, India.
Received: 2020-05-19 Accepted: 2020-2020-07-04 Published: 2020-08-01
ABSTRACTThis article reports the green synthesis of titanium dioxide nanoparticles (TiO2 NPs) from aqueous leaf extract of Trema Orientalis (L) and its effectiveness in photodegradation process of zoxamide under UV irradiation(λ max ≥ 250 nm). Titanium (IV) isopropoxide act as the precursor and leaf extract act as the reducing agent. The synthesized TiO2 NPs are confirmed by the powder X-ray diffraction (XRD) analysis and the crystalline size was calculated by the Scherrer’s formula(52nm) and as well as Williaman-Hall(W-H) equation(59 nm). The Dynamic Light Scattering (DLS) analysis shows the stability and particle size of approximately 88-94 nm of the synthesized TiO2 NPs. The Fourier Transform Infrared Spectroscopy (FTIR) analysis confirms the presence of various functional groups in the synthesized NPs. The UV absorption wavelength observed at the peak of 351 nm and the calculated energy band gap is found to be 3.27eV. The surface morphology of the synthesized TiO2 NPs is determined by using Scanning Electron Microscopy (SEM). The rate of photodegradation of zoxamide in acetonitrile/water solvent system followed pseudo-first-order kinetics, and calculated half-lives were found to be in the range of 2.33 -10.46 h. From this study, one photoproduct was isolated and characterized based on column chromatography, mass spectral data, and X-ray crystallography. The isolated photoproduct was identified as 3,5-dichloro-4 methyl benzoic acid. The plausible mechanistic pathway of the formation of photoproducts is also depicted. Langmuir–Hinshelwood (L–H) kinetic model was proposed for the rate equation of the zoxamide photodegradation in the presence of TiO2 NPs under UV irradiation.
Keywords: Fungicide; Photocatalyst; TiO2 NPs; Trema Orientalis(L); UV irradiation
How to cite this articlePurkait P., Bhattacharyya A., Roy S., Maitra S., Chandra Das G., Ghosh Chaudhuri M. Green Synthesis of TiO2 Nanoparticle: Its Characterization and Potential Application in Zoxamide Photodegradation. J. Water Environ. Nanotechnol., 2020; 5(3): 191-203. DOI: 10.22090/jwent.2020.03.001
ORIGINAL RESEARCH PAPER
This work is licensed under the Creative Commons Attribution 4.0 International License.To view a copy of this license, visit http://creativecommons.org/licenses/by/4.0/.
* Corresponding Author Email: [email protected]
INTRODUCTION Recent interest in the photocatalytic water
purification process can be related to its significant effectiveness over traditional wastewater techniques like activated carbon-based adsorption, chemical oxidation, microbial treatment, and others. In
traditional methods have some difficulties such as incomplete removal, high consumption of chemical reagent, high treatment cost, time-consuming, and production of toxic secondary waste [1-3]. The phenomenal growth of the agrochemical industry is an outcome of widespread practice of intensive agriculture [4]. As a consequence of which, the
192
P. Purkait et al. / Green Synthesis of TiO2 Nanoparticle
J. Water Environ. Nanotechnol., 5(3): 191-203 Summer 2020
occurrence of pesticide residue as a pollutant in the water resources is becoming frequent. The photochemical degradation of toxic and hazardous compounds is a very useful and efficient technique to solve many environmental problems. The heterogeneous photocatalytic oxidation process mainly relies on the in-situ generation of hydroxyl radicals under ambient conditions which are capable of converting a wide spectrum of toxic organic compounds including the non-biodegradable ones into relatively innocuous end products such as CO2 and H2O [5,6]. In this context, photochemical degradation of pesticide residue is an extremely useful and efficient technique for the water treatment process [7-9]. Photocatalyst while activated by UV or visible radiation results in accelerated degradation of pesticide residue. Studies in wastewater treatment by TiO2 as photocatalyst are still some limitations such as low adsorption capacity to hydrophobic contaminants, absorption only a small fraction of sunlight (2–3%), high aggregation tendency and difficulty of separation and recovery[10-12]. To improve the photo efficiency of TiO2, many studies have been carried out to eliminate the limitations mentioned above.
TiO2 NPs are often implied as photocatalyst in the water treatment system employed exploiting advantages of nanoparticles in size, morphology, and other related properties [13,14]. These photocatalysts are basically semiconducting oxides and among these TiO2 occupied a pivotal position as n-type wide bandgap semiconductor for light absorption, surface adsorption, charge transport photo-induced super hydrophilicity, non-toxicity, etc. that resulted in excellent electrical and optical property[15].
TiO2 NPs successfully remove bacteria and different organic chemicals from water and air [16-19]. In most of these cases, the synthesis of TiO2 NPs for the stated purposes entails the involvement of organic solvents most of which toxic and hazardous and non-environment friendly [20,21]. Researchers have been going on for the substituent of toxic organic solvent with aqueous medium supported by benign stabilizing and capping agent like plant extract, green algae, micro-organisms such as fungi and bacteria [22-25], etc. Green synthesis of the TiO2 NPs has the advantage over other physicochemical processes because bio-inspired processes are relatively cheap, eco-friendly and renewable, compatible for pharmaceutical,
water purification, and biomedical applications and can be easily scaled up for large scale synthesis. Most importantly such processes can be carried out at relatively low pressure and temperature [26].
In this present investigation synthesis of TiO2 NPs was carried out using Trema Orientalis(L) leaf extract which can be considered as a green method of the synthesis of NPs [27] and its effectiveness was studied by photodegradation of zoxamide [3, 5-dichloro-N-(3chloro-1-ethyl-1-methyl-2-oxopropyl)-4 methyl benzamide], a newly introduced benzamide chemical class of fungicide in India to control various fungal infection including blight in potatoes and tomatoes [28]. Due to its chlorinated property, zoxamide can be a potentially hazardous water pollutant [29-30].
In the present work, the photocatalytic degradation of zoxamide in an organic aqueous medium containing under UV using TiO2 NPs synthesized from a green source of Trema Orientalis(L) plant was investigated. The photoproduct from zoxamide during this photocatalytic degradation was identified and the degradation of zoxamide pathway is proposed based on the identified photometabolite.
MATERIALS AND METHODSMaterials
Leaves of Trema Orientalis(L) were collected from West Bengal, India. Titanium (IV) isopropoxide and bulk TiO2 were purchased from Merk. Zoxamide of analytical grade is 98.6% pure from Sigma Aldrich. All solution and reaction mixture prepared using de-ionized water.
Synthesis of TiO2 NPs using aqueous extract of Trema Orientalis(L)
The fresh leaves of Trema Orientalis (L) were gently washed with deionized water to remove dust and then chopped. The chopped leaves (100g) and 500 mL deionized water were boiled at 60oC for 30 min and cooled. This extract was filtered through nylon mesh followed by Whatman 1 filter paper and stored at 4oC for further use. Titanium (IV) isopropoxide precursor is mixed with ethanol in the ratio 1:10 under stirring for 30 min. The aqueous plant extract was heated at 60oC for 10 min. Then plant extract and precursor solution were taken in the ratio 1:10 and stirred using a magnetic stirrer at 60oC for 4 h. Then the mixture was subjected to ultrasonication for 30 minutes. The TiO2 NPS was obtained by filtration and washed with ethanol.
P. Purkait et al. / Green Synthesis of TiO2 Nanoparticle
J. Water Environ. Nanotechnol., 5(3): 191-203 Summer 2020 193
Separated TiO2 NPs were dried at 110oC and ground followed by calcination at 550oC for 3 h to remove the organic contaminants.
Characterization of synthesized NPsThe synthesized nanoparticles were
characterized by X-ray diffraction [Rigaku Ultima III], Fourier Transform Infrared [IR prestige spectrophotometers-21], Scanning Electron microscopy [Carl Zeiss EVO-18], UV-VIS spectrophotometer[Perkin Elmer, Lambda 35] and Dynamic Light Scattering[Malvern particle size analyzer DTS,ver.5.00].
Photodegradation of pesticides under UV lightFor the photo-degradation study of zoxamide
in the different aqueous organic solvent, solvent systems having the composition of acetonitrile: water (1:1, V/V), methanol: water (1:1, V/V), isopropanol: water (1:1, V/V) was prepared. Solutions of zoxamide were made by dissolving 120 mg of Zoxamide in one liter of each aqueous organic solvent and every set of solution were used for the experiment. All sets of sample solutions of zoxamide were irradiated separately by UV light (λ max ≥ 250 nm), inside a reactor fitted with a high-pressure mercury lamp (125 Watt, HPK, Philips). This was jacketed with a water-cooled Pyrex filter. It helps to maintain a fixed solution temperature (25°C) with continuous stirring by a magnetic stirrer. Aluminum foil was used to cover the flasks tightly to prevent any type of contamination or other exposures. Samples were collected at intervals of 0, 1, 2, 3, 6, 9, 12, 15, 18, 20, 24, 27 h from the irradiated solution for determination of degradation pattern of zoxamide in different aqueous organic medium. The rate of dissipation of zoxamide in different aqueous organic solvent systems under UV irradiation shows that the half-life value of zoxamide in case of aqueous acetonitrile is 10.46 h, lowest compared to the two other solvents [for the aqueous methanolic half-life is 15.36h and for aqueous isopropanolic system half-life value is 17.20h]. Thus aqueous acetonitrile was taken as the solvent system for the rest of the experiment. Data regarding the photocatalytic degradation of zoxamide using bulk TiO2[50mg/L] in aqueous acetonitrile solution under UV irradiation at different pH[pH 9, pH 7, and pH 3] shows that the half-life value of zoxamide[120mg/L] at pH 9 is 3.25h, lowest compared to the two other[ half-life at pH 7 is 3.30h and at pH 3 is 3.36]( Supplementary
Fig. 6).so the rest of the experiment done at pH 9. To understand the effect of bulk titanium dioxide as photocatalysts on photo-degradation of zoxamide, it was mixed (50mg/L) with one liter of aqueous acetonitrile solution which contains 120mg of zoxamide and follows a similar procedure for UV irradiation of the sample. Samples were collected at intervals of 0, 1, 2, 3, 6, 9, 12, 15h from the irradiated solution for determination of degradation pattern of zoxamide in the presence of bulk TiO2. A similar procedure was carried out separately for the rate determination and the kinetic study of photodegradation of zoxamide in aqueous acetonitrile solution using synthesized nano titanium dioxide(50mg/L) with the different initial concentration of zoxamide [sample no.Z1(110mg/L), Z2(105mg/L), Z3(165mg/L), and Z4(210mg/L)]. Samples were collected at intervals of 0, 1, 2, 3,4, 6, 8,10h from the irradiated solution for all the samples containing different concentrations of zoxamide.
Sample Preparation To prepare the final sample, 1 ml of experimental
solution was taken in a 50 ml centrifuge tube. Then, 10 ml of ethyl acetate was added to it. It was vortexed for 5 minutes. Next, the sample was centrifuged at 10000 rpm for 10 min. Then from centrifuged solution 5 ml supernatant solution taken and evaporate to dryness with the help of a turbo vapor nitrogen evaporator. Finally, volume was reconstituted with 5 ml acetonitrile. It was then filtered through a 0.2μ membrane filter. The acetonitrile fraction is the sample ready for analysis in the HPLC instrument for zoxamide residues.
Instrumental ParameterChromatographic condition
JASCO HPLC combined with variable wavelength with Photo-diode array-Jasco MD-2010 plus-multi-wavelength detector (detector wavelength for zoxamide i.e λmax212 nm) and Chrompass software. The Pump used was of JascoPU – 2080 plus- intelligent HPLC pump. Solvent mixing was Module: Jasco MX-2080-31and Jasco AS-2050 Plus-intelligent sampler (Jasco LC –Net II/ADC). Peerless Basic C18 column with 250 mm × 4.6 mm × 5µm configuration was used. The mobile phase composition for zoxamide solution was acetonitrile/water (7:3 v/v). Flow Rate was 0.3 ml/min. Retention time observed for the zoxamide standard was 7.0 ± 0.1 min. Limit Of Detection
194
P. Purkait et al. / Green Synthesis of TiO2 Nanoparticle
J. Water Environ. Nanotechnol., 5(3): 191-203 Summer 2020
(LOD) was 0.02 µg/ml and Limit Of Quantification was (LOQ) 0.05 µg/ml.
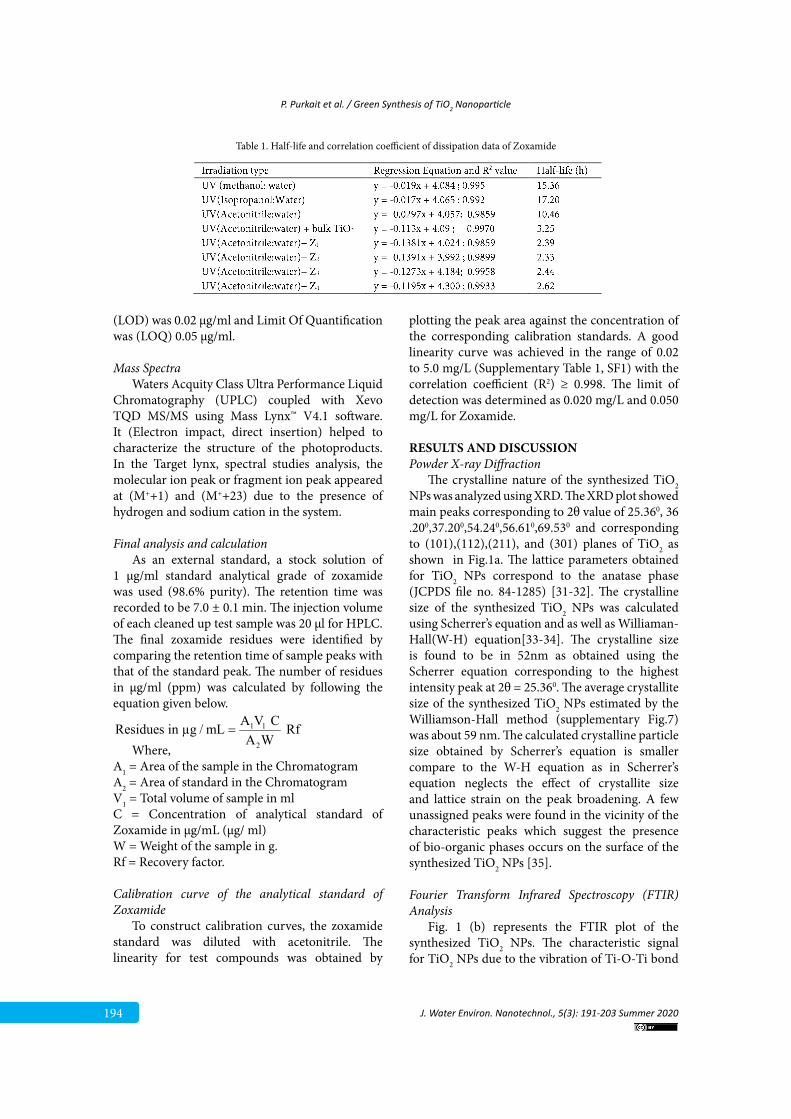
Mass SpectraWaters Acquity Class Ultra Performance Liquid
Chromatography (UPLC) coupled with Xevo TQD MS/MS using Mass Lynx™ V4.1 software. It (Electron impact, direct insertion) helped to characterize the structure of the photoproducts. In the Target lynx, spectral studies analysis, the molecular ion peak or fragment ion peak appeared at (M++1) and (M++23) due to the presence of hydrogen and sodium cation in the system.
Final analysis and calculationAs an external standard, a stock solution of
1 µg/ml standard analytical grade of zoxamide was used (98.6% purity). The retention time was recorded to be 7.0 ± 0.1 min. The injection volume of each cleaned up test sample was 20 µl for HPLC. The final zoxamide residues were identified by comparing the retention time of sample peaks with that of the standard peak. The number of residues in µg/ml (ppm) was calculated by following the equation given below.
1 1
2
A V CResidues in µg / mL RfA W
=Where,
A1 = Area of the sample in the ChromatogramA2 = Area of standard in the ChromatogramV1 = Total volume of sample in mlC = Concentration of analytical standard of Zoxamide in µg/mL (µg/ ml)W = Weight of the sample in g.Rf = Recovery factor.
Calibration curve of the analytical standard of Zoxamide
To construct calibration curves, the zoxamide standard was diluted with acetonitrile. The linearity for test compounds was obtained by
plotting the peak area against the concentration of the corresponding calibration standards. A good linearity curve was achieved in the range of 0.02 to 5.0 mg/L (Supplementary Table 1, SF1) with the correlation coefficient (R2) ≥ 0.998. The limit of detection was determined as 0.020 mg/L and 0.050 mg/L for Zoxamide.
RESULTS AND DISCUSSIONPowder X-ray Diffraction
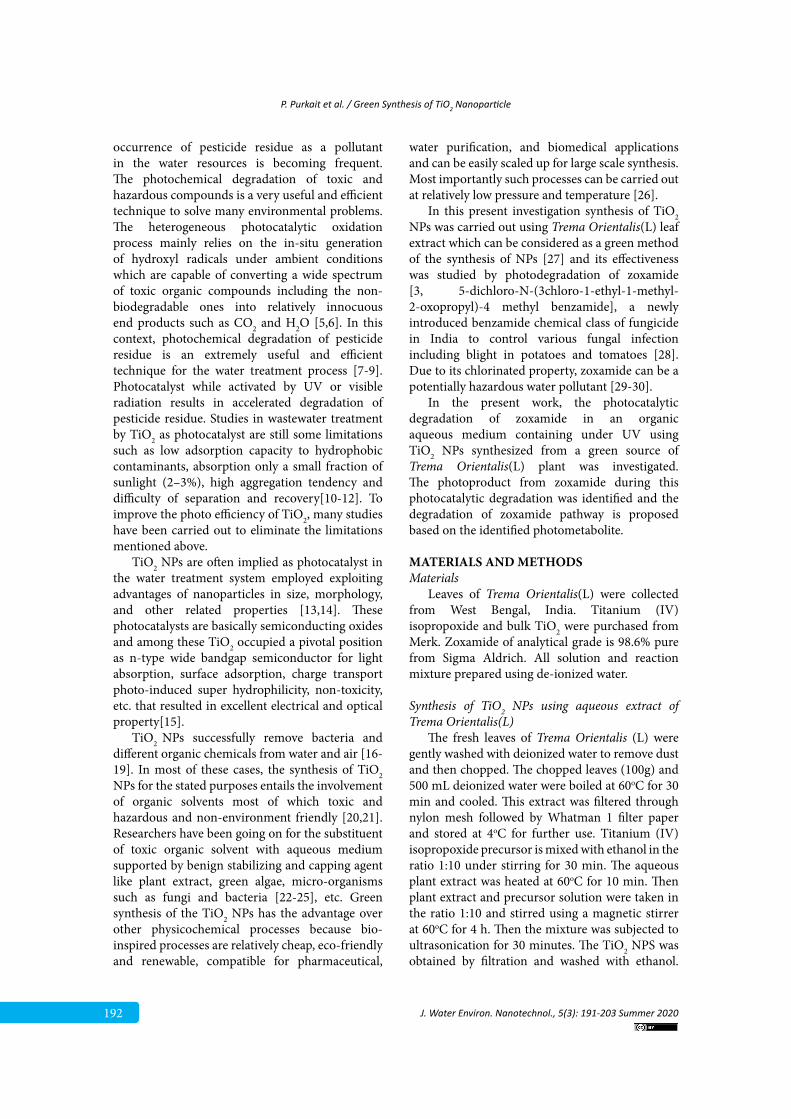
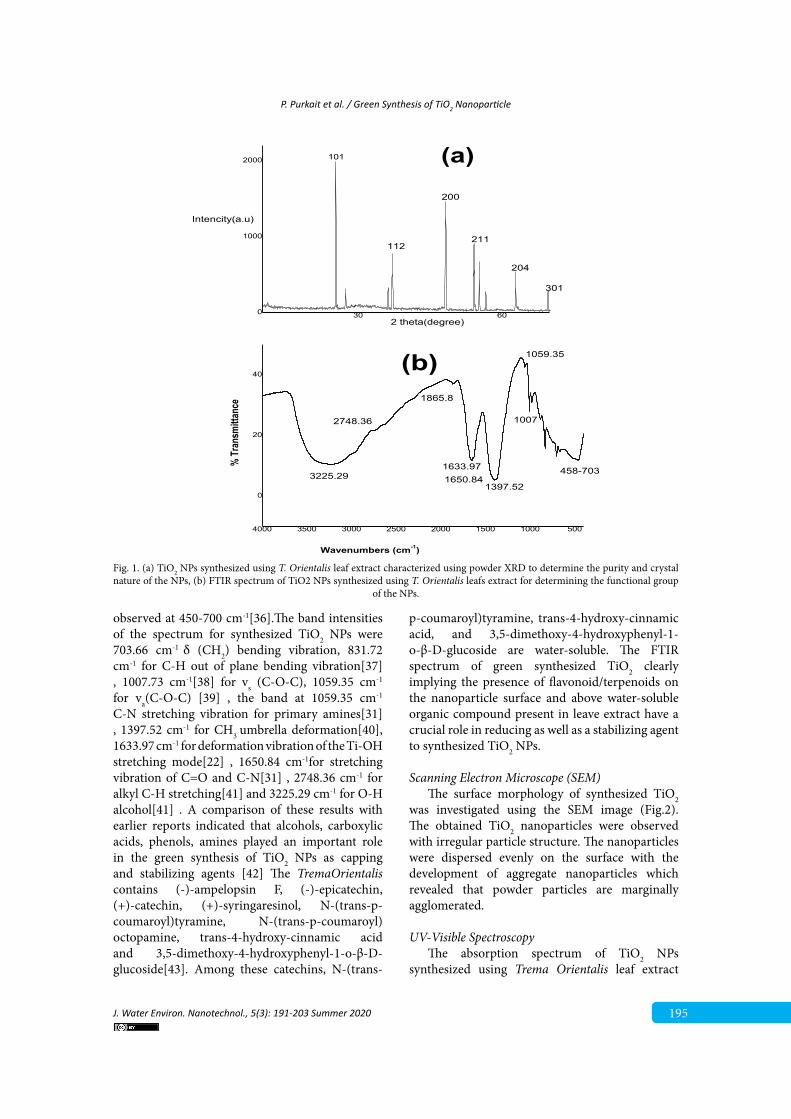
The crystalline nature of the synthesized TiO2 NPs was analyzed using XRD. The XRD plot showed main peaks corresponding to 2θ value of 25.360, 36.200,37.200,54.240,56.610,69.530 and corresponding to (101),(112),(211), and (301) planes of TiO2 as shown in Fig.1a. The lattice parameters obtained for TiO2 NPs correspond to the anatase phase (JCPDS file no. 84-1285) [31-32]. The crystalline size of the synthesized TiO2 NPs was calculated using Scherrer’s equation and as well as Williaman-Hall(W-H) equation[33-34]. The crystalline size is found to be in 52nm as obtained using the Scherrer equation corresponding to the highest intensity peak at 2θ = 25.360. The average crystallite size of the synthesized TiO2 NPs estimated by the Williamson-Hall method (supplementary Fig.7) was about 59 nm. The calculated crystalline particle size obtained by Scherrer’s equation is smaller compare to the W-H equation as in Scherrer’s equation neglects the effect of crystallite size and lattice strain on the peak broadening. A few unassigned peaks were found in the vicinity of the characteristic peaks which suggest the presence of bio-organic phases occurs on the surface of the synthesized TiO2 NPs [35].
Fourier Transform Infrared Spectroscopy (FTIR) Analysis
Fig. 1 (b) represents the FTIR plot of the synthesized TiO2 NPs. The characteristic signal for TiO2 NPs due to the vibration of Ti-O-Ti bond
1
Table 1. Half-life and correlation coefficient of dissipation data of Zoxamide
P. Purkait et al. / Green Synthesis of TiO2 Nanoparticle
J. Water Environ. Nanotechnol., 5(3): 191-203 Summer 2020 195
observed at 450-700 cm-1[36].The band intensities of the spectrum for synthesized TiO2 NPs were 703.66 cm-1 δ (CH2) bending vibration, 831.72 cm-1 for C-H out of plane bending vibration[37] , 1007.73 cm-1[38] for vs (C-O-C), 1059.35 cm-1 for va(C-O-C) [39] , the band at 1059.35 cm-1 C-N stretching vibration for primary amines[31] , 1397.52 cm-1 for CH3 umbrella deformation[40], 1633.97 cm-1 for deformation vibration of the Ti-OH stretching mode[22] , 1650.84 cm-1for stretching vibration of C=O and C-N[31] , 2748.36 cm-1 for alkyl C-H stretching[41] and 3225.29 cm-1 for O-H alcohol[41] . A comparison of these results with earlier reports indicated that alcohols, carboxylic acids, phenols, amines played an important role in the green synthesis of TiO2 NPs as capping and stabilizing agents [42] The TremaOrientalis contains (-)-ampelopsin F, (-)-epicatechin, (+)-catechin, (+)-syringaresinol, N-(trans-p-coumaroyl)tyramine, N-(trans-p-coumaroyl) octopamine, trans-4-hydroxy-cinnamic acid and 3,5-dimethoxy-4-hydroxyphenyl-1-o-β-D-glucoside[43]. Among these catechins, N-(trans-
p-coumaroyl)tyramine, trans-4-hydroxy-cinnamic acid, and 3,5-dimethoxy-4-hydroxyphenyl-1-o-β-D-glucoside are water-soluble. The FTIR spectrum of green synthesized TiO2 clearly implying the presence of flavonoid/terpenoids on the nanoparticle surface and above water-soluble organic compound present in leave extract have a crucial role in reducing as well as a stabilizing agent to synthesized TiO2 NPs.
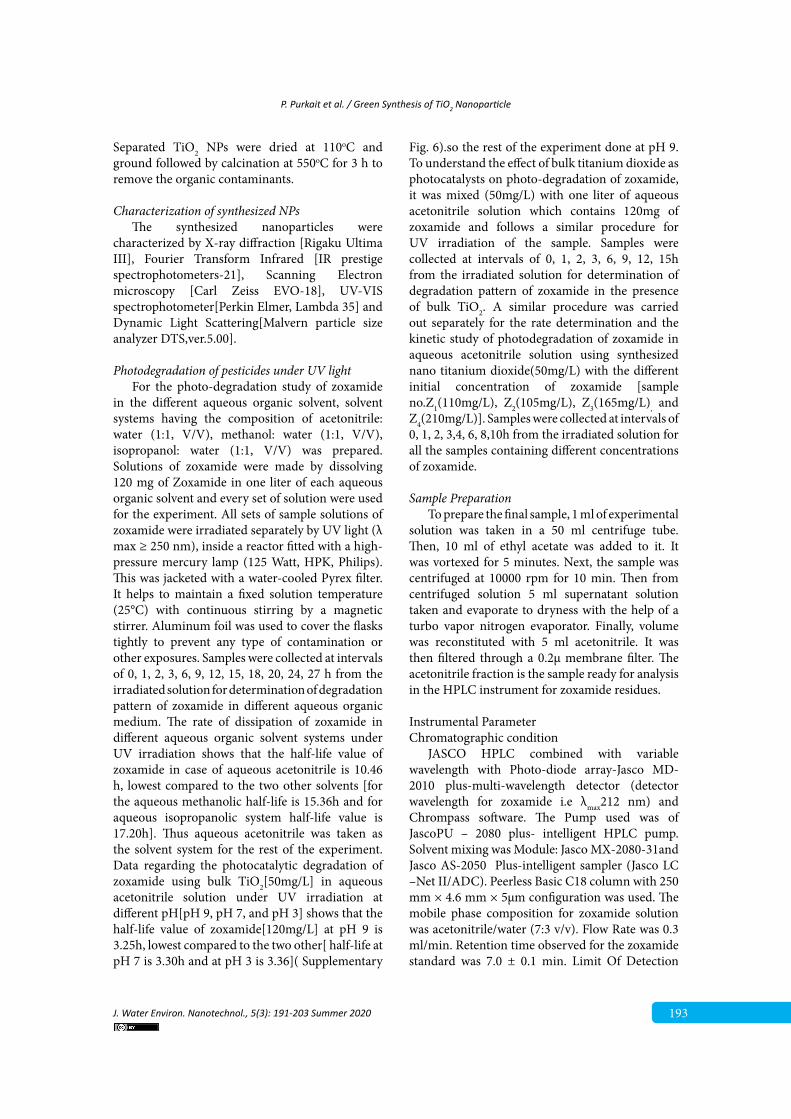
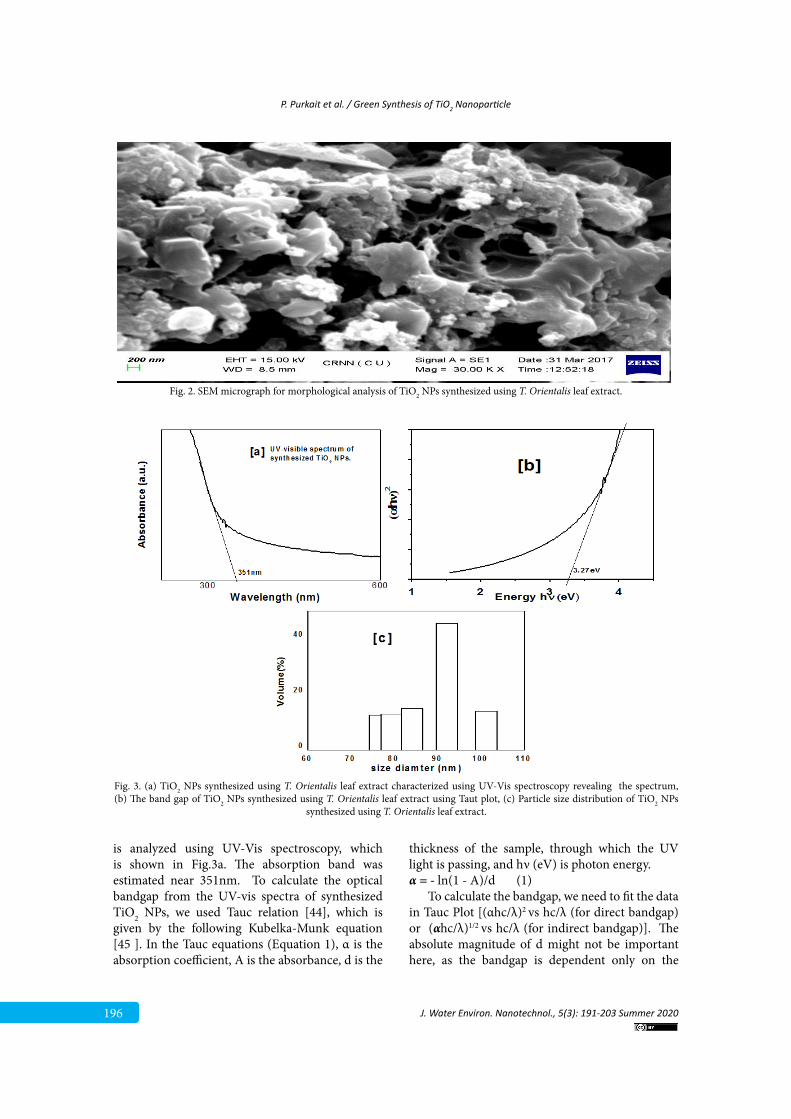
Scanning Electron Microscope (SEM)The surface morphology of synthesized TiO2
was investigated using the SEM image (Fig.2). The obtained TiO2 nanoparticles were observed with irregular particle structure. The nanoparticles were dispersed evenly on the surface with the development of aggregate nanoparticles which revealed that powder particles are marginally agglomerated.
UV-Visible Spectroscopy
The absorption spectrum of TiO2 NPs synthesized using Trema Orientalis leaf extract
1
30 600
1000
2000
2 theta(degree)
Intencity(a.u)
(a)101
112211
200
204
301
4000 3500 3000 2500 2000 1500 1000 500
0
20
40
Wavenumbers (cm-1)
(b)
458-7033225.29
2748.36 1007
1059.35
1397.52
1633.971650.84
1865.8
% Tr
ansm
ittan
ce
1
30 600
1000
2000
2 theta(degree)
Intencity(a.u)
(a)101
112211
200
204
301
4000 3500 3000 2500 2000 1500 1000 500
0
20
40
Wavenumbers (cm-1)
(b)
458-7033225.29
2748.36 1007
1059.35
1397.52
1633.971650.84
1865.8
% Tr
ansm
ittan
ce
Fig. 1. (a) TiO2 NPs synthesized using T. Orientalis leaf extract characterized using powder XRD to determine the purity and crystal nature of the NPs, (b) FTIR spectrum of TiO2 NPs synthesized using T. Orientalis leafs extract for determining the functional group
of the NPs.
196
P. Purkait et al. / Green Synthesis of TiO2 Nanoparticle
J. Water Environ. Nanotechnol., 5(3): 191-203 Summer 2020
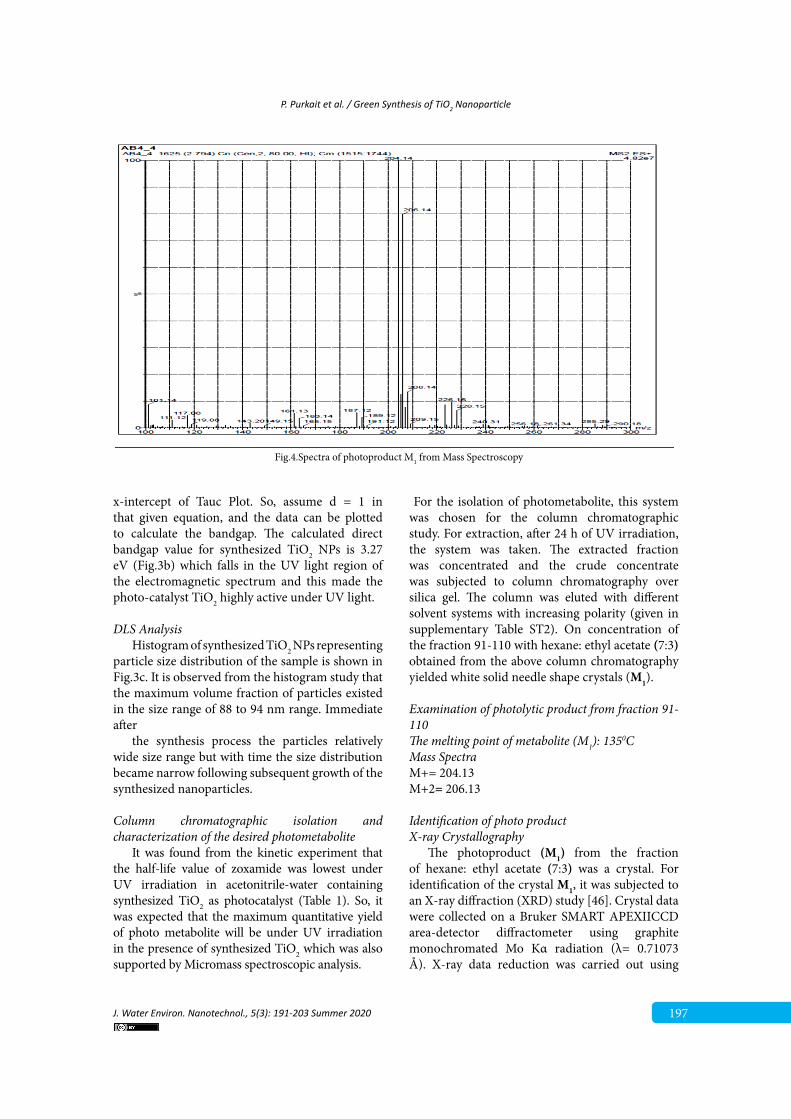
is analyzed using UV-Vis spectroscopy, which is shown in Fig.3a. The absorption band was estimated near 351nm. To calculate the optical bandgap from the UV-vis spectra of synthesized TiO2 NPs, we used Tauc relation [44], which is given by the following Kubelka-Munk equation [45 ]. In the Tauc equations (Equation 1), α is the absorption coefficient, A is the absorbance, d is the
thickness of the sample, through which the UV light is passing, and hν (eV) is photon energy.α = - ln(1 - A)/d (1)
To calculate the bandgap, we need to fit the data in Tauc Plot [(αhc/λ)2 vs hc/λ (for direct bandgap) or (αhc/λ)1/2 vs hc/λ (for indirect bandgap)]. The absolute magnitude of d might not be important here, as the bandgap is dependent only on the
2
Fig. 2. SEM micrograph for morphological analysis of TiO2 NPs synthesized using T. Orientalis leaf extract.
3
Fig. 3. (a) TiO2 NPs synthesized using T. Orientalis leaf extract characterized using UV-Vis spectroscopy revealing the spectrum, (b) The band gap of TiO2 NPs synthesized using T. Orientalis leaf extract using Taut plot, (c) Particle size distribution of TiO2 NPs
synthesized using T. Orientalis leaf extract.
P. Purkait et al. / Green Synthesis of TiO2 Nanoparticle
J. Water Environ. Nanotechnol., 5(3): 191-203 Summer 2020 197
x-intercept of Tauc Plot. So, assume d = 1 in that given equation, and the data can be plotted to calculate the bandgap. The calculated direct bandgap value for synthesized TiO2 NPs is 3.27 eV (Fig.3b) which falls in the UV light region of the electromagnetic spectrum and this made the photo-catalyst TiO2 highly active under UV light.
DLS Analysis Histogram of synthesized TiO2 NPs representing
particle size distribution of the sample is shown in Fig.3c. It is observed from the histogram study that the maximum volume fraction of particles existed in the size range of 88 to 94 nm range. Immediate after
the synthesis process the particles relatively wide size range but with time the size distribution became narrow following subsequent growth of the synthesized nanoparticles.
Column chromatographic isolation and characterization of the desired photometabolite
It was found from the kinetic experiment that the half-life value of zoxamide was lowest under UV irradiation in acetonitrile-water containing synthesized TiO2 as photocatalyst (Table 1). So, it was expected that the maximum quantitative yield of photo metabolite will be under UV irradiation in the presence of synthesized TiO2 which was also supported by Micromass spectroscopic analysis.
For the isolation of photometabolite, this system was chosen for the column chromatographic study. For extraction, after 24 h of UV irradiation, the system was taken. The extracted fraction was concentrated and the crude concentrate was subjected to column chromatography over silica gel. The column was eluted with different solvent systems with increasing polarity (given in supplementary Table ST2). On concentration of the fraction 91-110 with hexane: ethyl acetate (7:3) obtained from the above column chromatography yielded white solid needle shape crystals (M1).
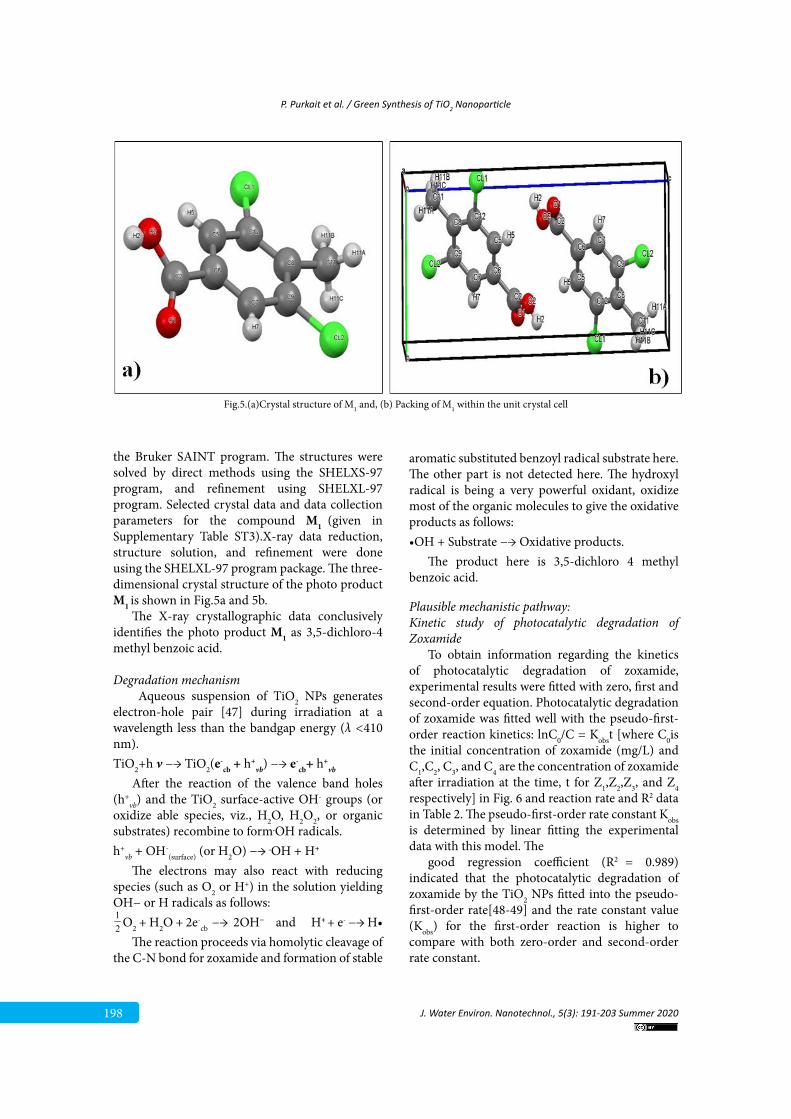
Examination of photolytic product from fraction 91-110 The melting point of metabolite (M1): 1350CMass SpectraM+= 204.13M+2= 206.13
Identification of photo productX-ray Crystallography
The photoproduct (M1) from the fraction of hexane: ethyl acetate (7:3) was a crystal. For identification of the crystal M1, it was subjected to an X-ray diffraction (XRD) study [46]. Crystal data were collected on a Bruker SMART APEXIICCD area-detector diffractometer using graphite monochromated Mo Kα radiation (λ= 0.71073 Å). X-ray data reduction was carried out using
4
Fig.4.Spectra of photoproduct M1 from Mass Spectroscopy
198
P. Purkait et al. / Green Synthesis of TiO2 Nanoparticle
J. Water Environ. Nanotechnol., 5(3): 191-203 Summer 2020
the Bruker SAINT program. The structures were solved by direct methods using the SHELXS-97 program, and refinement using SHELXL-97 program. Selected crystal data and data collection parameters for the compound M1 (given in Supplementary Table ST3).X-ray data reduction, structure solution, and refinement were done using the SHELXL-97 program package. The three-dimensional crystal structure of the photo product M1 is shown in Fig.5a and 5b.
The X-ray crystallographic data conclusively identifies the photo product M1 as 3,5-dichloro-4 methyl benzoic acid.
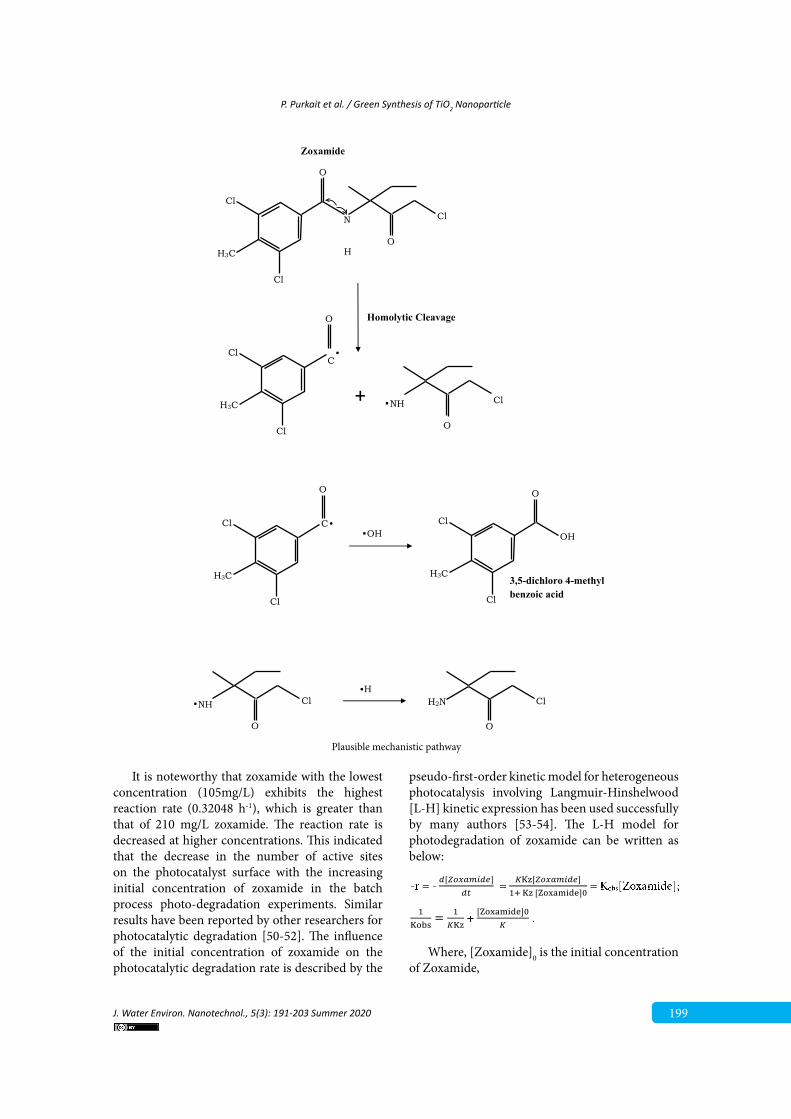
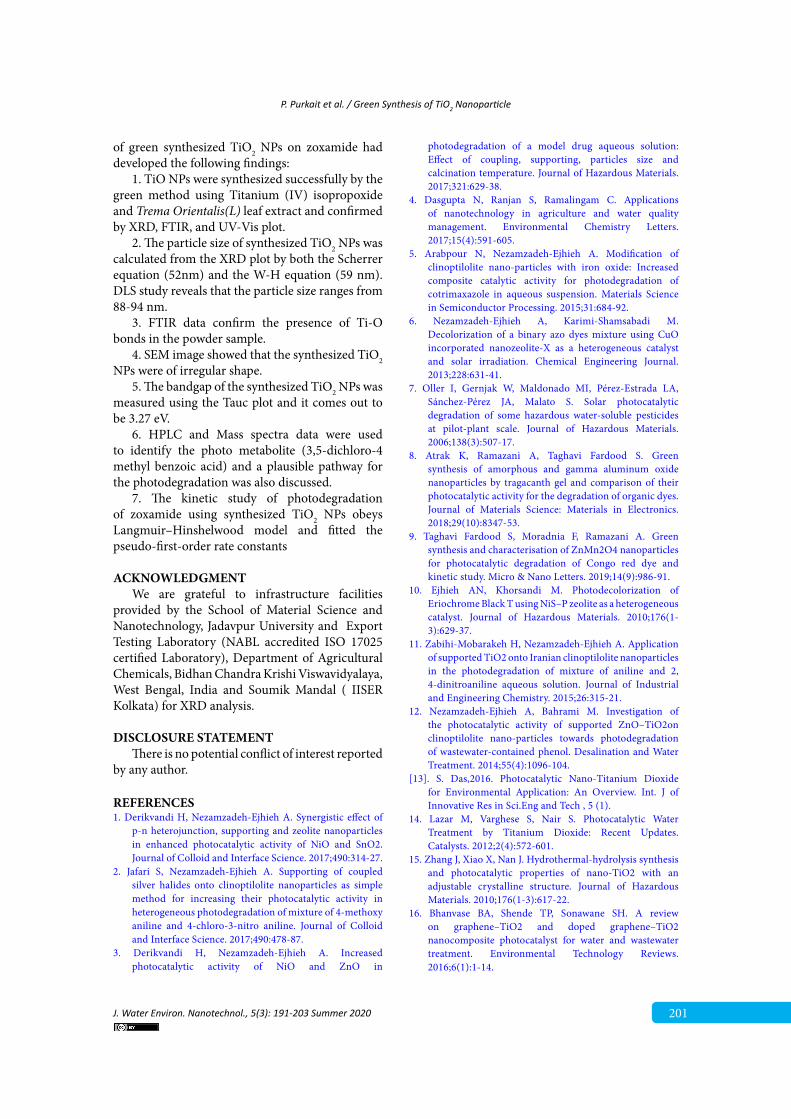
Degradation mechanism Aqueous suspension of TiO2 NPs generates
electron-hole pair [47] during irradiation at a wavelength less than the bandgap energy (λ <410 nm). TiO2+h ν −→ TiO2(e-
cb + h+νb) −→ e-
cb+ h+νb
After the reaction of the valence band holes (h+
νb) and the TiO2 surface-active OH- groups (or oxidize able species, viz., H2O, H2O2, or organic substrates) recombine to form.OH radicals. h+
νb + OH-(surface) (or H2O) −→ .OH + H+
The electrons may also react with reducing species (such as O2 or H+) in the solution yielding OH− or H radicals as follows:12 O2 + H2O + 2e-
cb −→ 2OH− and H+ + e- −→ H•The reaction proceeds via homolytic cleavage of
the C-N bond for zoxamide and formation of stable
aromatic substituted benzoyl radical substrate here. The other part is not detected here. The hydroxyl radical is being a very powerful oxidant, oxidize most of the organic molecules to give the oxidative products as follows:•OH + Substrate −→ Oxidative products.
The product here is 3,5-dichloro 4 methyl benzoic acid.
Plausible mechanistic pathway:Kinetic study of photocatalytic degradation of Zoxamide
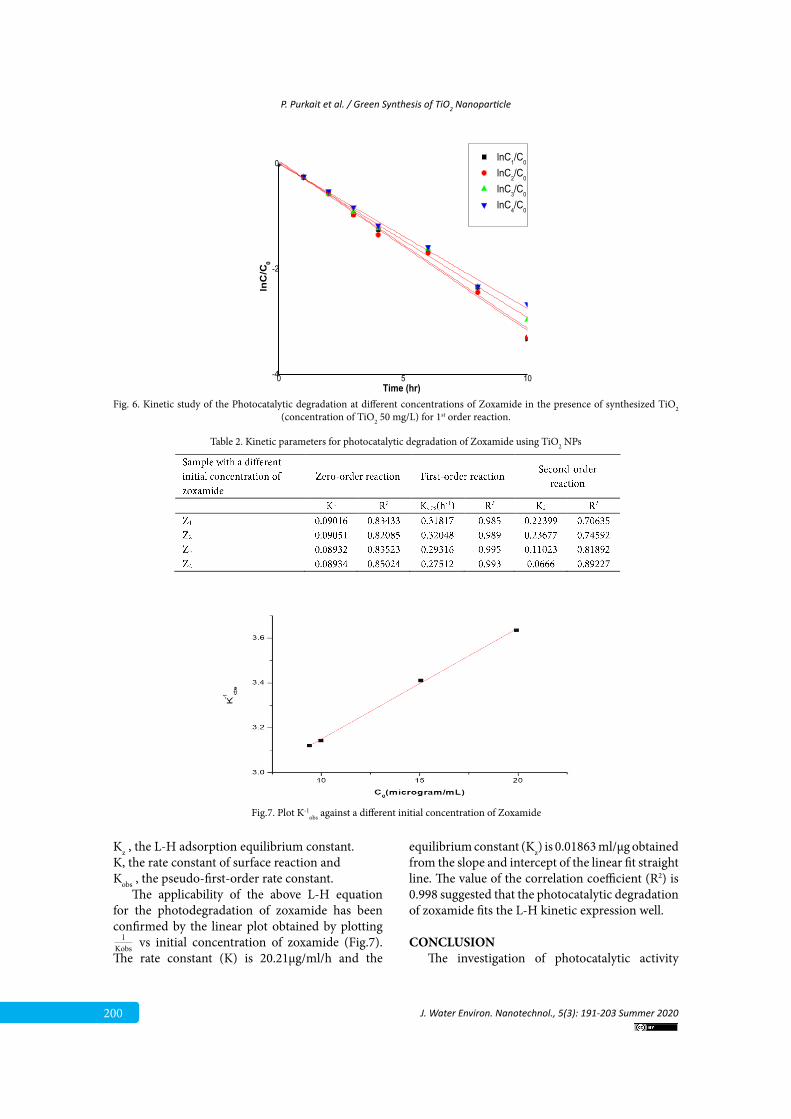
To obtain information regarding the kinetics of photocatalytic degradation of zoxamide, experimental results were fitted with zero, first and second-order equation. Photocatalytic degradation of zoxamide was fitted well with the pseudo-first-order reaction kinetics: lnC0/C = Kobst [where C0is the initial concentration of zoxamide (mg/L) and C1,C2, C3, and C4 are the concentration of zoxamide after irradiation at the time, t for Z1,Z2,Z3, and Z4 respectively] in Fig. 6 and reaction rate and R2 data in Table 2. The pseudo-first-order rate constant Kobs is determined by linear fitting the experimental data with this model. The
good regression coefficient (R2 = 0.989) indicated that the photocatalytic degradation of zoxamide by the TiO2 NPs fitted into the pseudo-first-order rate[48-49] and the rate constant value (Kobs) for the first-order reaction is higher to compare with both zero-order and second-order rate constant.
5
Fig.5.(a)Crystal structure of M1 and, (b) Packing of M1 within the unit crystal cell
P. Purkait et al. / Green Synthesis of TiO2 Nanoparticle
J. Water Environ. Nanotechnol., 5(3): 191-203 Summer 2020 199
1
.
.
. .
O
OH .
O
Cl
Cl
H3C
.
O
Cl
Cl
H3C
C
NH Cl
O
H
N Cl
O
O
Cl
Cl
H3C
+
Homolytic Cleavage
C OH
O
Cl
Cl
H3C 3,5-dichloro 4-methyl benzoic acid
Zoxamide
NH Cl H
O
H2N Cl
It is noteworthy that zoxamide with the lowest concentration (105mg/L) exhibits the highest reaction rate (0.32048 h-1), which is greater than that of 210 mg/L zoxamide. The reaction rate is decreased at higher concentrations. This indicated that the decrease in the number of active sites on the photocatalyst surface with the increasing initial concentration of zoxamide in the batch process photo-degradation experiments. Similar results have been reported by other researchers for photocatalytic degradation [50-52]. The influence of the initial concentration of zoxamide on the photocatalytic degradation rate is described by the
pseudo-first-order kinetic model for heterogeneous photocatalysis involving Langmuir-Hinshelwood [L-H] kinetic expression has been used successfully by many authors [53-54]. The L-H model for photodegradation of zoxamide can be written as below:
13
3.8.Kinetic study of photocatalytic degradation of Zoxamide:
To obtain information regarding the kinetics of photocatalytic degradation of zoxamide,
experimental results were fitted with zero, first and second-order equation. Photocatalytic
degradation of zoxamide was fitted well with the pseudo-first-order reaction kinetics: lnC0/C
= Kobst [where C0is the initial concentration of zoxamide (mg/L) and C1,C2, C3, and C4 are the
concentration of zoxamide after irradiation at the time, t for Z1,Z2,Z3, and Z4 respectively] in
fig.6 and reaction rate and R2 data in Table 2. The pseudo-first-order rate constant Kobs is
determined by linear fitting the experimental data with this model. The
good regression coefficient (R2 = 0.989) indicated that the photocatalytic degradation of
zoxamide by the TiO2 NPs fitted into the pseudo-first-order rate[48-49] and the rate constant
value (Kobs) for the first-order reaction is higher to compare with both zero-order and second-
order rate constant.
It is noteworthy that zoxamide with the lowest concentration (105mg/L) exhibits the highest
reaction rate (0.32048 h-1), which is greater than that of 210 mg/L zoxamide. The reaction
rate is decreased at higher concentrations. This indicated that the decrease in the number of
active sites on the photocatalyst surface with the increasing initial concentration of zoxamide
in the batch process photo-degradation experiments. Similar results have been reported by
other researchers for photocatalytic degradation [50-52]. The influence of the initial
concentration of zoxamide on the photocatalytic degradation rate is described by the pseudo-
first-order kinetic model for heterogeneous photocatalysis involving Langmuir-Hinshelwood
[L-H] kinetic expression has been used successfully by many authors [53-54]. The L-H
model for photodegradation of zoxamide can be written as below:
𝑑𝑑[𝑍𝑍𝑍𝑍𝑍𝑍𝑍𝑍𝑍𝑍𝑍𝑍𝑑𝑑𝑍𝑍]𝑑𝑑𝑑𝑑
𝐾𝐾Kz[𝑍𝑍𝑍𝑍𝑍𝑍𝑍𝑍𝑍𝑍𝑍𝑍𝑑𝑑𝑍𝑍]1+ Kz [Zoxamide]0
1Kobs = 1
𝐾𝐾Kz[Zoxamide]0
𝐾𝐾
Where, [Zoxamide]0 is the initial concentration of Zoxamide,
Kz , the L-H adsorption equilibrium constant.
K, the rate constant of surface reaction and
Kobs , the pseudo-first-order rate constant.
Where, [Zoxamide]0 is the initial concentration of Zoxamide,
Plausible mechanistic pathway
200
P. Purkait et al. / Green Synthesis of TiO2 Nanoparticle
J. Water Environ. Nanotechnol., 5(3): 191-203 Summer 2020
6
0 5 10-4
-2
0
lnC
/C0
Time (hr)
lnC1/C0
lnC2/C0
lnC3/C0
lnC4/C0
2
Table 2. Kinetic parameters for photocatalytic degradation of Zoxamide using TiO2 NPs
Fig. 6. Kinetic study of the Photocatalytic degradation at different concentrations of Zoxamide in the presence of synthesized TiO2 (concentration of TiO2 50 mg/L) for 1st order reaction.
Kz , the L-H adsorption equilibrium constant.K, the rate constant of surface reaction andKobs , the pseudo-first-order rate constant.
The applicability of the above L-H equation for the photodegradation of zoxamide has been confirmed by the linear plot obtained by plotting
1Kobs vs initial concentration of zoxamide (Fig.7). The rate constant (K) is 20.21µg/ml/h and the
equilibrium constant (Kz) is 0.01863 ml/µg obtained from the slope and intercept of the linear fit straight line. The value of the correlation coefficient (R2) is 0.998 suggested that the photocatalytic degradation of zoxamide fits the L-H kinetic expression well.
CONCLUSIONThe investigation of photocatalytic activity
7
Fig.7. Plot K-1
obs against a different initial concentration of Zoxamide
P. Purkait et al. / Green Synthesis of TiO2 Nanoparticle
J. Water Environ. Nanotechnol., 5(3): 191-203 Summer 2020 201
of green synthesized TiO2 NPs on zoxamide had developed the following findings:
1. TiO NPs were synthesized successfully by the green method using Titanium (IV) isopropoxide and Trema Orientalis(L) leaf extract and confirmed by XRD, FTIR, and UV-Vis plot.
2. The particle size of synthesized TiO2 NPs was calculated from the XRD plot by both the Scherrer equation (52nm) and the W-H equation (59 nm).DLS study reveals that the particle size ranges from 88-94 nm.
3. FTIR data confirm the presence of Ti-O bonds in the powder sample.
4. SEM image showed that the synthesized TiO2 NPs were of irregular shape.
5. The bandgap of the synthesized TiO2 NPs was measured using the Tauc plot and it comes out to be 3.27 eV.
6. HPLC and Mass spectra data were used to identify the photo metabolite (3,5-dichloro-4 methyl benzoic acid) and a plausible pathway for the photodegradation was also discussed.
7. The kinetic study of photodegradation of zoxamide using synthesized TiO2 NPs obeys Langmuir–Hinshelwood model and fitted the pseudo-first-order rate constants
ACKNOWLEDGMENTWe are grateful to infrastructure facilities
provided by the School of Material Science and Nanotechnology, Jadavpur University and Export Testing Laboratory (NABL accredited ISO 17025 certified Laboratory), Department of Agricultural Chemicals, Bidhan Chandra Krishi Viswavidyalaya, West Bengal, India and Soumik Mandal ( IISER Kolkata) for XRD analysis.
DISCLOSURE STATEMENTThere is no potential conflict of interest reported
by any author.
REFERENCES1. Derikvandi H, Nezamzadeh-Ejhieh A. Synergistic effect of
p-n heterojunction, supporting and zeolite nanoparticles in enhanced photocatalytic activity of NiO and SnO2. Journal of Colloid and Interface Science. 2017;490:314-27.
2. Jafari S, Nezamzadeh-Ejhieh A. Supporting of coupled silver halides onto clinoptilolite nanoparticles as simple method for increasing their photocatalytic activity in heterogeneous photodegradation of mixture of 4-methoxy aniline and 4-chloro-3-nitro aniline. Journal of Colloid and Interface Science. 2017;490:478-87.
3. Derikvandi H, Nezamzadeh-Ejhieh A. Increased photocatalytic activity of NiO and ZnO in
photodegradation of a model drug aqueous solution: Effect of coupling, supporting, particles size and calcination temperature. Journal of Hazardous Materials. 2017;321:629-38.
4. Dasgupta N, Ranjan S, Ramalingam C. Applications of nanotechnology in agriculture and water quality management. Environmental Chemistry Letters. 2017;15(4):591-605.
5. Arabpour N, Nezamzadeh-Ejhieh A. Modification of clinoptilolite nano-particles with iron oxide: Increased composite catalytic activity for photodegradation of cotrimaxazole in aqueous suspension. Materials Science in Semiconductor Processing. 2015;31:684-92.
6. Nezamzadeh-Ejhieh A, Karimi-Shamsabadi M. Decolorization of a binary azo dyes mixture using CuO incorporated nanozeolite-X as a heterogeneous catalyst and solar irradiation. Chemical Engineering Journal. 2013;228:631-41.
7. Oller I, Gernjak W, Maldonado MI, Pérez-Estrada LA, Sánchez-Pérez JA, Malato S. Solar photocatalytic degradation of some hazardous water-soluble pesticides at pilot-plant scale. Journal of Hazardous Materials. 2006;138(3):507-17.
8. Atrak K, Ramazani A, Taghavi Fardood S. Green synthesis of amorphous and gamma aluminum oxide nanoparticles by tragacanth gel and comparison of their photocatalytic activity for the degradation of organic dyes. Journal of Materials Science: Materials in Electronics. 2018;29(10):8347-53.
9. Taghavi Fardood S, Moradnia F, Ramazani A. Green synthesis and characterisation of ZnMn2O4 nanoparticles for photocatalytic degradation of Congo red dye and kinetic study. Micro & Nano Letters. 2019;14(9):986-91.
10. Ejhieh AN, Khorsandi M. Photodecolorization of Eriochrome Black T using NiS–P zeolite as a heterogeneous catalyst. Journal of Hazardous Materials. 2010;176(1-3):629-37.
11. Zabihi-Mobarakeh H, Nezamzadeh-Ejhieh A. Application of supported TiO2 onto Iranian clinoptilolite nanoparticles in the photodegradation of mixture of aniline and 2, 4-dinitroaniline aqueous solution. Journal of Industrial and Engineering Chemistry. 2015;26:315-21.
12. Nezamzadeh-Ejhieh A, Bahrami M. Investigation of the photocatalytic activity of supported ZnO–TiO2on clinoptilolite nano-particles towards photodegradation of wastewater-contained phenol. Desalination and Water Treatment. 2014;55(4):1096-104.
[13]. S. Das,2016. Photocatalytic Nano-Titanium Dioxide for Environmental Application: An Overview. Int. J of Innovative Res in Sci.Eng and Tech , 5 (1).
14. Lazar M, Varghese S, Nair S. Photocatalytic Water Treatment by Titanium Dioxide: Recent Updates. Catalysts. 2012;2(4):572-601.
15. Zhang J, Xiao X, Nan J. Hydrothermal-hydrolysis synthesis and photocatalytic properties of nano-TiO2 with an adjustable crystalline structure. Journal of Hazardous Materials. 2010;176(1-3):617-22.
16. Bhanvase BA, Shende TP, Sonawane SH. A review on graphene–TiO2 and doped graphene–TiO2 nanocomposite photocatalyst for water and wastewater treatment. Environmental Technology Reviews. 2016;6(1):1-14.
202
P. Purkait et al. / Green Synthesis of TiO2 Nanoparticle
J. Water Environ. Nanotechnol., 5(3): 191-203 Summer 2020
17. Prairie MR, Evans LR, Stange BM, Martinez SL. An investigation of titanium dioxide photocatalysis for the treatment of water contaminated with metals and organic chemicals. Environmental Science & Technology. 1993;27(9):1776-82.
18. Thomas J, Kumar KP, Chitra KR. Synthesis of Ag Doped Nano TiO2 as Efficient Solar Photocatalyst for the Degradation of Endosulfan. Advanced Science Letters. 2011;4(1):108-14.
19. Guan X, Du J, Meng X, Sun Y, Sun B, Hu Q. Application of titanium dioxide in arsenic removal from water: A review. Journal of Hazardous Materials. 2012;215-216:1-16.
20. Hügül M, Erçağ E, Apak R. KINETIC STUDIES ON UV-PHOTODEGRADATION OF SOME CHLOROPHENOLS USING TIO2CATALYST. Journal of Environmental Science and Health, Part A. 2002;37(3):365-83.
21. Šojić DV, Anderluh VB, Orčić DZ, Abramović BF. Photodegradation of clopyralid in TiO2 suspensions: Identification of intermediates and reaction pathways. Journal of Hazardous Materials. 2009;168(1):94-101.
22. Rajakumar G, Rahuman AA, Jayaseelan C, Santhoshkumar T, Marimuthu S, Kamaraj C, et al. Solanum trilobatum extract-mediated synthesis of titanium dioxide nanoparticles to control Pediculus humanus capitis, Hyalomma anatolicum anatolicum and Anopheles subpictus. Parasitology Research. 2013;113(2):469-79.
23. Taghavi Fardood S, Ramazani A, Joo SW. Green Chemistry Approach for the Synthesis of Copper Oxide Nanoparticles Using Tragacanth Gel and Their Structural Characterization. Journal of Structural Chemistry. 2018;59(2):482-6.
24. Srinivasan M, Venkatesan M, Arumugam V, Natesan G, Saravanan N, Murugesan S, et al. Green synthesis and characterization of titanium dioxide nanoparticles (TiO2 NPs) using Sesbania grandiflora and evaluation of toxicity in zebrafish embryos. Process Biochemistry. 2019;80:197-202.
25. Subhapriya S, Gomathipriya P. Green synthesis of titanium dioxide (TiO2) nanoparticles by Trigonella foenum-graecum extract and its antimicrobial properties. Microbial Pathogenesis. 2018;116:215-20.
26. Zhou H, Fan T, Zhang D. Biotemplated Materials for Sustainable Energy and Environment: Current Status and Challenges. ChemSusChem. 2011;4(10):1344-87.
[27]. S.P. Goutam, G. Saxena, V. Singh, A.K. Yadav,R.N. Bharagava and K.B. Thapa,2018. Green synthesis of TiO2 nanoparticles using leaf extract of Jatropha curcas L.Chem. Eng. 336:386-396..
28. Podhorniak LV. A Rapid Miniaturized Residue Analytical Method for the Determination of Zoxamide and Its Two Acid Metabolites in Ginseng Roots Using UPLC-MS/MS. Journal of Agricultural and Food Chemistry. 2014;62(17):3702-9.
[29].T. T. Firozjaee, N. Mehrdadi, M. Baghdadi and G. R. N. Bidhendi., 2018. Application of Nanotechnology in Pesticides Removal from Aqueous Solutions - A review. Int. J. Nanosci. Nanotechnol.14(1):43-56.
30. Ahmari H, Heris SZ, Khayyat MH. The effect of titanium dioxide nanoparticles and UV irradiation on photocatalytic degradation of Imidaclopride. Environmental Technology. 2017;39(4):536-47.
31. Hudlikar M, Joglekar S, Dhaygude M, Kodam K. Green
synthesis of TiO2 nanoparticles by using aqueous extract of Jatropha curcas L. latex. Materials Letters. 2012;75:196-9.
[32]. K. Thamaphat, P. Limsuwan and B. Ngotawornchai,2008. Phase Characterization of TiO2 Powder by XRD and TEM.Kasetsart J.(Nat. Sci.), 42(5) :357-361.
33. Omrani N, Nezamzadeh-Ejhieh A. Focus on scavengers’ effects and GC-MASS analysis of photodegradation intermediates of sulfasalazine by Cu2O/CdS nanocomposite. Separation and Purification Technology. 2020;235:116228.
34. Azimi S, Nezamzadeh-Ejhieh A. Enhanced activity of clinoptilolite-supported hybridized PbS–CdS semiconductors for the photocatalytic degradation of a mixture of tetracycline and cephalexin aqueous solution. Journal of Molecular Catalysis A: Chemical. 2015;408:152-60.
35. Marimuthu S, Rahuman AA, Jayaseelan C, Kirthi AV, Santhoshkumar T, Velayutham K, et al. Acaricidal activity of synthesized titanium dioxide nanoparticles using Calotropis gigantea against Rhipicephalus microplus and Haemaphysalis bispinosa. Asian Pacific Journal of Tropical Medicine. 2013;6(9):682-8.
36. Órdenes-Aenishanslins NA, Saona LA, Durán-Toro VM, Monrás JP, Bravo DM, Pérez-Donoso JM. Use of titanium dioxide nanoparticles biosynthesized by Bacillus mycoides in quantum dot sensitized solar cells. Microbial Cell Factories. 2014;13(1).
[37]. RM Silverstein, FX Webster, D. Kiemled,2005.Spectrometric Identification of Organic Compounds. John Wiley & Sons, 7th Edition,502.
38. Shameli K, Ahmad MB, Jazayeri SD, Shabanzadeh P, Sangpour P, Jahangirian H, et al. Investigation of antibacterial properties silver nanoparticles prepared via green method. Chemistry Central Journal. 2012;6(1).
39. Heredia-Guerrero JA, BenÃtez JJ, DomÃnguez E, Bayer IS, Cingolani R, Athanassiou A, et al. Infrared and Raman spectroscopic features of plant cuticles: a review. Frontiers in Plant Science. 2014;5.
[40].S. Kalpagam and T.Kanndasan.,2014. Preparation of titanium dioxide nanoparticles and its application in waste water treatment. J. Chem. Bio Phy sci sec A, 4(3):1936-1940.
41. Jayaseelan C, Rahuman AA, Roopan SM, Kirthi AV, Venkatesan J, Kim S-K, et al. Biological approach to synthesize TiO2 nanoparticles using Aeromonas hydrophila and its antibacterial activity. Spectrochimica Acta Part A: Molecular and Biomolecular Spectroscopy. 2013;107:82-9.
42. León A, Reuquen P, Garín C, Segura R, Vargas P, Zapata P, et al. FTIR and Raman Characterization of TiO2 Nanoparticles Coated with Polyethylene Glycol as Carrier for 2-Methoxyestradiol. Applied Sciences. 2017;7(1):49.
[43]. W.L. Kuo, Y.L. Huang, S.T. Wang, C.L. Ni, B.J. Shien and C.C. Chen,2007. chemical constituents of Trema Orientalis.J. Chin. Med, 18(1), 27-36.
44. Tauc J. Optical properties and electronic structure of amorphous Ge and Si. Materials Research Bulletin. 1968;3(1):37-46.
45. Norouzzadeh P, Mabhouti K, Golzan MM, Naderali R. Investigation of structural, morphological and optical
P. Purkait et al. / Green Synthesis of TiO2 Nanoparticle
J. Water Environ. Nanotechnol., 5(3): 191-203 Summer 2020 203
characteristics of Mn substituted Al-doped ZnO NPs: A Urbach energy and Kramers-Kronig study. Optik. 2020;204:164227.
46. Noland WE, Rieger JL, Tu ZH, Tritch KJ. A 2:1 co-crystal of 3,5-dibromo-4-cyanobenzoic acid and anthracene. Acta Crystallographica Section E Crystallographic Communications. 2017;73(11):1743-6.
47. Ahmed S, Rasul MG, Brown R, Hashib MA. Influence of parameters on the heterogeneous photocatalytic degradation of pesticides and phenolic contaminants in wastewater: A short review. Journal of Environmental Management. 2011;92(3):311-30.
[48].S. T. Fardood, F. Moradnia, M. Mostafaei, Z. Afshari, V. Faramarzi and S. Ganjkhanlu, 2019. Biosynthesis of MgFe2 O4 magnetic nanoparticles and their application in photodegradation of malachite green dye and kinetic study, Nanochem Res, 4(1): 86-93.
49. Moradnia F, Taghavi Fardood S, Ramazani A, Gupta VK. Green synthesis of recyclable MgFeCrO4 spinel nanoparticles for rapid photodegradation of direct black 122 dye. Journal of Photochemistry and Photobiology A: Chemistry. 2020;392:112433.
50. Daneshvar N, Hejazi MJ, Rangarangy B, Khataee AR. Photocatalytic Degradation of an Organophosphorus Pesticide Phosalone in Aqueous Suspensions of Titanium Dioxide. Journal of Environmental Science and Health, Part B. 2004;39(2):285-96.
51. Wu R-J, Chen C-C, Chen M-H, Lu C-S. Titanium dioxide-mediated heterogeneous photocatalytic degradation of terbufos: Parameter study and reaction pathways. Journal of Hazardous Materials. 2009;162(2-3):945-53.
52. Chen J-Q, Wang D, Zhu M-X, Gao C-J. Photocatalytic degradation of dimethoate using nanosized TiO2 powder. Desalination. 2007;207(1-3):87-94.
53. Amalraj A, Suryaprabha T, Rajeswari A, Pius A. Photocatalytic Degradation of Quinalphos and Profenofos Pesticides Using UV Irradiated TiO2 Nanoparticles—A Kinetic Study. Materials Focus. 2016;5(4):377-84.
54. Rodriguez-Acosta JW, Mueses MÁ, Machuca-Martínez F. Mixing Rules Formulation for a Kinetic Model of the Langmuir-Hinshelwood Semipredictive Type Applied to the Heterogeneous Photocatalytic Degradation of Multicomponent Mixtures. International Journal of Photoenergy. 2014;2014:1-9.