Embed Size (px)
Citation preview
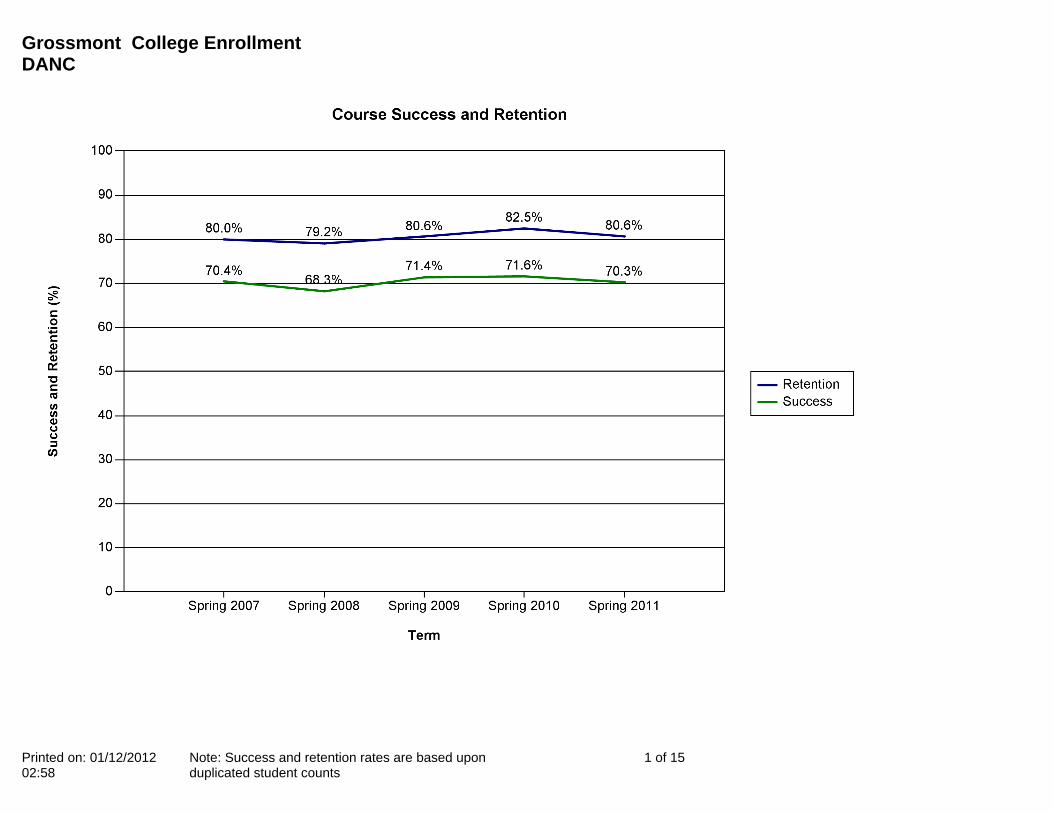
Grossmont College Enrollment DANC
Printed on: 01/12/2012 02:58
Note: Success and retention rates are based upon duplicated student counts
1 of 15
Grossmont College Enrollment DANC
Printed on: 01/12/2012 02:58
Note: Success and retention rates are based upon duplicated student counts
2 of 15
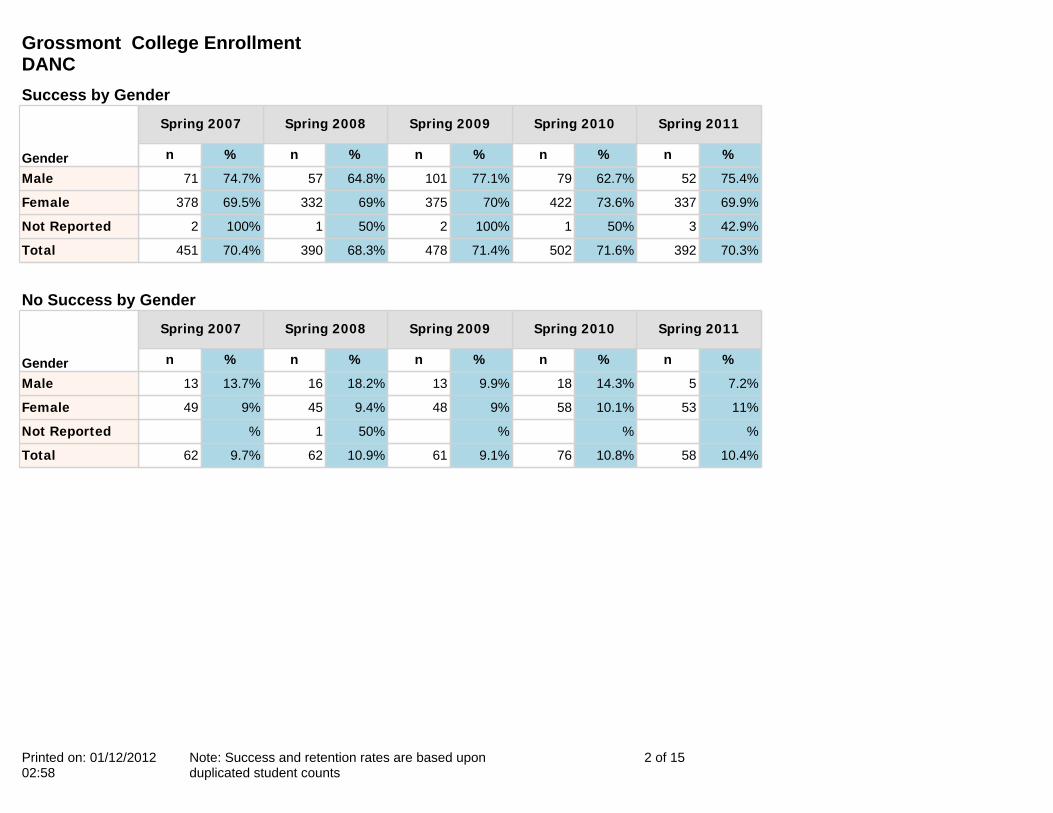
70.3%39271.6%50271.4%47868.3%39070.4%451
42.9%350%1100%250%1100%2
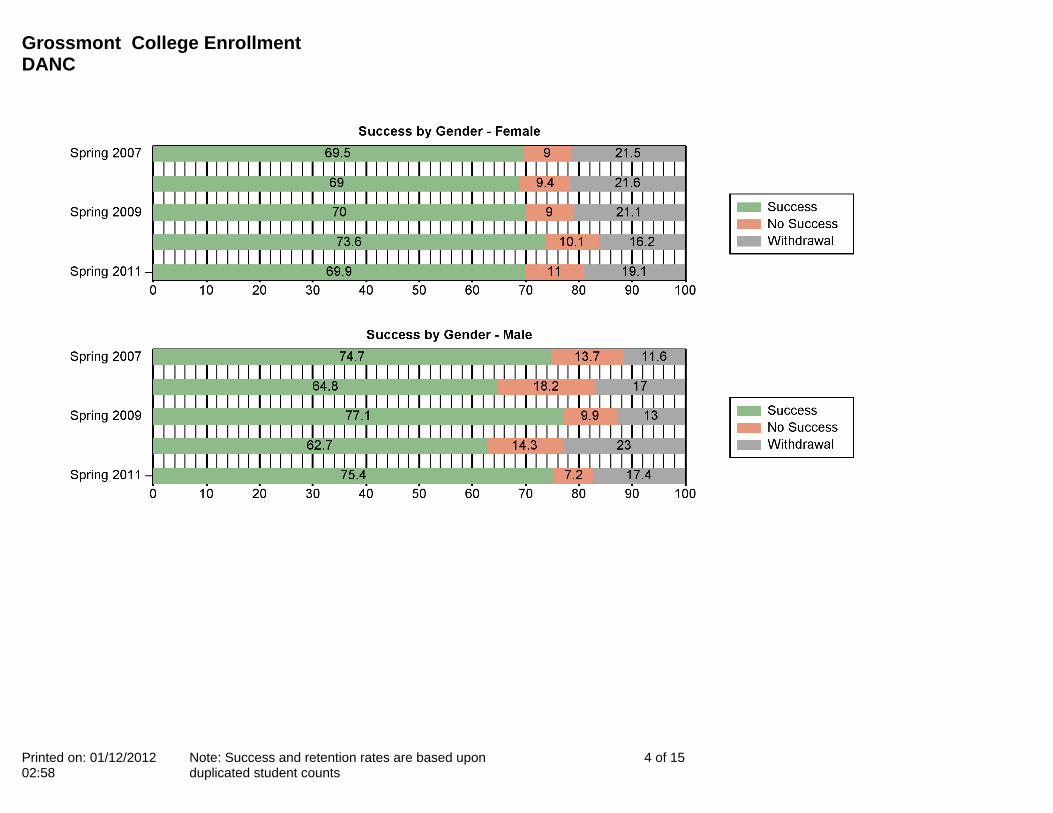
69.9%33773.6%42270%37569%33269.5%378
75.4%5262.7%7977.1%10164.8%5774.7%71
Total
Not Reported
Female
Male
%n%n%n%n%n
Spring 2011Spring 2010Spring 2009Spring 2008Spring 2007
Gender
10.4%5810.8%769.1%6110.9%629.7%62
%%%50%1%
11%5310.1%589%489.4%459%49
7.2%514.3%189.9%1318.2%1613.7%13
Total
Not Reported
Female
Male
%n%n%n%n%n
Spring 2011Spring 2010Spring 2009Spring 2008Spring 2007
Gender
Success by Gender
No Success by Gender
Grossmont College Enrollment DANC
Printed on: 01/12/2012 02:58
Note: Success and retention rates are based upon duplicated student counts
3 of 15
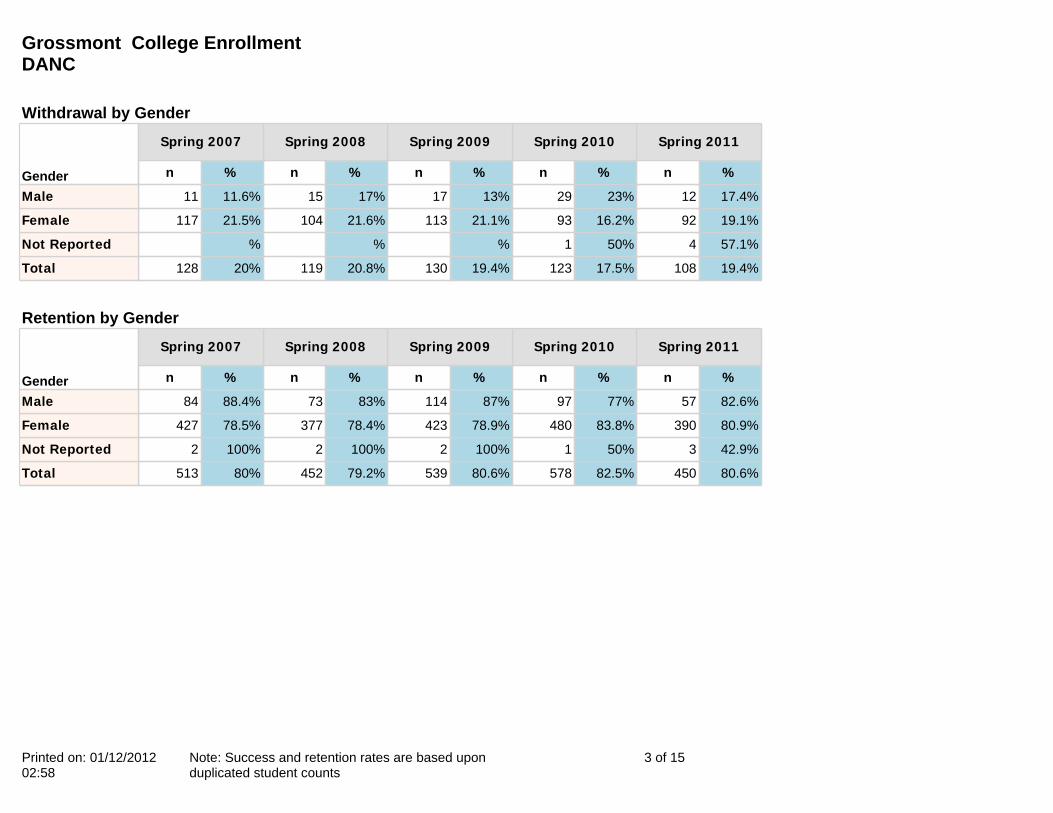
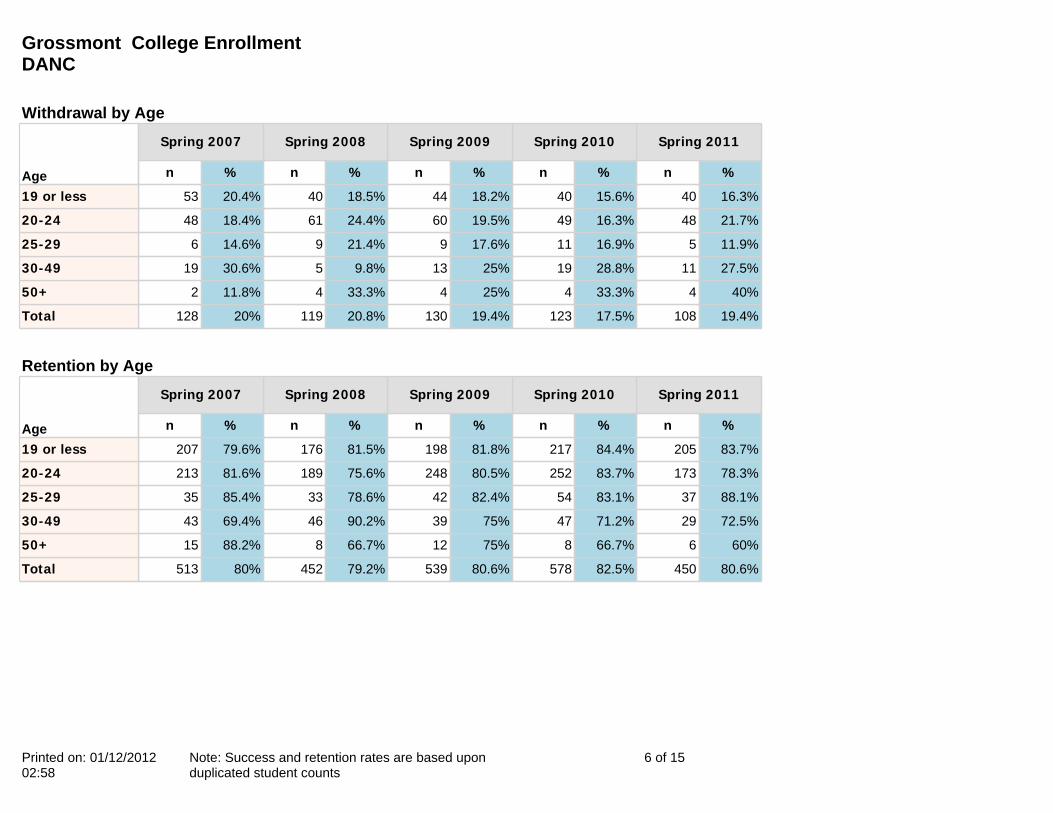
19.4%10817.5%12319.4%13020.8%11920%128
57.1%450%1%%%
19.1%9216.2%9321.1%11321.6%10421.5%117
17.4%1223%2913%1717%1511.6%11
Total
Not Reported
Female
Male
%n%n%n%n%n
Spring 2011Spring 2010Spring 2009Spring 2008Spring 2007
Gender
80.6%45082.5%57880.6%53979.2%45280%513
42.9%350%1100%2100%2100%2
80.9%39083.8%48078.9%42378.4%37778.5%427
82.6%5777%9787%11483%7388.4%84
Total
Not Reported
Female
Male
%n%n%n%n%n
Spring 2011Spring 2010Spring 2009Spring 2008Spring 2007
Gender
Withdrawal by Gender
Retention by Gender
Grossmont College Enrollment DANC
Printed on: 01/12/2012 02:58
Note: Success and retention rates are based upon duplicated student counts
4 of 15

Grossmont College Enrollment DANC
Printed on: 01/12/2012 02:58
Note: Success and retention rates are based upon duplicated student counts
5 of 15
70.3%39271.6%50271.4%47868.3%39070.4%451
60%658.3%762.5%1050%670.6%12
62.5%2554.5%3669.2%3680.4%4151.6%32
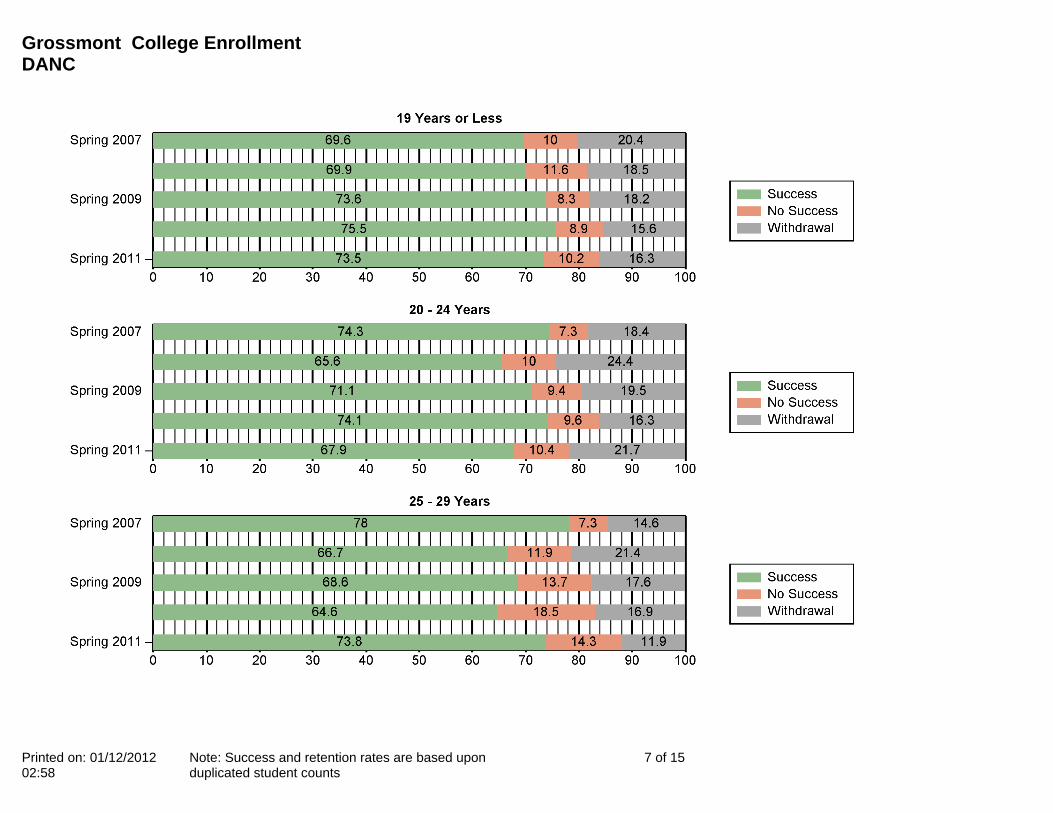
73.8%3164.6%4268.6%3566.7%2878%32
67.9%15074.1%22371.1%21965.6%16474.3%194
73.5%18075.5%19473.6%17869.9%15169.6%181
Total
50+
30-49
25-29
20-24
19 or less
%n%n%n%n%n
Spring 2011Spring 2010Spring 2009Spring 2008Spring 2007
Age
10.4%5810.8%769.1%6110.9%629.7%62
%8.3%112.5%216.7%217.6%3
10%416.7%115.8%39.8%517.7%11
14.3%618.5%1213.7%711.9%57.3%3
10.4%239.6%299.4%2910%257.3%19
10.2%258.9%238.3%2011.6%2510%26
Total
50+
30-49
25-29
20-24
19 or less
%n%n%n%n%n
Spring 2011Spring 2010Spring 2009Spring 2008Spring 2007
Age
Success by Age
No Success by Age
Grossmont College Enrollment DANC
Printed on: 01/12/2012 02:58
Note: Success and retention rates are based upon duplicated student counts
6 of 15
19.4%10817.5%12319.4%13020.8%11920%128
40%433.3%425%433.3%411.8%2
27.5%1128.8%1925%139.8%530.6%19
11.9%516.9%1117.6%921.4%914.6%6
21.7%4816.3%4919.5%6024.4%6118.4%48
16.3%4015.6%4018.2%4418.5%4020.4%53
Total
50+
30-49
25-29
20-24
19 or less
%n%n%n%n%n
Spring 2011Spring 2010Spring 2009Spring 2008Spring 2007
Age
80.6%45082.5%57880.6%53979.2%45280%513
60%666.7%875%1266.7%888.2%15
72.5%2971.2%4775%3990.2%4669.4%43
88.1%3783.1%5482.4%4278.6%3385.4%35
78.3%17383.7%25280.5%24875.6%18981.6%213
83.7%20584.4%21781.8%19881.5%17679.6%207
Total
50+
30-49
25-29
20-24
19 or less
%n%n%n%n%n
Spring 2011Spring 2010Spring 2009Spring 2008Spring 2007
Age
Withdrawal by Age
Retention by Age
Grossmont College Enrollment DANC
Printed on: 01/12/2012 02:58
Note: Success and retention rates are based upon duplicated student counts
7 of 15

Grossmont College Enrollment DANC
Printed on: 01/12/2012 02:58
Note: Success and retention rates are based upon duplicated student counts
8 of 15
Grossmont College Enrollment DANC
Printed on: 01/12/2012 02:58
Note: Success and retention rates are based upon duplicated student counts
9 of 15
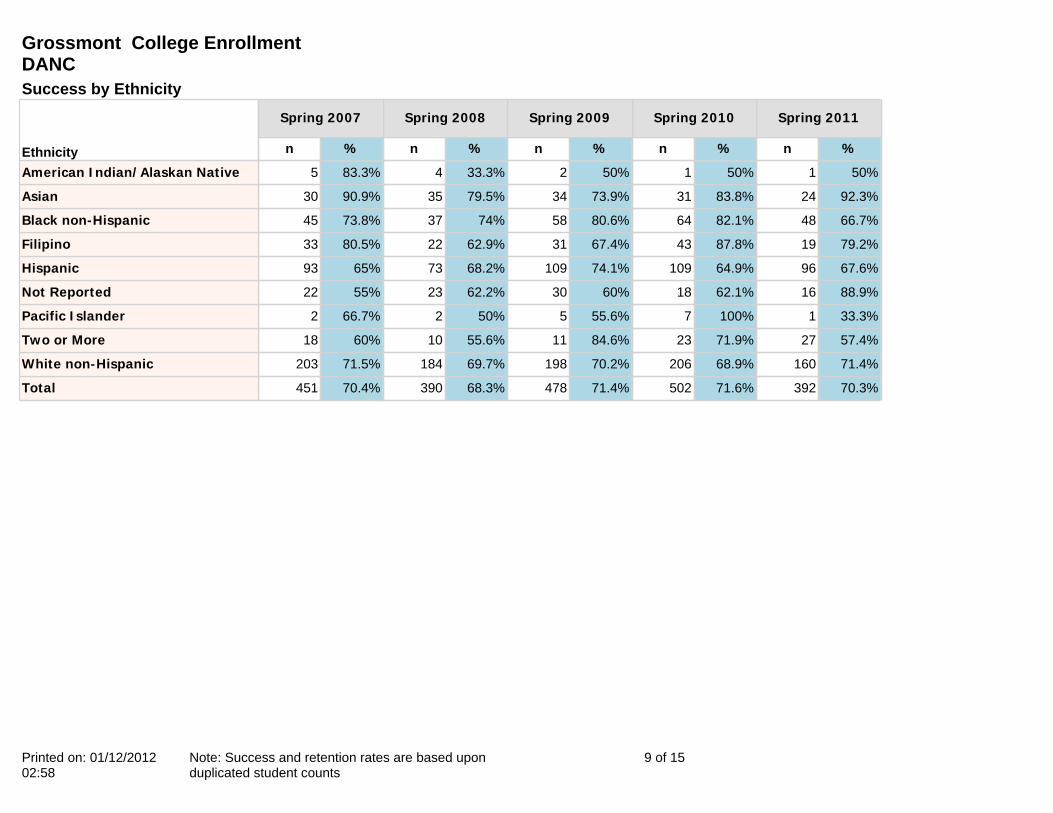
70.3%39271.6%50271.4%47868.3%39070.4%451
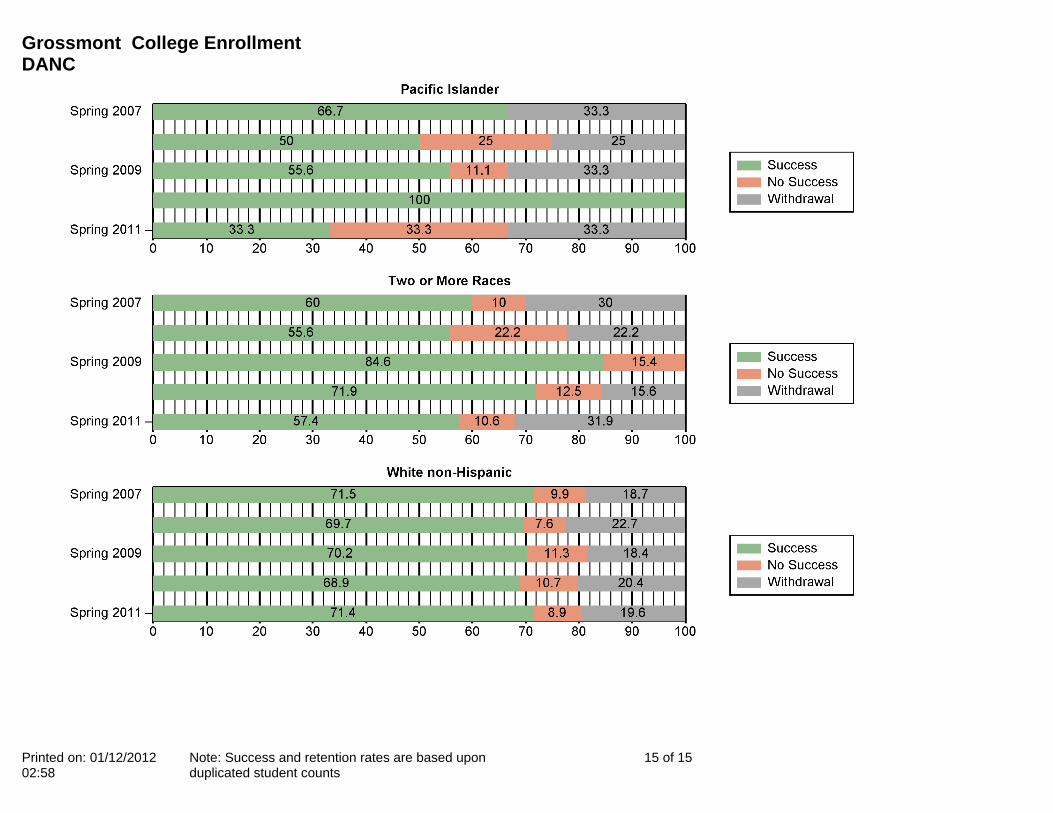
71.4%16068.9%20670.2%19869.7%18471.5%203
57.4%2771.9%2384.6%1155.6%1060%18
33.3%1100%755.6%550%266.7%2
88.9%1662.1%1860%3062.2%2355%22
67.6%9664.9%10974.1%10968.2%7365%93
79.2%1987.8%4367.4%3162.9%2280.5%33
66.7%4882.1%6480.6%5874%3773.8%45
92.3%2483.8%3173.9%3479.5%3590.9%30
50%150%150%233.3%483.3%5
Total
White non-Hispanic
Two or More
Pacific Islander
Not Reported
Hispanic
Filipino
Black non-Hispanic
Asian
American Indian/Alaskan Native
%n%n%n%n%n
Spring 2011Spring 2010Spring 2009Spring 2008Spring 2007
Ethnicity
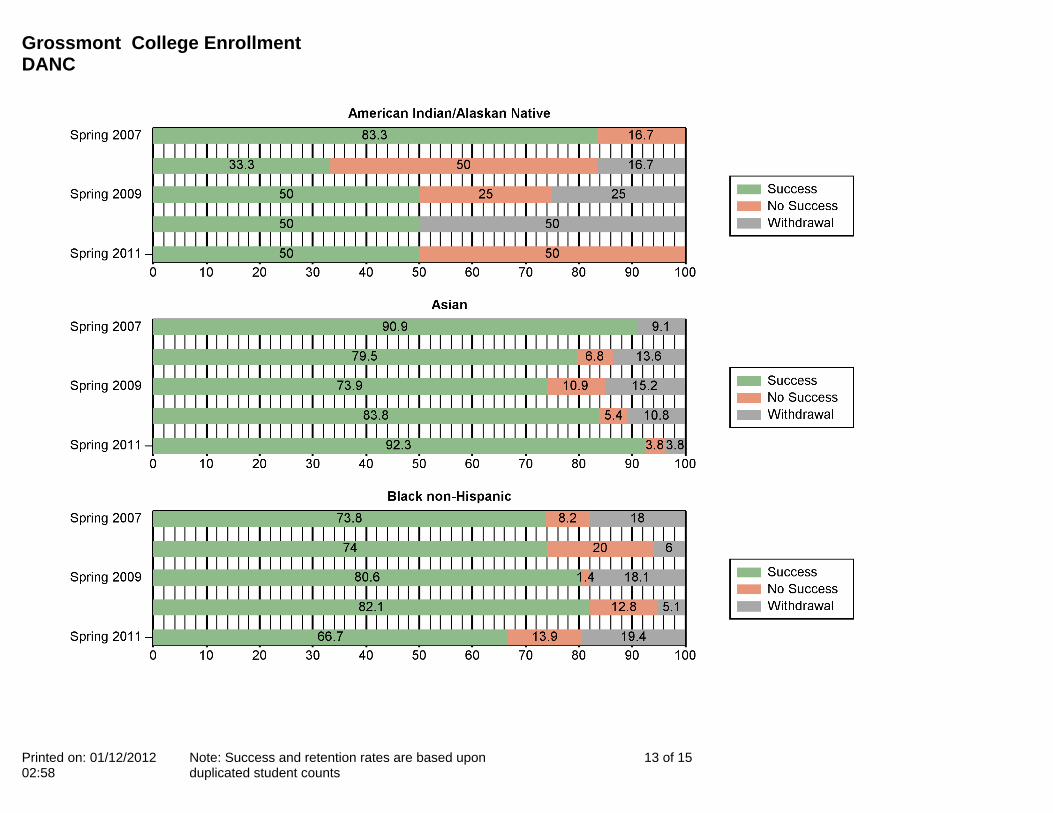
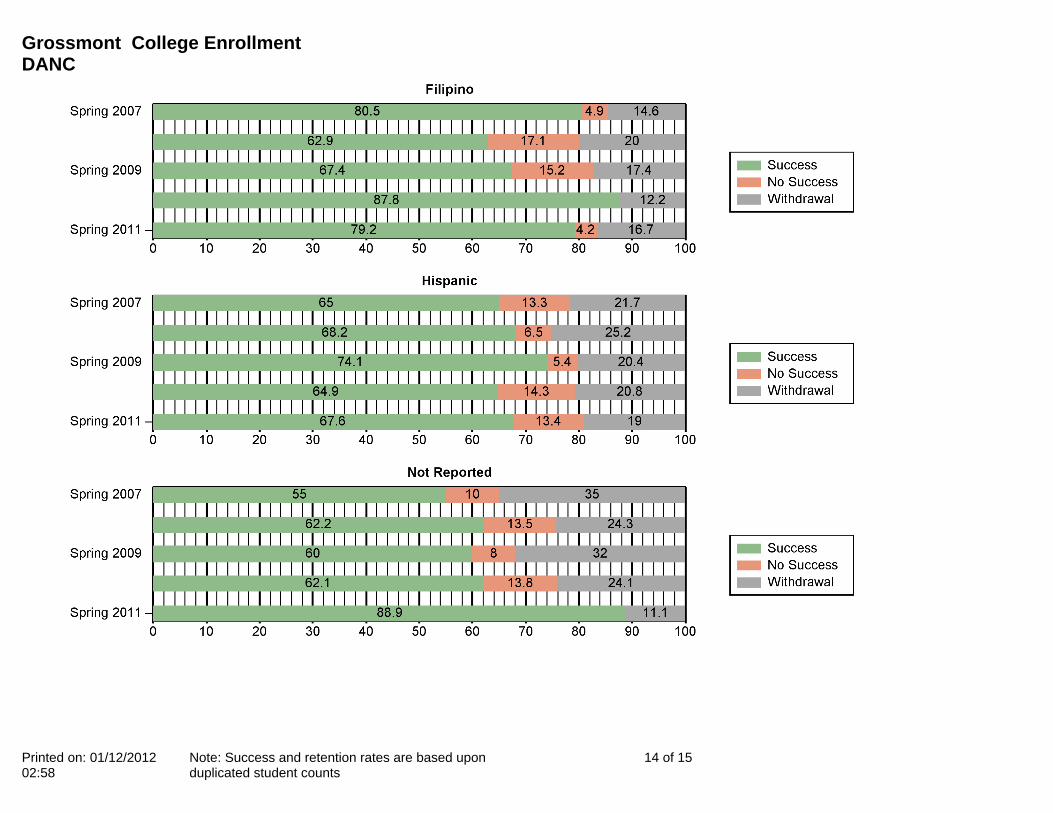
Success by Ethnicity
Grossmont College Enrollment DANC
Printed on: 01/12/2012 02:58
Note: Success and retention rates are based upon duplicated student counts
10 of 15
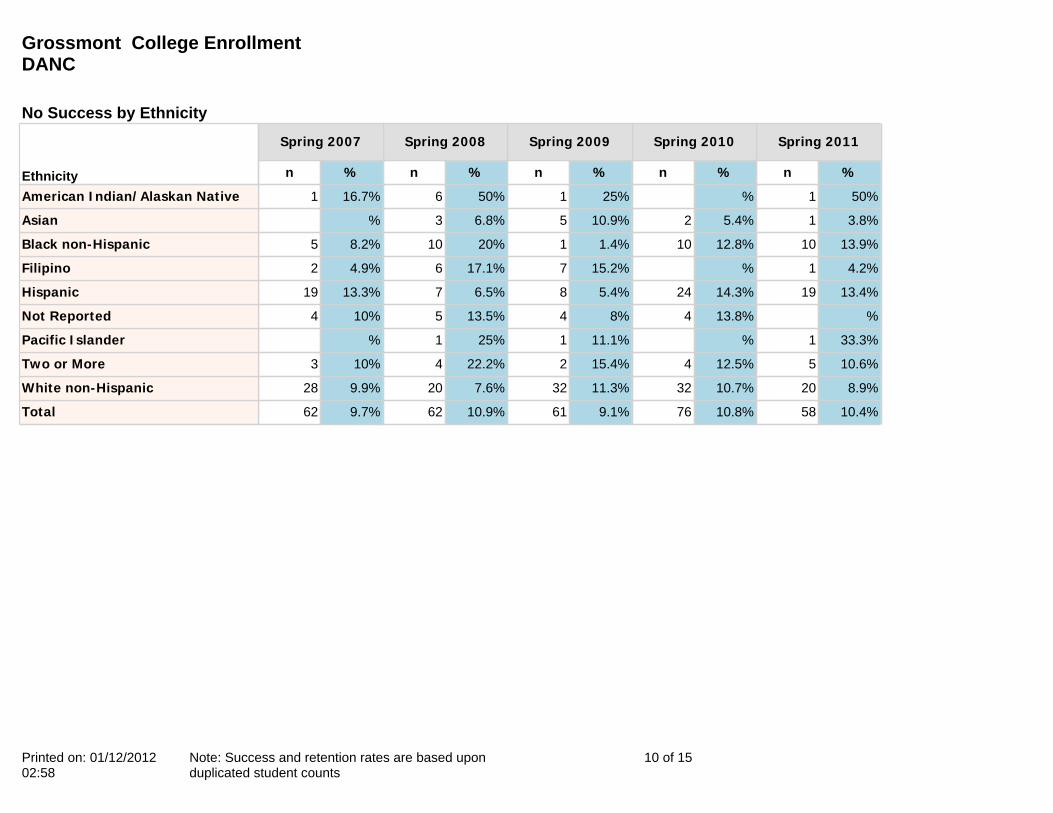
10.4%5810.8%769.1%6110.9%629.7%62
8.9%2010.7%3211.3%327.6%209.9%28
10.6%512.5%415.4%222.2%410%3
33.3%1%11.1%125%1%
%13.8%48%413.5%510%4
13.4%1914.3%245.4%86.5%713.3%19
4.2%1%15.2%717.1%64.9%2
13.9%1012.8%101.4%120%108.2%5
3.8%15.4%210.9%56.8%3%
50%1%25%150%616.7%1
Total
White non-Hispanic
Two or More
Pacific Islander
Not Reported
Hispanic
Filipino
Black non-Hispanic
Asian
American Indian/Alaskan Native
%n%n%n%n%n
Spring 2011Spring 2010Spring 2009Spring 2008Spring 2007
Ethnicity
No Success by Ethnicity
Grossmont College Enrollment DANC
Printed on: 01/12/2012 02:58
Note: Success and retention rates are based upon duplicated student counts
11 of 15
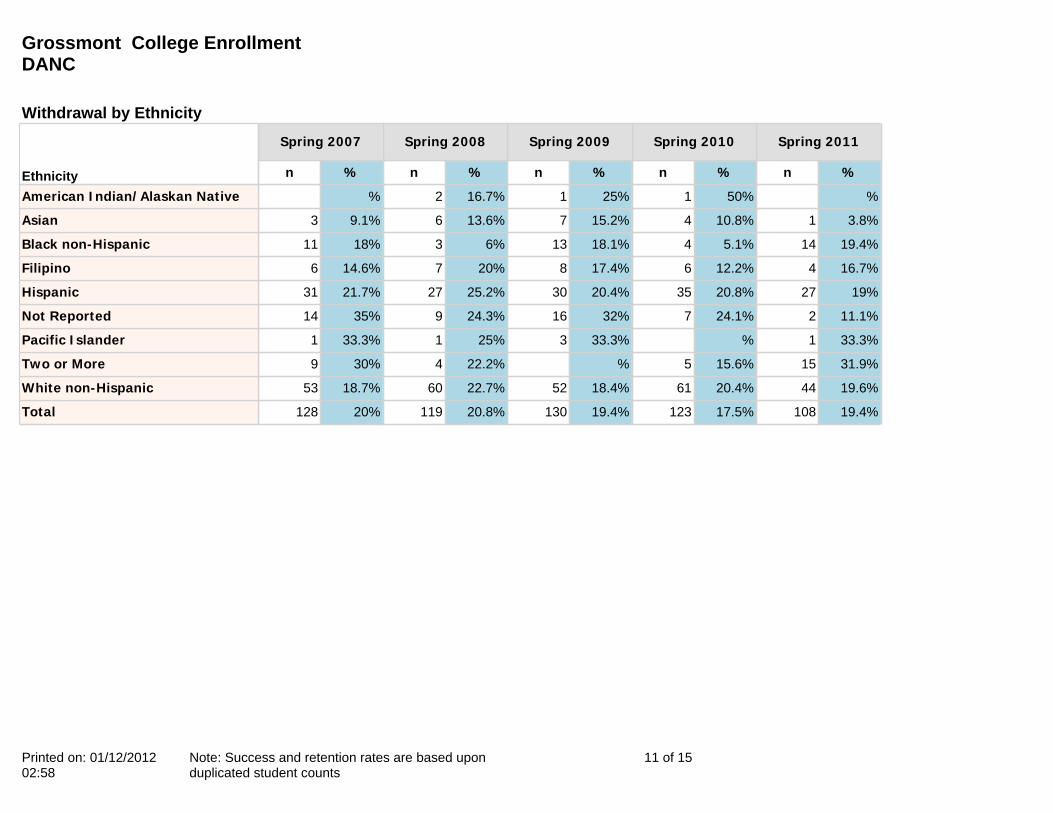
19.4%10817.5%12319.4%13020.8%11920%128
19.6%4420.4%6118.4%5222.7%6018.7%53
31.9%1515.6%5%22.2%430%9
33.3%1%33.3%325%133.3%1
11.1%224.1%732%1624.3%935%14
19%2720.8%3520.4%3025.2%2721.7%31
16.7%412.2%617.4%820%714.6%6
19.4%145.1%418.1%136%318%11
3.8%110.8%415.2%713.6%69.1%3
%50%125%116.7%2%
Total
White non-Hispanic
Two or More
Pacific Islander
Not Reported
Hispanic
Filipino
Black non-Hispanic
Asian
American Indian/Alaskan Native
%n%n%n%n%n
Spring 2011Spring 2010Spring 2009Spring 2008Spring 2007
Ethnicity
Withdrawal by Ethnicity
Grossmont College Enrollment DANC
Printed on: 01/12/2012 02:58
Note: Success and retention rates are based upon duplicated student counts
12 of 15
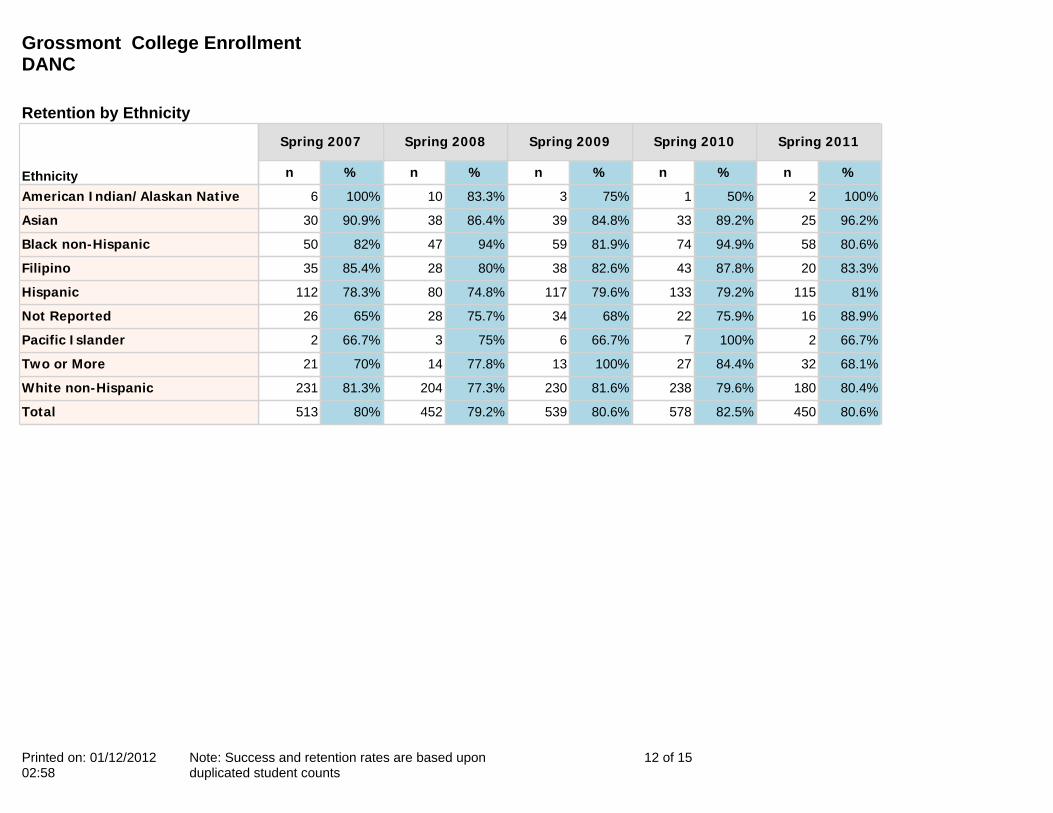
80.6%45082.5%57880.6%53979.2%45280%513
80.4%18079.6%23881.6%23077.3%20481.3%231
68.1%3284.4%27100%1377.8%1470%21
66.7%2100%766.7%675%366.7%2
88.9%1675.9%2268%3475.7%2865%26
81%11579.2%13379.6%11774.8%8078.3%112
83.3%2087.8%4382.6%3880%2885.4%35
80.6%5894.9%7481.9%5994%4782%50
96.2%2589.2%3384.8%3986.4%3890.9%30
100%250%175%383.3%10100%6
Total
White non-Hispanic
Two or More
Pacific Islander
Not Reported
Hispanic
Filipino
Black non-Hispanic
Asian
American Indian/Alaskan Native
%n%n%n%n%n
Spring 2011Spring 2010Spring 2009Spring 2008Spring 2007
Ethnicity
Retention by Ethnicity
Grossmont College Enrollment DANC
Printed on: 01/12/2012 02:58
Note: Success and retention rates are based upon duplicated student counts
13 of 15
Grossmont College Enrollment DANC
Printed on: 01/12/2012 02:58
Note: Success and retention rates are based upon duplicated student counts
14 of 15
Grossmont College Enrollment DANC
Printed on: 01/12/2012 02:58
Note: Success and retention rates are based upon duplicated student counts
15 of 15