Embed Size (px)
Citation preview

1
NATIONAL CONFERENCE FOR RABI CAMPAIGN 2014-15
Department of Agriculture, Andhra Pradesh
(17th & 18th September, 2014)
GROUP - I
SOIL HEALTH
Government of Andhra Pradesh
2
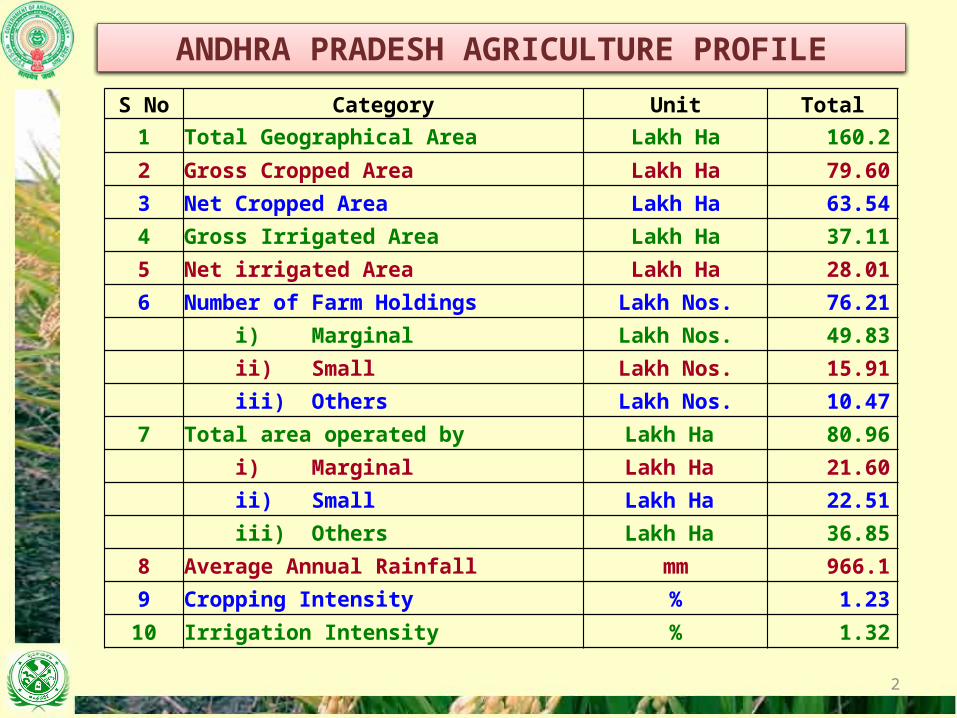
ANDHRA PRADESH AGRICULTURE PROFILE
S No Category Unit Total
1 Total Geographical Area Lakh Ha 160.2
2 Gross Cropped Area Lakh Ha 79.60
3 Net Cropped Area Lakh Ha 63.54
4 Gross Irrigated Area Lakh Ha 37.11
5 Net irrigated Area Lakh Ha 28.01
6 Number of Farm Holdings Lakh Nos. 76.21
i) Marginal Lakh Nos. 49.83
ii) Small Lakh Nos. 15.91
iii) Others Lakh Nos. 10.47
7 Total area operated by Lakh Ha 80.96
i) Marginal Lakh Ha 21.60
ii) Small Lakh Ha 22.51
iii) Others Lakh Ha 36.85
8 Average Annual Rainfall mm 966.1
9 Cropping Intensity % 1.23
10 Irrigation Intensity % 1.32

3
RAINFALL (SWM) (1-6-2014 TO 10-9-2014)Normal (SWM) : 554.3 mm Normal as on date : 447.3 mmReceived : 300.0 mm Deviation : - 32.9 %
Sl.No Districts
No.of districts
Status & deviation
1 - Nil - 0 Excess(20% & above)
2 Srikakulam, Vizianagaram, 2 Normal(+19% to -19%)
3 Visakhapatnam, East Godavari, West Godavari. Krishna, Guntur, Prakasam, Nellore, Chittoor, Kadapa, Kurnool and Anantapur,
11 Deficit (-20% to -59%)
Month Normal As on date
Actual Rainfall (m.m) % deviationto Normal as
on dateSTATUS
2012 2013 2014
June 90.0 70.0 98.0 36.0 -60 Scanty
July 145.8 183.0 145.0 104.0 -29 Deficient
August 158.0 175.2 111.1 123.9 -21 Deficient
September (1st to 10th sept.)
53.5 83.0 54.6 36.1 -33 Deficient
Andhra Pradesh 447.3 511.2 408.7 300 - 33 Deficient

4
KHARIF 2014 & RABI 2014-15 PROSPECTS
Sl.No. Crop
Normal Production
2014-15 (Target)
Kharif Rabi Total
1 Rice 76.05 49.62 34.88 84.50
2 Pulses 10.41 1.64 12.37 14.01
3 Total Foodgrains 109.07 58.11 68.93 127.04
4 Oil Seeds 20.25 11.38 4.80 16.18
5 Cotton (lakh bales) 12.29 21.20 0.00 21.20
(ABSTRACT)

5
SlNo CROP
Area (in Lakh hactares) Productivity (Kgs/hect) Production (in Lakh tonnes)
Normal Actual 2013
Target 2014 Normal Actual
2013Target
2014 Normal Actual 2013
Target 2014
1 Rice 16.42 17.06 17.14 2668 2555 2895 43.8 43.59 49.622 Wheat 0.00 0.00 0 0 0 0 0 0 03 Jowar 0.32 0.33 0.32 1726 1747 2172 0.57 0.58 0.704 Bajra 0.40 0.47 0.45 1706 1654 1692 0.69 0.78 0.755 Maize 0.75 1.10 1.10 3775 3711 4216 2.85 4.08 4.656 Ragi 0.36 0.37 0.36 1017 983 1144 0.36 0.36 0.417 Minor Millets 0.29 0.27 0.38 780 735 898 0.22 0.20 0.34
Coarse Grain 2.12 2.54 2.61 4.69 6.00 6.858 Bengal Gram 0.00 0.00 0.00 0 0 0 0 0 0.009 Redgram 2.04 1.83 2.53 443 563 502 0.91 1.03 1.27
10 Greengram 0.28 0.17 0.28 353 512 466 0.1 0.09 0.1311 Blackgram 0.20 0.15 0.25 520 682 676 0.1 0.10 0.1712 Horsegram 0.08 0.08 0.06 585 584 679 0.05 0.04 0.0413 Other Pulses 0.06 0.07 0.06 484 571 494 0.03 0.04 0.03
Total Pulses 2.66 2.30 3.18 1.19 1.30 1.64Total Foodgrains 21.20 21.89 22.93 49.68 50.89 58.11
14 Groundnut 10.90 10.86 12.76 512 627 846 5.59 6.81 10.7915 Sesamum 0.35 0.28 0.28 250 449 250 0.09 0.13 0.0716 Castor 0.87 0.48 0.47 415 522 794 0.36 0.25 0.3817 Sunflower 0.34 0.18 0.19 552 788 709 0.19 0.14 0.1318 Soyabean 0.02 0.03 0.01 1875 1610 2039 0.03 0.05 0.0119 Other Oil Seeds 0.00 0.55 0 21627 21730 0 10.42 11.95 0
Total Oilseeds 12.48 12.37 13.71 16.68 19.33 11.3820 Cotton 4.83 6.71 6.93 429 489 520 12.22 19.3 21.2021 Mesta 0.19 0.09 0.09 1508 1651 1588 1.64 0.83 0.7922 Chillies 1.09 1.13 1.14 3930 4619 3904 4.29 5.22 4.4623 Sugarcane 1.50 1.53 1.51 77821 78000 80618 116.42 119.34 121.7324 Onion 0.24 0.21 0.22 17174 18831 19581 4.16 3.95 4.2325 Turmeric 0.19 0.18 0.15 7946 8526 6234 1.48 1.53 0.95
Total Cropped Area 41.72 44.12 46.68
KHARIF 2014 ASSESSMENT COMPARED TO KHARIF 2013 AND NORMAL
Area in Lakh ha, Productivity in Kgs/ha & Prodcution in LMTs

6
SlNo CROP
Area (in Lakh hactares) Productivity (Kgs/hect) Production (in Lakh tonnes)
Normal Actual 2013-14
Target for 2014-15 Normal Actual
2013-14Target for
2014-15 Normal Actual 2013-14
Target for 2014-15
1 Rice 8.13 8.78 8.29 4005 4105 4208 32.25 36.04 34.882 Wheat 0.01 0.00 0.00 1180 1185 6312 0 0 03 Jowar 1.03 0.86 1.41 2211 2411 2648 2.29 2.07 3.734 Bajra 0.03 0.02 0.05 2000 1654 1441 0.05 0.03 0.075 Maize 1.92 2.42 1.87 7719 7478 9495 15.5 18.1 17.726 Ragi 0.05 0.05 0.08 1680 1512 1846 0.08 0.08 0.157 Minor Millets 0.01 0.01 0.01 1045 1106 915 0.01 0.01 0.01
Coarse Grain 3.04 3.36 3.42 17.94 20.29 21.688 Bengal Gram 5.07 4.72 5.50 1164 1365 1424 5.87 6.44 7.849 Redgram 0.03 0.10 0.08 732 563 750 0.02 0.01 0.06
10 Greengram 1.03 1.16 1.31 538 616 631 0.57 0.71 0.8311 Blackgram 3.55 2.50 4.29 713 779 790 2.52 1.95 3.3912 Horsegram 0.27 0.20 0.30 539 493 614 0.14 0.1 0.1813 Other Pulses 0.08 0.10 0.08 895 2100 874 0.1 0.21 0.07
Total Pulses 10.03 8.79 11.56 9.22 9.42 12.37Total Foodgrains 21.21 20.93 23.27 59.41 65.75 68.93
14 Groundnut 1.11 0.90 1.06 2269 2210 2264 2.40 1.99 2.4115 Sesamum 0.25 0.33 0.25 236 125 204 0.07 0.06 0.0816 Castor 0.01 0.01 0.04 647 522 713 0.02 0.01 0.0317 Sunflower 1.68 0.62 2.01 757 847 1006 0.97 0.53 2.0218 Soyabean 0.00 0.00 0.00 1875 1610 1610 0 0 019 Saflower 0.01 0.00 0.00 833 0 0 0 0 0.0020 Other Oil Seeds 0.18 0.12 0.13 1000 429 2716 0.1 0.06 0.26
Total Oilseeds 3.24 1.99 3.49 3.56 2.65 4.8021 Cotton 0.05 0.05 0 468 489 0 0.07 0.14 022 Mesta 0.00 0.00 0 0 0 0 0 0 023 Chillies 0.22 0.18 0.24 3830 3680 3918 0.81 0.66 0.9424 Sugarcane 0.00 0.00 0 0 0 0 0 0 025 Onion 0.05 0.05 0.04 23174 22513 24676 1.07 1.13 1.0626 Turmeric 0.00 0.00 0 0 0 0 0 0 027 Coriander 0.20 0.07 0.23 506 617 671 0.08 0.04 0.1628 Tobacco 1.40 1.39 1.15 2023 2801 1782 2.94 3.89 2.05
Total Cropped Area 26.37 24.67 28.42
RABI PROSPECTS 2014-15 COMPARED TO RABI 2013-14 & NORMALArea in Lakh ha, Productivity in Kgs/ha & Prodcution in LMTs

7
SlNo CROP
Area (in Lakh hactares) Productivity (Kgs/hect) Production (in Lakh tonnes)
Normal Actual 2013-14
Target for 2014-15 Normal Actual
2013-14Target for
2014-15 Normal Actual 2013-14
Target for 2014-15
1 Rice 24.55 25.83 25.43 3108 3082 3323 76.05 79.63 84.502 Wheat 0.01 0.00 0.00 1185 1185 1190 0.00 0.00 0.003 Jowar 1.35 1.18 1.73 2094 2227 2560 2.86 2.65 4.434 Bajra 0.43 0.49 0.50 1724 1654 1667 0.74 0.81 0.825 Maize 2.67 3.52 2.97 6642 6301 7533 18.35 22.18 22.376 Ragi 0.41 0.42 0.44 1099 1048 1273 0.44 0.44 0.567 Minor Millets 0.30 0.28 0.39 792 754 898 0.23 0.21 0.35
Coarse Grain 5.16 5.89 6.03 22.62 26.29 28.538 Bengal Gram 5.07 4.72 5.50 1164 1365 1424 5.87 6.44 7.849 Redgram 2.07 1.93 2.61 446 539 510 0.93 1.04 1.33
10 Greengram 1.31 1.34 1.59 500 602 602 0.67 0.80 0.9611 Blackgram 3.75 2.65 4.54 703 774 784 2.62 2.05 3.5612 Horsegram 0.35 0.28 0.36 550 500 626 0.19 0.14 0.2213 Other Pulses 0.14 0.17 0.14 750 1458 710 0.13 0.25 0.10
Total Pulses 12.69 11.09 14.74 10.41 10.72 14.01Total Foodgrains 42.41 42.82 46.20 109.08 116.64 127.04
14 Groundnut 12.01 11.76 13.82 667 748 955 7.99 8.80 13.2015 Sesamum 0.60 0.61 0.53 244 311 275 0.16 0.19 0.1516 Castor 0.88 0.49 0.51 424 522 804 0.38 0.26 0.4117 Sunflower 2.02 0.80 2.20 714 838 980 1.16 0.67 2.1518 Soyabean 0.02 0.03 0.01 2000 1610 2039 0.03 0.05 0.0119 Saflower 0.01 0.00 0.00 833 833 833 0.00 0.00 0.0020 Other Oil Seeds 0.18 0.67 0.13 18024 17925 2716 10.52 12.01 0.26
Total Oilseeds 15.72 14.37 17.20 20.24 21.98 16.1821 Cotton 4.88 6.77 6.93 429 489 520 12.29 19.44 21.2022 Mesta 0.19 0.09 0.09 1508 1651 1588 1.64 0.83 0.7923 Chillies 1.31 1.31 1.38 3913 4489 3907 5.10 5.88 5.4024 Sugarcane 1.50 1.53 1.51 77821 78000 80618 116.42 119.34 121.7325 Onion 0.29 0.26 0.26 18132 19538 20428 5.23 5.08 5.2926 Turmeric 0.19 0.18 0.15 7946 8526 6234 1.48 1.53 0.9527 Croriandor 0.20 0.07 0.23 506 617 671 0.08 0.04 0.1628 Tobacco 1.40 1.39 1.15 2023 2801 1782 2.94 3.89 2.05
Total Cropped Area 68.09 68.79 75.10
AREA, PRODUCTIVITY & PRODUCTION FOR 2014-15 WITH COMPARISION TO NORMAL & 2013-14 (KHARIF + RABI)
Area in Lakh ha, Productivity in Kgs/ha & Prodcution in LMTs

SOIL TESTING - INFRASTRUCTURE
S. No
Type of Soil Testing Lab Nos
Facility
1 Regional Soil Testing Labs 1 Macro & Micro nutrient & water analysis.
2 District Soil Testing Lab 16 Macro & Micro nutrient & water analysis
3 Mobile labs 4 Macronutrients.
4 Agril. Market Committee level labs
30 Macronutrients. (Out of 30, 15 AMC STLs are functioning)
Total 51
8

9
SOIL TESTING PROGRAMMES
• Soil testing campaign was organized during 1st -10th April 2014 and soil samples were collected @ 10 samples per revenue village.
• Soil health cards are distributed to farmers duly advocating soil test based fertilizer recommendations.
• As part of Agrisnet portal – software to computerize soil test results was developed.
• Facility to send SMS to farmers mobile in local language immediately after analysis has been launched by Department of Agriculture, AP on 8th Feb 2014.
Component Target for the year 2014-15
Analysis upto 30th Aug 2014 SHC dispatched SHC
OnlinedSMS sent to
farmers
Macro Analysis 169000 135108 118206 114561 98687
Micro Analysis 96400 35579 35579 0 0
Water Analysis 13220 7742 7742 0 0

10
Improving the soil testing facilities in AP by setting up centralized state labs with all modern equipment.
• Under NMSA 2014-15, - Rs. 13.5 crores was proposed for setting up 3 MSTLs, 1 centralized STL & strengthening of existing 20 STLs.
• Under special development package - Rs. 35.45 crores was proposed for setting up of new STLs (2 centralized STLs, 4 MSTLs and 35 AMC STLs) and strengthening of existing STLs with sophisticated equipment.
• It is proposed to undertake soil testing in total cropped area in AP in a period of 2-3 years by collecting soil samples using GPS.(Rs.50crores)
S.No Component Target for collection and Analysis of soil samples in Lakhs
2014-15 2015-16 2016-17 2017-18 2018-19
1 Macronutrient analysis 1.69 6.00 7.00 8.00 10.00
2 Micronutrient analysis 0.96 2.00 3.00 4.50 5.00
3 Water analysis 0.13 0.30 0.60 0.90 1.20
4Distribution of Soil Health cards 2.65 8.00 7.30 12.50 15.00
FIVE YEAR ACTION PLAN:

11
Soil Health Management:
• Indiscriminate fertilizer management over years – led to extensive mining of soils – macro and miconutrient deficiencies - sustainable agriculture & food security threatened.
• Many programs are being taken up by dept of Agriculture AP with these
Objectives:
1. To improve soil testing services to farmers in AP.
2. Collection of representative soil samples by using GPS & other latest methods from all the farm holdings in a scientific and time bound manner.
3. To identify and reclaim the problematic soils.
4. To create awareness & communicate the soil test results to the farmers – promote soil test based fertilizer usage by distributing of soil health cards.
5. To achieve the reduction in cost on fertilizers - decrease the total cost of cultivation –improve farm profitability.

12
Soil Health Management Programs in AP:
1. Productivity Enhancement through BHUCHETANA• The Dept is implementing BHUCHETANA in 13 districts of A.P.
covering an area of 132200 ha in Kharif 2014 @ 200ha/ mandal and 49575 ha in Rabi 2014-15 @75ha/ mandal under RKVY with an outlay of Rs.14.0 crores.
• 2-3 villages identified in each mandal & stratified soil sampling was done by collecting 10 representative soil samples from the targetted area. These samples were analysed for macro and micro nutrients and fertilizer recommendations were given.
• The secondary and micronutrients were supplied to the farmers on 50% subsidy as per the soil test based recommendations for the proposed area.
• In order to converge good management practices, different schemes namely organic farming, seed village programme, Farmer Field School, NFSM, Promoting fodder production, farm ponds and machineries (individuals as well as hiring centres) will be implemented in the Project area.

13
2. Correction of micronutrient deficiencies in soils of AP in a massive way by supplying the micronutrients to farmers covering 45% cropped area in AP.
• Preliminary soil mapping exercise revealed large scale deficiencies of multiple nutrients such as micro and secondary nutrients like Zinc, Boron, Sulphur, Iron and copper which are reducing the responses to added N,P,K nutrients also.
• Project is proposed to supply deficient micronutrients on 70% subsidy and create awareness of these deficiencies in soils beside N,P,K
S. No
Name of the input
Area proposed to be covered in Lakh Ha
2014-15 2015-16 2016-17 2017-18 2018-19 Total
1 Zinc Sulphate 6.79 21.90 9.00 21.90 9.00 68.59
2 Borax 6.36 20.54 2.00 20.54 2.00 51.44
3 Gypsum 2.55 9.92 12.00 9.92 12.00 46.39
Total Ha 15.70 52.36 23.00 52.36 23.00 166.42
FIVE YEAR ACTION PLAN:

14
3. Soil Health Mapping and Piloting Innovative Knowledge Sharing Systems for Increasing Productivity of Agriculture in Andhra Pradesh
• Soil Mapping is critical as soil test based nutrient management practices are used as an entry point for bridging yield gaps between current and achievable potential yields in the state.
• Hence Dept of Agriculture in collaboration with ICRISAT has taken up this project to disseminate soil health information by preparing soil health atlas using GIS interpolation, wall writings, through internet and develop soil test based recommendations for all major crops mandal wise.
• Proposed under RKVY over a period of 3 years with an outlay of Rs.10.60 crores.

15
Expected Outcomes• Increase awareness among the farmers about the soil health
to enable sustainability of agriculture production.• Reduced use of Nitrogen and phosphatic fertilizers through
balanced fertilizer applications based on soil test recommendations.
• Increase awareness of micronutrient deficiencies in major crops.
• A baseline status maps of soil fertility which will be a guide for developing soil health status and future monitoring of soil health status.
• To make available mandal-wise soil test-based recommendations for major crops in the state for improving the production and productivity.

16