Embed Size (px)
Citation preview
Growth, Characterisation and Modelling of Novel Magnetic Thin Films for Engineering Applications
Arun Raghunathan
Wolfson Centre for Magnetics School of Engineering
Cardiff University
A thesis submitted for the degree of
Doctor o f Philosophy
October 2010
UMI Number: U585400
All rights reserved
INFORMATION TO ALL USERS The quality of this reproduction is dependent upon the quality of the copy submitted.
In the unlikely event that the author did not send a complete manuscript and there are missing pages, these will be noted. Also, if material had to be removed,
a note will indicate the deletion.
Dissertation Publishing
UMI U585400Published by ProQuest LLC 2013. Copyright in the Dissertation held by the Author.
Microform Edition © ProQuest LLC.All rights reserved. This work is protected against
unauthorized copying under Title 17, United States Code.
ProQuest LLC 789 East Eisenhower Parkway
P.O. Box 1346 Ann Arbor, Ml 48106-1346
O Rnml \ . \ i ■ ' M ! ' '
I ’ K i i
Gv ROW
DECLARATION
This work has not previously been accepted in substance for any degree and is not concurrently submitted in candidature for any degree.
Signed: - ^ ^ ^ ^ ^ ^ J ^ - ^ c a n d i d a t e ) Date: 11 October 2010
STATEMENT 1
This thesis is being submitted in partial fulfilment of the requirements for the degree of PhD.
Signed: (candidate) Date: 11 October 2010
STATEMENT 2
This thesis is the result of my own independent work /investigation, except where otherwise stated. Other sources are acknowledged by explicit references.
Signed: e ( c a n d i d a t e ) Date: 11 October 2010
STATEMENT 3
I hereby give consent for my thesis, if accepted, to be available for photocopying and for inter-library loan, and for the title and summary to be made available to outside organisations.
Signed: ^ ^ ^ ^ ^ - - ^ ( c a n d i d a t e ) Date: 11 October 2010
Acknowledgements
I would like to thank Prof. David Jiles for providing me with an
opportunity to pursue research at Cardiff University and for his
continuous support at every stage of this research.
I am grateful to Dr John Snyder and Dr Yevgen Melikhov for their
invaluable guidance throughout this study w ithout which this re
search would not have been complete.
I would like to personally thank Prof. Anil Prabhakar of IIT Madras
who always believed in my abilities and introduced me to Prof.
Jiles.
My sincere gratitude to Mr Paul Farrugia and his technical team
in the electrical workshop who always helped me with debugging
and fixing the faulty equipments (usual routine!). I appreciate the
efforts of Mr Steve Mead and his team in the mechanical workshop
for helping me with the design and development of the bender in a
very short time.
I am grateful to Mr Pete Fisher and Mr Tony Oldroyd of School
of Earth Sciences for letting me use their SEM and XRD facilities,
without which the analysis part of this research would have been
difficult.
I am thankful to all Wolf son Centre (if I may say so!) colleagues for
many insightful discussions and to all my friends who directly or
indirectly played a role in the smooth completion of this research.
I also admire and appreciate the kindness and benevolence of engi
neering research office staff (Nicola, Chris, Julie, Rachel, Jeanette...).
I am deeply indebted to and greatly proud of my family who stood
by me and encouraged me to pursue my dreams.
Abstract
Magnetic materials, especially thin films, are being exploited today
in many engineering applications such as magnetic recording heads
and media, magnetic sensors and actuators and even magnetic re
frigeration due to their smaller form factor or to thin film effects
that do not occur in bulk material. Hence there is a need for opti
mised growth of thin films to suit the requirements of applications.
The aim of this research work is two-fold:
1. Growth and characterisation of optimised magnetic thin films
using pulsed-laser deposition and
2. Extension of Jiles-Atherton (JA) theory of hysteresis.
A series of magnetoelastic thin films based on cobalt ferrite were
deposited on SiO2/Si(100) substrates using pulsed-laser deposition
at different substrate temperatures and different reactive oxygen
pressures. The crystal structure, composition, magnetic properties,
microstructure and magnetic domains of cobalt ferrite thin films
were investigated. The optimised growth conditions of polycrys
talline spinel cobalt ferrite thin films were determined from char
acterisation results. The Curie point of the optimised cobalt ferrite
thin film was determined from moment vs. temperature measure
ment. The optimised thin film was magnetically annealed in order
to induce an in-plane uniaxial anisotropy. The magnetostriction of
the optimised sample was determined in the vibrating sample mag
netometer using the inverse measurement technique. A special 3-
point bender was designed and built for this purpose.
The first successful thin film of Gd5Si2Ge2, a magnetocaloric rare
earth intermetallic alloy, was deposited on a polycrystalline AIN
substrate. The crystal structure, composition and magnetic phase
transformation of Gd5Si2Ge2 thin film were investigated. The pre
liminary results are furnished in this thesis.
The JA model of hysteresis was extended to incorporate thermal
dependence of magnetic hysteresis. The extended model was vali
dated against measurements made on substituted cobalt ferrite ma
terial. A functional form of anhysteretic magnetisation was de
rived. The JA theory was also extended to model magnetic two-
phase materials. This proposed model was qualitatively compared
with measured data published in the literature. The JA theory was
applied to magnetoelastic thin films. The cobalt ferrite thin films
deposited on SiO2/Si(100) substrates at different substrate temper
atures and oxygen pressures have been modelled based on JA the
ory and were validated against measurements. This model would
help in understanding the influence of deposition parameters on
properties of thin films. The calculated and measured data were in
excellent agreement.
Contents
Nomenclature xx
1 Introduction 1
1.1 Scope, motivation and contribution................................................ 1
1.2 Organisation of the t h e s i s .............................................................. 3
2 Background 5
2.1 In troduction ...................................................................................... 5
2.2 Magnetoelastic e f fe c t........................................................................ 6
2.2.1 Spinel fe r r i te s .......................................................................... 7
2.3 Magnetocaloric e ffec t........................................................................ 11
2.3.1 Gd5(SixGei_x)4 a lloys.............................................................. 13
2.4 Thin film growth and characterisa tion ......................................... 17
2.5 Pulsed-laser deposition.................................................................... 17
2.5.1 Influence of deposition param eters..................................... 20
2.5.1.1 Target surface ....................................................... 20
2.5.1.2 Laser f lu e n c e ......................................................... 21
2.5.1.3 Laser w a v e le n g th ................................................ 22
vi
CONTENTS
2.5.1.4 Target-to-substrate distance ............................... 24
2.5.1.5 Ambient g a s ........................................................... 25
2.5.1.6 Substrate tem perature............................................ 28
2.5.2 Stress in thin f i l m s ............................................................... 29
2.5.3 Characterisation .................................................................... 29
2.5.3.1 C rystallography..................................................... 30
2.53.2 C om position ........................................................... 31
2.5.3.3 Deposition r a te ........................................................ 31
2.5.3.4 Magnetic h y s te re s is ............................................... 31
2.5.3.5 M agnetostriction..................................................... 33
2.5.3.6 Surface m orphology............................................... 35
2.5.3.7 Magnetic d o m ain s.................................................. 36
2.6 Theory of hysteresis............................................................................ 36
2.7 Sum m ary.............................................................................................. 41
3 Magnetoelastic thin films 42
3.1 In troduction ........................................................................................ 42
3.2 Magnetoelastic thin film s................................................................... 43
3.3 Growth and characterisation of cobalt ferrite f i lm s ...................... 44
3.3.1 Influence of substrate tem p era tu re ..................................... 45
3.3.2 Influence of reactive oxygen ................................................. 53
3.4 Effect of magnetic annea ling ............................................................. 61
3.5 Magnetoelastic m easurem ents.......................................................... 64
3.6 Sum m ary.............................................................................................. 69
CONTENTS
4 Magnetocaloric thin films 70
4.1 In tro d u c tio n ..................................................................................... 70
4.2 Magnetocaloric thin f i l m s .............................................................. 71
4.3 Growth of Gd5(SixGei_x)4 thin f i lm s ............................................ 71
4.4 Deposition te m p e ra tu re ................................................................. 72
4.5 Characterisation of Gd5(SixGei_x)4 thin f i lm s ............................. 73
4.5.1 X-ray diffraction p a t te r n s ..................................................... 73
4.5.2 Scanning electron m icroscopy............................................... 74
4.5.3 Magnetic phase transform ation............................................ 77
4.6 Sum m ary............................................................................................ 80
5 Extensions to Jiles-Atherton theory of hysteresis 82
5.1 In troduction ...................................................................................... 82
5.2 Jiles-Atherton th e o r y ....................................................................... 83
5.3 Thermal dependence of h y s te re s is ............................................... 88
5.3.1 Temperature dependence of microstructural parameters 89
5.3.2 Parameter identification ........................................................ 91
5.3.3 Model v a lid a tio n .................................................................... 92
5.4 Functional form of anhysteretic m a g n e tisa tio n .......................... 97
5.4.1 Anhysteretic m agnetisa tion ................................................. 97
5.4.2 Need for a functional form ................................................. 99
5.4.3 Thermodynamics of the anhysteretic fu n c t io n ................ 99
5.4.4 Derivation of functional f o rm .............................................. 101
5.4.5 Validation of functional f o r m .............................................. 103
5.5 Modelling of magnetic two-phase m ateria ls ....................................108
viii
CONTENTS
5.5.1 The m o d e l.................................................................................. 108
5.5.2 Parameter identification....................................................... 110
5.5.3 Typical examples of magnetic two-phase materials . . . I l l
5.6 Sum m ary............................................................................................. 115
6 Application of Jiles-Atherton theory to thin films 117
6.1 In troduction ....................................................................................... 117
6.2 Thin film hysteresis m o d e ls ................................................................ 118
6.3 JA model for thin f i lm s ..................................................................... 119
6.4 Modelling p ro ce d u re ............................................................................120
6.4.1 Thin films deposited at different substrate temperatures 123
6.4.2 Thin films deposited at different oxygen pressures . . . . 126
6.5 Sum m ary............................................................................................. 129
7 Conclusions and future work 131
7.1 C onc lu sions....................................................................................... 131
7.2 Magnetoelastic thin film s.................................................................. 132
7.2.1 Future w o r k ............................................................................ 133
7.2.2 Magnetocaloric thin f i lm s .................................................... 134
7.2.3 Future w o rk ............................................................................ 135
7.3 M o d e llin g .......................................................................................... 135
7.3.1 Future w o rk ............................................................................ 136
A Derivation of anhysteretic magnetisation (uniaxial anisotropy) 138
B Validation of specific cases 141
B.l Axial anisotropy c a s e ........................................................................ 141
CONTENTS
B.2 Planar anisotropy c a s e .........................................................................142
C List of Publications 143
C.l Peer reviewed jo u rn a ls ..................................................................... 143
C.2 Conference presentations...................................................................... 144
Bibliography 145
List of Figures
2.1 An illustration of a cubic spinel structure [Chikazumi, 1997]. . . 8
2.2 Phase diagram of Gd5(SixGei_x)4 alloys [Pecharsky et al., 2002]. 14
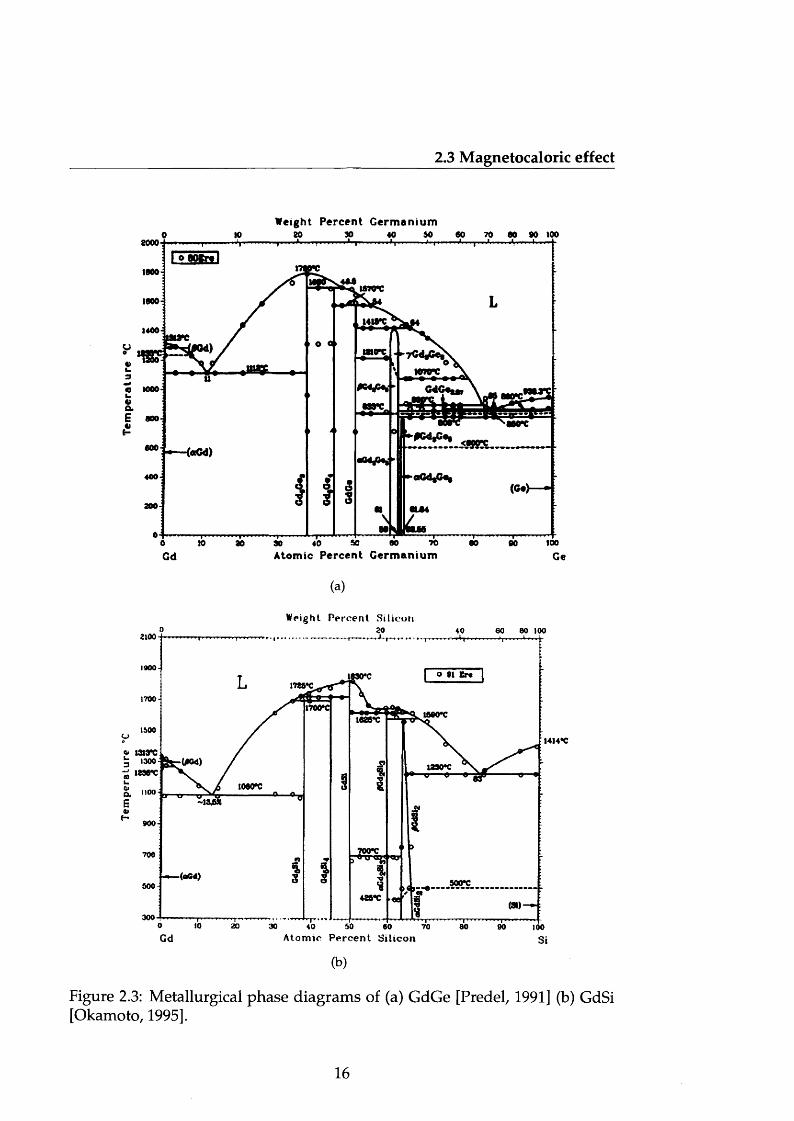
2.3 Metallurgical phase diagrams of (a) GdGe [Predel, 1991] (b) GdSi
[Okamoto, 1995]................................................................................... 16
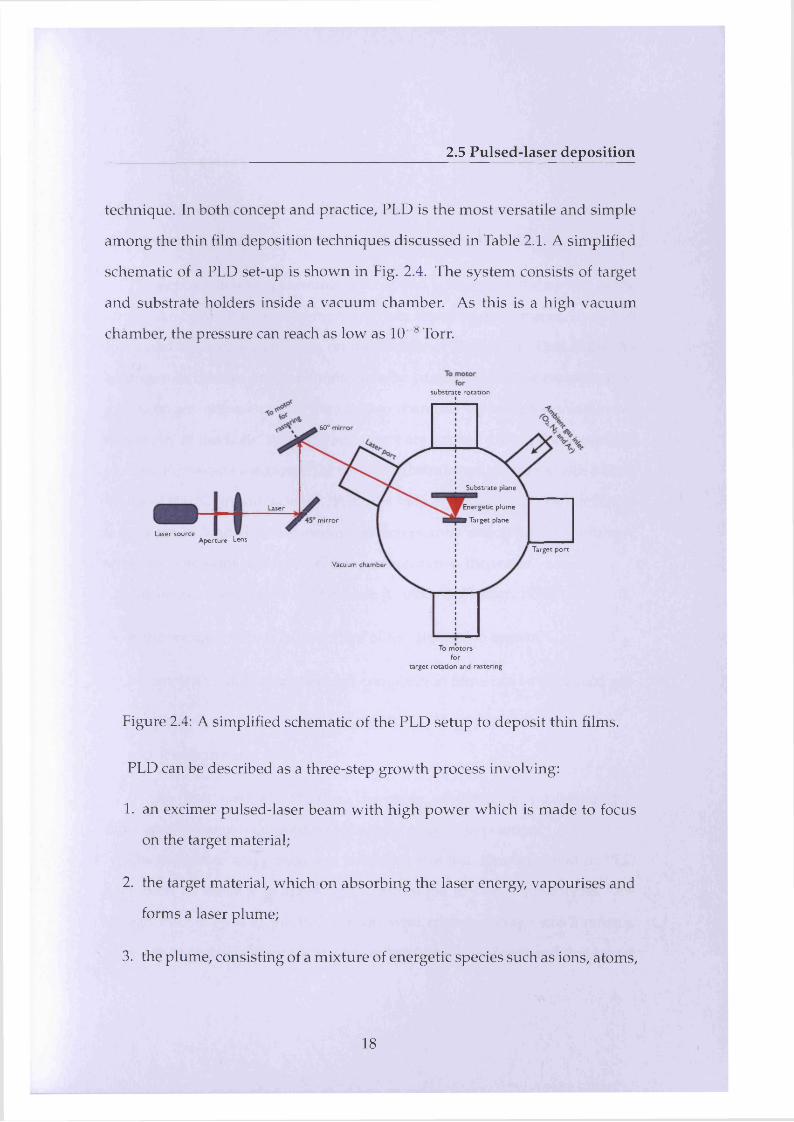
2.4 A simplified schematic of the PLD setup to deposit thin films. . 18
2.5 Scanning electron micrograph of the modified surface of a YBCO
target exposed at 308 nm to 1000 shots/site at a fluence of 5.6
J/cm 2 [Chrisey & Hubler, 1994]........................................................ 21
2.6 SEM images of YBCO (a) target surfaces and (b) the correspond
ing thin films deposited using PLD at different wavelengths (i)
266 nm, (ii) 355 nm, (iii) 533 nm and (iv) 1064 nm [Kautek et al.,
1990]...................................................................................................... 23
LIST OF FIGURES
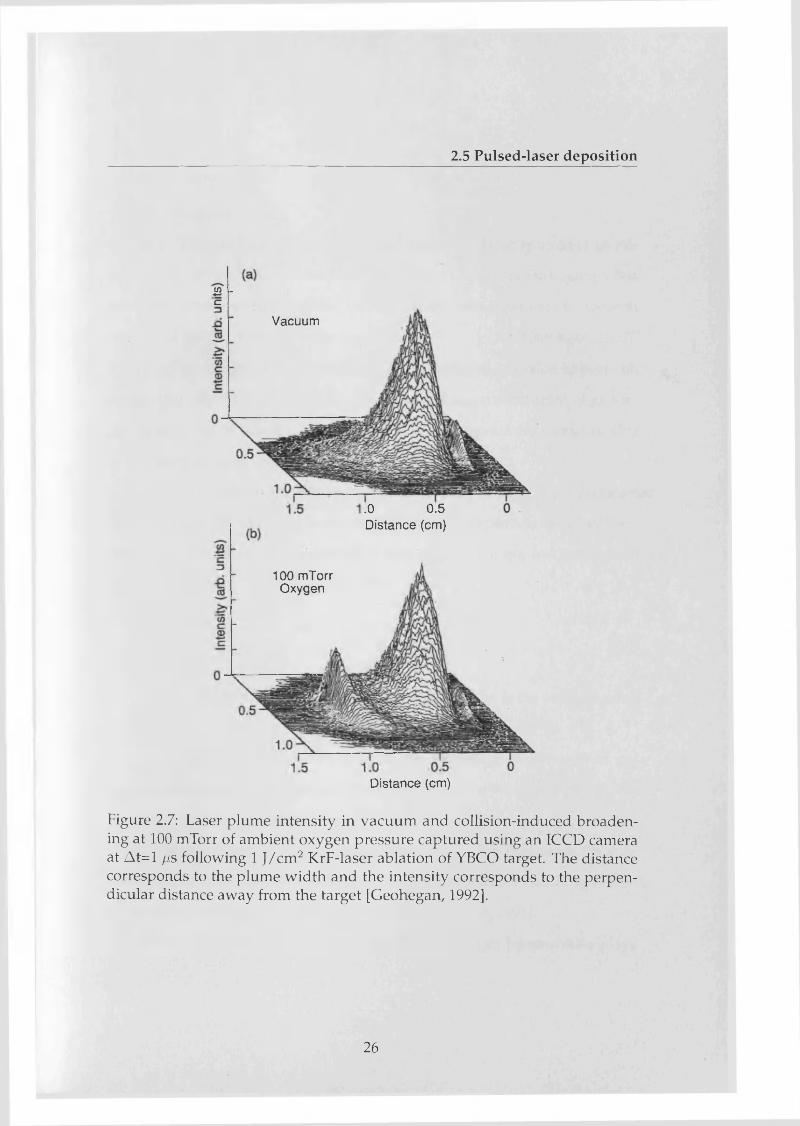
2.7 Laser plume intensity in vacuum and collision-induced broad
ening at 100 mTorr of ambient oxygen pressure captured using
an ICCD camera at At=l fis following 1 J/cm 2 KrF-laser abla
tion of YBCO target. The distance corresponds to the plume
width and the intensity corresponds to the perpendicular dis
tance away from the target [Geohegan, 1992]................................. 26
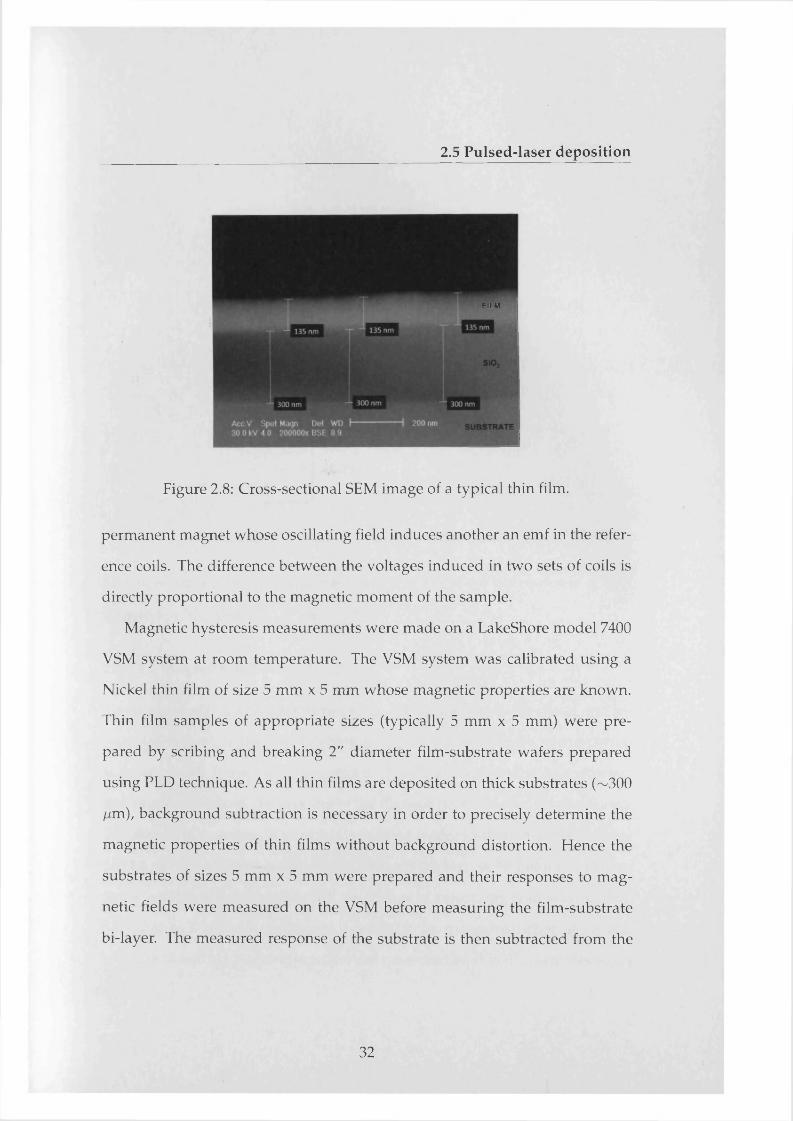
2.8 Cross-sectional SEM image of a typical thin film.......................... 32
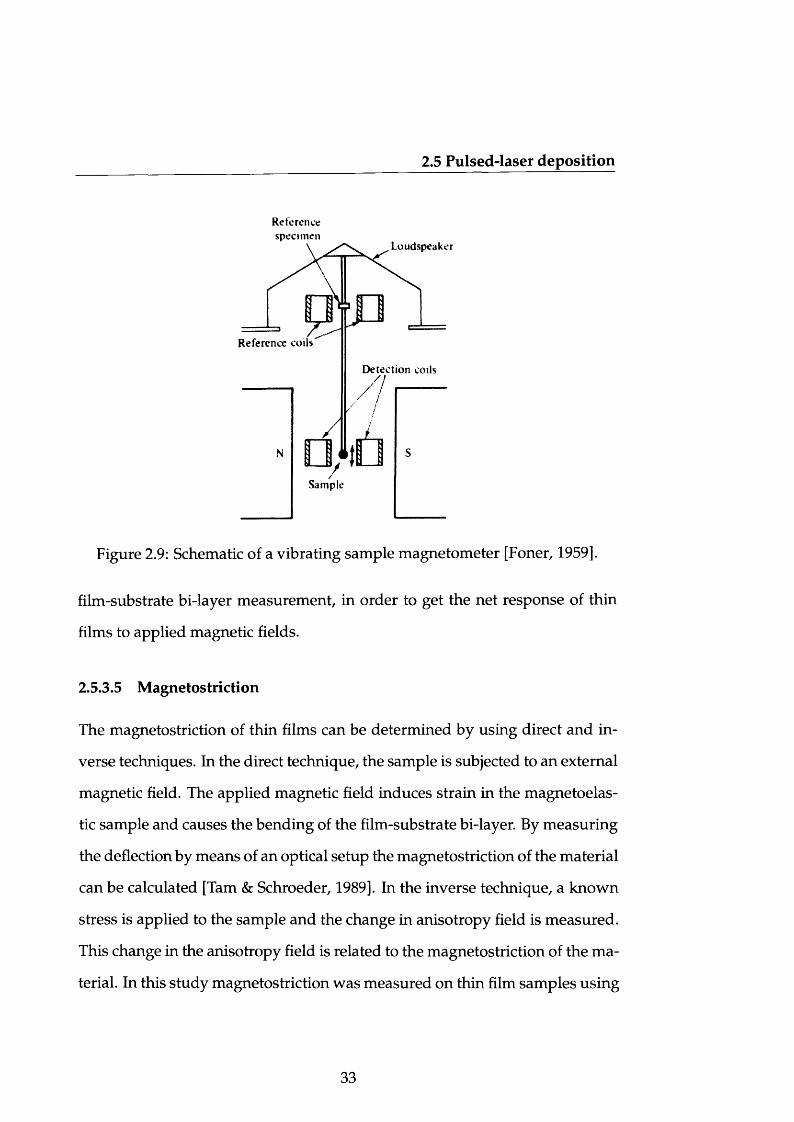
2.9 Schematic of a vibrating sample magnetometer [Foner, 1959]. . 33
2.10 A domain-level schematic of a typical magnetic hysteresis. . . . 38
3.1 XRD powder diffraction patterns of cobalt ferrite thin films de
posited at different substrate temperatures.................................... 46
3.2 (a) In-plane hysteresis curves of cobalt ferrite thin films mea
sured from VSM at room temperature. The magnetisation in
creases with increasing substrate temperature whereas the in
plane coercivity is almost same for all thin films, (b) The per
pendicular hysteresis loops of thin films show the same trend in
magnetisation as in-plane measurements........................................ 47
3.3 (a) Initial magnetisation curves measured from SQUID, (b) The
dependence of coercivity of cobalt ferrite thin films on the depo
sition temperature............................................................................... 48
3.4 The calculated strain due to thermal expansion mismatch be
tween the substrate and film at different substrate temperatures. 49
3.5 The surface morphology of cobalt ferrite thin films seen in AFM. 51
3.6 The grain size of cobalt ferrite films versus substrate temperature. 51
LIST OF FIGURES
3.7 The magnetic domain imaging of cobalt ferrite thin films seen in
MFM..................................................................................................... 52
3.8 The magnetic feature size of cobalt ferrite films versus substrate
temperature......................................................................................... 53
3.9 XRD powder diffraction patterns of cobalt ferrite thin films de
posited at different oxygen pressures.............................................. 54
3.10 Variation of deposition rate with reactive oxygen pressures. . . 56
3.11 (a) In-plane and (b) perpendicular hysteresis curves of cobalt
ferrite thin films deposited at different oxygen pressures mea
sured from VSM at room temperature............................................. 57
3.12 (a) Initial magnetisation curves measured from SQUID magne
tometer. (b) The dependence of coercivity of cobalt ferrite thin
films on the reactive oxygen pressure.............................................. 57
3.13 The surface morphology of cobalt ferrite thin films seen in AFM
for different reactive oxygen pressures............................................ 59
3.14 The grain size of cobalt ferrite films versus reactive oxygen pres
sure........................................................................................................ 59
3.15 The magnetic domain images of cobalt ferrite thin films seen in
MFM for different reactive oxygen pressures................................. 60
3.16 The magnetisation versus temperature of cobalt ferrite thin film
(at 1600 kA /m (mu0H=2 T) applied field) deposited at 250 °C
and 22 mTorr oxygen. The Curie temperature was found to be
at 520 °C using the point of inflection procedure........................... 61
LIST OF FIGURES
3.17 Induced uniaxial anisotropy in cobalt ferrite thin films by mag
netic annealing at 450 °C. Hysteresis loops measured at room
temperature in the plane along (easy) and orthogonal (hard) to
the direction of applied field during magnetic anneal................... 63
3.18 The schematic of a bender assembly designed for VSM to apply
known amount of stress on thin film samples. The strain gauge
was on the film-side and the screw was in contact with the film
while applying compressive stress................................................... 65
3.19 The FEM modelling of the VSM b e n d e r . ....................................... 66
3.20 Influence of compressive stress on cobalt ferrite thin films. . . . 66
4.1 The amount of orthorhombic phase versus heating and cooling
in Gd5Si2Ge2- The 400 °C point during heating and cooling is
the same experimental point [Mozharivskyj et al., 2005].............. 73
4.2 The 6-26 XRD pattern of Gd5Si2.0sGex.92 thin film deposited at
285 °C on AIN substrate..................................................................... 75
4.3 The 6-29 patterns of secondary phases of Gd-Si-Ge calculated
using Rietveld refinement method. The distinct peaks of the
secondary phases (circled peaks) are not found in the measured
pattern................................................................................................... 76
4.4 The SEM image of Gd5Si2.0sGe1.92 film deposited on AIN sub
strate at 285 °C. The average size of a grain is ~1.5 /im ................ 77
4.5 Magnetisation versus temperature curve of Gd5Si2.0sGe1.92 thin
film deposited on AIN substrate at 285 °C (a) Measured and (b)
Sigmoidal fit of the measured data.................................................. 78
xiv
LIST OF FIGURES
5.1 Origin of irreversible and reversible magnetisation. 85
5.2 Typical hysteresis curve showing the magnetic response of a
material to the applied magnetic field. The five microstructural
parameters influence the respective specified regions of the hys-
5.3 (a) The measured spontaneous magnetisation of a substituted
cobalt ferrite at different temperatures, (b) The calculated tem
perature dependence of spontaneous magnetisation shows that
at the Curie temperature (550 K) there is a transition from ferri-
5.4 (a) The pinning parameter calculated from the model equation
up to the Curie temperature, (b) The measured coercive field is
compared with the coercive field calculated from the model and
the pinning parameter. It is clear from the figure that, in soft
magnetic materials, the pinning parameter can be approximated
to coercivity........................................................................................ 94
5.5 (a) and (b) show the temperature dependence of domain cou
pling and reversibility parameter respectively when the domain
density was assumed to be constant with temperature. Although
both the parameters increase monotonically with increasing tem
perature, reversibility parameter has an upper limit of 1............. 94
teresis curve 87
magnetic to paramagnetic state. 93
xv
LIST OF FIGURES
5.6 (a) The exponential decrease of domain density with tempera
ture. (b) The temperature dependence of domain coupling and
reversibility parameter when the domain density decays expo
nentially with temperature. The magnetic domain interactions
drop exponentially with temperature, same as the domain density. 95
5.7 The comparison between measured hysteresis loops and calcu
lated loops at 10 K, 200 K, and 400 K. (a) The domain density
was assumed to be independent of temperature (Case 1). (b)
The domain density was exponentially decreasing with increas
ing temperature (Case 2).................................................................... 96
5.8 (a) A typical anhysteretic magnetisation curve of isotropic ma
terial modelled using Langevin function, (b) The corresponding
hysteresis curve obtained by combining the anhysteretic with
the loss fa c to r ..................................................................................... 98
5.9 The spherical coordinate system representation of magnetic vec
tors. The applied magnetic field is along z-direction, the anisotropy
vector Ku and the moment m make angles 7 and 9 with the ap
plied field respectively...................................................................... 101
5.10 Multi-dimensional representation of anisotropy. The 1-D case
represents easy axis, 2-D case represents easy plane and 3-D case
represents isotropy where there is no preferred orientation. . . . 104
xvi
LIST OF FIGURES
5.11 The plots show the anhysteretic magnetisation function for dif
ferent anisotropies. The curves were calculated from the gen
eralised functional form. The (K u > 0, 7 =0) represent uniax
ial anisotropy with applied field along the easy axis, (K u < 0,
7=f) represents planar anisotropy with applied field in the easy
plane, Ku=0 represents isotropy, and (Ku > 0, 7 =f) represents
the hard direction anhysteretic magnetisation when the applied
field is orthogonal to the uniaxial easy axis........................................ 107
5.12 (a) Typical magnetic two-phase hysteresis behaviour. The mate
rial exhibits a low-field and a high-field magnetic phase below
and above an exchange field, Hex. (b) Boltzmann function that
describes both step-like and smooth transition by variation of
parameter A H ..........................................................................................110
5.13 (a) Two-phase hysteresis behaviour calculated using JA theory
with variable hysteresis parameters, (b) The measured hystere
sis behaviour of a CoPt based hard-soft bi-layer thin films on
Si02/Si (reproduced from [Alexandrakis et al., 2008]). The hys
teresis loop of single hard layer (in white squares) is given for
comparison........................................................................................... 113
5.14 (a) Two-phase hysteresis behaviour calculated using JA theory
with variable hysteresis parameters, (b) The measured hystere
sis behaviour of a FePt/FeNi based magnetic micro-wires (re
produced from [Torrejon et al., 2008])............................................. 114
xvii
LIST OF FIGURES
6.1 The variation of calculated JA parameters of cobalt ferrite thin
films with substrate temperature..................................................... 124
6.2 Comparison between measured in-plane hysteresis loops of cobalt
ferrite thin films deposited at different substrate temperatures
and calculated loops based on the JA model......................................125
6.3 The variation of calculated JA parameters of cobalt ferrite thin
films with reactive oxygen pressure.....................................................127
6.4 Comparison between measured in-plane hysteresis loops of cobalt
ferrite thin films deposited at different oxygen pressures and
calculated loops based on the JA model.......................................... 128
xviii
List of Tables
2.1 Thin film deposition techniques based on P V D .......................... 17
2.2 Thin film characterisation techniques used in this study. 30
2.3 Models of magnetic hysteresis [Liorzou et al., 2000]..................... 39
3.1 Effect of magnetic annealing on coercivity ................................... 64
5.1 The boundary conditions for the two cases of magnetic two-
phase materials discussed here. The domain coupling and re
versibility parameters were assumed to be constant in all the
cases, as it seemed to have no considerable effect on the result
ing loops............................................................................................... 112
xix
Nomenclature
Greek Symbols
a Domain coupling
/? Critical exponent
Xan Anhysteretic susceptibility
Xin Initial susceptibility
e Mechanical strain
7 Angle between magnetic field and unique axis
A Magnetostriction
0 Angle between magnetic moment and unique axis
6 Angle between magnetic moment and applied field
Other Symbols
ATad Adiabatic temperature change
a Domain density
xx
NOMENCLATURE
c Reversibility parameter
He Effective magnetic field
Hk Anisotropy field
Hex Exchange field
k Pinning parameter
ks Boltzmann's constant
K u Anisotropy constant
m Magnetic moment
Ms Spontaneous magnetisation
Man Anhysteretic magnetisation
Mirr Irreversible magnetisation
A£rev Reversible magnetisation
N Number of independent magnetic moments
T Temperature
Tc Curie temperature
V Poisson's ratio
Y Young's modulus
Z Total partition function
xxi
NOMENCLATURE
Acronyms
AF Antiferromagnetic
AFM Atomic force microscopy
APB Antiphase boundary
CVD Chemical vapour deposition
EDX Energy dispersive X-ray spectroscopy
FM Ferromagnetic
ICCD Intensified change-coupled device
JA Jiles-Atherton
MFM Magnetic force microscopy
PLD Pulsed-laser deposition
PM Paramagnetic
PVD Physical vapour deposition
RMSE Root mean square error
SEM Scanning electron microscopy
SQUID Superconducting Quantum Interference Device
VSM Vibrating sample magnetometer
XRD X-ray diffraction
xxii
Chapter 1
Introduction
1.1 Scope, motivation and contribution
Magnetic materials have been applied to solve many engineering challenges.
The number of applications that exploit the properties of magnetic materials
is constantly increasing. Magnetic materials in the form of bulk, thin films,
nanowires, and ferrofluids have revolutionised the field of magnetism with
important applications such as magnetic recording, data storage, sensors, ac
tuators and magnetic authentication. Magnetoelastic and magnetocaloric ma
terials among others are being thoroughly investigated as they are promising
candidates for tackling today's sensing (magnetostriction) and energy (mag
netic refrigeration) needs respectively.
Ferrites are a class of materials discovered in the early 1900s, that are ap
plied in high frequency applications [Snoek, 1936]. Cobalt ferrite, a member of
the ferrites family has been investigated in recent years due to its magnetoe-
lasticity, a property that can be applied in sensors [Smit & Wijn, 1959]. Further-
1
1.1 Scope, motivation and contribution
more, cobalt ferrite was shown to be adaptable enough that its properties can
be tailored to meet the requirements of different applications [Lo et al., 2005;
Song, 2007].
Gd5Si2Ge2, a rare earth intermetallic alloy which exhibits magnetocaloric
effect can be a replacement for conventional refrigeration [Pecharsky & Gschnei-
dner Jr., 1997a]. A magnetic refrigerator built using this material was found to
be twice as efficient as conventional refrigerators. The Carnot efficiency was
found to be ~60% in magnetic refrigerators, whereas it is only ~30% in con
ventional liquid-vapour refrigerators.
In order to build complete working models to demonstrate the capabilities
of magnetoelastic and magnetocaloric materials, there is a need to produce
them in thin film forms which are ideal for device applications. Hence this
thesis aims at
• growing magnetoelastic and magnetocaloric thin films on suitable sub
strates,
• investigating the properties of these thin films,
• studying the influence of deposition conditions on properties of thin films,
• optimising the growth conditions based on the measured properties,
• developing non-destructive techniques for characterising thin films and
• modelling of magnetic properties of magnetoelastic thin films using Jiles-
Atherton theory of hysteresis.
2
1.2 Organisation of the thesis
This thesis covers three important areas in the material science and engi
neering of thin films: preparation, characterisation and modelling that give
insights and instigate new ideas that will further widen the scope.
1.2 Organisation of the thesis
Chapter 2 gives the overall background of this research work. Magnetoelas
tic and magnetocaloric effects and materials are discussed in detail. The
pulsed-laser deposition technique and the influence of deposition con
ditions on thin film growth are detailed. An introduction to analytical
models of hysteresis is also given.
Chapter 3 elaborates the growth process and characterisation of cobalt ferrite
thin films on S i02/Si substrates using pulsed-laser deposition. Two se
ries of films: one at different substrate temperatures and the other at
different oxygen pressures, have been studied. The origin of perpendic
ular anisotropy in these thin film structures is investigated. Magnetic an
nealing of cobalt ferrite thin films to induce in-plane uniaxial anisotropy
was studied. The results of magnetostriction measurements on uniaxial
anisotropic thin films based on inverse technique are reported.
Chapter 4 presents the first successful production of Gd5Si2Ge2 thin films, a
magnetocaloric rare earth intermetallic alloy suitable for magnetic refrig
eration applications. The magnetic phase transformation in this material
can be seen from the magnetic measurements and the results are fur
nished.
3
1.2 Organisation of the thesis
Chapter 5 details the analytical modelling of magnetic properties of materi
als based on the Jiles-Atherton model of hysteresis. The extensions to
the Jiles-Atherton theory which were developed as part of this research
work are presented. A comparison between the calculated and measured
thermal dependence of hysteresis in substituted cobalt ferrite material is
given. The functional form of anhysteretic magnetisation is derived. The
procedure to model magnetic two-phase materials using Jiles-Atherton
theory is described and the results are explained qualitatively.
Chapter 6 discusses the application of Jiles-Atherton theory to cobalt ferrite
thin films. The effects of deposition parameters (substrate temperature
and oxygen pressure) on magnetic properties of cobalt ferrite thin films
are modelled. The variations of Jiles-Atherton parameters with deposi
tion conditions are studied and the results are furnished.
Chapter 7 lists the conclusions that arise from this research work. It also sug
gests directions for future work in several areas of magnetic materials
and modelling on which this thesis was conducted.
4
Chapter 2
Background
2.1 Introduction
This chapter gives an overall background of the work that was carried out as
a part of this research. Section 2.2 introduces the magnetoelastic effect and the
class of materials that exhibit this phenomenon. The origin of magnetoelastic-
ity and previous work on magnetoelastic materials are discussed in the sub
sequent subsections. Section 2.3 explains the magnetocaloric effect and a rare
earth intermetallic alloy that exhibits this effect. Section 2.4 aims at detailed
discussions on thin film growth procedures and the techniques to characterise
them. The pulsed-laser deposition of thin films and the influence of growth pa
rameters on thin film properties are explained in detail in Section 2.5. Finally,
Section 2.6 describes the origin of hysteresis and various models to predict
hysteretic behaviour in magnetic materials.
5
2.2 Magnetoelastic effect
2.2 Magnetoelastic effect
In 1842 Joule observed a change in length of a Nickel sample when subjected
to a magnetic field [Joule, 1842]. The reason is, in Nickel, the intensity and
orientation of magnetic field causes variations in interatomic distances. This is
known as the direct magnetoelastic effect. Although this effect can be found in
almost all magnetic materials, only a few show large enough coupling between
their magnetic and mechanical properties to make them suitable to be applied
as sensors or actuators.
Ferrites are a class of materials developed mainly for high frequency appli
cations as eddy current losses are lower than conventional metallic ferromag
netic materials. Hence they have been investigated for high frequency appli
cations [Snoek, 1936,1948]. They are basically ferrimagnetic oxides where the
magnetic ions whose ionic radii are smaller than oxygen are confined to par
ticular interstitial crystallographic sites within the lattice. The super-exchange
coupling, an interaction between the magnetic ions through the oxygen atom
situated between them, is the cause of ferrimagnetic ordering in these ma
terials. Hence oxygen deficient ferrites are likely to show lower saturation
magnetisation due to weaker super-exchange coupling than those that have
sufficient oxygen to help achieve a ferrimagnetic ordered state. Ferrites can
be broadly classified based on their crystallographic structures: spinel, per-
ovskite, garnet and hexa ferrites.
Cobalt ferrite is a magnetoelastic material that belongs to the class of spinel
ferrites. This material was not extensively studied until recently. However,
lately, there has been a tremendous increase in the research on cobalt ferrite
6
2.2 Magnetoelastic effect
due to their magnetoelastic properties which can be utilised in sensor applica
tions. As an important part of this study is based on thin film growth and char
acterisation of cobalt ferrite, a major part of this chapter is focused on spinel
ferrites.
2.2.1 Spinel ferrites
Spinel ferrites are a class of ferrimagnetic oxide materials with chemical for
mula M0 .Fe203 or more generally MN20 4, where M represents one of the
metal ions with divalent state or a combination of metal ions with an average
valence state of two and N represents trivalent metal ions or a combination
(often all or partially Fe3+). They possess the crystal structure of the mineral
spinel MgAl20 4 and hence the name 'spinel ferrites'. The smallest cubic cell of
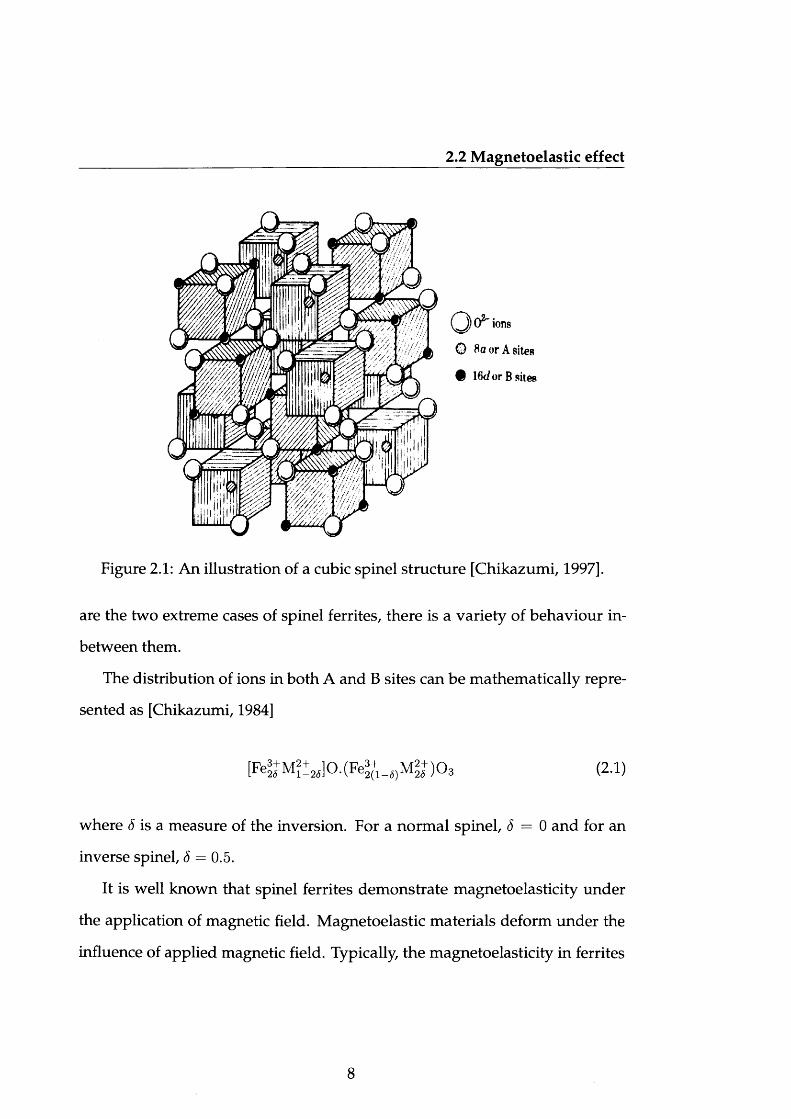
spinel lattice has eight molecules of MN20 4 in which 32 oxygen atoms form a
face centred cubic (fee) lattice. Two types of interstitial sites occur in this cubic
lattice: 8-tetrahedral (A) and 16-octahedral (B). The 8 M2+ and 16 Fe3+ ions are
distributed among A and B sites. The moments of A and B sites are anitpar-
allel to each other. The cubic cell is shown in Fig. 2.1. The octants with their
occupied metal ions and oxygen ions are represented in the schematic. The
structure of metal ions is the same in all diagonally opposite octants.
Spinel ferrites can be classified as normal and inverse, depending on the
site occupancy of the M2+ and Fe3+ ions. In normal spinels, all the M2+ ions are
located at the A sites and all the Fe3+ ions are located at the B sites whereas, in
the inverse spinel structure, all M2+ ions are located at the B sites and Fe3+ ions
are equally distributed between A and B sites. Although normal and inverse
7
2.2 Magnetoelastic effect
Q ) Onions
Q 8a or A sites
# 16<i or B sites
Figure 2.1: An illustration of a cubic spinel structure [Chikazumi, 1997].
are the two extreme cases of spinel ferrites, there is a variety of behaviour in-
between them.
The distribution of ions in both A and B sites can be mathematically repre
sented as [Chikazumi, 1984]
[F e ^ M ^ ]0 .(F e ^ _ {)M ^ ) 0 3 (2.1)
where S is a measure of the inversion. For a normal spinel, <5 = 0 and for an
inverse spinel, <5 = 0.5.
It is well known that spinel ferrites demonstrate magnetoelasticity under
the application of magnetic field. Magnetoelastic materials deform under the
influence of applied magnetic field. Typically, the magnetoelasticity in ferrites
8
2.2 Magnetoelastic effect
is very small, but there are a few exceptions (most notably cobalt-containing
ferrites). The magnetoelastic coupling is influenced by various factors: elec
tron states, crystallographic ordering, oxidation states and stoichiometry. Hence
the interpretation of magnetoelasticity in spinel ferrites is a complex task. Tsuya
has thoroughly studied the microscopic origin of magnetoelasticity in spinel
ferrites [Tsuya, 1958]. Spinel ferrites have been well-studied and a review of
their properties can be found in [du Tremolet de Lacheisserie, 1993].
Cobalt ferrite, among other spinel ferrites has partially inverse spinel struc
ture and possesses high magnetoelastic coupling (of the order of 10~4) [Weil,
1952]. This coupling was later found to vary with the heat treatment [Gumen,
1966], anisotropy and composition [Belov et al., 1989]. The anisotropy energy
of cobalt ferrite is very large compared with other spinel ferrites and its easy
axes of magnetisation lie in the [100] directions.
The source of anisotropy energy in ferrites was calculated by Yosida and
Tachiki [Yosida & Tachiki, 1957]. It was concluded that the major part of
anisotropy energy of cobalt ferrite arises from Co2+ ions in the B site, whereas
the anisotropy energy of nickel ferrite comes from Fe3+ ions and the anisotropy
energy of magnetite comes from Fe2+ ions in the B sites. It was also reported
that substituting cobalt for the divalent metallic ions in ferrites changes the
easy axis direction from [111] to [100] [Slonczewski, 1958]. Theoretical inves
tigations of the magnetic anisotropy of ferrites have also been carried out by
Wolf [Wolf, 1957] and Slonczewski [Slonczewski, 1958].
Studies were carried out to improve magnetic and magnetoelastic proper
ties of cobalt ferrite by cation substitutions. The net magnetic moment in fer
rites is the difference in magnetic moments between the B and A sublattices.
9
2.2 Magnetoelastic effect
Hence by substituting a non-magnetic cation which has A site preference, the
net magnetic moment of the material can be increased. However, this also
changes the exchange coupling. On the other hand, by substituting a cation
onto the B site, the net magnetic moment can be varied (mainly decreased)
with less change in the exchange coupling. In substituted ferrites, in order to
achieve higher sensitivity, i.e. change in magnetostriction with applied field
, anisotropy should be made to decrease faster than magnetostriction.
The effects of substituting cations such as Mn3+, Cr3+, Ge4+, and Ga3+ in
cobalt ferrite were investigated by Song [Song, 2007]. Subsequently the tem
perature dependence and anisotropy of Ge4+ and Ga3+ substituted cobalt fer
rites were measured by Ranvah et al. [Ranvah et al., 2008, 2009a]. Recently,
Al3+ has been substituted in cobalt ferrite and its temperature dependent mag
netic properties have been studied [Ranvah et al., 2009b]. The above investi
gations showed that of all other cations, the substitution of Ge4+ cation was
effective. The Ge4+ substituted cobalt ferrite has reduced anisotropy and coer-
civity while it also showed an increased sensitivity, i.e. the strain derivative.
Some magnetic materials, when heat treated in the presence of a magnetic
field are known to develop a uniaxial magnetic anisotropy. This process is
widely known today as magnetic annealing. In certain classes of materials
(including cobalt ferrite), this is thought to take place due to directional or
der [Cullity & Graham, 2009]. In 1933, Kato and Takei showed that the mixed
oxides of cobalt and iron respond to heat treatments in the presence of a mag
netic field [Kato & Takei, 1933]. A detailed study of magnetic annealing of fer
rites was made by Bozorth et al. [Bozorth et al., 1955]. The magnetomechanical
properties of cobalt ferrite were found to improve with magnetic annealing. It
10
2.3 Magnetocaloric effect
was shown by Lo et al. that the magnetostriction and the strain derivative im
proved in bulk cobalt ferrite after magnetically annealing at 300 °C for 36 hrs
in the presence of a magnetic field of ~318 kA /m (4 kOe) [Lo et al., 2005].
The exceptional magnetic and magnetoelastic properties of cobalt ferrite
and its derivatives in bulk form and the ability to tailor the magnetic and mag
netoelastic characteristics to suit the requirements have sparked much research
interest in cobalt ferrite and shown its potential for a wide range of applica
tions. Researchers have been able to reproduce some of these qualities of bulk
cobalt ferrite in thin film form. Chapter 3 of this thesis explains the growth pro
cedure and characterisation of cobalt ferrite thin films using pulsed-laser de
position (PLD) and compares the results, where available, with its bulk form.
2.3 Magnetocaloric effect
The magnetocaloric effect is a phenomenon that couples magnetic and ther
modynamic processes in a material where a reversible change in temperature
is caused by a changing magnetic field. This is also known as adiabatic de
magnetisation. The effect was first observed by the German physicist War
burg [Warburg, 1881] in pure iron and the fundamental principle was explained
later [Debye, 1926; Giauque, 1927]. Although most ferromagnetic materials ex
hibit a change in temperature under the influence of magnetic field, the mag
netocaloric effect in most materials is not well-pronounced enough for appli
cations.
The magnetocaloric effect can be used for cooling and the magnetocaloric
refrigeration cycle can be described as:
11
2.3 Magnetocaloric effect
• Increase in the temperature of magnetocaloric materials under the influ
ence of increasing magnetic field in an adiabatic condition.
• Releasing the generated heat by means of natural or forced convection of
air or any fluid.
• Removal of the external magnetic field adiabatically when the material is
at room temperature reduces the temperature of the material.
• The material then extracts heat from the region to be cooled, thereby cool
ing it.
The magnetocaloric materials can be broadly divided into three categories
based on the temperature range at which they exhibit the magnetocaloric ef
fect:
• low temperature (~10 - 80 K),
• intermediate temperature (80 - 250 K) and
• near room temperature.
Pure rare earth metals such as neodymium (Nd), erbium (Er) and thul-
lium (Tm) exhibit magnetocaloric effect in the low temperature range as they
achieve magnetic ordering at low temperatures. The magnetocaloric effect in
these materials was found to be, for e.g. in Nd, the adiabatic temperature
change is only A Tad « 2.5 K at T = 10 K for a 8000 kA /m (/i0H=10 T) increase
in magnetic field. This is due to the difficulty in magnetising them in a mag
netic field [Zimm et al., 1989,1990].
12
2.3 Magnetocaloric effect
The magnetocaloric effect in the intermediate temperatures is not well-
studied since there are not many applications in this temperature range of 80
- 250 K. Benford found that pure dysprosium (Dy) with A Tad ~ 12 K at T
~ 180 K for a 5600 kA /m (//0H=7 T) increase in magnetic field, is one of the
best magnetocaloric materials in this range with a field dependence of ~1.7
K /T [Benford, 1979].
2.3.1 Gd5(SixGei_ x )4 alloys
The near room temperature magnetocaloric effect has been thoroughly inves
tigated recently due to the possibility of magnetic refrigeration applications.
Gadolinium (Gd) is a preferred refrigerant material near room temperature as
its magnetic ordering occurs at Tc = 294 K. Hence Gd and its alloys have been
extensively studied. At Tc, a change in adiabatic temperature of 20 K can be
achieved in Gd for a magnetic field change of 8000 kA /m ( / i 0 H = 1 0 T) with a
field dependence of 2 K /T [Dan'kov et al., 1998]. Intermetallic compounds,
such as Y2Fei7 and Nd2Fei7, whose magnetic ordering is also near room tem
perature were shown to exhibit lower magnetocaloric effect than Gd until the
discovery of giant magnetocaloric effect in Gd5(SixGei_x)4 alloys [Pecharsky &
Gschneidner Jr., 1997a]. The adiabatic temperature change in these intermetal
lic alloys was found to be at least 30% higher than that of Gd and the field
dependence was ~5 K/T.
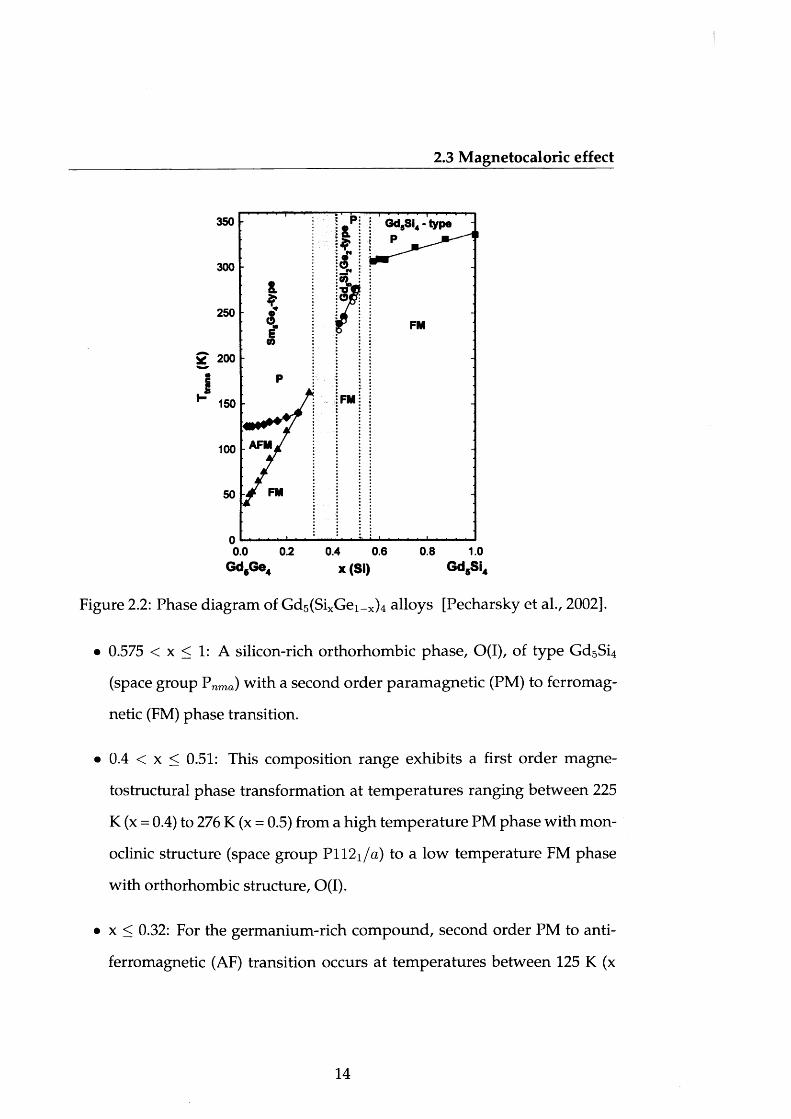
Pecharsky and Gschneidner published the phase diagram of Gd5(SixGei_x)4
alloys at zero field [Pecharsky et al., 2002]. The phase diagram shown in Fig. 2.2
has three different ranges of varying composition:
13
2.3 Magnetocaloric effect
350 Gd5Si4 - type
300
250FM
FM150
AFM100
FM
0.2 0.4 0.6 0.8 1.00.0Gd6Ge4 x (Si) Gd5Si4
Figure 2.2: Phase diagram of Gd5(SixGei_x)4 alloys [Pecharsky et al., 2002].
• 0.575 < x < 1: A silicon-rich orthorhombic phase, 0(1), of type GdsSi4
(space group Pnma) with a second order paramagnetic (PM) to ferromag
netic (FM) phase transition.
• 0.4 < x < 0.51: This composition range exhibits a first order magne-
tostructural phase transformation at tem peratures ranging between 225
K (x = 0.4) to 276 K (x = 0.5) from a high temperature PM phase with mon
oclinic structure (space group P112i/a) to a low temperature FM phase
with orthorhombic structure, O(I).
• x < 0.32: For the germanium-rich compound, second order PM to anti
ferromagnetic (AF) transition occurs at temperatures between 125 K (x
14
2.3 Magnetocaloric effect
= 0) and 135 K (x = 0.2).The AF-FM transition occurs simultaneously
with a first-order structural transformation from a high-temperature or
thorhombic phase, O(II), of type Sm5Ge4 (space group Pnma) to the low-
temperature 0(1) phase. It was also shown that in the range 0.24 < x <
0.32 the second order PM-AF transition disappears leading to the coexis
tence of O(II) and 0(1) phases [Pecharsky & Gschneidner Jr., 1997b].
The stabilisation of crystallographic structures which influence the magne
tocaloric effect in Gd5(SixGei_x)4 alloys is quite complex. It depends mainly on
the heat treatments of the samples and the purity of the components [Pecharsky
et al., 2003]. A detailed review of the high temperature heat treatments on
Gd5Si2Ge2 can be found in Ref. [Mozharivskyj et al., 2005].
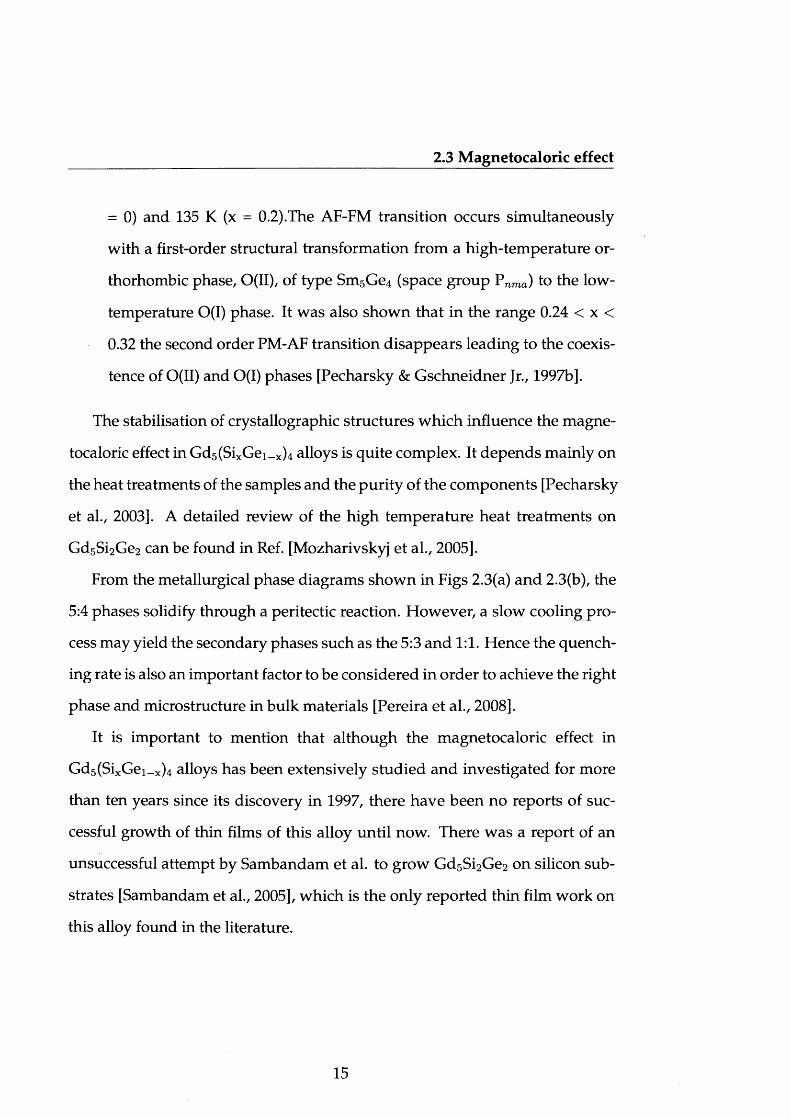
From the metallurgical phase diagrams shown in Figs 2.3(a) and 2.3(b), the
5:4 phases solidify through a peritectic reaction. However, a slow cooling pro
cess may yield the secondary phases such as the 5:3 and 1:1. Hence the quench
ing rate is also an important factor to be considered in order to achieve the right
phase and microstructure in bulk materials [Pereira et al., 2008].
It is important to mention that although the magnetocaloric effect in
Gd5(SixGei_x)4 alloys has been extensively studied and investigated for more
than ten years since its discovery in 1997, there have been no reports of suc
cessful growth of thin films of this alloy until now. There was a report of an
unsuccessful attempt by Sambandam et al. to grow Gd5Si2Ge2 on silicon sub
strates [Sambandam et al., 2005], which is the only reported thin film work on
this alloy found in the literature.
15
Tem
pera
ture
6C
Tem
pera
ture
2.3 Magnetocaloric effect
Weight Percent Germanium0 10 20 30 40 30 60 70 80 90 100
2000 i - . ............ I ............... ^ ------------- 1- ■■»■■■■....................... >1 ■ * i ..... 1— I— 1..................>1.... ■ —I
Gd Atomic Percent Germanium Ge
(a)
Weight Pe rcen t Silicon20 60 80 10040
1900o «i tr*
1700-
1414*C
1100
900
700
800
30030 40 50 60
Atomic Percent Silicon70 80 90 100
SiGd
(b)
Figure 2.3: Metallurgical phase diagrams of (a) GdGe [Predel, 1991] (b) GdSi [Okamoto, 1995].
16
2.4 Thin film growth and characterisation
2.4 Thin film growth and characterisation
Today, thin films have been exploited to a large extent and are constantly be
ing engineered to suit many applications. The quality of thin films, which
influences their properties, is highly dependent on the growth process. Hence
selecting the right technique to grow thin films is advantageous. Thin film
growth techniques can be broadly classified into two categories: physical vapour
deposition (PVD) and chemical vapour deposition (CVD). PVD involves purely
physical processes such as high temperature vacuum evaporation or plasma
sputter bombardment of a target material whereas CVD involves chemical re
action at the surface to be coated. Thin film deposition techniques based on
PVD are listed in Table 2.1.
Table 2.1: Thin film deposition techniques based on PVD
Deposition technique Description
Evaporation Electrically resistive heating in high vacuum
Electron beam Electron bombardment in high vacuum
Sputtering Plasma discharge bombardment in high vacuum
Pulsed-laser Laser ablation in high vacuum
2.5 Pulsed-laser deposition
This section focuses on growing high quality thin films using the pulsed-laser
deposition (PLD) technique, and the influence of deposition parameters on
thin film properties. In this thesis, all thin films were prepared using the PLD
17
2.5 Pulsed-laser deposition
technique. In both concept and practice, PLD is the most versatile and simple
among the thin film deposition techniques discussed in Table 2.1. A simplified
schematic of a PLD set-up is shown in Fig. 2.4. The system consists of target
and substrate holders inside a vacuum chamber. As this is a high vacuum
chamber, the pressure can reach as low as 10-8 Torr.
substrate rotation
60° mirror
Substrate plane
Laser
mirror
Laser sourceAperture Lens
Target port
Vacuum chamber
Energetic plume
■ Target plane
To m otors for
target rotation and rastering
Figure 2.4: A simplified schematic of the PLD setup to deposit thin films.
PLD can be described as a three-step growth process involving:
1. an excimer pulsed-laser beam with high power which is made to focus
on the target material;
2. the target material, which on absorbing the laser energy, vapourises and
forms a laser plume;
3. the plume, consisting of a mixture of energetic species such as ions, atoms,
18
2.5 Pulsed-laser deposition
molecules etc., which rapidly expands from the target surface to vacuum
forming a nozzle jet, which is then deposited on the substrate.
The deposition is very forward-directed and is normal to the surface of the
target. An optics train consisting of mirrors, lenses and apertures, is used to
focus and raster the laser beam on the surface of the target. Thin films can
be grown in reactive or inert atmosphere by passing gases, for example oxy
gen, nitrogen, argon etc., into the vacuum chamber. In order to maintain ho
mogeneity of the films, substrate and target are rotated during the deposition
process. Films can be deposited at various substrate temperatures with a max
imum of 950 °C (in our system). With the help of a target carousel, multiple
targets can be loaded simultaneously which enables deposition of multilayer
structures and films with graded composition across the wafer.
The main advantages of PLD include [Chrisey & Hubler, 1994]:
• the energy source is independent of the deposition system,
• complex multilayer and graded composition films can be produced eas-
%
• cost-effectiveness.
Unlike other methods, PLD has the major advantage of producing thin
films whose average composition equals the target composition.
The generation and presence of particulates in thin films prepared by PLD
have been an obstacle in applying the technique to some applications. Al
though PLD is good at producing films with correct average stoichiometry,
there are a number of deposition parameters to be considered and fine-tuned
19
2.5 Pulsed-laser deposition
in order to achieve single phase films and the right structure and nanostructure
in thin films.
2.5.1 Influence of deposition parameters
The influence of main deposition parameters such as target topography, laser
fluence, ambient gas pressure and substrate temperature on thin film growth
and composition is explained in this section. It is necessary to set these param
eters so as to gain complete control over the quality, stoichiometry, structure
and micro or nanostructure of thin films grown using PLD technique.
2.5.1.1 Target surface
The laser irradiation at high fluence (i.e. laser energy density) and power mod
ifies the target surface. The thermal cycle induced by the laser pulse on the
target surface can be explained as a series of phenomena: absorption of laser
pulse, target vapourisation, capillary wave formation and solidification. The
surface modifications by lasers were reported as early as mid-60's [Birnbaum,
1965].The target surface topography, modified by the frozen capillary waves,
contains irregular structures such as ripples, ridges and cones as shown in
Fig. 2.5.
It was observed in both sputtering [Auciello et al., 1988] and PLD [Foltyn
et al., 1991] of YBCO films that the target surface modification plays a cru
cial role in film composition and deposition rate. Foote et al. found that ini
tially at low exposures the films were copper- and barium-rich. Once the ex
posure is ^40 shots/site, the composition reaches steady state [Foote et al.,
20
2.5 Pulsed-laser deposition
1992], The decrease in deposition rate is due to the reduction in target mate
rial being vapourised and this trend stops when cones have been completely
formed [Krajnovich & Vazquez, 1993].
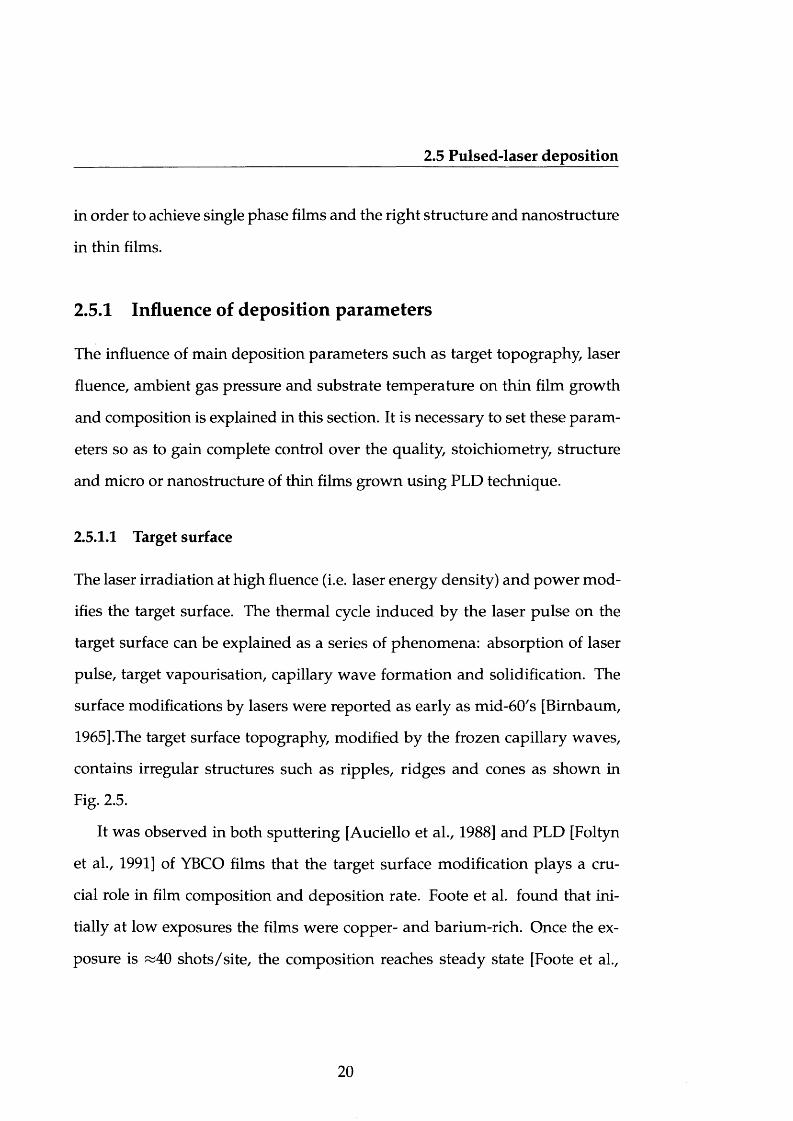
Figure 2.5: Scanning electron micrograph of the modified surface of a YBCO target exposed at 308 nm to 1000 shots/site at a fluence of 5.6 J/cm 2 [Chrisey & Hubler, 1994].
Variation in the angular distribution of the ablated material implies that
different components contained in the plume have different angular distribu
tions with respect to the deposition axis. The film stoichiometry is known to
be uniform only within a smaller range of angles about the deposition axis.
Target cratering also influences the angular distribution of the ablated mate
rial [Chrisey & Hubler, 1994].
Laser preconditioning of the target is necessary before every deposition in
order to achieve the required composition and uniformity and stable deposi
tion rate.
2.5.1.2 Laser fluence
Particulate generation is a very important factor to be considered in thin film
growth. The particulate generation depends on various parameters such as
21
2.5 Pulsed-laser deposition
process conditions, type of material etc., and laser fluence or energy density
has a considerable effect on the particulate size and density [Chrisey & Hubler,
1994]. The laser energy density is mainly determined by the laser spot size and
laser energy. For any given laser wavelength, there is a threshold laser fluence
below which particulates cannot be observed and above which the particulate
density increases rapidly. Blank et al. found that for a 308 nm XeCl excimer
laser with 20 ns pulse duration the threshold laser fluence is 0.9 J/cm 2 [Blank
et al., 1992].
The laser fluence also affects deposited film thickness. In simple relation,
film thickness can be represented as
d oc S 2E (2.2)
where S is the laser spot size (usually the diameter of the laser spot) and E is
the laser energy density. The other parameters that determine the thickness are
laser repetition rate and the duration of deposition. The higher the repetition
rate of the laser pulse and the longer the deposition duration the thicker are
the films. Film thicknesses of > 1 (im can be grown.
The angular distribution of the plume was found to be independent of laser
fluence in a wide range of materials [Foltyn et al., 1991; Neifeld et al., 1988;
Scheibe et al., 1990].
2.5.1.3 Laser wavelength
The amount of laser power absorbed by the target when irradiated is deter
mined by the light wavelength. The absorption coefficients of metals decrease
22
2.5 Pulsed-laser deposition
with decreasing wavelength. So, the penetration depth of light in metal targets
is larger in the ultraviolet (UV) region than in the infrared (IR) region. The re
verse is true for oxide superconductors. It has been shown that the particulate
size and density are higher for YBCO films prepared using IR laser as com
pared to UV laser [Dyer et al., 1992; Koren et al., 1989]. The variation in the
particulate size is likely to be due to the difference in absorption coefficient of
the target at different wavelengths.
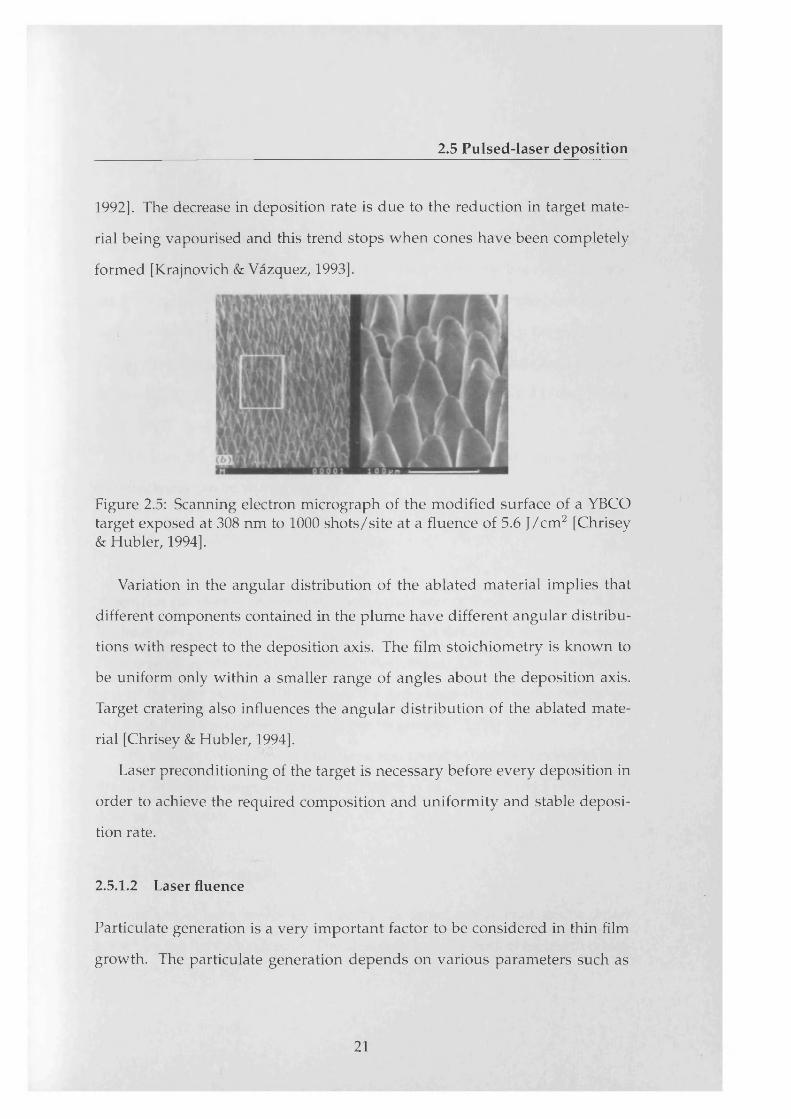
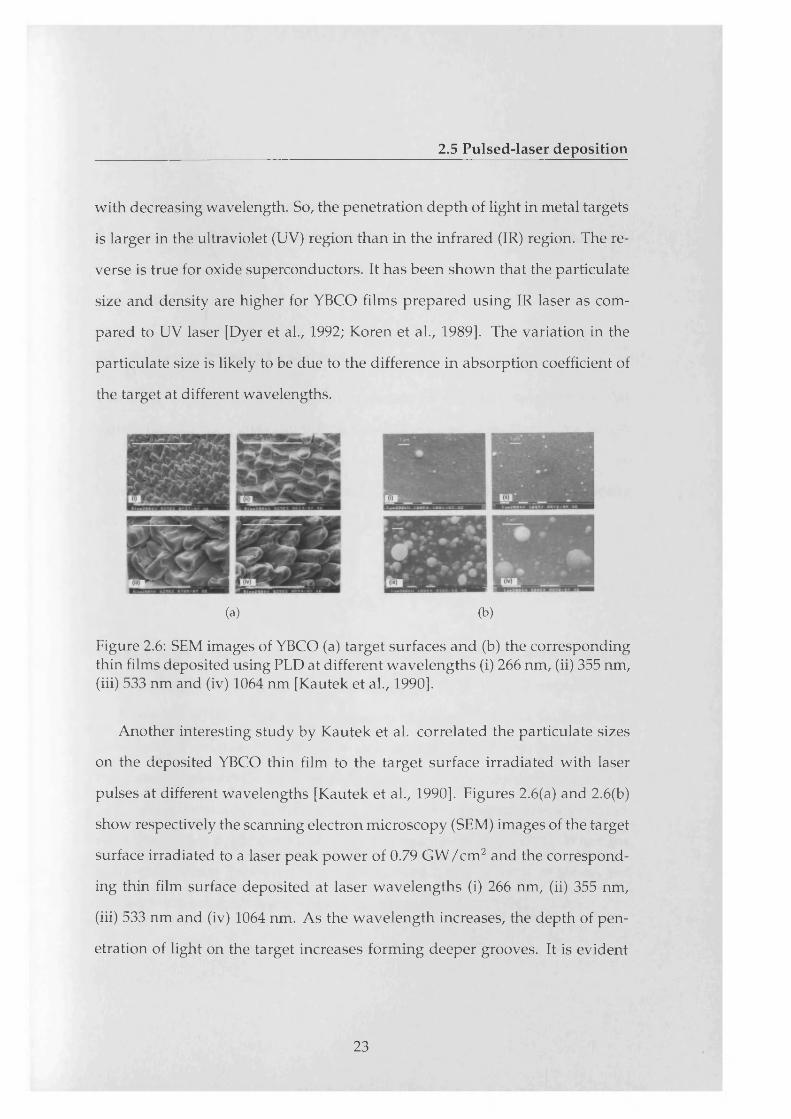
(a) (b)
Figure 2.6: SEM images of YBCO (a) target surfaces and (b) the corresponding thin films deposited using PLD at different wavelengths (i) 266 nm, (ii) 355 nm, (iii) 533 nm and (iv) 1064 nm [Kautek et al., 1990].
Another interesting study by Kautek et al. correlated the particulate sizes
on the deposited YBCO thin film to the target surface irradiated with laser
pulses at different wavelengths [Kautek et al., 1990]. Figures 2.6(a) and 2.6(b)
show respectively the scanning electron microscopy (SEM) images of the target
surface irradiated to a laser peak power of 0.79 GW /cm 2 and the correspond
ing thin film surface deposited at laser wavelengths (i) 266 nm, (ii) 355 nm,
(iii) 533 nm and (iv) 1064 nm. As the wavelength increases, the depth of pen
etration of light on the target increases forming deeper grooves. It is evident
23
2.5 Pulsed-laser deposition
from Fig. 2.6(b) that the penetration depth has a significant effect on particulate
size and density. Ideally, a wavelength that is strongly absorbed and has shal
low penetration depth is desired to ablate materials with minimum particulate
generation.
2.5.1.4 Target-to-substrate distance
The target-to-substrate distance, and pressure in chamber, vary the angular
distribution of the plume. In the presence of ambient gas, the plume length
decreases due to collisions between the laser plume and ambient gas. The
laser plume length (L) can be represented as a function of laser energy density
(E) and ambient pressure (P0) [Dyer et al., 1990]
1
and volume (for oxygen, argon and nitrogen, 7 ^ 1.4 ,1.7 and 1.4 respectively).
When the target-to-substrate distance is much smaller than L, there is no
considerable variation in particulate size and density. It was found that as
the distance between the target and substrate increases, the number of smaller
ing a merging of particulates during flight [Nishikawa et al., 1991]. When the
target-to-substrate distance is much greater than L, the adhesion of the ejected
species to the substrate becomes poor [Chrisey & Hubler, 1994].
(2.3)
where 7 is the ratio of specific heats of ambient gas at constant pressure'V
particulates decreases and the number of larger particulates increases indicat-
24
2.5 Pulsed-laser deposition
2.5.1.5 Ambient gas
In order to compensate for the loss of constituent elements such as oxygen or
nitrogen in deposited thin films, a reactive ambient atmosphere is necessary
during the deposition process. The creation of 0 2, N 2 and H2 atmosphere in
side the PLD chamber enables the growth of oxide, nitride and hydride films
from metallic targets. Recently oxidants such as N20 , N 0 2 and 0 3 have been
shown to be very effective as far as the growth of superconducting oxide films
are concerned.
The particulate size depends on the pressure of the ambient gas. It was
found by Matsunawa et al. that, in the production of various ultra-fine metals
and alloys in the presence of argon atmosphere, a decrease in ambient gas
pressure reduces the particulate size [Matsunawa et al., 1986]. The effect of
ambient gas atmosphere on the nature of particulates can be related to the
increased collisions between the ejected species and ambient gas species at
higher ambient gas pressures.
The growth mechanism of particles in the presence of ambient gas is by
diffusion and so the particulate size is determined by the residence time of
the particulate in vapour species [Chrisey & Hubler, 1994]. In the PLD of thin
films in vacuum, where there are virtually no collisions, particulates are pre
dominantly formed from solidified liquid droplets expelled from the target.
As explained earlier, in the presence of ambient gas, the ejected vapour
species undergo collisions. Hence the plume angular distribution is perturbed
and the ejected particles deviate from their initial projected trajectories. This
phenomena broadens the angular distribution of the plume thereby reducing
25
2.5 Pulsed-laser deposition
& - cVacuum
.0 0.5Distance (cm)
100 mTorr Oxygen
Distance (cm)
Figure 2.7: Laser plume intensity in vacuum and collision-induced broadening at 100 mTorr of ambient oxygen pressure captured using an ICCD camera at At=l fis following 1 J/cm 2 KrF-laser ablation of YBCO target. The distance corresponds to the plume width and the intensity corresponds to the perpendicular distance away from the target [Geohegan, 1992].
26
2.5 Pulsed-laser deposition
the deposition rate.
The collision-induced broadening effect emission intensity at At=l fis fol
lowing 1 J/cm 2 KrF-laser ablation of YBCO target was captured using a fast
intensified charge-coupled device (ICCD) camera array detector in vacuum
and at 100 mTorr of oxygen pressure are shown in Fig. 2.7 [Geohegan, 1992].
At 100 mTorr oxygen, a third component of the plasma emission appears on
the leading edge of the expanding plasma as a sharp contact front of greater
radius of curvature which is highly suggestive of a shock front formation due
to background gas collisions.
The broadening effects induced by collisions between ambient gas and ejected
species begin to occur when the mean free path (A) of a particle in the ambient
gas is less than the target-to-substrate distance (h). The mean free path can be
approximated as [Chrisey & Hubler, 1994]
A « - A - (2.4)>J/no
where n is the number density of the ambient gas and o is the collision cross
section.
The reduction in mean free path of the ejected species as the ambient gas
pressure increases (approximately 50 mm at 1 mTorr to 0.5 mm at 100 mTorr)
indicates that, at high ambient gas pressures, the ejected vapour species un
dergo enough collisions to form particulates even before they reach the sub
strate. It was found experimentally that collision-induced broadening occurs
at pressures only above ~22 mTorr [Gorbunov & Konov, 1991].
In the growth of multicomponent oxide films, oxygen pressure also plays
27
2.5 Pulsed-laser deposition
an important role in achieving the desired phase in the deposited films. In
the growth of LiNbOa films, as Li atoms are much lighter than Nb, Li atoms
are readily scattered in collisions with the background gas [Chrisey & Hubler,
1994]. This results in growth of Nb-rich multiphase films. Hence control of the
reactive ambient gas gives a good control over composition of the deposited
film.
2.5.1.6 Substrate temperature
The influence of substrate temperature on the crystal structure and stoichiom
etry of the deposited film has been investigated by Metev et al. [Metev &
Meteva, 1989]. The investigation showed that at given deposition conditions
there exists a critical substrate temperature below which the films are not crys
talline and also below which the composition of the films deviates from the
target stoichiometry. The substrate temperature determines the heat loss of
the condensate through the substrate, i.e. the speed of crystallisation. At tem
peratures below the critical point, the velocity of crystallisation is very low as
the cooling rate is higher. So, not all adatoms (adsorbed atoms or atoms that
lie on the crystal surface) form crystallites. On the arrival of the next vapour
species, due to the rise in temperature, the unbonded atoms re-evaporate leav
ing a particular cation-rich stoichiometry in a multicomponent film. When
the temperature is higher than the critical temperature, the cooling rate de
creases leading to crystallisation of all adatoms. Hence the substrate temper
ature is also a critical parameter to preserve stoichiometry in multicomponent
thin films.
28
2.5 Pulsed-laser deposition
2.5.2 Stress in thin films
During the growth process, thin films can often develop large stresses. The
origin of stress in thin films can be broadly divided into strains developed:
1. within the film,
2. at the film-substrate interface and
3. due to dynamic processess.
Grain boundaries, impurities, dislocations and other types of defects in the
film can contribute to the intrinsic strain developed within the film. The strain
at the film-substrate interface can be attributed to thermal expansion mismatch
and lattice mismatch between the film and substrate. Interdiffusion and recrys
tallisation in thin films also contribute to the intrinsic strain in thin films.
It is important to consider the stress levels on film-substrate bilayer as the
magnitude of stress was found to play an important role in determining both
surface morphology and magnetic properties of thin films [Koch, 1994].
2.5.3 Characterisation
In this study, thin films prepared by PLD were characterised in order to help
understand their structure, orientation, composition, morphology, magnetic
and domain features. The properties measured and the techniques used are
listed in Table 2.2.
29
2.5 Pulsed-laser deposition
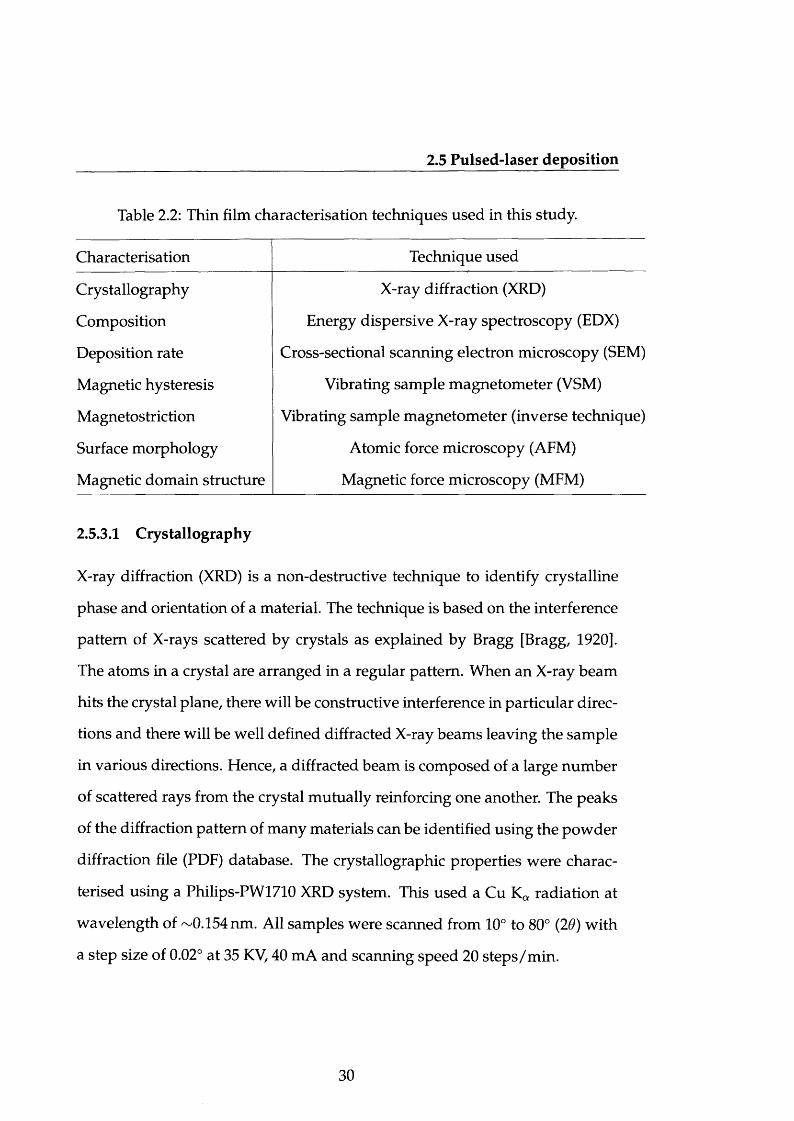
Table 2.2: Thin film characterisation techniques used in this study.
Characterisation Technique used
Crystallography X-ray diffraction (XRD)
Composition Energy dispersive X-ray spectroscopy (EDX)
Deposition rate Cross-sectional scanning electron microscopy (SEM)
Magnetic hysteresis Vibrating sample magnetometer (VSM)
Magnetostriction Vibrating sample magnetometer (inverse technique)
Surface morphology Atomic force microscopy (AFM)
Magnetic domain structure Magnetic force microscopy (MFM)
2.5.3.1 Crystallography
X-ray diffraction (XRD) is a non-destructive technique to identify crystalline
phase and orientation of a material. The technique is based on the interference
pattern of X-rays scattered by crystals as explained by Bragg [Bragg, 1920].
The atoms in a crystal are arranged in a regular pattern. When an X-ray beam
hits the crystal plane, there will be constructive interference in particular direc
tions and there will be well defined diffracted X-ray beams leaving the sample
in various directions. Hence, a diffracted beam is composed of a large number
of scattered rays from the crystal mutually reinforcing one another. The peaks
of the diffraction pattern of many materials can be identified using the powder
diffraction file (PDF) database. The crystallographic properties were charac
terised using a Philips-PW1710 XRD system. This used a Cu Ka radiation at
wavelength of ~0.154nm. All samples were scanned from 10° to 80° (26) with
a step size of 0.02° at 35 KV, 40 mA and scanning speed 20 steps/min.
30
2.5 Pulsed-laser deposition
2.5.3.2 Composition
The stoichiometry of the thin films was determined using energy dispersive X-
ray (EDX) spectroscopy. The composition was averaged over 15 locations on
the surface of the thin films. In oxide films, the content of oxygen can be accu
rately determined using sophisticated techniques such as Xray photoelectron
spectroscopy (XPS). However, in this study, the oxygen content was assumed
to be the expected stoichiometric value.
2.5.3.3 Deposition rate
The thickness of the thin films and hence the deposition rate of the system was
found from cross-sectional imaging of the film samples in high magnification
scanning electron microscopy (SEM). All of the oxide films were deposited on
silicon substrates that had a 300 nm thick thermal oxide layer on top. The
layers of deposited thin film, thermal oxide and the substrate can be seen in
the cross-sectional image obtained from SEM shown in Fig. 2.8.
2.5.3.4 Magnetic hysteresis
The characterisation of magnetic hysteresis, a measure of magnetisation of the
sample at different applied magnetic fields, is very important in the investi
gation of magnetic materials. Although this can be done using several tech
niques, a vibrating-sample magnetometer (VSM) [Foner, 1959] was used in
this study. When a magnetic sample is continuously vibrated, it induces a flux
change or alternating electromotive force (emf) in the detection coils as shown
in Fig 2.9. The vibrating rod also carries a reference specimen, usually a small
31
2.5 Pulsed-laser deposition
FILM
Figure 2.8: Cross-sectional SEM image of a typical thin film.
permanent magnet whose oscillating field induces another an emf in the refer
ence coils. The difference between the voltages induced in two sets of coils is
directly proportional to the magnetic moment of the sample.
Magnetic hysteresis measurements were made on a LakeShore model 7400
VSM system at room temperature. The VSM system was calibrated using a
Nickel thin film of size 5 mm x 5 mm whose magnetic properties are known.
Thin film samples of appropriate sizes (typically 5 mm x 5 mm) were pre
pared by scribing and breaking 2" diameter film-substrate wafers prepared
using PLD technique. As all thin films are deposited on thick substrates (~300
\xm), background subtraction is necessary in order to precisely determine the
magnetic properties of thin films without background distortion. Hence the
substrates of sizes 5 mm x 5 mm were prepared and their responses to mag
netic fields were measured on the VSM before measuring the film-substrate
bi-layer. The measured response of the substrate is then subtracted from the
32
2.5 Pulsed-laser deposition
Referencespecimen
Loudspeaker
Reference coils
Detection coils
Sample
Figure 2.9: Schematic of a vibrating sample magnetometer [Foner, 1959].
film-substrate bi-layer measurement, in order to get the net response of thin
films to applied magnetic fields.
2.5.3.5 Magnetostriction
The magnetostriction of thin films can be determined by using direct and in
verse techniques. In the direct technique, the sample is subjected to an external
magnetic field. The applied magnetic field induces strain in the magnetoelas-
tic sample and causes the bending of the film-substrate bi-layer. By measuring
the deflection by means of an optical setup the magnetostriction of the material
can be calculated [Tam & Schroeder, 1989]. In the inverse technique, a known
stress is applied to the sample and the change in anisotropy field is measured.
This change in the anisotropy field is related to the magnetostriction of the ma
terial. In this study magnetostriction was measured on thin film samples using
33
2.5 Pulsed-laser deposition
the inverse technique.
In order to measure magnetostriction based on the inverse technique, a
VSM sample holder with a 3-point bender assembly was designed in order
to apply a known amount of strain on thin films. This bender was designed
specifically for this project. The bender assembly was made from a light
weight ceramic material and was non-magnetic. The bender was fit to the
VSM vibrating rod so as to measure the anisotropy field of the material in both
zero-applied stress and applied stress state. The magnetostriction can then be
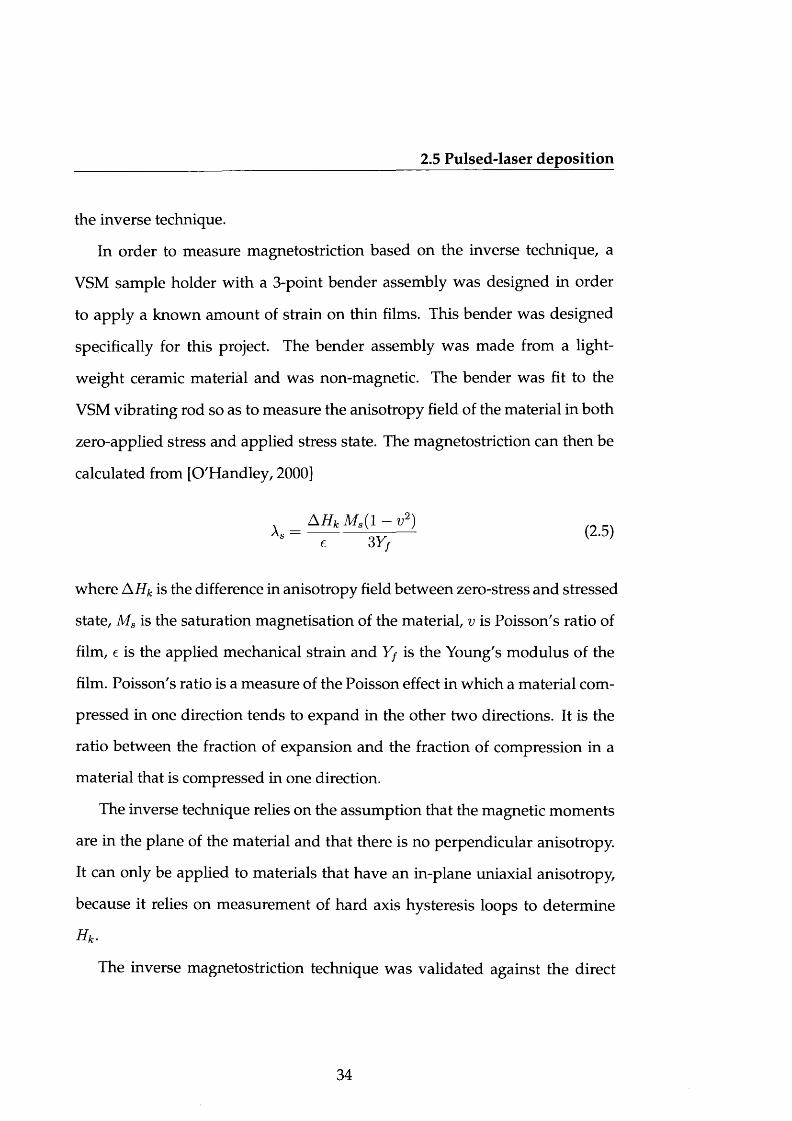
calculated from [O'Handley, 2000]
, AHk Ms( l - v * )As = 1 ------- 3V) (2'5)
where A Hk is the difference in anisotropy field between zero-stress and stressed
state, Ms is the saturation magnetisation of the material, v is Poisson's ratio of
film, e is the applied mechanical strain and Yf is the Young's modulus of the
film. Poisson's ratio is a measure of the Poisson effect in which a material com
pressed in one direction tends to expand in the other two directions. It is the
ratio between the fraction of expansion and the fraction of compression in a
material that is compressed in one direction.
The inverse technique relies on the assumption that the magnetic moments
are in the plane of the material and that there is no perpendicular anisotropy.
It can only be applied to materials that have an in-plane uniaxial anisotropy,
because it relies on measurement of hard axis hysteresis loops to determine
Hk.
The inverse magnetostriction technique was validated against the direct
34
2.5 Pulsed-laser deposition
technique using four thin film samples of different compositions: Co95Fe5,
Co6oFe2oB2o, NiesFeisCo^, and Ni80Fe20, representing both positive and neg
ative magnetostriction, and having saturation magnetostriction of magnitudes
ranging from 1CT7 to 10~5. The direct measurements were carried out on a
high precision optical cantilever beam system and the inverse magnetostric
tion measurements were carried out on a non-destructive inductive B-H looper
with three-point bending stage. The difference between the measured values
of magnetostriction from both techniques was calculated to be less than 18%.
This work has been published and a more detailed analysis of this technique
and its comparison to the direct technique can be found in [Raghunathan et al.,
2009].
2.5.3.6 Surface morphology
Atomic force microscopy (AFM) is a form of scanning probe microscopy (SPM)
where a small cantilever probe tip of diameter less than 10 nm is scanned
across the sample to obtain information about the sample's surface. The tech
nique to measure topography of the thin film surface involves tapping the sur
face with the oscillating probe tip. The inter-atomic forces between the probe
tip and the sample surface cause the cantilever to deflect as the samples sur
face topography changes. A laser light reflected from the back of the cantilever
measures the deflection which is then transformed into a map of topography.
Thin film surface topography and roughness can be determined by AFM.
The grain size can also be calculated from the surface topographical image.
The optimum resolution of this technique is about 5 nm lateral and <0.1 nm
height [Veeco, 2004].
35
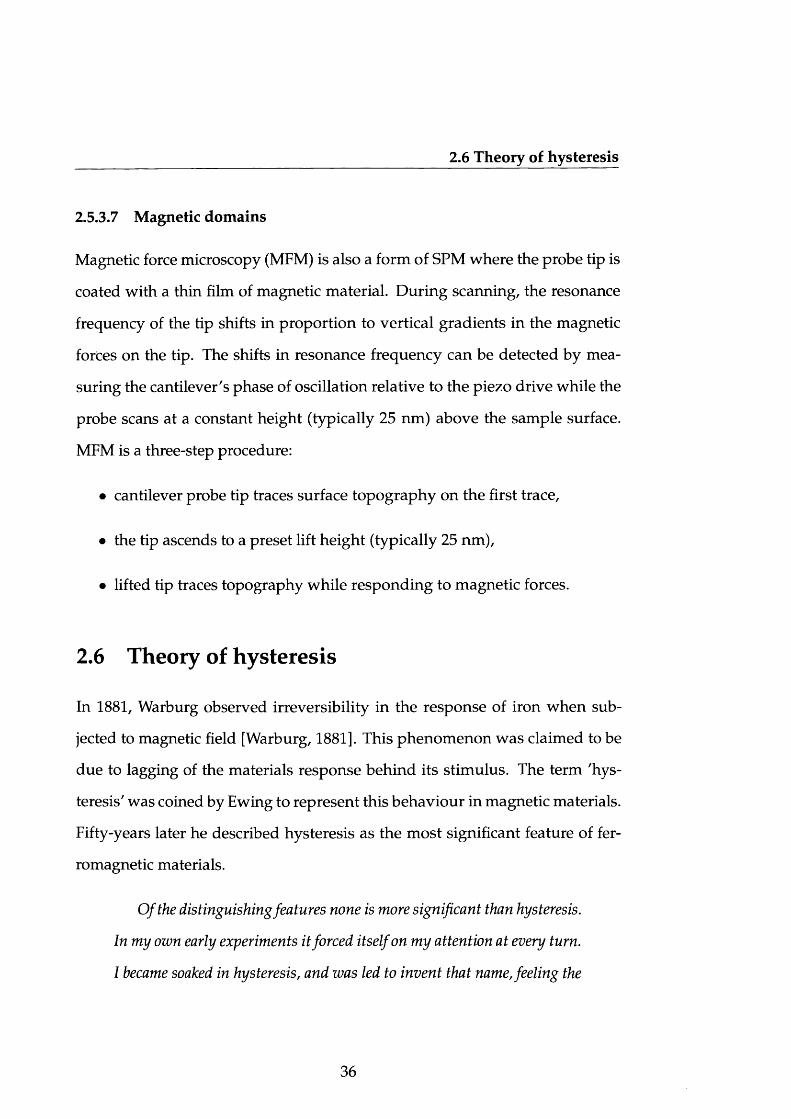
2.6 Theory of hysteresis
2.5.3.7 Magnetic domains
Magnetic force microscopy (MFM) is also a form of SPM where the probe tip is
coated with a thin film of magnetic material. During scanning, the resonance
frequency of the tip shifts in proportion to vertical gradients in the magnetic
forces on the tip. The shifts in resonance frequency can be detected by mea
suring the cantilever's phase of oscillation relative to the piezo drive while the
probe scans at a constant height (typically 25 nm) above the sample surface.
MFM is a three-step procedure:
• cantilever probe tip traces surface topography on the first trace,
• the tip ascends to a preset lift height (typically 25 nm),
• lifted tip traces topography while responding to magnetic forces.
2.6 Theory of hysteresis
In 1881, Warburg observed irreversibility in the response of iron when sub
jected to magnetic field [Warburg, 1881]. This phenomenon was claimed to be
due to lagging of the materials response behind its stimulus. The term 'hys
teresis' was coined by Ewing to represent this behaviour in magnetic materials.
Fifty-years later he described hysteresis as the most significant feature of fer
romagnetic materials.
Of the distinguishing features none is more significant than hysteresis.
In my own early experiments it forced itself on my attention at every turn.
I became soaked in hysteresis, and was led to invent that name, feeling the
36
2.6 Theory of hysteresis
need of a word that should be sufficiently wide to include not only the
phenomena of magnetic retentiveness, but other manifestations of what
seemed to be essentially the same thing, though some of them were not
associated with any visible magnetic change. [Ewing, 1930]
Hysteresis curves, in general, exhibit the path- or history-dependent re
sponse of the material to a stimulus. In ferromagnetism, the magnetising field,
H, is the stimulus and magnetisation, M , is the response. The magnetic flux
density, B (also known as the magnetic induction) is the vector sum of mag
netisation and field:
B = p0{H + M) (2.6)
According to Ewing [Ewing, 1900], magnetic hysteresis exhibits three dis
tinct stages in one cycle of applied field:
• In the first stage of hysteresis, at very low fields, the response is almost
proportional to the applied field and is reversible.
• The second stage is an irreversible process, which involves higher dissi
pation of energy and a new equilibrium state. It is this state that gives
rise to hysteresis.
• The final stage is a state of complete parallelism with the applied field.
At the microscopic level, magnetic hysteresis can be explained as follows:
• In the demagnetised state, the magnetic domains are arranged in such a
way that along any direction, there are an equal number of positive and
negative components, resulting in no net magnetisation.
37
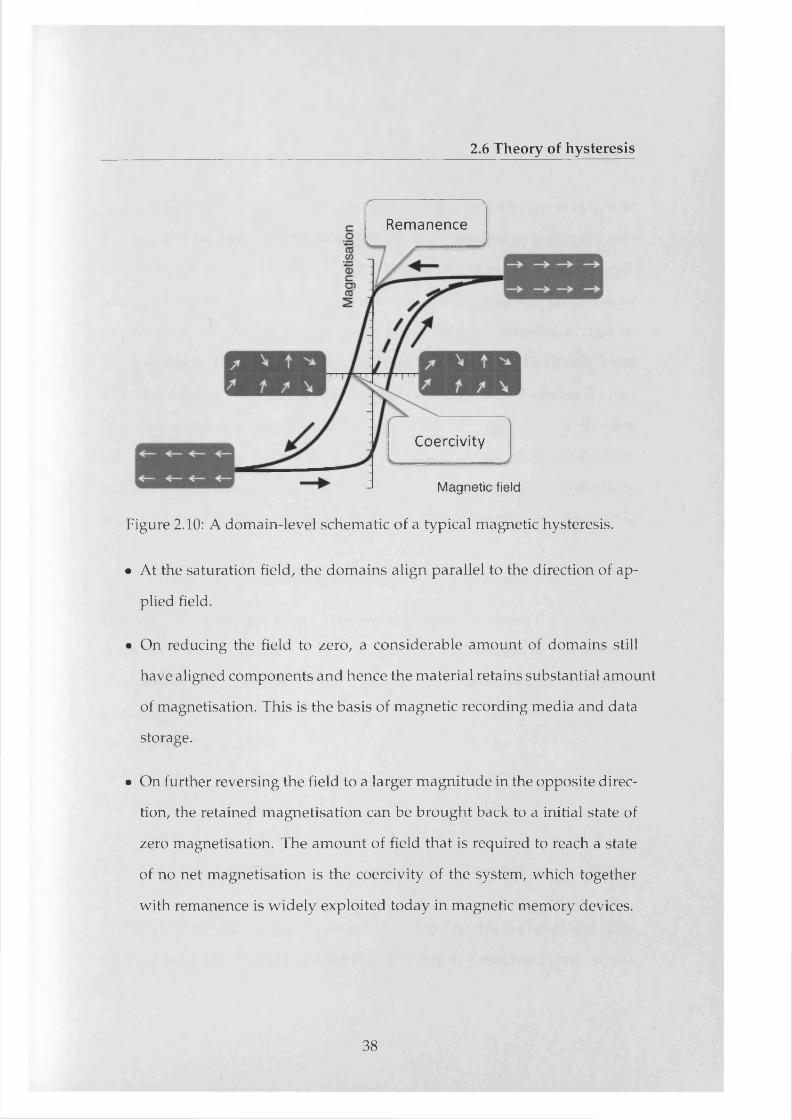
2.6 Theory of hysteresis
Remanence
Coercivity
Magnetic field
Figure 2.10: A domain-level schematic of a typical magnetic hysteresis.
• At the saturation field, the domains align parallel to the direction of ap
plied field.
• On reducing the field to zero, a considerable amount of domains still
have aligned components and hence the material retains substantial amount
of magnetisation. This is the basis of magnetic recording media and data
storage.
• On further reversing the field to a larger magnitude in the opposite direc
tion, the retained magnetisation can be brought back to a initial state of
zero magnetisation. The amount of field that is required to reach a state
of no net magnetisation is the coercivity of the system, which together
with remanence is widely exploited today in magnetic memory devices.
38
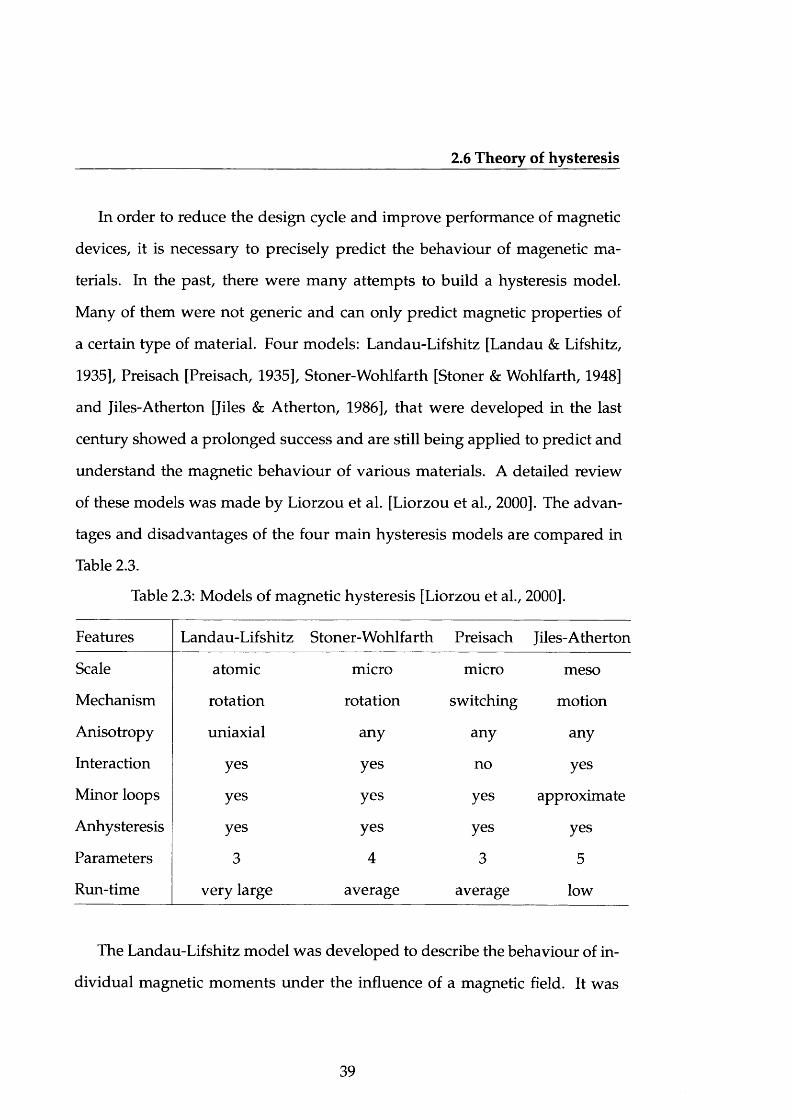
2.6 Theory of hysteresis
In order to reduce the design cycle and improve performance of magnetic
devices, it is necessary to precisely predict the behaviour of magenetic ma
terials. In the past, there were many attempts to build a hysteresis model.
Many of them were not generic and can only predict magnetic properties of
a certain type of material. Four models: Landau-Lifshitz [Landau & Lifshitz,
1935], Preisach [Preisach, 1935], Stoner-Wohlfarth [Stoner & Wohlfarth, 1948]
and Jiles-Atherton [Jiles & Atherton, 1986], that were developed in the last
century showed a prolonged success and are still being applied to predict and
understand the magnetic behaviour of various materials. A detailed review
of these models was made by Liorzou et al. [Liorzou et al., 2000]. The advan
tages and disadvantages of the four main hysteresis models are compared in
Table 2.3.
Table 2.3: Models of magnetic hysteresis [Liorzou et al., 2000].
Features Landau-Lifshitz Stoner-Wohlfarth Preisach Jiles-Atherton
Scale atomic micro micro meso
Mechanism rotation rotation switching motion
Anisotropy uniaxial any any any
Interaction yes yes no yes
Minor loops yes yes yes approximate
Anhysteresis yes yes yes yes
Parameters 3 4 3 5
Run-time very large average average low
The Landau-Lifshitz model was developed to describe the behaviour of in
dividual magnetic moments under the influence of a magnetic field. It was
39
2.6 Theory of hysteresis
known, at least at the macroscopic level, that the magnetic moments rotate
when a magnetic field is applied. This model was built by applying this idea at
the microscopic level of individual magnetic moments, but it was never quite
clear on what scale these moments were. The model is really a continuum
model, so they are not individual "atomic" moments, but neither are they do
mains. The behaviour of the entire material can then be determined by inte
grating the rotation process over the volume. The major practical problem in
using this model is the processing time as the calculations have to be made on
large number of individual magnetic moments.
The Stoner-Wohlfarth model was built to describe the reorientation of mag
netic moments of individual domains by coherent rotation or flipping of all
moments within the domain. Unlike Landau-Lifshitz model, this model does
not take in to account individual moments. Although the model originally
assumed that there were no magnetic interactions between the domains, the
model was improved subsequently to incorporate the coupling between do
mains. The effects of anisotropy on the orientation of magnetisation was also
built in to the model.
The Preisach model is an empirical model that describes hysteresis on a
macroscopic scale. The model treats hysteresis as summation of a series of
switching events occurring at the microscopic level in a material. As this is a
mathematical model that treats hysteresis as a mathematical structure, it can
be applied to any other physical system that exhibits hysteresis. The main
assumption of this model is that each domain in the material has the same
magnetisation but different switching fields. Hence the magnetic characteris
tics are described as a volume fraction of domains with particular combination
40
2.7 Summary
of switching fields.
The Jiles-Atherton model was developed based on statistical thermody
namic principles at a multidomain mesoscopic level. The basis of this model
is the mechanism of domain boundary movement. The model was shown to
perform well in materials with low anisotropy and, with minor modifications,
can be applied to axial and planar anisotropic materials. Built on Lange vin-
Weiss theory, this model assumes that the orientations of magnetic moments
are distributed statistically. By integrating the moment distribution over all
possible orientations the magnetic characteristics can be obtained. The model
also incorporates coupling between magnetic moments in the form of a strong
internal magnetic field proportional to magnetisation that tends to align mo
ments in a domain parallel to each other. A more detailed review of this model
can be found in Chapter 5 of this thesis.
2.7 Summary
• Magnetoelastic effects and the properties of materials that exhibit these
phenomena have been discussed.
• The various thin film deposition techniques have been compared. Pulsed-
laser deposition of thin films and the influence of growth parameters on
thin film properties have been explained in detail.
• The origin of hysteresis in magnetic materials was described. The four
main successful models that are being used to describe and predict hys
teresis behaviour in magnetic materials were explained.
41
Chapter 3
Magnetoelastic thin films
3.1 Introduction
This chapter describes the deposition of magnetoelastic thin films (cobalt fer
rite, in particular) using the pulsed-laser deposition technique and the optimi
sation of the growth process. Section 3.2 reviews the previous work on cobalt
ferrite thin films. Section 3.3 explains the present work on the growth of cobalt
ferrite thin films on silicon substrates at various substrate temperatures and
oxygen pressures and the influence of deposition conditions on the magnetic
properties and crystal structure of thin films. Section 3.4 investigates the ef
fect of magnetic annealing on magnetic properties of cobalt ferrite thin films.
Section 3.5 elaborates the measurement of magnetostriction in the optimised
cobalt ferrite thin film based on the inverse measurement technique.
42
3.2 Magnetoelastic thin films
3.2 Magnetoelastic thin films
Ferrite thin films are applied extensively in microwave magnetic devices. Re
cently magnetoelastic ferrites have sparked considerable research interest in
order to explore the potential for sensor applications. The growth of ferrite
thin films range from nanocrystalline or polycrystalline to epitaxial using tech
niques such as spin-spray coating, electroplating, sputtering, pulsed-laser de
position, evaporation and molecular beam epitaxy. Due to the complexity of
the crystal structure of ferrites, structural disorders such as cation vacancies,
oxygen deficiencies, non-equilibrium cation distributions, grain boundaries
etc., influence the magnetic and electronic properties of the films.
High coercivity, large perpendicular anisotropy, large saturation magneti
sation and high resistivity of ferrite thin films have been a focus of perpendic
ular media applications [Hiratsuka et al., 1997; Zhuang et al., 2000].
CoFe20 4, a partially inverse spinel structure ferrite is unique among spinel
ferrites due to its large magnetic anisotropy along with large anisotropic mag
netostriction. The first order magnetocrystalline anisotropy constant (K2) of
CoFe20 4 is positive (which means that the easy axes are along the (100) direc
tions) and is an order of magnitude greater than other spinel structure ferrites.
An analysis with the help of Mossbauer spectroscopy showed that the CoFe20 4
is not completely inverse spinel and the degree of inversion depends on the
heat treatment of the material [Sawatzky et al., 1968]. It was also found that
the cation distribution and the strain due to lattice and thermal expansion mis
match between the film and substrate has substantial effect on the properties of
CoFe20 4 thin films [Suzuki, 2001]. The growth of epitaxial CoFe20 4 thin films
43
3.3 Growth and characterisation of cobalt ferrite films
on (100) MgO substrates at high temperatures was found to induce a strong
tension in the film and produce a high perpendicular anisotropy [Dorsey et al.,
1996]. Antiphase boundaries (APBs) are a kind of structural disorder formed
at the interface of ordered regions where the structures at either side of the
boundary are "out-of-phase". APBs were found in CoFe204 thin films de
posited directly on MgO substrates and thought to be due to lattice mismatch
[Hu et al., 2001]. Such APBs were also observed in magnetite films deposited
on MgO substrates [Margulies et al., 1996]. It was reported by Suzuki et al. that
the APBs vanish when the CoFe20 4 films were deposited on CoCr20 4 buffered
oxide substrates. However the buffered substrates induce a slight compressive
strain in the film [Suzuki et al., 1999].
Post-deposition annealing treatments can play a major role in the proper
ties of ferrite thin films. For example, in magnetite Fe30 4 film, Fe2+ ions can
be oxidised to Fe3+ ions resulting in either a- or 7-Fe20 3 phase. Since 7 -Fe20 3
is ferrimagnetic with net magnetic moment less than magnetite and o-Fe20 3
is a canted antiferromagnet, the overall magnetisation of the thin film is re
duced [Suzuki, 2001].
3.3 Growth and characterisation of cobalt ferrite films
Cobalt ferrite thin films were deposited from a CoFe20 4 target using a 248 nm
wavelength KrF excimer laser at 210 mj and 13 Hz repetition rate. The laser
spot size was 9 mm x 1.5 mm. The target-to-substrate distance was maintained
at 50 mm. Substrates were Si (100) wafers with 300 nm thermal Si02 on top.
The chamber was pum ped down to lx l0 ~7 Torr before depositions.
44
3.3 Growth and characterisation of cobalt ferrite films
3.3.1 Influence of substrate temperature
In order to study the influence of substrate temperature on the properties of
cobalt ferrite thin films, a series of films were deposited at five different sub
strate temperatures or deposition temperatures (TDEP): 250 °C, 350 °C, 450 °C,
550 °C and 600 °C. All films were deposited in 22 mTorr of oxygen, and cooled
to room temperature under the same oxygen pressure. The properties of cobalt
ferrite thin films at different substrate temperatures are detailed below.
a. Crystallography
The crystal structure and orientation of cobalt ferrite thin films were investi
gated by 0-20 X-ray diffraction (XRD) scans, the patterns of which are shown
in Fig. 3.1. All films were found to be crystalline, even at lower substrate tem
peratures. They all appear single-phase with cubic spinel structure. The films
that were deposited at lower temperatures are predominantly (lll)-textured
whereas at higher temperatures, they are (100)- and (311)-textured. The com
positions of films were determined using energy-dispersive X-ray spectroscopy
(EDX) and were found to be C01.1Fe1.9O4. The oxygen content was assumed
to have the stoichiometric value since EDX cannot determine the content of
oxygen accurately.
The growth of crystalline cobalt ferrite films at low temperatures (~250 °C)
indicates the potential for integration with multilayer structures that require
low processing temperatures.
b. Deposition rate
The thicknesses of thin films were measured from cross-sectional imaging in
45
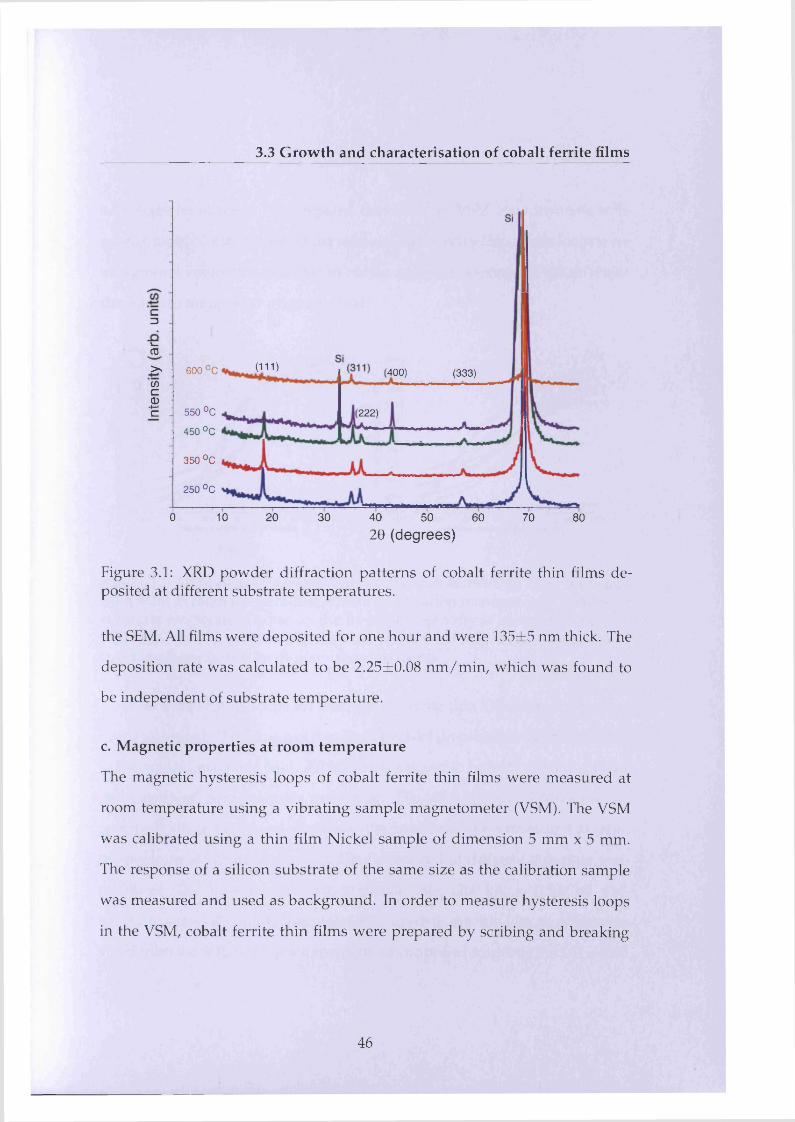
3.3 Growth and characterisation of cobalt ferrite films
c3I—03
on) (400)600 °C>»c/)cCL)
(333)
-*—* c 550 °C
450 °C
(222)
350 °C
250 °C
0 20 30 40 5010 60 70 8020 (degrees)
Figure 3.1: XRD powder diffraction patterns of cobalt ferrite thin films deposited at different substrate temperatures.
the SEM. All films were deposited for one hour and were 135±5 nm thick. The
deposition rate was calculated to be 2.25±0.08 nm /m in, which was found to
be independent of substrate temperature.
c. Magnetic properties at room temperature
The magnetic hysteresis loops of cobalt ferrite thin films were measured at
room temperature using a vibrating sample magnetometer (VSM). The VSM
was calibrated using a thin film Nickel sample of dimension 5 mm x 5 mm.
The response of a silicon substrate of the same size as the calibration sample
was measured and used as background. In order to measure hysteresis loops
in the VSM, cobalt ferrite thin films were prepared by scribing and breaking
46
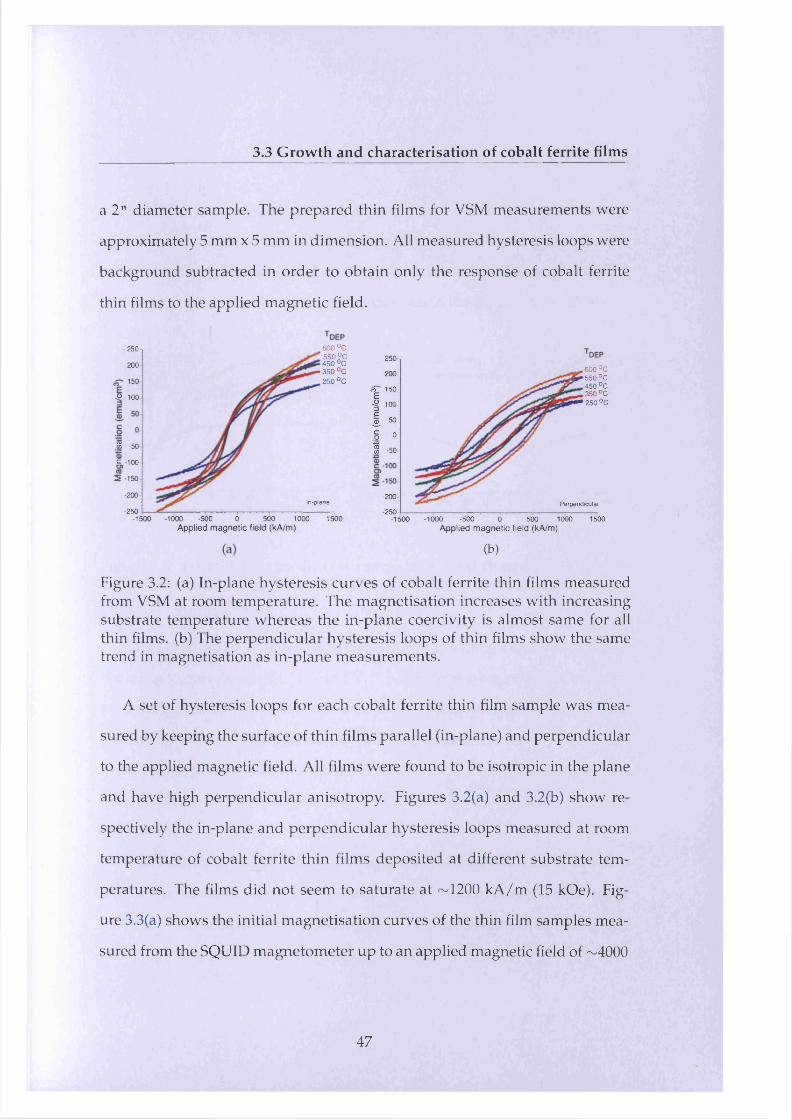
3.3 Growth and characterisation of cobalt ferrite films
a 2" diameter sample. The prepared thin films for VSM measurements were
approximately 5 mm x 5 mm in dimension. All measured hysteresis loops were
background subtracted in order to obtain only the response of cobalt ferrite
thin films to the applied magnetic field.
250
200
o P 150E-§ 100
J. 50 I 01 -50
-200
-250-1500 -1000 -500 0 500 1000 1500
Applied m agnetic field (kA/m)
(b)
Figure 3.2: (a) In-plane hysteresis curves of cobalt ferrite thin films measured from VSM at room temperature. The magnetisation increases with increasing substrate temperature whereas the in-plane coercivity is almost same for all thin films, (b) The perpendicular hysteresis loops of thin films show the same trend in magnetisation as in-plane measurements.
A set of hysteresis loops for each cobalt ferrite thin film sample was mea
sured by keeping the surface of thin films parallel (in-plane) and perpendicular
to the applied magnetic field. All films were found to be isotropic in the plane
and have high perpendicular anisotropy. Figures 3.2(a) and 3.2(b) show re
spectively the in-plane and perpendicular hysteresis loops measured at room
temperature of cobalt ferrite thin films deposited at different substrate tem
peratures. The films did not seem to saturate at ~1200 kA/m (15 kOe). Fig
ure 3.3(a) shows the initial magnetisation curves of the thin film samples mea
sured from the SQUID magnetometer up to an applied magnetic field of ~4000
600 °C 550 °C 450 °C 350 °C 250 °C
250
200
150
^ 100
8 -50
5,-1005 -150
-200In-plane
-250-1500 -1000 -500 0 500 1000 1500
Applied m agnetic field (kA/m)
600 °C 550 °C 450 °C
, 350 °C
Perpendicular
250 °C
47
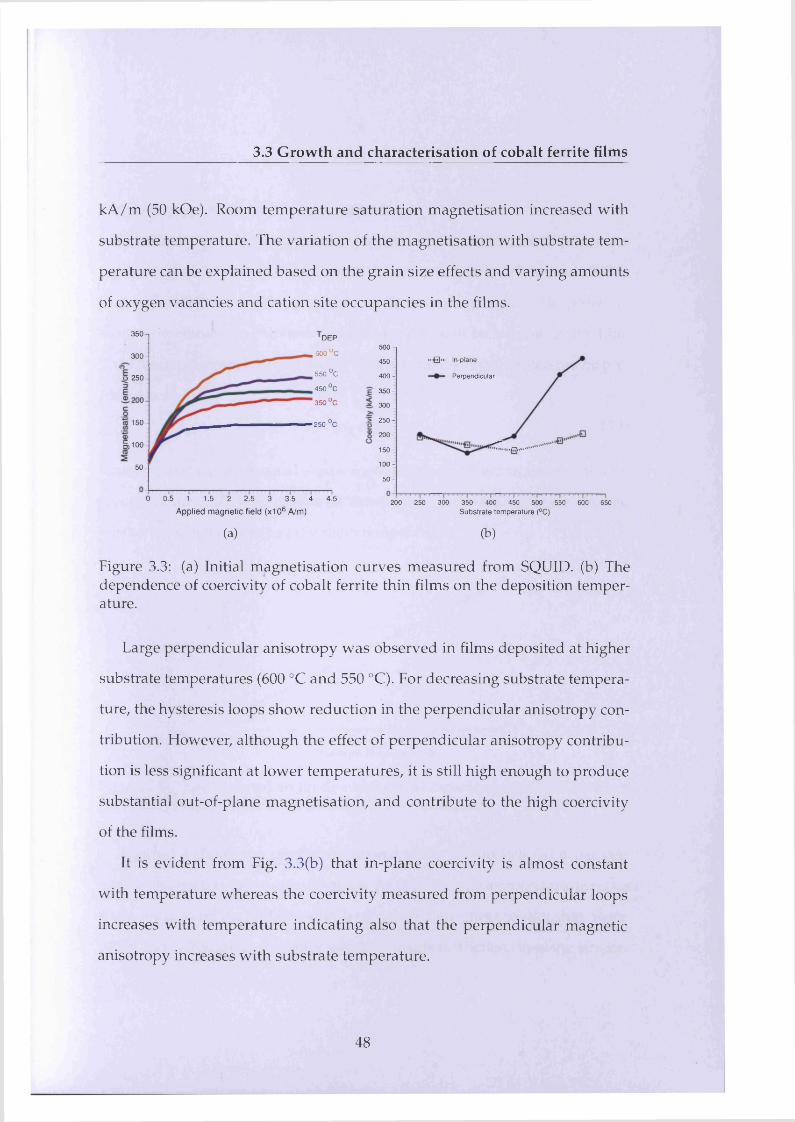
3.3 Growth and characterisation of cobalt ferrite films
kA/m (50 kOe). Room temperature saturation magnetisation increased with
substrate temperature. The variation of the magnetisation with substrate tem
perature can be explained based on the grain size effects and varying amounts
of oxygen vacancies and cation site occupancies in the films.
350 D E P
600 °C300-
550 °C
450 °C
350 °C
o 250-
250 °C150-
§>100-
50-
0 0.5 1 1.5 2 2.5 3 3.5 4 4.5
500 -i
" f l » In-plane4 50-
4 00- Perpendicular
3 50-
3 00-
2 50-
2 00 -
150-
1 0 0 -
5 0 -
Applied m agnetic field (x106 A/m)
(a)
200 250 300 350 400 450 500 550 600 650Substrate temperature (°C)
(b)
Figure 3.3: (a) Initial magnetisation curves measured from SQUID, (b) The dependence of coercivity of cobalt ferrite thin films on the deposition temperature.
Large perpendicular anisotropy was observed in films deposited at higher
substrate temperatures (600 °C and 550 °C). For decreasing substrate tempera
ture, the hysteresis loops show reduction in the perpendicular anisotropy con
tribution. However, although the effect of perpendicular anisotropy contribu
tion is less significant at lower temperatures, it is still high enough to produce
substantial out-of-plane magnetisation, and contribute to the high coercivity
of the films.
It is evident from Fig. 3.3(b) that in-plane coercivity is almost constant
with temperature whereas the coercivity measured from perpendicular loops
increases with temperature indicating also that the perpendicular magnetic
anisotropy increases with substrate temperature.
48
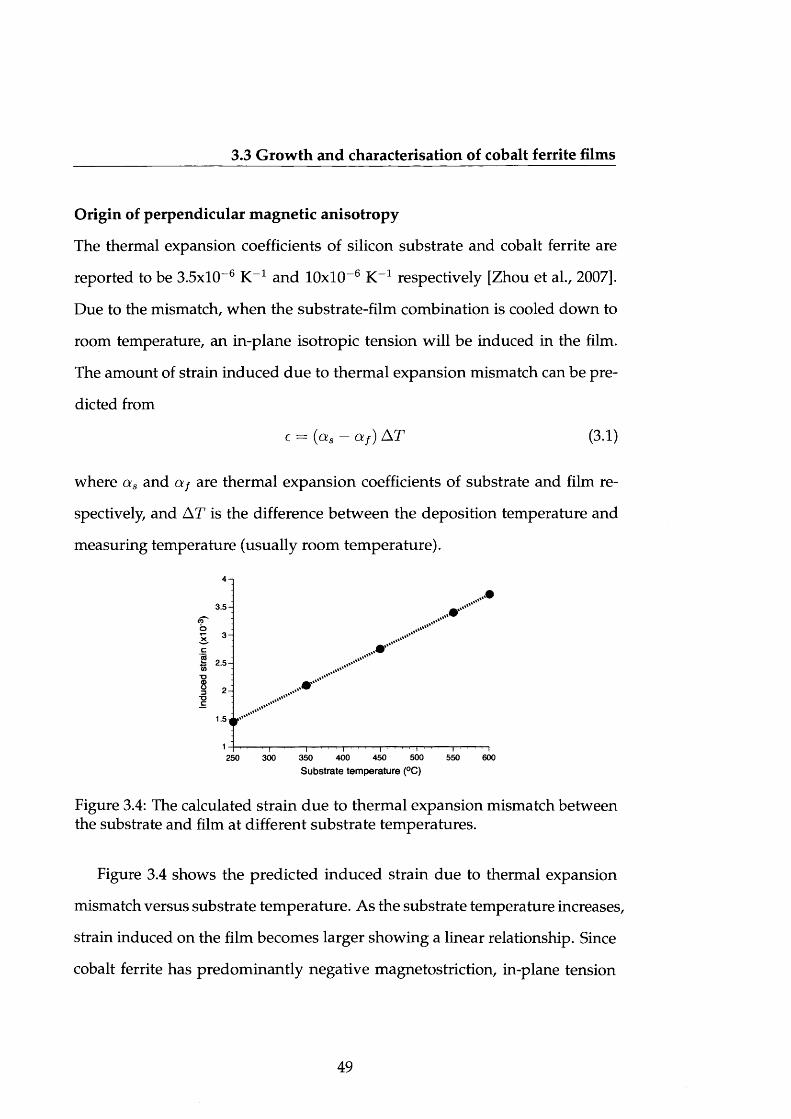
3.3 Growth and characterisation of cobalt ferrite films
Origin of perpendicular magnetic anisotropy
The thermal expansion coefficients of silicon substrate and cobalt ferrite are
reported to be 3.5xl0~6 K-1 and lOxlO-6 K-1 respectively [Zhou et al., 2007].
Due to the mismatch, when the substrate-film combination is cooled down to
room temperature, an in-plane isotropic tension will be induced in the film.
The amount of strain induced due to thermal expansion mismatch can be pre
dicted from
e = (a8 — otf) AT (3.1)
where as and af are thermal expansion coefficients of substrate and film re
spectively, and AT is the difference between the deposition temperature and
measuring temperature (usually room temperature).
3 .5 -
1.5:
%»*
' ) —I I250 300 350 400 450 500 550 600
Substrate temperature (°C)
Figure 3.4: The calculated strain due to thermal expansion mismatch between the substrate and film at different substrate temperatures.
Figure 3.4 shows the predicted induced strain due to thermal expansion
mismatch versus substrate temperature. As the substrate temperature increases,
strain induced on the film becomes larger showing a linear relationship. Since
cobalt ferrite has predominantly negative magnetostriction, in-plane tension
49
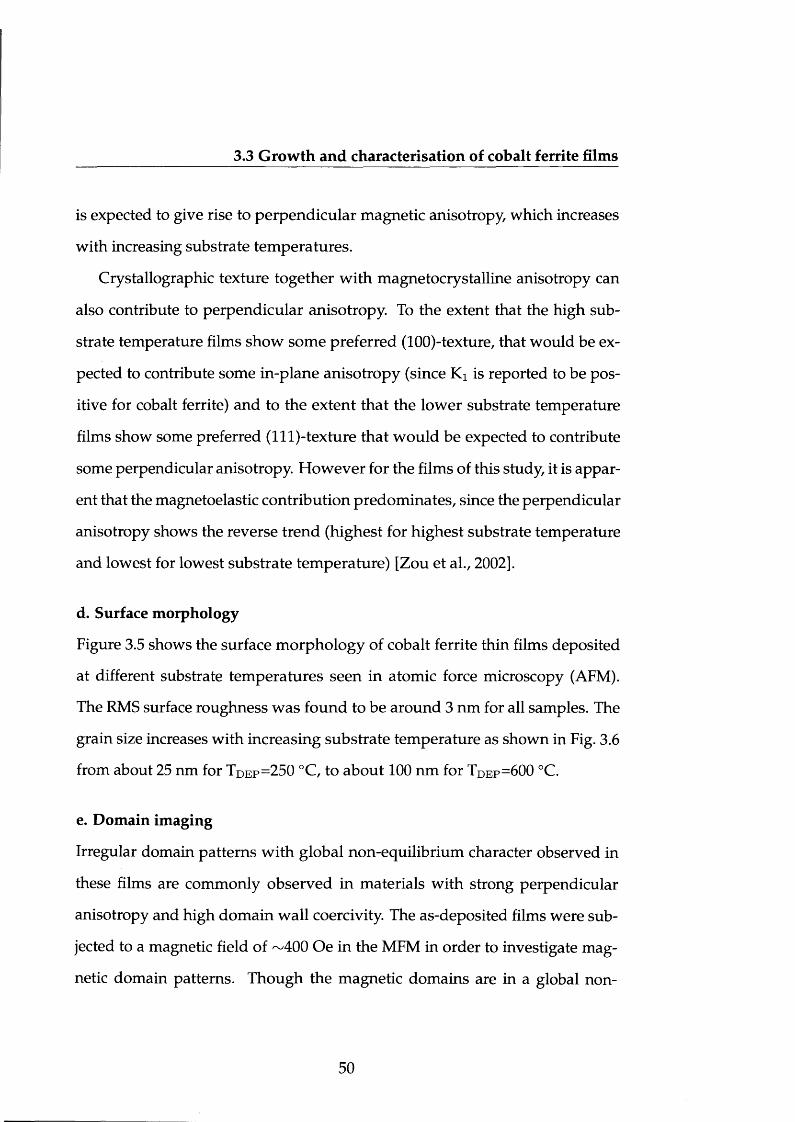
3.3 Growth and characterisation of cobalt ferrite films
is expected to give rise to perpendicular magnetic anisotropy, which increases
with increasing substrate temperatures.
Crystallographic texture together with magnetocrystalline anisotropy can
also contribute to perpendicular anisotropy. To the extent that the high sub
strate temperature films show some preferred (lOO)-texture, that would be ex
pected to contribute some in-plane anisotropy (since Ki is reported to be pos
itive for cobalt ferrite) and to the extent that the lower substrate temperature
films show some preferred (lll)-tex ture that would be expected to contribute
some perpendicular anisotropy. However for the films of this study, it is appar
ent that the magnetoelastic contribution predominates, since the perpendicular
anisotropy shows the reverse trend (highest for highest substrate temperature
and lowest for lowest substrate temperature) [Zou et al., 2002].
d. Surface morphology
Figure 3.5 shows the surface morphology of cobalt ferrite thin films deposited
at different substrate temperatures seen in atomic force microscopy (AFM).
The RMS surface roughness was found to be around 3 nm for all samples. The
grain size increases with increasing substrate temperature as shown in Fig. 3.6
from about 25 nm for TDep=250 °C, to about 100 nm for TDEP=600 °C.
e. Domain imaging
Irregular domain patterns with global non-equilibrium character observed in
these films are commonly observed in materials with strong perpendicular
anisotropy and high domain wall coercivity. The as-deposited films were sub
jected to a magnetic field of —400 Oe in the MFM in order to investigate mag
netic domain patterns. Though the magnetic domains are in a global non-
50
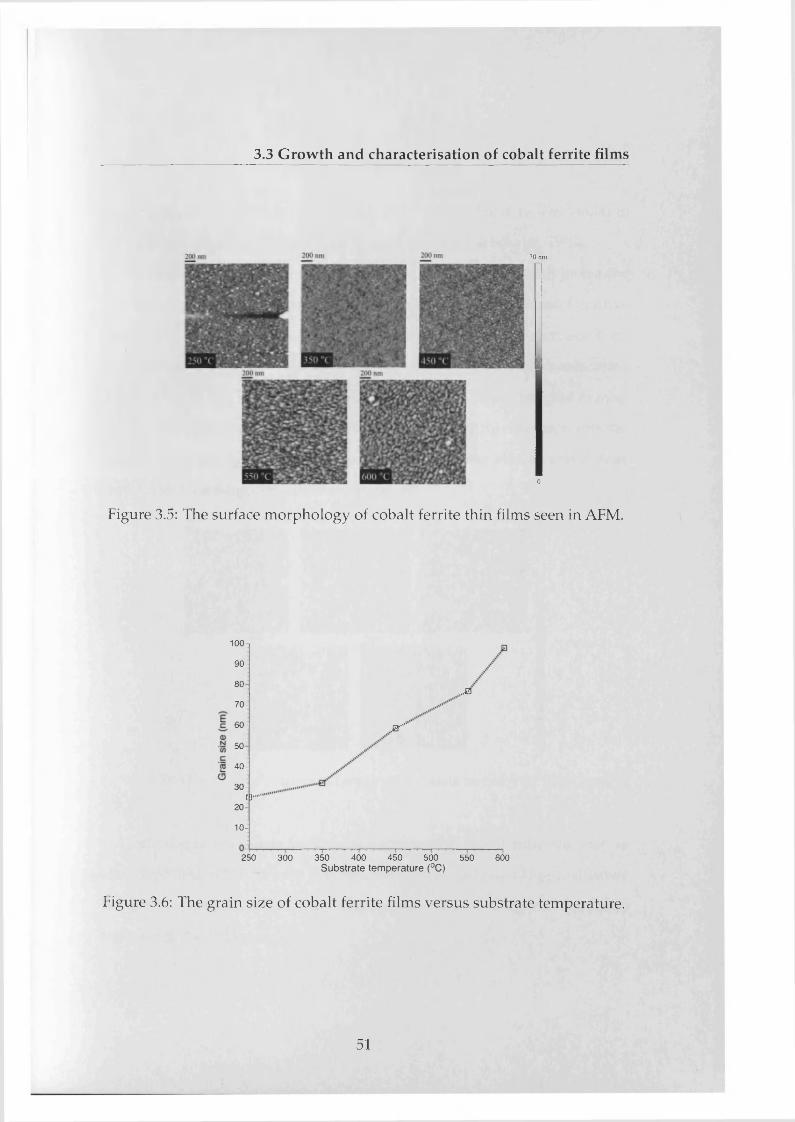
3.3 Growth and characterisation of cobalt ferrite films
70 nm
0
Figure 3.5: The surface morphology of cobalt ferrite thin films seen in AFM.
1 0 0 - i
90-
80
70-
60-
50
40-
30-[20
10 -
[ J....
JB
.0"“’
250 300 350 400 450 500 550Substrate temperature (°C)
600
Figure 3.6: The grain size of cobalt ferrite films versus substrate temperature.
51
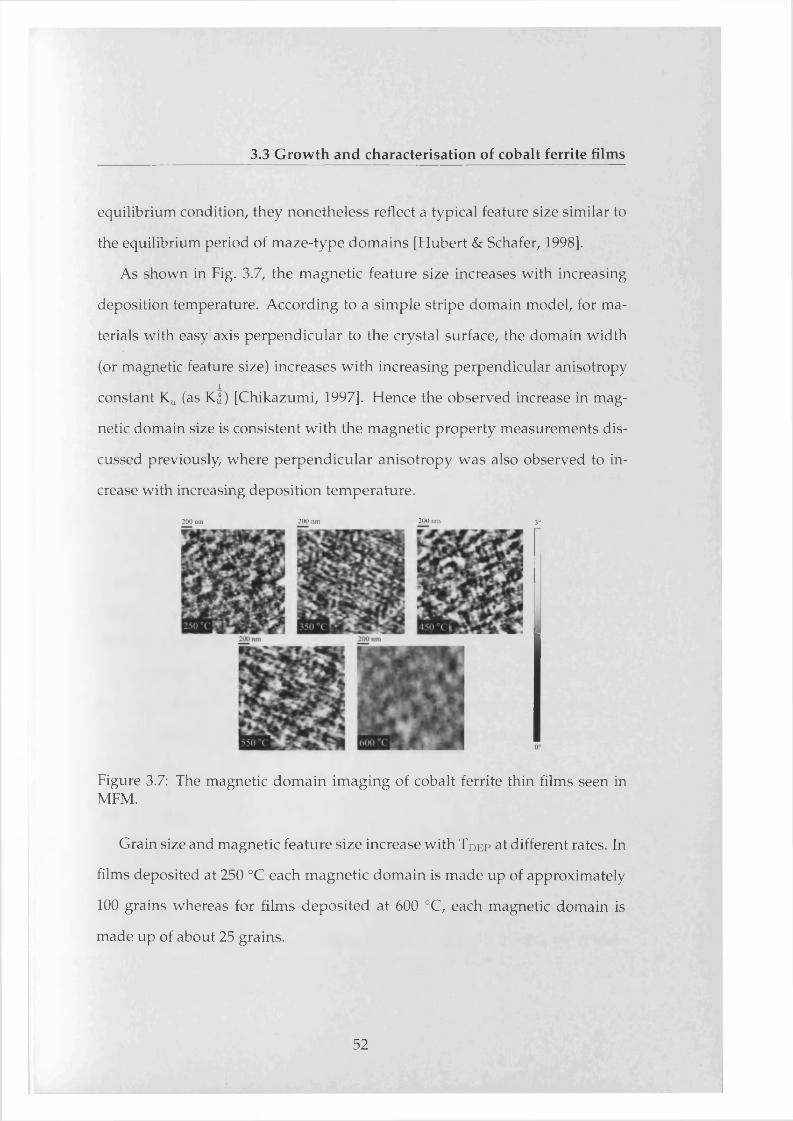
3.3 Growth and characterisation of cobalt ferrite films
equilibrium condition, they nonetheless reflect a typical feature size similar to
the equilibrium period of maze-type domains [Hubert & Schafer, 1998].
As shown in Fig. 3.7, the magnetic feature size increases with increasing
deposition temperature. According to a simple stripe domain model, for ma
terials with easy axis perpendicular to the crystal surface, the domain width
(or magnetic feature size) increases with increasing perpendicular anisotropyi
constant Ku (as IQ) [Chikazumi, 1997]. Hence the observed increase in mag
netic domain size is consistent with the magnetic property measurements dis
cussed previously, where perpendicular anisotropy was also observed to in
crease with increasing deposition temperature.
200 nm 200 nm 200 nm 30
Figure 3.7: The magnetic domain imaging of cobalt ferrite thin films seen in MFM.
Grain size and magnetic feature size increase with TDEP at different rates. In
films deposited at 250 °C each magnetic domain is made up of approximately
100 grains whereas for films deposited at 600 °C, each magnetic domain is
made up of about 25 grains.
52
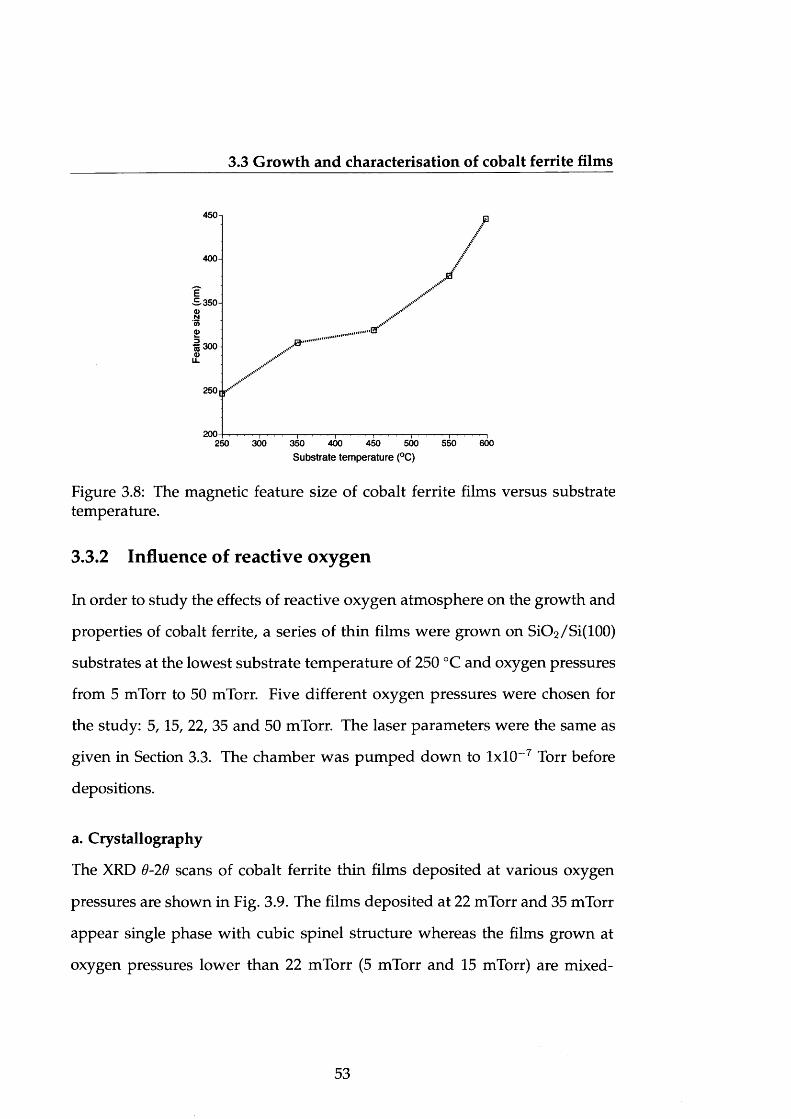
3.3 Growth and characterisation of cobalt ferrite films
450-1
400-
ES 3 5 0 - 0)N‘55 CD
15 300- ®
u .
250T
2 0 0 — 1 1 1 1 i 1 . i------- 1------- 1 1 ! 1 - 1 i ......... 1.... i 1 1 1 i250 300 350 400 450 500 550 600
Substrate temperature (°C)
Figure 3.8: The magnetic feature size of cobalt ferrite films versus substrate temperature.
3.3.2 Influence of reactive oxygen
In order to study the effects of reactive oxygen atmosphere on the growth and
properties of cobalt ferrite, a series of thin films were grown on SiO2/Si(100)
substrates at the lowest substrate tem perature of 250 °C and oxygen pressures
from 5 mTorr to 50 mTorr. Five different oxygen pressures were chosen for
the study: 5, 15, 22, 35 and 50 mTorr. The laser parameters were the same as
given in Section 3.3. The chamber was pum ped down to lxlO-7 Torr before
depositions.
a. Crystallography
The XRD 6-20 scans of cobalt ferrite thin films deposited at various oxygen
pressures are shown in Fig. 3.9. The films deposited at 22 mTorr and 35 mTorr
appear single phase with cubic spinel structure whereas the films grown at
oxygen pressures lower than 22 mTorr (5 mTorr and 15 mTorr) are mixed-
53
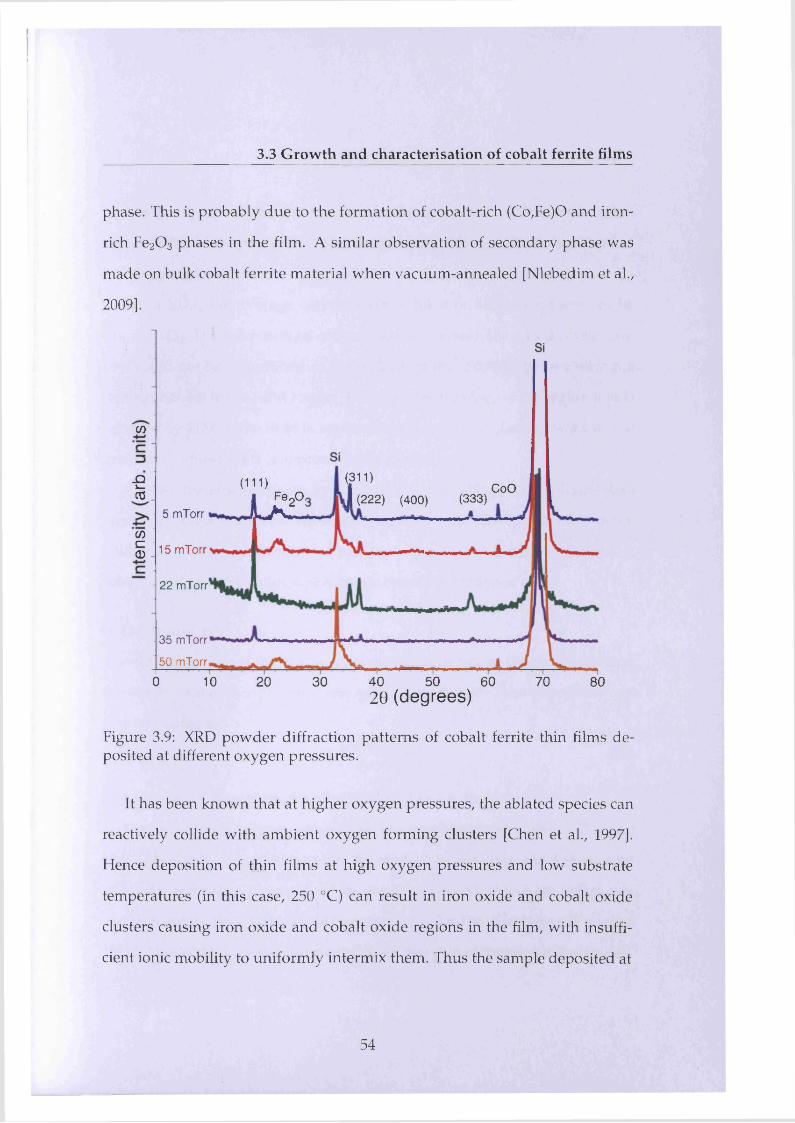
3.3 Growth and characterisation of cobalt ferrite films
phase. This is probably due to the formation of cobalt-rich (Co,Fe)0 and iron-
rich Fe2C>3 phases in the film. A similar observation of secondary phase was
made on bulk cobalt ferrite material when vacuum-annealed [Nlebedim et al.,
2009].
co
(311)J (222) (400) (333)
.Qi — (111) CoO03 Fe«0
Lk L5 mTorr(Oc<D 15 mTorr
22 mTorr
35 mTorr50 mTorr,
0 40 50 60 7010 20 30 8026 (degrees)
Figure 3.9: XRD powder diffraction patterns of cobalt ferrite thin films deposited at different oxygen pressures.
It has been known that at higher oxygen pressures, the ablated species can
reactively collide with ambient oxygen forming clusters [Chen et al., 1997].
Hence deposition of thin films at high oxygen pressures and low substrate
temperatures (in this case, 250 °C) can result in iron oxide and cobalt oxide
clusters causing iron oxide and cobalt oxide regions in the film, with insuffi
cient ionic mobility to uniformly intermix them. Thus the sample deposited at
54
3.3 Growth and characterisation of cobalt ferrite films
high oxygen pressure also shows several structural phases, although the cation
compositions of the phases could be considerably different than what forms at
low oxygen pressures.
From EDX, the average composition of all thin films was found to be
C01.1Fe1.9O4. The compositions of the different phases in the mixed-phase sam
ples could not be determined as the regions of the different phases were not
distinguishable in the SEM image. This is not surprising, as the region that is
sampled by EDX in the SEM is approximately 1 fim dimensions, whereas the
grain size in these films is approximately 25 nm.
This analysis suggests that, for the optimised growth of single phase cobalt
ferrite thin films at the low substrate temperature of 250 °C and these depo
sition rates, there is a window of reactive oxygen pressure above and below
which the correct crystallographic phase cannot be achieved.
b. Deposition rate
The deposition rate of the PLD system mainly depends on the orientation and
directivity of the laser plume at any given laser fluence. The deposition rate
was calculated asthickness
d = ^ t a T (3'2)
The duration of deposition for all thin films was 1 hour.
Figure 3.10 shows that the deposition rate decreases rapidly after ~22 mTorr.
This observation is consistent with the study by Gorbunov and Konov who
showed that the laser plume broadens due to collisions between ejected species
and ambient oxygen at oxygen pressures above 22 mTorr [Gorbunov & Konov,
1991]. These collisions also reduce the mean free path of the ejected species and
55
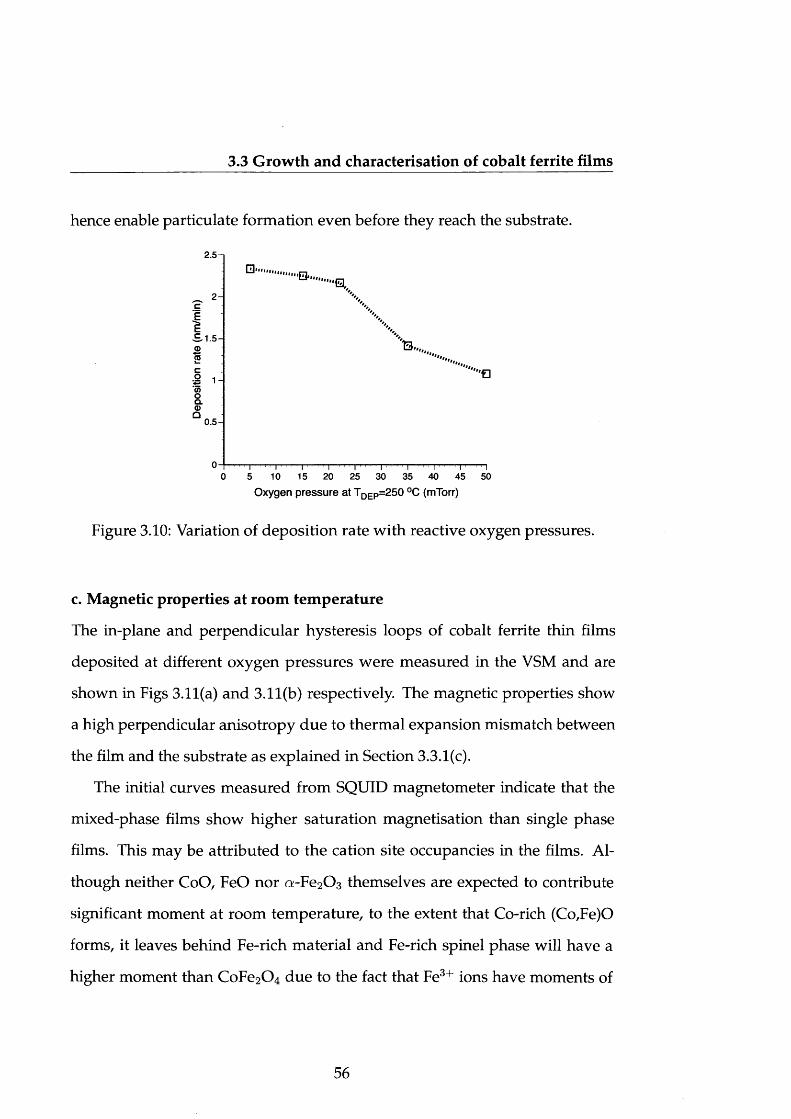
3.3 Growth and characterisation of cobalt ferrite films
hence enable particulate formation even before they reach the substrate.
2.5-1
^ 2 c '£E£ 1 .5 -<Drac•I H <0 oCL (1)Q
0.5-^
Q,,, ....El
'El
" i,! ■ i 1 ■ i .....r"i......." ~r..... ~r~.....1 " 1 11 " | 111 r | ' i5 10 15 20 25 30 35 40 45 50
Oxygen pressure at TDEP=250 °C (mTorr)
Figure 3.10: Variation of deposition rate with reactive oxygen pressures.
c. Magnetic properties at room temperature
The in-plane and perpendicular hysteresis loops of cobalt ferrite thin films
deposited at different oxygen pressures were measured in the VSM and are
shown in Figs 3.11(a) and 3.11(b) respectively. The magnetic properties show
a high perpendicular anisotropy due to thermal expansion mismatch between
the film and the substrate as explained in Section 3.3.1(c).
The initial curves measured from SQUID magnetometer indicate that the
mixed-phase films show higher saturation magnetisation than single phase
films. This may be attributed to the cation site occupancies in the films. Al
though neither CoO, FeO nor n-Fe203 themselves are expected to contribute
significant moment at room temperature, to the extent that Co-rich (Co,Fe)0
forms, it leaves behind Fe-rich material and Fe-rich spinel phase will have a
higher moment than CoFe2 0 4 due to the fact that Fe3+ ions have moments of
56
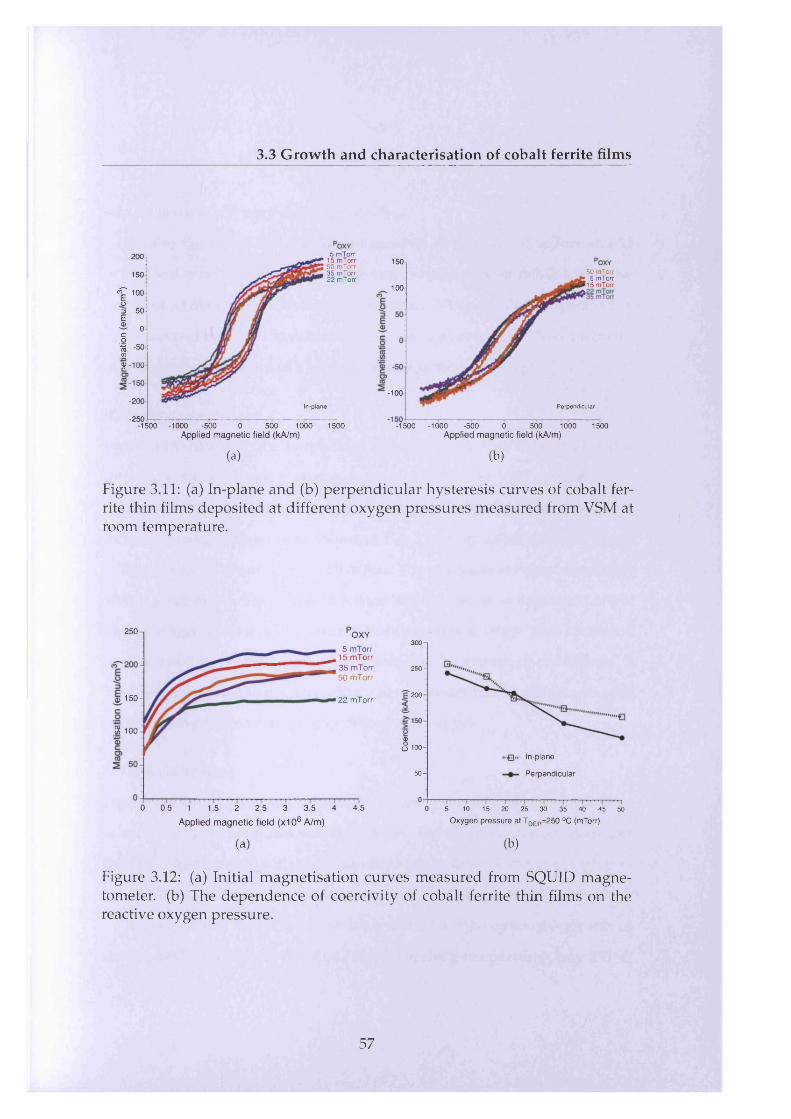
3.3 Growth and characterisation of cobalt ferrite films
200
150
^ 10003 50 EA 0 .11 2-100
'•a -so
-150
-200
-250
5 mTorr15 mTorr50 mTorr35 mTorr22 mTorr
In-plane
-1500 -1000 -500 0 500 1000 1500Applied m agnetic field (kA/m)
(a)
150
100
-100
5 0 mTorr5 mTorr
15 mTorr
Perpendicular
-1500 -1000 -500 0 500 1000 1500A pplied m agnetic field (kA/m)
(b)
Figure 3.11: (a) In-plane and (b) perpendicular hysteresis curves of cobalt ferrite thin films deposited at different oxygen pressures measured from VSM at room temperature.
250 OXY
5 mTorr 15 mTorr 35 mTorr 50 mTorr
© 150- 22 mTorr
$ 100
0 0.5 1 1.5 2 2.5 3 3 .5 4 4.5
Applied magnetic field (x106 A/m)
(a)
300n
2 50-
200
8o 100-■Qi. In-plane
Perpendicular5 0 -
5 10 15 20 25 30 35 40 45 50
Oxygen pressure at TDEp=250 °C (mTorr)
(b)
Figure 3.12: (a) Initial magnetisation curves measured from SQUID magnetometer. (b) The dependence of coercivity of cobalt ferrite thin films on the reactive oxygen pressure.
57
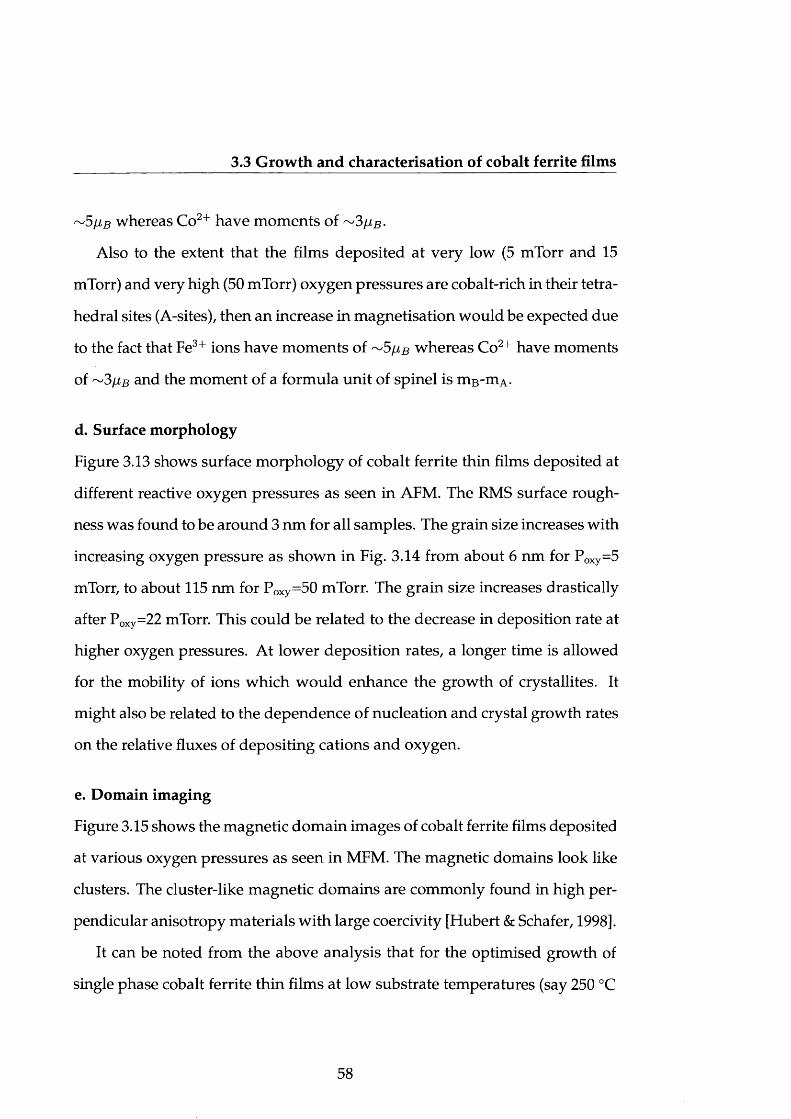
3.3 Growth and characterisation of cobalt ferrite films
~5hb whereas Co2+ have moments of 3 hb-
Also to the extent that the films deposited at very low (5 mTorr and 15
mTorr) and very high (50 mTorr) oxygen pressures are cobalt-rich in their tetra
hedral sites (A-sites), then an increase in magnetisation would be expected due
to the fact that Fe3+ ions have moments of ~5/i# whereas Co2+ have moments
of ~3hb and the moment of a formula unit of spinel is mB-mA.
d. Surface morphology
Figure 3.13 shows surface morphology of cobalt ferrite thin films deposited at
different reactive oxygen pressures as seen in AFM. The RMS surface rough
ness was found to be around 3 nm for all samples. The grain size increases with
increasing oxygen pressure as shown in Fig. 3.14 from about 6 nm for P O X y = 5
mTorr, to about 1 1 5 nm for P o x y = 5 0 mTorr. The grain size increases drastically
after P o x y = 2 2 mTorr. This could be related to the decrease in deposition rate at
higher oxygen pressures. At lower deposition rates, a longer time is allowed
for the mobility of ions which would enhance the growth of crystallites. It
might also be related to the dependence of nucleation and crystal growth rates
on the relative fluxes of depositing cations and oxygen.
e. Domain imaging
Figure 3.15 shows the magnetic domain images of cobalt ferrite films deposited
at various oxygen pressures as seen in MFM. The magnetic domains look like
clusters. The cluster-like magnetic domains are commonly found in high per
pendicular anisotropy materials with large coercivity [Hubert & Schafer, 1998].
It can be noted from the above analysis that for the optimised growth of
single phase cobalt ferrite thin films at low substrate temperatures (say 250 °C
58
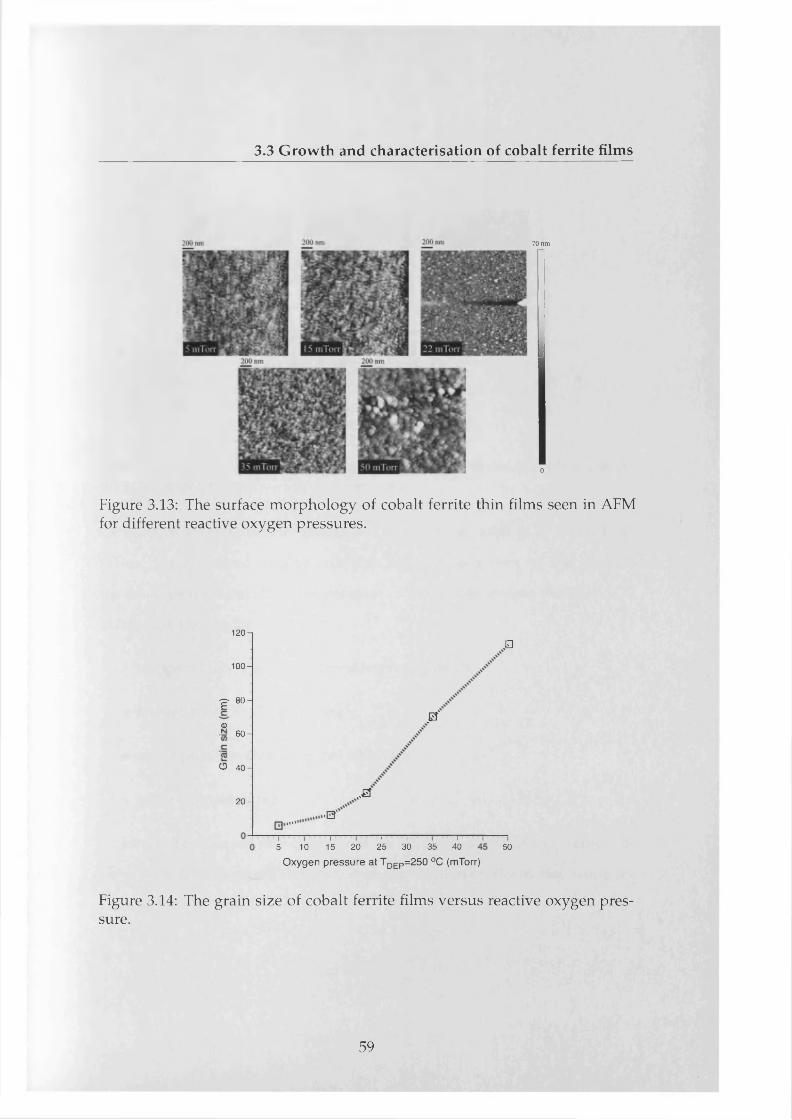
3.3 Growth and characterisation of cobalt ferrite films
70nni
0
Figure 3.13: The surface morphology of cobalt ferrite thin films seen in AFM for different reactive oxygen pressures.
120 -
100 -
J3
? «H 0)
~ 60 H
.ET'
0 4 0 -
20 -JB
....0
T"25
TTr30
T 1405 10 15 20 25 30 35
Oxygen pressure at TDEP=250 °C (mTorr)50
Figure 3.14: The grain size of cobalt ferrite films versus reactive oxygen pressure.
59
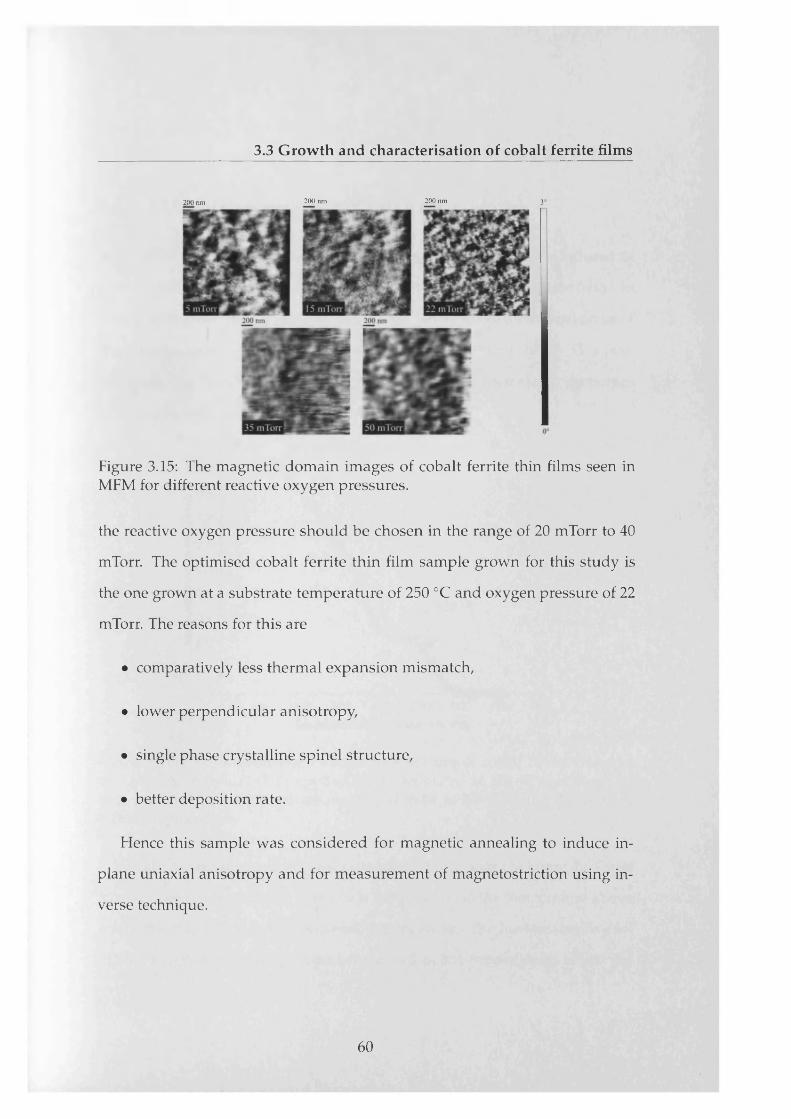
3.3 Growth and characterisation of cobalt ferrite films
200 nm 200 nm 200 nm J»
Figure 3.15: The magnetic domain images of cobalt ferrite thin films seen in MFM for different reactive oxygen pressures.
the reactive oxygen pressure should be chosen in the range of 20 mTorr to 40
mTorr. The optimised cobalt ferrite thin film sample grown for this study is
the one grown at a substrate temperature of 250 °C and oxygen pressure of 22
mTorr. The reasons for this are
• comparatively less thermal expansion mismatch,
• lower perpendicular anisotropy,
• single phase crystalline spinel structure,
• better deposition rate.
Hence this sample was considered for magnetic annealing to induce in
plane uniaxial anisotropy and for measurement of magnetostriction using in
verse technique.
60
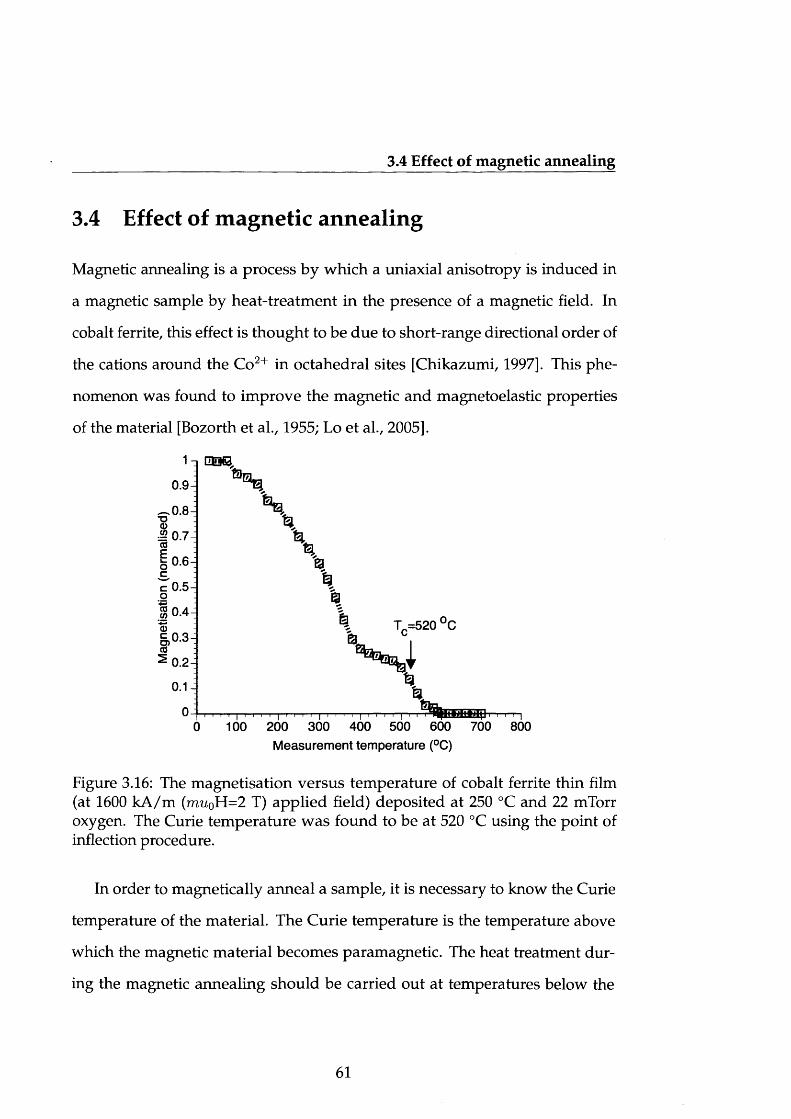
3.4 Effect of magnetic annealing
3.4 Effect of magnetic annealing
Magnetic annealing is a process by which a uniaxial anisotropy is induced in
a magnetic sample by heat-treatment in the presence of a magnetic field. In
cobalt ferrite, this effect is thought to be due to short-range directional order of
the cations around the Co2+ in octahedral sites [Chikazumi, 1997]. This phe
nomenon was found to improve the magnetic and magnetoelastic properties
of the material [Bozorth et al., 1955; Lo et al., 2005].
Figure 3.16: The magnetisation versus temperature of cobalt ferrite thin film (at 1600 kA /m (mu0H=2 T) applied field) deposited at 250 °C and 22 mTorr oxygen. The Curie temperature was found to be at 520 °C using the point of inflection procedure.
In order to magnetically anneal a sample, it is necessary to know the Curie
temperature of the material. The Curie temperature is the temperature above
which the magnetic material becomes paramagnetic. The heat treatment dur
ing the magnetic annealing should be carried out at temperatures below the
1-n QES0,
0.9-|
T =520 °Cc
— I I I I I I I I I I I I I I I I I I I I I I I I I I I I I I I
0 100 200 300 400 500 600 700 800Measurement temperature (°C)
61
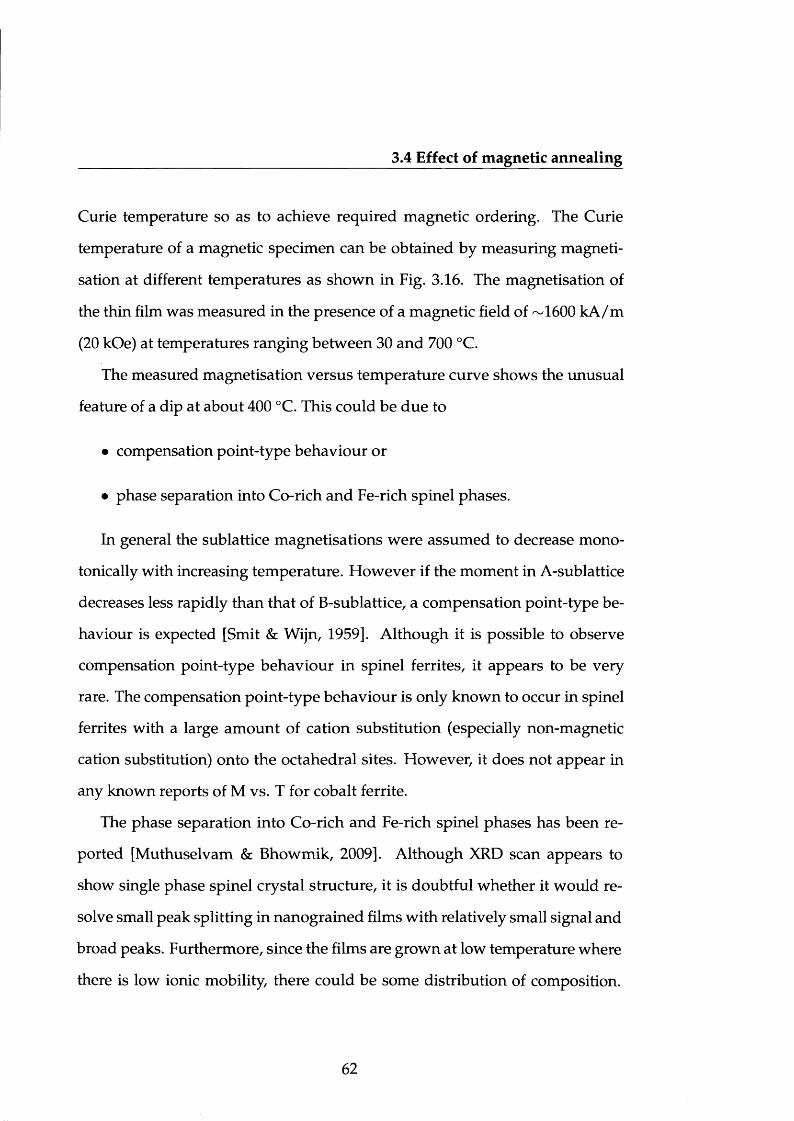
3.4 Effect of magnetic annealing
Curie temperature so as to achieve required magnetic ordering. The Curie
temperature of a magnetic specimen can be obtained by measuring magneti
sation at different temperatures as shown in Fig. 3.16. The magnetisation of
the thin film was measured in the presence of a magnetic field of ~1600 kA /m
(20 kOe) at temperatures ranging between 30 and 700 °C.
The measured magnetisation versus temperature curve shows the unusual
feature of a dip at about 400 °C. This could be due to
• compensation point-type behaviour or
• phase separation into Co-rich and Fe-rich spinel phases.
In general the sublattice magnetisations were assumed to decrease mono-
tonically with increasing temperature. However if the moment in A-sublattice
decreases less rapidly than that of B-sublattice, a compensation point-type be
haviour is expected [Smit & Wijn, 1959]. Although it is possible to observe
compensation point-type behaviour in spinel ferrites, it appears to be very
rare. The compensation point-type behaviour is only known to occur in spinel
ferrites with a large amount of cation substitution (especially non-magnetic
cation substitution) onto the octahedral sites. However, it does not appear in
any known reports of M vs. T for cobalt ferrite.
The phase separation into Co-rich and Fe-rich spinel phases has been re
ported [Muthuselvam & Bhowmik, 2009]. Although XRD scan appears to
show single phase spinel crystal structure, it is doubtful whether it would re
solve small peak splitting in nanograined films with relatively small signal and
broad peaks. Furthermore, since the films are grown at low temperature where
there is low ionic mobility, there could be some distribution of composition.
62
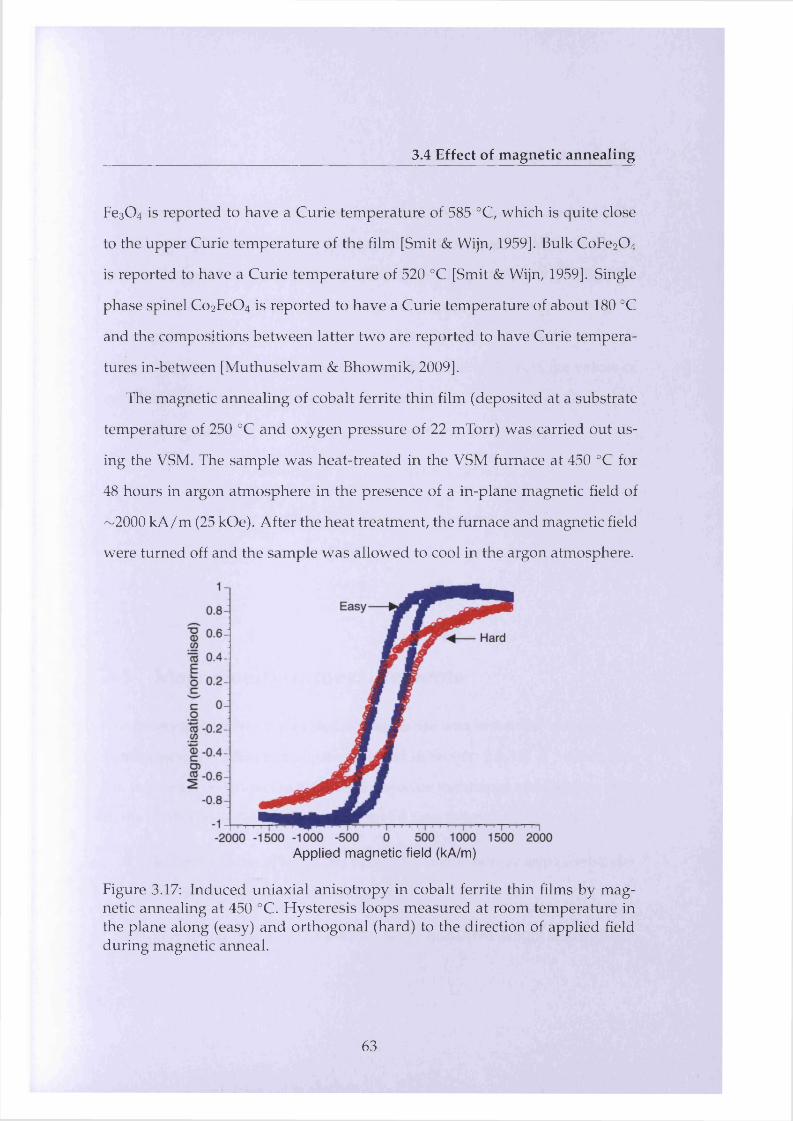
3.4 Effect of magnetic annealing
Fe30 4 is reported to have a Curie temperature of 585 °C, which is quite close
to the upper Curie temperature of the film [Smit & Wijn, 1959]. Bulk CoFe20 4
is reported to have a Curie temperature of 520 °C [Smit & Wijn, 1959]. Single
phase spinel Co2Fe04 is reported to have a Curie temperature of about 180 °C
and the compositions between latter two are reported to have Curie tempera
tures in-between [Muthuselvam & Bhowmik, 2009].
The magnetic annealing of cobalt ferrite thin film (deposited at a substrate
temperature of 250 °C and oxygen pressure of 22 mTorr) was carried out us
ing the VSM. The sample was heat-treated in the VSM furnace at 450 °C for
48 hours in argon atmosphere in the presence of a in-plane magnetic field of
~2000 kA/m (25 kOe). After the heat treatment, the furnace and magnetic field
were turned off and the sample was allowed to cool in the argon atmosphere.
Applied magnetic field (kA/m)
Figure 3.17: Induced uniaxial anisotropy in cobalt ferrite thin films by magnetic annealing at 450 °C. Hysteresis loops measured at room temperature in the plane along (easy) and orthogonal (hard) to the direction of applied field during magnetic anneal.
63
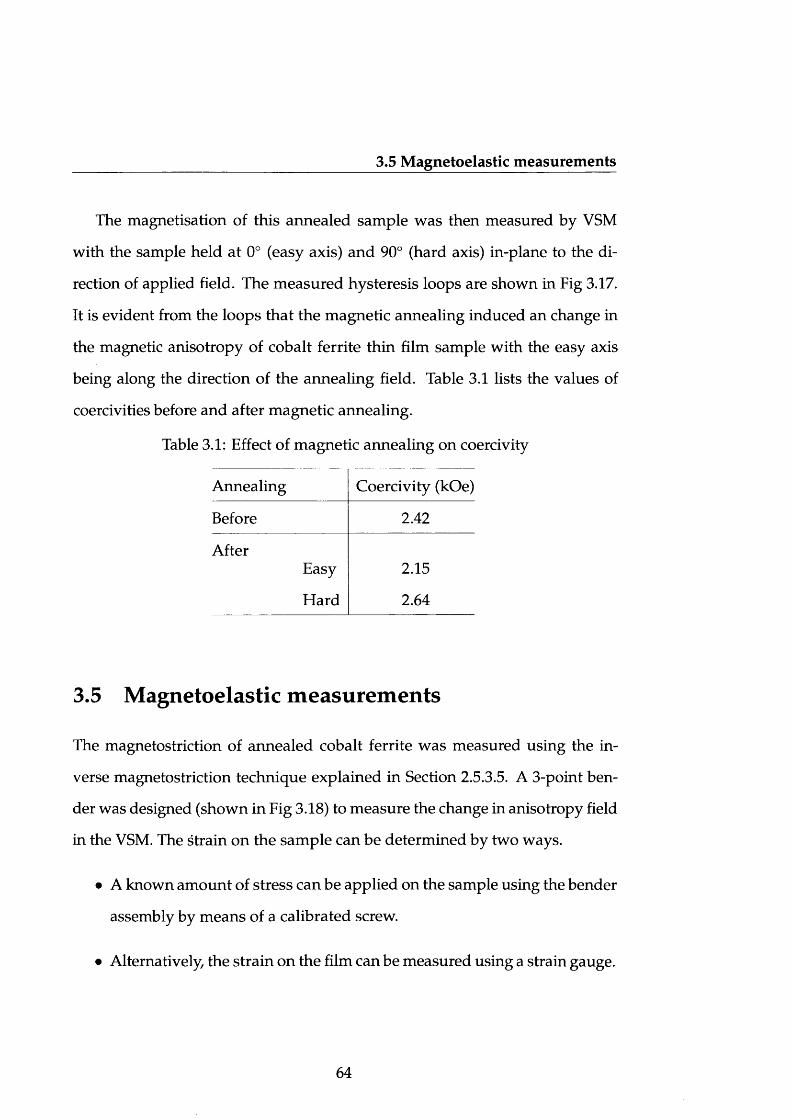
3.5 Magnetoelastic measurements
The magnetisation of this annealed sample was then measured by VSM
with the sample held at 0° (easy axis) and 90° (hard axis) in-plane to the di
rection of applied field. The measured hysteresis loops are shown in Fig 3.17.
It is evident from the loops that the magnetic annealing induced an change in
the magnetic anisotropy of cobalt ferrite thin film sample with the easy axis
being along the direction of the annealing field. Table 3.1 lists the values of
coercivities before and after magnetic annealing.
Table 3.1: Effect of magnetic annealing on coercivity
Annealing Coercivity (kOe)
Before 2.42
AfterEasy 2.15
Hard 2.64
3.5 Magnetoelastic measurements
The magnetostriction of annealed cobalt ferrite was measured using the in
verse magnetostriction technique explained in Section 2.5.3.5. A 3-point ben
der was designed (shown in Fig 3.18) to measure the change in anisotropy field
in the VSM. The strain on the sample can be determined by two ways.
• A known amount of stress can be applied on the sample using the bender
assembly by means of a calibrated screw.
• Alternatively, the strain on the film can be measured using a strain gauge.
64
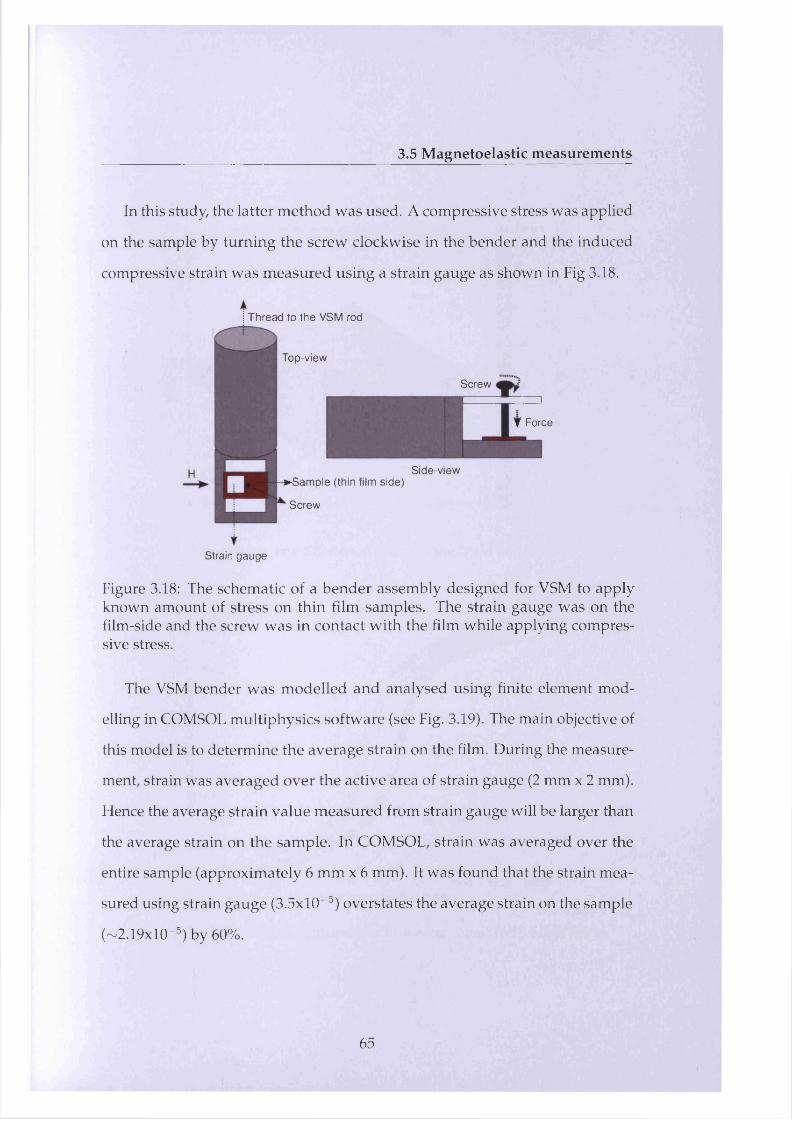
3.5 Magnetoelastic measurements
In this study, the latter method was used. A compressive stress was applied
on the sample by turning the screw clockwise in the bender and the induced
compressive strain was measured using a strain gauge as shown in Fig 3.18.
Thread to the VSM rod
Top-view
Screw
T Force
Side-view►Sample (thin film side)
Screw
Strain gauge
Figure 3.18: The schematic of a bender assembly designed for VSM to apply known amount of stress on thin film samples. The strain gauge was on the film-side and the screw was in contact with the film while applying compressive stress.
The VSM bender was modelled and analysed using finite element mod
elling in COMSOL multiphysics software (see Fig. 3.19). The main objective of
this model is to determine the average strain on the film. During the measure
ment, strain was averaged over the active area of strain gauge (2 mm x 2 mm).
Hence the average strain value measured from strain gauge will be larger than
the average strain on the sample. In COMSOL, strain was averaged over the
entire sample (approximately 6 mm x 6 mm). It was found that the strain mea
sured using strain gauge (3.5xl0~5) overstates the average strain on the sample
(~2.19xl0-5) by 60%.
65
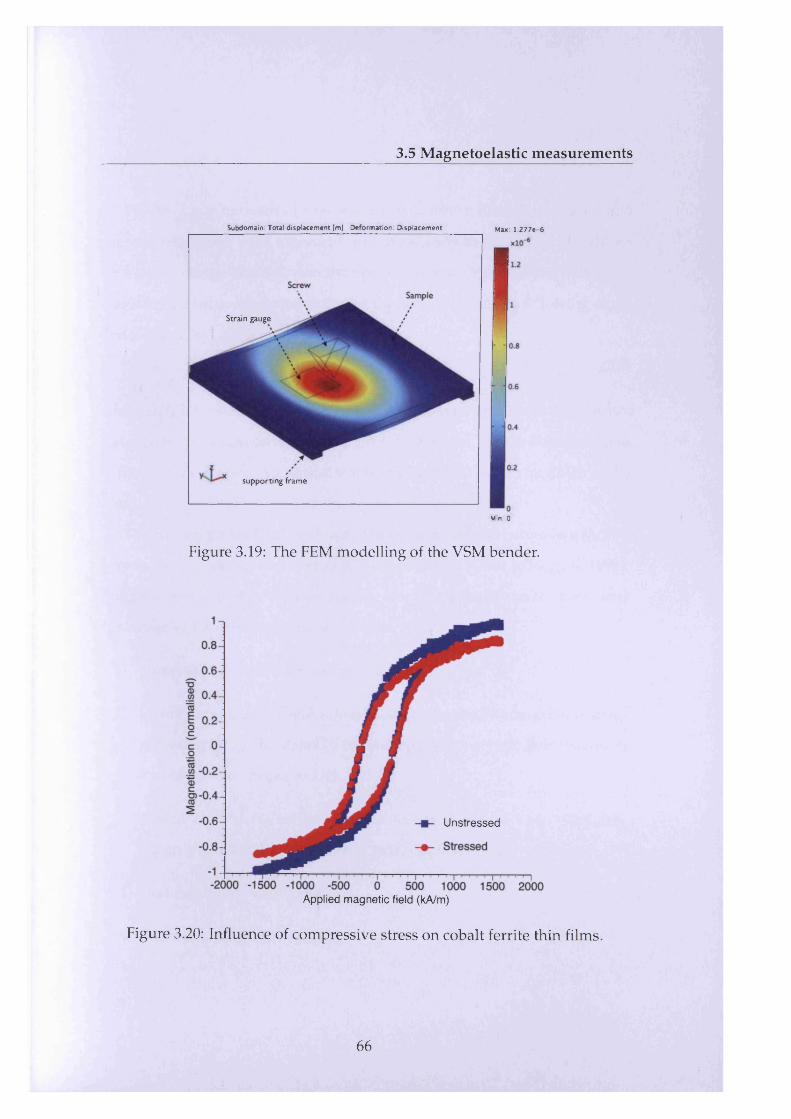
3.5 Magnetoelastic measurements
Subdomain: Total displacement [m] Deformation: Displacement Max: 1 .2 7 7 e-6
S t r a i n g a u g e
supporting frame
Mm: 0
Figure 3.19: The FEM modelling of the VSM bender.
Unstressed
Applied magnetic field (kA/m)
Figure 3.20: Influence of compressive stress on cobalt ferrite thin films.
66
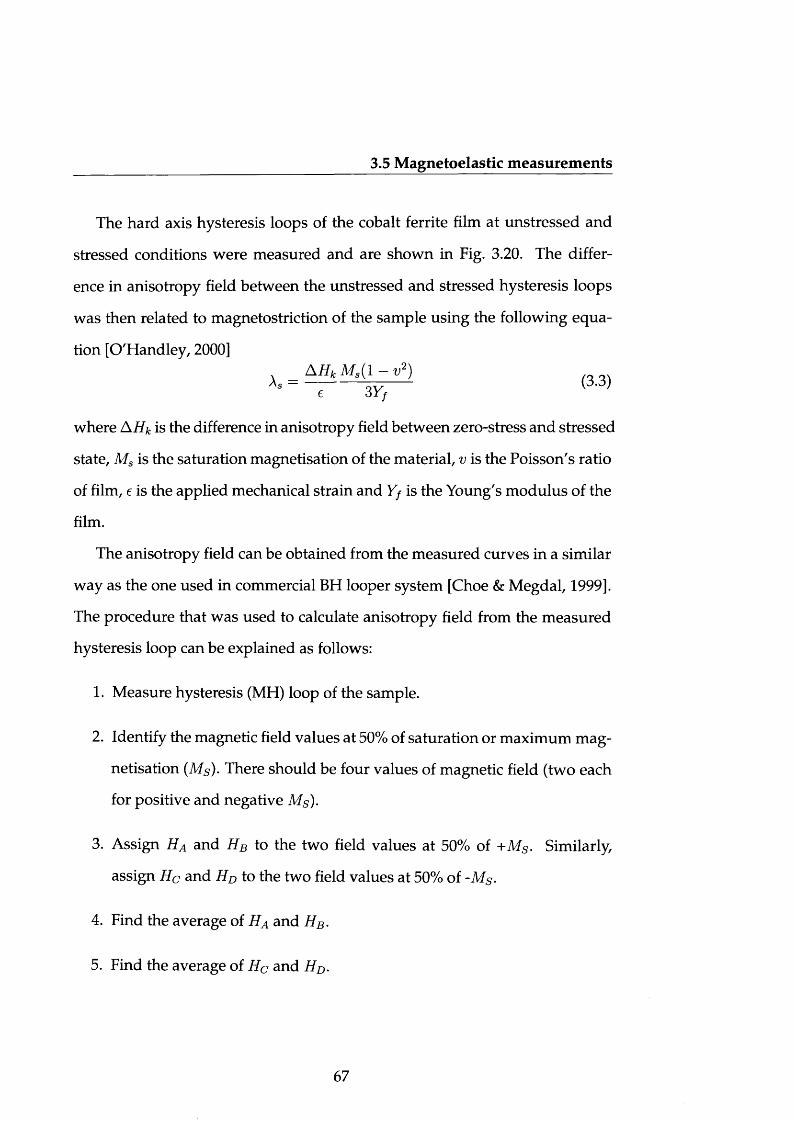
3.5 Magnetoelastic measurements
The hard axis hysteresis loops of the cobalt ferrite film at unstressed and
stressed conditions were measured and are shown in Fig. 3.20. The differ
ence in anisotropy field between the unstressed and stressed hysteresis loops
was then related to magnetostriction of the sample using the following equa
tion [O'Handley, 2000]
A ,3.3,e 6Yf
where A Hk is the difference in anisotropy field between zero-stress and stressed
state, Ms is the saturation magnetisation of the material, v is the Poisson's ratio
of film, e is the applied mechanical strain and Yj is the Young's modulus of the
film.
The anisotropy field can be obtained from the measured curves in a similar
way as the one used in commercial BH looper system [Choe & Megdal, 1999].
The procedure that was used to calculate anisotropy field from the measured
hysteresis loop can be explained as follows:
1. Measure hysteresis (MH) loop of the sample.
2. Identify the magnetic field values at 50% of saturation or maximum mag
netisation (Ms). There should be four values of magnetic field (two each
for positive and negative Ms).
3. Assign Ha and HB to the two field values at 50% of +MS. Similarly,
assign He and HD to the two field values at 50% of -Ms .
4. Find the average of HA and HB.
5. Find the average of Hc and HD.
67
3.5 Magnetoelastic measurements
6 . Find the difference between the two averages. The resulting value is the
anisotropy field of the sample.
The above procedure was carried out on both unstressed and stressed sam
ples. The difference in the anisotropy field between unstressed and stressed
sample was found to be 144.7 Oe. The saturation magnetisation, Ms, was mea
sured using SQUID magnetometer (shown in Fig. 3.3(a)) as 150 em u/cm 3 (150
kA/m). The Poisson ratio, v, was assumed to be 0.3 and the Young's modulus,
Yf, of Cobalt ferrite is 141.6 GPa [Zheng et al., 2004]. The applied mechani
cal strain, e, was calculated from finite element modelling and was 2.19xl0~5.
Substituting these values in the equation (3.3) gives
As « —211.3 x l0 ~6 (3.4)
The saturation magnetostriction of polycrystalline cobalt ferrite in bulk form
was reported as -210 x 10~6 [Bozorth, 1951]. However, bulk cobalt ferrite has
also been reported in the literature to have values ranging from -65 x 10-6 to -
225 x 10~6 depending on sample fabrication and processing conditions [Nlebe-
dim et al., 2010]. The deposited thin film falls close to the upper end of this
range.
It is interesting to note that despite the facts that the thin film has very dif
ferent Ms and coercivity than bulk cobalt ferrite, it nonetheless has a measured
magnetostriction comparable to some of the highest values measured for bulk
material.
68
3.6 Summary
3.6 Summary
• The growth of magnetoelastic thin films using pulsed-laser deposition
technique was detailed. The influence of substrate temperature and oxy
gen pressure on the magnetic properties and crystal structure of cobalt
ferrite thin films was studied.
• The growth process of cobalt ferrite thin films was optimised for low sub
strate temperature. It was found that there is only a narrow window of
reactive oxygen pressure for the growth of single phase spinel crystalline
cobalt ferrite thin films at low substrate temperatures.
• Cobalt ferrite films grown at low substrate temperature and optimised
oxygen pressure on thermal expansion matched substrates, can be ap
plied in multilayer sensors on micro electro mechanical systems (MEMS)
devices.
• The optimised cobalt ferrite thin film was magnetically annealed to suc
cessfully induce in-plane uniaxial anisotropy.
• Saturation magnetostriction was measured on the magnetically annealed
cobalt ferrite thin film based on inverse measurement technique in the
VSM. A 3-point bender was designed for this purpose.
• Despite the fact that the cobalt ferrite thin film differs from bulk material
in a number of ways, nonetheless the measured magnetostriction value
coincides with the upper end of the range of values reported for bulk
material.
69
Chapter 4
Magnetocaloric thin films
4.1 Introduction
This chapter describes the growth and characterisation of magnetocaloric thin
films. The films are deposited from a Gd5Si2Ge2 target on AIN substrates using
pulsed-laser depostion (PLD). Section 4.2 discusses the only reported previous
work in the literature on growing Gd5Si2Ge2 thin films. Section 4.3 explains the
growth conditions for the deposition of thin films. Section 4.4 determines the
best deposition temperature to grow Gd5Si2Ge2 thin films of desired phase and
composition. Section 4.5 describes several characterisation techniques used.
The measurements on crystallographic structure, composition and scanning
electron microscopy are detailed. The observation of magnetic phase trans
formation from the measured magnetisation at different temperatures is also
discussed.
70
4.2 Magnetocaloric thin films
4.2 Magnetocaloric thin films
Magnetocaloric materials, in particular Gd5(SixGei_x)4 alloys have been ex
tensively studied in their bulk form [Pecharsky & Gschneidner Jr., 1997a,b,c].
Yet with the exception of one unsuccessful attempt, there are no thin films
of these alloys reported in the literature until now. The reason for this could
be their complexity in stabilisation of crystal and phase structures which are
highly dependent on the purity of components and post-annealing processes
[Mozharivskyj et al., 2005].
The only published article in the literature is on the growth of Gd5Si2Ge2 on
Si3N4/Si substrates [Sambandam et al., 2005]. The films were sputtered from a
Gd5Si2Ge2 target. The deposited films were vacuum annealed at three different
temperatures: 700, 900 and 1150°C for 1 hr. It was found that the formation
of GdSi2 phase in the films was enhanced with increasing temperature. At
1150 °C, Gd5Si2Ge2 formed along with the GdSi2 phase. Sambandam et al.
concluded that although the magnetocaloric phase formed, the Si3N4 was not a
stable diffusion barrier. The secondary ion mass spectrometry (SIMS) analysis
at the interface of film/Si3N4/Si indicated a breakdown of the diffusion barrier
(Si3N4) and an evident inter-diffusion between the film and the substrate.
4.3 Growth of Gd5 (SixG ei_ x ) 4 thin films
In bulk form, Gd5(SixGei_x)4 alloy composition, phase, crystal structure and
the resulting magnetocaloric effect are determined by the heat treatments and
purity of the components [Mozharivskyj et al., 2005; Pecharsky & Gschneid-
71
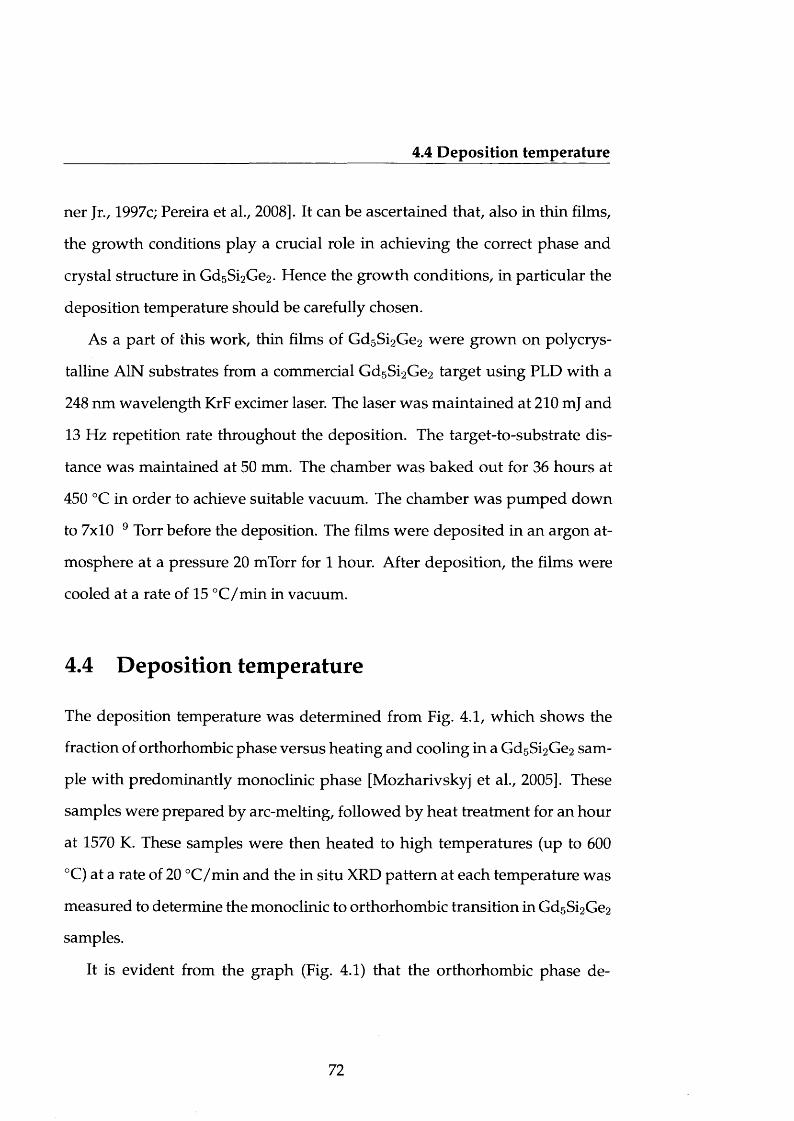
4.4 Deposition temperature
ner Jr., 1997c; Pereira et al., 2008]. It can be ascertained that, also in thin films,
the growth conditions play a crucial role in achieving the correct phase and
crystal structure in Gd5Si2Ge2. Hence the growth conditions, in particular the
deposition temperature should be carefully chosen.
As a part of this work, thin films of Gd5Si2Ge2 were grown on polycrys
talline AIN substrates from a commercial Gd5Si2Ge2 target using PLD with a
248 nm wavelength KrF excimer laser. The laser was maintained at 210 mj and
13 Hz repetition rate throughout the deposition. The target-to-substrate dis
tance was maintained at 50 mm. The chamber was baked out for 36 hours at
450 °C in order to achieve suitable vacuum. The chamber was pum ped down
to 7x10⁻⁹ Torr before the deposition. The films were deposited in an argon at
mosphere at a pressure 20 mTorr for 1 hour. After deposition, the films were
cooled at a rate of 15 °C/m in in vacuum.
4.4 Deposition temperature
The deposition temperature was determined from Fig. 4.1, which shows the
fraction of orthorhombic phase versus heating and cooling in a Gd5Si2Ge2 sam
ple with predominantly monoclinic phase [Mozharivskyj et al., 2005]. These
samples were prepared by arc-melting, followed by heat treatment for an hour
at 1570 K. These samples were then heated to high temperatures (up to 600
°C) at a rate of 20 °C/min and the in situ XRD pattern at each temperature was
measured to determine the monoclinic to orthorhombic transition in Gd5Si2Ge2
samples.
It is evident from the graph (Fig. 4.1) that the orthorhombic phase de-
72
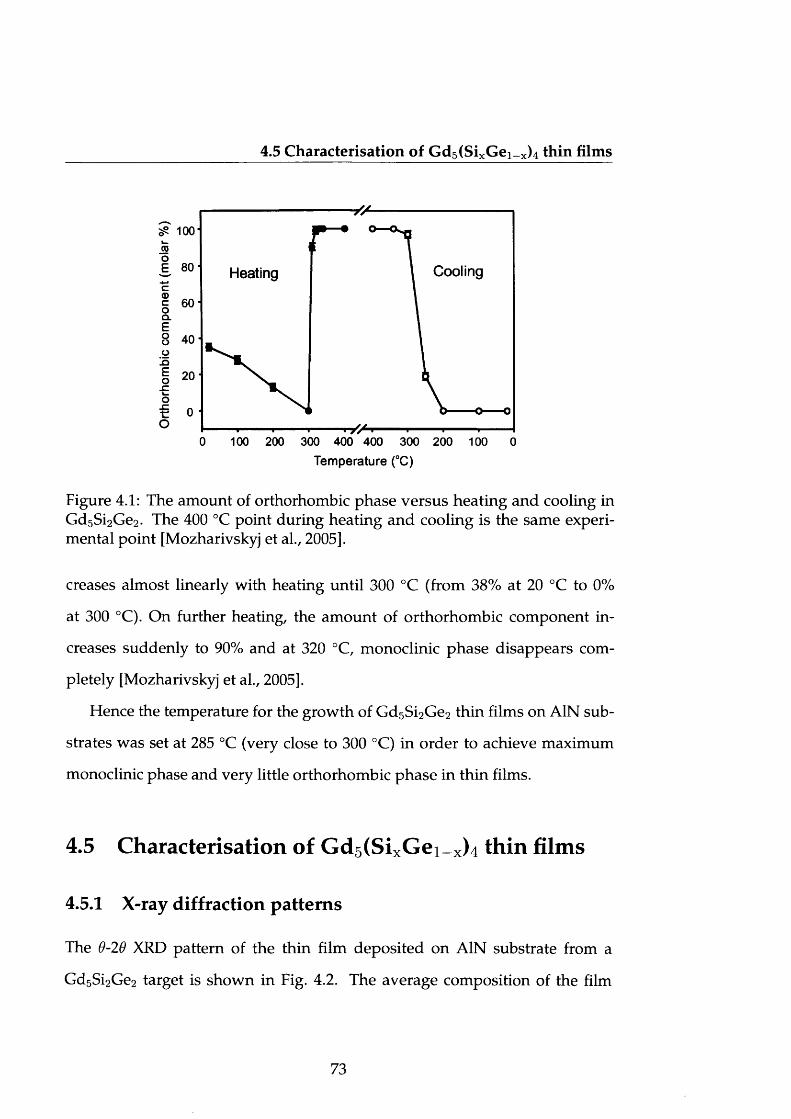
4.5 Characterisation of Gd5(SixGei_x)4 thin films
5? 100
CoolingHeating
2 0 -
« ■ 1 / / ' • '100 200 300 400 400 300 200 100 00
Temperature (°C)
Figure 4.1: The amount of orthorhombic phase versus heating and cooling in Gd5Si2Ge2. The 400 °C point during heating and cooling is the same experimental point [Mozharivskyj et al., 2005].
creases almost linearly with heating until 300 °C (from 38% at 20 °C to 0%
at 300 °C). On further heating, the amount of orthorhombic component in
creases suddenly to 90% and at 320 °C, monoclinic phase disappears com
pletely [Mozharivskyj et al., 2005].
Hence the temperature for the growth of Gd5Si2Ge2 thin films on AIN sub
strates was set at 285 °C (very close to 300 °C) in order to achieve maximum
monoclinic phase and very little orthorhombic phase in thin films.
4.5 Characterisation of Gd5 (SixGei_ x ) 4 thin films
4.5.1 X-ray diffraction patterns
The 9-29 XRD pattern of the thin film deposited on AIN substrate from a
Gd5Si2Ge2 target is shown in Fig. 4.2. The average composition of the film
73
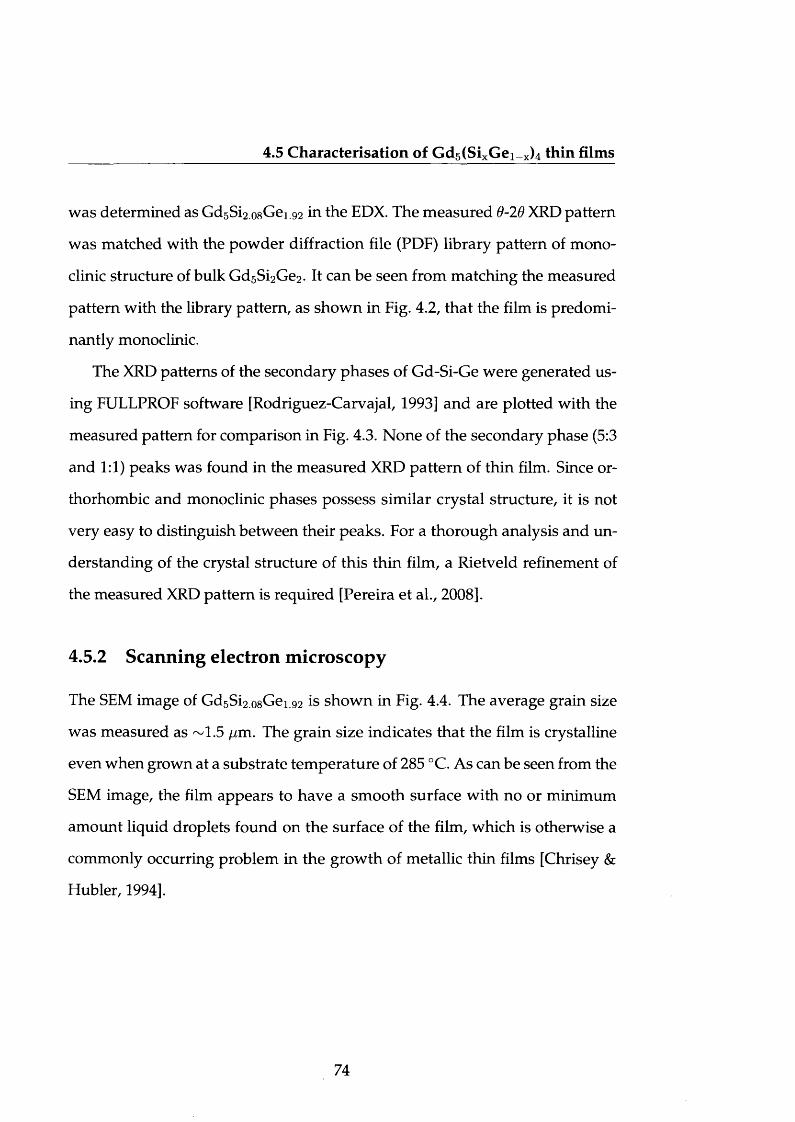
4.5 Characterisation of Gd5(SixGei_x)4 thin films
was determined as Gd5Si2.0sGe1.92 in the EDX. The measured 9-20 XRD pattern
was matched with the powder diffraction file (PDF) library pattern of mono
clinic structure of bulk Gd5Si2Ge2. It can be seen from matching the measured
pattern with the library pattern, as shown in Fig. 4.2, that the film is predomi
nantly monoclinic.
The XRD patterns of the secondary phases of Gd-Si-Ge were generated us
ing FULLPROF software [Rodriguez-Carvajal, 1993] and are plotted with the
measured pattern for comparison in Fig. 4.3. None of the secondary phase (5:3
and 1:1) peaks was found in the measured XRD pattern of thin film. Since or
thorhombic and monoclinic phases possess similar crystal structure, it is not
very easy to distinguish between their peaks. For a thorough analysis and un
derstanding of the crystal structure of this thin film, a Rietveld refinement of
the measured XRD pattern is required [Pereira et al., 2008].
4.5.2 Scanning electron microscopy
The SEM image of Gd5Si2.08Ge1.92 is shown in Fig. 4.4. The average grain size
was measured as ~1.5 //m. The grain size indicates that the film is crystalline
even when grown at a substrate tem perature of 285 °C. As can be seen from the
SEM image, the film appears to have a smooth surface with no or minimum
amount liquid droplets found on the surface of the film, which is otherwise a
commonly occurring problem in the growth of metallic thin films [Chrisey &
Hubler, 1994].
74
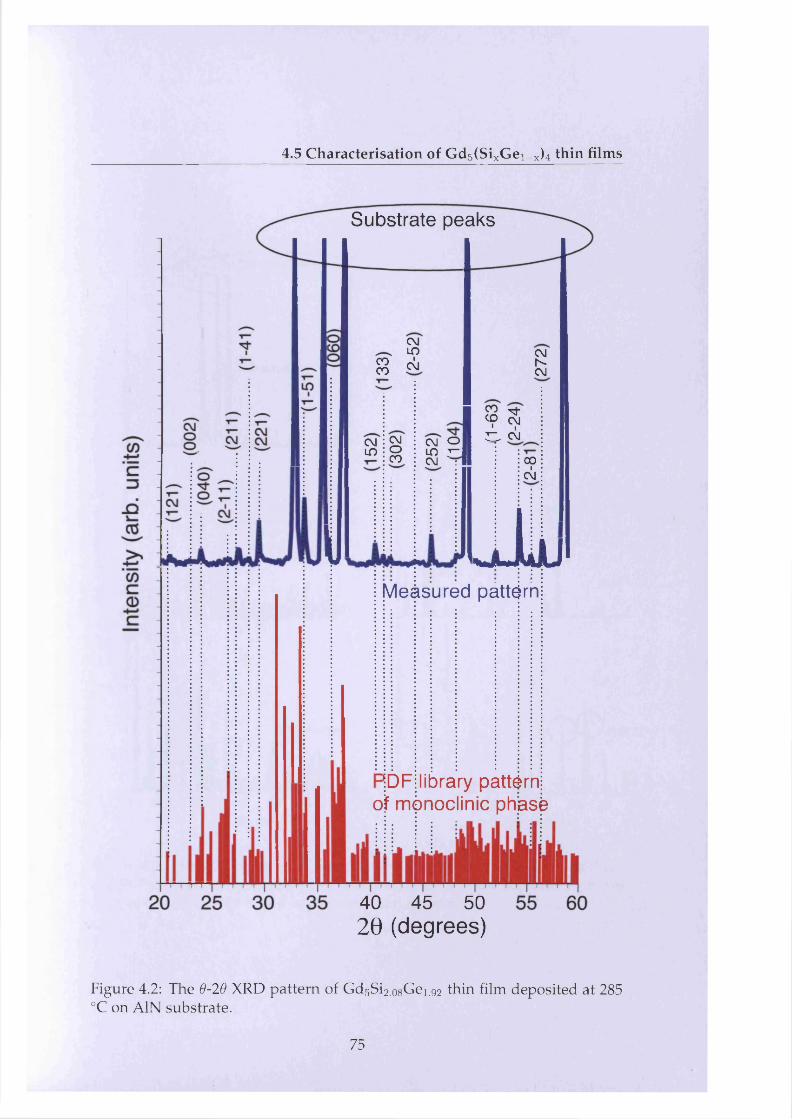
4.5 Characterisation of Gd5(SixGei_x)4 thin films
I
Substrate peaks
COCO
CNJIT)I(M
C\JinC \lOCO
CM Om r~ CM
CMr^CM
CO<9 Si1 in CM
COICM
UuljjUMeasured pattern
DF library patternof mpnoclinic phase
40 45 5020 (degrees)
Figure 4.2: The 9-20 XRD pattern of Gd5Si2.0sGe1.92 thin film deposited at 285 °C on AIN substrate.
75
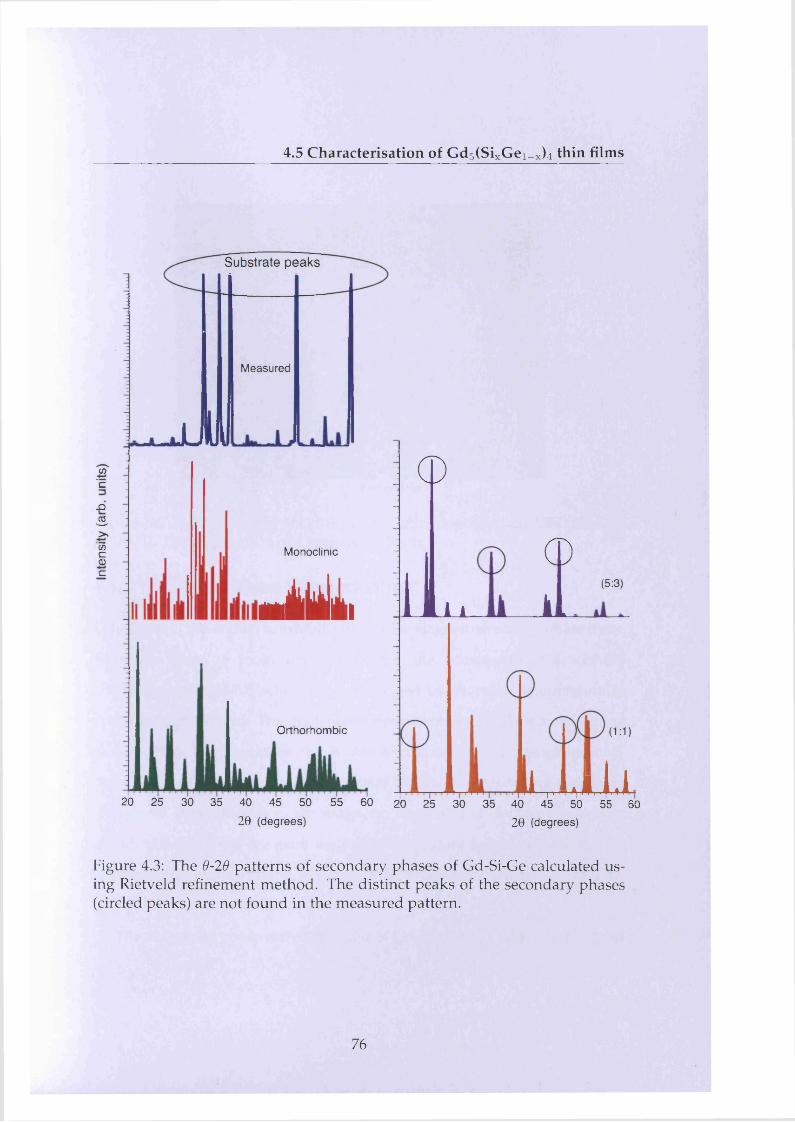
4.5 Characterisation of Gd5(SixGei_x)4 thin films
w‘c_Q
-S->*
' c / 5cQ)C
Substrate peaks
jJU
Measured
Monoclinic - «
J i l i
Orthorhombic
®
i_L
CDi
(5:3)
20 25 30 35 40 45 5020 (degrees)
55 60
(1:1)
20 25 30 35 40iUpH - j | ,| » j
45 50 55 602 0 (degrees)
Figure 4.3: The 9-20 patterns of secondary phases of Gd-Si-Ge calculated using Rietveld refinement method. The distinct peaks of the secondary phases (circled peaks) are not found in the measured pattern.
76
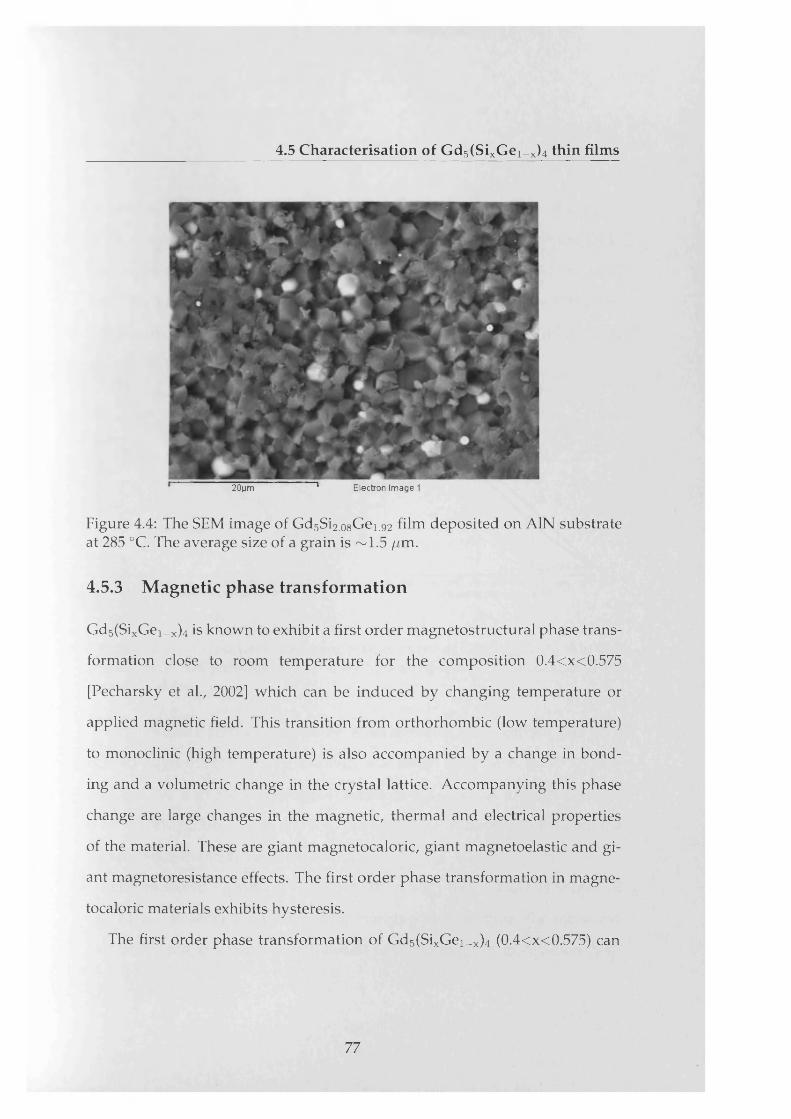
4.5 Characterisation of Gd5(SixGei_x)4 thin films
20tjm 1 E lectron Im age 1
Figure 4.4: The SEM image of Gd5Si2.0sGe1.92 film deposited on AIN substrate at 285 °C. The average size of a grain is ~1.5 /im.
4.5.3 Magnetic phase transformation
Gd5(SixGei_x)4 is known to exhibit a first order magnetostructural phase trans
formation close to room temperature for the composition 0.4<x<0.575
[Pecharsky et al., 2002] which can be induced by changing temperature or
applied magnetic field. This transition from orthorhombic (low temperature)
to monoclinic (high temperature) is also accompanied by a change in bond
ing and a volumetric change in the crystal lattice. Accompanying this phase
change are large changes in the magnetic, thermal and electrical properties
of the material. These are giant magnetocaloric, giant magnetoelastic and gi
ant magnetoresistance effects. The first order phase transformation in magne
tocaloric materials exhibits hysteresis.
The first order phase transformation of Gd5(SixGei_x)4 (0.4<x<0.575) can
77
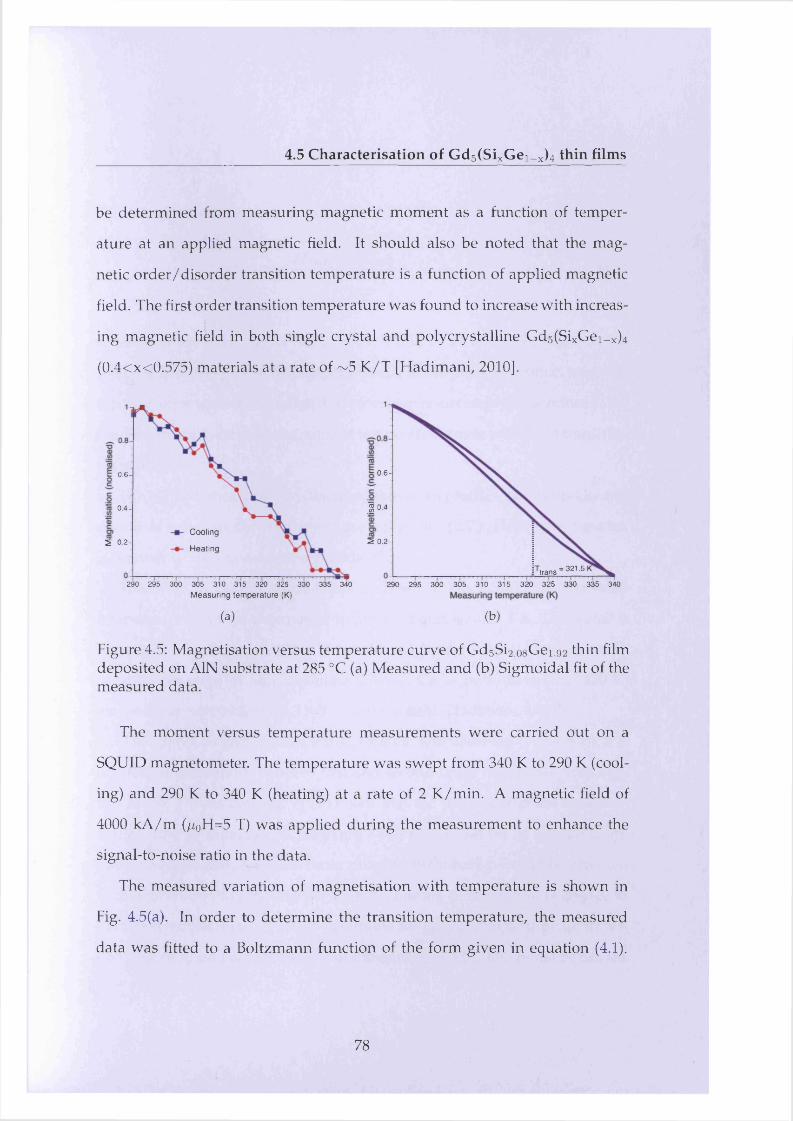
4.5 Characterisation of Gd5(SixGei_x)4 thin films
be determined from measuring magnetic moment as a function of temper
ature at an applied magnetic field. It should also be noted that the mag
netic order/disorder transition temperature is a function of applied magnetic
field. The first order transition temperature was found to increase with increas
ing magnetic field in both single crystal and polycrystalline Gd5(SixGei_x)4
(0.4<x<0.575) materials at a rate of ~5 K /T [Hadimani, 2010].
0 .6 -0 .6 -
I 0-4-0.4-
Cooling
Heating2 0.2 -5 0.2 -
= 321.5trans290 295 300 305 310 315 320 325 330 335 340
M easuring tem perature (K)290 295 300 305 310 315 320 325 330 335 340
(a) (b)
Figure 4.5: Magnetisation versus temperature curve of Gd5Si2.08Ge1.92 thin film deposited on AIN substrate at 285 °C (a) Measured and (b) Sigmoidal fit of the measured data.
The moment versus temperature measurements were carried out on a
SQUID magnetometer. The temperature was swept from 340 K to 290 K (cool
ing) and 290 K to 340 K (heating) at a rate of 2 K/min. A magnetic field of
4000 kA/m (//0H=5 T) was applied during the measurement to enhance the
signal-to-noise ratio in the data.
The measured variation of magnetisation with temperature is shown in
Fig. 4.5(a). In order to determine the transition temperature, the measured
data was fitted to a Boltzmann function of the form given in equation (4.1).
78
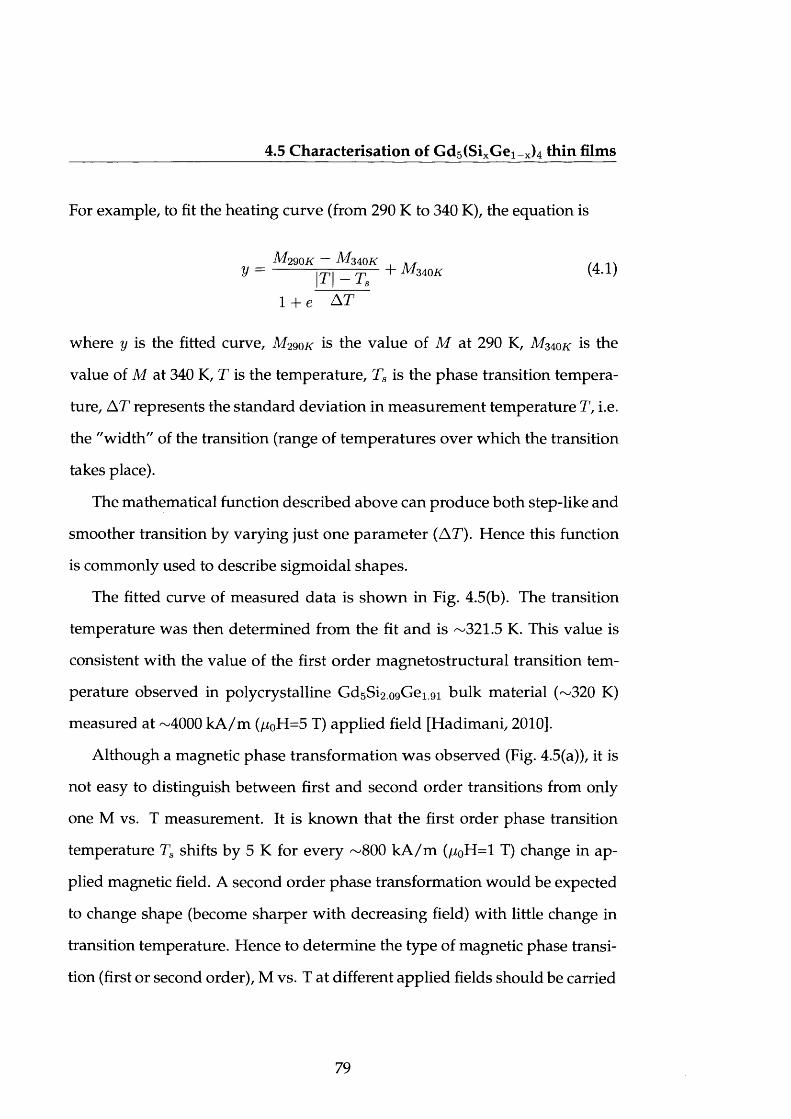
4.5 Characterisation of Gd5(SixGei_x)4 thin films
For example, to fit the heating curve (from 290 K to 340 K), the equation is
M 290K — MmokV = T ~ T M0K *
1 + e A T
where y is the fitted curve, M29qk is the value of M at 290 K, is the
value of M at 340 K, T is the temperature, Ts is the phase transition tempera
ture, AT represents the standard deviation in measurement temperature T, i.e.
the "width" of the transition (range of temperatures over which the transition
takes place).
The mathematical function described above can produce both step-like and
smoother transition by varying just one param eter (AT). Hence this function
is commonly used to describe sigmoidal shapes.
The fitted curve of measured data is shown in Fig. 4.5(b). The transition
temperature was then determined from the fit and is ~321.5 K. This value is
consistent with the value of the first order magnetostructural transition tem
perature observed in polycrystalline Gd5Si2.09Ge1.91 bulk material (~320 K)
measured at ~4000 kA /m (//0H=5 T) applied field [Hadimani, 2010].
Although a magnetic phase transformation was observed (Fig. 4.5(a)), it is
not easy to distinguish between first and second order transitions from only
one M vs. T measurement. It is known that the first order phase transition
temperature Ts shifts by 5 K for every ~800 kA /m (/i0H =l T) change in ap
plied magnetic field. A second order phase transformation would be expected
to change shape (become sharper with decreasing field) with little change in
transition temperature. Hence to determine the type of magnetic phase transi
tion (first or second order), M vs. T at different applied fields should be carried
79
4.6 Summary
out.
The growth of magnetocaloric films based on Gd5Si2Ge2 at a lower sub
strate temperature (285 °C) and the magnetic phase transformation at near
room temperature indicate that these films are potential candidates in micro
cooling applications.
As the research on Gd5Si2Ge2 thin films is in its initial stage, only the pre
liminary results are reported here. The electrical resistivity, heat capacity, mag
netic hysteresis, moment vs. temperature at different applied fields and mag
netostriction measurements on this thin film are underw ay and will be re
ported subsequently.
4.6 Summary
• The first successful thin film of Gd5Si2.08Ge1.92 was grown on AIN sub
strate using PLD at a substrate temperature of 285 °C. The choice of de
position parameters was explained.
• The film was characterised to study crystallographic structure, composi
tion and grain size.
• The 9-26 XRD scans show monoclinic structure. This was confirmed by
matching the PDF library pattern of monoclinic Gd5Si2Ge2.
• The secondary phases were calculated using FULLPROF software and
were compared with the measured XRD scan. There was no evidence of
a substantial amount of secondary phases found in the film.
80
4.6 Summary
• It was concluded that for a thorough understanding of crystal structure,
Rietveld refinement is required.
• A magnetic phase transformation near room temperature was observed
in the magnetisation versus tem perature study. The type of magnetic
phase transformation (first or second order) is yet to be determined.
• This property of thin film makes it an attractive candidate for micro
cooling applications.
81
Chapter 5
Extensions to Jiles-Atherton theory
of hysteresis
5.1 Introduction
This chapter focuses on modelling aspects of magnetic hysteresis curves. The
theory and principle of Jiles-Atherton (JA) model of hysteresis are discussed in
the following section. The extensions to this theory carried out as part of this
research work are elaborated in the subsequent sections. Firstly, the modelling
of temperature dependence of hysteresis based on JA theory is explained in
Section 5.3. The functional form of anhysteretic magnetisation has been de
rived in Section 5.4. The extension of JA theory to model and predict the be
haviour of two-phase materials is described in Section 5.5.
82
5.2 Jiles-Atherton theory
5.2 Jiles-Atherton theory
The theory of ferromagnetic hysteresis developed by Jiles and Atherton (JA),
compared to other existing theories takes a more general approach in mod
elling the behaviour of magnetic materials in microscopic scale [Jiles & Ather
ton, 1986]. The model is built on the Langevin-Weiss classical model and con
siders an array of magnetic domains in thermal equilibrium at a particular
temperature. The orientations of the magnetic moments are assumed to fol
low a statistical distribution. The bulk magnetisation can be obtained by sim
ply integrating the distribution of moments over all possible orientations. This
technique depends highly on the anisotropy of the material and the resulting
magnetisation can take different forms based on whether the material is axially
anisotropic or planar anisotropic or isotropic as explained in Section 5.4.
Ferromagnetic materials when subjected to external magnetic field change
their magnetisation path. The path the magnetisation curve takes depends
on whether the field is increasing or decreasing. This path-dependent be
haviour exhibits irreversibility and hence hysteresis. According to JA theory,
the change in total magnetisation, M, of a ferromagnetic material can be cal
culated from microstructural dom ain processes that contribute to irreversible,
Mirr, and reversible, Mrev/ changes in magnetisation components.
A A/" = AAdirr T A Mrev. (^d)
Before proceeding further, it is important to describe the five microstruc
tural parameters that form the basis of JA theory:
83
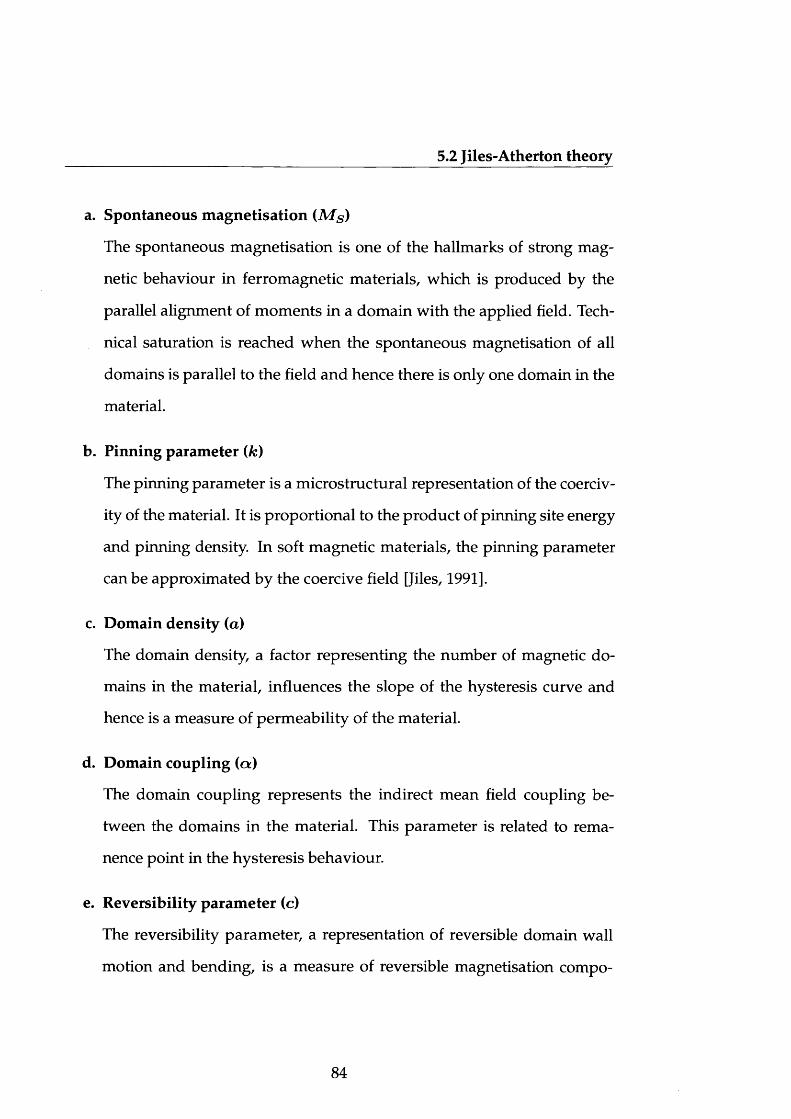
5.2 Jiles-Atherton theory
a. Spontaneous magnetisation (M s )
The spontaneous magnetisation is one of the hallmarks of strong mag
netic behaviour in ferromagnetic materials, which is produced by the
parallel alignment of moments in a domain with the applied field. Tech
nical saturation is reached when the spontaneous magnetisation of all
domains is parallel to the field and hence there is only one domain in the
material.
b. Pinning parameter (k )
The pinning parameter is a microstructural representation of the coerciv-
ity of the material. It is proportional to the product of pinning site energy
and pinning density. In soft magnetic materials, the pinning parameter
can be approximated by the coercive field [Jiles, 1991].
c. Domain density (a)
The domain density, a factor representing the number of magnetic do
mains in the material, influences the slope of the hysteresis curve and
hence is a measure of permeability of the material.
d. Domain coupling (a)
The domain coupling represents the indirect mean field coupling be
tween the domains in the material. This parameter is related to rema-
nence point in the hysteresis behaviour.
e. Reversibility parameter (c)
The reversibility parameter, a representation of reversible domain wall
motion and bending, is a measure of reversible magnetisation compo-
84
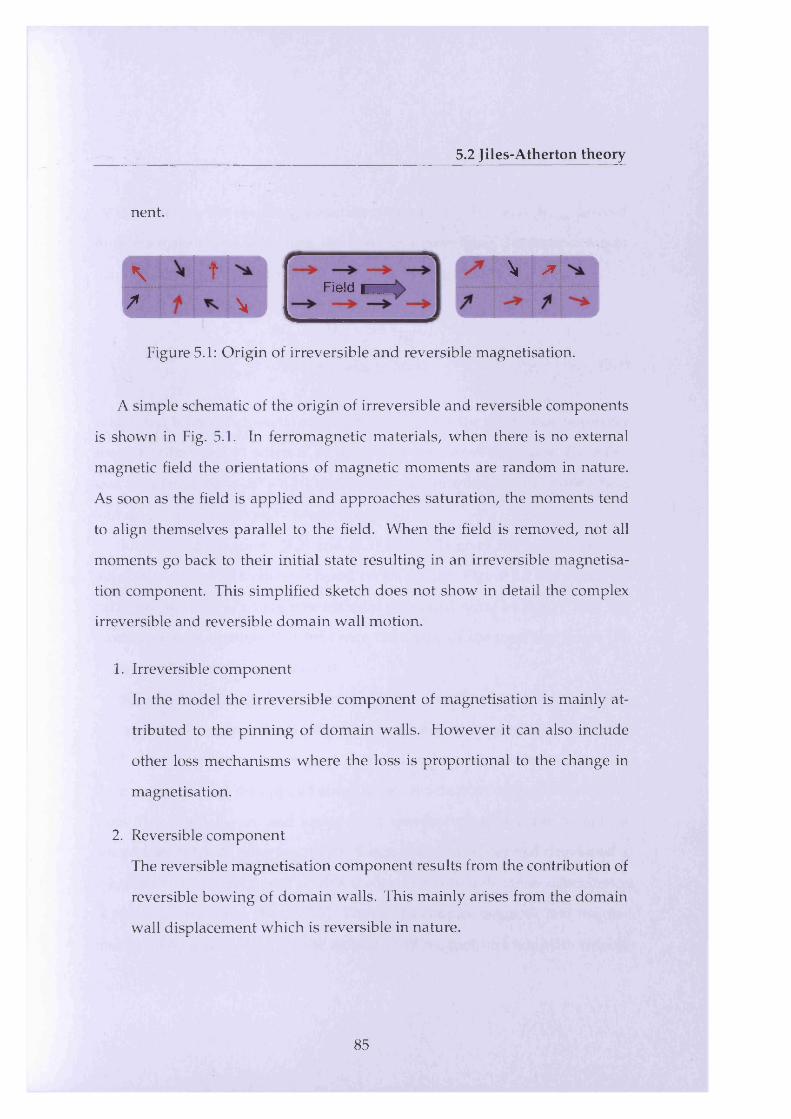
5.2 Jiles-Atherton theory
nent.
\ t/ A
Field |\ *
;a ■ v. • ■>,
Figure 5.1: Origin of irreversible and reversible magnetisation.
A simple schematic of the origin of irreversible and reversible components
is shown in Fig. 5.1. In ferromagnetic materials, when there is no external
magnetic field the orientations of magnetic moments are random in nature.
As soon as the field is applied and approaches saturation, the moments tend
to align themselves parallel to the field. When the field is removed, not all
moments go back to their initial state resulting in an irreversible magnetisa
tion component. This simplified sketch does not show in detail the complex
irreversible and reversible domain wall motion.
1. Irreversible component
In the model the irreversible component of magnetisation is mainly at
tributed to the pinning of domain walls. However it can also include
other loss mechanisms where the loss is proportional to the change in
magnetisation.
2. Reversible component
The reversible magnetisation component results from the contribution of
reversible bowing of domain walls. This mainly arises from the domain
wall displacement which is reversible in nature.
85
5.2 Jiles-Atherton theory
Considering the two magnetisation components, Mirr and Mrev/ derived
from microstructural processes, the equations describing the dependence of
magnetisation, M, on magnetic field, H , can be constructed:
MiTT = Man ~ k S ^ f - (5.2)dHe
Mrev = C (Man - Mirr) (5.3)
where Man is the anhysteretic magnetisation and 6 is the directional parameter
that takes the value +1 when H increases and -1 when H decreases. The effec
tive field term, He = H + aM, arises from the contributions of applied field
and magnetic interactions between domains.
Substituting equations (5.2) and (5.3) into (5.1) gives the microstructure-
dependent model of hysteresis based on JA theory. Figure 5.2 shows a typi
cal hysteresis loop of a magnetic material generated using JA theory with mi
crostructural parameters that influence the shape of the loop and hence the
magnetic properties of the material.
Several studies have been carried out successfully to extend the JA the
ory to include magnetoelastic, thermal, frequency and anisotropy effects. In
1984, the JA theory was applied to explain the magnetomechanical effect on
the assumption that the applied stress causes the domain walls to break away
from their pinning sites and hence the magnetisation approaches an anhys
teretic state [Jiles & Atherton, 1984]. Later, Sablik and Jiles had developed a
magnetoelastic model based on this theory to incorporate stress dependence
of hysteresis [Sablik & Jiles, 1993]. The model couples magnetic and magne-
tostrictive hysteresis through the derivative of magnetostriction with respect
86
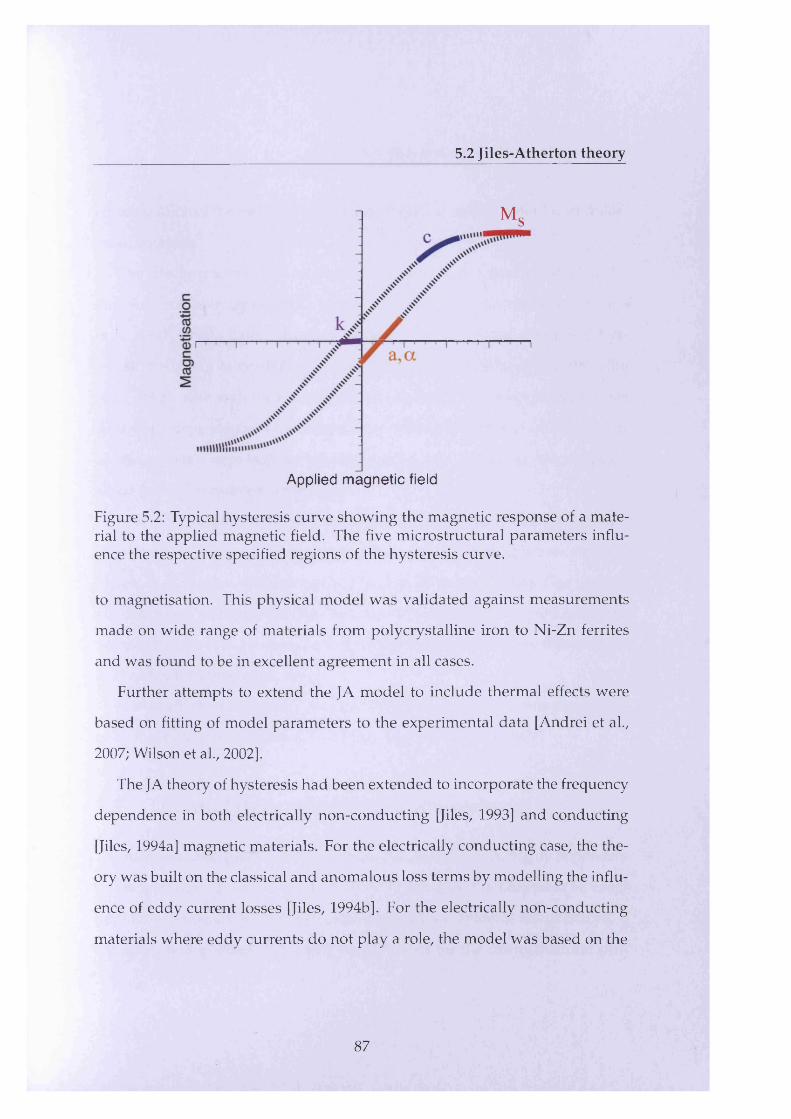
5.2 Jiles-Atherton theory
Ms
Applied magnetic field
Figure 5.2: Typical hysteresis curve showing the magnetic response of a material to the applied magnetic field. The five microstructural parameters influence the respective specified regions of the hysteresis curve.
to magnetisation. This physical model was validated against measurements
made on wide range of materials from polycrystalline iron to Ni-Zn ferrites
and was found to be in excellent agreement in all cases.
Further attempts to extend the JA model to include thermal effects were
based on fitting of model parameters to the experimental data [Andrei et al.,
2007; Wilson et al., 2002].
The JA theory of hysteresis had been extended to incorporate the frequency
dependence in both electrically non-conducting [Jiles, 1993] and conducting
[Jiles, 1994a] magnetic materials. For the electrically conducting case, the the
ory was built on the classical and anomalous loss terms by modelling the influ
ence of eddy current losses [Jiles, 1994b]. For the electrically non-conducting
materials where eddy currents do not play a role, the model was based on the
87
5.3 Thermal dependence of hysteresis
representation of the motion of domain walls using second order linear differ
ential equation.
The effects of anisotropy on hysteresis was modelled by Ramesh et al. by
deriving an anisotropy-dependent anhysteretic magnetisation function [Ramesh
et al., 1997, 1996]. Later, Jiles et al. applied the anisotropy-dependent hys
teresis modelling to crystalline and textured materials [Jiles et al., 1997; Shi
et al., 1998]. Although there were partially successful attempts to incorporate
anisotropy dependence of hysteresis, the resulting model was not complete as
all these models were built for known specific cases and do not have a gener
alised form of anisotropy dependence.
Several algorithms have been developed to extract microstructural param
eters from the measured hysteresis loop based on this theory of hysteresis. A
review of estimation methods can be found in [Chwastek, 2008]. One such al
gorithm based on numerical determination of microstructural parameters de
veloped by Jiles et al. has been well-established and proven to be reliable [Jiles
& Thoelke, 1989; Jiles et al., 1992].
It is worth mentioning here the recent work on developing new capabilities
of JA theory to model dynamic hysteresis loops [Chwastek, 2009].
5.3 Thermal dependence of hysteresis
The magnetisation processes in ferromagnetic materials are highly dependent
on temperature. In order to understand thoroughly the behaviour of mag
netisation processes in ferromagnetic materials at different temperatures, a
temperature-dependent hysteresis model based on the microstructural pro-
88
5.3 Thermal dependence of hysteresis
cesses is necessary.
5.3.1 Temperature dependence of microstructural parameters
In the present work, the effects of temperature on magnetic hysteresis have
been incorporated into the existing theory by representing the five microstruc
tural model parameters: spontaneous magnetisation, Ms, pinning, k, domain
density, a, domain coupling, a, and reversibility, c, as functions of tempera
ture, T. The material dependent parameters such as Curie temperature, Tc ,
and critical exponent, /?, have also been added as additional variables to the
existing model. The Curie temperature is the temperature at which the ferro
magnetic material becomes paramagnetic. In other words, the orientation of
moments becomes random and hence the spontaneous magnetisation becomes
zero. The critical exponent is a representation of mean field interactions in the
material and can be derived from mean field theory [Arrott & Noakes, 1967].
a. M s vs. T
The spontaneous magnetisation of a ferromagnetic material decreases with in
creasing temperature and reaches zero at the Curie temperature when it be
comes paramagnetic. The Weiss theory of ferromagnetism describes this tem
perature dependence of spontaneous magnetisation as [Chikazumi, 1984]
b. k vs. T
The pinning parameter is proportional to the coercivity of the material, which
(5.4)
89
5.3 Thermal dependence of hysteresis
decreases exponentially with increasing temperature, indicating that the pin
ning energy of domain walls decays with temperature.
k(T) = k{0 )exp (5-5)
The critical exponent factor j3' of pinning parameter is different from the
critical exponent (3 of spontaneous magnetisation and this indicates that there
can be different critical exponent values for different parameters.
c. a vs. T
The temperature-dependent JA model was developed for two cases of domain
density as follows:
case 1: In this case, the domain density was assumed to be constant as it showed
only negligible variation with temperature [Wilson et al., 2002].
case 2: As the temperature increases, the domain walls break away from pinning
sites and consequently cause a reduction in the density of domains in the
material. Hence the domain density, similar to the pinning parameter,
was made to decrease exponentially w ith temperature in this case.
a(T) = a(0) exp ( (5 -6)
d. a. vs. T
For isotropic materials, the domain coupling can be represented as a function
of domain density and spontaneous magnetisation and is given by [Jiles et al.,
1992]
90
5.3 Thermal dependence of hysteresis
3(2 1a = T7---------- V5-7)Ms XcMn
At higher anhysteretic susceptibilities, Xan, the contribution of the second
term to domain coupling is negligible. Hence by substituting the correspond
ing expressions of Ms and a, the tem perature dependence of domain density
can be obtained.
e. c vs. X
For isotropic materials, the reversibility parameter can be treated in an analo
gous way to that of domain coupling and is given by [Jiles et al., 1992]
3“ Xin (5-8)M s
Assuming constant initial susceptibility, x*n, and substituting the expres
sions of Ms and a, the relation between reversibility parameter and tempera
ture can be determined.
5.3.2 Parameter identification
The initial conditions of the model such as the values of parameters at 0 K, the
initial susceptibility and anhysteretic susceptibility can be determined, using
well-documented identification procedures, from measured data at low tem
peratures [Jiles et al., 1992]. The Curie temperature and critical exponent can
be estimated from measuring Ms vs. T and fitting the model equation given
in (5.4) to the measured data. By following the above estimation procedure, all
parameters that are necessary to describe the ferromagnetic behaviour below
91
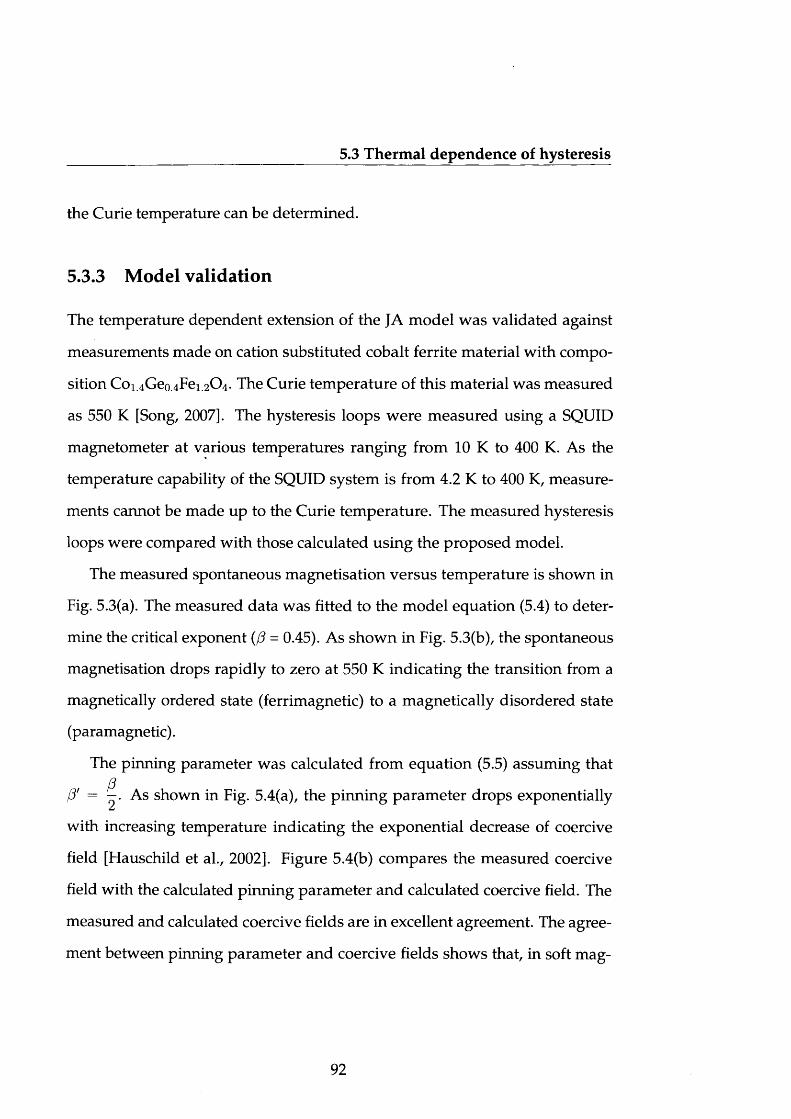
5.3 Thermal dependence of hysteresis
the Curie temperature can be determined.
5.3.3 Model validation
The temperature dependent extension of the JA model was validated against
measurements made on cation substituted cobalt ferrite material with compo
sition C01.4Geo.4Fe1.2O4. The Curie temperature of this material was measured
as 550 K [Song, 2007]. The hysteresis loops were measured using a SQUID
magnetometer at various temperatures ranging from 10 K to 400 K. As the
temperature capability of the SQUID system is from 4.2 K to 400 K, measure
ments cannot be made up to the Curie temperature. The measured hysteresis
loops were compared with those calculated using the proposed model.
The measured spontaneous magnetisation versus temperature is shown in
Fig. 5.3(a). The measured data was fitted to the model equation (5.4) to deter
mine the critical exponent (/? = 0.45). As shown in Fig. 5.3(b), the spontaneous
magnetisation drops rapidly to zero at 550 K indicating the transition from a
magnetically ordered state (ferrimagnetic) to a magnetically disordered state
(paramagnetic).
The pinning parameter was calculated from equation (5.5) assuming that
(3' = As shown in Fig. 5.4(a), the pinning parameter drops exponentially
with increasing temperature indicating the exponential decrease of coercive
field [Flauschild et al., 2002]. Figure 5.4(b) compares the measured coercive
field with the calculated pinning parameter and calculated coercive field. The
measured and calculated coercive fields are in excellent agreement. The agree
ment between pinning param eter and coercive fields shows that, in soft mag-
92
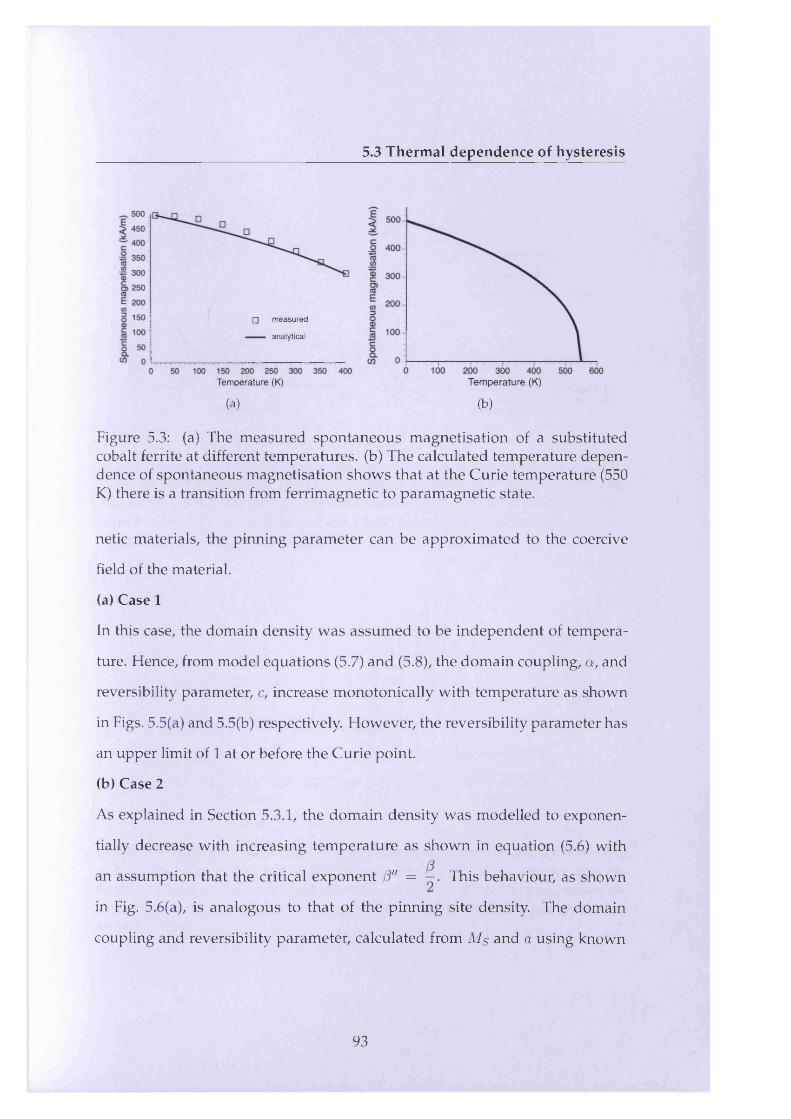
5.3 Thermal dependence of hysteresis
□ measured
analytical
Temperature (K) Temperature (K)
(a) (b)
Figure 5.3: (a) The measured spontaneous magnetisation of a substituted cobalt ferrite at different temperatures, (b) The calculated temperature dependence of spontaneous magnetisation shows that at the Curie temperature (550 K) there is a transition from ferrimagnetic to paramagnetic state.
netic materials, the pinning parameter can be approximated to the coercive
field of the material.
(a) Case 1
In this case, the domain density was assumed to be independent of tempera
ture. Hence, from model equations (5.7) and (5.8), the domain coupling, a, and
reversibility parameter, c, increase monotonically with temperature as shown
in Figs. 5.5(a) and 5.5(b) respectively. However, the reversibility parameter has
an upper limit of 1 at or before the Curie point.
(b) Case 2
As explained in Section 5.3.1, the domain density was modelled to exponen
tially decrease with increasing temperature as shown in equation (5.6) with
an assumption that the critical exponent /?" = This behaviour, as shown
in Fig. 5.6(a), is analogous to that of the pinning site density. The domain
coupling and reversibility parameter, calculated from Ms and a using known
93
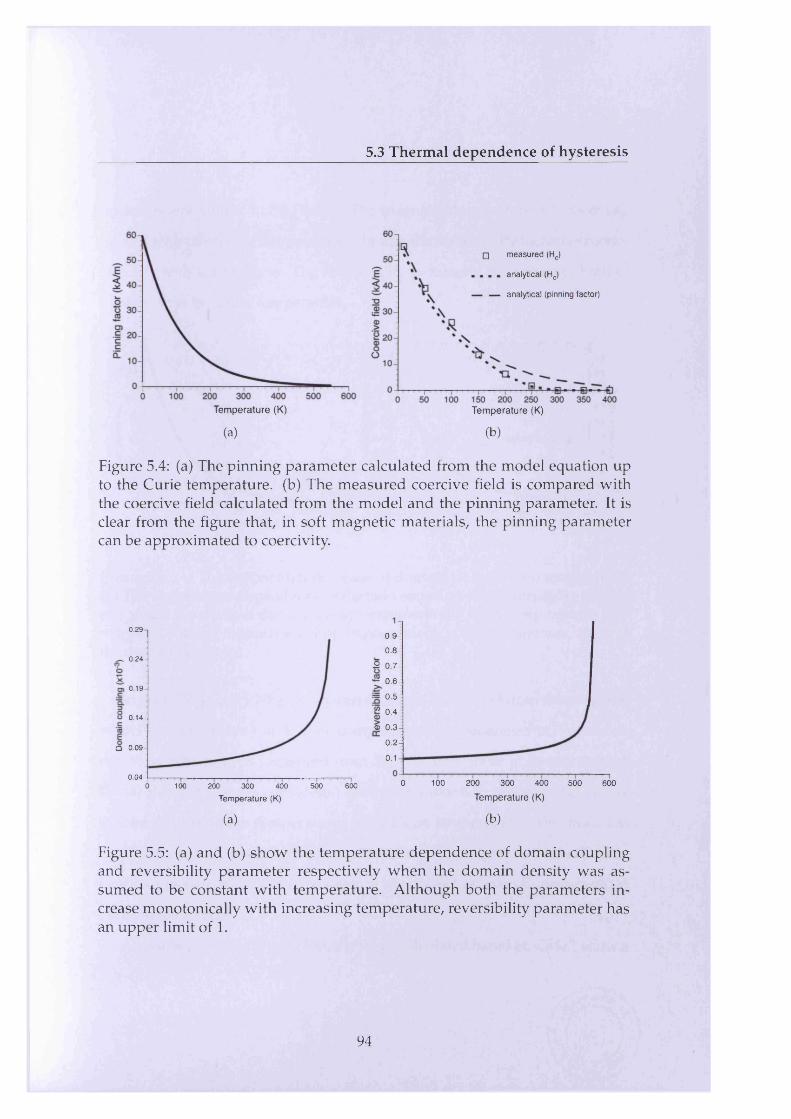
5.3 Thermal dependence of hysteresis
□ m easured (H J
analytical (Hc)
analytical (pinning factor)
Temperature (K) Temperature (K)
(a) (b)
Figure 5.4: (a) The pinning parameter calculated from the model equation up to the Curie temperature, (b) The measured coercive field is compared with the coercive field calculated from the model and the pinning parameter. It is clear from the figure that, in soft magnetic materials, the pinning parameter can be approximated to coercivity.
0.290 .9 -
0 .8 -
2 0 .7 -^ 0 .2 4 -
0 .6 -0.19-
0 .5 -
0 .4 -0 .1 4 -
© 0 .3 -
0 .2 -Q 0 .0 9 -
0.1
0 .0 4 - 0 100 200 300 400 500 6000 100 500 600200 300 400
Tem perature (K) Temperature (K)
(a) (b)
Figure 5.5: (a) and (b) show the temperature dependence of domain coupling and reversibility parameter respectively when the domain density was assumed to be constant with temperature. Although both the parameters increase monotonically with increasing temperature, reversibility parameter has an upper limit of 1.
94
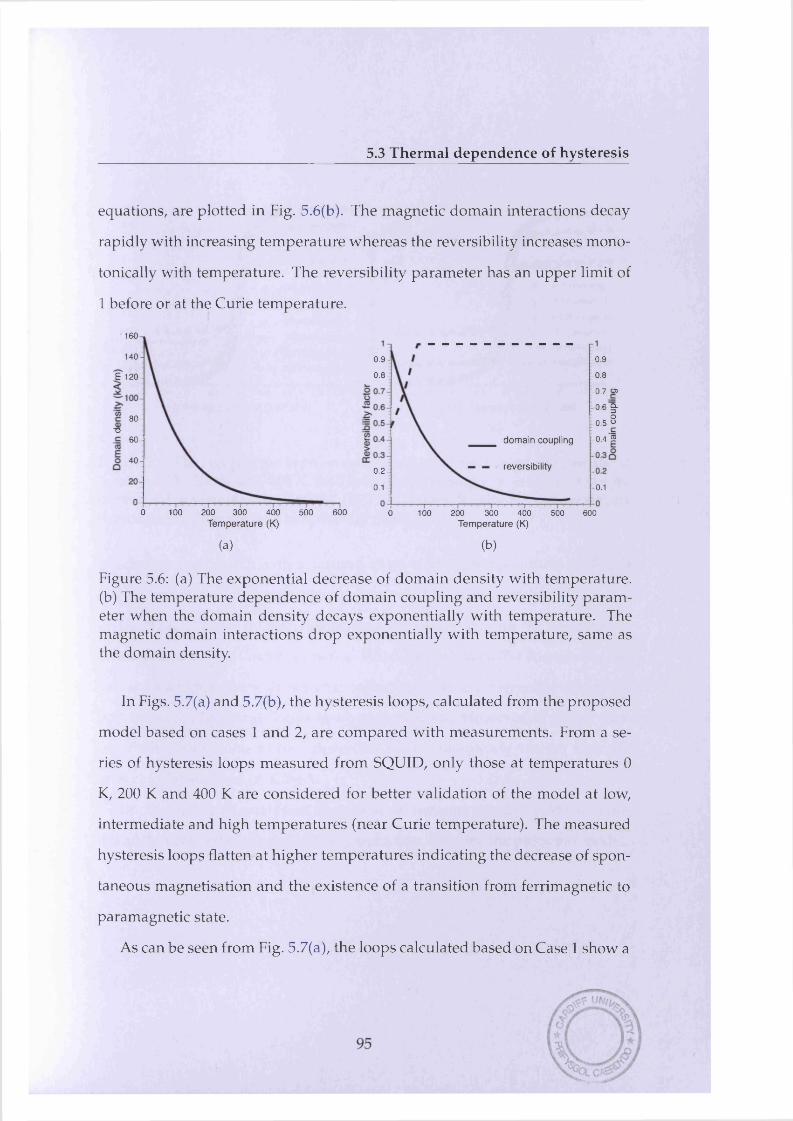
5.3 Thermal dependence of hysteresis
equations, are plotted in Fig. 5.6(b). The magnetic domain interactions decay
rapidly with increasing temperature whereas the reversibility increases mono-
tonically with temperature. The reversibility parameter has an upper limit of
1 before or at the Curie temperature.
160
14 0 - 0 .9 - -0 .9
0 .8 - - 0.8
-0 .7 05
- 0.6 §■ o
-0 .5 « c-0 .4 2
E 120-
80 -"O
_ _ _ _ domain coupling60 -
4 0 - reversibility0 .2 -
0.10.1 -
0 200 300 600100 400 500 200 300 400 6000 100 500Temperature (K) Temperature (K)
(a) (b)
Figure 5.6: (a) The exponential decrease of domain density with temperature, (b) The temperature dependence of domain coupling and reversibility parameter when the domain density decays exponentially with temperature. The magnetic domain interactions drop exponentially with temperature, same as the domain density.
In Figs. 5.7(a) and 5.7(b), the hysteresis loops, calculated from the proposed
model based on cases 1 and 2, are compared with measurements. From a se
ries of hysteresis loops measured from SQUID, only those at temperatures 0
K, 200 K and 400 K are considered for better validation of the model at low,
intermediate and high temperatures (near Curie temperature). The measured
hysteresis loops flatten at higher temperatures indicating the decrease of spon
taneous magnetisation and the existence of a transition from ferrimagnetic to
paramagnetic state.
As can be seen from Fig. 5.7(a), the loops calculated based on Case 1 show a
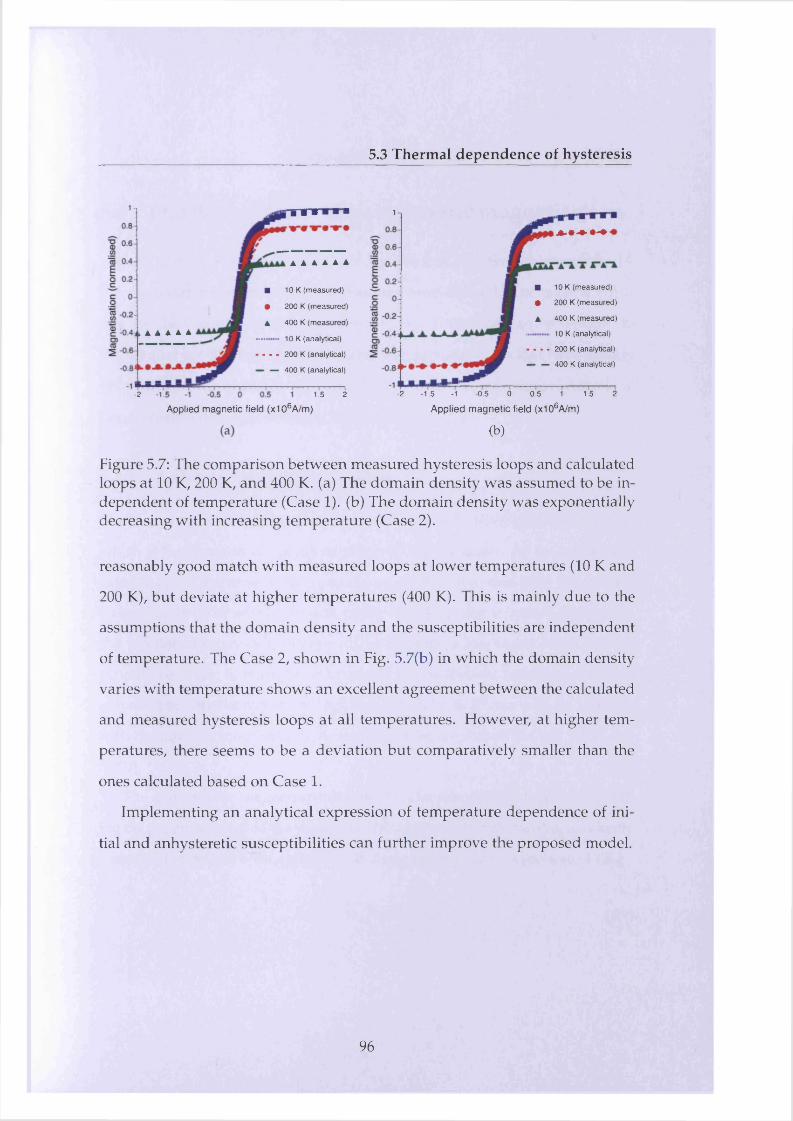
5.3 Thermal dependence of hysteresis
■ 10 K (measured)
• 200 K (measured)
A 400 K (measured)
10 K (analytical)
• - - 200 K (analytical)
- — 400 K (analytical)
■ 10 K (measured)
• 200 K (measured)
A 400 K (measured)
10 K (analytical)
200 K (analytical)
■ — 400 K (analytical)
1-, ‘1 1 ■ 1
-2 -14
Applied magnetic field (x106A/m)1.5 2 -2 -1.5 -1 -0.5 0 0.5 1
Applied magnetic field (x106A/m)
(b)
1.5 2
Figure 5.7: The comparison between measured hysteresis loops and calculated loops at 10 K, 200 K, and 400 K. (a) The domain density was assumed to be independent of temperature (Case 1). (b) The domain density was exponentially decreasing with increasing temperature (Case 2).
reasonably good match with measured loops at lower temperatures (10 K and
200 K), but deviate at higher temperatures (400 K). This is mainly due to the
assumptions that the domain density and the susceptibilities are independent
of temperature. The Case 2, shown in Fig. 5.7(b) in which the domain density
varies with temperature shows an excellent agreement between the calculated
and measured hysteresis loops at all temperatures. However, at higher tem
peratures, there seems to be a deviation but comparatively smaller than the
ones calculated based on Case 1.
Implementing an analytical expression of temperature dependence of ini
tial and anhysteretic susceptibilities can further improve the proposed model.
96
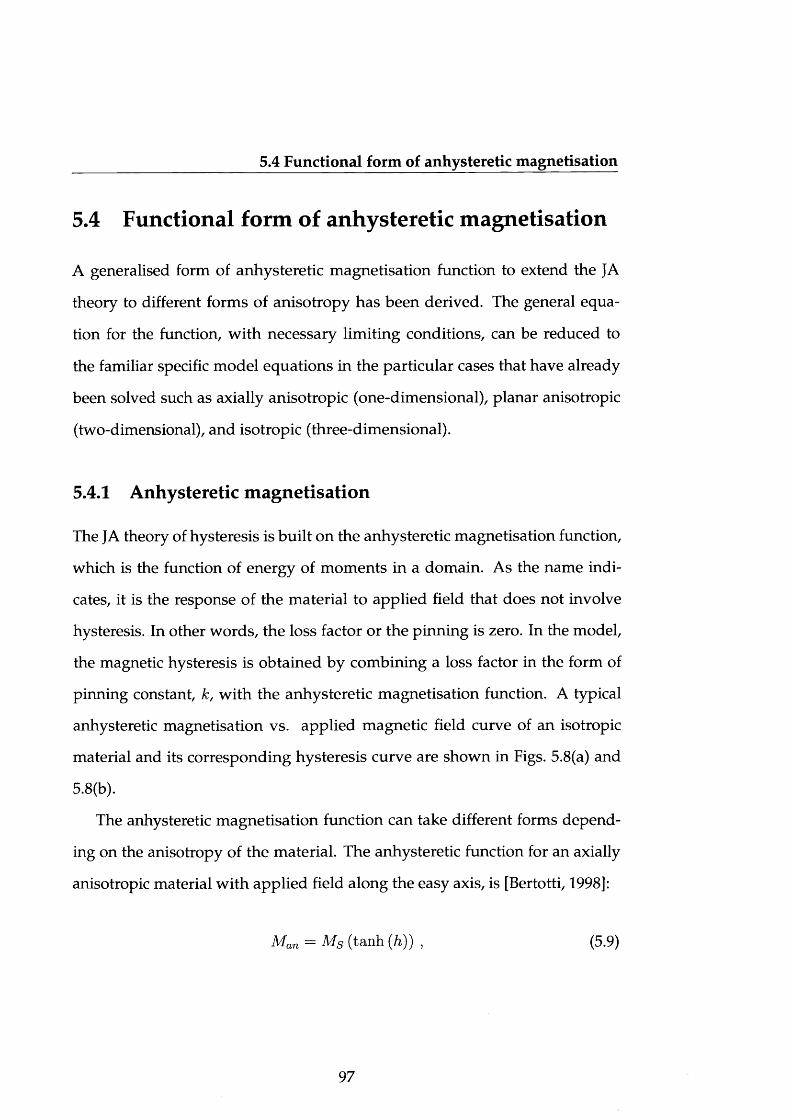
5.4 Functional form of anhysteretic magnetisation
5.4 Functional form of anhysteretic magnetisation
A generalised form of anhysteretic magnetisation function to extend the JA
theory to different forms of anisotropy has been derived. The general equa
tion for the function, with necessary limiting conditions, can be reduced to
the familiar specific model equations in the particular cases that have already
been solved such as axially anisotropic (one-dimensional), planar anisotropic
(two-dimensional), and isotropic (three-dimensional).
5.4.1 Anhysteretic magnetisation
The JA theory of hysteresis is built on the anhysteretic magnetisation function,
which is the function of energy of moments in a domain. As the name indi
cates, it is the response of the material to applied field that does not involve
hysteresis. In other words, the loss factor or the pinning is zero. In the model,
the magnetic hysteresis is obtained by combining a loss factor in the form of
pinning constant, k, with the anhysteretic magnetisation function. A typical
anhysteretic magnetisation vs. applied magnetic field curve of an isotropic
material and its corresponding hysteresis curve are shown in Figs. 5.8(a) and
5.8(b).
The anhysteretic magnetisation function can take different forms depend
ing on the anisotropy of the material. The anhysteretic function for an axially
anisotropic material with applied field along the easy axis, is [Bertotti, 1998]:
M an = Ms (tanh (h)) , (5.9)
97
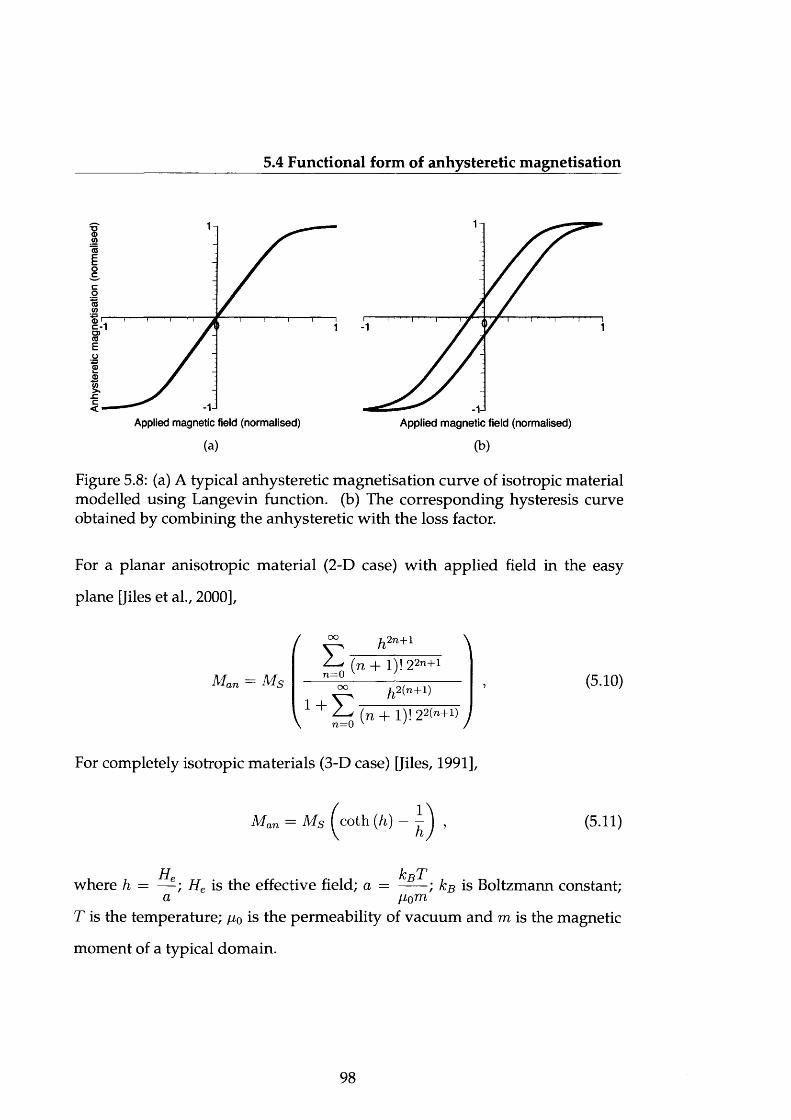
5.4 Functional form of anhysteretic magnetisation
Applied magnetic field (normalised) Applied magnetic field (normalised)
(0o_c_co
Figure 5.8: (a) A typical anhysteretic magnetisation curve of isotropic material modelled using Langevin function, (b) The corresponding hysteresis curve obtained by combining the anhysteretic with the loss factor.
For a planar anisotropic material (2-D case) with applied field in the easy
plane [Jiles et al., 2000],
For completely isotropic materials (3-D case) [Jiles, 1991],
T is the temperature; /i0 is the permeability of vacuum and m is the magnetic
moment of a typical domain.
(5.10)
(5.11)
H k rwhere h = — He is the effective field; a = —— ; ks is Boltzmann constant;
a fiQifn
98
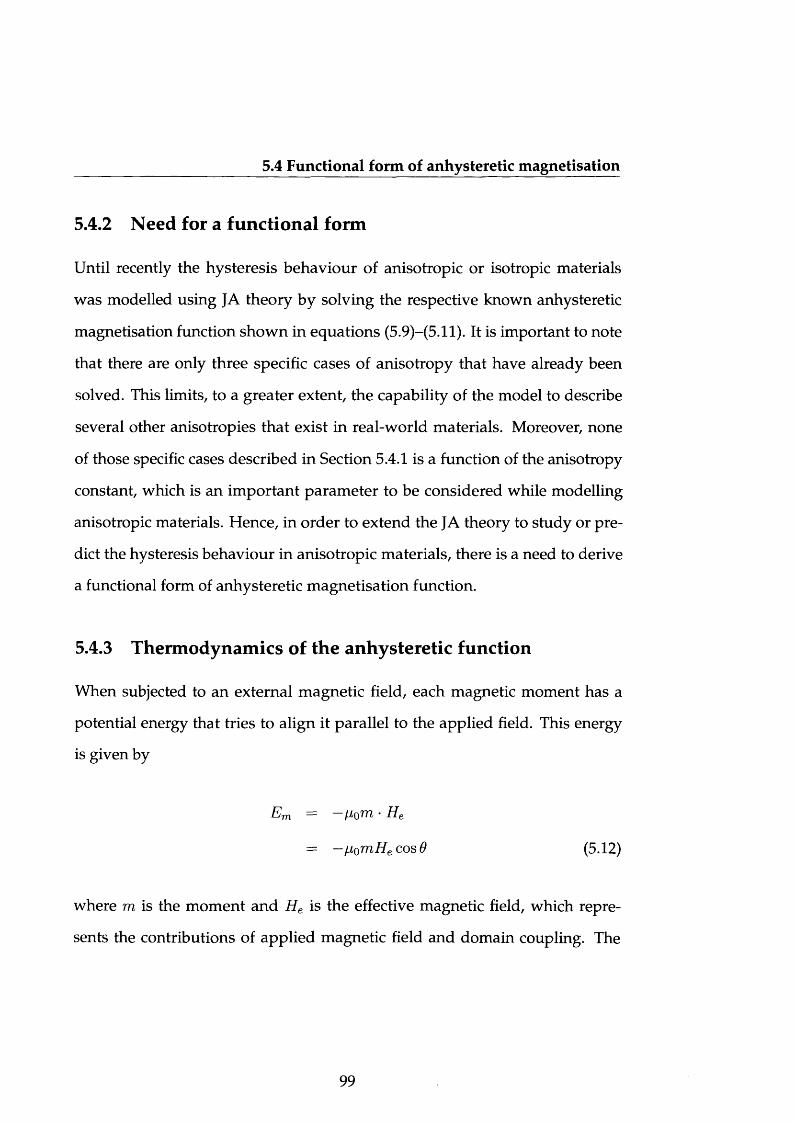
5.4 Functional form of anhysteretic magnetisation
5.4.2 Need for a functional form
Until recently the hysteresis behaviour of anisotropic or isotropic materials
was modelled using JA theory by solving the respective known anhysteretic
magnetisation function shown in equations (5.9)-(5.11). It is important to note
that there are only three specific cases of anisotropy that have already been
solved. This limits, to a greater extent, the capability of the model to describe
several other anisotropies that exist in real-world materials. Moreover, none
of those specific cases described in Section 5.4.1 is a function of the anisotropy
constant, which is an important parameter to be considered while modelling
anisotropic materials. Hence, in order to extend the JA theory to study or pre
dict the hysteresis behaviour in anisotropic materials, there is a need to derive
a functional form of anhysteretic magnetisation function.
5.4.3 Thermodynamics of the anhysteretic function
When subjected to an external magnetic field, each magnetic moment has a
potential energy that tries to align it parallel to the applied field. This energy
is given by
Em = -£to m • He
-- —f i Q m H e c o s 6 (5 .12)
where m is the moment and He is the effective magnetic field, which repre
sents the contributions of applied magnetic field and domain coupling. The
99
5.4 Functional form of anhysteretic magnetisation
anisotropy energy, for uniaxial materials, can be written to lowest order as
where Ku is the anisotropy constant; Q and 6 are the angles made by the mag
netic moment with respect to the unique axis and applied field respectively.
According to statistical thermodynamics, assuming no direct interaction
between the domains, the individual partition function can be represented
as [Bertotti, 1998]
The interaction in this case depends on an indirect mean field coupling. The
total partition function, Z, associated with N independent moments is given
in terms of individual partition functions by (Zm)N. The Gibbs free energy can
be calculated from the total partition function as
The anhysteretic magnetisation, Man, which is a function of energy of N mo
ments occupying a volume A V in a domain, can be expressed as a change in
Ea = K u sin2 Q (5.13)
'm
(5.14)states
where h and k are energy ratios and are given by
He K u kBT= — ' K' = T T r ; a = ------a kBl M om
G = - k BT \ n Z
- N k BT \ n Z m. (5.15)
100
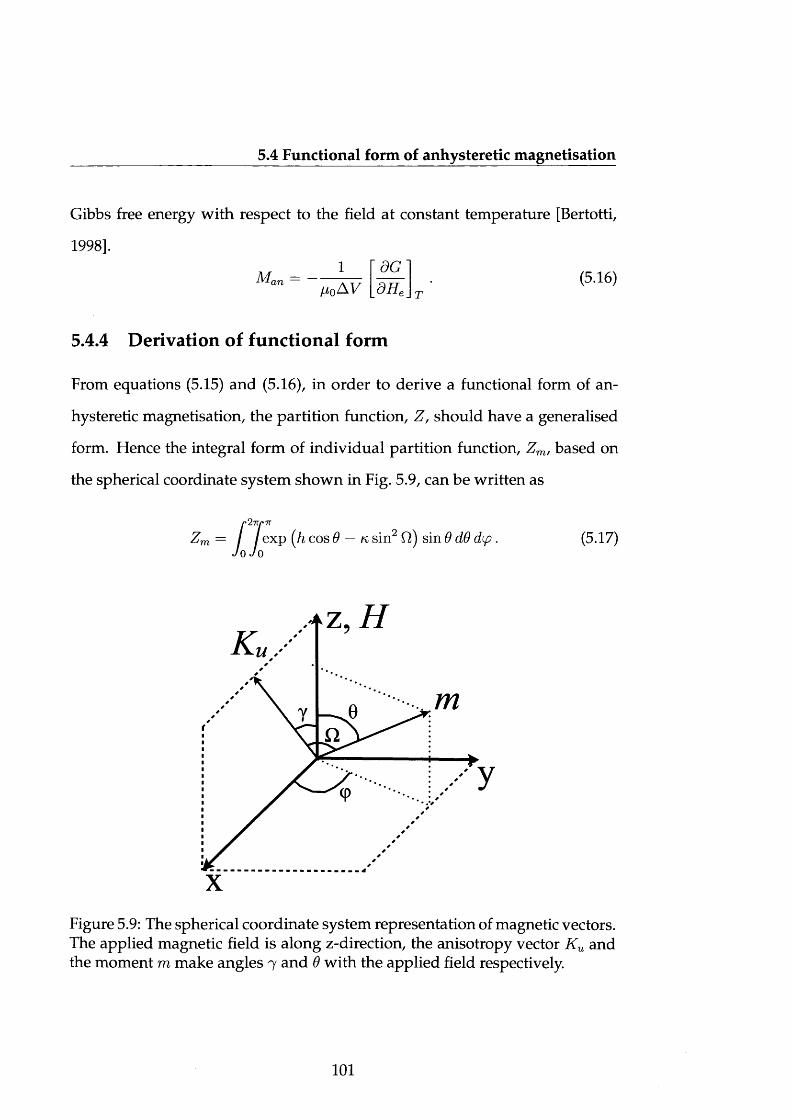
5.4 Functional form of anhysteretic magnetisation
Gibbs free energy with respect to the field at constant temperature [Bertotti,
1998].
Mnr, =1
HqA VdGd K
(5.16)
5.4.4 Derivation of functional form
From equations (5.15) and (5.16), in order to derive a functional form of an
hysteretic magnetisation, the partition function, Z, should have a generalised
form. Hence the integral form of individual partition function, Zm, based on
the spherical coordinate system shown in Fig. 5.9, can be written as
/•27iy* 7rZm = / / exp (h cos 0 — k sin2 fl) sin 0 dO dip. (5.17)
Jo Jo
Figure 5.9: The spherical coordinate system representation of magnetic vectors. The applied magnetic field is along z-direction, the anisotropy vector K u and the moment m make angles 7 and 6 with the applied field respectively.
101
5.4 Functional form of anhysteretic magnetisation
From equation (5.15), the Gibbs free energy can be calculated as
/ /*27T/*7T \
G = — N kBT In I j J exp (h cos 9 — k sin2 Q) sin 9 dO dp \ , (5.18)
The anhysteretic magnetisation can then be derived from Gibbs free energy
using equation (5.16) as
A/r _ NkBT d r x r2vrv an~ /x0A V d H t ( l '2 'K p 'K \
/ / exp (h cos 0 — k sin2 O) sin 9 dO dip ]
Taking the partial derivative w.r.t He we get,
(5.19)
pZTTpTT
/ / exp (h cos 9 — k, sin2 fl) sin 9 cos 9 d9 dtp M a n = M S °2y7r------------------------------------------------------------------- * (5 '2 0 )
/ / exp (h cos 9 — k sin2 f2) sin 9 d9 dp J0 Jo
Nmwhere Ms is the spontaneous magnetisation and is given by Ms =
In order to generalize the anhysteretic magnetisation function shown in
equation (5.20), the angle made by moments with anisotropy axis, Q, should be
represented in terms of other known angle parameters. This can be achieved
by defining the direction cosines of K u and m from the spherical coordinate
system.
From Fig. 5.9(a)), the direction cosines of Ku and m can be written as
K u : (sin 7 ,0, cos 7 )
m : (sin 9 cos p, sin 9 sin p, cos 9)
102
5.4 Functional form of anhysteretic magnetisation
The scalar product yields
(5.21)
On substitution of direction cosines,
cos Q, = sin 7 sin 9 cos p + cos 7 cos 6 (5.22)
On substituting equation (5.22) into (5.20) using a known trigonometric iden
tity (sin2 Q + cos2 0 = 1), we get
Equation (5.23) is the generalised form of anhysteretic magnetisation func
tion, which with suitable limiting conditions, can be reduced to known specific
model equations of particular cases.
5.4.5 Validation of functional form
The generalised form of anhysteretic magnetisation function can be validated
against the model equations for specific cases: axially anisotropic, planar anisotropic
and isotropic. Figure 5.10 shows the three specific cases of anisotropic materi
als that have known expressions for anhysteretic magnetisation function.
a. Axially anisotropic case
Consider the axially anisotropic case where the anisotropy constant is positive
exp (h cos 9 — k [l — cos2 f i]) sin 9 cos 9 d9 dp
exp (h cos 9 — k [l — cos2 fl]) sin 9 d9 dp(5.23)
103
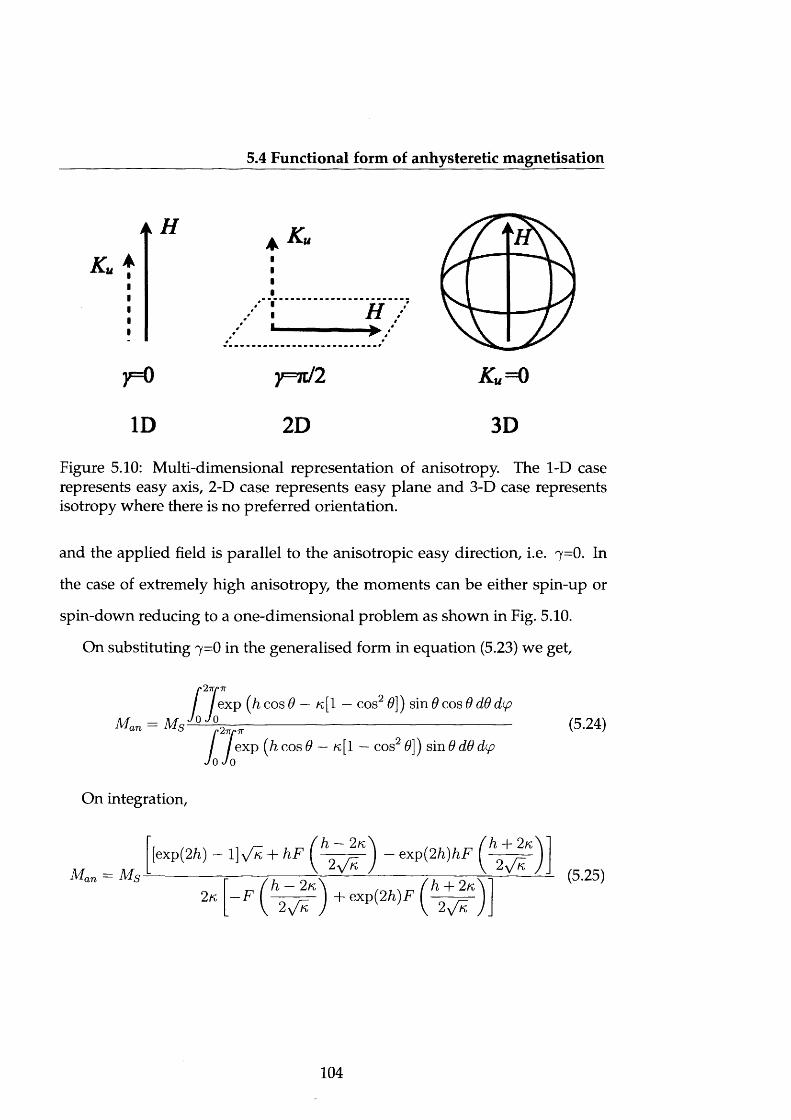
5.4 Functional form of anhysteretic magnetisation
A H
y = 0 y = jt /2 Ku=0
ID 2D 3D
Figure 5.10: Multi-dimensional representation of anisotropy. The 1-D case represents easy axis, 2-D case represents easy plane and 3-D case represents isotropy where there is no preferred orientation.
and the applied field is parallel to the anisotropic easy direction, i.e. 7 =0 . In
the case of extremely high anisotropy, the moments can be either spin-up or
spin-down reducing to a one-dimensional problem as shown in Fig. 5.10.
On substituting 7=0 in the generalised form in equation (5.23) we get,
exp (h cos 0 — k [ 1 — cos2 6 } ) sin 9 cos 9 d9 dcp
exp (h cos 9 — k [ 1 — cos2 9]) sin 9 d9 dcp
On integration,
Man =exp(2 h)hF
+ exp ( 2 / i ) F(5.25)
104
5.4 Functional form of anhysteretic magnetisation
where F(x) is Dawson's integral and is given by
F(x) = exp(—x 2) f exp(t2)dt Jo
For large \x\, the function F(x) ~ The complete derivation of equa-£Jution (5.25) from (A.l) is given in Appendix A.
In the case of extremely high anisotropy, K u tends to +00 (i.e. k, tends to
+00), applying the above boundary condition in equation (5.25) and neglecting
higher order terms, we get
Man « Ms (tanh (h)). (5.26)
This solution is the same as the axially anisotropic case shown in equa
tion (5.9). The derivation is given in Appendix B.
b. Planar anisotropic case
Consider that the anisotropy is negative and the applied field is in the easy
plane i.e. 7 = | . As shown in Fig. 5.10, unlike the ID case, the preferred
direction in this case is a plane. Hence this case can be reduced to a two-
dimensional problem in case of extremely high negative anisotropy.
On substitution of the boundary condition (7 = | ) in the generalised func
tional form given in equation (5.23), we get
/*27r/*7r/ / exp (h cos 9 — k[1 — sin2 9 cos2 (/?]) sin 9 cos 9 d9 dtp
Man = (5.27)/ / exp ( / i cos 9 — k[1 — sin2 9 cos2 p\) sin 9 d9 dp
Jo Jo
105
5.4 Functional form of anhysteretic magnetisation
On integration with respect to <p,
/*7T
/ exp (h cos 9 — j [3 + cos 29]\ lo sin2 0^ sin 9 cos 9 d9Man = Ms Jo~ r - ------------ ----------------— ------- (5.28)
/ exp y h cos9 — —[3 + cos29] j I0 ( — sin2 9j sin9d9J o
where I0(x) is the modified Bessel function of the first kind. The derivation of
the above equation can be found in Appendix B.
The procedure to solve this integral is similar to the one shown by Jiles et
al. [Jiles et al., 2000] and the solution is given in equation (5.10). The solution is
an infinite series and has no closed form. This can also be solved numerically
and the solution gives the anhysteretic curve of planar anisotropic materials.
c. Isotropic case
When there is no preferred direction in a material, that is anisotropy is zero,
i.e. K u=0 and hence k=0, this case has three-dimensional solution as shown in
Fig. 5.10.
On substitution of the boundary condition in equation (5.23) we get
/»27l7»7r
/ /exp (hcos9) cos 9 sin 9 d9d(pMan = M s JoJo ------------------------------- (5.29)
/ exp (h cos 9) sin 9 d9 dip Jo Jo
Solving the above integral yields,
M an = Ms ^coth (h) - (5.30)
This Langevin's function is the same as the one shown in equation (5.11)
106
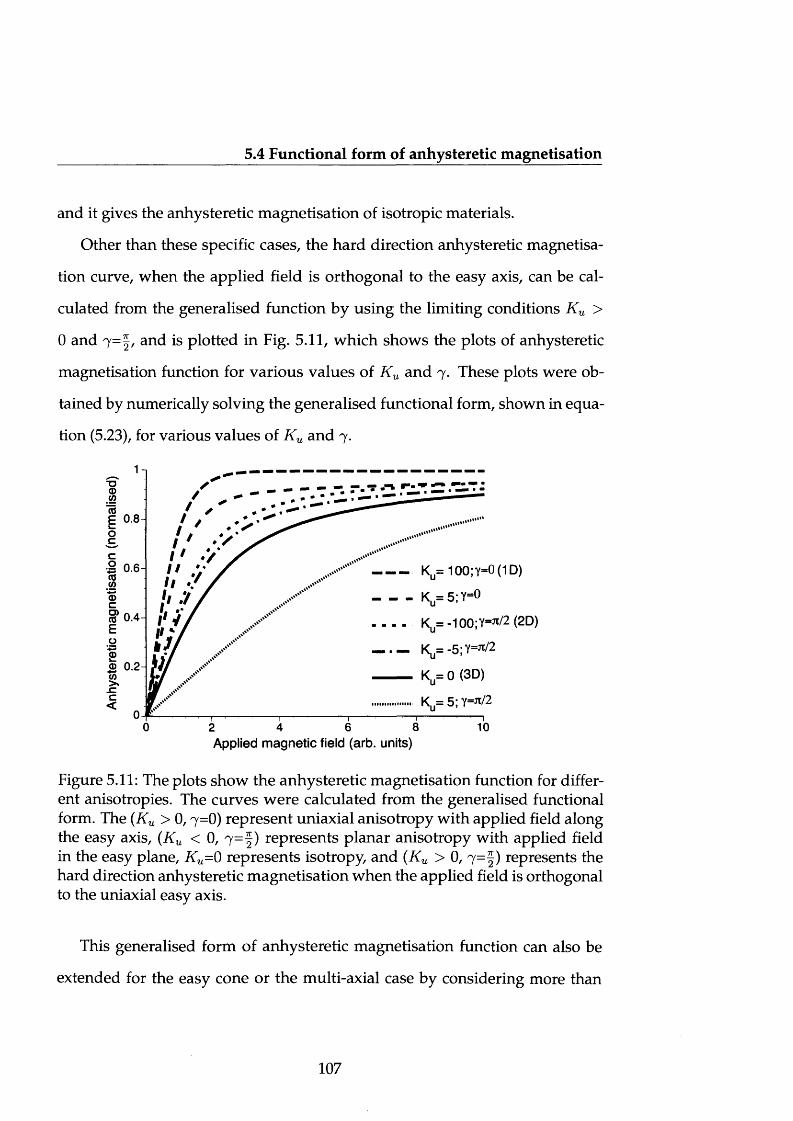
5.4 Functional form of anhysteretic magnetisation
and it gives the anhysteretic magnetisation of isotropic materials.
Other than these specific cases, the hard direction anhysteretic magnetisa
tion curve, when the applied field is orthogonal to the easy axis, can be cal
culated from the generalised function by using the limiting conditions K u >
0 and 7=f, and is plotted in Fig. 5.11, which shows the plots of anhysteretic
magnetisation function for various values of K u and 7 . These plots were ob
tained by numerically solving the generalised functional form, shown in equa
tion (5.23), for various values of K u and 7 .
Applied magnetic field (arb. units)
Figure 5.11: The plots show the anhysteretic magnetisation function for different anisotropies. The curves were calculated from the generalised functional form. The (Ku > 0 ,7 =0) represent uniaxial anisotropy with applied field along the easy axis, (Ku < 0, 7 = f) represents planar anisotropy with applied field in the easy plane, Ku=0 represents isotropy, and (Ku > 0, 7 =§) represents the hard direction anhysteretic magnetisation when the applied field is orthogonal to the uniaxial easy axis.
This generalised form of anhysteretic magnetisation function can also be
extended for the easy cone or the multi-axial case by considering more than
107
5.5 Modelling of magnetic two-phase materials
one anisotropy constant in the anisotropy energy equation given in (5.13). Re
placing the uniaxial anisotropy energy with cubic anisotropy energy and de
riving the generalised form predicts precisely the hysteresis behaviour of cubic
anisotropy materials.
5.5 Modelling of magnetic two-phase materials
Magnetic two-phase materials are those that exhibit two magnetic phases in
one hysteresis cycle: one at lower fields and the other at higher fields. The
transition from one phase to the other, i.e. low field phase to high field phase
occurs at the exchange field. The exchange field is an inherent property of the
material that represents the coupling between two different types of magnetic
phases in a material. In order to understand completely the behaviour of mag
netic two-phase materials, a reliable model based on microstructural processes
is necessary. Hence, the JA theory of hysteresis has been extended to model
magnetic two-phase materials by representing the five microstructural param
eters: spontaneous magnetisation, Ms, pinning parameter, k, domain density,
a, domain coupling, a, and reversibility parameter, c, as functions of the ex
change field.
5.5.1 The model
Magnetic two-phase behaviour can be induced in magnetic materials by sub
jecting them to thermal treatment [Alexandrakis et al., 2009] or compressive
stress [Moses & Davies, 1980]. Typical hysteresis behaviour of a two-phase
material is shown in Fig. 5.12(a). It is evident from the figure that the hystere-
108
5.5 Modelling of magnetic two-phase materials
sis loop has two distinct regions, low field and high field, having completely
different magnetic phase. Hence to model this hysteresis behaviour, two sets
of microstructural parameters, one set for each magnetic phase, are required.
Also, a simple-yet-robust mathematical function that could switch between
two states in various ways, e.g. step-like, smooth etc., is necessary to describe
easily the sharper or smoother transitions from one magnetic phase to the other
based on the exchange field. A known mathematical function that can produce
both step-like and smoother transition by varying just one parameter is the
Boltzmann function and is represented as [Bender & Orszag, 1978]
» - A ' \ h \ - h . + a * < 5 - 3 1 )
1 + e AH
where y is one of the JA parameters (MS/ k, a, c, and a), A\ is the value of
y in the low field magnetic phase, A2 is the value of y in the high field mag
netic phase, H is the applied magnetic field, He* is the exchange field of the
material at which the transition from one magnetic phase to the other occurs,
A H represents the range of fields over which the transition takes place i.e. the
smoothness of transition between two magnetic phases.
Figure 5.12(b) shows the plot of Boltzmann function given in equation (5.31).
Larger values of AH correspond to smoother transition whereas smaller val
ues indicate abrupt transition (or step-like function).
109
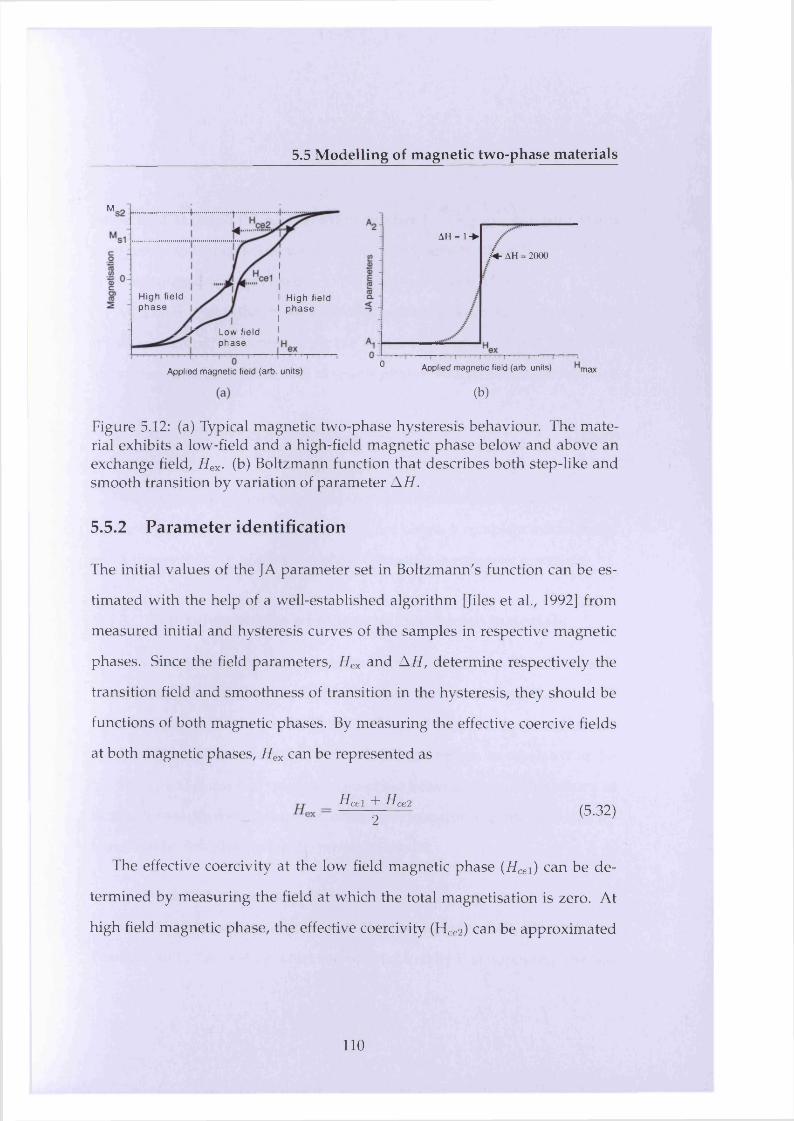
5.5 Modelling of magnetic two-phase materials
H ig h f ie ld | p h a s e |
H ig h fie ld p h a s e
y j r L ow fie ld
pha$eA pplied m agnetic field (arb . units)
M,
0 Applied m agnetic field (arb. units)
AH - !-►
(b)
M- AH - 2000
max
Figure 5.12: (a) Typical magnetic two-phase hysteresis behaviour. The material exhibits a low-field and a high-held magnetic phase below and above an exchange field, Hex. (b) Boltzmann function that describes both step-like and smooth transition by variation of parameter AH.
5.5.2 Parameter identification
The initial values of the JA parameter set in Boltzmann's function can be es
timated with the help of a well-established algorithm [Jiles et al., 1992] from
measured initial and hysteresis curves of the samples in respective magnetic
phases. Since the held parameters, Hex and AH, determine respectively the
transition held and smoothness of transition in the hysteresis, they should be
functions of both magnetic phases. By measuring the effective coercive helds
at both magnetic phases, Hex can be represented as
The effective coercivity at the low held magnetic phase (i/cei) can be de
termined by measuring the field at which the total magnetisation is zero. At
high held magnetic phase, the effective coercivity (Hce2) can be approximated
Heel + Hce 2 (5.32)2
110
5.5 Modelling of magnetic two-phase materials
MSi ~I- 52as the field at which the magnetisation reaches ( ------ ------- ], where Ms 1 is
the spontaneous magnetisation in the low field magnetic phase (LFP) and M S2
is the spontaneous magnetisation in the high field phase (HFP).
As A H represents the smoothness of transition between the magnetic phases,
it can be deduced from measuring the slopes of initial curve just below and
above the exchange field for both magnetic phases, which can be approximated
as
A H = ~dM' 'dM'dH LFP dH HFP
(5.33)
By substituting the exchange field-dependent parameter set into the exist
ing model shown in equations (5.1)-(5.3), we obtain a complete model based
on JA theory that can predict two-phase behaviour in magnetic materials.
5.5.3 Typical examples of magnetic two-phase materials
There is a wide range of magnetic materials that exhibit two-phase magnetic
behaviour such as hard-soft bi-layer thin films, micro-wires, multilayer struc
tures that are used for perpendicular recording and even grain-oriented silicon-
iron under compressive stress. With suitable conditions, as tabulated in Ta
ble 5.1, typical features of magnetic two-phase behaviour of materials such as
hard-soft bi-layer thin films, grain-oriented silicon-iron and magnetic micro
wires, can be described using the proposed model.
Case 1: Hard-soft bi-layer thin films
Consider CoPt based hard-soft bi-layer films deposited on Si02/Si substrates.
The hard-soft bilayered structure can be produced by first depositing the bot-
111
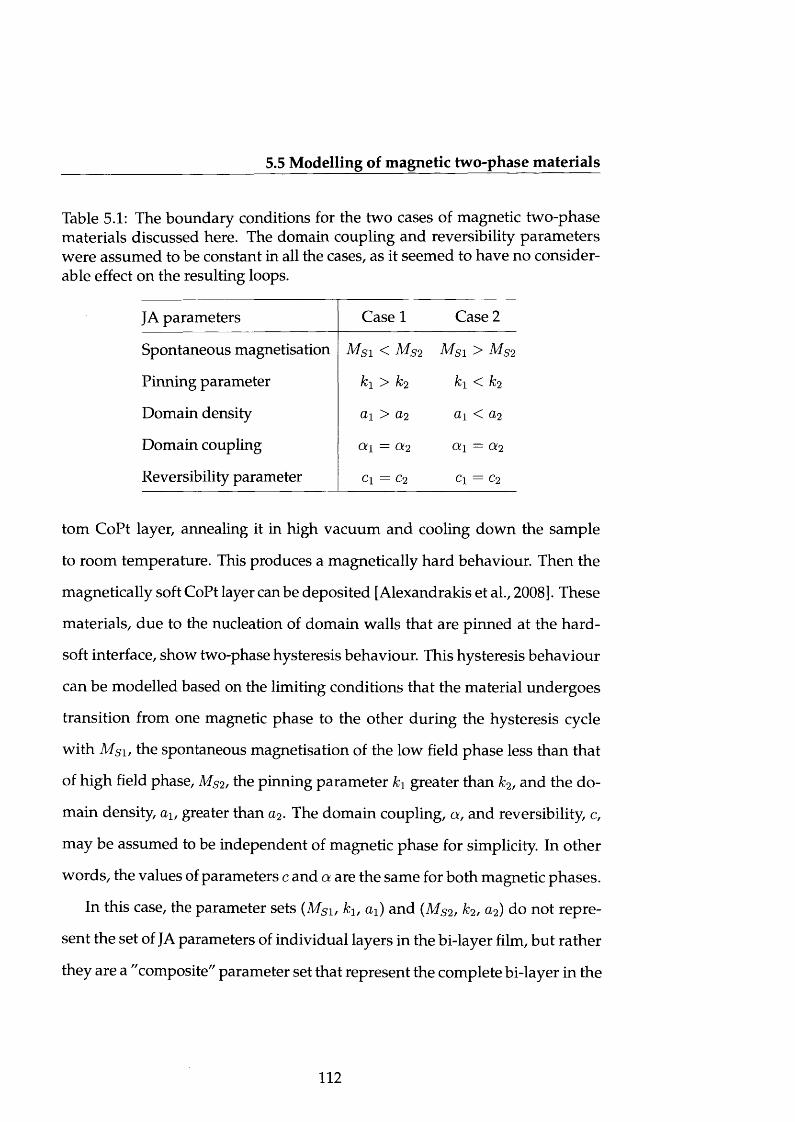
5.5 Modelling of magnetic two-phase materials
Table 5.1: The boundary conditions for the two cases of magnetic two-phase materials discussed here. The domain coupling and reversibility parameters were assumed to be constant in all the cases, as it seemed to have no considerable effect on the resulting loops.
JA parameters Case 1 Case 2
Spontaneous magnetisation M s i < M s 2 M s i > M s 2
Pinning parameter ki > k2 h < k2
Domain density a i > a 2 a i < a 2
Domain coupling a i — °l2 OL\ = Oi2
Reversibility parameter Cl = c 2 Cl = C2
tom CoPt layer, annealing it in high vacuum and cooling down the sample
to room temperature. This produces a magnetically hard behaviour. Then the
magnetically soft CoPt layer can be deposited [Alexandrakis et al., 2008]. These
materials, due to the nucleation of domain walls that are pinned at the hard-
soft interface, show two-phase hysteresis behaviour. This hysteresis behaviour
can be modelled based on the limiting conditions that the material undergoes
transition from one magnetic phase to the other during the hysteresis cycle
with Ms\, the spontaneous magnetisation of the low field phase less than that
of high field phase, MS2, the pinning parameter k\ greater than k2/ and the do
main density, alr greater than a2. The domain coupling, a, and reversibility, c,
may be assumed to be independent of magnetic phase for simplicity. In other
words, the values of parameters c and a are the same for both magnetic phases.
In this case, the parameter sets (Msi, h , ai) and (MS2, k2/ a2) do not repre
sent the set of JA parameters of individual layers in the bi-layer film, but rather
they are a "composite" parameter set that represent the complete bi-layer in the
112
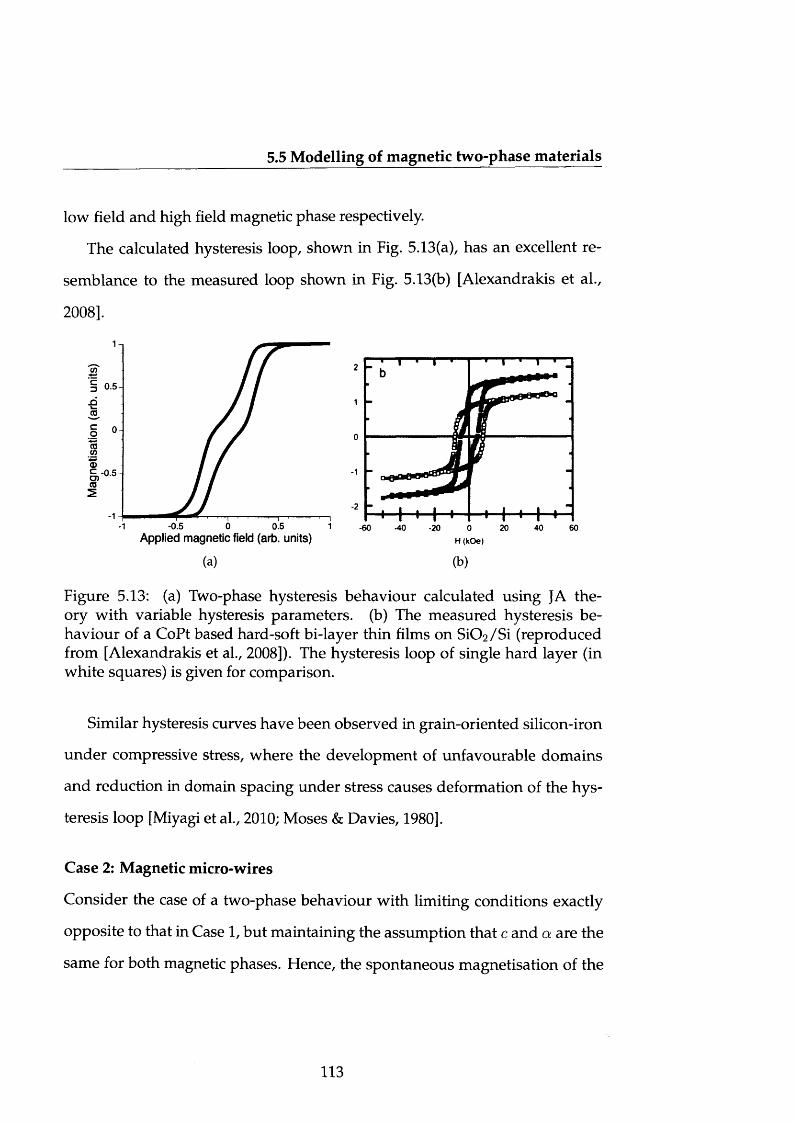
5.5 Modelling of magnetic two-phase materials
low field and high field magnetic phase respectively.
The calculated hysteresis loop, shown in Fig. 5.13(a), has an excellent re
semblance to the measured loop shown in Fig. 5.13(b) [Alexandrakis et al.,
2008].
Figure 5.13: (a) Two-phase hysteresis behaviour calculated using JA theory with variable hysteresis parameters, (b) The measured hysteresis behaviour of a CoPt based hard-soft bi-layer thin films on Si02/Si (reproduced from [Alexandrakis et al., 2008]). The hysteresis loop of single hard layer (in white squares) is given for comparison.
Similar hysteresis curves have been observed in grain-oriented silicon-iron
under compressive stress, where the development of unfavourable domains
and reduction in domain spacing under stress causes deformation of the hys
teresis loop [Miyagi et al., 2010; Moses & Davies, 1980].
Case 2: Magnetic micro-wires
Consider the case of a two-phase behaviour with limiting conditions exactly
opposite to that in Case 1, but maintaining the assumption that c and a are the
same for both magnetic phases. Flence, the spontaneous magnetisation of the
-60 -40 -20 0 20 40 60H ( k O e )Applied magnetic field (arb. units)
(a) (b)
113
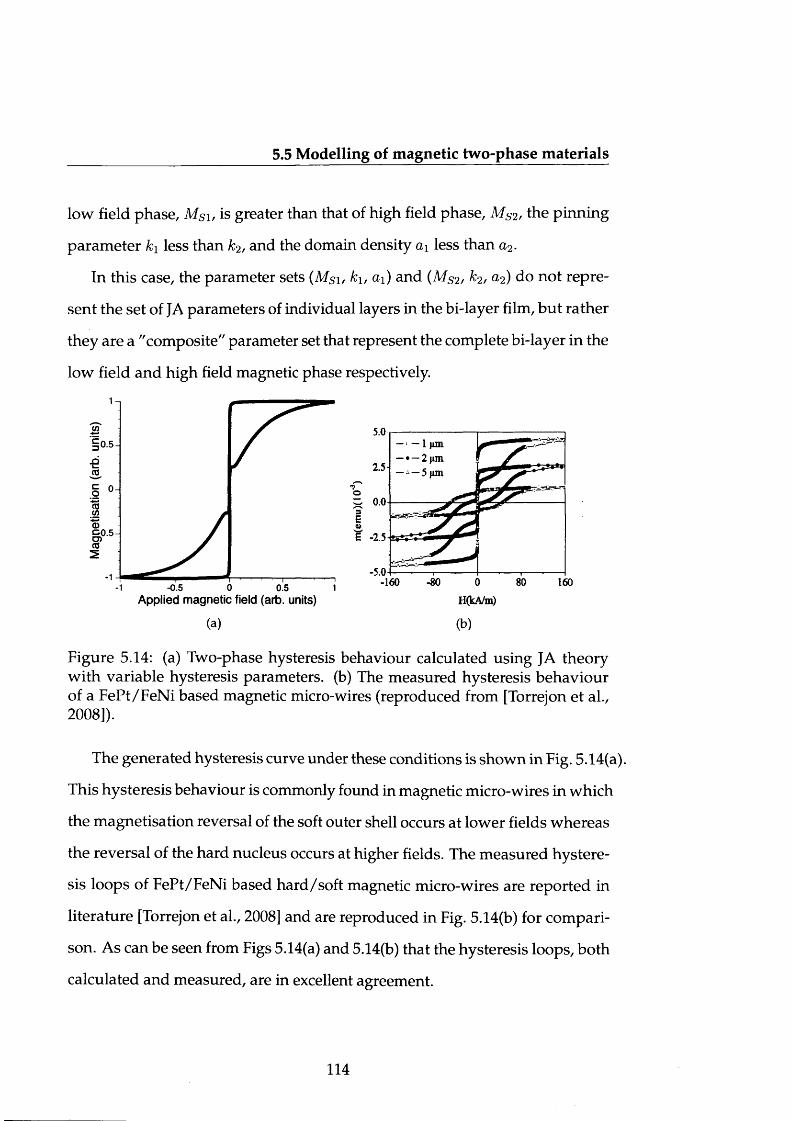
5.5 Modelling of magnetic two-phase materials
low field phase, Ms 1, is greater than that of high field phase, MS2, the pinning
parameter ki less than k2/ and the domain density ai less than a2.
In this case, the parameter sets (Msi, h , ai) and (MS2/ k2, a2) do not repre
sent the set of JA parameters of individual layers in the bi-layer film, but rather
they are a "composite" parameter set that represent the complete bi-layer in the
low field and high field magnetic phase respectively.
5.00 .5 -
2.5-
w 0.0
¥ -2.5 y s
S d-80 0
-5.0-160 80 160"I1-0.5 0 0.5
Applied magnetic field (arb. units)•1
(a) (b)
Figure 5.14: (a) Two-phase hysteresis behaviour calculated using JA theory with variable hysteresis parameters, (b) The measured hysteresis behaviour of a FePt/FeNi based magnetic micro-wires (reproduced from [Torrejon et al., 2008]).
The generated hysteresis curve under these conditions is shown in Fig. 5.14(a).
This hysteresis behaviour is commonly found in magnetic micro-wires in which
the magnetisation reversal of the soft outer shell occurs at lower fields whereas
the reversal of the hard nucleus occurs at higher fields. The measured hystere
sis loops of FePt/FeNi based hard/soft magnetic micro-wires are reported in
literature [Torrejon et al., 2008] and are reproduced in Fig. 5.14(b) for compari
son. As can be seen from Figs 5.14(a) and 5.14(b) that the hysteresis loops, both
calculated and measured, are in excellent agreement.
114
5.6 Summary
In the two-phase material modelling, for better prediction of two-phase
magnetic behaviour, the exchange field should be represented as a function
of stress (in the case of silicon-iron) in the material. Also, the parameters c and
a should be represented as functions of the exchange field rather than assum
ing constants. In order to understand completely the behaviour of two-phase
materials, it is also necessary to model minor loops using JA theory.
5.6 Summary
• This chapter introduced the modelling aspects of magnetic hysteresis.
The JA theory of hysteresis was discussed in detail. The extension of
JA theory to incorporate temperature dependence of hysteresis was ex
plained.
• The thermally dependent hysteresis model was validated against mea
surements made of a substituted cobalt ferrite material and was found to
be in good agreement.
• The functional form of anhysteretic magnetisation that helps in m od
elling the influence of anisotropy effects on magnetic hysteresis in JA
theory was derived. It was shown that, with necessary limiting condi
tions, the generalised form could be reduced to known model equations
for specific cases.
• The procedure to model and predict the magnetic hysteresis behaviour
of magnetic two-phase materials using JA theory was elaborated. Two
different cases based on this model were discussed. It was found that
115
5.6 Summary
the calculated hysteresis behaviours were qualitatively in excellent agree
ment with those measured on hard-soft bi-layer thin film structures and
micro-wires.
116
Chapter 6
Application of Jiles-Atherton theory
to thin films
6.1 Introduction
This chapter introduces the modelling aspects of thin films based on Jiles-
Atherton theory of hysteresis. Section 6.2 explains the need for a magnetic
hysteresis model for thin films based on phenomenological approach. Sec
tion 6.3 gives a detailed approach to modelling of thin films using JA theory
by choosing the correct anhysteretic magnetisation function. Section 6.4 elab
orates the procedure to model thin films based on JA theory of hysteresis and
applies the proposed model to cobalt ferrite thin films investigated in Chap
ter 3. The variations of microscopic JA parameters with substrate temperature
and oxygen pressure are studied. The modelled and measured hysteresis loops
are then compared.
117
6.2 Thin film hysteresis models
6.2 Thin film hysteresis models
The first magnetic thin film was prepared by the German physicist August
Kundt in the 1880s using electrochemical deposition process [Kundt, 1886].
Since then there has been a huge development in this field. The dynamics of
domains and domain walls of magnetic thin films were studied and known in
the early 1990s [Slonczewski, 1991a,b]. Although there were models to predict
the magnetic behaviour in bulk materials, they cannot be used in their present
form to predict behaviour in thin films. This is due to the kind of anisotropy,
crystallographic structure, substrate induced strain, grain size, texture etc. that
differentiate thin films from bulk materials and play a major role in determin
ing the magnetic behaviour.
A theory of magnetic hysteresis for thin films developed by Slonczewski in
1960s based on Stoner-Wohlfarth model, which was previously circulated in
ternally at IBM research, has recently been published [Slonczewski, 2009]. This
model was primarily developed for thin films that approach single domain
magnetic behaviour that are commonly found in small structures of iron-nickel
alloy and are widely applied in the magnetic recording industry.
Micromagnetic models based on Landau-Lifshitz theory were conducted
on thin films. Today micromagnetics is widely used in the modelling of spin
valves, giant magnetoresistive heads and thin film media [Lee et al., 2010;
Miles & Parker, 1996; Zhu & Bertram, 1988]. In micromagnetic models, thin
film media were modeled as a planar hexagonal array of hexagonally shaped
grains. Each grain is a single domain particle whose magnetisation reverses by
coherent rotation. However, the main disadvantage of micromagnetic models
118
6.3 JA model for thin films
is their very large computation time as explained in Section 2.6.
Today thin films can be found in many applications ranging from mag
netic recording media to solar panels. Although the properties of materials
in bulk form are better for some applications, thin films attract the develop
ing markets with the potential to produce next-generation nanoscale devices.
However, growing good quality thin films to achieve desired properties is still
considered as a challenge due to the influence of many deposition parameters
as explained in Section 2.5.1. It is neither very easy nor inexpensive to ex
perimentally optimise the deposition parameters for the growth of good qual
ity thin films with desired properties for a particular application. Hence an
attempt was made as a part of this research to develop a phenomenological
model of magnetic hysteresis for thin films based on JA theory in order to un
derstand the effects of deposition parameters on the properties of thin films
without having to deposit and characterise large number of samples on a "try-
and-test" basis.
6.3 JA model for thin films
As a part of this research work, an attempt was made to model magnetic prop
erties of thin films using Jiles-Atherton theory of hysteresis. The JA theory
is explained in detail in Chapter 5. The five parameters of the model are in
trinsic properties of the material and hence are not directly influenced by the
form factor of the material (bulk or thin film). One of the main parameters to
be considered in thin film modelling is the anisotropy. In this work, thin film
anisotropy was approximated to two-dimensional case due to their negligible
119
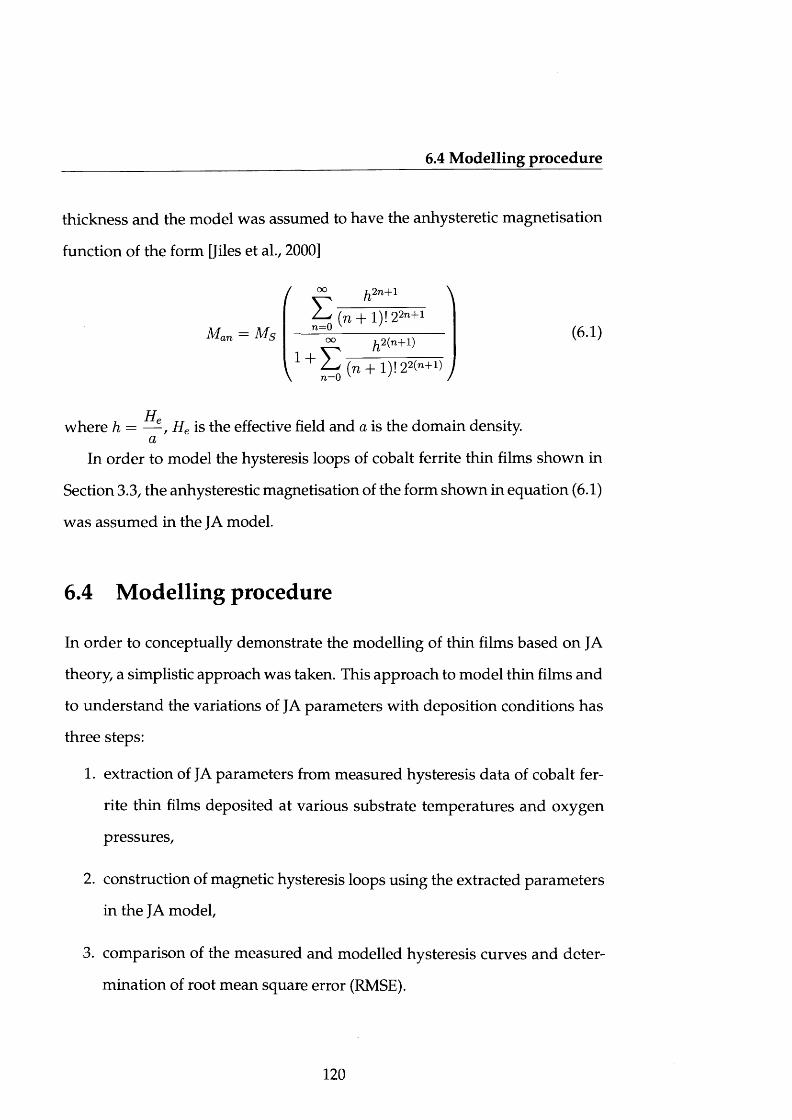
6.4 Modelling procedure
thickness and the model was assumed to have the anhysteretic magnetisation
function of the form [Jiles et al., 2000]
(
Man = MSE
h 2n + 1 \(n + l ) ! 22n+1
fi2(n+1)
\ l + ^ 0 (n + m 2(n+l) J
(6.1)
HPwhere h = — , He is the effective field and a is the domain density.a
In order to model the hysteresis loops of cobalt ferrite thin films shown in
Section 3.3, the anhysterestic magnetisation of the form shown in equation (6.1)
was assumed in the JA model.
6.4 Modelling procedure
In order to conceptually demonstrate the modelling of thin films based on JA
theory, a simplistic approach was taken. This approach to model thin films and
to understand the variations of JA parameters with deposition conditions has
three steps:
1. extraction of JA parameters from measured hysteresis data of cobalt fer
rite thin films deposited at various substrate temperatures and oxygen
pressures,
2. construction of magnetic hysteresis loops using the extracted parameters
in the JA model,
3. comparison of the measured and modelled hysteresis curves and deter
mination of root mean square error (RMSE).
120
6.4 Modelling procedure
The five parameters of JA theory were extracted from the measurements
using dividing rectangles (DIRECT) algorithm, an iterative optimisation tech
nique with reliability and robustness. As the name indicates, the algorithm
objective function. A detailed explanation of the DIRECT algorithm can be
found in [Perttunen et al., 1993]. The important inputs to this algorithm are
• objective function: any function that is to be minimised or maximised
using optimisation algorithms. In this case, it is the solution of JA model
equations (5.1)—(5.3).
• number of iterations: 1000
• global minimum: The smallest overall value of a function over its entire
range. In this case, it is defined as
where Mmodei and Mmeas are respectively the modelled and measured
magnetisation data. This is a good approximation for the minimal value
of the objective function as the modelled data is obtained by calculating
the objective function.
For all the cases discussed in this Chapter, the optimised parameters were
obtained after 1000 iterations at which the minimum value of the objective
function reaches a value of the order of 10~2.
samples points in the domain and uses the information to decide the next
search path iteratively until it converges globally to a minimal value of the
modelmm (6.2)
121
6.4 Modelling procedure
The hysteresis loops of cobalt ferrite thin films were calculated by using the
extracted parameters in the JA model equations (5.1)-(5.3) given in Chapter 5.
The hysteresis model and the optimisation algorithm were coded in MATLAB.
The boundaries of the five JA parameters were set as follows [Chwastek &
Szczyglowski, 2007]:
where, Ms is saturation magnetisation, k is pinning constant, a is domain den
sity, a is domain coupling, c is reversibility factor, MtiP is the maximum value
of magnetisation in the measured data, Htip is the maximum value of magnetic
field in the measured data and Hc is the measured coercivity.
The error between the measured and modelled hysteresis curves, a mea
sure of reliability and robustness of the extraction procedure, was obtained by
calculating RMSE as follows:
Ms: (Q.8*Mtip, 1.5*Mtip)
k: (13.2*HC,5*HC>
a: (05*HC, 5*HC)
a: (0.7*HtiP/M tiP, HtiP/M tiP)
c: (0,1)
RMSE = ^ (6.3)
where Y is the measured magnetisation data, y is the modelled magnetisation
data and n is the number of points. The lower the RMSE value the better the
6.4 Modelling procedure
fit between measurements and model. The RMSE value can be related to the
m inimum value of the objective function given in equation (6.2).
6.4.1 Thin films deposited at different substrate temperatures
The JA parameters are extracted using the DIRECT algorithm from the mea
sured in-plane hysteresis loops of cobalt ferrite thin films deposited at different
substrate temperatures shown in Fig. 3.2(a) to understand the influence of sub
strate temperature on microscopic parameters. Figure 6.1 shows the variation
of extracted JA parameters of cobalt ferrite thin films with substrate temper
ature. The calculated saturation magnetisation increases with increasing sub
strate temperature as observed in the measurements. The domain wall pin
ning parameter increases with deposition temperature indicating an increase
in domain wall pinning energy and/or pinning density. The domain density
remains almost constant at substrate temperatures higher than 350 °C. The
domain coupling, a measure of magnetic interactions between domains, de
creases with increasing substrate temperature. The reversibility, a measure of
domain wall bowing, is almost independent of substrate temperature.
The calculated and measured saturation magnetisation and coercivity are
in very good agreement. The hysteresis loops calculated using the extracted
parameters of the JA model are plotted against the measured loops for com
parison and are given in Fig. 6.2. As can be seen from the figure, the modelled
and measured hysteresis loops are in excellent agreement.
The RMSE increases with increasing substrate temperature indicating that
the model deviates more from the measurements at higher substrate temper-
123
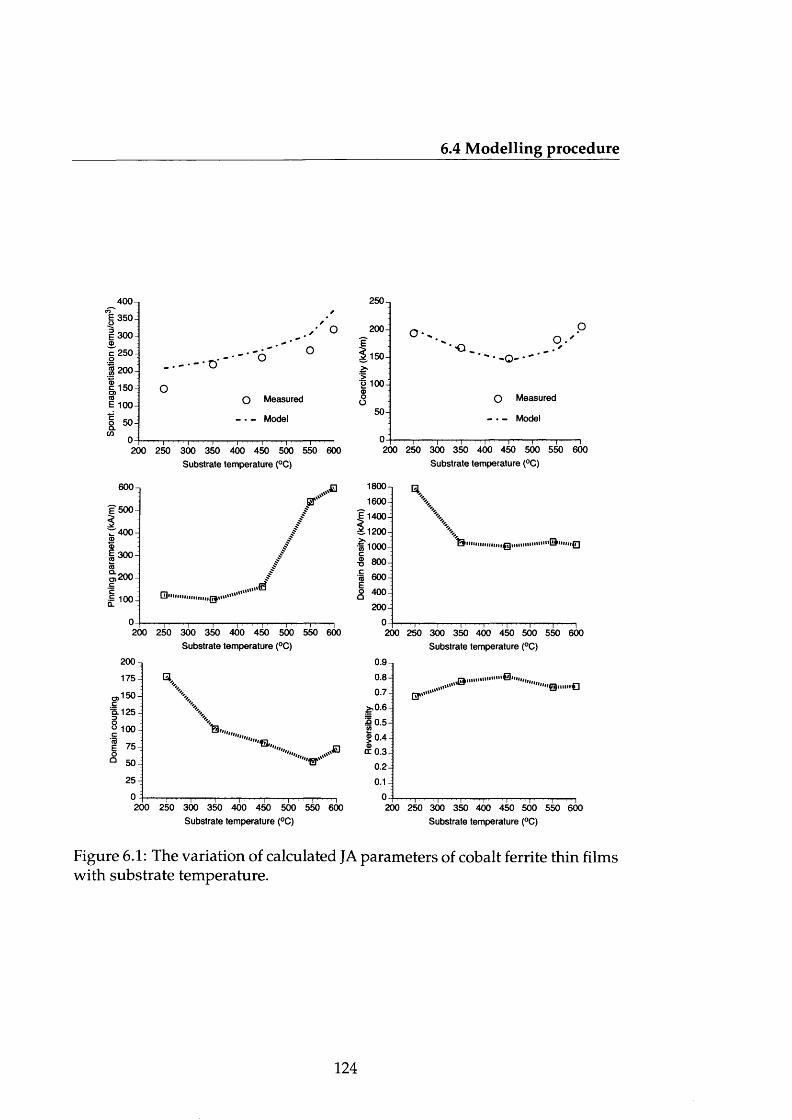
6.4 Modelling procedure
_ 4°° | 350
1 300 Ac 250 of 200- ©C 150 o (0E 100
I 50
0
°o
o’
O Measured Model
200 250 300 350 400 450 500 550 600 Substrate temperature (°C)
600
E* 500-
r 4 0 0 - ©§ 300-CO
S200-C
■— 1 0 0 - CD'HUMlliinnniQ^ull'"” '
r
200 250 300 350 400 450 500 550 600 Substrate temperature (°C)
200 n175-
150-
0 100-
50-
25 -
200 250 300 350 400 450 500 550 600
250
200-|1.150
0 100 © o o50
O0 .‘
O Measured
Model
200 250 300 350 400 450 500 550 600 Substrate temperature (°C)
18001600
1 1400 1.1200I '1000■g 800-|
‘5 600 § 400-|
200 0200 250 300 350 400 450 500 550 600
Substrate temperature (°C)0.9 0.8 0.7-j
£0.6 I 0.5to®0.4̂©t t 0 .3
0.2 0.14 0
0"
Substrate temperature (°C)200 250 300 350 400 450 500 550 600
Substrate temperature (°C)
Figure 6.1: The variation of calculated JA parameters of cobalt ferrite thin films with substrate temperature.
124
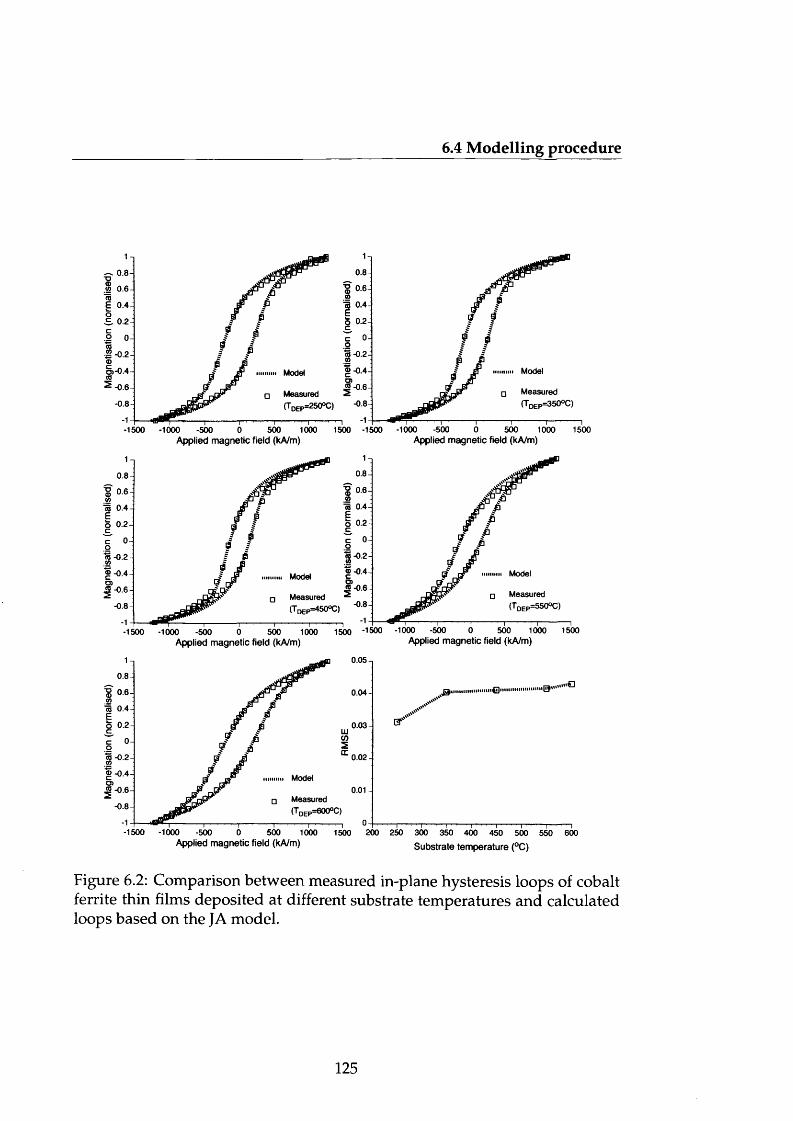
6.4 Modelling procedure
0 .8 -0 .8 -
"8 0.6-E 0 .4 - oS 0 .2 -co 0- <3•S -0-2-(D& -0 .4 -
75 0.4- EO 0.2-
-0.2
® -0.4- ModelModel
«-0.6- 0.6 Measured (T DEP=350°C)
Measured 0" DEP=250°C) -0.8- 0.8
1000 1500 -1500 -1000 -500) Applied magnetic field (kA/m)
500-1500 -1000 -500 0 500 1Applied magnetic field (kA/m)
1000 1500
0 .8 -0.80 .6 -
75 0.4- Eo 0 .2 -
75 0 .4 - EO 0 . 2 - cc 0 -
75 -0.2- -0.2
® -04 Model c□>® -0.6 Measured 2(T De p = 4 5 0 °C ) ‘° - 8
? -0 .4- lllllltIH Model
« -0 .6 -
-0 .8 -
00 -500 0 500 1000 1500Applied magnetic field (kA/m)
-1500 -1000 -500 0 500 1Applied magnetic field (kA/m)
0.05-,
0 .8 -
■ § 0 .6 - 0 .04-
<0 0 .4 - EO 0 .2 - 0.03-
73 -0.2- 0 .0 2 -
® - 0 .4 - ModelS - 0 .6 - 0 .0 1 -
Measured (Tdep=600°C)-0 .8 -
-1500 -1000 -500Applied magnetic field (kA/m)
500 1000 1500
Substrate temperature (°C)
Figure 6.2: Comparison between measured in-plane hysteresis loops of cobalt ferrite thin films deposited at different substrate temperatures and calculated loops based on the JA model.
125
6.4 Modelling procedure
ature. It is already explained in Section 3.3.1 and also shown in Fig. 3.4 that
there is a substantial amount of strain on the film at higher substrate tempera
tures due to thermal expansion mismatch between the film and substrate. But
the JA model assumes the ideal case where there is no thermal expansion mis
match. This is probably the reason for deviation of the model predictions from
measurements at higher substrate temperatures.
6.4.2 Thin films deposited at different oxygen pressures
In order to understand the effect of reactive oxygen pressure on microscopic
parameters, the in-plane hysteresis loops of cobalt ferrite thin films deposited
at various oxygen pressures were modelled using the procedure explained
above. The JA parameters were extracted from the measured loops and are
plotted against the reactive oxygen pressure and are shown in Fig. 6.3.
The variation of saturation magnetisation with oxygen pressure does not
show a monotonic trend. This behaviour can be attributed to the oxygen de
ficiency, and formation of mixed phase films at lower (5 mTorr and 15 mTorr)
and higher oxygen pressures (50 mTorr). The pinning parameter, although
seems to be constant at lower oxygen pressures, increases at higher oxygen
pressures. The domain density decreases with increasing oxygen pressures
whereas the domain coupling increases with oxygen pressure until ~22 mTorr
and then decreases. The measured and modelled values of saturation mag
netisation and coercivity are in good agreement.
It is worth noting that the range of oxygen pressure for optimised growth of
single phase cobalt ferrite thin films at lower substrate temperature is approx-
126
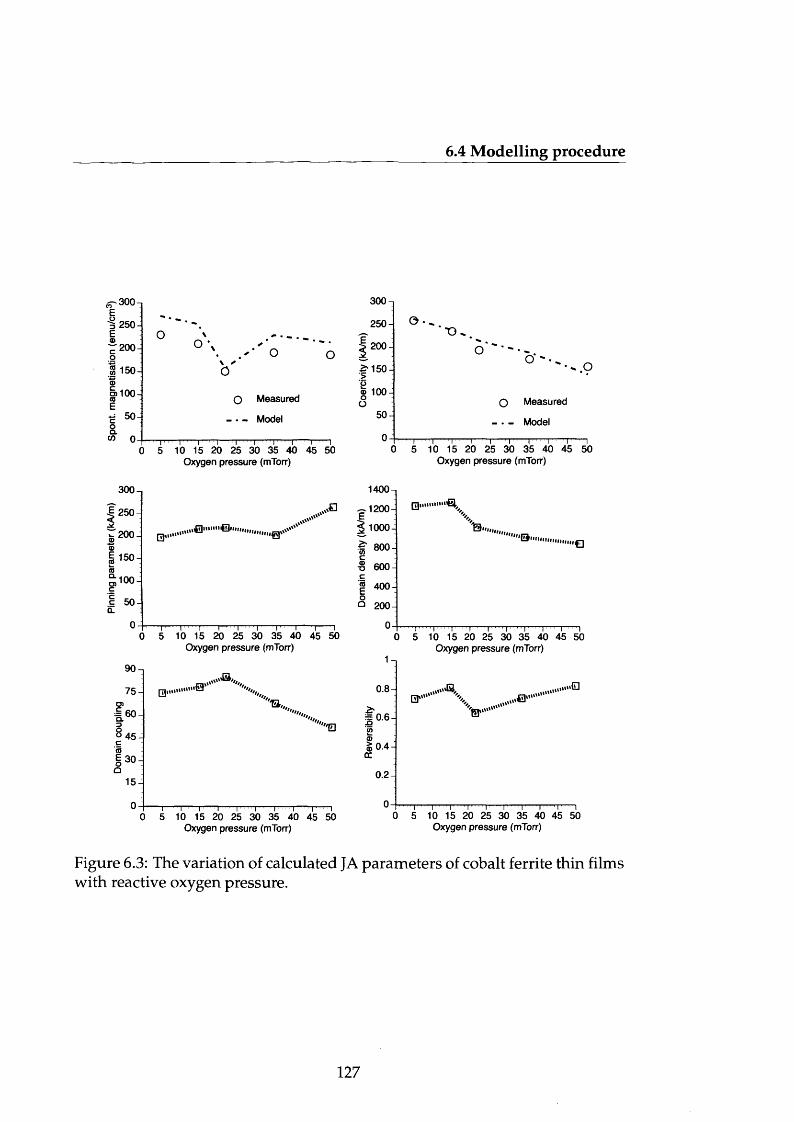
6.4 Modelling procedure
t=r 300 EO 'J
2 5 0 -E©^ 20001 150- ®
§>100-COE~ 50 oQ.
CO n
300
| 2 5 0 -
iT 200I 150-1aj£100cI 50-1Q.
90
7 5 -O)|6o l8 4 5 -| cCO§30la
15
O \
o \ O► ✓3
O Measured
- ■ - Model
O
■r1 r~—i—~r— i---- 1---- 1---- 1---- 1---- 10 5 10 15 20 25 30 35 40 45 50
Oxygen pressure (mTorr)
»&"""& .
~t— i---- 1------- 1-1------ r~—r~—i---1-----15 10 15 20 25 30 35 40 45 50
Oxygen pressure (mTorr)
u 'S ,, .
TZ,
0 5i i i i i i i r i
10 15 20 25 30 35 40 45 50Oxygen pressure (mTorr)
300
250
| 200-
£ •1 5 0 -'>o© 100 - o O
5 0 -I
1400-
— 1200 -
| 1000-
| 800-
I 600-c^ 400-
Q 2 0 0 -
o O * ^
O Measured
Model
- O
~n—i--- r—r—i---1---1---1---110 15 20 25 30 35 40 45 50
Oxygen pressure (mTorr)
'Hi
0 5 10 15 20 25 30 35 40 45 50 Oxygen pressure (mTorr)
___ °0 .8 -
0 .6 -
0 .2 -
0 5 10 15 20 25 30 35 40 45 50Oxygen pressure (mTorr)
Figure 6.3: The variation of calculated JA parameters of cobalt ferrite thin films with reactive oxygen pressure.
127
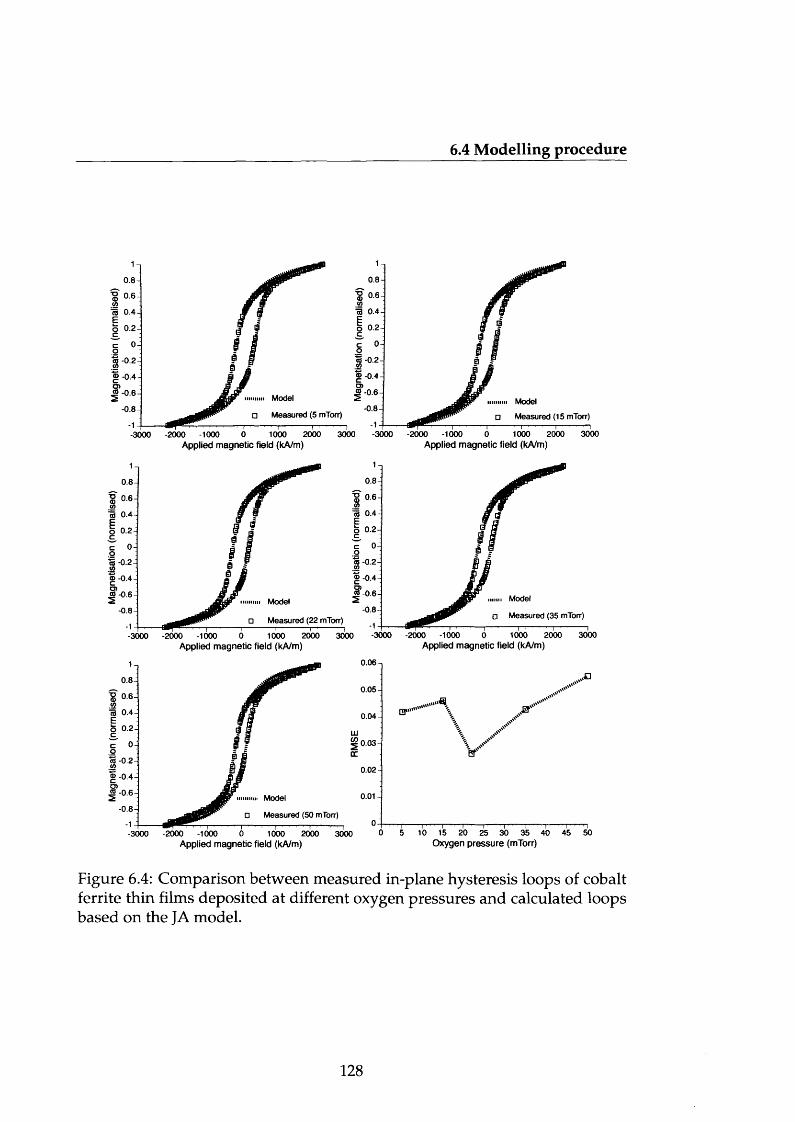
6.4 Modelling procedure
0.8
? 0.6
0 .8 -
f 0 .6 -
75 0 .4 EO 0 .2
a 0 .4 EO 0.2
0 -0 -
-0 .2 -- 0 .2 -
© - 0 .4 -© -0 .4
« -0.6© - 0.6■■■■■■■ Model
□ Measured (15 mTorr)-0.8-0.8
n M easured (5 mTorr)
-3 0 0 0 -2 0 0 0 -1 0 0 0 0 1 0 0 0 2 0 0 0 3 0 0 0
Applied magnetic field (kA/m)-3 0 0 0 -2 0 0 0 -1 0 0 0 0 1 0 0 0 2 0 0 0 3 0 0 0
Applied magnetic field (kA/m)
0.80.8
IT 0-6 12 0 6
CO 0 .4 - EO 0 .2 - cc 0 - o
’« -0 .2 -
M 0 .4 EO 0.2
© -0.4
© - 0.6 Model Model- 0 .8 --0.8 a M easured (35 mTorr)□ M easured (22 mTorr)
-3 0 0 0 -2 0 0 0 -1 0 0 0 0 1 0 0 0 2 0 0 0 3 0 0 0Applied magnetic field (kA/m)
-3 0 0 0 -2 0 0 0 -1 0 0 0 0 1 0 0 0 2 0 0 0 3 0 0 0Applied magnetic field (kA/m)
0 .0 6
0 .8 -
0.05"8 0 .6 -
nj 0 .4 - EO 0 .2 - c^ 0 - o'c3 -0.2-
0 .0 4 -
0 .0 3 -
0.02© - 0 .4 -
© - 0.6 0 .01 -
- 0 .8 -□ Measured (50 mTorr)
-3 0 0 0 -2 0 0 0 -1 0 0 0 0 1 0 0 0 2 0 0 0 3 0 0 0Applied magnetic field (kA/m) Oxygen pressure (mTorr)
Figure 6.4: Comparison between measured in-plane hysteresis loops of cobalt ferrite thin films deposited at different oxygen pressures and calculated loops based on the JA model.
128
6.5 Summary
imately between 20 mTorr and 40 mTorr. Hence these irregular trends in the
microscopic parameters versus oxygen pressures can be attributed to the pres
ence of mixed phases in the films particularly at the higher and lower substrate
temperatures.
The comparison of modelled hysteresis loops against the measurements
made on cobalt ferrite thin films deposited at different oxygen pressures is
shown in Fig. 6.4. It is evident that the thin film JA model is in excellent agree
ment with measurements.
The RMSE is low for the sample deposited at 22 mTorr which is single
phase indicating that the deviation between the measurement and model is
low. For samples deposited at lower and higher oxygen pressures, the devia
tion is higher. This maybe due to the inherent assumption of the JA model that
the samples are single phase.
6.5 Summary
• The modelling aspects of thin films based on JA theory of hysteresis were
discussed.
• The anhysteretic magnetisation function for planar anisotropy materials
was used to model thin films using JA theory.
• The proposed model was applied to cobalt ferrite thin films investigated
in Chapter 3.
• The JA parameters were extracted from measured data using the DIRECT
optimisation algorithm.
129
6.5 Summary
• The variations of JA parameters with substrate temperature and oxygen
pressure were studied. The modelled and measured hysteresis loops
were found to be in excellent agreement.
• This model can be further improved by
- considering thermal expansion coefficients and lattice constants of
film and substrate in the model which would help incorporate strain
due to thermal expansion and lattice mismatches.
- modelling mixed phase compositions in thin films
- modelling minor loops accurately using JA theory of hysteresis.
130
Chapter 7
Conclusions and future work
7.1 Conclusions
Magnetoelastic and magnetocaloric thin films were grown using the pulsed-
laser deposition technique. The structural, microstructural and magnetic prop
erties of these thin films were characterised using established procedures. Novel
thin film growth techniques and characterisation procedures were developed,
where necessary.
Many valuable additions have been made (including an application to thin
films) to the Jiles-Atherton model, a well-established model of hysteresis. The
thin film model of Jiles-Atherton theory was validated against measurements
made on magnetoelastic thin films grown as part of this research work.
The thoroughly investigated findings and thereby derived conclusions from
this extensive research work and recommendations for the future work are
listed below:
131
7.2 Magnetoelastic thin films
7.2 Magnetoelastic thin films
• Magnetoelastic thin films based on cobalt ferrite were produced on S i02 / Si(100)
substrates using pulsed-laser deposition technique at various deposition
conditions.
• The influence of deposition parameters: substrate temperature and oxy
gen pressure, on the magnetic properties and crystal structure of cobalt
ferrite thin films was studied.
• The growth process of cobalt ferrite thin films was optimised for low
substrate temperature.
• It was found that there is only a narrow window of reactive oxygen pres
sure for the growth of single phase spinel crystalline cobalt ferrite thin
films at low substrate temperatures.
• Cobalt ferrite films grown at low substrate temperature and optimised
oxygen pressure on thermal expansion matched substrates can be ap
plied in multilayer sensors on micro electro mechanical systems (MEMS)
devices.
• In-plane uniaxial anisotropy was induced by means of magnetic anneal
ing in the optimised cobalt ferrite thin film.
• A 3-point bender was designed to measure magnetostriction in thin films
in the vibrating sample magnetometer based on the inverse measure
ment technique.
132
7.2 Magnetoelastic thin films
• Using this 3-point bender, saturation magnetostriction was measured on
the magnetically annealed poly crystalline cobalt ferrite thin film. The
measured value of magnetostriction in thin films was found to reach the
upper end of the range of bulk values of cobalt ferrite reported in the
literature. This indicates that cobalt ferrite thin films can be used as mag-
netostrictive sensors and actuators.
7.2.1 Future work
Although research has been carried out on cobalt ferrite materials by several
research groups around the world, the applications developed based on this
material are few. Hence future work may focus on developing applications by
exploiting magnetic, magnetoelastic and related properties of this material.
• The growth of cobalt ferrite thin films can be optimised further based on
other deposition parameters such as deposition rate, laser fluence and
laser repetition rate in order to achieve higher saturation magnetisation
and softer magnetic properties (low coercivity).
• Cobalt ferrite thin films can be grown on thermal expansion matched
substrates allowing wider range of substrate temperatures to be used for
optimisation.
• Cation substituted cobalt ferrite thin films can be grown on thermal ex
pansion matched substrates.
• The process of magnetic annealing of cobalt ferrite thin films can be op
timised.
133
7.2 Magnetoelastic thin films
• The optimised cobalt ferrite thin films may be grown on piezoelectric
substrates such as (Ba, Sr)Ti03 or some other piezoelectric oxides. These
thin film structures have potential in magnetoelectric sensor and high fre
quency device applications due to their strong magnetoelectric coupling.
• As the findings of this research work demonstrate, single phase crys
talline spinel cobalt ferrite thin films can be produced at low substrate
temperatures, these thin films can be grown on flexible substrates. This
structure, cobalt ferrite thin film on flexible substrates, can be applied as
non-contact strain sensor.
7.2.2 Magnetocaloric thin films
• The first successful thin film of Gd5Si2.0sGe1.92 was grown on polycrys
talline AIN substrate using pulsed-laser deposition technique.
• The crystallographic structure, composition, grain size and magnetic prop
erties were studied.
• It was found that the film was predominantly monoclinic. There was no
evidence of a substantial amount of secondary phases found in the film.
• The magnetic phase transformation near room temperature was deter
mined in the magnetisation versus temperature study.
• This property indicates the potential for this thin film to be used in micro
cooling applications.
134
7.3 Modelling
7.2.3 Future work
Since this is the first known reported successful growth of Gd5Si2Ge2 thin film,
there is a wide scope for research. The growth process of G d5Si2Ge2 thin films
may be optimised with the goal to produce first order m agnetic/structural
phase transition temperature in the region of interest. Future research on G d5Si2Ge2
thin films with a focus on developing a prototype may help conserve energy
in refrigeration applications. Although it is too early to give the approximate
efficiency of these thin films in refrigeration applications, it was found that
bulk Gd5Si2Ge2 have 60% Carnot efficiency, which is twice than liquid-vapour
cycle refrigeration. As Gd5Si2Ge2 also has a giant magnetostrain, films of this
material, especially highly oriented films, could be used for actuator or sensor
applications.
7.3 Modelling
• The Jiles-Atherton theory was extended to incorporate tem perature de
pendence of hysteresis.
• The proposed thermal dependence was validated against measurements
made of a substituted cobalt ferrite material and the results were found
to be in excellent agreement.
• A generalised functional form of anhysteretic magnetisation which is the
basis of Jiles-Atherton theory was derived.
• It was shown that, with necessary limiting conditions, the generalised
135
7.3 Modelling
form could be reduced to known model equations for specific cases such
as uni-axially anisotropic, planar anisotropic and isotropic.
• A procedure to model and predict the magnetic hysteresis behaviour
of two-phase magnetic materials using Jiles-Atherton theory was devel
oped.
• The calculated magnetic two-phase hysteresis behaviours were qualita
tively in excellent agreement with those measured on hard-soft bi-layer
thin film structures and micro-wires.
• The Jiles-Atherton theory of hysteresis was extended for thin films.
• The thin film model based on Jiles-Atherton theory was validated against
measurements made on cobalt ferrite thin films and was found to be in
excellent agreement.
7.3.1 Future work
The Jiles-Atherton theory is being developed continuously since it was first
proposed in 1986. There is nonetheless considerable scope for future research
on this model. A few recommendations arise out of this research work are as
follows:
• thermal expansion coefficients and lattice constants of film and substrate
may be incorporated into the model in order to analyse the effects of
strain due to thermal expansion and lattice mismatches on magnetic prop
erties of materials,
136

___________________________________________________ 7.3 Modelling
• modelling of mixed phase compositions in thin films
• accurate modelling of minor loops.
137
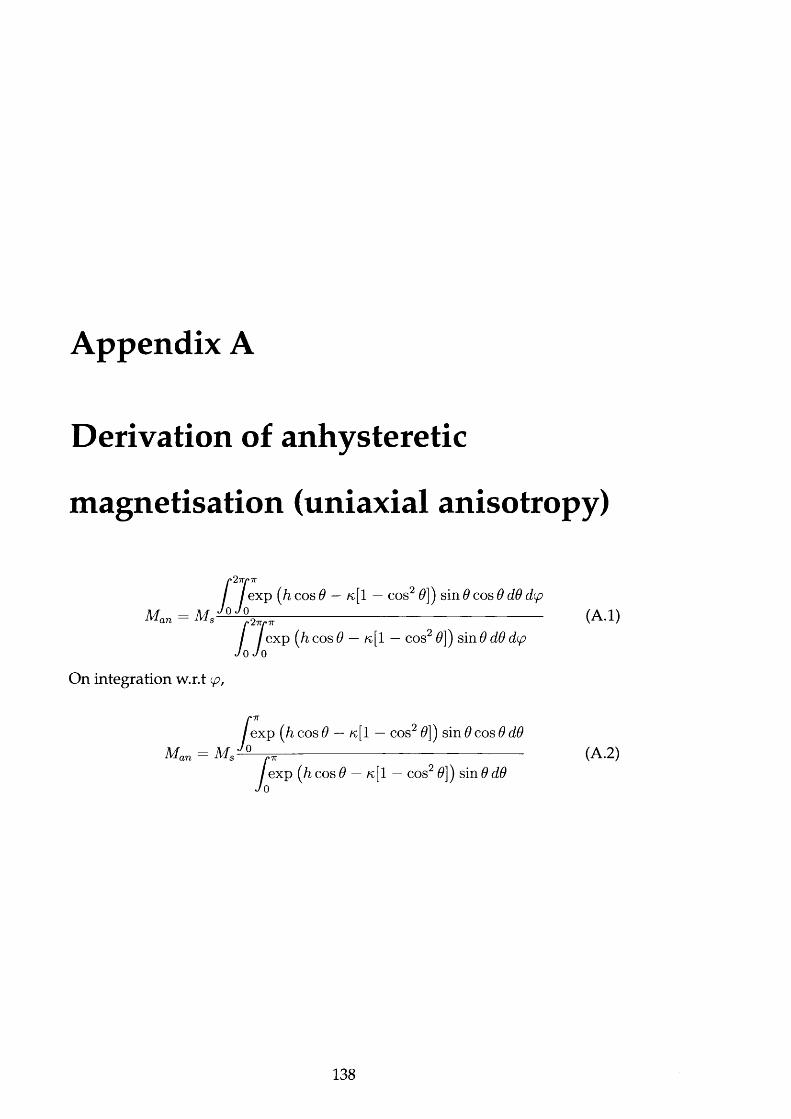
Appendix A
Derivation of anhysteretic
magnetisation (uniaxial anisotropy)
/*27r/*7T
/ / exp (/i cos 9 — k[1 — cos2 9]) sin 9 cos 9 d9 dipMan = Ms^ p ~ --------------------------------------------------- (A.l)
/ / exp (/i cos 0 — ac[1 — cos2 9\) sin 0 d9 dp Jo Jo
On integration w.r.t p,
n 7T
/exp (hcos9 — «[1 — cos2 9]) sin9 cos9d9 M a n = (A.2)
/ exp (h cos 9 — k[1 — cos2 9\) sin 9 d9 Jo
138
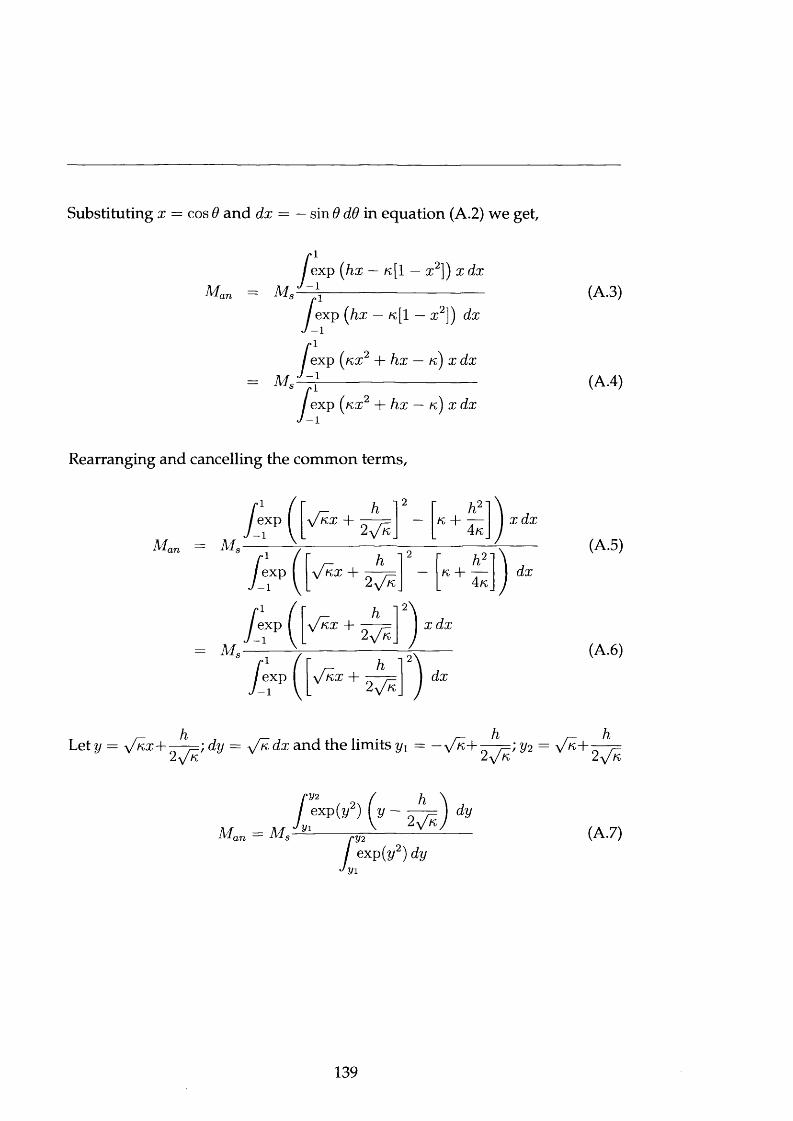
Substituting x = cos 0 and dx = — sin 0 d0 in equation (A.2) we get,
M nr) = M <
= M.
j exp (hx — /c[l — x 2}) x dx
J exp (hx — ac[1 — x 2]) dx
(nx2 + hx — ac) x dxs
/ exp ( / c x 2 + hx — a c ) x dx
(A3)
(A.4)
Rearranging and cancelling the common terms,
M n r , - M sf - T
y/Rx +h
2 ^ .AC +
4 / cxdx
M s
P |
yfkx +
yfRx +
h2 - ^ /ac
h
AC +4 ac
dx
2 > / ac_x dx
l \exp yfRx +
h2 \ / ac_
dx
(A.5)
(A.6)
Let y = y/Rx+ -^= ; dy = y/Rdx and the limits yx = — y ^+ T r-p ; 2/2 = ^ + 77-7=2 - y AC ^ v ^
Man = MsJ%^)(y-A^dy
Jry 2exp(?/2) dy
yi
(A .7)
139
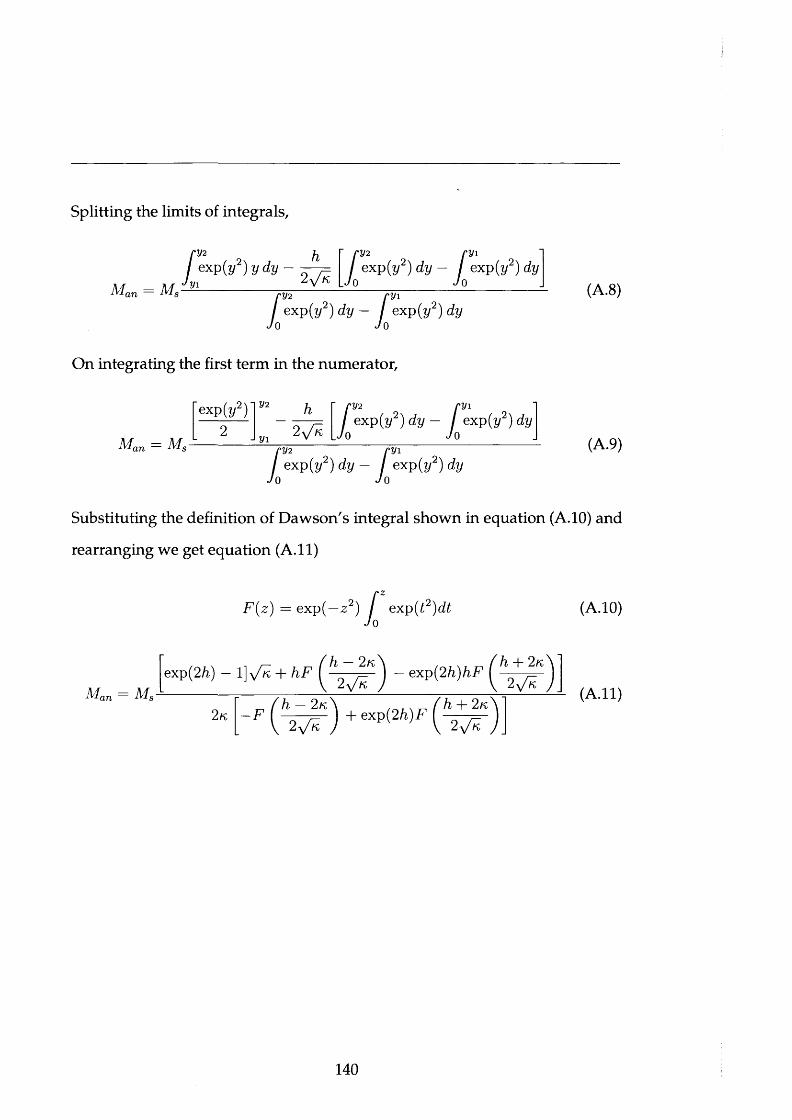
Splitting the limits of integrals,
Mnn = M,
r y 2/ exp(?/2)
J y iydy —
h2^ /k
ry2 ry i/ exp(?/2) d y - exp(y2) dy
J o J or y 2 m/ exp(y2) d y - exp(?/2) dy
jo Jo
(A.8)
On integrating the first term in the numerator,
M an M s
exp (y2) y2 h rs/2 ry i/ exp(y2) d y - exp(y2) dy
Jo Jor y 2 r y i/ exp(y2) d y - exp (y2) dy
Jo Jo
(A.9)
Substituting the definition of Dawson's integral shown in equation (A. 10) and
rearranging we get equation (A .ll)
F(z) — exp(—z2) f exp(t2)dt Jo
(A.10)
exp(2 h) — 1 ] \ / k + hFh — 2 k
2 yJ~Ke M 2h)hF ( * ± 2 ? )
2 K_ . h — 2k \ N _ / d + 2 kF [ . _ 1 + exp(2h)F
2 -\J~K 2 y/~K
(A .ll)
140
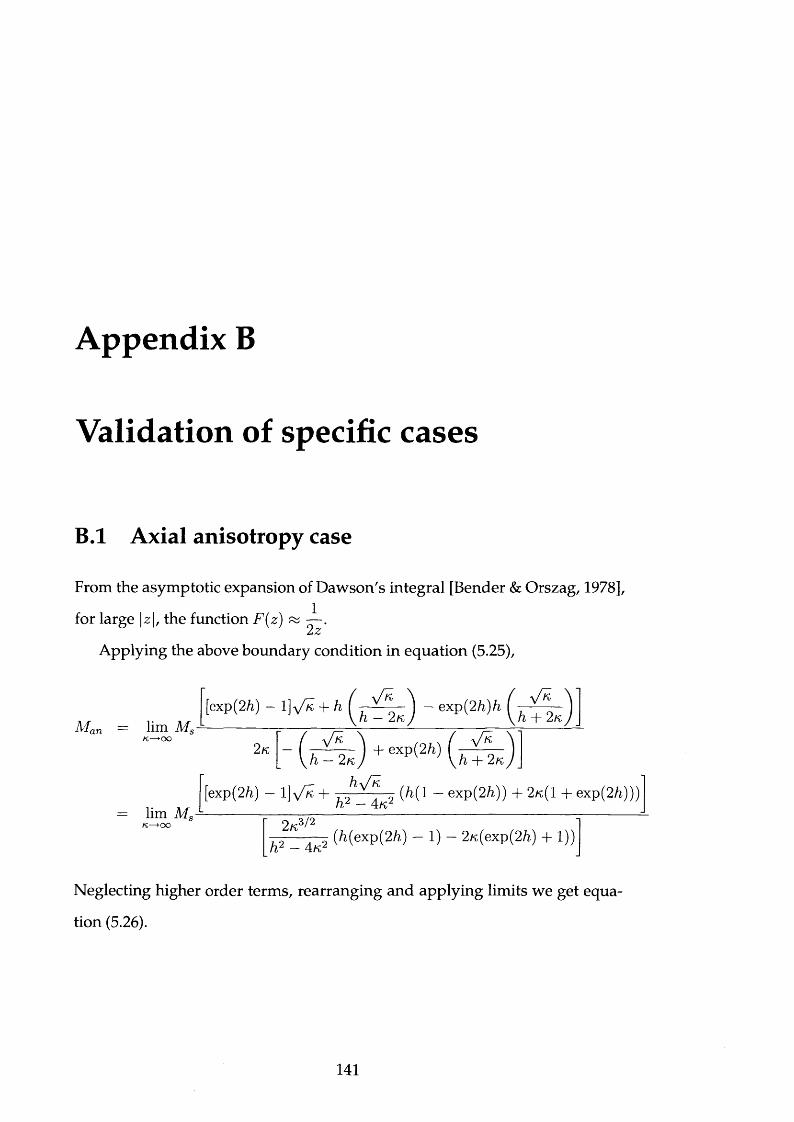
Appendix B
Validation of specific cases
B.l Axial anisotropy case
From the asymptotic expansion of Dawson's integral [Bender & Orszag, 1978],
for large \z\, the function F(z) ~ — .2z
Applying the above boundary condition in equation (5.25),
Mn lim MsK — KXD
lim Ms
[exp(2/i) — \]y/H + h ( - v K -■ ) — exp(2h)h 1 x Kh — 2 k h -j- 2 k
2 k h — 2 k + exp(2h) h H- 2 k
[exp (2/i) 1] V k + 7 0 ^ 0 (M 1 exp(2/i)) + 2 k {1 + exp(2/i))) — 4 k z
r 2k3/2 i0 A cy y by LJ 1 j | Lj jh z —
Neglecting higher order terms, rearranging and applying limits we get equa
tion (5.26).
141
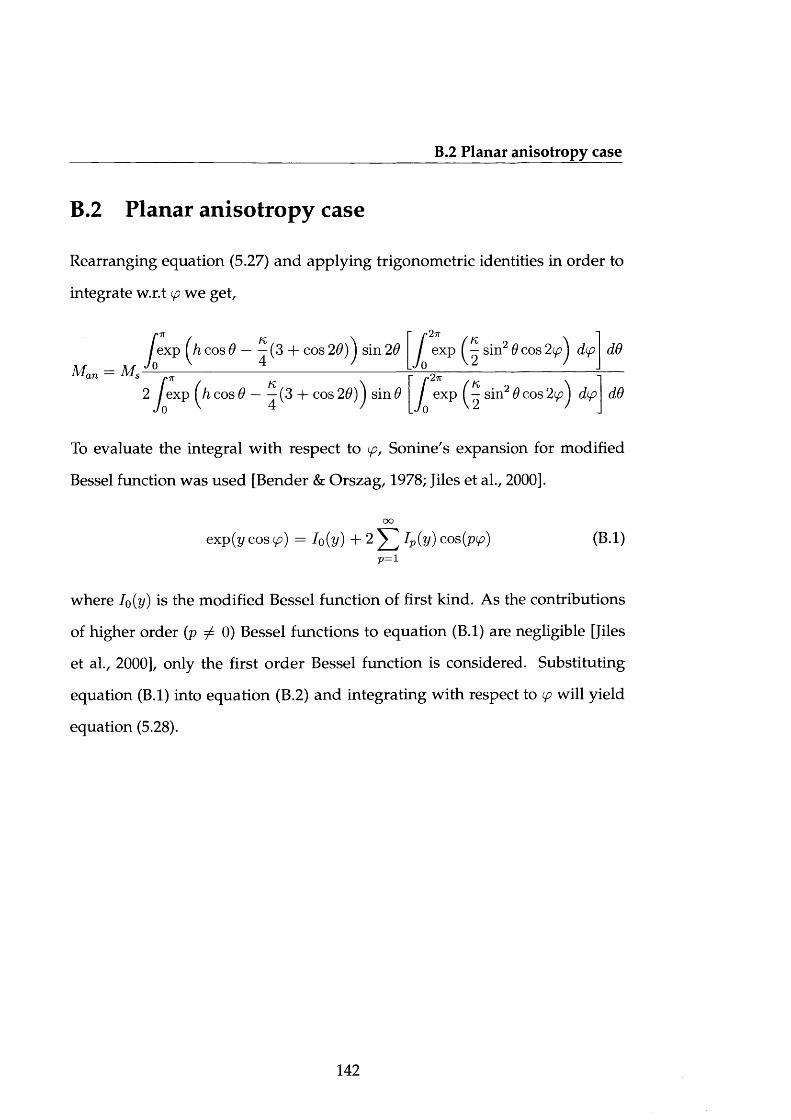
B.2 Planar anisotropy case
6.2 Planar anisotropy case
Rearranging equation (5.27) and applying trigonometric identities in order to
integrate w.r.t p we get,
J exp (h cos 0 — j (3 + cos 20)^ sin 20p 2 tc
/ exp |̂ sin2 0 cos dp dO/»7T
2 J exp (ji cos 6 — — (3 + cos 20)^ sin 0/•27T
j expsin2 6 cos 2p^ dp dO
To evaluate the integral w ith respect to p, Sonine's expansion for modified
Bessel function was used [Bender & Orszag, 1978; Jiles et al., 2000].
oo
exp(y cos p) = I0(y) + 2 ^ Ip(y) cos(pp) (B.l)p = i
where Io(y) is the modified Bessel function of first kind. As the contributions
of higher order (p ^ 0) Bessel functions to equation (B.l) are negligible [Jiles
et al., 2000], only the first order Bessel function is considered. Substituting
equation (B.l) into equation (B.2) and integrating with respect to p will yield
equation (5.28).
142
Appendix C
List of Publications
C.l Peer reviewed journals
1. Influence of reactive atmosphere on properties of cobalt ferrite thin films prepared
using pulsed-laser deposition, Journal of Applied Physics (under review).
2. Modeling of two-phase magnetic materials based on Jiles-Atherton theory of
hysteresis, Journal of M agnetism and Magnetic Materials (2010) (under
review)
3. Growth of crystalline cobalt ferrite thin films at lower temperatures using pulsed-
laser deposition technique, Journal of Applied Physics 107, 09A516 (2010).
4. Theoretical model of temperature dependence of hysteresis based on mean field
theory, IEEE Transactions on Magnetics 46 (6), 5467478 (2010).
5. Generalized form of anhysteretic magnetization in Jiles-Atherton theory of hys
teresis, Applied Physics Letters 95 (17), 172510 (2009).
143
C.2 Conference presentations
6. Modeling the temperature dependence of hysteresis based on Jiles-Atherton the
ory of hysteresis, IEEE Transactions on Magnetics 45 (10), 5257370 (2009).
7. Comparison of alternative techniques in characterizing magnetostriction and
inverse magnetostriction in magnetic thin films, IEEE Transactions on Mag
netics 45 (9), 5208521 (2009).
C.2 Conference presentations
1. 55th Magnetism and Magnetic Materials Conference, Atlanta, Georgia,
14-18 Nov. 2010 (accepted for presentation).
2. The Joint European Magnetic Symposia, Krakow, Poland, 23-28 Aug.
2010.
3. APS March Meeting, Portland, Oregon, 15-19 March 2010.
4. I I th Joint MMMIntermag Conference, Washington, DC, 18-22 Jan. 2010.
5. 19th Soft Magnetic Materials Conference, Torino, Italy, 6-9 Sep. 2009.
6. The IEEE International Magnetics Conference, Sacramento, CA, 4-8 May
2009.
7. 53rd Magnetism and Magnetic Materials Conference, Austin, Texas, 10-14
Nov. 2008.
8. 1& 2DM Conference, Cardiff, 1-3 Sep. 2008.
9. Speaking of Science-2008 Conference, Cardiff, April 2008.
144
Bibliography
Alexandrakis, V., Niarchos, D., Tsiaoussis, I., & Panagiotopoulos, I. (2008).
Magnetization reversal in CoPt-based hard-soft homocomposites. Journal
of Magnetism and Magnetic Materials, 320,1020-1025.
Alexandrakis, V., Niarchos, D., Wolff, M., & Panagiotopoulos, I. (2009). Magne
tization reversal in C o P t(lll) h a rd /so ft bilayers. Journal of Applied Physics,
105,063908.
Andrei, P., Stancu, A., Hauser, H., & Fulmek, P. (2007). Temperature, stress,
and rate dependent num erical implementation of magnetization processes
in phenomenological models. Journal of Optoelectronics and Advanced Ma
terials, 9,1137-1139.
Arrott, A. & Noakes, J. E. (1967). Approximate equation of state for nickel near
its critical temperature. Physical Review Letters, 19, 786-789.
Auciello, O., Krauss, A. R., Santiago-Aviles, J., Schreiner, A. F., & Gruen, D. M.
(1988). Surface compositional and topographical changes resulting from ex-
cimer laser impacting on YBa2Cu30 7 single phase superconductors. Applied
Physics Letters, 52, 239-241.
145
BIBLIOGRAPHY
Belov, K. P., Goryaga, A. N., & Lyamzin, A. N. (1989). Anomalous magnetic
properties of CoFe20 4 ferrite. Soviet Phys. Solid State, 31,191.
Bender, C. M. & Orszag, S. A. (1978). Advanced Mathematical Methods for
Scientists and Engineers. (McGraw-Hill (New York)).
Benford, S. M. (1979). The magnetocaloric effect in dysprosium. Journal of
Applied Physics, 50,1868-1870.
Bertotti, G. (1998). Hysteresis in Magnetism. (New York: Academic Press).
Bimbaum, M. (1965). Semiconductor surface damage produced by Ruby
lasers. Journal of Applied Physics, 36, 3688-3689.
Blank, D. H. A., Ijsselsteijn, R. P. J., Out, P. G., Kuiper, H. J. H., Flokstra, J., &
Rogalla, H. (1992). High Tc thin films prepared by laser ablation: material
distribution and droplet problem. M aterials Science and Engineering B, 13,
67-74.
Bozorth, R. M. (1951). Ferromagnetism. (Princeton, NJ: D. Van Nostrand Com
pany Inc.).
Bozorth, R. M., Tilden, E. F., & Williams, A. J. (1955). Anisotropy and magne
tostriction of some ferrites. Physical Review, 99,1788-1798.
Bragg, W. L. (1920). Crystal structure. Nature, 105, 646-648.
Chen, X. Y., Xiong, S. B., Sha, Z. S., & Liu, Z. G. (1997). The interaction of
ambient background gas w ith a plum e formed in pulsed laser deposition.
Applied Surface Science, 115, 279-284.
146
BIBLIOGRAPHY
Chikazumi, S. (1984). Physics of Magnetism. (New York: John Wiley and Sons).
Chikazumi, S. (1997). Physics of Ferromagnetism. (USA: Oxford University
Press), 2nd edn.
Choe, G. & Megdal, B. (1999). High precision magnetostriction measurement
employing the B-H looper bending method. IEEE Transactions on Magnet
ics, 35, 3959-3961.
Chrisey, D. B. & Hubler, G. K. eds. (1994). Pulsed laser deposition of thin films.
(New York: John Wiley and Sons).
Chwastek, K. (2008). Frequency behaviour of the modified jiles-atherton
model. Physica B: Condensed Matter, 403, 2484-2487.
Chwastek, K. (2009). M odelling of dynamic hysteresis loops using the Jiles-
Atherton approach. M athematical and Com puter Modelling of Dynamical
Systems, 15,95-105.
Chwastek, K. & Szczyglowski, J. (2007). An alternative method to estimate the
parameters of Jiles-Atherton model. Journal of Magnetism and Magnetic
Materials, 314,47-51.
Cullity, B. D. & Graham, C. D. (2009). Introduction to Magnetic Materials.
(New Jersey: John Wiley and Sons), 2nd edn.
Dan'kov, S. Y., Tishin, A. M., Pecharsky, V. K., & Gschneidner Jr., K. A. (1998).
Magnetic phase transitions and the magnetothermal properties of gadolin
ium. Physical Review B - Condensed Matter and Materials Physics, 57,3478-
3490.
147
BIBLIOGRAPHY
Debye, P. (1926). Einige bem erkungen zur magnetisierung bei tiefer temper-
atur. Annalen der Physik, 386,1154-1160.
Dorsey, P. C., Lubitz, P., Chrisey, D. B., & Horwitz, J. S. (1996). CoFe20 4 thin
films grown on (100) MgO substrates using pulsed laser deposition. Journal
of Applied Physics, 79, 6338-6340.
du Tremolet de Lacheisserie, E. (1993). Magnetostriction: Theory and Applica
tions of Magnetoelasticity. (Boca Raton: CRC Press).
Dyer, P. E., Issa, A., & Key, P. H. (1990). An investigation of laser ablation
and deposition of Y-Ba-Cu-O in an oxygen environment. Applied Surface
Science, 46, 89-95.
Dyer, P. E., Key, P. H., & Monk, P. (1992). Ablation studies of Y-Ba-Cu-oxide in
oxygen using a pulsed C 0 2 laser. Applied Surface Science, 54,160-165.
Ewing, J. A. (1900). Magnetic induction in iron and other metals. The electri
cian series. (London: The electrician printing and publishing company), 3rd
edn.
Ewing, J. A. (1930). Ferromagnetism and hysteresis. Proceedings of the Physi
cal Society, 42, 355-357.
Foltyn, S. R., Dye, R. C., Ott, K. C., Peterson, E., Hubbard, K. M., Hutchinson,
W., M uenchausen, R. E., Estler, R. C., & Wu, X. D. (1991). Target modification
in the excimer laser deposition of YBa2Cu30 7 _a; thin films. Applied Physics
Letters, 59,594-596.
148
BIBLIOGRAPHY
Foner, S. (1959). Versatile and sensitive vibrating-sample magnetometer. Re
view of Scientific Instrum ents, 30, 548-557.
Foote, M. C., Jones, B. B., H unt, B. D., Bamer, J. B., Vasquez, R. P., & Bajuk, L. J.
(1992). Composition variations in pulsed-laser-deposited Y-Ba-Cu-O thin
films as a function of deposition parameters. Physica C: Superconductivity
and its applications, 201,176-182.
Geohegan, D. B. (1992). Fast intensified-ccd photography of YBa2Cu307_x laser
ablation in vacuum and am bient oxygen. Applied Physics Letters, 60, 2732-
2734.
Giauque, W. F. (1927). A therm odynam ic treatm ent of certain magnetic effects,
a proposed method of producing tem peratures considerably below 1 abso
lute. Journal of the American Chemical Society, 49,1864-1870.
Gorbunov, A. A. & Konov, V. I. (1991). Carbon films deposited from UV laser
plasma. Surface and Coatings Technology, 47, 503-508.
Gumen, N. M. (1966). Variations of magnetostriction in heat-treated cobalt-
ferrite. Soviet Phys. J. E. T. P., 22, 251.
Hadimani, R. L. (2010). Advanced magnetoelastic and magnetocaloric materi
als for device applications. Ph.D. thesis, Cardiff University.
Hauschild, J., Fritzsche, H., Bonn, S., & Liu, Y. (2002). Determination of the
tem perature dependence of the coercivity in Fe/C r (110) multilayers. Ap
plied Physics A: Materials Science and Processing, 74, S1541-S1543.
149
BIBLIOGRAPHY
Hiratsuka, N., Nozawa, M., & Kakizaki, K. (1997). Magnetic properties of
cobalt ferrite films w ith perpendicular magnetic anisotropy. Journal of Mag
netism and Magnetic Materials, 176, 31-35.
Hu, G., Harris, V. G., & Suzuki, Y. (2001). Microstructure and magnetic prop
erties of cobalt ferrite thin films. IEEE Transactions on Magnetics, 37, 2347-
2349.
Hubert, A. & Schafer, R. (1998). Magnetic domains. (New York: Springer).
Jiles, D. C. (1991). Introduction to M agnetism and Magnetic Materials. (Lon
don: Chapman and Hall).
Jiles, D. C. (1993). Frequency dependence of hysteresis curves in 'non
conducting' magnetic materials. IEEE Transactions on Magnetics, 29, 3490-
3492.
Jiles, D. C. (1994a). Frequency dependence of hysteresis curves in conducting
magnetic materials. Journal of Applied Physics, 76, 5849-5855.
Jiles, D. C. (1994b). M odelling the effects of eddy current losses on frequency
dependent hysteresis in electrically conducting media. IEEE Transactions on
Magnetics, 30, 4326-4328.
Jiles, D. C. & Atherton, D. L. (1984). Theory of the magnetisation process in
ferromagnets and its application to the magnetomechanical effect. Journal
of Physics D: Applied Physics, 17,1265-1281.
Jiles, D. C. & Atherton, D. L. (1986). Theory of ferromagnetic hysteresis. Jour
nal of Magnetism and Magnetic Materials, 61,48-60.
150
BIBLIOGRAPHY
Jiles, D. C., Lee, S. J., Kenkel, J., & Metlov, K. L. (2000). Superparamagnetic
magnetization equation in two dimensions. Applied Physics Letters, 77,
1029-1031.
Jiles, D. C., Ramesh, A., Shi, Y., & Fang, X. (1997). Application of the anisotropic
extension of the theory of hysteresis to the magnetization curves of crys
talline and textured m agnetic materials. IEEE Transactions on Magnetics,
33, 3961-3963.
Jiles, D. C. & Thoelke, J. B. (1989). Theory of ferromagnetic hysteresis: De
termination of model param eters from experimental hysteresis loops. IEEE
Transactions on Magnetics, 25, 3928-3930.
Jiles, D. C., Thoelke, J. B., & Devine, M. K. (1992). Numerical determination
of hysteresis param eters for the m odeling of magnetic properties using the
theory of ferromagnetic hysteresis. IEEE Transactions on Magnetics, 28, 27-
35.
Joule, J. P. (1842). On a new class of magnetic forces. Sturgeon's Annals of
Electricity, 8, 219.
Kato, Y. & Takei, T. (1933). Perm anent oxide magnet and its characteristics.
The Journal of the Institute of Electrical Engineers of Japan, 53,408-412.
Kautek, W., Roas, B., & Schultz, L. (1990). Formation of YBaCu oxide thin films
by pulsed laser deposition: A comparative study in the UV, visible and IR
range. Thin Solid Films, 191, 317-334.
151
BIBLIOGRAPHY
Koch, R. (1994). The intrinsic stress of polycrystalline and epitaxial thin metal
films. Journal of Physics: Condensed Matter, 6, 9519-9550.
Koren, G., Gupta, A., Baseman, R. J., Lutwyche, M. I., & Laibowitz, R. B.
(1989). Laser w avelength dependent properties of YBa2Cu307_«5 thin films
deposited by laser ablation. Applied Physics Letters, 55, 2450-2452.
Krajnovich, D. J. & Vazquez, J. E. (1993). Formation of intrinsic surface defects
during 248 nm photoablation of polyimide. Journal of Applied Physics, 73,
3001-3008.
Kundt, A. (1886). Ueber doppelbrechung des lichtes in metallschichten, welche
durch zerstuben einer kathode hergestellt sind. Annalen der Physik, 263,
59-71.
Landau, L. D. & Lifshitz, E. M. (1935). On the theory of the dispersion of
magnetic permeability in ferromagnetic bodies. Physik. Z. Sowjetunion, 8,
153-169.
Lee, J., Fuger, M., Fidler, J., Suess, D., Schrefl, T., & Shimizu, O. (2010). Mod
eling of the write and read back performances of hexagonal Ba-ferrite par
ticulate media for high density tape recording. Journal of Magnetism and
Magnetic Materials, 322, 3869-3875.
Liorzou, F., Phelps, B., & Atherton, D. L. (2000). Macroscopic models of mag
netization. IEEE Transactions on Magnetics, 36,418-428.
Lo, C. C. H., Ring, A. P., Snyder, J. E., & Jiles, D. C. (2005). Improvement of
152
BIBLIOGRAPHY
magnetomechancial properties of cobalt ferrite by magnetic annealing. IEEE
Transactions on Magnetics, 41,3676-3678.
Margulies, D. T., Parker, F. T., Spada, F. E., Goldman, R. S., Li, J., Sinclair, R.,
& Berkowitz, A. E. (1996). Anom alous moment and anisotropy behavior in
Fe30 4 films. Physical Review B - Condensed Matter and Materials Physics,
53,9175-9187.
Matsunawa, A., Katayama, S., Susuki, A., & Ariyasu, T. (1986). Laser produc
tion of metallic ultra-fine particles. Transactions of JWRI (Japanese Welding
Research Institute), 15, 233-244.
Metev, S. & Meteva, K. (1989). Nucleation and growth of laser-plasma de
posited thin films. A pplied Surface Science, 43,402^408.
Miles, J. J. & Parker, M. R. (1996). Micromagnetic modelling of spin valve and
GMR read heads. IEEE Transactions on Magnetics, 32,4597-4602.
Miyagi, D., Miki, K., Nakano, M., & Takahashi, N. (2010). Influence of com
pressive stress on magnetic properties of laminated electrical steel sheets.
IEEE Transactions on Magnetics, 46, 318-321.
Moses, A. J. & Davies, D. (1980). Influence of compressive stress on magnetic
properties of commercial (110)[001] oriented silicon-iron. IEEE Transactions
on Magnetics, 16,454-460.
Mozharivskyj, Y., Pecharsky, A. O., Pecharsky, V. K., & Miller, G. J. (2005). On
the high-tem perature phase transition of Gd5Si2Ge2. Journal of the American
Chemical Society, 127, 317-324.
153
BIBLIOGRAPHY
Muthuselvam, I. P. & Bhowmik, R. N. (2009). Structural phase stability and
magnetism in Co2F e0 4 spinel oxide. Solid State Sciences, 11, 719-725.
Neifeld, R. A., Gunapala, S., Liang, C., Shaheen, S. A., Croft, M., Price, J., Si
mons, D., & Hill, W. T. (1988). Systematics of thin films formed by excimer
laser ablation: Results on SmBa2Cu30 7. Applied Physics Letters, 53, 703-
704.
Nishikawa, Y., Tanaka, K., & Yoshida, Y. (1991). M orphology of particles gen
erated from thin film by excimer laser ablation. N ippon Kinzoku Gakkaishi,
55, 581-587.
Nlebedim, I. C., Ranvah, N., Williams, P. I., Melikhov, Y., Anayi, F., Snyder,
J. E., Moses, A. J., & Jiles, D. C. (2009). Influence of vacuum sintering on
microstructure and magnetic properties of magnetostrictive cobalt ferrite.
Journal of Magnetism and Magnetic Materials, 321, 2528-2532.
Nlebedim, I. C., Snyder, J. E., Moses, A. J., & Jiles, D. C. (2010). Dependence of
the magnetic and m agnetoelastic properties of cobalt ferrite on processing
parameters, accepted for publication in Journal of Magnetism and Magnetic
Materials.
O'Handley, R. C. (2000). M odern magnetic materials: Principles and applica
tions. (New York: John Wiley and Sons).
Okamoto, H. (1995). Com m ent on Gd-Si (gadolinium-silicon). Journal of Phase
Equilibria, 16,198-199.
Pecharsky, A. O., Gschneidner Jr., K. A., & Pecharsky, V. K. (2003). The giant
154
BIBLIOGRAPHY
magnetocaloric effect of optimally prepared Gd5Si2Ge2. Journal of Applied
Physics, 93, 4722-4728.
Pecharsky, A. O., Gschneidner Jr., K. A., Pecharsky, V. K., & Schindler, C. E.
(2002). The room tem perature m etastable/stable phase relationships in the
pseudo-binary G d5Si4-Gd5Ge4 system. Journal of Alloys and Compounds,
338,126-135.
Pecharsky, V. K. & Gschneidner Jr., K. A. (1997a). Giant magnetocaloric effect
in Gd5(Si2Ge2). Physical Review Letters, 78,4494^497.
Pecharsky, V. K. & Gschneidner Jr., K. A. (1997b). Phase relationships and crys
tallography in the pseudobinary system G d5Si4-Gd5Ge4. Journal of Alloys
and Compounds, 260, 98-106.
Pecharsky, V. K. & Gschneidner Jr., K. A. (1997c). Tunable magnetic regenerator
alloys with a giant magnetocaloric effect for magnetic refrigeration from ~20
to ~290 k. Applied Physics Letters, 70, 3299-3301.
Pereira, A. M., Peixoto, J. R., Leitao, D., Sousa, C., Carpinteiro, F., Tavares, P. B.,
Martins, N., Sousa, J. B., & Araujo, J. P. (2008). Preparation of Gd5Si2Ge2 com
pounds using RF-induction. Journal of Non-Crystalline Solids, 354, 5292-
5294.
Perttunen, C. D., Jones, D. R., & Stuckman, B. E. (1993). Lipschitzian opti
mization without the lipschitz constant. Journal of Optimization Theory
and Application, 79,157-181.
Predel, B. (1991). Landolt-Bornstein, Group IV Physical Chemistry - Phase
155
BIBLIOGRAPHY
Equilibria, Crystallographic and Thermodynamic Data of Binary Alloys,
vol. 5. (Springer - Verlag).
Preisach, F. (1935). Uber die magnetische nachwirkung. Zeitschrift fur Physik,
94, 277-302.
Raghunathan, A., Snyder, J. E., & Jiles, D. C. (2009). Comparison of alternative
techniques for characterizing m agnetostriction and inverse magnetostriction
in magnetic thin films. IEEE Transactions on Magnetics, 45,3269-3273.
Ramesh, A., Jiles, D. C., & Bi, Y. (1997). Generalization of hysteresis modeling
to anisotropic materials. Journal of Applied Physics, 81,5585-5587.
Ramesh, A., Jiles, D. C., & Roderick, J. M. (1996). A model of anisotropic an-
hysteretic magnetization. IEEE Transactions on Magnetics, 32,4234-^236.
Ranvah, N., Melikhov, Y., Jiles, D. C., Snyder, J. E., Moses, A. J., Williams, P. I.,
& Song, S. H. (2008). Tem perature dependence of magnetic anisotropy of
Ga-substituted cobalt ferrite. Journal of Applied Physics, 103.
Ranvah, N., Melikhov, Y., Nlebedim, I. C., Jiles, D. C., Snyder, J. E., Moses, A. J.,
& Williams, P. I. (2009a). Temperature dependence of magnetic anisotropy of
germ anium /cobalt cosubstituted cobalt ferrite. Journal of Applied Physics,
105.
Ranvah, N., Nlebedim, I. C., Melikhov, Y., Snyder, J. E., Williams, P. I., Moses,
A. J., & Jiles, D. C. (2009b). Temperature dependence of magnetic properties
of CoAlxFe2-x0 4 . IEEE Transactions on Magnetics, 45,4261-4264.
156
BIBLIOGRAPHY
Rodriguez-Carvajal, J. (1993). Recent advances in magnetic structure deter
mination by neutron pow der diffraction. Physica B: Physics of Condensed
Matter, 192,55-69.
Sablik, M. J. & Jiles, D. C. (1993). Coupled magnetoelastic theory of magnetic
and magnetostrictive hysteresis. IEEE Transactions on Magnetics, 29, 2113-
2123.
Sambandam, S. N., Bethala, B., Sood, D. K., & Bhansali, S. (2005). Evaluation
of silicon nitride as a diffusion barrier for Gd-Si-Ge films on silicon. Surface
and Coatings Technology, 200, 1335-1340.
Sawatzky, G. A., Van Der Woude, F., & M orrish, A. H. (1968). Cation distribu
tions in octahedral and tetrahedral sites of the ferrimagnetic spinel CoFe2 0 4.
Journal of Applied Physics, 39,1204-1205.
Scheibe, H. J., Gorbunov, A. A., Baranova, G. K., Klassen, N. V., Konov, V. I.,
Kulakov, M. P., Pompe, W., Prokhorov, A. M., & Weiss, H. J. (1990). Thin film
deposition by excimer laser evaporation. Thin Solid Films, 189,283-291.
Shi, Y. M., Jiles, D. C., & Ramesh, A. (1998). Generalization of hysteresis m od
eling to anisotropic and textured materials. Journal of Magnetism and Mag
netic Materials, 187, 75-78.
Slonczewski, J. (2009). Theory of magnetic hysteresis in films and its applica
tion to computers. IEEE Transactions on Magnetics, 45, 8-14.
Slonczewski, J. C. (1958). Origin of magnetic anisotropy in cobalt-substituted
magnetite. Physical Review, 110,1341-1348.
157
BIBLIOGRAPHY
Slonczewski, J. C. (1991a). Dynamics of domains and walls in soft magnetic
films. IEEE Transactions on Magnetics, 27, 3532-3538.
Slonczewski, J. C. (1991b). Theory of dom ain dynamics in film heads. IEEE
Transactions on Magnetics, 27,4784-4786.
Smit, J. & Wijn, H. P. J. (1959). Ferrites. (Eindhoven: N. V. Philips).
Snoek, J. L. (1936). Magnetic and electrical properties of the binary systems
MO. Fe20 3. Physica, 3, 463-483.
Snoek, J. L. (1948). Dispersion and absorption in magnetic ferrites at frequen
cies above one M e/s. Physica, 14, 207-217.
Song, S.-H. (2007). Magnetic and magnetoelastic properties of M-substituted
cobalt ferrites (M=Mn, Cr, Ga, Ge). Ph.D. thesis, Material Science and Engi
neering, Iowa State University.
Stoner, E. C. & Wohlfarth, E. P. (1948). A mechanism of magnetic hysteresis
in heterogenous alloys. Philosphical transactions of the Royal Society of
London A, pp. 599-642.
Suzuki, Y. (2001). Epitaxial spinel ferrite thin films. Annual Review of Materi
als Science, 31, 265-289.
Suzuki, Y., Hu, G., Van Dover, R. B., & Cava, R. J. (1999). Magnetic anisotropy
of epitaxial cobalt ferrite thin films. Journal of Magnetism and Magnetic
Materials, 191,1-8.
158
BIBLIOGRAPHY
Tam, A. C. & Schroeder, H. (1989). New high-precision optical technique to
measure magnetostriction of a thin magnetic film deposited on a substrate.
IEEE Transactions on Magnetics, 25, 2629-2638.
Torrejon, J., Badini-Confalonieri, G., & Vazquez, M. (2008). Fabrication and
magnetic properties of hard /so ft magnetostatically coupled FePt-FeNi mul
tilayer microwires. Journal of Applied Physics, 103, 07E712.
Tsuya, N. (1958). Theory of m agnetostriction and g factor in ferrites. Journal
of Applied Physics, 29,449-451.
Veeco (2004). Digital Instruments Dimension 3100 User's Manual. Veeco In
struments Inc.
Warburg, E. (1881). Magnetische untersuchungen. Annalen der Physik, 249,
141-164.
Weil, L. (1952). Magnetostriction de quelques ferrites orientes thermiquement.
CR Acadie des sciences, 234,1351.
Wilson, P. R., Ross, J. N., & Brown, A. D. (2002). Simulation of magnetic com
ponent models in electric circuits including dynamic therm al effects. IEEE
Transactions on Power Electronics, 17, 55-65.
Wolf, W. P. (1957). Effect of crystalline electric fields on ferromagnetic
anisotropy. Physical Review, 108,1152-1157.
Yosida, K. & Tachiki, M. (1957). On the origin of the magnetic anisotropy en
ergy of ferrites. Progress of Theoretical Physics, 17, 331-359.
159
BIBLIOGRAPHY
Zheng, H., Wang, J., Lofland, S. E., Ma, Z., M ohaddes-Ardabili, L., Zhao, T.,
Salamanca-Riba, L., Shinde, S. R., Ogale, S. B., Bai, F., Viehland, D., Jia, Y.,
Schlom, D. G., Wuttig, M., Roytburd, A., & Ramesh, R. (2004). Multiferroic
BaTi0 3 -CoFe20 4 nanostructures. Science, 303, 661-663.
Zhou, J.-R, He, H.-C., & Nan, C.-W. (2007). Effects of substrate tem perature
and oxygen pressure on the magnetic properties and structures of CoFe20 4
thin films prepared by pulsed-laser deposition. Applied Surface Science,
253, 7456-7460.
Zhu, J . . & Bertram, H. N. (1988). Micromagnetic studies of thin metallic films.
Journal of Applied Physics, 63, 3248-3253.
Zhuang, Z., Rao, M., White, R. M., Laughlin, D. E., & Kryder, M. H. (2000). Bar
ium ferrite thin film media with perpendicular c-axis orientation and small
grain size. Journal of Applied Physics, 87, 6370-6372.
Zimm, C. B., Barclay, J. A., Harkness, H. H., Green, G. F., & Patton, W. G. (1989).
Magnetocaloric effect in thulium. Cryogenics, 29, 937-938.
Zimm, C. B., Ratzmann, P. M., Barclay, J. A., Green, G. F., & Chafe, J. N. (1990).
Magnetocaloric effect in neodymium. Advances in Cryogenic Engineering,
36, 763-768.
Zou, P., Yu, W., & Bain, J. A. (2002). Influence of stress and texture on soft
magnetic properties of thin films. IEEE Transactions on Magnetics, 38,3501-
3520.
160