Embed Size (px)
Citation preview
Issues in Employment and Poverty
Discussion Paper
21
Growth, Employment and Poverty in
Mozambique
By
Tilman Brück and Katleen van den Broeck
January 2006

ii
ISBN
ISBN 92-2-118253-3 (print)
ISBM 92-2-118254-1 (web pdf)
Copyright
iii
Table of Contents
List of Tables ................................................................................................................ v List of Figures ............................................................................................................. vii Preface.......................................................................................................................... ix Acknowledgements ...................................................................................................... xi 1. Introduction........................................................................................................... 1
1.1. Objective ....................................................................................................... 1 1.2. Approach....................................................................................................... 1 1.3. Data Sources ................................................................................................. 1
2. Growth, Employment and Poverty: A Macro-Level View................................... 4 2.1. Macro-Economic Growth ............................................................................. 4 2.2. Poverty and Social Development ................................................................ 13 2.3. Employment ................................................................................................ 20
2.3.1. The Individual Level............................................................................... 20 2.3.2. Intra-Household Issues............................................................................ 23
2.4. Poverty and Employment Correlations ....................................................... 25 2.5. An Initial Assessment ................................................................................. 29
3. Growth, Employment and Poverty: A Micro-Level View.................................. 30 3.1. Individual Choice of Employment Type..................................................... 31
3.1.1. Urban Analysis........................................................................................ 36 3.1.2. Rural Analysis......................................................................................... 38
3.2. Household Consumption Analysis.............................................................. 43 3.2.1. Urban Analysis........................................................................................ 49 3.2.2. Rural Analysis......................................................................................... 51
4. Summary and Conclusions ................................................................................. 52 4.1. Summary..................................................................................................... 52 4.2. Regional and Sectoral Divergences ............................................................ 55 4.3. Agricultural Development ........................................................................... 55 4.4. Gender and Education................................................................................. 56
Bibliography................................................................................................................ 59

iv
v
List of Tables
Table 1 Regional GDP Per Capita (in real US-Dollar).............................................. 7 Table 2 Poverty Headcount and Poverty Gap .......................................................... 14 Table 3 Changes in Inequality in Household Consumption in Mozambique .......... 15 Table 4 Percentage of activity types, of active age population (16 to 65)............... 20 Table 5 Importance of employment categories, total and by region (income
earning active age population) .................................................................... 21 Table 6 Importance of employment categories, by gender of household head
(income earning active age population) ...................................................... 21 Table 7 Importance of employment categories, by rural-urban (income earning
active age population) ................................................................................. 22 Table 8 Employment in non-agricultural sectors, total and by region (income
earning active age) ...................................................................................... 22 Table 9 Employment in non-agricultural sectors, by self-employed and wage
workers (income earning active age) .......................................................... 23 Table 10 Intra-household division of employments .................................................. 24 Table 11 Activities of spouse by main activities of the household head ................... 24 Table 12 Change in average consumption per poverty quartile (nominal) ................ 25 Table 13 Change in average consumption per employment category of the head
(nominal) ..................................................................................................... 26 Table 14 Relative consumption position by location and region............................... 26 Table 15 Relative consumption position by main activity category of household
head ............................................................................................................. 26 Table 16 Relative consumption position by main activity category of household
head, by region............................................................................................ 27 Table 17 Relative consumption position by main activity category of household
head, by location......................................................................................... 28 Table 18 Relative consumption position by main activity category of household
head ............................................................................................................. 28 Table 19 Averages of variables used in employment regressions ............................. 34 Table 20 Summary of Household Data ...................................................................... 35 Table 21 Determinants of occupational choice, urban sample .................................. 40 Table 22 Determinants of occupational choice, rural sample .................................... 41 Table 23 Averages of regression variables, by location ............................................ 45 Table 24 OLS regressions with individual level predicted occupations, dependent
variable: log(consumption per capita). Urban sample. ............................... 46 Table 25 OLS regressions with observed occupations, dependent variable:
log(consumption per capita). Urban sample. .............................................. 47 Table 26 OLS regressions with observed occupations, dependent variable:
log(consumption per capita). Rural sample. ............................................... 48 Table 27 OLS regressions with individual level predicted occupations, dependent
variable: log(consumption per capita). Rural sample. ................................ 50

vi
vii
List of Figures
Figure 1 Gross Domestic Product, International Comparison .................................... 5 Figure 2 Gross Domestic Product by Sector, 1990 - 2002 Mozambique annual
change in %................................................................................................... 6 Figure 3 Consumer Prices 1990 – 2003 annual % change Mozambique .................... 8 Figure 4 Exchange Rate Exchange Rate (Metical per US $) average period
Mozambique .................................................................................................. 9 Figure 5 Exports and Imports...................................................................................... 9 Figure 6 External Indebtedness, International Comparison Total external debt to
gross national income. (EDT/GNI) in % .................................................... 11 Figure 7 Exports and Debt Service Exports of goods and services per capita Total
debt service per capita................................................................................. 11 Figure 8 Foreign Aid Flows, International Comparison Aid per capita 1 ................. 12 Figure 9 Foreign Direct Investment, International Comparison Foreign direct
investment, net inflows (US-$ million) Mozambique, Tanzania, Zambia .13 Figure 10 Population Growth Rates, International Comparison................................. 16 Figure 11 Life Expectancy at Birth by Gender total (years) ....................................... 16 Figure 12 Life Expectancy at Birth (years) Mozambique by Region ......................... 17 Figure 13 Infant Mortality Rates, International Comparison (per 1000 live births) ... 17 Figure 14 HIV Prevalence % aged 15-49 2003........................................................... 18 Figure 15 Adult Literacy Rates by Gender, Mozambique (% of people aged 15 and
above).......................................................................................................... 18 Figure 16 Adult Literacy Rates, International Comparison (% of people aged 15 and
above).......................................................................................................... 19 Figure 17 Primary and Secondary School Enrolment Rates by Gender School
enrolment, primary (% net) School enrolment, secondary (% net) ............ 19

viii
ix
Preface
The present paper explores the dynamics of the relationship between economic growth, employment and poverty and estimates the effect of employment outcomes on household welfare and nationwide poverty reduction in post-war Mozambique (1992 onwards). The approach of the study combines recent macro-economic analysis with a detailed assessment of the only two nationally representative household surveys (1996-97 and 2002-03) undertaken in Mozambique hitherto. In chapter 2, post-war macro-economic and aggregate trends in employment and private consumption are assessed, paying particular attention to the rural-urban and the regional divides and issues of inequality. The authors document some impressive macro-economic progress and reductions in poverty since the end of the war. While GDP growth reached 10% in some years (like 1998 and 2001), the incidence of poverty declined from 69.4% in 1996-97 to 54.1% in 2002-03. The economy underwent significant structural change, with the share of agriculture in GDP declining from 38% in 1995 to 23% in 2002. The structure of employment also changed substantially, with the share of self-employed farmers declining from 75% to 68% over the same period, and that of non-agricultural employment increasing from 14% to 20%. Thus, on the whole, Mozambique’s experience during the 1990s appears to be one of ‘good growth’ – with high economic growth resulting in an impressive decline in poverty that was helped by a change in employment structure towards higher productivity sectors. Questions remain, however. For example, there was a sharp decline in the share of manufacturing in total non-agricultural employment. Second, there has been considerable regional variation in the performance regarding poverty reduction; in the South, poverty actually increased and the distribution of consumption worsened. In chapter 3, the study turns to the micro-economic issues of employment choices and poverty outcomes in order to better understand the linkages between growth, employment creation and poverty reduction. Detailed individual and household- level employment and poverty outcomes are assessed. The analytical framework is two-fold. On the one hand the authors aim to understand welfare, measured by household consumption, and the role employment in the household can play. On the other hand, the authors aim at identifying personal or household characteristics that influence the pattern of employment. Throughout the study, the authors distinguish two broad categories of employment by sector, i.e., agricultural versus non-agricultural employment, and by function, i.e., self-employment versus wage employment. Methodologically, the use of a detailed and novel micro-economic assessment of welfare effects of employment based on the two household surveys allows the authors to establish the nationally representative determinants of household welfare and household employment and their interdependence. The first survey mainly focussed on information at the individual level, e.g., age, gender, health, education and employment status. The second survey, in addition to collecting individual level data, provides information at the household level, such as, land- and tree holdings, livestock ownership, dwelling characteristics, asset ownership and agricultural production.

x
Both surveys cover both rural and urban areas and are nationally representative with all ten provinces included and Maputo City covered as a separate eleventh province. The authors find no direct effect of employment on consumption at the household level in 1996. However, in 2002 such an effect is noticeable in some regions, with non-agricultural employment having significant positive effects on household consumption in urban areas. By contrast, agricultural employment has significant positive consumption effects for Northern rural areas. These findings suggest that there is no single national strategy, which can strengthen the pro-poor effects of growth and employment across the country. Instead, three sets of policies are identified at overcoming new challenges dealing with (i) regional and sectoral divergences, (ii) agricultural development, and (iii) education and gender. Regionally and sectorally differentiated responses are needed, consisting of efforts to improve the quality of human capital, to raise agricultural productivity in rural areas, to increase the demand for off- farm labour in rural areas, and to strengthen inter-sectoral and inter-regional labour mobility. Given that over two thirds of the population is active in agriculture, and given agriculture’s strong welfare effects (especially in Northern and Central rural areas), agricultural development matters immensely for Mozambican poverty reduction. Therefore, developmental efforts supporting productivity, marketing and international trading possibilities are recommended. The study clearly demonstrates the importance of gender and education as determinants of access to employment. Although the importance of both factors is decreasing in urban areas, they are actually increasing in rural areas. To relieve the gender constraint in the field of employment, policies have to address the underlying cultural, political and social constraints for female labour demand. Simultaneously, the quality and quantity of female labour has to be increased through more and better education. Education remains a key driver of poverty reduction in Mozambique as seen in the 1990s when a lack of education within urban areas acted as a contributor towards being poor and, overall, towards increasing inequality. The experience of Mozambique especially in the south indicates that high growth alone is not sufficient for poverty reduction due to the impediment that sharply rising inequality poses. In analysing the consumption effects of employment, the authors conclude that it is not employment per se that matters most, but actually the large effects of variables related to both consumption and employment access that determine success in alleviating poverty. The present paper forms part of the outputs of a project on Employment Poverty Linkages and Policies for Pro-Poor Growth funded by the Swedish International Development Agency (SIDA). Other country level studies covered by the project include those on Bangladesh, Bolivia, Ethiopia, Pakistan, Vietnam and Thailand.
Rizwanul Islam Director
January 2006 Employment Strategy Department

xi
Acknowledgements
We would like to thank Channing Arndt and his team at the Ministry of Planning and Finance in Maputo for their support and advice in carrying out this study. Helpful comments from Rizwanul Islam are also acknowledged. Caroline Kip and Wolfgang Härle provided excellent research assistance. The usual disclaimer applies. In particular, the views presented in this report are those of the authors alone.
1
1. Introduction 1.1. Objective This report analyses the relationship between economic growth, employment and poverty in post-war Mozambique. It summarises recent macro-economic trends and provides a detailed and novel micro-economic assessment of the welfare effects of employment. Based on these findings, the study derives policy recommendations for enhancing growth, creating employment and alleviating poverty in post-war Mozambique. 1.2. Approach The approach of the study is to combine macro-economic analysis with a detailed assessment of the only two nationally representative household surveys undertaken in Mozambique to date. The macro-economic analysis provides a framework for the micro-economic investigation and supports the interpretation of the detailed micro-economic findings. Methodologically, the use of two household surveys from 1996-97 and 2002-03 allows us to establish the nationally representative determinants of household welfare and household employment and their interdependence. Estimating the effect of employment outcomes on household welfare addresses an important linkage between growth, employment and poverty. Conceptually, it is possible to think of a number of variables, which could influence the probability of a household being poor in terms of inadequate income. The variables could be asset-related (e.g. the possession of income-generating assets), human capital related (e.g. education and skill levels of the working members of a household) or employment related (e.g. the sector and quantity of employment of the workers, wages, productivity, etc.). The analysis will also include regional variables to capture district endowments important for pro-poor growth. Other papers on Mozambique using the same data sources focus in more detail on issues of pro-poor growth (James, Arndt et al. 2005), consumption inequality (Fox, Bardasi et al. 2005), poverty determinants (Maximiano, Arndt et al. 2005), demography (Klasen and Woltermann 2004), and the methodology of the surveys (Instituto Nacional de Estatística 2004). This paper instead focuses on the employment-poverty nexus and its linkages to the macro-economic developments in Mozambique. 1.3. Data Sources The data used for the analysis are the IAF data (Inquérito aos Agregados Familiares), which represent the only nationally representative data on employment and consumption available in Mozambique. The first IAF dataset was collected in the period from February 1996 to April 1997 (Government of Mozambique 1998). The second survey ran from July 2002 to June 2003 (Government of Mozambique 2004).
2
In both cases the survey was designed and organised by the Instituto Nacional de Estatística (INE).1 In 1996-97 the emphasis was on the households’ living conditions, whereas in the later survey it was not as much on living conditions as on expenditures. More details on sampling method and data collection can be found in the two reports that resulted from the surveys (Government of Mozambique 1998; Government of Mozambique 2004). Both surveys cover both rural and urban areas and are nationally representative. All 10 provinces were included and Maputo City was considered separately, as an eleventh province. Within each province all districts are included. The household sampling of the 1996-97 survey was based on the latest census available i.e. the 1980 census while the 2002-03 sampling was based on the more recent census of 1997. For each of the primary sampling units the survey teams used simple random selection techniques for inclusion of households in the sample. In 1996-97 nearly 8300 households were interviewed and 8700 in 2002-03. The IAF data do not have a panel character but have to be used as two cross-section datasets. Information was collected both at household and individual level. At the individual level, there is information on age, gender, health, education and employment status. The latter topic is more broadly tackled in the first survey. At the household level there is information on land- and tree holdings, livestock ownership, dwelling characteristics, asset ownership and agricultural production. In the second survey not all of these topics are as extensively treated as in the first one and some are even left out such as land and livestock ownership. Both surveys have sections on household expenditure, recorded in much more detail in the second survey. This slightly different focus entails some constraints for our empirical analysis since we decided for comparability reasons to use only data that were collected in both surveys. However, many interesting changes can be observed using only the variables that overlap. The analysis has a double focus. On the one hand we aim to understand welfare, measured by household consumption, and the role employment patterns in the household can play. On the other hand, we also aim at identifying personal or household characteristics that actually allow for a certain pattern of employment. Throughout the report we basically use a two-way classification of employments (which provide earned income). On the one hand, we distinguish by sector, i.e. agricultural versus non-agricultural employment 2, where the distinction only refers to the main activity of the site where the work is performed and not to the location, which could be rural or urban. On the other hand, we distinguish income earners by function, i.e. self-employment versus wage employment. Using this framework, all income earners are sorted by their main activity into one of these four categories. A fifth category consists of persons who are working but who do not get a monetary income. In most cases these will be helpers in the activities of other members of their
1 Summary statistics on most of the variables collected in both surveys have been published in Mozambique (Instituto Nacional de Estatística 1999). 2 Non-agricultural employment refers to employment in a sector other than agriculture, forestry or fishery. It does not only refer to employment off the household’s farm. In the 2002-03 IAF survey activities related to either one of the three sectors (agriculture, fisheries, forestry) were grouped as one sector hence our definition of agriculture includes all three.
3
household or family. Another definition we may use is off- farm employment which broadens the non-agricultural category to include wage work in the agricultural sector. So off- farm includes all employment that is held outside of the own farm. Additionally, we may make a distinction between rural and urban areas. The determination of where exactly lies the border between a rural and urban area may be subject to the survey designers’ views. Between both surveys the definition of rural and urban even changed, including some of the former rural areas in the urban category in the 2002-03 survey. Ten percent of the sample population living in urban areas in 2002 would have been living in rural areas under the 1996 rural-urban definitions. Obviously, the boundaries should change in the course of the urbanization process. For comparative reasons we applied the 2002-03 definition also to the 1996-97 sample. Other than rural urban differences, regional differences may also exist. It was shown that poverty differences and changes thereof were strikingly more prominent between regions than between rural-urban areas. Hence we opt to focus both on regional differences as well as on the rural-urban divide. Whenever we make the rural-urban division, we use the 2002-03 definition for both surveys. By this definition, the North and Central regions are equally “rural” as the percentage of the sample living in rural areas was 65 and 64 percent respectively in 1996 and 60 and 61 percent respectively in 2002. The South is the “urban” region with 53 and 65 percent of its sample population living in urban areas in 1996 and 2002 respectively. In all regions we notice an increase in the urban population. In what follows all statistics are weighed to correct for sampling probabilities.3 In the empirical literature on welfare or employment choice the rural-urban distinction is widely used as a tool to divide the population (Heltberg and Tarp 2002; Justino and Litchfield 2002; Gibson and Rozelle 2003). Also the distinction between agricultural and non-agricultural sectors or the farm and non-farm sector is broadly applied (Barrett, Reardon et al. 2001). Some authors focus on one intersection of both which is usually the rural non-farm group (Reardon 2000; Mecharla 2002; Isgut 2004). We would have liked to assess the structure of real wages and earnings of wage-paid workers and real earnings of the self-employed in order to analyse another important element in the channel of transmission of benefits of growth to the poor. However, for two reasons this was not possible. First, the available data focuses on the analysis of household consumption levels but neither on household income data nor on wage rates. Second, the smallholder farm sector in Mozambique is characterised by a large share of auto-consumption and it accounts for the majority of employment in the country. Therefore data on wage rates are neither available nor would they be easy to calculate in principle. The methods of this section have therefore been adjusted to the needs of a dataset containing the consumption data of many rural, self-employed farm households.
3 The weights are the inverse of the probability with which a particular household in the primary sampling unit could be selected for being interviewed.
4
2. Growth, Employment and Poverty: A Macro-Level View This section provides an overview of the performance of the Mozambican economy in terms of economic growth, employment and poverty. This part of the study will thus delineate the Mozambican phenomenon of high rates of growth and high rates of poverty since the end of the war in 1992. The pattern of economic growth will be assessed in terms of its sectoral structure and its driving forces (including an analysis of international financial flows). In addition, this section provides key indicators of the structure and trends of human capital accumulation, employment and poverty. Regional and rural-urban inequalities in output, employment and poverty will also be discussed. A comparison with neighbouring countries’ performance is undertaken where appropriate. This section also examines the sectors and occupations where the poor are concentrated and analyses the trends in employment and earnings in various groups of households. In addition, it asks whether there are discernible shifts in the structure of employment towards sectors with more growth potentia l. Section 2.1 analyses economic growth and international financial flows, section 2.2 discusses aggregate poverty and social developments, section 2.3 presents aggregate employment data while section 2.4 summarises correlations between employment and poverty trends. Section 2.5 provides an initial assessment of macro-economic and aggregate trends. 2.1. Macro-Economic Growth Mozambique experienced a severe civil war until 1992. The economy was badly damaged by the conflict, which occurred mainly in rural areas (Colletta, Kostner et al. 1996; Addison and de Sousa 1999). At the same time, farm productivity in the post-war period was well below regional averages (Tschirley and Weber 1994). Consequently, the incidence of absolute poverty during the war was much higher in rural areas (68%) than in urban areas (32% to 52%) (Lopes and Sacerdoti 1991). Of all poor people in Mozambique in 1988-89, 83% were resident in rural areas and only 17% in urban areas (Lopes and Sacerdoti 1991). The regional divergences in Mozambique are a significant feature of the economy, as will be shown in both the macro- and the micro-economic analyses below in more detail. In contrast to the South, the North of Mozambique is often considered the “green belt” of the country. Yet even here post-war agricultural production was hampered by poor transport networks and the absence of irrigation infrastructure and of mechanized agricultural production (Cramer and Pontara 1998, Heltberg and Tarp 2002, Pitcher 1998, Tschirley and Benfica 2001, Tschirley and Weber 1994). There were few agricultural or non-agricultural wage employment opportunities and no migrant workers, unlike in Southern Mozambique. Only 11 percent of all rural households in the North, for example, occasionally or regularly employed agricultural labour (UNDP 1999). In the early post-war period (until the mid-1990s), output markets did not exist in all months and in all locations throughout Mozambique.
5
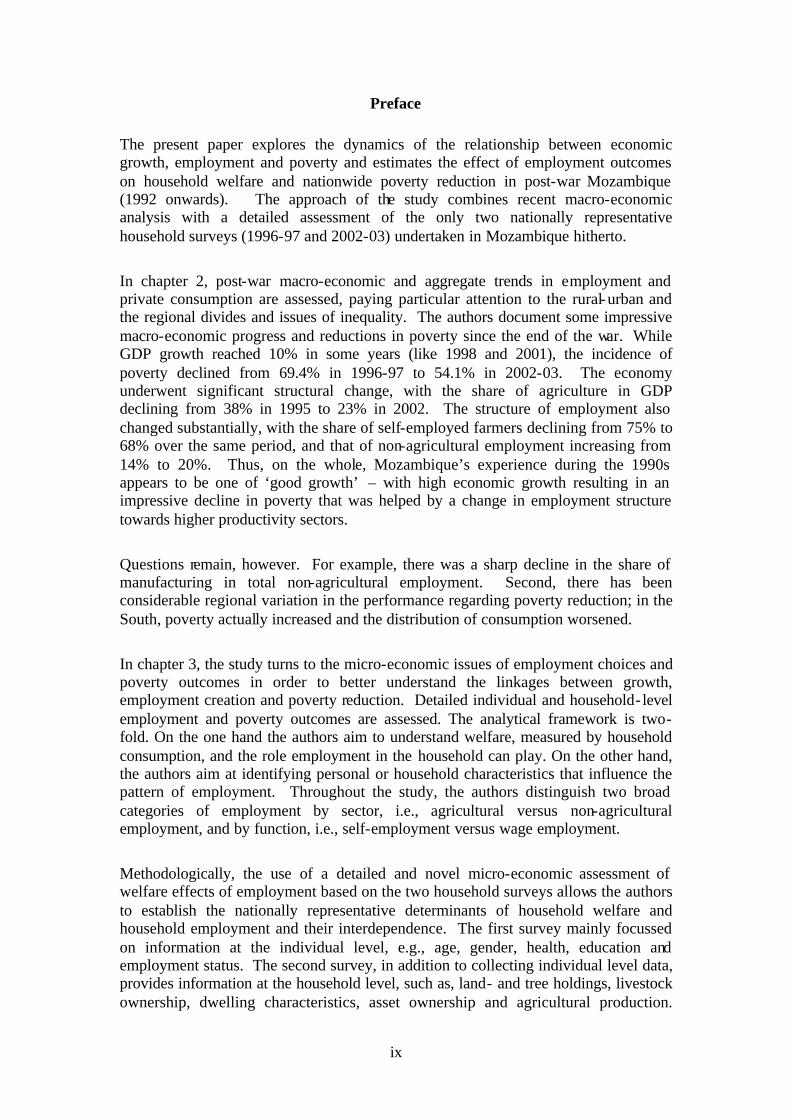
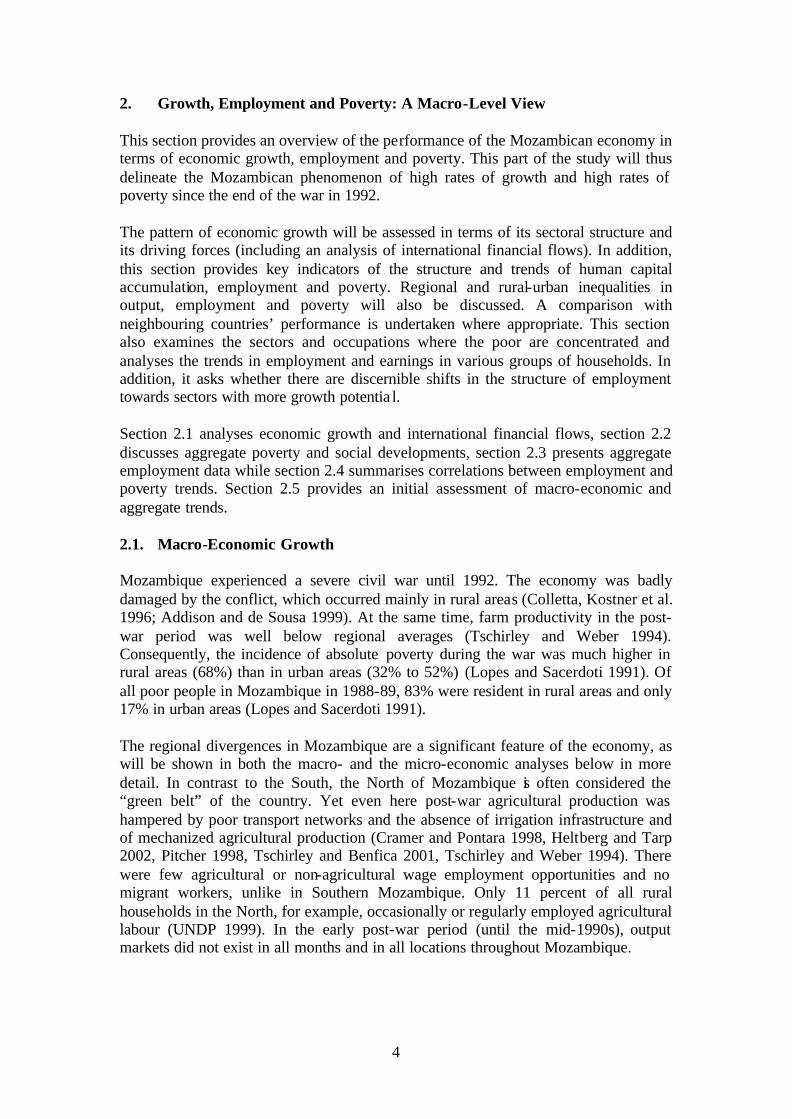
Figure 1. Gross Domestic Product 1, International Comparison
-30%
-25%
-20%
-15%
-10%
-5%
0%
5%
10%
15%
1990 1991 1992 1993 1994 1995 1996 1997 1998 1999 2000 2001 2002
Mozambique Angola
South Africa Tanzania
Zambia
1 GDP in constant 1995 US $. Source: World Development Indicators 2004. After the strong negative impact of the war on per capita growth, Mozambique experienced a sustained growth resurgence after the war (Figure 1). The average annual GDP and GDP per capita growth rates for the period 1995 to 2002 were 8.0 per cent and 5.6 per cent, respectively (World Bank, 2005). Growth rates increased in the 1990s and peaked in 1998 and 2001 at about 10%. The floods in the year 2000 had a negative impact on GDP per capita growth in the short-term. Neighbouring countries with the notable exception of Angola rarely exceeded these growth rates. South African per capita GDP growth, for instance, was consistent ly lower than that of Mozambique, except in the last year of war and during the floods in Mozambique. The recovery of the 1990s can be explained in part by the end of the capital destruction and of the high levels of uncertainty caused by the war, a credible peace agreement and peace process, the high inflow of resources with the factual two-year UN occupation of the country, the return of the large number of displaced people, related increases in the total land cultivated, favourable weather conditions, continued high levels of aid, continually improved macroeconomic management, increased competition in many markets, and increasing inflows of foreign direct investment. The sectoral disaggregation of GDP growth shown in Figure 2 indicates that agriculture experienced a strong catch up in the early 1990s and a subsequent drop in its growth rates. Considering that per capita food production in 1993 was still three quarters of the 1980, that is pre-war, level, the early growth in post-war agriculture may be considered a catching up phenomenon as the security situation in rural are improved dramatically, as markets integrated and as inputs became at least partially available.
6
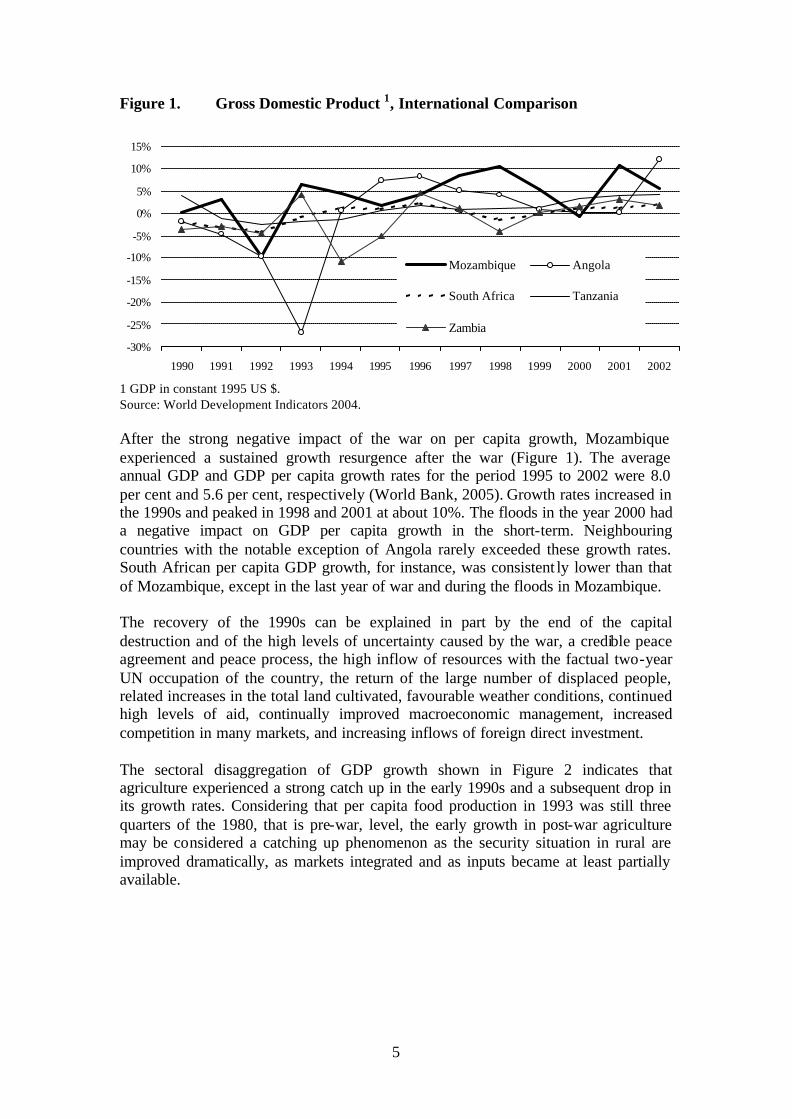
Figure 2. Gross Domestic Product by Sector, 1990 – 2002 annual % change
-30
-20
-10
0
10
20
30
40
50
60
70
1990 1991 1992 1993 1994 1995 1996 1997 1998 1999 2000 2001 2002
Agriculture Industry
Services, etc.
Source: World Development Indicators 2004. The subsequent drop in the agricultural growth rates could then be interpreted in two ways. Optimistically, this could be seen to represent the release of labour from the primary to the other, perhaps more productive sectors, thus advancing the Mozambican economy in spirit of dual, Lewis-style economic transformation. Should this scenario hold true, then both growth and poverty alleviation efforts should be directed towards the modern sectors in industry and services, which would continue to “pull” people towards them. More pessimistically, the drop in the agricultural growth rates may be the expression of a emerging constraint on growth due to the continuing weaknesses especially of the rural economy in all parts of the country. Despite strong advances in providing rural infrastructure, health care and education, there remains a massive need for further public and private investment in rural and hence agricultural development. Given the continuing high share of the Mozambique population living and working in agriculture and given their continued poverty, addressing the reduction in growth in this sector is thus a key policy challenge for Mozambique. Accelerating agricultural growth could be obtained by raising still low productivity levels, by providing much more education and health in rural areas and by strengthening markets and linkages between sectors through developing rural off- farm sectors. The further analysis will indicate which of these interpretations appears more likely for the case of Mozambique. The growth rates of industry have been much higher than for agriculture, save two short periods of contraction in the early 1990s (with an on-going war) and in the mid-1990s. This growth experience of industry is based on a very low level, though, thus emphasising the emergence of even modest rises in industrial activities. In addition, the high growth rates in the late 1990s were fuelled by the so-called mega projects of foreign direct investors, starting with the Mozal plant (see also Figure 9). The service sector has been fairly stagnant in Mozambique, with its growth rate fluctuating around zero for the entire period. The exception to this trend was the early
7
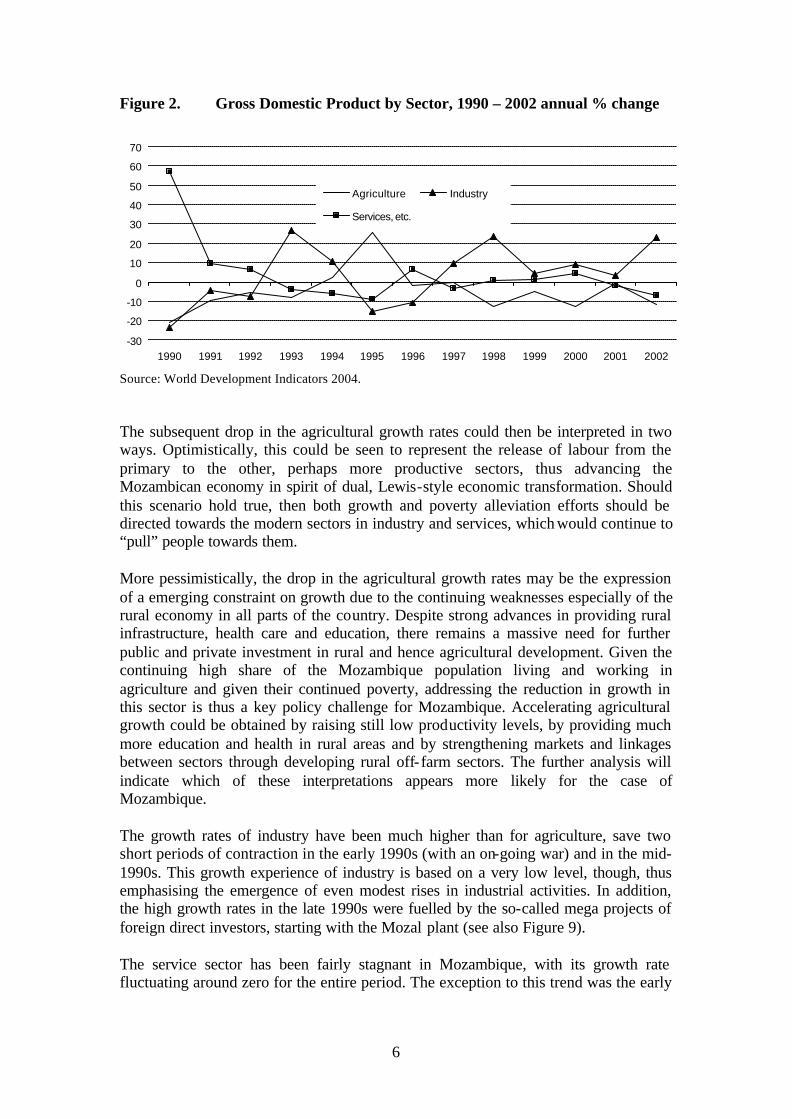
post-war period, when the influx of the UN-troops and foreign aid boosted the demand for services dramatically (see also Figure 8). Table 1. Regional GDP Per Capita (in real US-Dollar) 1996 1997 1998 1999 2000
North 121 138 143 136 112 Niassa 97 110 107 109 95 Cabo Delgado 113 110 128 122 98 Nampula 131 158 160 149 122
Centre 135 142 143 143 113 Zambézia 103 106 96 95 78 Tete 99 113 108 110 105 Manica 123 143 171 173 125 Sofala 249 248 258 261 191
South 357 369 406 399 341 Inhambane 136 141 143 143 115 Gaza 113 129 138 138 93 Maputo Province 123 171 166 168 171 Maputo City 1,089 1,076 1,235 1,221 1,068
National 187 198 210 206 171
Source: UNDP (2001: Table 17). The regional distribution of GDP per capita is presented in Figure 2. It indicates the extreme poverty in GDP terms across the country, the degree of homogeneity within the poor North, the higher heterogeneity in the Centre with Zambézia becoming markedly poorer and Sofala being noticeable less poor than the neighbouring provinces while the South is characterised by the extreme difference in output between the capital city and the other Southern provinces. Noticeable is also the reduction in GDP per capita in 2000 across almost the entire country due to the floods. A variety of factors could have contributed to different macro-economic growth experiences. In the North, some of the positive factors include overall favourable agronomic conditions, international trade routes through parts of the provinces, stable social relations, improvements in educational attainments and improving rural infrastructures (such as access to electricity and telephone services, bridges and health and education services). On the other hand, many parts of the North still suffer from geographic and economic isolation, low educational endowments and poor socio-economic indicators, and low efforts to improve agricultural productivity. In the Centre, agronomic conditions are also favourable in principle and there is also a principal transport corridor between the coast and the interior as well as an interior transport corridor cutting through Tete province. Furthermore, the second largest Mozambican city, Beira, is situated in the Centre thus providing some economic stimuli. The first ever Mozambican mega project, the hydroelectric Cahora Bassa damn, is also located in the Centre but arguably its linkages with the local economy are minimal. With the deteriorating political situation in Zimbabwe, the value of the transport corridors is also much diminished while the Central provinces generally
8
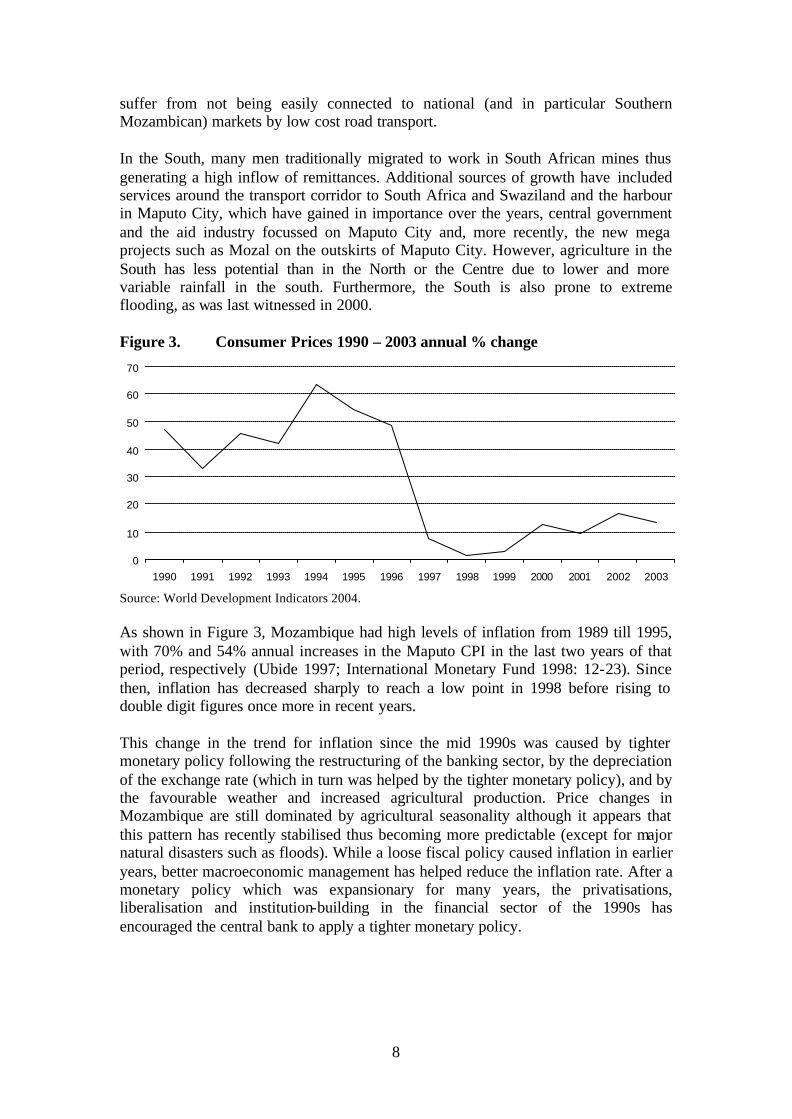
suffer from not being easily connected to national (and in particular Southern Mozambican) markets by low cost road transport. In the South, many men traditionally migrated to work in South African mines thus generating a high inflow of remittances. Additional sources of growth have included services around the transport corridor to South Africa and Swaziland and the harbour in Maputo City, which have gained in importance over the years, central government and the aid industry focussed on Maputo City and, more recently, the new mega projects such as Mozal on the outskirts of Maputo City. However, agriculture in the South has less potential than in the North or the Centre due to lower and more variable rainfall in the south. Furthermore, the South is also prone to extreme flooding, as was last witnessed in 2000. Figure 3. Consumer Prices 1990 – 2003 annual % change
0
10
20
30
40
50
60
70
1990 1991 1992 1993 1994 1995 1996 1997 1998 1999 2000 2001 2002 2003
Source: World Development Indicators 2004. As shown in Figure 3, Mozambique had high levels of inflation from 1989 till 1995, with 70% and 54% annual increases in the Maputo CPI in the last two years of that period, respectively (Ubide 1997; International Monetary Fund 1998: 12-23). Since then, inflation has decreased sharply to reach a low point in 1998 before rising to double digit figures once more in recent years. This change in the trend for inflation since the mid 1990s was caused by tighter monetary policy following the restructuring of the banking sector, by the depreciation of the exchange rate (which in turn was helped by the tighter monetary policy), and by the favourable weather and increased agricultural production. Price changes in Mozambique are still dominated by agricultural seasonality although it appears that this pattern has recently stabilised thus becoming more predictable (except for major natural disasters such as floods). While a loose fiscal policy caused inflation in earlier years, better macroeconomic management has helped reduce the inflation rate. After a monetary policy which was expansionary for many years, the privatisations, liberalisation and institution-building in the financial sector of the 1990s has encouraged the central bank to apply a tighter monetary policy.
9
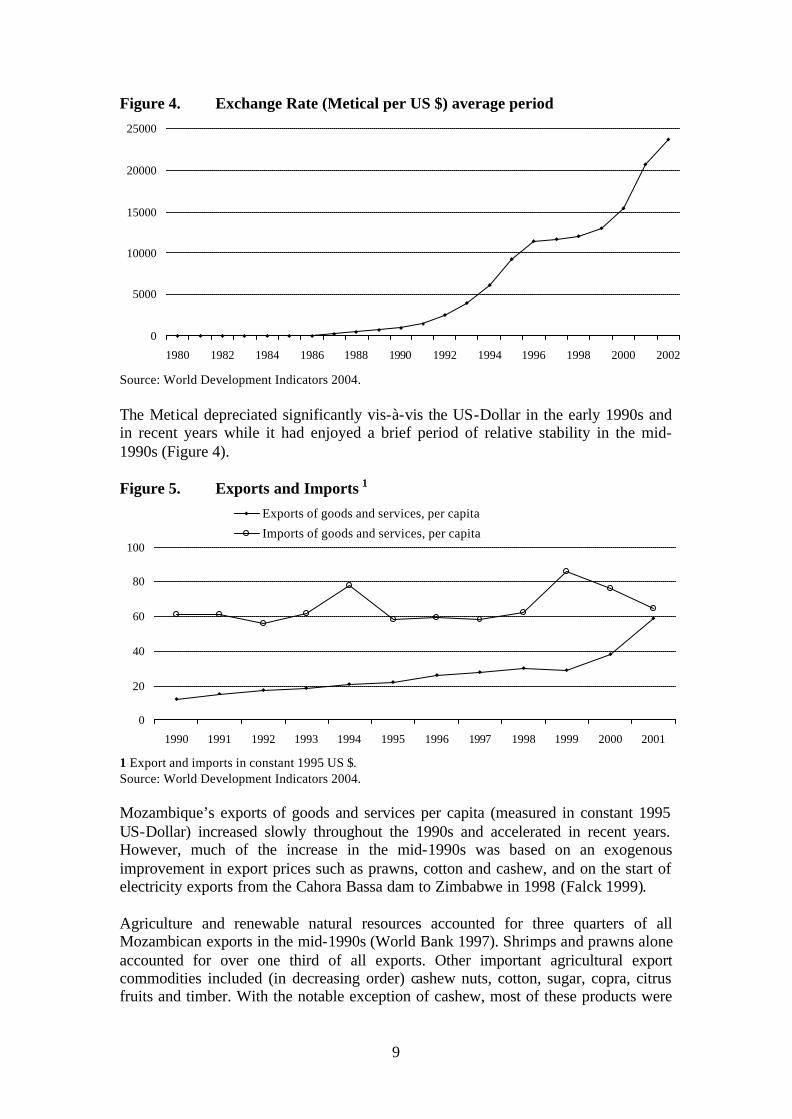
Figure 4. Exchange Rate (Metical per US $) average period
0
5000
10000
15000
20000
25000
1980 1982 1984 1986 1988 1990 1992 1994 1996 1998 2000 2002
Source: World Development Indicators 2004. The Metical depreciated significantly vis-à-vis the US-Dollar in the early 1990s and in recent years while it had enjoyed a brief period of relative stability in the mid-1990s (Figure 4). Figure 5. Exports and Imports 1
0
20
40
60
80
100
1990 1991 1992 1993 1994 1995 1996 1997 1998 1999 2000 2001
Exports of goods and services, per capita
Imports of goods and services, per capita
1 Export and imports in constant 1995 US $. Source: World Development Indicators 2004. Mozambique’s exports of goods and services per capita (measured in constant 1995 US-Dollar) increased slowly throughout the 1990s and accelerated in recent years. However, much of the increase in the mid-1990s was based on an exogenous improvement in export prices such as prawns, cotton and cashew, and on the start of electricity exports from the Cahora Bassa dam to Zimbabwe in 1998 (Falck 1999). Agriculture and renewable natural resources accounted for three quarters of all Mozambican exports in the mid-1990s (World Bank 1997). Shrimps and prawns alone accounted for over one third of all exports. Other important agricultural export commodities included (in decreasing order) cashew nuts, cotton, sugar, copra, citrus fruits and timber. With the notable exception of cashew, most of these products were
10
being farmed by commercial, large-scale farms or plantations in Mozambique. More recently, export increases resulted from the completion of the first mega-projects in Mozambique, including the Mozal plant. This has shifted the composition of Mozambican exports and the nature of the possible linkages these export activities may have at the local level. Increased export earnings do no t, however, seem to depend on increasing investments by or in smallholder farming agriculture, especially as diminishing returns to land are being increasingly experienced in fertile, centrally located farmland. In addition, the contribution of the prawn industry will continue to decline in absolute terms if the government continues to grant large numbers of fishing licences while neglecting the environmental protection of the mangrove swamps, which are crucial in the life-cycle of prawns. Furthermore, improvements in the external competitiveness may not translate into broadly based, poverty-reducing agricultural output growth if structural problems and a lack of institutional development continue to inhibit the supply response of smallholder farmers comparably more than the supply response of large, multinational investment consortia. Imports of goods and services per capita measured in constant 1995 US-Dollar stayed near or above the 60 Dollar mark throughout the period 1990 to 2001 with significant increases related to additional aid flows in the early post-war period, the construction of the mega-projects and the aid needs after the floods (Figure 5). Most notable is the extreme divergence between the level of exports and imports, indicating the massive reliance on aid and debt that has characterised the Mozambican economy for many years. If the real level of per capita imports is unlikely to fall below the 60 US-Dollar mark, then will be necessary to expand exports significantly and sustainably, as has started to happen in recent years due to the start of production at Mozal. Mozambique has improved its competitiveness vis-à-vis most of its trading partners since the end of the conflict. Mozambique has gained much labour productivity with comprehensive programme of privatisations which reduced the workforce of most formerly publicly owned firms but improved the productivity of the remaining workers significantly. And increases in the Mozambican rate of inflation were generally not matched by increases in the nominal wage rate so that this, too, helped improve Mozambique’s international competitiveness. Overall, Mozambique has improved its competitiveness by 113% 1987-96 and by 24% 1992-96 while South Africa has worsened its competitiveness by 163% 1987-96 and by 28% in the period 1992-96 (International Monetary Fund 1998: 44).
11
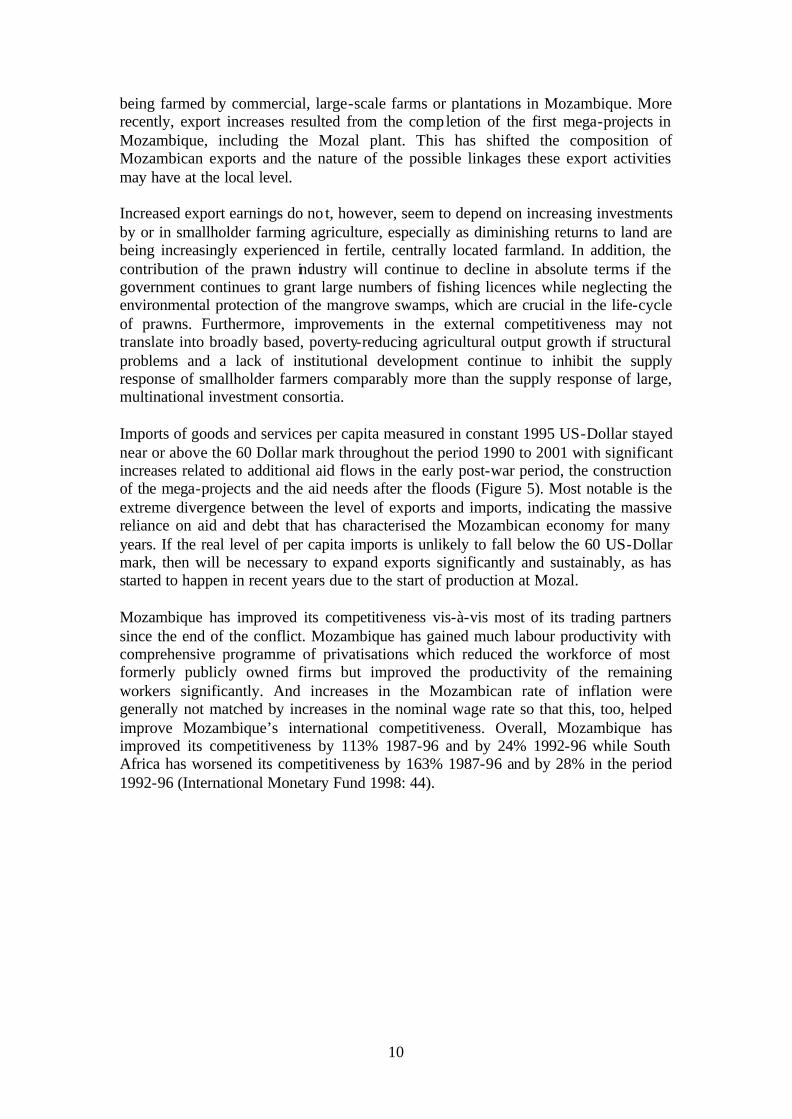
Figure 6. External Indebtedness, International Comparison. Total external debt to gross national income. (EDT/GNI) in %
0
100
200
300
400
500
600
1990 1991 1992 1993 1994 1995 1996 1997 1998 1999 2000 2001 2002
Mozambique Angola South Africa Tanzania Zambia
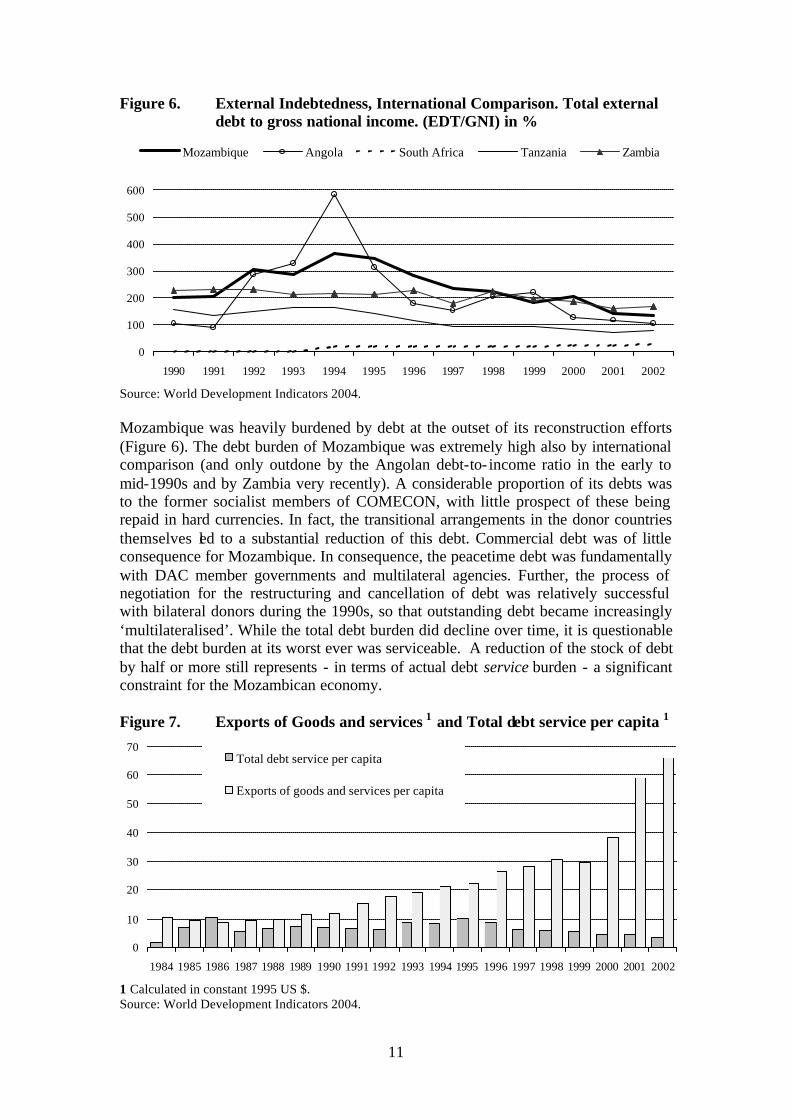
Source: World Development Indicators 2004. Mozambique was heavily burdened by debt at the outset of its reconstruction efforts (Figure 6). The debt burden of Mozambique was extremely high also by international comparison (and only outdone by the Angolan debt-to- income ratio in the early to mid-1990s and by Zambia very recently). A considerable proportion of its debts was to the former socialist members of COMECON, with little prospect of these being repaid in hard currencies. In fact, the transitional arrangements in the donor countries themselves led to a substantial reduction of this debt. Commercial debt was of little consequence for Mozambique. In consequence, the peacetime debt was fundamentally with DAC member governments and multilateral agencies. Further, the process of negotiation for the restructuring and cancellation of debt was relatively successful with bilateral donors during the 1990s, so that outstanding debt became increasingly ‘multilateralised’. While the total debt burden did decline over time, it is questionable that the debt burden at its worst ever was serviceable. A reduction of the stock of debt by half or more still represents - in terms of actual debt service burden - a significant constraint for the Mozambican economy. Figure 7. Exports of Goods and services 1 and Total debt service per capita 1
0
10
20
30
40
50
60
70
1984 1985 1986 1987 1988 1989 1990 1991 1992 1993 1994 1995 1996 1997 1998 1999 2000 2001 2002
Total debt service per capita
Exports of goods and services per capita
1 Calculated in constant 1995 US $. Source: World Development Indicators 2004.
12
The Mozambican debt service per capita in constant 1995 US Dollar rose in the mid-1990s (Figure 7) as new reconstruction loans were extended and fell as the wartime debt was restructured or cancelled in recent years (Castel-Branco 1999; International Monetary Fund and International Development Association 2000). At the same time, export earnings per capita rose, suggesting an improved serviceability of the Mozambican debt burden. However, given the much higher levels of imports observed above and given the sectoral composition of exports, even these rises in export earnings per capita are not sufficient for achieving a sustainable external position in Mozambican. Figure 8. Foreign Aid Flows, International Comparison. Aid per capita 1
0
50
100
150
200
250
1990 1991 1992 1993 1994 1995 1996 1997 1998 1999 2000 2001 2002
MozambiqueAngolaSouth AfricaTanzaniaZambia
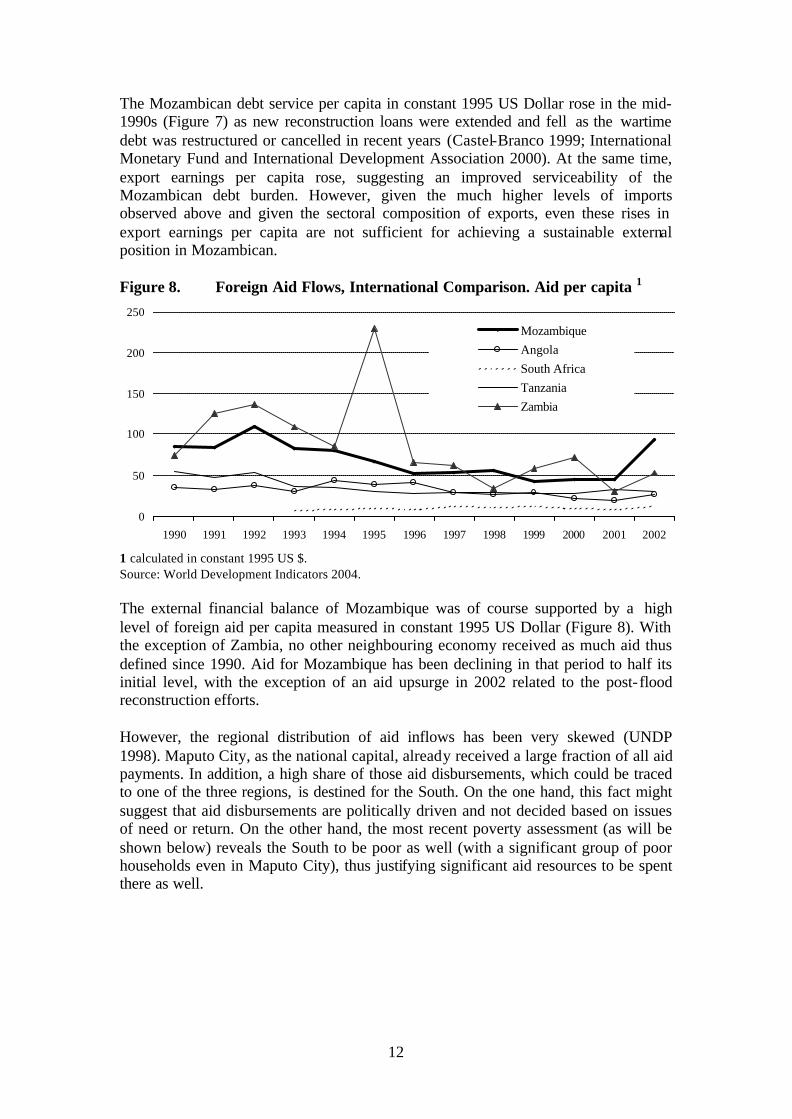
1 calculated in constant 1995 US $. Source: World Development Indicators 2004. The external financial balance of Mozambique was of course supported by a high level of foreign aid per capita measured in constant 1995 US Dollar (Figure 8). With the exception of Zambia, no other neighbouring economy received as much aid thus defined since 1990. Aid for Mozambique has been declining in that period to half its initial level, with the exception of an aid upsurge in 2002 related to the post- flood reconstruction efforts. However, the regional distribution of aid inflows has been very skewed (UNDP 1998). Maputo City, as the national capital, already received a large fraction of all aid payments. In addition, a high share of those aid disbursements, which could be traced to one of the three regions, is destined for the South. On the one hand, this fact might suggest that aid disbursements are politically driven and not decided based on issues of need or return. On the other hand, the most recent poverty assessment (as will be shown below) reveals the South to be poor as well (with a significant group of poor households even in Maputo City), thus justifying significant aid resources to be spent there as well.
13
Figure 9. Foreign Direct Investment, International Comparison. Foreign direct investment, net inflows (US-$ million) Mozambique, Tanzania, Zambia
0
50
100
150
200
250
300
350
400
450
500
1990 1991 1992 1993 1994 1995 1996 1997 1998 1999 2000 2001 2002
Mozambique Tanzania Zambia
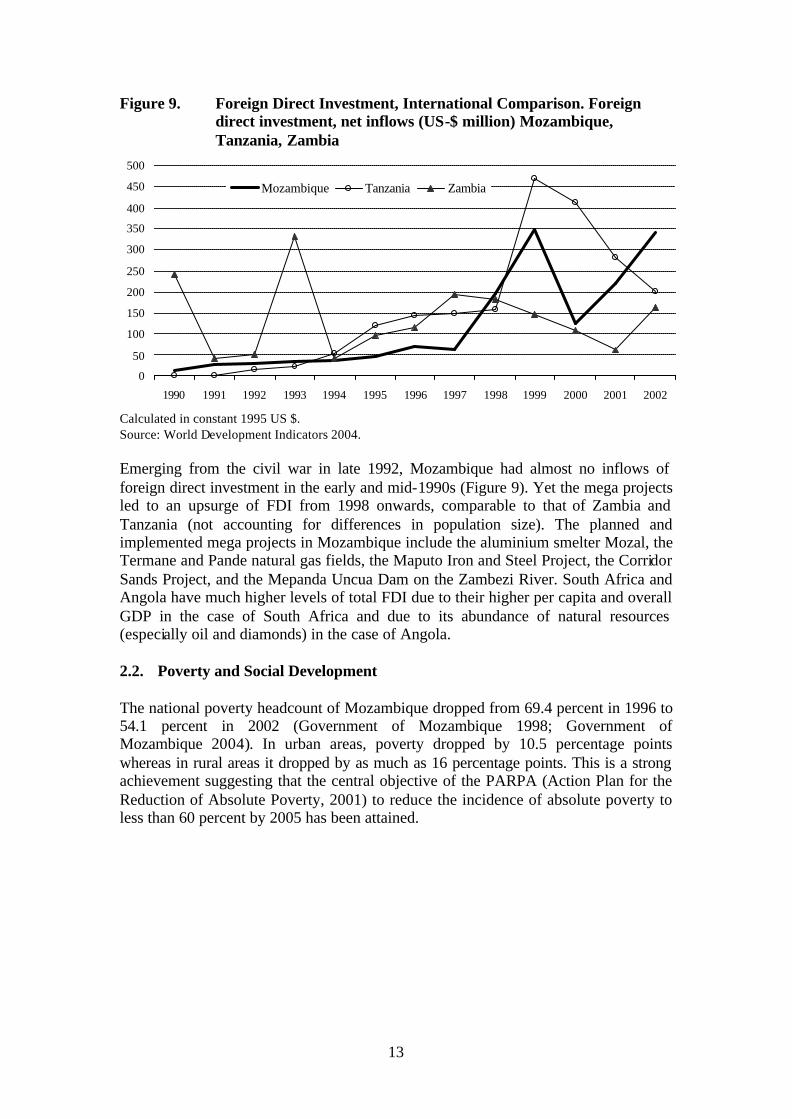
Calculated in constant 1995 US $. Source: World Development Indicators 2004. Emerging from the civil war in late 1992, Mozambique had almost no inflows of foreign direct investment in the early and mid-1990s (Figure 9). Yet the mega projects led to an upsurge of FDI from 1998 onwards, comparable to that of Zambia and Tanzania (not accounting for differences in population size). The planned and implemented mega projects in Mozambique include the aluminium smelter Mozal, the Termane and Pande natural gas fields, the Maputo Iron and Steel Project, the Corridor Sands Project, and the Mepanda Uncua Dam on the Zambezi River. South Africa and Angola have much higher levels of total FDI due to their higher per capita and overall GDP in the case of South Africa and due to its abundance of natural resources (especially oil and diamonds) in the case of Angola. 2.2. Poverty and Social Development The national poverty headcount of Mozambique dropped from 69.4 percent in 1996 to 54.1 percent in 2002 (Government of Mozambique 1998; Government of Mozambique 2004). In urban areas, poverty dropped by 10.5 percentage points whereas in rural areas it dropped by as much as 16 percentage points. This is a strong achievement suggesting that the central objective of the PARPA (Action Plan for the Reduction of Absolute Poverty, 2001) to reduce the incidence of absolute poverty to less than 60 percent by 2005 has been attained.
14
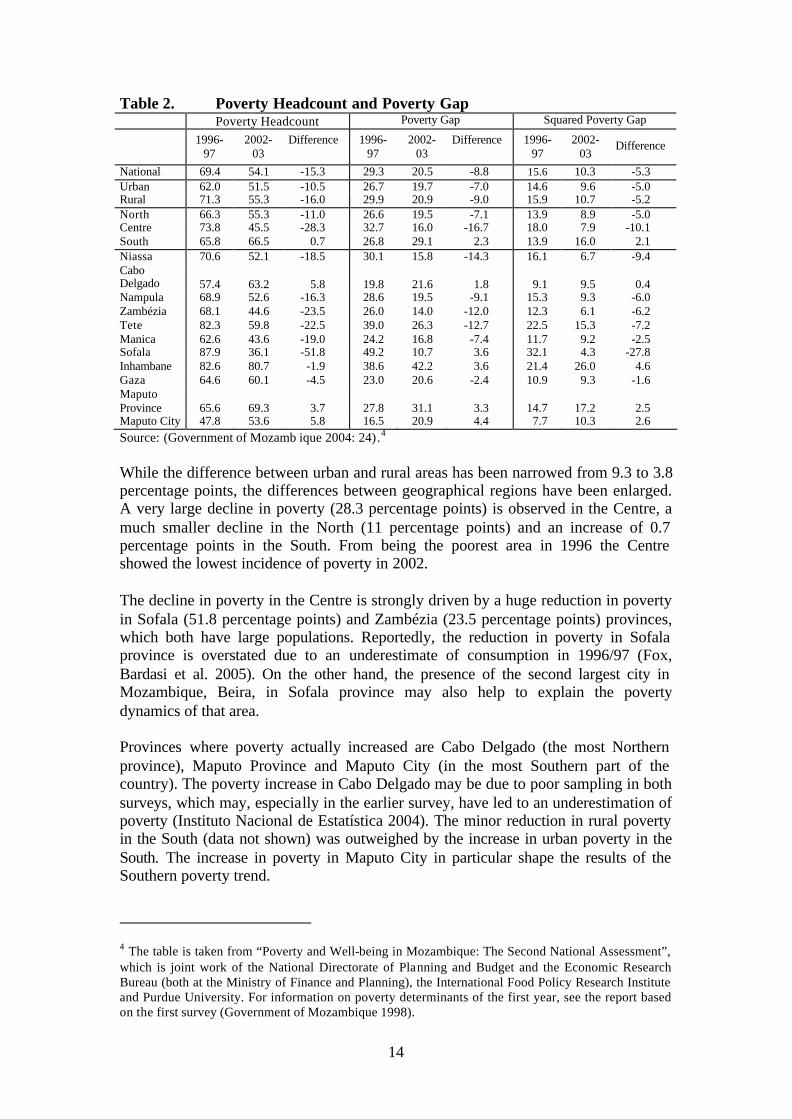
Table 2. Poverty Headcount and Poverty Gap Poverty Headcount Poverty Gap Squared Poverty Gap
1996-97
2002-03
Difference 1996-97
2002-03
Difference 1996-97
2002-03
Difference
National 69.4 54.1 -15.3 29.3 20.5 -8.8 15.6 10.3 -5.3 Urban 62.0 51.5 -10.5 26.7 19.7 -7.0 14.6 9.6 -5.0 Rural 71.3 55.3 -16.0 29.9 20.9 -9.0 15.9 10.7 -5.2 North 66.3 55.3 -11.0 26.6 19.5 -7.1 13.9 8.9 -5.0 Centre 73.8 45.5 -28.3 32.7 16.0 -16.7 18.0 7.9 -10.1 South 65.8 66.5 0.7 26.8 29.1 2.3 13.9 16.0 2.1 Niassa 70.6 52.1 -18.5 30.1 15.8 -14.3 16.1 6.7 -9.4 Cabo Delgado 57.4 63.2 5.8 19.8 21.6 1.8 9.1 9.5 0.4 Nampula 68.9 52.6 -16.3 28.6 19.5 -9.1 15.3 9.3 -6.0 Zambézia 68.1 44.6 -23.5 26.0 14.0 -12.0 12.3 6.1 -6.2 Tete 82.3 59.8 -22.5 39.0 26.3 -12.7 22.5 15.3 -7.2 Manica 62.6 43.6 -19.0 24.2 16.8 -7.4 11.7 9.2 -2.5 Sofala 87.9 36.1 -51.8 49.2 10.7 3.6 32.1 4.3 -27.8 Inhambane 82.6 80.7 -1.9 38.6 42.2 3.6 21.4 26.0 4.6 Gaza 64.6 60.1 -4.5 23.0 20.6 -2.4 10.9 9.3 -1.6 Maputo Province 65.6 69.3 3.7 27.8 31.1 3.3 14.7 17.2 2.5 Maputo City 47.8 53.6 5.8 16.5 20.9 4.4 7.7 10.3 2.6 Source: (Government of Mozamb ique 2004: 24).4 While the difference between urban and rural areas has been narrowed from 9.3 to 3.8 percentage points, the differences between geographical regions have been enlarged. A very large decline in poverty (28.3 percentage points) is observed in the Centre, a much smaller decline in the North (11 percentage points) and an increase of 0.7 percentage points in the South. From being the poorest area in 1996 the Centre showed the lowest incidence of poverty in 2002. The decline in poverty in the Centre is strongly driven by a huge reduction in poverty in Sofala (51.8 percentage points) and Zambézia (23.5 percentage points) provinces, which both have large populations. Reportedly, the reduction in poverty in Sofala province is overstated due to an underestimate of consumption in 1996/97 (Fox, Bardasi et al. 2005). On the other hand, the presence of the second largest city in Mozambique, Beira, in Sofala province may also help to explain the poverty dynamics of that area. Provinces where poverty actually increased are Cabo Delgado (the most Northern province), Maputo Province and Maputo City (in the most Southern part of the country). The poverty increase in Cabo Delgado may be due to poor sampling in both surveys, which may, especially in the earlier survey, have led to an underestimation of poverty (Instituto Nacional de Estatística 2004). The minor reduction in rural poverty in the South (data not shown) was outweighed by the increase in urban poverty in the South. The increase in poverty in Maputo City in particular shape the results of the Southern poverty trend.
4 The table is taken from “Poverty and Well-being in Mozambique: The Second National Assessment”, which is joint work of the National Directorate of Planning and Budget and the Economic Research Bureau (both at the Ministry of Finance and Planning), the International Food Policy Research Institute and Purdue University. For information on poverty determinants of the first year, see the report based on the first survey (Government of Mozambique 1998).
15
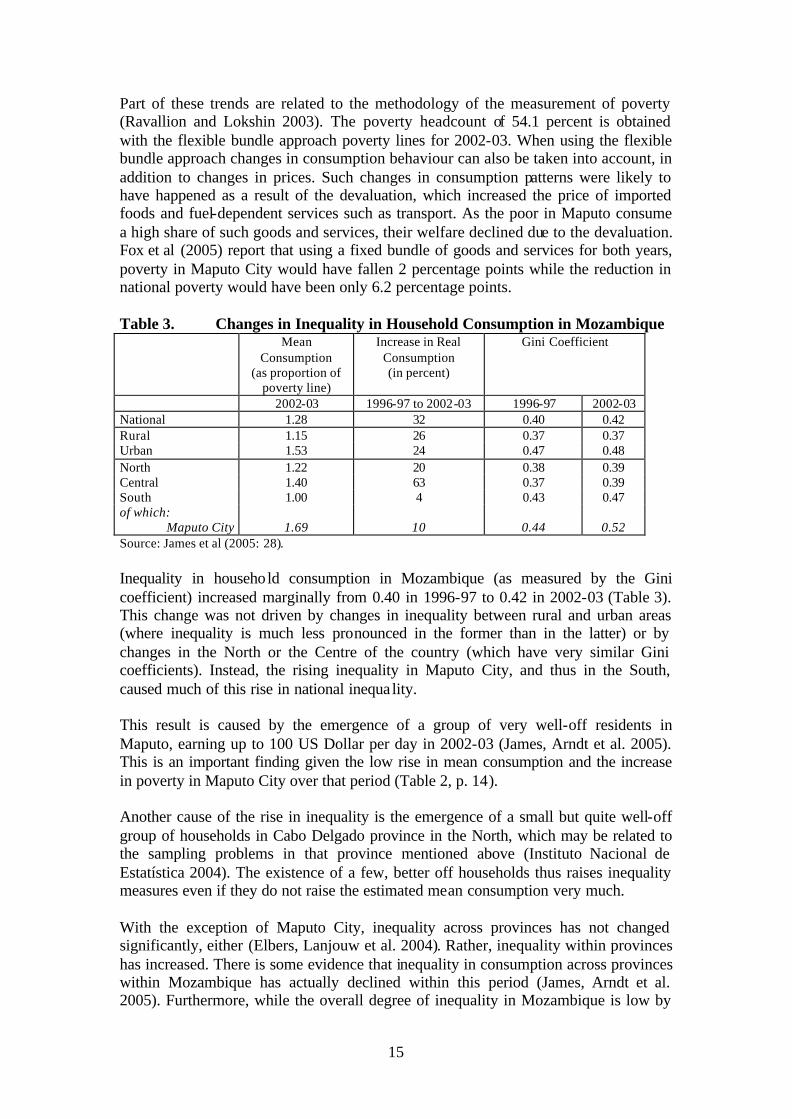
Part of these trends are related to the methodology of the measurement of poverty (Ravallion and Lokshin 2003). The poverty headcount of 54.1 percent is obtained with the flexible bundle approach poverty lines for 2002-03. When using the flexible bundle approach changes in consumption behaviour can also be taken into account, in addition to changes in prices. Such changes in consumption patterns were likely to have happened as a result of the devaluation, which increased the price of imported foods and fuel-dependent services such as transport. As the poor in Maputo consume a high share of such goods and services, their welfare declined due to the devaluation. Fox et al (2005) report that using a fixed bundle of goods and services for both years, poverty in Maputo City would have fallen 2 percentage points while the reduction in national poverty would have been only 6.2 percentage points. Table 3. Changes in Inequality in Household Consumption in Mozambique Mean
Consumption (as proportion of
poverty line)
Increase in Real Consumption (in percent)
Gini Coefficient
2002-03 1996-97 to 2002-03 1996-97 2002-03 National 1.28 32 0.40 0.42 Rural 1.15 26 0.37 0.37 Urban 1.53 24 0.47 0.48 North 1.22 20 0.38 0.39 Central 1.40 63 0.37 0.39 South 1.00 4 0.43 0.47 of which:
Maputo City
1.69
10
0.44
0.52 Source: James et al (2005: 28). Inequality in household consumption in Mozambique (as measured by the Gini coefficient) increased marginally from 0.40 in 1996-97 to 0.42 in 2002-03 (Table 3). This change was not driven by changes in inequality between rural and urban areas (where inequality is much less pronounced in the former than in the latter) or by changes in the North or the Centre of the country (which have very similar Gini coefficients). Instead, the rising inequality in Maputo City, and thus in the South, caused much of this rise in national inequa lity. This result is caused by the emergence of a group of very well-off residents in Maputo, earning up to 100 US Dollar per day in 2002-03 (James, Arndt et al. 2005). This is an important finding given the low rise in mean consumption and the increase in poverty in Maputo City over that period (Table 2, p. 14). Another cause of the rise in inequality is the emergence of a small but quite well-off group of households in Cabo Delgado province in the North, which may be related to the sampling problems in that province mentioned above (Instituto Nacional de Estatística 2004). The existence of a few, better off households thus raises inequality measures even if they do not raise the estimated mean consumption very much. With the exception of Maputo City, inequality across provinces has not changed significantly, either (Elbers, Lanjouw et al. 2004). Rather, inequality within provinces has increased. There is some evidence that inequality in consumption across provinces within Mozambique has actually declined within this period (James, Arndt et al. 2005). Furthermore, while the overall degree of inequality in Mozambique is low by
16
African standards, the degree of urban inequality is high by African standards (Fox, Bardasi et al. 2005). The policy challenge concerning the inequality of welfare appears to lie in tackling the rising consumption inequality within Maputo City and thus to stem the small rise in consumption inequality seen in 1996-97 to 2002-03. Consumption in Mozambique is rising across the entire distribution of consumption (from the poorest to the riches households) even if some better off households are experiencing a faster rise in consumption than some poorer households (James, Arndt et al. 2005). Growth in Mozambique thus appears to be broadly based, if not pro-poor. Figure 10. Population Growth Rates, International Comparison
0,5%
1,0%
1,5%
2,0%
2,5%
3,0%
3,5%
4,0%
1990 1991 1992 1993 1994 1995 1996 1997 1998 1999 2000 2001 2002
Mozambique Angola South Africa Tanzania Zambia
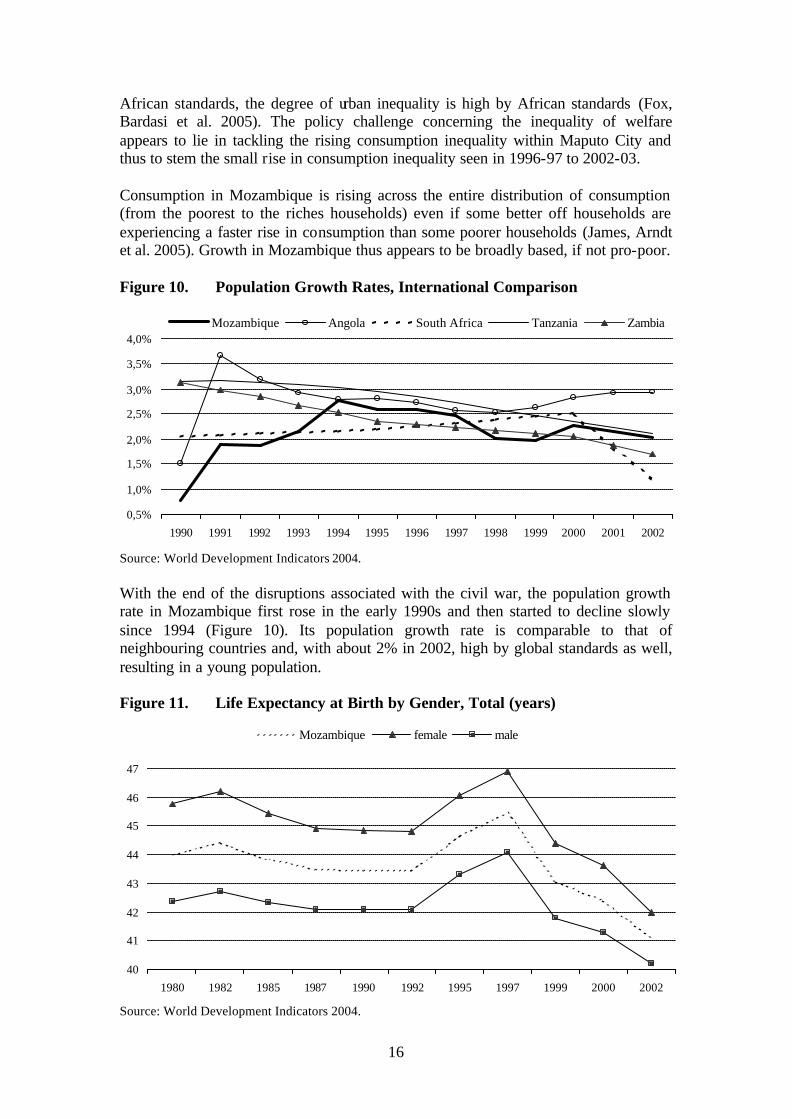
Source: World Development Indicators 2004. With the end of the disruptions associated with the civil war, the population growth rate in Mozambique first rose in the early 1990s and then started to decline slowly since 1994 (Figure 10). Its population growth rate is comparable to that of neighbouring countries and, with about 2% in 2002, high by global standards as well, resulting in a young population. Figure 11. Life Expectancy at Birth by Gender, Total (years)
40
41
42
43
44
45
46
47
1980 1982 1985 1987 1990 1992 1995 1997 1999 2000 2002
Mozambique female male
Source: World Development Indicators 2004.
17
Life expectancy in Mozambique had declined during the war years, recovered after the end of the war and has recently started to fall significantly as a result of AIDS (Figure 11). Women continue to have a higher life expectancy than men but the changes in life expectancy are occurring almost in parallel, with a small degree of convergence having taken place recently. Figure 12. Life Expectancy at Birth (years). Mozambique by Region
52,8
43,5
42,1
0 10 20 30 40 50 60
north
centre
south
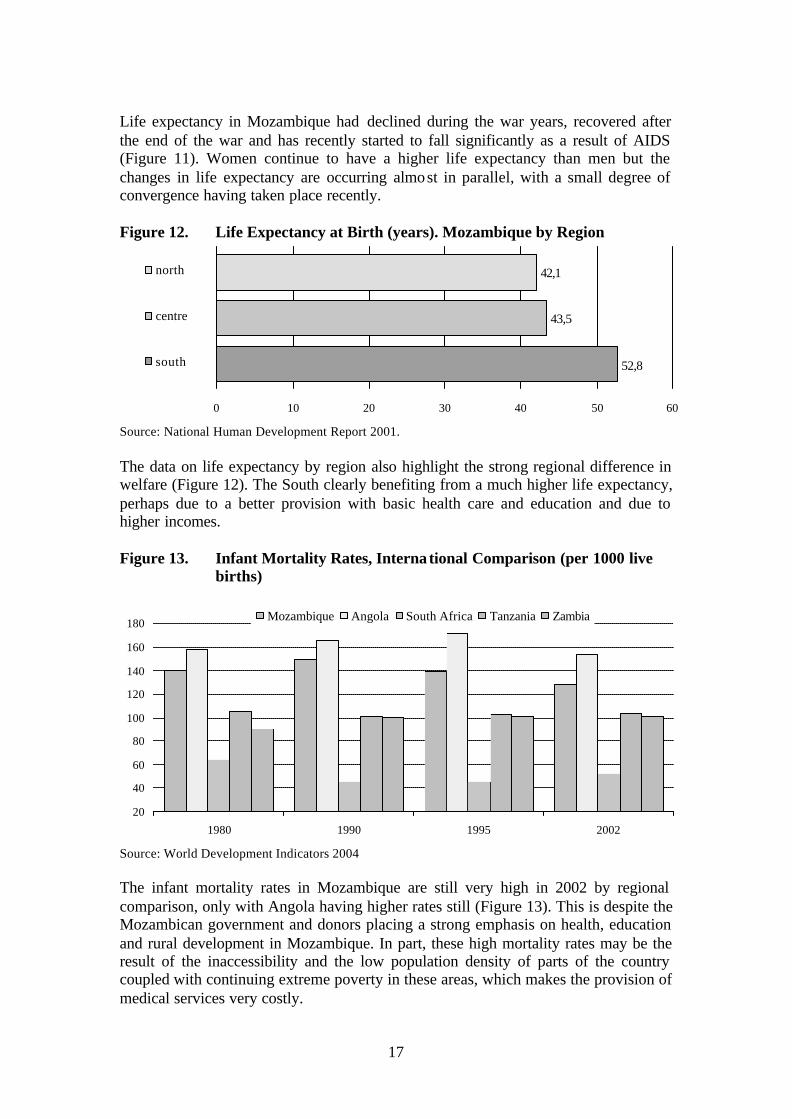
Source: National Human Development Report 2001. The data on life expectancy by region also highlight the strong regional difference in welfare (Figure 12). The South clearly benefiting from a much higher life expectancy, perhaps due to a better provision with basic health care and education and due to higher incomes. Figure 13. Infant Mortality Rates, International Comparison (per 1000 live
births)
20
40
60
80
100
120
140
160
180
1980 1990 1995 2002
Mozambique Angola South Africa Tanzania Zambia
Source: World Development Indicators 2004 The infant mortality rates in Mozambique are still very high in 2002 by regional comparison, only with Angola having higher rates still (Figure 13). This is despite the Mozambican government and donors placing a strong emphasis on health, education and rural development in Mozambique. In part, these high mortality rates may be the result of the inaccessibility and the low population density of parts of the country coupled with continuing extreme poverty in these areas, which makes the provision of medical services very costly.
18
Figure 14. HIV Prevalence, % aged 15-49 2003
0
5
10
15
20
25
Mozambique Angola South Africa Tanzania Zambia
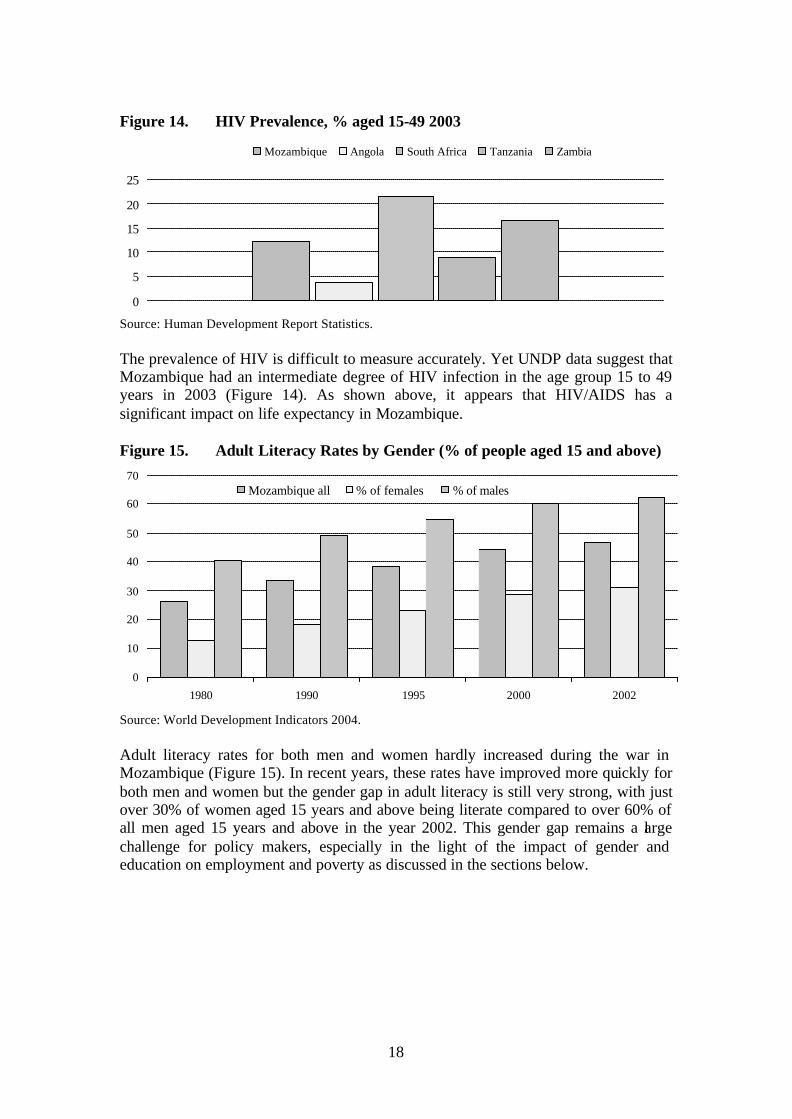
Source: Human Development Report Statistics. The prevalence of HIV is difficult to measure accurately. Yet UNDP data suggest that Mozambique had an intermediate degree of HIV infection in the age group 15 to 49 years in 2003 (Figure 14). As shown above, it appears that HIV/AIDS has a significant impact on life expectancy in Mozambique. Figure 15. Adult Literacy Rates by Gender (% of people aged 15 and above)
0
10
20
30
40
50
60
70
1980 1990 1995 2000 2002
Mozambique all % of females % of males
Source: World Development Indicators 2004. Adult literacy rates for both men and women hardly increased during the war in Mozambique (Figure 15). In recent years, these rates have improved more quickly for both men and women but the gender gap in adult literacy is still very strong, with just over 30% of women aged 15 years and above being literate compared to over 60% of all men aged 15 years and above in the year 2002. This gender gap remains a large challenge for policy makers, especially in the light of the impact of gender and education on employment and poverty as discussed in the sections below.
19
Figure 16. Adult Literacy Rates, International Comparison (% of people aged 15 and above)
20
30
40
50
60
70
80
90
1990 1991 1992 1993 1994 1995 1996 1997 1998 1999 2000 2001 2002
Mozambique all Tanzania South Africa Zambia
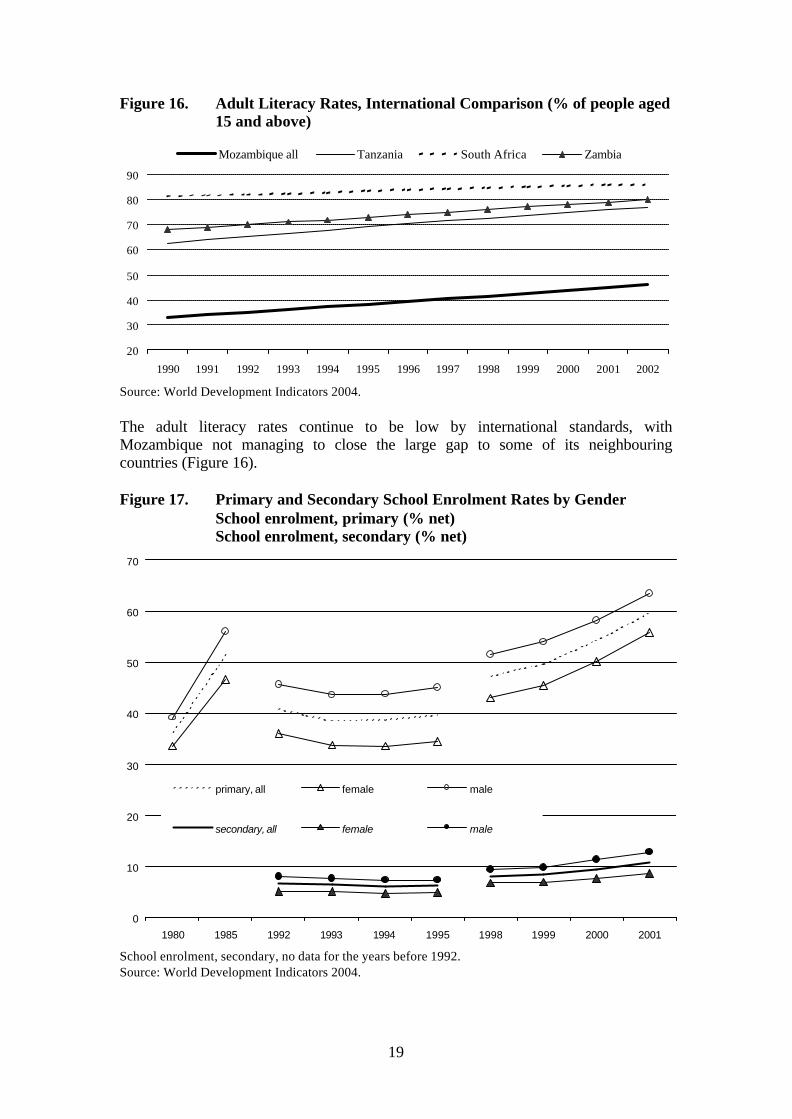
Source: World Development Indicators 2004. The adult literacy rates continue to be low by international standards, with Mozambique not managing to close the large gap to some of its neighbouring countries (Figure 16). Figure 17. Primary and Secondary School Enrolment Rates by Gender
School enrolment, primary (% net) School enrolment, secondary (% net)
0
10
20
30
40
50
60
70
1980 1985 1992 1993 1994 1995 1998 1999 2000 2001
primary, all female male
secondary, all female male
School enrolment, secondary, no data for the years before 1992. Source: World Development Indicators 2004.
20
Only in the year 2000 did Mozambique achieve primary school enrolment rates surpassing those of 1985 (Figure 17). The gender gap in primary school enrolment is still existent with more boys than girls attending school. In fact, the gap is slowly approaching the size of the gap which had existed in the pre-war year of 1980. Mozambique has a below average primary school enrolment with 54% compared to the average of all developing countries of 68% in the year 2002 (World Bank 2004). In addition, the secondary school enrolment rates for both girls and boys recently started to rise from a very low level. 2.3. Employment
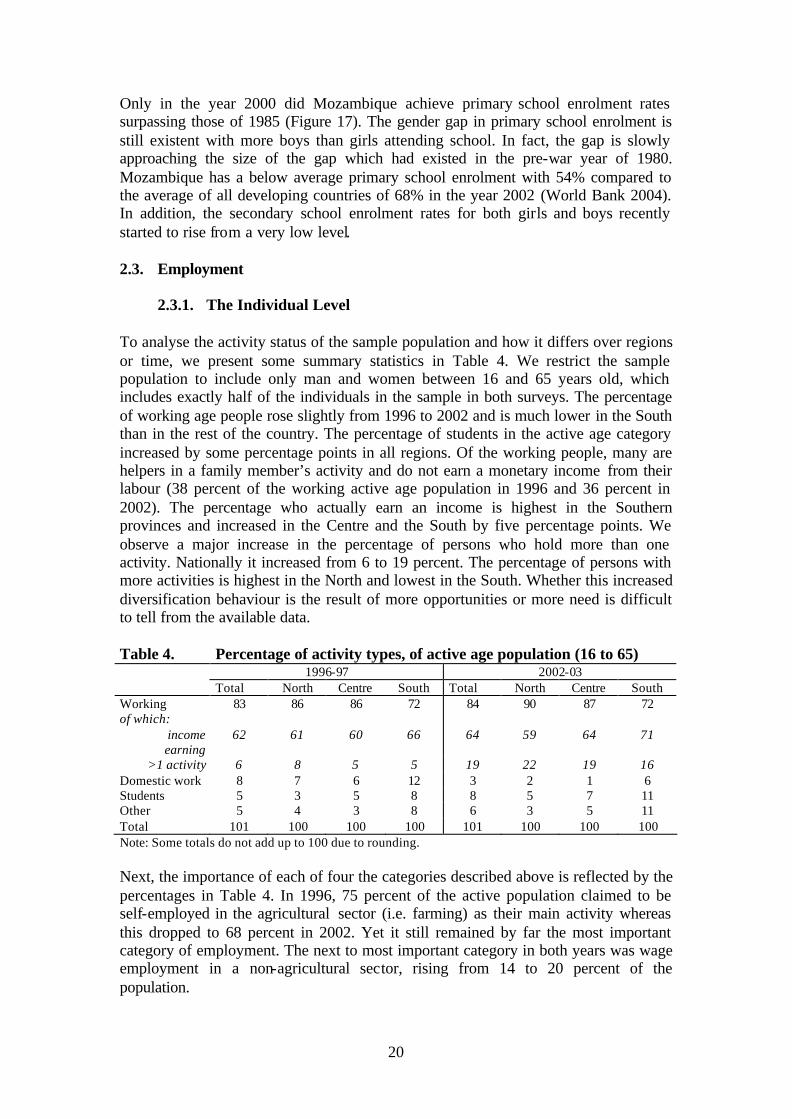
2.3.1. The Individual Level To analyse the activity status of the sample population and how it differs over regions or time, we present some summary statistics in Table 4. We restrict the sample population to include only man and women between 16 and 65 years old, which includes exactly half of the individuals in the sample in both surveys. The percentage of working age people rose slightly from 1996 to 2002 and is much lower in the South than in the rest of the country. The percentage of students in the active age category increased by some percentage points in all regions. Of the working people, many are helpers in a family member’s activity and do not earn a monetary income from their labour (38 percent of the working active age population in 1996 and 36 percent in 2002). The percentage who actually earn an income is highest in the Southern provinces and increased in the Centre and the South by five percentage points. We observe a major increase in the percentage of persons who hold more than one activity. Nationally it increased from 6 to 19 percent. The percentage of persons with more activities is highest in the North and lowest in the South. Whether this increased diversification behaviour is the result of more opportunities or more need is difficult to tell from the available data. Table 4. Percentage of activity types, of active age population (16 to 65) 1996-97 2002-03 Total North Centre South Total North Centre South Working 83 86 86 72 84 90 87 72 of which:
income earning
62 61 60 66 64 59 64 71
>1 activity 6 8 5 5 19 22 19 16 Domestic work 8 7 6 12 3 2 1 6 Students 5 3 5 8 8 5 7 11 Other 5 4 3 8 6 3 5 11 Total 101 100 100 100 101 100 100 100 Note: Some totals do not add up to 100 due to rounding. Next, the importance of each of four the categories described above is reflected by the percentages in Table 4. In 1996, 75 percent of the active population claimed to be self-employed in the agricultural sector (i.e. farming) as their main activity whereas this dropped to 68 percent in 2002. Yet it still remained by far the most important category of employment. The next to most important category in both years was wage employment in a non-agricultural sector, rising from 14 to 20 percent of the population.
21
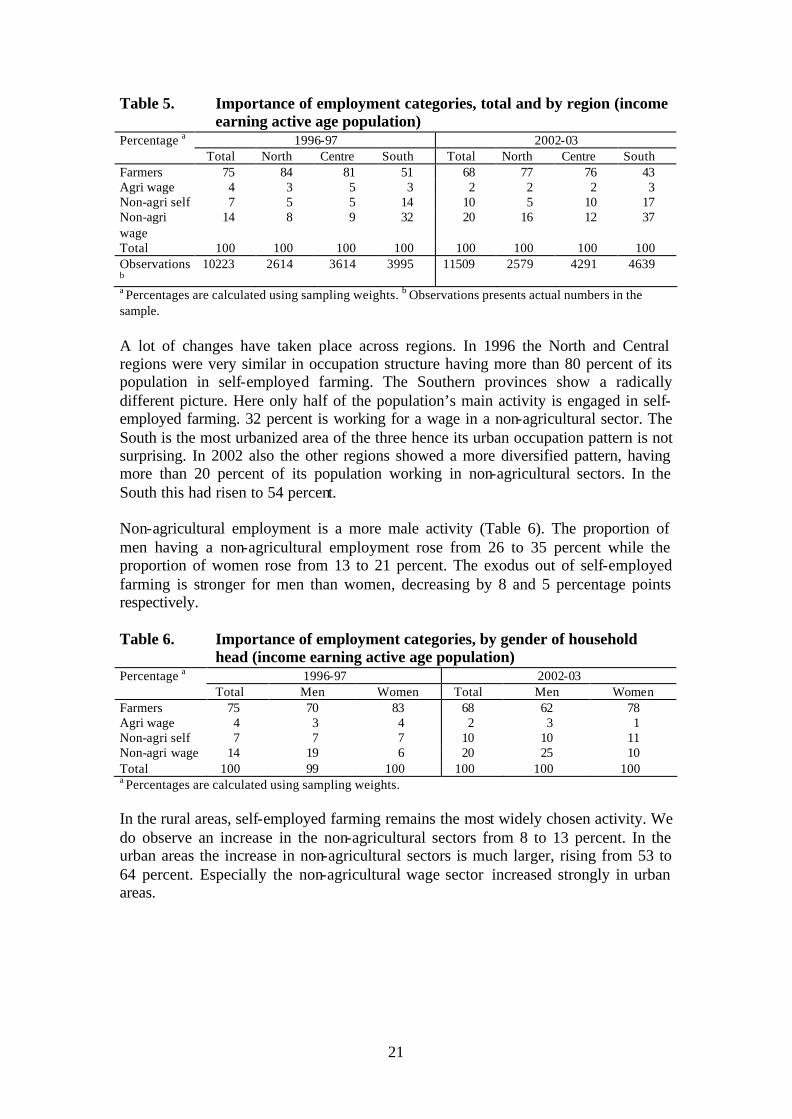
Table 5. Importance of employment categories, total and by region (income earning active age population)
Percentage a 1996-97 2002-03 Total North Centre South Total North Centre South Farmers 75 84 81 51 68 77 76 43 Agri wage 4 3 5 3 2 2 2 3 Non-agri self 7 5 5 14 10 5 10 17 Non-agri wage
14 8 9 32 20 16 12 37
Total 100 100 100 100 100 100 100 100 Observations b
10223 2614 3614 3995 11509 2579 4291 4639
a Percentages are calculated using sampling weights. b Observations presents actual numbers in the sample. A lot of changes have taken place across regions. In 1996 the North and Central regions were very similar in occupation structure having more than 80 percent of its population in self-employed farming. The Southern provinces show a radically different picture. Here only half of the population’s main activity is engaged in self-employed farming. 32 percent is working for a wage in a non-agricultural sector. The South is the most urbanized area of the three hence its urban occupation pattern is not surprising. In 2002 also the other regions showed a more diversified pattern, having more than 20 percent of its population working in non-agricultural sectors. In the South this had risen to 54 percent. Non-agricultural employment is a more male activity (Table 6). The proportion of men having a non-agricultural employment rose from 26 to 35 percent while the proportion of women rose from 13 to 21 percent. The exodus out of self-employed farming is stronger for men than women, decreasing by 8 and 5 percentage points respectively. Table 6. Importance of employment categories, by gender of household
head (income earning active age population) Percentage a 1996-97 2002-03 Total Men Women Total Men Women Farmers 75 70 83 68 62 78 Agri wage 4 3 4 2 3 1 Non-agri self 7 7 7 10 10 11 Non-agri wage 14 19 6 20 25 10 Total 100 99 100 100 100 100 a Percentages are calculated using sampling weights. In the rural areas, self-employed farming remains the most widely chosen activity. We do observe an increase in the non-agricultural sectors from 8 to 13 percent. In the urban areas the increase in non-agricultural sectors is much larger, rising from 53 to 64 percent. Especially the non-agricultural wage sector increased strongly in urban areas.
22
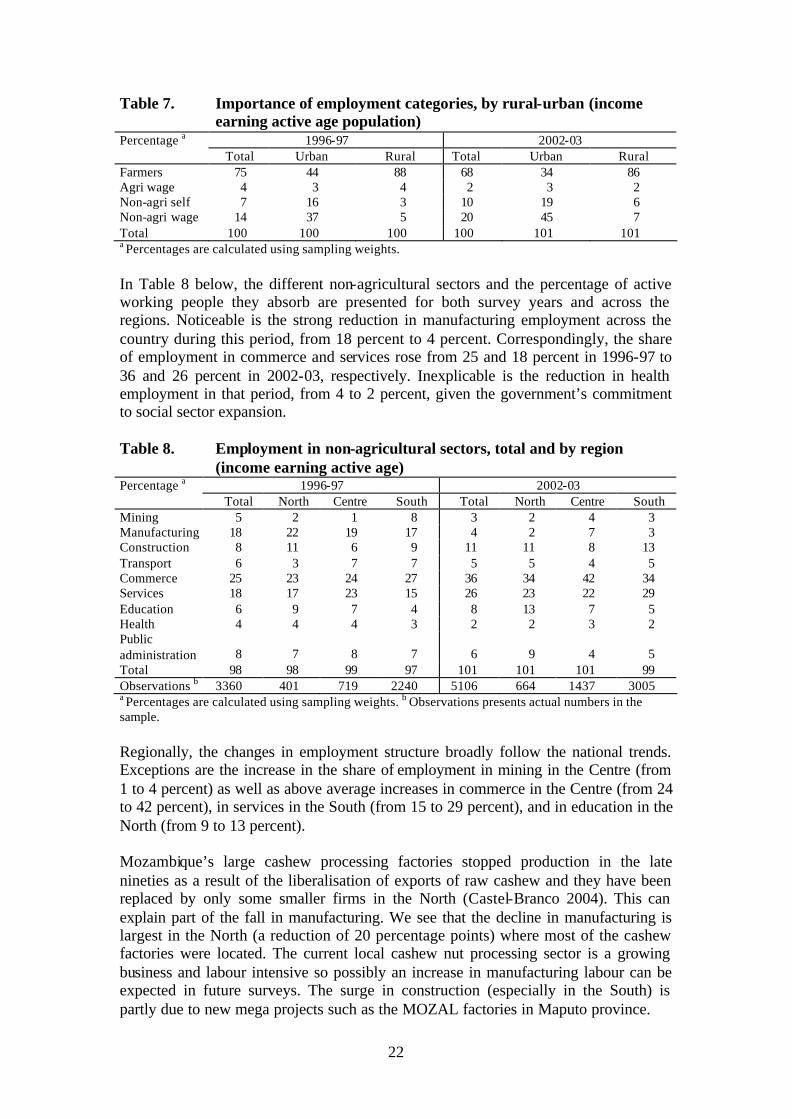
Table 7. Importance of employment categories, by rural-urban (income earning active age population)
Percentage a 1996-97 2002-03 Total Urban Rural Total Urban Rural Farmers 75 44 88 68 34 86 Agri wage 4 3 4 2 3 2 Non-agri self 7 16 3 10 19 6 Non-agri wage 14 37 5 20 45 7 Total 100 100 100 100 101 101 a Percentages are calculated using sampling weights. In Table 8 below, the different non-agricultural sectors and the percentage of active working people they absorb are presented for both survey years and across the regions. Noticeable is the strong reduction in manufacturing employment across the country during this period, from 18 percent to 4 percent. Correspondingly, the share of employment in commerce and services rose from 25 and 18 percent in 1996-97 to 36 and 26 percent in 2002-03, respectively. Inexplicable is the reduction in health employment in that period, from 4 to 2 percent, given the government’s commitment to social sector expansion. Table 8. Employment in non-agricultural sectors, total and by region
(income earning active age) Percentage a 1996-97 2002-03 Total North Centre South Total North Centre South Mining 5 2 1 8 3 2 4 3 Manufacturing 18 22 19 17 4 2 7 3 Construction 8 11 6 9 11 11 8 13 Transport 6 3 7 7 5 5 4 5 Commerce 25 23 24 27 36 34 42 34 Services 18 17 23 15 26 23 22 29 Education 6 9 7 4 8 13 7 5 Health 4 4 4 3 2 2 3 2 Public administration 8 7 8 7 6 9 4 5 Total 98 98 99 97 101 101 101 99 Observations b 3360 401 719 2240 5106 664 1437 3005 a Percentages are calculated using sampling weights. b Observations presents actual numbers in the sample. Regionally, the changes in employment structure broadly follow the national trends. Exceptions are the increase in the share of employment in mining in the Centre (from 1 to 4 percent) as well as above average increases in commerce in the Centre (from 24 to 42 percent), in services in the South (from 15 to 29 percent), and in education in the North (from 9 to 13 percent). Mozambique’s large cashew processing factories stopped production in the late nineties as a result of the liberalisation of exports of raw cashew and they have been replaced by only some smaller firms in the North (Castel-Branco 2004). This can explain part of the fall in manufacturing. We see that the decline in manufacturing is largest in the North (a reduction of 20 percentage points) where most of the cashew factories were located. The current local cashew nut processing sector is a growing business and labour intensive so possibly an increase in manufacturing labour can be expected in future surveys. The surge in construction (especially in the South) is partly due to new mega projects such as the MOZAL factories in Maputo province.
23
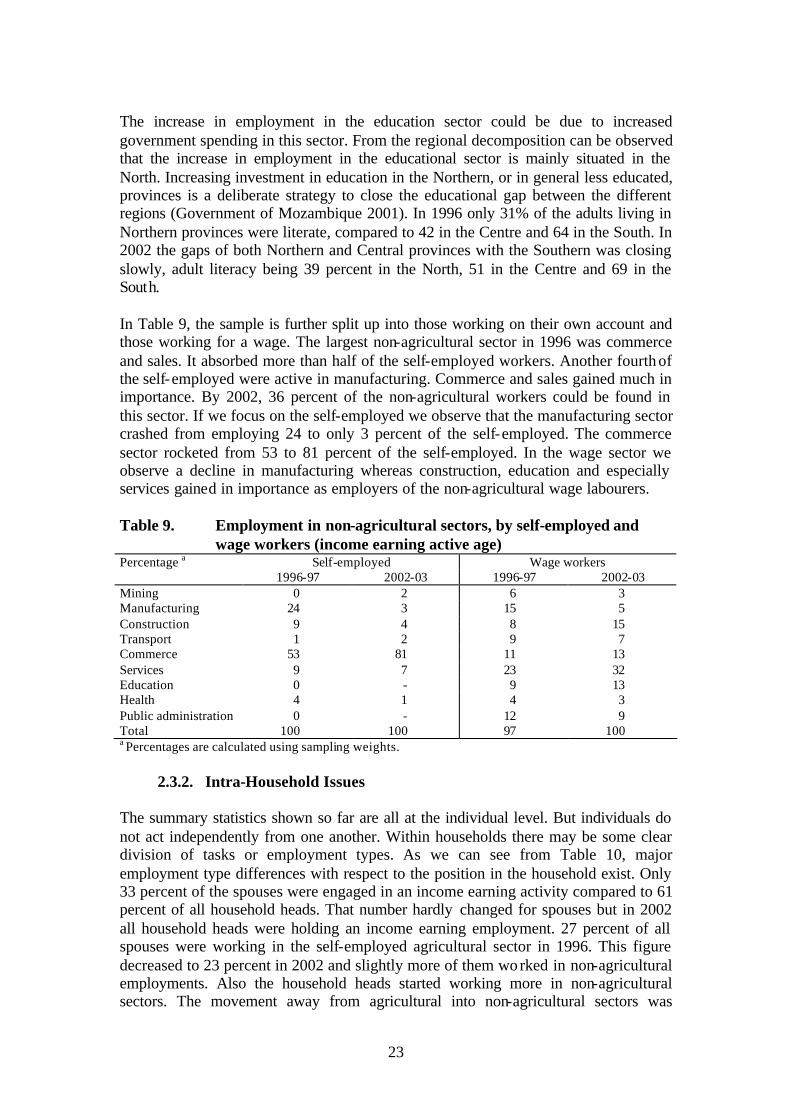
The increase in employment in the education sector could be due to increased government spending in this sector. From the regional decomposition can be observed that the increase in employment in the educational sector is mainly situated in the North. Increasing investment in education in the Northern, or in general less educated, provinces is a deliberate strategy to close the educational gap between the different regions (Government of Mozambique 2001). In 1996 only 31% of the adults living in Northern provinces were literate, compared to 42 in the Centre and 64 in the South. In 2002 the gaps of both Northern and Central provinces with the Southern was closing slowly, adult literacy being 39 percent in the North, 51 in the Centre and 69 in the South. In Table 9, the sample is further split up into those working on their own account and those working for a wage. The largest non-agricultural sector in 1996 was commerce and sales. It absorbed more than half of the self-employed workers. Another fourth of the self-employed were active in manufacturing. Commerce and sales gained much in importance. By 2002, 36 percent of the non-agricultural workers could be found in this sector. If we focus on the self-employed we observe that the manufacturing sector crashed from employing 24 to only 3 percent of the self-employed. The commerce sector rocketed from 53 to 81 percent of the self-employed. In the wage sector we observe a decline in manufacturing whereas construction, education and especially services gained in importance as employers of the non-agricultural wage labourers. Table 9. Employment in non-agricultural sectors, by self-employed and
wage workers (income earning active age) Percentage a Self-employed Wage workers 1996-97 2002-03 1996-97 2002-03 Mining 0 2 6 3 Manufacturing 24 3 15 5 Construction 9 4 8 15 Transport 1 2 9 7 Commerce 53 81 11 13 Services 9 7 23 32 Education 0 - 9 13 Health 4 1 4 3 Public administration 0 - 12 9 Total 100 100 97 100 a Percentages are calculated using sampling weights. 2.3.2. Intra-Household Issues The summary statistics shown so far are all at the individual level. But individuals do not act independently from one another. Within households there may be some clear division of tasks or employment types. As we can see from Table 10, major employment type differences with respect to the position in the household exist. Only 33 percent of the spouses were engaged in an income earning activity compared to 61 percent of all household heads. That number hardly changed for spouses but in 2002 all household heads were holding an income earning employment. 27 percent of all spouses were working in the self-employed agricultural sector in 1996. This figure decreased to 23 percent in 2002 and slightly more of them worked in non-agricultural employments. Also the household heads started working more in non-agricultural sectors. The movement away from agricultural into non-agricultural sectors was
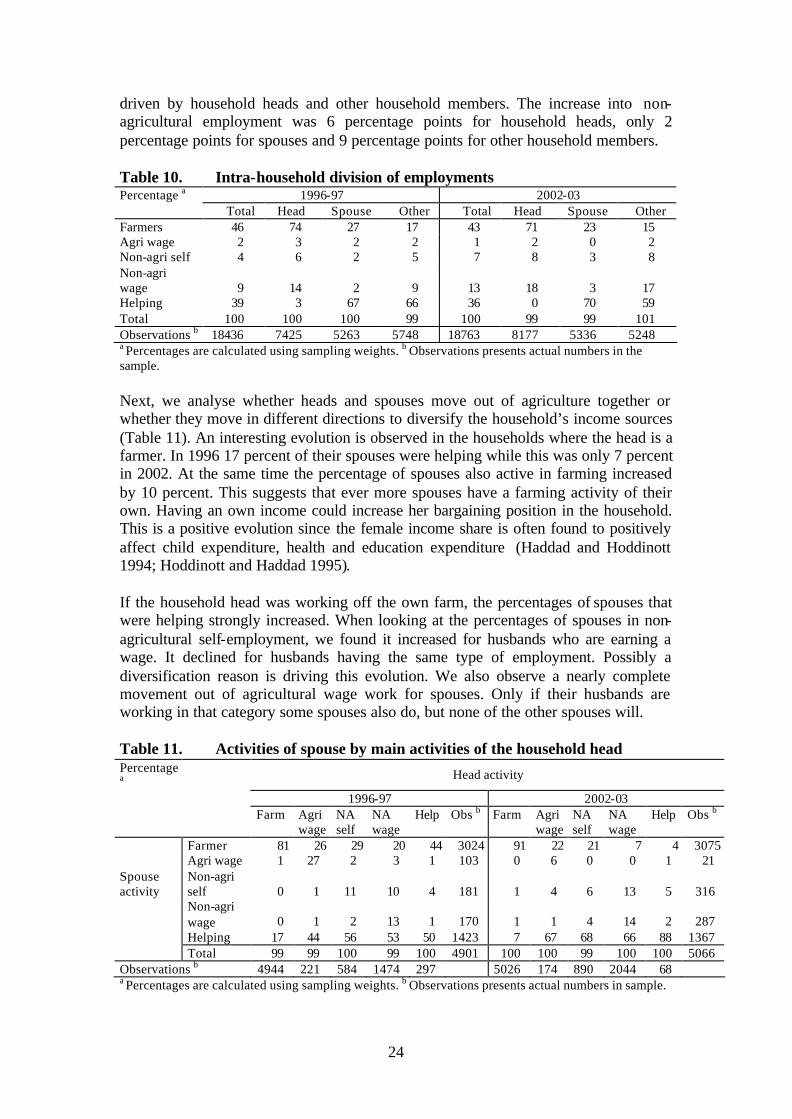
24
driven by household heads and other household members. The increase into non-agricultural employment was 6 percentage points for household heads, only 2 percentage points for spouses and 9 percentage points for other household members. Table 10. Intra-household division of employments Percentage a 1996-97 2002-03 Total Head Spouse Other Total Head Spouse Other Farmers 46 74 27 17 43 71 23 15 Agri wage 2 3 2 2 1 2 0 2 Non-agri self 4 6 2 5 7 8 3 8 Non-agri wage 9 14 2 9 13 18 3 17 Helping 39 3 67 66 36 0 70 59 Total 100 100 100 99 100 99 99 101 Observations b 18436 7425 5263 5748 18763 8177 5336 5248 a Percentages are calculated using sampling weights. b Observations presents actual numbers in the sample. Next, we analyse whether heads and spouses move out of agriculture together or whether they move in different directions to diversify the household’s income sources (Table 11). An interesting evolution is observed in the households where the head is a farmer. In 1996 17 percent of their spouses were helping while this was only 7 percent in 2002. At the same time the percentage of spouses also active in farming increased by 10 percent. This suggests that ever more spouses have a farming activity of their own. Having an own income could increase her bargaining position in the household. This is a positive evolution since the female income share is often found to positively affect child expenditure, health and education expenditure (Haddad and Hoddinott 1994; Hoddinott and Haddad 1995). If the household head was working off the own farm, the percentages of spouses that were helping strongly increased. When looking at the percentages of spouses in non-agricultural self-employment, we found it increased for husbands who are earning a wage. It declined for husbands having the same type of employment. Possibly a diversification reason is driving this evolution. We also observe a nearly complete movement out of agricultural wage work for spouses. Only if their husbands are working in that category some spouses also do, but none of the other spouses will. Table 11. Activities of spouse by main activities of the household head Percentage a
Head activity 1996-97 2002-03 Farm Agri
wage NA self
NA wage
Help Obs b Farm Agri wage
NA self
NA wage
Help Obs b
Farmer 81 26 29 20 44 3024 91 22 21 7 4 3075 Agri wage 1 27 2 3 1 103 0 6 0 0 1 21 Spouse activity
Non-agri self 0 1 11 10 4 181 1 4 6 13 5 316
Non-agri wage 0 1 2 13 1 170 1 1 4 14 2 287
Helping 17 44 56 53 50 1423 7 67 68 66 88 1367 Total 99 99 100 99 100 4901 100 100 99 100 100 5066 Observations b 4944 221 584 1474 297 5026 174 890 2044 68 a Percentages are calculated using sampling weights. b Observations presents actual numbers in sample.
25
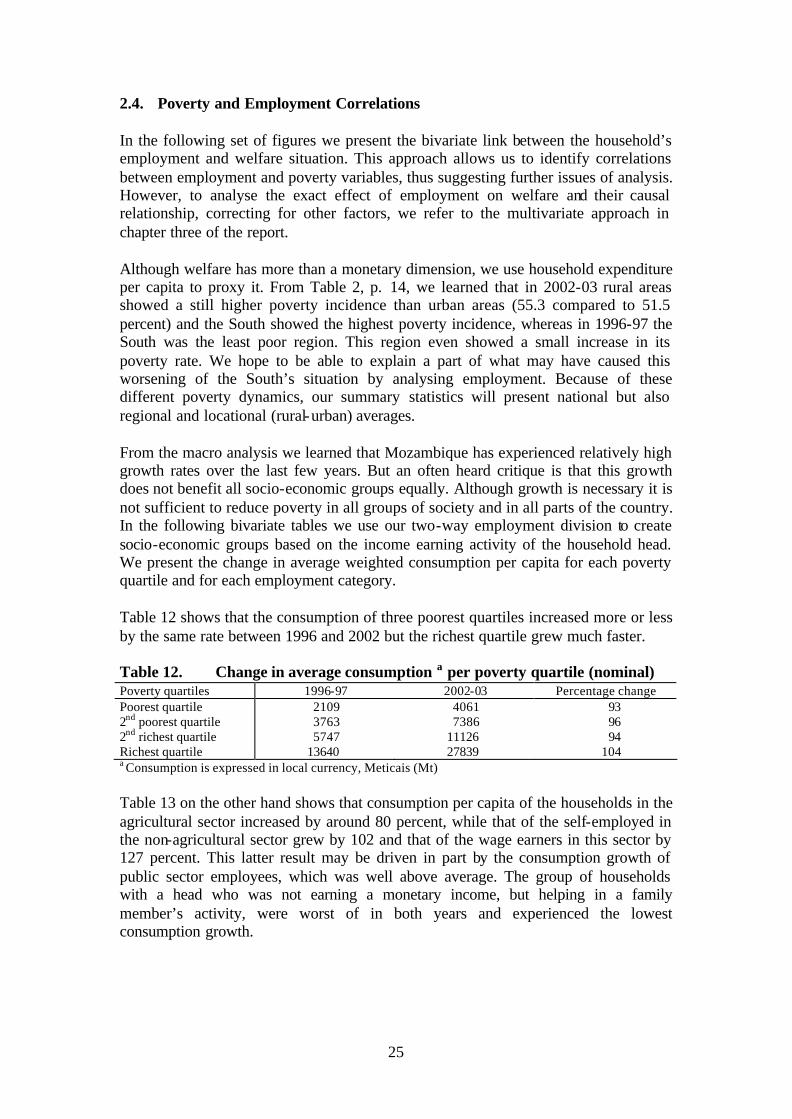
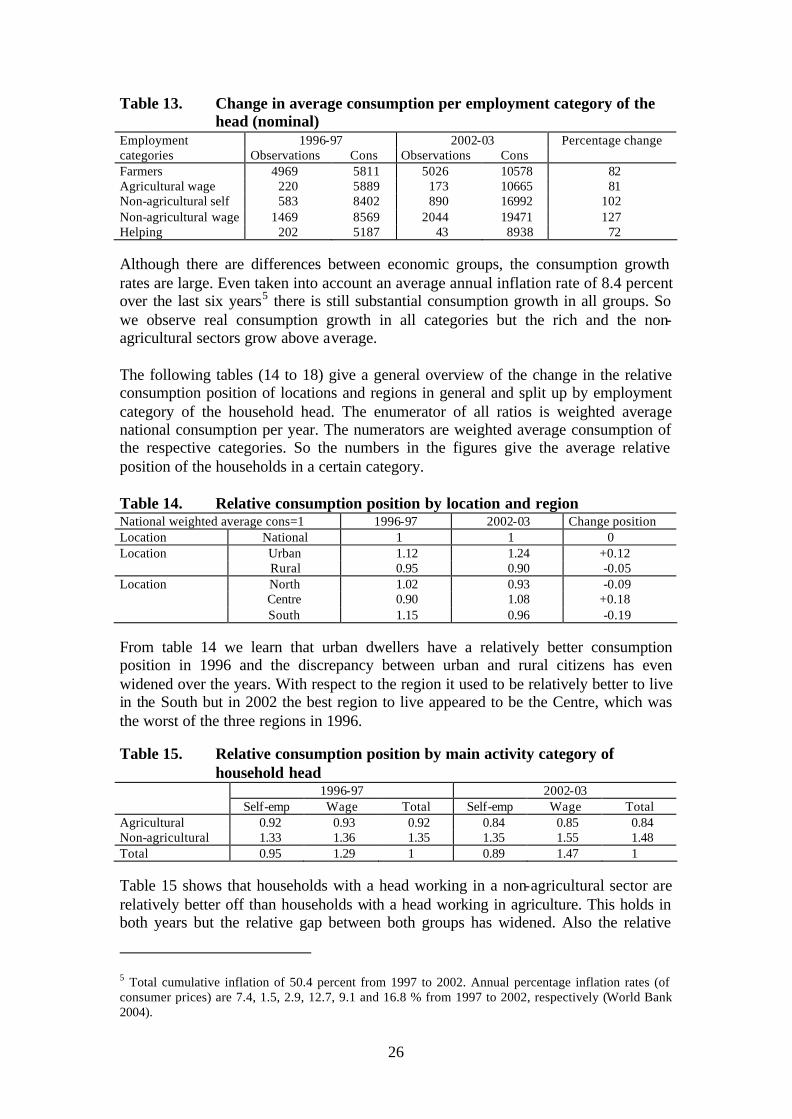
2.4. Poverty and Employment Correlations In the following set of figures we present the bivariate link between the household’s employment and welfare situation. This approach allows us to identify correlations between employment and poverty variables, thus suggesting further issues of analysis. However, to analyse the exact effect of employment on welfare and their causal relationship, correcting for other factors, we refer to the multivariate approach in chapter three of the report. Although welfare has more than a monetary dimension, we use household expenditure per capita to proxy it. From Table 2, p. 14, we learned that in 2002-03 rural areas showed a still higher poverty incidence than urban areas (55.3 compared to 51.5 percent) and the South showed the highest poverty incidence, whereas in 1996-97 the South was the least poor region. This region even showed a small increase in its poverty rate. We hope to be able to explain a part of what may have caused this worsening of the South’s situation by analysing employment. Because of these different poverty dynamics, our summary statistics will present national but also regional and locational (rural-urban) averages. From the macro analysis we learned that Mozambique has experienced relatively high growth rates over the last few years. But an often heard critique is that this growth does not benefit all socio-economic groups equally. Although growth is necessary it is not sufficient to reduce poverty in all groups of society and in all parts of the country. In the following bivariate tables we use our two-way employment division to create socio-economic groups based on the income earning activity of the household head. We present the change in average weighted consumption per capita for each poverty quartile and for each employment category. Table 12 shows that the consumption of three poorest quartiles increased more or less by the same rate between 1996 and 2002 but the richest quartile grew much faster. Table 12. Change in average consumption a per poverty quartile (nominal) Poverty quartiles 1996-97 2002-03 Percentage change Poorest quartile 2109 4061 93 2nd poorest quartile 3763 7386 96 2nd richest quartile 5747 11126 94 Richest quartile 13640 27839 104 a Consumption is expressed in local currency, Meticais (Mt) Table 13 on the other hand shows that consumption per capita of the households in the agricultural sector increased by around 80 percent, while that of the self-employed in the non-agricultural sector grew by 102 and that of the wage earners in this sector by 127 percent. This latter result may be driven in part by the consumption growth of public sector employees, which was well above average. The group of households with a head who was not earning a monetary income, but helping in a family member’s activity, were worst of in both years and experienced the lowest consumption growth.
26
Table 13. Change in average consumption per employment category of the head (nominal)
1996-97 2002-03 Employment categories Observations Cons Observations Cons
Percentage change
Farmers 4969 5811 5026 10578 82 Agricultural wage 220 5889 173 10665 81 Non-agricultural self 583 8402 890 16992 102 Non-agricultural wage 1469 8569 2044 19471 127 Helping 202 5187 43 8938 72 Although there are differences between economic groups, the consumption growth rates are large. Even taken into account an average annual inflation rate of 8.4 percent over the last six years5 there is still substantial consumption growth in all groups. So we observe real consumption growth in all categories but the rich and the non-agricultural sectors grow above average. The following tables (14 to 18) give a general overview of the change in the relative consumption position of locations and regions in general and split up by employment category of the household head. The enumerator of all ratios is weighted average national consumption per year. The numerators are weighted average consumption of the respective categories. So the numbers in the figures give the average relative position of the households in a certain category. Table 14. Relative consumption position by location and region National weighted average cons=1 1996-97 2002-03 Change position Location National 1 1 0 Location Urban 1.12 1.24 +0.12 Rural 0.95 0.90 -0.05 Location North 1.02 0.93 -0.09 Centre 0.90 1.08 +0.18 South 1.15 0.96 -0.19 From table 14 we learn that urban dwellers have a relatively better consumption position in 1996 and the discrepancy between urban and rural citizens has even widened over the years. With respect to the region it used to be relatively better to live in the South but in 2002 the best region to live appeared to be the Centre, which was the worst of the three regions in 1996. Table 15. Relative consumption position by main activity category of
household head 1996-97 2002-03
Self-emp Wage Total Self-emp Wage Total Agricultural 0.92 0.93 0.92 0.84 0.85 0.84 Non-agricultural 1.33 1.36 1.35 1.35 1.55 1.48 Total 0.95 1.29 1 0.89 1.47 1 Table 15 shows that households with a head working in a non-agricultural sector are relatively better off than households with a head working in agriculture. This holds in both years but the relative gap between both groups has widened. Also the relative
5 Total cumulative inflation of 50.4 percent from 1997 to 2002. Annual percentage inflation rates (of consumer prices) are 7.4, 1.5, 2.9, 12.7, 9.1 and 16.8 % from 1997 to 2002, respectively (World Bank 2004).
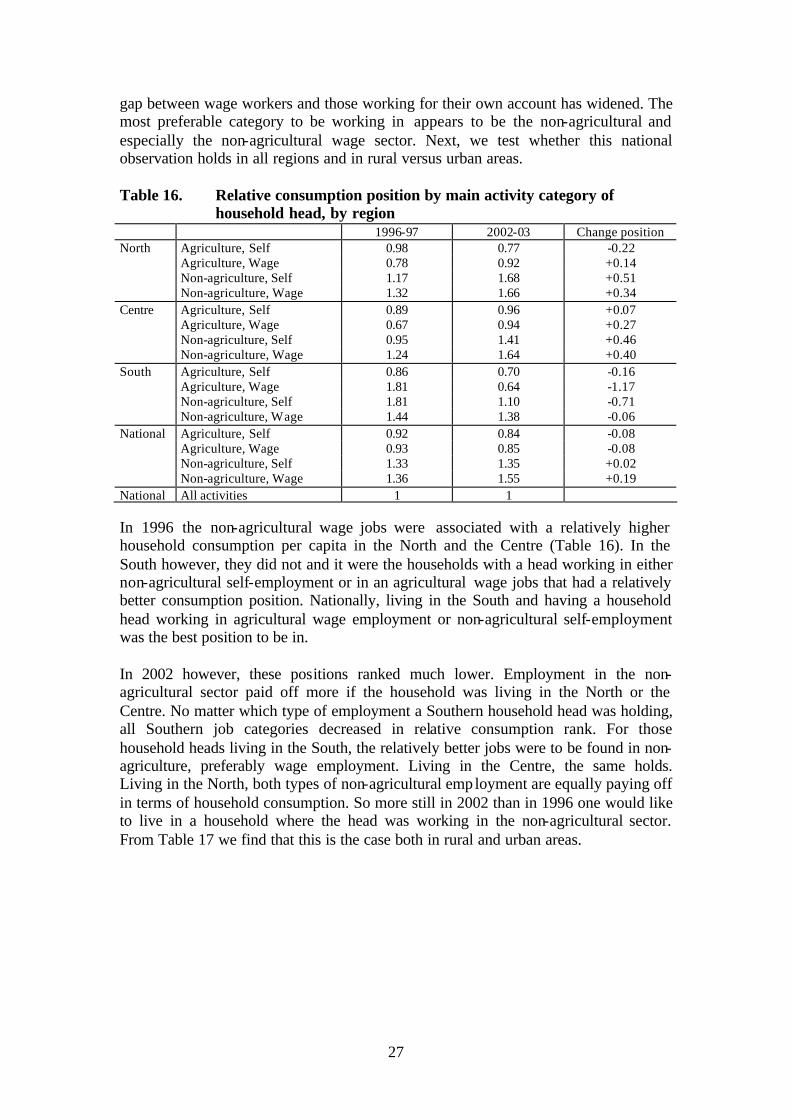
27
gap between wage workers and those working for their own account has widened. The most preferable category to be working in appears to be the non-agricultural and especially the non-agricultural wage sector. Next, we test whether this national observation holds in all regions and in rural versus urban areas. Table 16. Relative consumption position by main activity category of
household head, by region 1996-97 2002-03 Change position North Agriculture, Self 0.98 0.77 -0.22 Agriculture, Wage 0.78 0.92 +0.14 Non-agriculture, Self 1.17 1.68 +0.51 Non-agriculture, Wage 1.32 1.66 +0.34 Centre Agriculture, Self 0.89 0.96 +0.07 Agriculture, Wage 0.67 0.94 +0.27 Non-agriculture, Self 0.95 1.41 +0.46 Non-agriculture, Wage 1.24 1.64 +0.40 South Agriculture, Self 0.86 0.70 -0.16 Agriculture, Wage 1.81 0.64 -1.17 Non-agriculture, Self 1.81 1.10 -0.71 Non-agriculture, Wage 1.44 1.38 -0.06 National Agriculture, Self 0.92 0.84 -0.08 Agriculture, Wage 0.93 0.85 -0.08 Non-agriculture, Self 1.33 1.35 +0.02 Non-agriculture, Wage 1.36 1.55 +0.19 National All activities 1 1 In 1996 the non-agricultural wage jobs were associated with a relatively higher household consumption per capita in the North and the Centre (Table 16). In the South however, they did not and it were the households with a head working in either non-agricultural self-employment or in an agricultural wage jobs that had a relatively better consumption position. Nationally, living in the South and having a household head working in agricultural wage employment or non-agricultural self-employment was the best position to be in. In 2002 however, these positions ranked much lower. Employment in the non-agricultural sector paid off more if the household was living in the North or the Centre. No matter which type of employment a Southern household head was holding, all Southern job categories decreased in relative consumption rank. For those household heads living in the South, the relatively better jobs were to be found in non-agriculture, preferably wage employment. Living in the Centre, the same holds. Living in the North, both types of non-agricultural employment are equally paying off in terms of household consumption. So more still in 2002 than in 1996 one would like to live in a household where the head was working in the non-agricultural sector. From Table 17 we find that this is the case both in rural and urban areas.
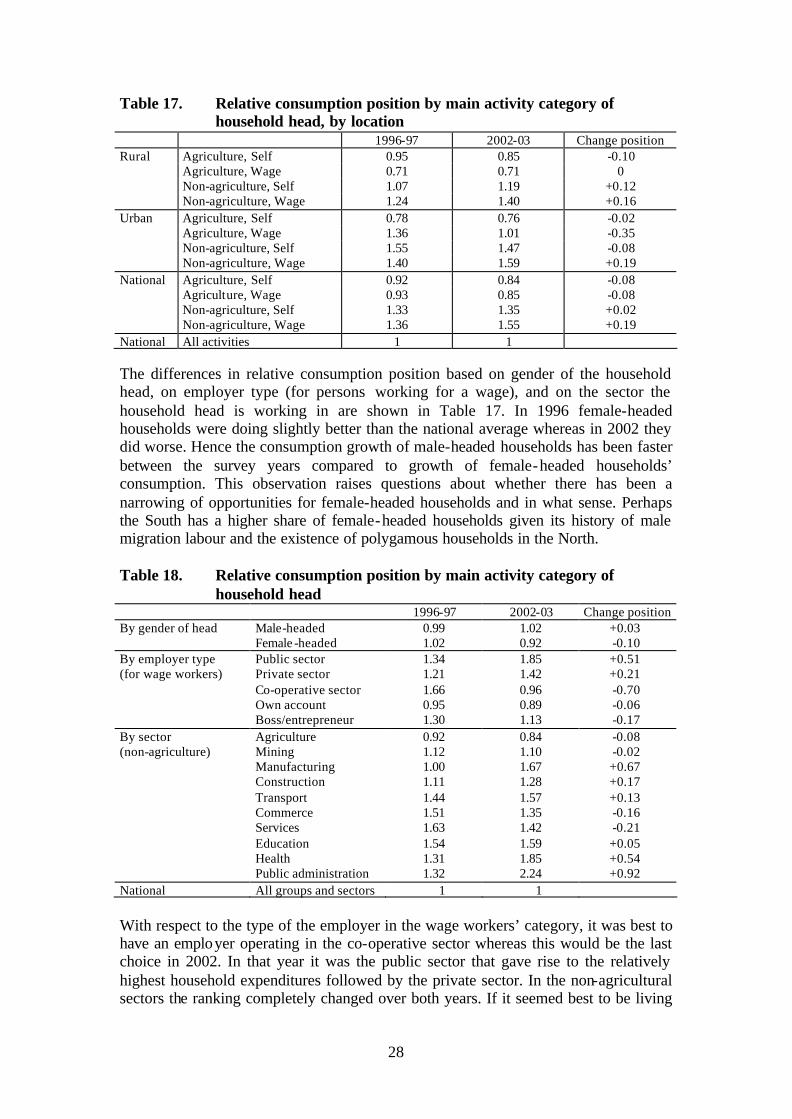
28
Table 17. Relative consumption position by main activity category of household head, by location
1996-97 2002-03 Change position Rural Agriculture, Self 0.95 0.85 -0.10 Agriculture, Wage 0.71 0.71 0 Non-agriculture, Self 1.07 1.19 +0.12 Non-agriculture, Wage 1.24 1.40 +0.16 Urban Agriculture, Self 0.78 0.76 -0.02 Agriculture, Wage 1.36 1.01 -0.35 Non-agriculture, Self 1.55 1.47 -0.08 Non-agriculture, Wage 1.40 1.59 +0.19 National Agriculture, Self 0.92 0.84 -0.08 Agriculture, Wage 0.93 0.85 -0.08 Non-agriculture, Self 1.33 1.35 +0.02 Non-agriculture, Wage 1.36 1.55 +0.19 National All activities 1 1 The differences in relative consumption position based on gender of the household head, on employer type (for persons working for a wage), and on the sector the household head is working in are shown in Table 17. In 1996 female-headed households were doing slightly better than the national average whereas in 2002 they did worse. Hence the consumption growth of male-headed households has been faster between the survey years compared to growth of female-headed households’ consumption. This observation raises questions about whether there has been a narrowing of opportunities for female-headed households and in what sense. Perhaps the South has a higher share of female-headed households given its history of male migration labour and the existence of polygamous households in the North. Table 18. Relative consumption position by main activity category of
household head 1996-97 2002-03 Change position By gender of head Male-headed 0.99 1.02 +0.03 Female -headed 1.02 0.92 -0.10 By employer type Public sector 1.34 1.85 +0.51 (for wage workers) Private sector 1.21 1.42 +0.21 Co-operative sector 1.66 0.96 -0.70 Own account 0.95 0.89 -0.06 Boss/entrepreneur 1.30 1.13 -0.17 By sector Agriculture 0.92 0.84 -0.08 (non-agriculture) Mining 1.12 1.10 -0.02 Manufacturing 1.00 1.67 +0.67 Construction 1.11 1.28 +0.17 Transport 1.44 1.57 +0.13 Commerce 1.51 1.35 -0.16 Services 1.63 1.42 -0.21 Education 1.54 1.59 +0.05 Health 1.31 1.85 +0.54 Public administration 1.32 2.24 +0.92 National All groups and sectors 1 1 With respect to the type of the employer in the wage workers’ category, it was best to have an employer operating in the co-operative sector whereas this would be the last choice in 2002. In that year it was the public sector that gave rise to the relatively highest household expenditures followed by the private sector. In the non-agricultural sectors the ranking completely changed over both years. If it seemed best to be living
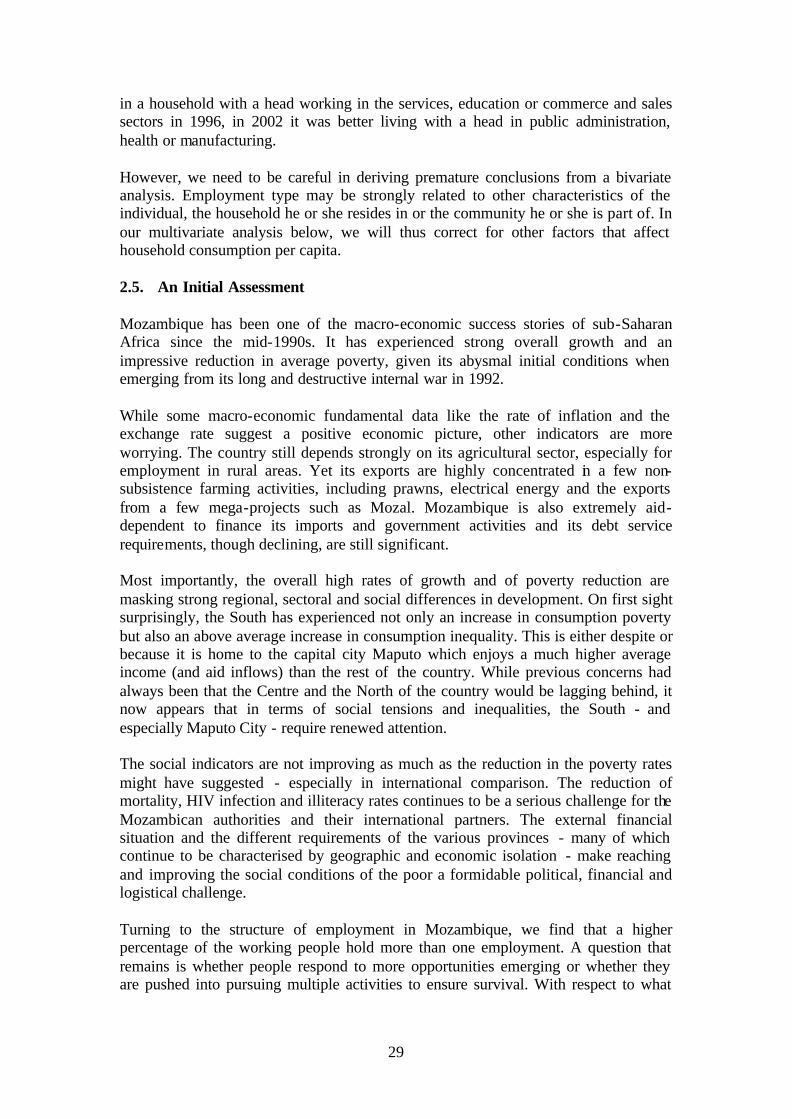
29
in a household with a head working in the services, education or commerce and sales sectors in 1996, in 2002 it was better living with a head in public administration, health or manufacturing. However, we need to be careful in deriving premature conclusions from a bivariate analysis. Employment type may be strongly related to other characteristics of the individual, the household he or she resides in or the community he or she is part of. In our multivariate analysis below, we will thus correct for other factors that affect household consumption per capita. 2.5. An Initial Assessment Mozambique has been one of the macro-economic success stories of sub-Saharan Africa since the mid-1990s. It has experienced strong overall growth and an impressive reduction in average poverty, given its abysmal initial conditions when emerging from its long and destructive internal war in 1992. While some macro-economic fundamental data like the rate of inflation and the exchange rate suggest a positive economic picture, other indicators are more worrying. The country still depends strongly on its agricultural sector, especially for employment in rural areas. Yet its exports are highly concentrated in a few non-subsistence farming activities, including prawns, electrical energy and the exports from a few mega-projects such as Mozal. Mozambique is also extremely aid-dependent to finance its imports and government activities and its debt service requirements, though declining, are still significant. Most importantly, the overall high rates of growth and of poverty reduction are masking strong regional, sectoral and social differences in development. On first sight surprisingly, the South has experienced not only an increase in consumption poverty but also an above average increase in consumption inequality. This is either despite or because it is home to the capital city Maputo which enjoys a much higher average income (and aid inflows) than the rest of the country. While previous concerns had always been that the Centre and the North of the country would be lagging behind, it now appears that in terms of social tensions and inequalities, the South - and especially Maputo City - require renewed attention. The social indicators are not improving as much as the reduction in the poverty rates might have suggested - especially in international comparison. The reduction of mortality, HIV infection and illiteracy rates continues to be a serious challenge for the Mozambican authorities and their international partners. The external financial situation and the different requirements of the various provinces - many of which continue to be characterised by geographic and economic isolation - make reaching and improving the social conditions of the poor a formidable political, financial and logistical challenge. Turning to the structure of employment in Mozambique, we find that a higher percentage of the working people hold more than one employment. A question that remains is whether people respond to more opportunities emerging or whether they are pushed into pursuing multiple activities to ensure survival. With respect to what
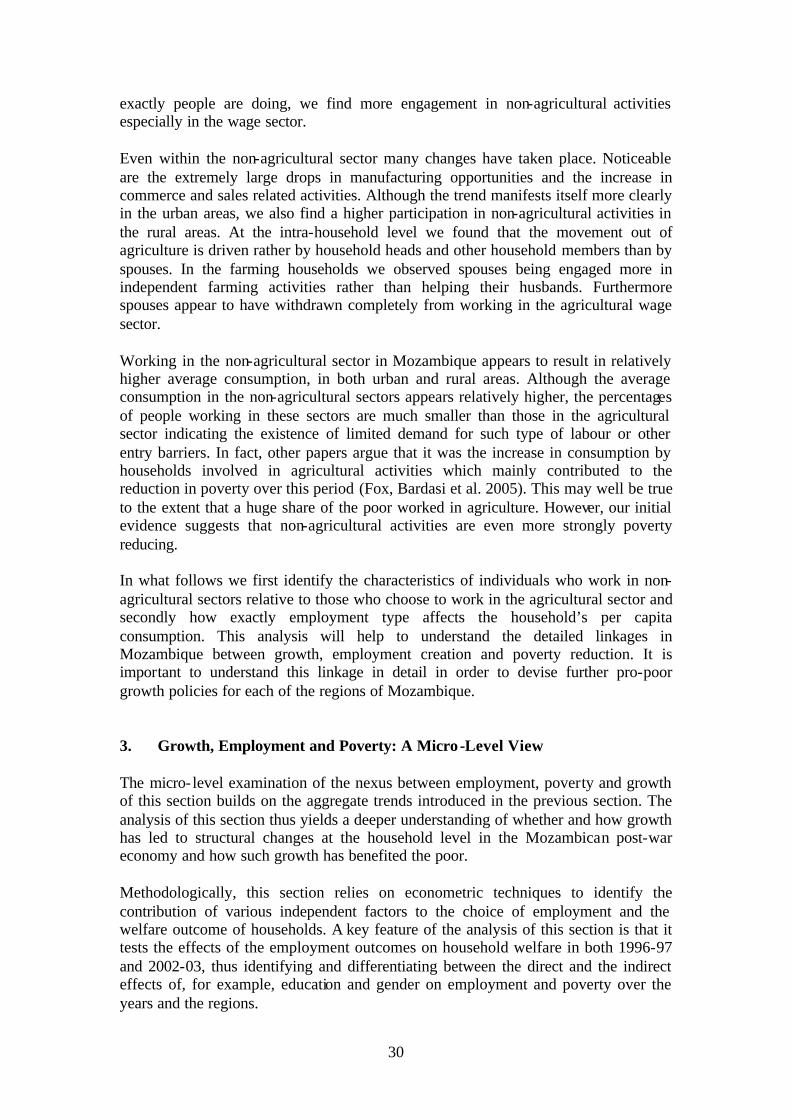
30
exactly people are doing, we find more engagement in non-agricultural activities especially in the wage sector. Even within the non-agricultural sector many changes have taken place. Noticeable are the extremely large drops in manufacturing opportunities and the increase in commerce and sales related activities. Although the trend manifests itself more clearly in the urban areas, we also find a higher participation in non-agricultural activities in the rural areas. At the intra-household level we found that the movement out of agriculture is driven rather by household heads and other household members than by spouses. In the farming households we observed spouses being engaged more in independent farming activities rather than helping their husbands. Furthermore spouses appear to have withdrawn completely from working in the agricultural wage sector. Working in the non-agricultural sector in Mozambique appears to result in relatively higher average consumption, in both urban and rural areas. Although the average consumption in the non-agricultural sectors appears relatively higher, the percentages of people working in these sectors are much smaller than those in the agricultural sector indicating the existence of limited demand for such type of labour or other entry barriers. In fact, other papers argue that it was the increase in consumption by households involved in agricultural activities which mainly contributed to the reduction in poverty over this period (Fox, Bardasi et al. 2005). This may well be true to the extent that a huge share of the poor worked in agriculture. However, our initial evidence suggests that non-agricultural activities are even more strongly poverty reducing. In what follows we first identify the characteristics of individuals who work in non-agricultural sectors relative to those who choose to work in the agricultural sector and secondly how exactly employment type affects the household’s per capita consumption. This analysis will help to understand the detailed linkages in Mozambique between growth, employment creation and poverty reduction. It is important to understand this linkage in detail in order to devise further pro-poor growth policies for each of the regions of Mozambique. 3. Growth, Employment and Poverty: A Micro-Level View The micro- level examination of the nexus between employment, poverty and growth of this section builds on the aggregate trends introduced in the previous section. The analysis of this section thus yields a deeper understanding of whether and how growth has led to structural changes at the household level in the Mozambican post-war economy and how such growth has benefited the poor. Methodologically, this section relies on econometric techniques to identify the contribution of various independent factors to the choice of employment and the welfare outcome of households. A key feature of the analysis of this section is that it tests the effects of the employment outcomes on household welfare in both 1996-97 and 2002-03, thus identifying and differentiating between the direct and the indirect effects of, for example, education and gender on employment and poverty over the years and the regions.
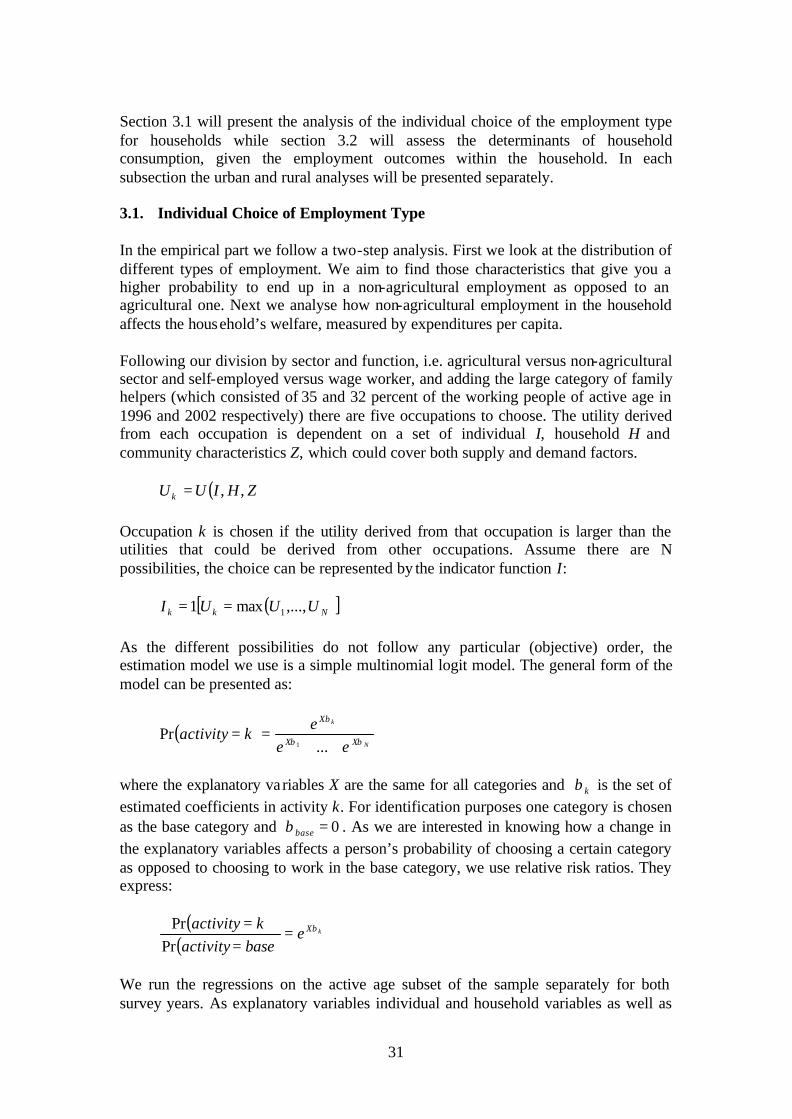
31
Section 3.1 will present the analysis of the individual choice of the employment type for households while section 3.2 will assess the determinants of household consumption, given the employment outcomes within the household. In each subsection the urban and rural analyses will be presented separately. 3.1. Individual Choice of Employment Type In the empirical part we follow a two-step analysis. First we look at the distribution of different types of employment. We aim to find those characteristics that give you a higher probability to end up in a non-agricultural employment as opposed to an agricultural one. Next we analyse how non-agricultural employment in the household affects the household’s welfare, measured by expenditures per capita. Following our division by sector and function, i.e. agricultural versus non-agricultural sector and self-employed versus wage worker, and adding the large category of family helpers (which consisted of 35 and 32 percent of the working people of active age in 1996 and 2002 respectively) there are five occupations to choose. The utility derived from each occupation is dependent on a set of individual I, household H and community characteristics Z, which could cover both supply and demand factors. ( )ZHIUU k ,,= Occupation k is chosen if the utility derived from that occupation is larger than the utilities that could be derived from other occupations. Assume there are N possibilities, the choice can be represented by the indicator function I: ( )[ ]Nkk UUUI ,...,max1 1== As the different possibilities do not follow any particular (objective) order, the estimation model we use is a simple multinomial logit model. The general form of the model can be presented as:
( )N
k
XX
X
eee
kactivityββ
β
++==
...Pr
1 where the explanatory va riables X are the same for all categories and kβ is the set of estimated coefficients in activity k. For identification purposes one category is chosen as the base category and 0=baseβ . As we are interested in knowing how a change in the explanatory variables affects a person’s probability of choosing a certain category as opposed to choosing to work in the base category, we use relative risk ratios. They express:
( )
( )kXe
baseactivitykactivity β=
==
PrPr
We run the regressions on the active age subset of the sample separately for both survey years. As explanatory variables individual and household variables as well as
32
regional dummies are included. At the individual level we use variables that represent human capital. Age and age squared are used to reflect experience. Dummy variables indicating whether the person has finished a certain level of education, more specifically one dummy for finishing primary school and one for secondary, are included. Also the gender of the person, marital status (being with or without a partner present), permanent health situation (whether the person has any disabilities), and whether the person is a household head are included to capture differential access to activities and culturally determined gender roles. At the household level we include the gender of the household head for the same reasons of differences in opportunities or culturally determined gender roles. The number of children (0 to 15 year olds) and the number of adults (over 16 of age) are included to capture time or physical constraints to engage for example in off- farm wage jobs. In addition to individual or household characteristics location characteristics often play a significant role in employment decisions. For example, analysing agricultural supply response in Mozambique, the results of Heltberg (2002) are suggestive of a strong influence of area based characteristics. Mecharla (2002) for Andhra Pradesh and Isgut (2004) for Honduras find strong locational effects, more specifically from road infrastructure variables, on rural non-farm employment possibilities. We include provincial dummies to capture all type of differences between the provinces that could affect employment opportunities. Using a fixed effect model deals with possible biases due to omitted variables that could affect occupational choice at the provincial level. The explanatory variables in the rural occupational choice analysis are different from those in the urban analysis only in two respects. On the one hand, secondary education is excluded since too few persons living in rural areas have completed their secondary education (5 persons in 1996 and 23 in 2002). On the other hand, the rural regressions include some community characteristics. These are a set of dummy variables, indicating whether a characteristic is present or not. The variables capture accessibility of the village and the presence of possible work sites such as health centres or schools. We included the presence of a market in the village (market), whether any form of transport reaches the villages (transport), the presence in the village of a health centre or a sanitary post (health), a primary and secondary school (primary, secondary) and a farmer information centre (farming). A problem our data may suffer from is the lack of physical and social capital variables (Narayan and Pritchett 1999). The latter are difficult to capture exactly and possibly endogenous but physical asset variables are often used in occupational choice analysis. Especially produc tive asset variables such as livestock and land could affect occupational choice. However, there were no questions asked relating to land or livestock in the IAF 2002-03 dataset, which focused on expenditures, so we find ourselves unable to use them as exp lanatory variables for either of the two years because of comparability reasons. Although income portfolio theory stresses the importance of asset allocation (Barrett, Reardon et al. 2001) as they offer not only a store of wealth but also a source of income, sometimes they are found to be less significant in determining activity choice in empirical research. For example in Burkina Faso (Reardon, Delgado et al. 1992) land constraints do not drive income diversification. In Ethiopia and Tanzania, Dercon and Krishnan (1996) find that income portfolios are explained mainly by differences in ability, location and access
33
to credit. Obviously income portfolio choice could be driven by asset ownership indirectly since access to credit is often determined by the ability to provide collateral. But examples of the opposite, where asset ownership does appear to affect occupational choice, do exist. Empirical evidence from other countries is supportive of both possibilities. In the case of Mozambique, there are some observations in favour of the position that assets do not (yet) affect occupational choice. Unlike in many other African countries, land appears not to be a constraint so far (Brück 2003). If households need more land to cultivate they would only have to clear it. Hence it is not the land that constitutes the constraint but labour, as it is the latter that is the key input in clearing land. The results of the IAF 1996-97 poverty determinants analysis confirms the view that land is not important as a poverty determinant.6 Moreover, these results show that the non-poor are more likely to use hired labour than the poor, both in rural and urban areas, which may indicate that the labour constraint plays a bigger role than the land constraint.7 Hence our estimation strategy involves assuming that assets are not a key determinant in Mozambicans occupational choice and that our coefficients do not suffer too strongly from omitted variables biases. Having said that, we will bear the omitted asset problem in mind while interpreting the results. For example, the coefficients of the provinces with higher population densities and binding land constraints may be biased towards off- farm employments due to the omitted land variable. Table 19 presents averages of the variables used in the regression while Table 20 presents more variables and divides the sample also into the poor and the non-poor sub-samples. We observe few differences in demographic structure between urban and rural areas and between both years. The working persons between 16 and 65 years old (active age) are on average 35 years old, and they live in households with on average two or three children and two or three adults with the larger numbers in the urban areas. The share of female-headed households increased by 4 and 3 percent in urban and rural areas respectively. The workforce appears to be more female in rural areas than in urban areas. In urban areas the workforce is characterised by a higher percentage of single persons (i.e. the never married, widowed or divorced), increasing strongly over the years whereas in the rural areas the percentage is lower and decreasing over the years. On average 2 percent is disabled, which could be physically or mentally disabled. What did change is the percentage of persons who reached the final year of primary and secondary school. In urban areas the former increased from 18 to 24 percent and in rural areas it remained the same being only around 4 percent. The percentage of workers with complete secondary schooling increased in urban areas from 2 to 4 percent while in rural areas it remained close to zero. The percentages of persons having gone to primary school for some years was 40 and 16
6 Based on empirical studies using the IAF 1996-97 data which found that land was insignificant as a poverty determinant, the question on land was not asked in the 2002-03 survey. Only for the Northern areas land holdings did have a minor impact on the logarithm of consumption, a one percent increase in land holdings was found to have only a 0.05 percent increase in consumption per capita (Government of Mozambique 1998). 7 On the other hand, it is argued for post-war Northern Mozambique that land did have an impact on rural poverty (Brück 2004), thus further cautioning about the importance of including assets in poverty regressions in poor rural areas.
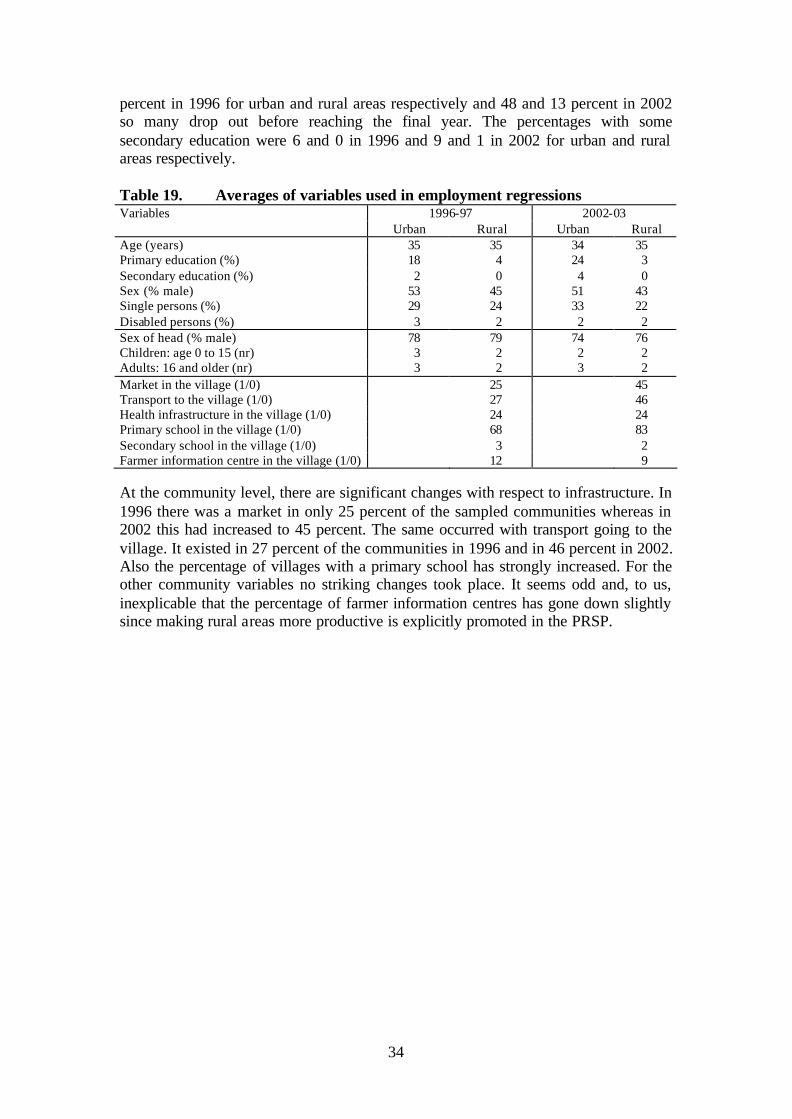
34
percent in 1996 for urban and rural areas respectively and 48 and 13 percent in 2002 so many drop out before reaching the final year. The percentages with some secondary education were 6 and 0 in 1996 and 9 and 1 in 2002 for urban and rural areas respectively. Table 19. Averages of variables used in employment regressions
1996-97 2002-03 Variables Urban Rural Urban Rural
Age (years) 35 35 34 35 Primary education (%) 18 4 24 3 Secondary education (%) 2 0 4 0 Sex (% male) 53 45 51 43 Single persons (%) 29 24 33 22 Disabled persons (%) 3 2 2 2 Sex of head (% male) 78 79 74 76 Children: age 0 to 15 (nr) 3 2 2 2 Adults: 16 and older (nr) 3 2 3 2 Market in the village (1/0) 25 45 Transport to the village (1/0) 27 46 Health infrastructure in the village (1/0) 24 24 Primary school in the village (1/0) 68 83 Secondary school in the village (1/0) 3 2 Farmer information centre in the village (1/0) 12 9 At the community level, there are significant changes with respect to infrastructure. In 1996 there was a market in only 25 percent of the sampled communities whereas in 2002 this had increased to 45 percent. The same occurred with transport going to the village. It existed in 27 percent of the communities in 1996 and in 46 percent in 2002. Also the percentage of villages with a primary school has strongly increased. For the other community variables no striking changes took place. It seems odd and, to us, inexplicable that the percentage of farmer information centres has gone down slightly since making rural areas more productive is explicitly promoted in the PRSP.
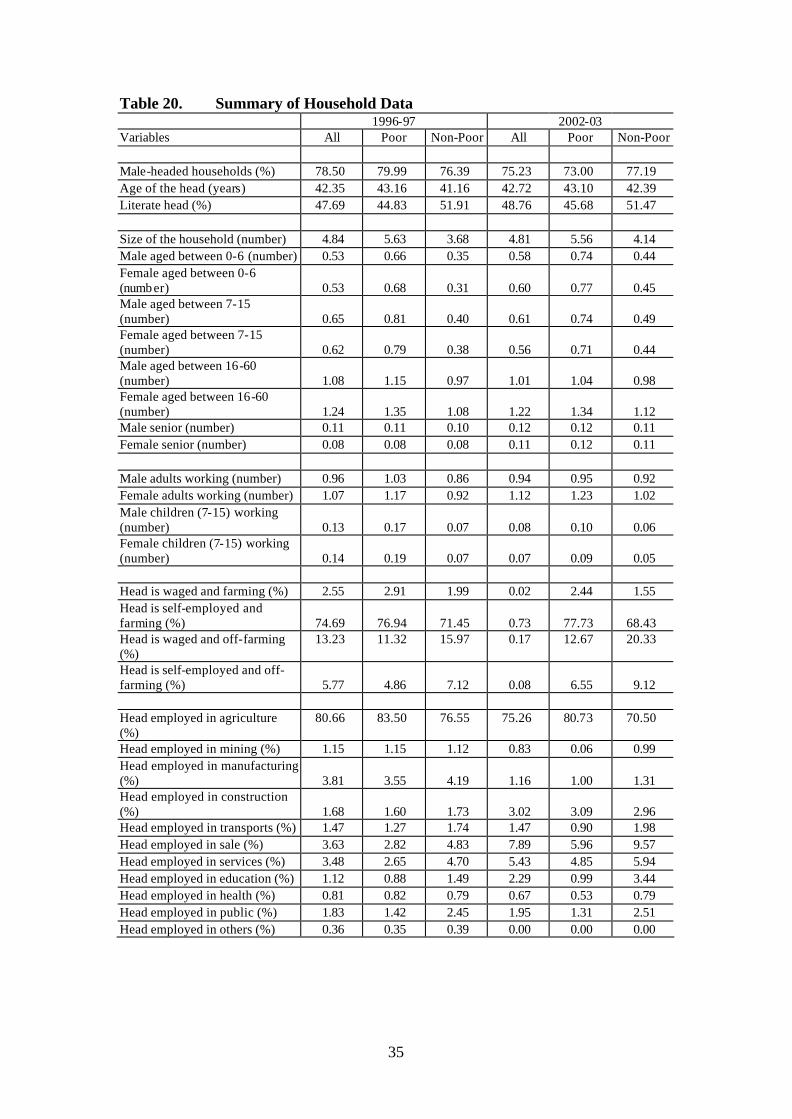
35
Table 20. Summary of Household Data 1996-97 2002-03 Variables All Poor Non-Poor All Poor Non-Poor Male-headed households (%) 78.50 79.99 76.39 75.23 73.00 77.19 Age of the head (years) 42.35 43.16 41.16 42.72 43.10 42.39 Literate head (%) 47.69 44.83 51.91 48.76 45.68 51.47 Size of the household (number) 4.84 5.63 3.68 4.81 5.56 4.14 Male aged between 0-6 (number) 0.53 0.66 0.35 0.58 0.74 0.44 Female aged between 0-6 (number) 0.53 0.68 0.31 0.60 0.77 0.45 Male aged between 7-15 (number) 0.65 0.81 0.40 0.61 0.74 0.49 Female aged between 7-15 (number) 0.62 0.79 0.38 0.56 0.71 0.44 Male aged between 16-60 (number) 1.08 1.15 0.97 1.01 1.04 0.98 Female aged between 16-60 (number) 1.24 1.35 1.08 1.22 1.34 1.12 Male senior (number) 0.11 0.11 0.10 0.12 0.12 0.11 Female senior (number) 0.08 0.08 0.08 0.11 0.12 0.11 Male adults working (number) 0.96 1.03 0.86 0.94 0.95 0.92 Female adults working (number) 1.07 1.17 0.92 1.12 1.23 1.02 Male children (7-15) working (number) 0.13 0.17 0.07 0.08 0.10 0.06 Female children (7-15) working (number) 0.14 0.19 0.07 0.07 0.09 0.05 Head is waged and farming (%) 2.55 2.91 1.99 0.02 2.44 1.55 Head is self-employed and farming (%) 74.69 76.94 71.45 0.73 77.73 68.43 Head is waged and off-farming (%)
13.23 11.32 15.97 0.17 12.67 20.33
Head is self-employed and off-farming (%) 5.77 4.86 7.12 0.08 6.55 9.12 Head employed in agriculture (%)
80.66 83.50 76.55 75.26 80.73 70.50
Head employed in mining (%) 1.15 1.15 1.12 0.83 0.06 0.99 Head employed in manufacturing (%) 3.81 3.55 4.19 1.16 1.00 1.31 Head employed in construction (%) 1.68 1.60 1.73 3.02 3.09 2.96 Head employed in transports (%) 1.47 1.27 1.74 1.47 0.90 1.98 Head employed in sale (%) 3.63 2.82 4.83 7.89 5.96 9.57 Head employed in services (%) 3.48 2.65 4.70 5.43 4.85 5.94 Head employed in education (%) 1.12 0.88 1.49 2.29 0.99 3.44 Head employed in health (%) 0.81 0.82 0.79 0.67 0.53 0.79 Head employed in public (%) 1.83 1.42 2.45 1.95 1.31 2.51 Head employed in others (%) 0.36 0.35 0.39 0.00 0.00 0.00
36
We use separate models for different sub-samples. Table 21 (p. 40) and Table 22 (p. 41) show the results of the multinomial regressions analysing the determinants of occupational choice in urban and rural areas respectively. We divide the sample based on location since the opportunities to get engaged in different types of employments may differ between rural and urban areas and different skills may be needed. Moreover, for the rural areas additional information was collected at the community level. Thus we include some of the community characteristics that were asked in both surveys in the rural part of the analysis. The results have to be interpreted towards the base category, which is the group of family helpers. 3.1.1. Urban Analysis Looking at some variables of interest, we find that age has an equal affect on all income earning categories, i.e. younger persons have a significantly higher chance to be helpers in the activity of another household member. In 2002 the discrepancy of the age effect between choosing to become a farmer or working off- farm8 has increased. The age effect being larger in off- farm employments could partly be explained by the fact that for an off- farm job one needs first to acquire some education (and possibly some social or informational network), making people older before they can actually try to obtain an off- farm employment. In 2002 more people study (see Table 4, p. 20) and start to work later which pushes the age effect upward. This idea is confirmed by the results. Primary education increases access to all off-farm employments in 1996 and only to non-agricultural employment in 2002. Moreover, its effect became smaller. Having completed primary education, the ratio of choosing an income-earning category as opposed to being a helper is largest for the non-agricultural wage category in both years. Surprisingly, secondary education is not very significant for selection into any of the income earning categories but it does appear to decrease the probability of becoming self-employed. So a person with secondary education living in an urban area will either be a family helper or working for a wage. Being male results in a much higher probability of being an income earner, in 1996 in increasing order of being a farmer, working as a wage worker in the agricultural sector, being engaged in a non-agricultural self-employed activity and a 42 times higher probability of working for a wage in the non-agricultural sector. In 2002 the magnitudes of the effects of being male slightly decrease for all categories except for working in the agricultural sector for a wage. So the gender differences in the probabilities of working off the own farm start to diminish; only the agricultural wage sector appears to be reserved for men. Further, the results are suggestive of lower probabilities for single household members to be working in agriculture. They will rather be helping or working for a wage in the non-agricultural sector. The wage category appears to offer low employment opportunities for disabled persons.
8 The term off-farm is used to refer to activities other than being self-employed in the agricultural sector so it includes working for a wage in the agricultural sector, working for a wage in the non-agricultural sector and working for one’s own account in the non-agricultural sector.
37
With respect to the gender of the household head, we find for 1996 that members of a male-headed household have lower probabilities to be working in a self-employment category. They will either be helping or working for a wage. In 2002 the members of a male-headed household have lower probabilities to be income earning at all but will rather be helpers. The number of children (0 to 15 years old) do not seem to affect occupational choice. Adults present in the household do, but they only seem to have a downward effect on the choice to become an income earner in general. The effect is more or less the same in both years. The location dummies (not represented in the figure) are often highly significant determinants of the probability to choose for an occupation type. For example, living in Maputo City in 1996 resulted in a extremely higher probability to be in non-agricultural wage or self-employment than to be a family helper. In 2002 the probabilities to be in a non-agricultural employment dropped in magnitude and were equal to those in Maputo Province but both were still much higher than those of any other province. Other provincial effects worth noticing are for example that in 1996 the probability of being an agricultural wage labourer was highest living in Maputo City whereas in 2002 it is highest in Maputo Province. The probability of being in non-agriculture plummeted in Maputo City while it strongly increased in Maputo Province and Sofala. For 1996 we ran the regression including two dummies, one which indicates the landless households and one which indicates whether the household owns livestock. They often appeared insignificant and if they were it was in a negative way, decreasing the probability of having an employment off the own farm. The dummies never acted positive e.g. to increase the probability of having a non-agricultural employment, where they may have proven their collateral value. Moreover, including the dummies did not change any of the results discussed, except for the Maputo City dummies. When the land dummy was included the ir magnitude dropped considerably. So the large effect that living in Maputo has on the probability of being engaged in non-agricultural activities is partly explained by the household’s smaller land holdings that create a need to look for off- farm employment. Concluding, we found that education and gender appear to be the strongest determinants of which type of employment is held. They offer strong opportunities to work in off- farm employments especially in non-agricultural wage employment. But the effects appear to be decreasing over time. This may be related to the overall rising educational attainments, especially at the primary level, where having primary education in 2002-03 pays a smaller premium than it previously did. Meanwhile the demand for secondary school graduates has not yet picked up significantly so that having secondary education does not yet yield a strong dividend in the labour market. The declining coefficients on the gender variables may be related to the sectors beyond the non-agricultural wage sector (which observes a continued high gender effect) being more accessible to women. Given the changing sectoral structure of employment with a high share of commerce and services these sectors may also offer more employment opportunities for women.
38
3.1.2. Rural Analysis We mainly comment on the results that are different from those in the urban sample. The effect of age was the same in rural as in urban areas, increasing the probability of ending up in any income earning category, but declining with increasing age. The results show that also in the rural areas primary education gives a significantly higher probability of choosing a non-agricultural employment in both years. Although the education effects were smaller in rural than in urban areas in 1996, in 2002 they were higher for both non-agricultural categories. Gender is also in rural areas an important determinant of occupational choice. Being a man provides a much higher probability of choosing any income earning employment compared with helping in other household members’ activities, but especially for non-agricultural wage employment the risk ratios are extremely high. Moreover, unlike in the urban areas where the risk ratios are declining, they are increasing in rural areas for most categories. A very high increase can be observed in the probability of ending up in the agricultural wage sector. Although a lot lower, the same occurred in urban areas. The effect of being single in a rural community is more or less equal to the effect in urban areas offering a lower probability of being an income earner. Disabled persons did not encounter more difficulties in their occupational choice than the fully able persons in 1996 but in 2002, as in the urban areas, it as a serious downward effect on their chances of finding non-agricultural wage employment. In the rural analysis the provincial dummies remain important, even correcting for community characteristics. We focus on the latter but there are still some unobserved characteristics at the provincial level that affect employment choice. The factor that appeared in 1996 to make a difference in increasing the probability for all employment types as opposed to helping was transportation to the village for off- farm employment and the presence of a market in the village for being a self-employed farmer. Both were not significant in 2002. It could be that roads have been upgraded between both years which makes markets in other communities easier accessible and there is less need for having one in the own community. On average the community characteristics appear to be most important in determining access to wage employment. Where it concerns non-agricultural wage employment, the presence of health infrastructure and a secondary school are important community determinants of this type of employment (in addition to the market and transport dummies in 1996 and the dummy for the presence of a farmer information centre in 2002). They could work through the labour demand side by offering employment or through the supply side by offering the opportunity to increase the quality of labour. The secondary school demand effect became larger in 2002, which could be either because of increased demand for secondary school teachers or by higher demand for secondary educated workers (which mostly those living in a community with a secondary school present can offer). Concluding, education and gender are the most crucial determinants of employment choice. Their effects are much stronger in rural areas. The evidence even suggests an increased effect over time (except for non-agricultural wage employment) unlike in
39
urban areas where it appears to be diminishing. The regressions revealed that disabled persons have significantly lower probabilities to choose for non-agricultural wage employment and the negative effect is much larger in rural than urban areas. We also found that infrastructure was greatly important as determinants of any income earning employment in 1996 but was not in 2002 which may suggest that it ahs been upgraded between both years. What was more significant in 2002, was the presence of health infrastructure, a secondary school or a farmer information centre. The information revealed by the regressions on the determinants of occupational choice is used to predict for each working person the probabilities of ending up in the five respective categories. We assume that the occupation chosen is that one with the highest probability. When we aggregate the individually predicted occupations to the household level we obtain predicted numbers of household members in each of the five categories. This variable is carried over to the next step where we explain household consumption by regressing it on a set of variables including the predicted employment figures.
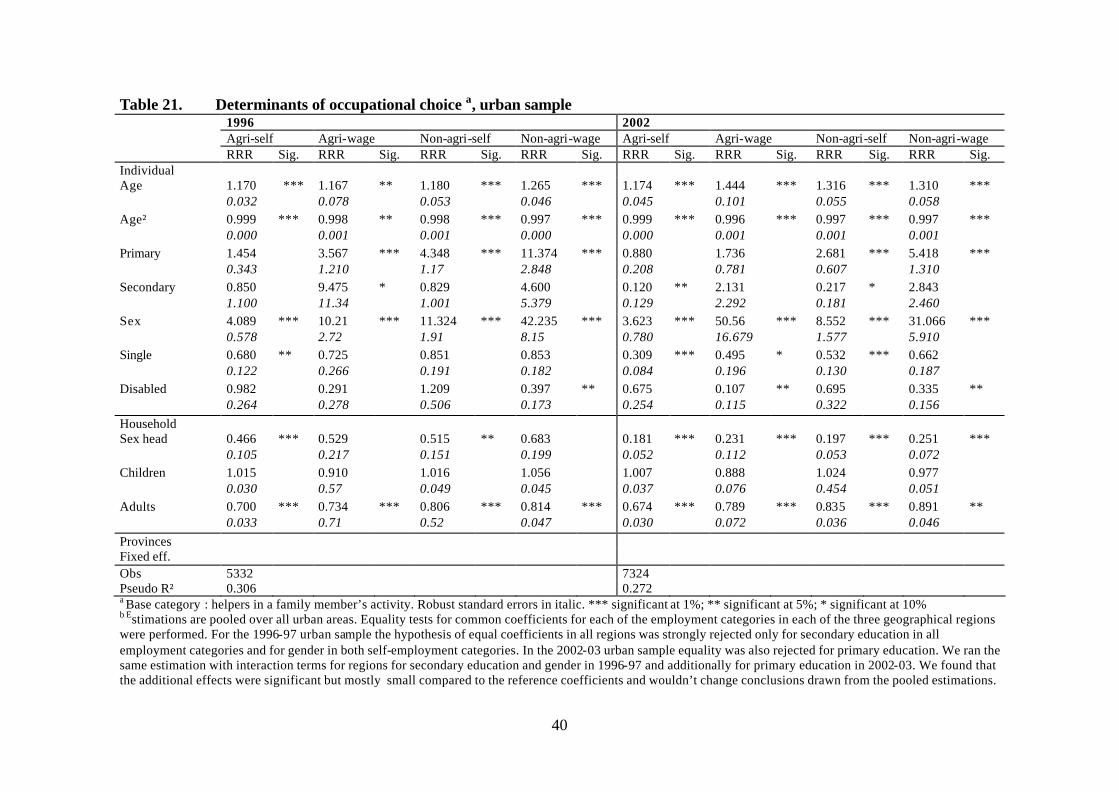
40
Table 21. Determinants of occupational choice a, urban sample 1996 2002 Agri-self Agri-wage Non-agri-self Non-agri-wage Agri-self Agri-wage Non-agri-self Non-agri-wage
RRR Sig. RRR Sig. RRR Sig. RRR Sig. RRR Sig. RRR Sig. RRR Sig. RRR Sig. Individual Age 1.170
0.032 *** 1.167
0.078 ** 1.180
0.053 *** 1.265
0.046 *** 1.174
0.045 *** 1.444
0.101 *** 1.316
0.055 *** 1.310
0.058 ***
Age² 0.999 0.000
*** 0.998 0.001
** 0.998 0.001
*** 0.997 0.000
*** 0.999 0.000
*** 0.996 0.001
*** 0.997 0.001
*** 0.997 0.001
***
Primary 1.454 0.343
3.567 1.210
*** 4.348 1.17
*** 11.374 2.848
*** 0.880 0.208
1.736 0.781
2.681 0.607
*** 5.418 1.310
***
Secondary 0.850 1.100
9.475 11.34
* 0.829 1.001
4.600 5.379
0.120 0.129
** 2.131 2.292
0.217 0.181
* 2.843 2.460
Sex 4.089 0.578
*** 10.21 2.72
*** 11.324 1.91
*** 42.235 8.15
*** 3.623 0.780
*** 50.56 16.679
*** 8.552 1.577
*** 31.066 5.910
***
Single 0.680 0.122
** 0.725 0.266
0.851 0.191
0.853 0.182
0.309 0.084
*** 0.495 0.196
* 0.532 0.130
*** 0.662 0.187
Disabled 0.982 0.264
0.291 0.278
1.209 0.506
0.397 0.173
** 0.675 0.254
0.107 0.115
** 0.695 0.322
0.335 0.156
**
Household Sex head 0.466
0.105 *** 0.529
0.217 0.515
0.151 ** 0.683
0.199 0.181
0.052 *** 0.231
0.112 *** 0.197
0.053 *** 0.251
0.072 ***
Children 1.015 0.030
0.910 0.57
1.016 0.049
1.056 0.045
1.007 0.037
0.888 0.076
1.024 0.454
0.977 0.051
Adults 0.700 0.033
*** 0.734 0.71
*** 0.806 0.52
*** 0.814 0.047
*** 0.674 0.030
*** 0.789 0.072
*** 0.835 0.036
*** 0.891 0.046
**
Provinces Fixed eff. Obs 5332 7324 Pseudo R² 0.306 0.272 a Base category : helpers in a family member’s activity. Robust standard errors in italic. *** significant at 1%; ** significant at 5%; * significant at 10% b Estimations are pooled over all urban areas. Equality tests for common coefficients for each of the employment categories in each of the three geographical regions were performed. For the 1996-97 urban sample the hypothesis of equal coefficients in all regions was strongly rejected only for secondary education in all employment categories and for gender in both self-employment categories. In the 2002-03 urban sample equality was also rejected for primary education. We ran the same estimation with interaction terms for regions for secondary education and gender in 1996-97 and additionally for primary education in 2002-03. We found that the additional effects were significant but mostly small compared to the reference coefficients and wouldn’t change conclusions drawn from the pooled estimations.
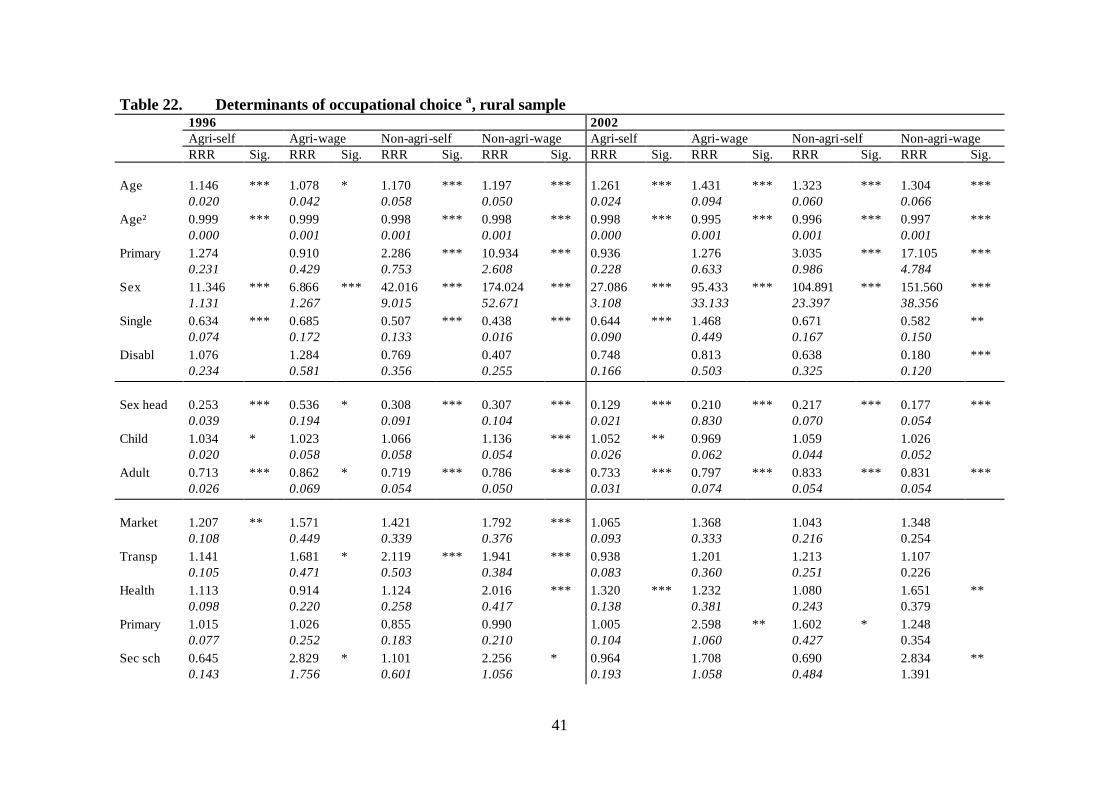
41
Table 22. Determinants of occupational choice a, rural sample 1996 2002 Agri-self Agri-wage Non-agri-self Non-agri-wage Agri-self Agri-wage Non-agri-self Non-agri-wage
RRR Sig. RRR Sig. RRR Sig. RRR Sig. RRR Sig. RRR Sig. RRR Sig. RRR Sig. Age 1.146
0.020 *** 1.078
0.042 * 1.170
0.058 *** 1.197
0.050 *** 1.261
0.024 *** 1.431
0.094 *** 1.323
0.060 *** 1.304
0.066 ***
Age² 0.999 0.000
*** 0.999 0.001
0.998 0.001
*** 0.998 0.001
*** 0.998 0.000
*** 0.995 0.001
*** 0.996 0.001
*** 0.997 0.001
***
Primary 1.274 0.231
0.910 0.429
2.286 0.753
*** 10.934 2.608
*** 0.936 0.228
1.276 0.633
3.035 0.986
*** 17.105 4.784
***
Sex 11.346 1.131
*** 6.866 1.267
*** 42.016 9.015
*** 174.024 52.671
*** 27.086 3.108
*** 95.433 33.133
*** 104.891 23.397
*** 151.560 38.356
***
Single 0.634 0.074
*** 0.685 0.172
0.507 0.133
*** 0.438 0.016
*** 0.644 0.090
*** 1.468 0.449
0.671 0.167
0.582 0.150
**
Disabl 1.076 0.234
1.284 0.581
0.769 0.356
0.407 0.255
0.748 0.166
0.813 0.503
0.638 0.325
0.180 0.120
***
Sex head 0.253
0.039 *** 0.536
0.194 * 0.308
0.091 *** 0.307
0.104 *** 0.129
0.021 *** 0.210
0.830 *** 0.217
0.070 *** 0.177
0.054 ***
Child 1.034 0.020
* 1.023 0.058
1.066 0.058
1.136 0.054
*** 1.052 0.026
** 0.969 0.062
1.059 0.044
1.026 0.052
Adult 0.713 0.026
*** 0.862 0.069
* 0.719 0.054
*** 0.786 0.050
*** 0.733 0.031
*** 0.797 0.074
*** 0.833 0.054
*** 0.831 0.054
***
Market 1.207
0.108 ** 1.571
0.449 1.421
0.339 1.792
0.376 *** 1.065
0.093 1.368
0.333 1.043
0.216 1.348
0.254
Transp 1.141 0.105
1.681 0.471
* 2.119 0.503
*** 1.941 0.384
*** 0.938 0.083
1.201 0.360
1.213 0.251
1.107 0.226
Health 1.113 0.098
0.914 0.220
1.124 0.258
2.016 0.417
*** 1.320 0.138
*** 1.232 0.381
1.080 0.243
1.651 0.379
**
Primary 1.015 0.077
1.026 0.252
0.855 0.183
0.990 0.210
1.005 0.104
2.598 1.060
** 1.602 0.427
* 1.248 0.354
Sec sch 0.645 0.143
2.829 1.756
* 1.101 0.601
2.256 1.056
* 0.964 0.193
1.708 1.058
0.690 0.484
2.834 1.391
**
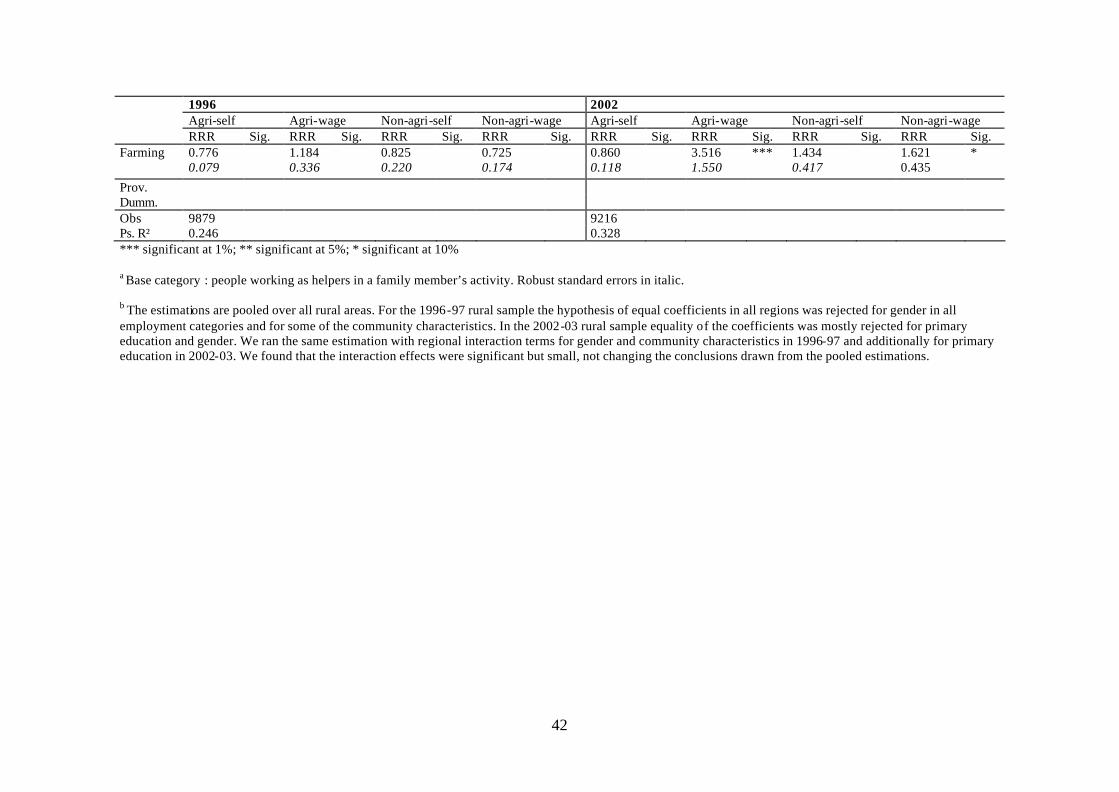
42
1996 2002 Agri-self Agri-wage Non-agri-self Non-agri-wage Agri-self Agri-wage Non-agri-self Non-agri-wage
RRR Sig. RRR Sig. RRR Sig. RRR Sig. RRR Sig. RRR Sig. RRR Sig. RRR Sig. Farming 0.776
0.079 1.184
0.336 0.825
0.220 0.725
0.174 0.860
0.118 3.516
1.550 *** 1.434
0.417 1.621
0.435 *
Prov. Dumm. Obs 9879 9216 Ps. R² 0.246 0.328 *** significant at 1%; ** significant at 5%; * significant at 10%
a Base category : people working as helpers in a family member’s activity. Robust standard errors in italic. b The estimations are pooled over all rural areas. For the 1996-97 rural sample the hypothesis of equal coefficients in all regions was rejected for gender in all employment categories and for some of the community characteristics. In the 2002-03 rural sample equality of the coefficients was mostly rejected for primary education and gender. We ran the same estimation with regional interaction terms for gender and community characteristics in 1996-97 and additionally for primary education in 2002-03. We found that the interaction effects were significant but small, not changing the conclusions drawn from the pooled estimations.
43
3.2. Household Consumption Analysis Although above we observed a movement towards rural non-farm employment, it has long been considered relative ly non-productive in the economic development literature (with the rural sector generally providing “surplus” labour for other, more modern activities, for example in the urban industrial sector). In the views of many authors, the rural non-farm sector was thus contributing neither to growth or welfare. The Lanjouw survey of non-farm data and policy experience is one crucial attempt to correct this view (Lanjouw and Lanjouw 2001). They argue that the rural non-farm sector can play a significantly positive role in promoting growth and welfare, e.g. by slowing rural-urban migration, providing alternatives for those left out of agriculture, or by increasing household security through income diversification. We use household survey data to compare the consumption effects of holding a certain type of job over both survey years. As both surveys do not include the same households, we analyse both cross-section datasets separately. The welfare measure we use throughout the analysis is daily household expenditures per capita (which was constructed by the poverty research team at the Mozambican Ministry of Finance). Comparing the change in the effects of employment on consumption we will analyse how employment may have affected the incidence of poverty. From the descriptive part we learned that the households with a household head employed in a non-agricultural sector have on average a higher expenditure pattern. In this section we discuss the effect of employment and other household characteristics on poverty. The modelling approach often taken is either: ),( iii EXfpoor = (X.1) where the poverty status of household i (being poor or non-poor) is explained by a vector of household characteristics including employment in different sectors or activity types. Other authors use the logarithm of household consumption: ( ) ),(ln iii EXfcons = (X.2) There are reasons to prefer model (X.2) over model (X.1). First, it uses more information which make sit more efficient. In model (X.2) a household is either poor or non-poor but all poor and all non-poor households are treated in the same way. Second, the definition of being poor or non-poor is subject to the choice of the poverty line. Sometimes the one-dollar per day measure is used or more subtle national or even regional poverty lines can be calculated. But there is always some arbitrariness attached to the choice of the poverty line. From the empirical work on the determinants of poverty in Mozambique we learned that education, gender of the household head and employment, especially non-agricultural employment positively affect household consumption per capita (Tschirley and Weber 1994; Government of Mozambique 1998; Tschirley and Benfica 2001). In these studies the number of workers in different sectors are included as explanatory variables. But as this is mostly a choice variable it may depend on the other household characteristics used to explain consumption. If this is the case, the
44
coefficients of the variables may be over- or underestimated dependent on their indirect effect through occupational choice. Especially where it concerns education and gender of the household head, which are strong determinants of occupational choice (or access), the coefficients may be biased. Therefore we aim to isolate the direct effects that explanatory variables may have on consumption by correcting for the indirect effects through access to certain employment types. Hence our model takes the following shape, which is an extension of model (X.2): ( ) ( )iiiii XXEXfcons 211 ,(,ln = (X.3) We can not use a straightforward instrumental variables approach since the employment data are at the individual level and consumption is observed at the household level. Hence we manually predict what type of employment a household member will choose (using the model in part 2.1), aggregate it to the household level and consequently use the predicted number of household members in different occupation categories as explanatory variables in the household consumption regressions. Our choice of explanatory variables is limited by the fact that we only include those that appear in both questionnaires. The 1996-97 survey includes information on land and livestock ownership, which are typically used in welfare analysis (though not always significant), but in the 2002-03 survey these questions were not repeated. In the consumption analysis we use the gender of the household head (sexhead) because it may reflect differences in opportunities and may even capture part of the land ownership effect as male headed households tend to have larger landholdings than female headed households. Further we include age of the household head (agehead) as it may capture life cycle effects, experience or social networks. Especially for the households with significant auto-consumption experience in farming may influence household production hence consumption. We also include the number of adults and children in the household (adults, children): larger households typically show lower consumption per capita. Especially in our case it may be relevant because consumption also includes use value of durable goods and imputed rent values for housing. We also include the squared terms of these household composition variables to capture non- linearities. Next, we include the number of adults in the households who completed primary education, divided by men and women (primary men, primary women). The number of disabled persons in the household is also included as an explanatory variable because they may need additional care (disabled person). In empirical research on welfare, locational characteristics often prove crucial determinants. For example, Justino and Litchfield (2002) find that changes in households’ poverty status in Vietnam are strongly correlated with locational characteristics such as access to key institutions and infrastructure. To capture all possible unobserved differences related to the location of the household we include district level fixed effects. Additionally, in the rural analysis we include the village characteristics that were used in the occupational choice regressions.
45
Since all these variables could have not only a direct effect on consumption but also an indirect one through their effect on non-agricultural employment opportunities9, we use the predicted number of adults in non-agricultural (non-agri adults) and agricultural employments (agri adults). In Table 23 we present averages for the variables used in the regressions, divided by urban and rural areas. Table 23. Averages of regression variables, by location
1996 2002 Variables Urban Rural Urban Rural
Male headed households (%) 78 79 74 76 Age of household head (years) 42 42 42 43 Number of adults (>15yrs) 3 2 3 2 Number of children (0-15) 3 2 2 2 Number of adult men finished primary 0.36 0.07 0.49 0.06 Number of adult women finished primary 0.18 0.02 0.28 0.02 Number of disabled adults 0.07 0.07 0.08 0.07 Number of adults working in non-agriculture 0.66 0.10 0.93 0.15 Number of adults working in agriculture 0.64 1.14 0.58 1.11 Predicted number of adults in non-agriculture 0.54 0.01 0.87 0.04 Predicted number of adults in agriculture 0.70 1.03 0.55 1.02 As we found before, the number of female-headed households increased in both urban and rural areas. We find very low and only marginally increasing numbers for men and women who completed primary education. In rural areas they do not appear to be increasing which may be due to rural-urban migration by those who obtained secondary education. The numbers are much lower for women than for men in all areas. Besides education there are also large differences in the number of household members holding non-agricultural and agricultural employments. The former type can be found much more in urban households and the gap is even larger in 2002. As the three geographic regions North, Centre and South, differ strongly with respect to poverty incidence and the change therein over both survey years (both in poverty headcount ratios and poverty gaps) we performed a pooling test. Equality of coefficients was strongly rejected for all explanatory variables (except for the number of adult men with primary education) in either the 1996-97 or the 2002-03 survey for rural areas. In the urban areas only few coefficients differed. For consistency and comparability reasons we ran the regressions separate for all regions in both survey years and in both the rural and urban analysis. Table 24 presents the urban analysis and Table 25 the rural analysis. The left hand side variable is the logarithm of household consumption per capita per day.
9 The Durbin-Wu-Hausman endogeneity tests on the actual numbers of household members working in non-agricultural and on those working in agricultural employment both suggested endogeneity at the 1 percent level in all regions for both rural and urban areas.
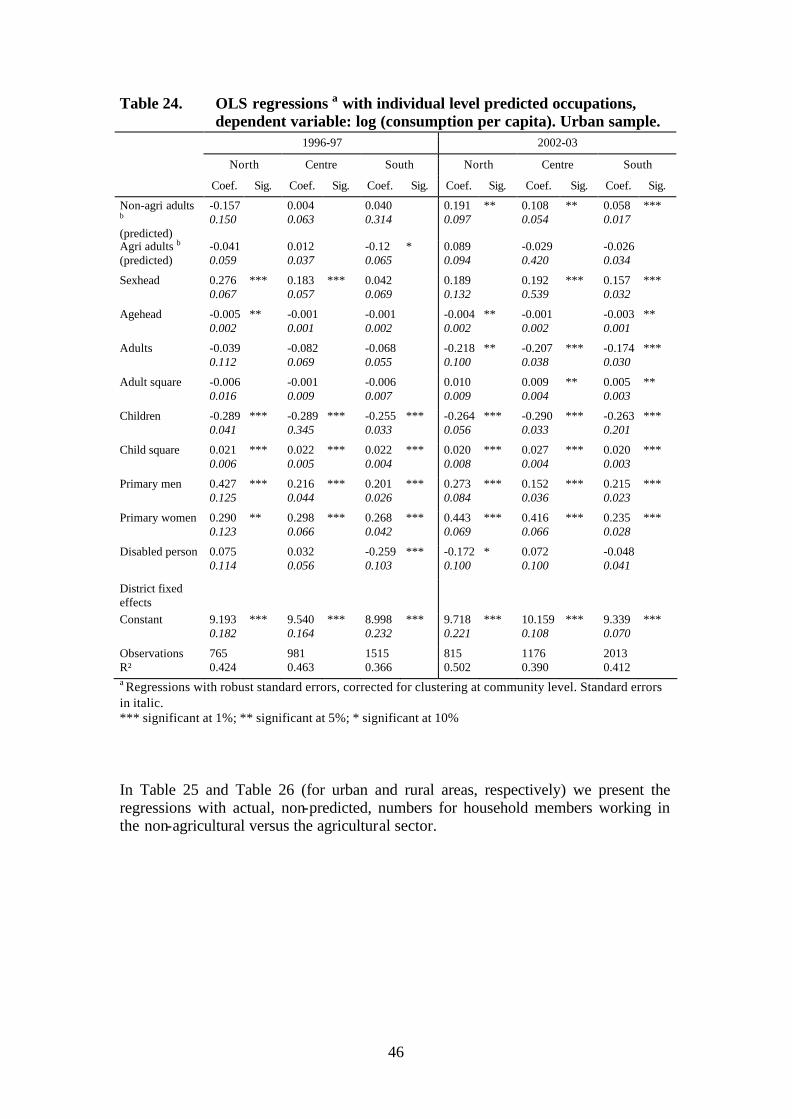
46
Table 24. OLS regressions a with individual level predicted occupations, dependent variable: log (consumption per capita). Urban sample.
1996-97 2002-03
North Centre South North Centre South
Coef. Sig. Coef. Sig. Coef. Sig. Coef. Sig. Coef. Sig. Coef. Sig.
Non-agri adults b
(predicted)
-0.157 0.150
0.004 0.063
0.040 0.314
0.191 0.097
** 0.108 0.054
** 0.058 0.017
***
Agri adults b
(predicted) -0.041 0.059
0.012 0.037
-0.12 0.065
* 0.089 0.094
-0.029 0.420
-0.026 0.034
Sexhead 0.276 0.067
*** 0.183 0.057
*** 0.042 0.069
0.189 0.132
0.192 0.539
*** 0.157 0.032
***
Agehead -0.005 0.002
** -0.001 0.001
-0.001 0.002
-0.004 0.002
** -0.001 0.002
-0.003 0.001
**
Adults -0.039 0.112
-0.082 0.069
-0.068 0.055
-0.218 0.100
** -0.207 0.038
*** -0.174 0.030
***
Adult square -0.006 0.016
-0.001 0.009
-0.006 0.007
0.010 0.009
0.009 0.004
** 0.005 0.003
**
Children -0.289 0.041
*** -0.289 0.345
*** -0.255 0.033
*** -0.264 0.056
*** -0.290 0.033
*** -0.263 0.201
***
Child square 0.021 0.006
*** 0.022 0.005
*** 0.022 0.004
*** 0.020 0.008
*** 0.027 0.004
*** 0.020 0.003
***
Primary men 0.427 0.125
*** 0.216 0.044
*** 0.201 0.026
*** 0.273 0.084
*** 0.152 0.036
*** 0.215 0.023
***
Primary women 0.290 0.123
** 0.298 0.066
*** 0.268 0.042
*** 0.443 0.069
*** 0.416 0.066
*** 0.235 0.028
***
Disabled person 0.075 0.114
0.032 0.056
-0.259 0.103
*** -0.172 0.100
* 0.072 0.100
-0.048 0.041
District fixed effects
Constant 9.193 0.182
*** 9.540 0.164
*** 8.998 0.232
*** 9.718 0.221
*** 10.159 0.108
*** 9.339 0.070
***
Observations 765 981 1515 815 1176 2013 R² 0.424 0.463 0.366 0.502 0.390 0.412 a Regressions with robust standard errors, corrected for clustering at community level. Standard errors in italic. *** significant at 1%; ** significant at 5%; * significant at 10% In Table 25 and Table 26 (for urban and rural areas, respectively) we present the regressions with actual, non-predicted, numbers for household members working in the non-agricultural versus the agricultural sector.
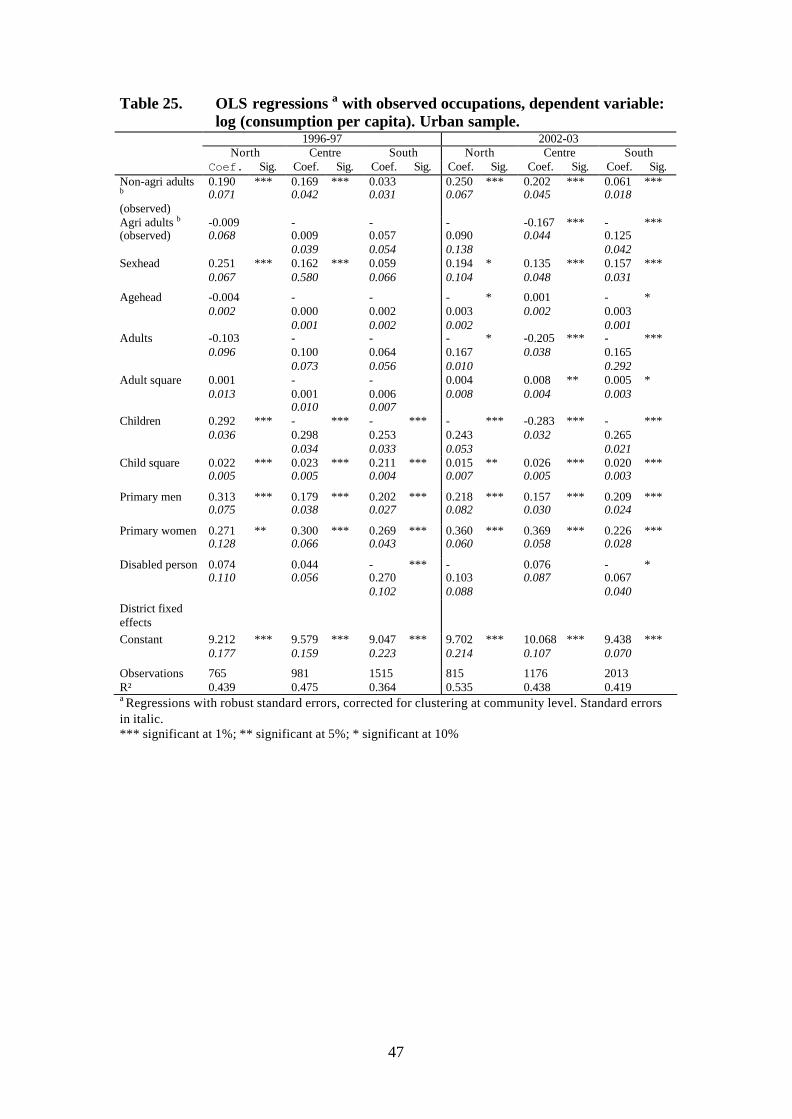
47
Table 25. OLS regressions a with observed occupations, dependent variable: log (consumption per capita). Urban sample.
1996-97 2002-03 North Centre South North Centre South
Coef. Sig. Coef. Sig. Coef. Sig. Coef. Sig. Coef. Sig. Coef. Sig. Non-agri adults b
(observed)
0.190 0.071
*** 0.169 0.042
*** 0.033 0.031
0.250 0.067
*** 0.202 0.045
*** 0.061 0.018
***
Agri adults b
(observed) -0.009 0.068
-0.009 0.039
-0.057 0.054
-0.090 0.138
-0.167 0.044
*** -0.125 0.042
***
Sexhead 0.251 0.067
*** 0.162 0.580
*** 0.059 0.066
0.194 0.104
* 0.135 0.048
*** 0.157 0.031
***
Agehead -0.004 0.002
-0.000 0.001
-0.002 0.002
-0.003 0.002
* 0.001 0.002
-0.003 0.001
*
Adults -0.103 0.096
-0.100 0.073
-0.064 0.056
-0.167 0.010
* -0.205 0.038
*** -0.165 0.292
***
Adult square 0.001 0.013
-0.001 0.010
-0.006 0.007
0.004 0.008
0.008 0.004
** 0.005 0.003
*
Children 0.292 0.036
*** -0.298 0.034
*** -0.253 0.033
*** -0.243 0.053
*** -0.283 0.032
*** -0.265 0.021
***
Child square 0.022 0.005
*** 0.023 0.005
*** 0.211 0.004
*** 0.015 0.007
** 0.026 0.005
*** 0.020 0.003
***
Primary men 0.313 0.075
*** 0.179 0.038
*** 0.202 0.027
*** 0.218 0.082
*** 0.157 0.030
*** 0.209 0.024
***
Primary women 0.271 0.128
** 0.300 0.066
*** 0.269 0.043
*** 0.360 0.060
*** 0.369 0.058
*** 0.226 0.028
***
Disabled person 0.074 0.110
0.044 0.056
-0.270 0.102
*** -0.103 0.088
0.076 0.087
-0.067 0.040
*
District fixed effects
Constant 9.212 0.177
*** 9.579 0.159
*** 9.047 0.223
*** 9.702 0.214
*** 10.068 0.107
*** 9.438 0.070
***
Observations 765 981 1515 815 1176 2013 R² 0.439 0.475 0.364 0.535 0.438 0.419 a Regressions with robust standard errors, corrected for clustering at community level. Standard errors in italic. *** significant at 1%; ** significant at 5%; * significant at 10%
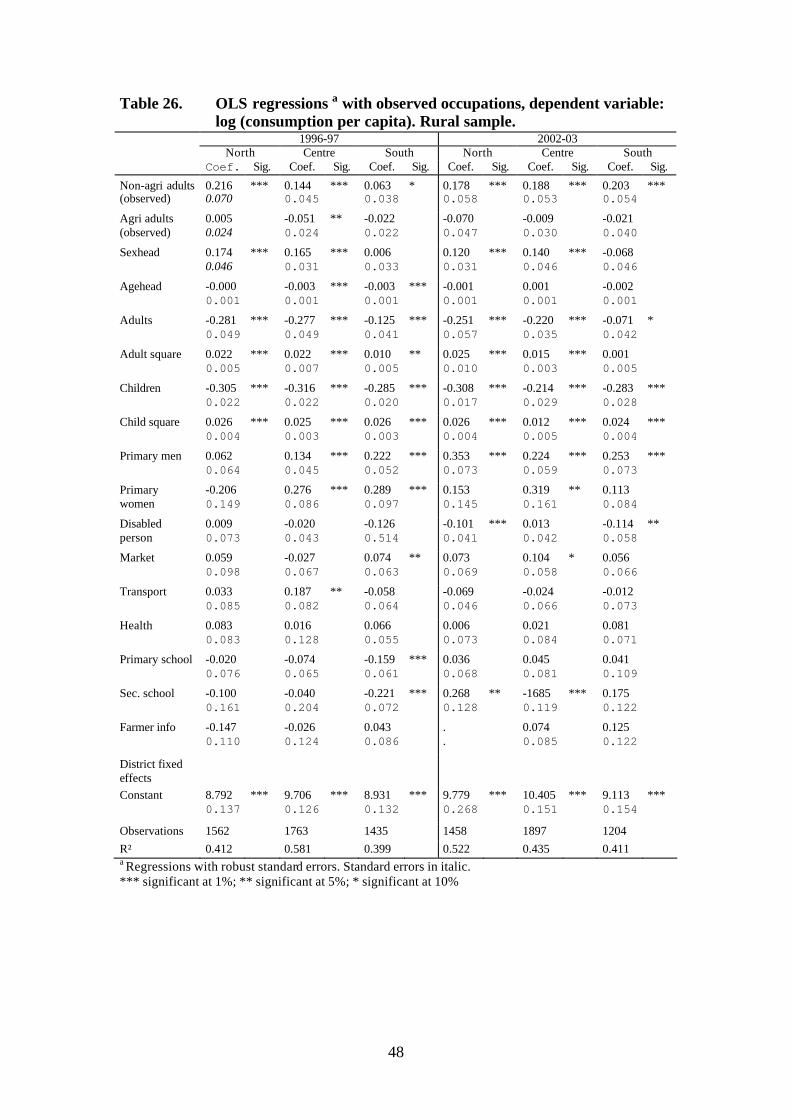
48
Table 26. OLS regressions a with observed occupations, dependent variable: log (consumption per capita). Rural sample.
1996-97 2002-03 North Centre South North Centre South
Coef. Sig. Coef. Sig. Coef. Sig. Coef. Sig. Coef. Sig. Coef. Sig.
Non-agri adults (observed)
0.216 0.070
*** 0.144 0.045
*** 0.063 0.038
* 0.178 0.058
*** 0.188 0.053
*** 0.203 0.054
***
Agri adults (observed)
0.005 0.024
-0.051 0.024
** -0.022 0.022
-0.070 0.047
-0.009 0.030
-0.021 0.040
Sexhead 0.174 0.046
*** 0.165 0.031
*** 0.006 0.033
0.120 0.031
*** 0.140 0.046
*** -0.068 0.046
Agehead -0.000 0.001
-0.003 0.001
*** -0.003 0.001
*** -0.001 0.001
0.001 0.001
-0.002 0.001
Adults -0.281 0.049
*** -0.277 0.049
*** -0.125 0.041
*** -0.251 0.057
*** -0.220 0.035
*** -0.071 0.042
*
Adult square 0.022 0.005
*** 0.022 0.007
*** 0.010 0.005
** 0.025 0.010
*** 0.015 0.003
*** 0.001 0.005
Children -0.305 0.022
*** -0.316 0.022
*** -0.285 0.020
*** -0.308 0.017
*** -0.214 0.029
*** -0.283 0.028
***
Child square 0.026 0.004
*** 0.025 0.003
*** 0.026 0.003
*** 0.026 0.004
*** 0.012 0.005
*** 0.024 0.004
***
Primary men 0.062 0.064
0.134 0.045
*** 0.222 0.052
*** 0.353 0.073
*** 0.224 0.059
*** 0.253 0.073
***
Primary women
-0.206 0.149
0.276 0.086
*** 0.289 0.097
*** 0.153 0.145
0.319 0.161
** 0.113 0.084
Disabled person
0.009 0.073
-0.020 0.043
-0.126 0.514
-0.101 0.041
*** 0.013 0.042
-0.114 0.058
**
Market 0.059 0.098
-0.027 0.067
0.074 0.063
** 0.073 0.069
0.104 0.058
* 0.056 0.066
Transport 0.033 0.085
0.187 0.082
** -0.058 0.064
-0.069 0.046
-0.024 0.066
-0.012 0.073
Health 0.083 0.083
0.016 0.128
0.066 0.055
0.006 0.073
0.021 0.084
0.081 0.071
Primary school -0.020 0.076
-0.074 0.065
-0.159 0.061
*** 0.036 0.068
0.045 0.081
0.041 0.109
Sec. school -0.100 0.161
-0.040 0.204
-0.221 0.072
*** 0.268 0.128
** -1685 0.119
*** 0.175 0.122
Farmer info -0.147 0.110
-0.026 0.124
0.043 0.086
. .
0.074 0.085
0.125 0.122
District fixed effects
Constant 8.792 0.137
*** 9.706 0.126
*** 8.931 0.132
*** 9.779 0.268
*** 10.405 0.151
*** 9.113 0.154
***
Observations 1562 1763 1435 1458 1897 1204 R² 0.412 0.581 0.399 0.522 0.435 0.411 a Regressions with robust standard errors. Standard errors in italic. *** significant at 1%; ** significant at 5%; * significant at 10%
49
3.2.1. Urban Analysis The significant household composition variables, representing the number of adults and children show the expected signs: they have a negative effect on household consumption per capita which is decreasing in magnitude for additional persons. The child effects do not differ much over both years but the adult effects do. They are negative in 2002 but they were not in 1996. This may be slightly worrisome if it would mean that opportunities for adults to add to household income are fewer. However, it could also originate from the fact that in 2002 more adults are studying and cannot contribute to household income in the short run. When the gender of the household head proves significant it appears to be in favour of the male headed households. In 1996 there is a very large effect in the North which has disappeared in 2002 but in the other regions the positive effect of living in a male headed household has even increased. The education variables have a very significant positive impact on household consumption per capita. For men they are strongest in the North but decreasing over both years. For women they do not differ strongly over the regions but they increased significantly over the years except in the Southern urban areas where they actually decreased. In general the effect of women’s primary education appears to be larger than that of men’s. Turning to the employment variables we do not observe strong effects in 1996 but in 2002 having more adults who work in a non-agricultural environment significantly increases household per capita consumption. The effect of non-agricultural employment is strongest in the Northern towns and smallest in the Southern ones. So some changes have taken place for the households that have members working in non-agriculture. Where it did not differentiate them from others in 1996 it does so in 2002. To conclude that in urban areas the growth in industry or services has actually started to affect the households involved in that sector may be preliminary but our results are at least suggestive of it. In the regressions shown in Table 25 (p. 47) we find much lower coefficients for education in the North and Central region and higher effects of having non-agricultural workers in 1996. This suggests that the variables are positively correlated and that part of the education effect is captured by employment. This may cause wrong conclusions to be drawn on the effect of both. The effect is larger with respect to men’s education as it more strongly affects non-agricultural employment. The effects are less striking in 2002 and but more pronounced for women’s education. This complies with our findings in the individual occupational choice regressions where both education and gender effects in access to employment were decreasing in urban areas. So when predicted numbers are used, which capture the effect of education through giving access to certain types of employment, the effects of employment are weaker while those of education are stronger. By not correcting for the employment access effect of education in 1996 the wrong conclusions could have been drawn with respect to the consumption effect of having persons in non-agricultural employments. It was
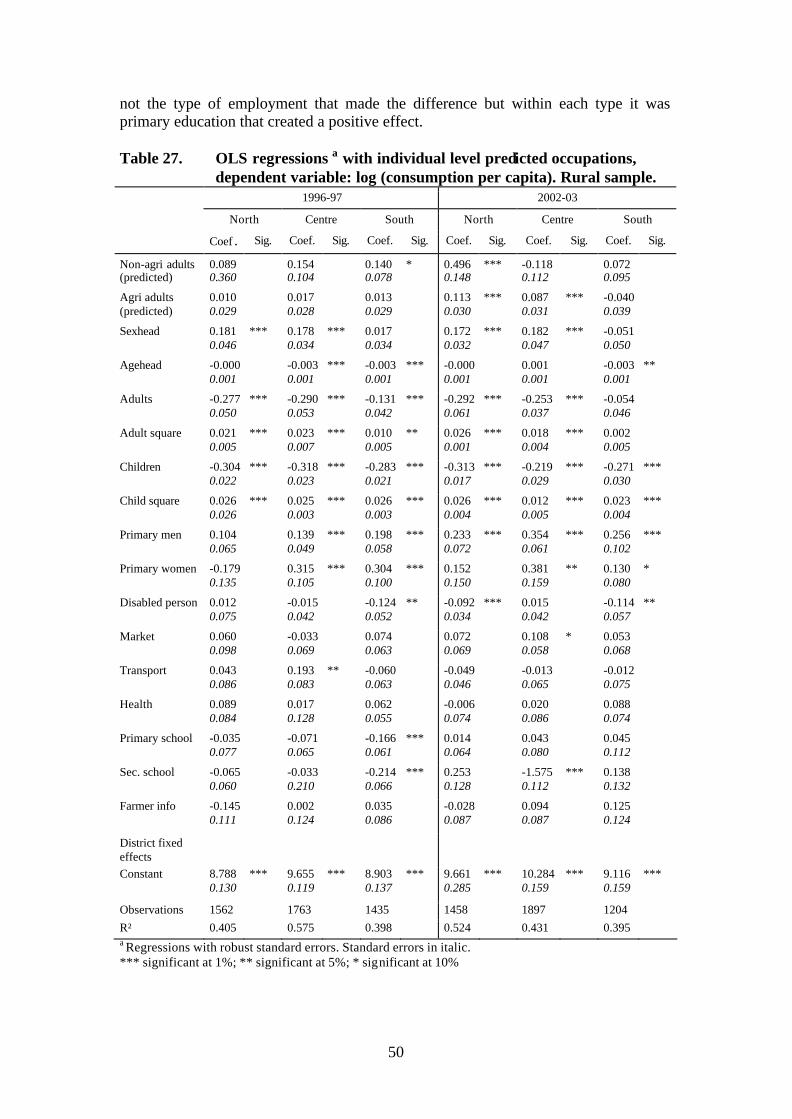
50
not the type of employment that made the difference but within each type it was primary education that created a positive effect. Table 27. OLS regressions a with individual level predicted occupations,
dependent variable: log (consumption per capita). Rural sample. 1996-97 2002-03
North Centre South North Centre South
Coef. Sig. Coef. Sig. Coef. Sig. Coef. Sig. Coef. Sig. Coef. Sig.
Non-agri adults (predicted)
0.089 0.360
0.154 0.104
0.140 0.078
* 0.496 0.148
*** -0.118 0.112
0.072 0.095
Agri adults (predicted)
0.010 0.029
0.017 0.028
0.013 0.029
0.113 0.030
*** 0.087 0.031
*** -0.040 0.039
Sexhead 0.181 0.046
*** 0.178 0.034
*** 0.017 0.034
0.172 0.032
*** 0.182 0.047
*** -0.051 0.050
Agehead -0.000 0.001
-0.003 0.001
*** -0.003 0.001
*** -0.000 0.001
0.001 0.001
-0.003 0.001
**
Adults -0.277 0.050
*** -0.290 0.053
*** -0.131 0.042
*** -0.292 0.061
*** -0.253 0.037
*** -0.054 0.046
Adult square 0.021 0.005
*** 0.023 0.007
*** 0.010 0.005
** 0.026 0.001
*** 0.018 0.004
*** 0.002 0.005
Children -0.304 0.022
*** -0.318 0.023
*** -0.283 0.021
*** -0.313 0.017
*** -0.219 0.029
*** -0.271 0.030
***
Child square 0.026 0.026
*** 0.025 0.003
*** 0.026 0.003
*** 0.026 0.004
*** 0.012 0.005
*** 0.023 0.004
***
Primary men 0.104 0.065
0.139 0.049
*** 0.198 0.058
*** 0.233 0.072
*** 0.354 0.061
*** 0.256 0.102
***
Primary women -0.179 0.135
0.315 0.105
*** 0.304 0.100
*** 0.152 0.150
0.381 0.159
** 0.130 0.080
*
Disabled person 0.012 0.075
-0.015 0.042
-0.124 0.052
** -0.092 0.034
*** 0.015 0.042
-0.114 0.057
**
Market 0.060 0.098
-0.033 0.069
0.074 0.063
0.072 0.069
0.108 0.058
* 0.053 0.068
Transport 0.043 0.086
0.193 0.083
** -0.060 0.063
-0.049 0.046
-0.013 0.065
-0.012 0.075
Health 0.089 0.084
0.017 0.128
0.062 0.055
-0.006 0.074
0.020 0.086
0.088 0.074
Primary school -0.035 0.077
-0.071 0.065
-0.166 0.061
*** 0.014 0.064
0.043 0.080
0.045 0.112
Sec. school -0.065 0.060
-0.033 0.210
-0.214 0.066
*** 0.253 0.128
-1.575 0.112
*** 0.138 0.132
Farmer info -0.145 0.111
0.002 0.124
0.035 0.086
-0.028 0.087
0.094 0.087
0.125 0.124
District fixed effects
Constant 8.788 0.130
*** 9.655 0.119
*** 8.903 0.137
*** 9.661 0.285
*** 10.284 0.159
*** 9.116 0.159
***
Observations 1562 1763 1435 1458 1897 1204 R² 0.405 0.575 0.398 0.524 0.431 0.395 a Regressions with robust standard errors. Standard errors in italic. *** significant at 1%; ** significant at 5%; * significant at 10%
51
3.2.2. Rural Analysis We have at least three interesting results with respect to education and employment in the rural areas. First, the effects of education differ between the rural and the urban areas. There are only weak effects in the Northern rural areas whereas in Northern urban areas we find the strongest effects of education. Only men’s education shows positive effects on household consumption, but it is smaller than in the other regions. In urban areas women’s education has generally a much larger effect than men’s but in the rural areas this does not always hold. This suggests that providing more education per se may not immediately raise household consumption in all areas, unless more comprehensive development programmes also raise the demand for more skilled labour. It seems likely that in these areas, some of which are quite isolated, the labour market returns to education are quite low. Probably, education indicators are only imperfect indicators for the skills and knowledge that being a successful farmer in northern rural areas entails. The results also suggest that education has differential effects between rural and urban areas and that not having education within urban areas will increasingly be a contributor towards being poor and, overall, increasing inequalities. Second, and as in urban areas, household members doing non-agricultural activities have only a marginal effect on rural household consumption in 1996 while agricultural employment has no consumption effect wha tsoever. In 2002, the effects have gained in importance but in a quite different way than it does in the urban areas. In the North, non-agricultural household members have a crucial effect on the household’s consumption per capita. In the other regions’ rural areas they do not have any effect on consumption (for the South there is even a decrease in its effect). This shows on the one hand the increasing differentiation between rural and urban poverty determinants and dynamics, which are also important in understanding the regional differences in poverty, where different regions have different degrees of urbanisation. On the other hand, having non-agricultural activities raises household consumption in the North, thus emphasising the premium that these activities have for poverty reduction, even if not very many people engage in them. Additional to the effect of non-agricultural employment, agricultural employment also positively affects consumption in the Northern and Central rural areas. This is encouraging for poverty reduction reasons since most of the population lives and works in agriculture and the highest poverty rates are still observed in rural areas. What actual factor caused the effect is not immediately clear from the data. It could be an income, expenditure or production effect. Prices for the crops these farmers grow may have increased or prices of the crops they eat may have dropped. Productivity could have increased or the marketing situation improved e.g. through better market and road infrastructure which decreases the transportation costs of getting the harvest to regional or international markets. From a policy perspective, this emphasises the general need to strengthen agricultural development policies to raise productivities in farming and marketing, thus raising farm-gate prices, and hence to reduce poverty. Likewise the markets for consumption goods can still be improved across rural Mozambique.
52
Third, when looking at the regressions in Table 27 including actual instead of predicted employment variables, the results presented there would lead to different conclusions. The effect of non-agricultural employment shows significantly positive in all regions and the effect of agricultural employment is never significant. Additional to the employment variables, the education variables, especially for men, have different coefficients. Therefore, controlling for the employment decisions is a crucial step in understanding how employment and education operate on poverty reduction and on understand ing the relative importance of the agricultural and non-agricultural sectors. Finally, the effect of male-headed households exists in rural areas only in the North and the Centre, decreasing in the North but increasing in the Centre. In the South, unlike in urban areas the effect does not exist in the rural areas. The effects of the community dummies are not straightforward. We find that infrastructure variables positively affects household consumption in the Central rural areas, in 1996 through transport to the village and in 2002 through having a market in the village. Other than those, the effects are not significant or showing a puzzling sign.
4. Summary and Conclusions This study has assessed the relationship between economic growth, employment and poverty in post-war Mozambique. Drawing on recent macro-economic trends and a detailed and novel micro-economic assessment of the welfare effects of employment, we identify three important issues, namely regional and sectoral divergences, agricultural development, and gender and education. On each issue, there have been some policy successes in the past. However, recent experiences also suggest to improve past policies and to develop new policy initiatives. Before turning to each of these topics, a summary of the main findings of this study will be presented. The most fascinating finding of this study is the degree of change experienced in the economy at many levels. At the individual and household levels, for example, we found a high degree of mobility, especially for employment activities. This implies a certain flexibility of the economy and offers hope that many more households in Mozambique can escape poverty as a result of their individual choices, rather than being the victim of adverse circumstances. 4.1. Summary A key driver of poverty reduction in Mozambique in the 1990s was education, judging from the 1996 first national household survey. Yet little is known about poverty-employment linkages and the determinants of employment status during this period of rapid economic growth. In particular, the empirical literature on pro-poor growth in Mozambique does not address the mechanisms by which higher educational attainments reduce household poverty. This mechanism may operate through an indirect channe l (better employment opportunities and higher productivity) or a direct channel (an improved ability to contract goods and services).
53
Furthermore, little is known to date about the linkages between sectoral and regional changes in growth, employment and poverty in Mozambique. This is particularly important in view of the strong regional differences in poverty reduction in the period 1996 to 2003 and in view of the small increase in consumption inequality observed in that period for the whole country and fo r the urban South (including Maputo City) in particular. This paper addresses these issues by investigating the linkages between growth, employment status and poverty at the macro-economic and the household levels in Mozambique for the period 1996-97 to 2002-03. We do this by pursuing two lines of investigation. In chapter 2, we assess recent, post-war macro-economic and aggregate trends in employment and private consumption, paying particular attention to the rural-urban and the regional divides and issues of inequality. We find some impressive macro-economic progress and some strong reductions in poverty have been achieved since the end of the war. However, some very hard work remains to be done, as the less impressive poverty record of the South indicates. Furthermore, while the distribution of consumption has remained fairly stable at the national level, in the South, inequality in the distribution of consumption has increased noticeably. The experience of the South indicates that high growth alone is not sufficient for poverty reduction; even high growth does not lead to poverty reduction in times of sharply rising inequality. The pattern and sources of growth, as well as the manner in which its benefits are distributed, are equally important from the point of view of achieving the goal of poverty reduction. From this perspective, productive and remunerative employment assumes a central role in making economic growth pro-poor. Furthermore, we observed a sharp decline in the share of manufacturing employment over total non-agricultural employment in recent years. Declines in manufacturing occur in parallel to a decline in agricultural activities (both self and wage employed) and an increase in employment in services and commerce. Liberalisation of exports of raw cashew in the late nineties resulted in the replacement of large cashew processing factories by smaller firms in the North, explaining in part the large fall in manufacturing and manufacturing employment as the economy continues to adjust. Given that the current local cashew nut processing sector is labour- intensive, a decline in this industry can have negative consequences, unless the other parts of the economy adjust in such a way as to offset such negative impacts. An important policy challenge will be to assist these growing sectors to offer highly productive and attractive employment opportunities at all skill levels, thus contributing to economic growth and preventing a worsening of inequality. There is a danger that employment in these sectors may offer less value added and be less competitive, especially if they were in the non-traded sectors. Put simply, it may be that the employment structure will move from predominantly rural, low-skill, low-productivity agricultural activities to predominantly urban, low-skill, low-productivity non-agricultural services, thus constraining growth and poverty reduction.

54
It seems likely that at the national level, the high-dividend economic policy measures have already been taken and further pro-poor growth may be much harder to realise. Alternative policy strategies, developing more opportunities for productive employment by the more vulnerable households and individuals must be prioritised. At this point of our analysis, we therefore turned to the micro-economic issues of employment choices and poverty outcomes to understand better the linkages between growth, employment choices and creation and poverty reduction. In chapter 3, therefore, we analyse detailed individual and household- level employment and poverty outcomes. Two different employment categories are considered: agricultural versus non-agricultural employment and self-employment versus wage employment. We analyse employment status and consumption decisions as well as the effect of the former on the latter, using nationally representative household survey data from 1996-97 and newly available follow-up survey from 2002-03. First, we estimate the determinants of individual employment status. We find that while agricultural activities dominate in both years, the agricultural share of total employment is declining. Furthermore, mobility across different activity types is large as households are diversifying their activity base within and between sectors. This mobility is driven by education and gender. Although the importance of these variables is decreasing in urban areas, it is increasing in rural areas. Second, we find that different groups share, in the reduction of poverty to varying degrees. Poorer households benefit less from growth than better-off households, raising the issue of widening inequality. We estimate the determinants of household consumption, demonstrating for the new data set that education has positive effects on consumption in aggregate. Third, we use instrumental variable techniques to control for the joint determination of employment status (aggregated to the household level) and household consumption. Once we correct for variables affecting both employment status and consumption, we find no direct effect of employment on consumption at the household level in 1996. However, in 2002 such effect is noticeable in some regions. For instance, non-agricultural employment has significant positive effects on household consumption in urban areas. In Northern rural areas, in contrast, it is agricultural employment that has significant positive consumption effects. These findings suggest that is no single national strategy which can strengthen the pro-poor growth effects of employment across the country. Instead, we discuss three sets of policies aimed at overcoming the new challenges. These include policies dealing with (i) regional and sectoral divergences, (ii) agricultural development, and (iii) education and gender. Regionally and sectorally differentiated responses are needed, consisting of efforts to improve the quality of human capital, to raise agricultural productivity in rural areas, to increase the demand for off- farm labour in rural areas, and to strengthen inter-sectoral and inter-regional labour mobility (including rural-urban mobility). These policies may be augmented by targeted interventions to assist specific groups caught
55
in poverty traps, such as female-headed households in rural areas or the ultra-poor in urban areas. These policies will be increasingly important to prevent further increases in inequality, especially in Maputo City. 4.2. Regional and Sectoral Divergences In Mozambique, there are significant, persistent and in some instances widening economic differences. These trends include divergences in employment, poverty, aid and macro-economic performance across the regions and across sectors. A key difference between rural and urban areas in Mozambique operates through education. Not having education within urban areas increasingly acts as a contributor towards being poor and, overall, towards increasing inequality. It may be preliminary to conclude that in urban areas the growth in industry or services has actually started to affect the households involved in that sector but our results are at least suggestive of it. Therefore, barriers to employment should be removed and the quality of the human capital increased to allow more access into the rewarding sectors. To delineate these effects even further, some in-depth studies may be necessary to understand how exactly education drives employment choices and what the limitations of education in affecting employment outcomes are. In the area of manufacturing exports the challenge for the Mozambican policy makers is to maintain their cost advantage in a period of low inflation. One possible strategy is to encourage employers and trade unions to agree low real wage gains but to expand employment instead thus spreading the benefits of Mozambique’s export-oriented growth strategy across the income divide. This should be accompanied by various forms of education and training opportunities for future and current workers to allow real wage growth to be based on better labour productivity and increasing industrial value-added. In addition, the government must maintain its macroeconomic policy record as this is one aspect on which Mozambique will be able to differentiate itself from almost all its neighbouring countries (especially South Africa) without such strategy requiring large, direct financial commitments by the gove rnment or donors. Furthermore, regional imbalances may be countered in part through stronger national and international integration of Mozambique, including with its immediate neighbours. Both the exchange of labour (for example with South Africa) and the trade of local agricultural produce (for example with Malawi) may generate further economic stimuli for the low skilled and for those not connected with the growth occurring in large urban areas or through the ,mega projects. This can be complemented by stronger national markets, allowing price signals and goods to be carried across Mozambique and into its neighbouring economies. Enhancing national market integration should also be an important policy objective of international donors. 4.3. Agricultural Development Agricultural (and hence rural) development matters dramatically for Mozambican poverty reduction. While export-oriented plantations may offer increasing
56
employment opportunities to poor landless or land constrained farmers (Cramer and Pontara 1998), such income opportunities are likely to be seasonal and insecure, transferring few skills, and badly paid. Given the weaknesses with the implementation of the land law, the low agricultural minimum wage, and the absence of strong judicial and civil institutions supporting the rights of rural workers, traditional export crops, except for cashew, do not offer a significant hope for the majority of rural smallholders to escape their structural poverty. Governments in many countries used to neglect the rural non-agricultural sector, but recently it has gained importance in poverty reduction strategies for example through a stronger emphasis on the promotion of small-scale businesses and attempts to increase access to (micro-) credit in rural areas. In Mozambique’s development strategy, too, the role of private initiatives is recognized, including for rural areas. For example, in the agricultural and rural development section, one of the six fundamental areas of action, increasing rural access to credit is recognized as an important strategy to increase rural initiatives and the measures to do so include the creation of thirty micro-finance institutions in rural areas (Government of Mozambique 2001). Agricultural development efforts should be intensified, as this has strong welfare effects especially in the Northern and Central rural areas. Agricultural production could be enhanced by supporting productivity, marketing and international trading possibilities. The role of agriculture, though only a quarter of national GDP, matters hugely to poverty reduction given that over two thirds of the population is active in that category and that it still shows the lowest average consumption. Rural infrastructure and public goods are often highly significant determinants of the probability to choose for an occupation type, though the role of these variables has diminished over time possibly due to the expansion and upgrading of these facilities in recent years. Mozambique may now have to prepare rural and urban second-generation infrastructure to cope with new challenges as a result of new industrial, economic and social developments. For example, individuals and households who do and cannot work in a growing region, sector, or type of employment, other type of poverty reducing support may be necessary. Such measures should include social safety nets and policies aimed at creating access to the more rewarding types of employment. In most areas of Mozambique, such policies and institutions do not yet exist. On balance, our results are neither wholly confirming nor contradicting the findings of Lanjouw and Lanjouw (2001). We demonstrate that, in the Northern rural areas only, non-farm employment leads to significantly higher household expenditures. In rural Central and Southern areas, however, agricultural employment is better. Such regional divergences indicate the urgent need to differentiate national policies locally and to develop strong planning, and evaluation tools for local policy initiatives. 4.4. Gender and Education Our study demonstrates the importance of gender and education as determinants of access to employment. Although the importance of both factors is decreasing in urban
57
areas, they are actually increasing in rural areas. To relieve the gender constraint in the field of employment, policies may have to address the underlying cultural, political ands social constraints for female labour demand. At the same time, the female labour supply has to be increased in quality through ore and better education for girls and women. Secondary education is not yet a key determinants of employment choices in Mozambique. Rather, completing primary education is the more important determinant. Concerning the analysis of the consumption effects of employment, we found that initially it is not employment per se that matters most. Instead, there are large effects of variables related to both consumption and employment access, especially in 2002-03. We observe that the categories and the sectors of employment that are growing are starting to have effects on the persons working in the sector. For example, in 2002 having more adults who work in a non-agricultural environment significantly increases household per capita consumption in urban areas. Overall, we confirm that education is an effective tool for reducing poverty in Mozambique. However, we also find that providing more education per se may not immediately raise household consumption in all areas, unless more comprehensive development programmes also raise the demand for more skilled labour. We believe that this an important insight which should be addressed alongside the ongoing expansion of education in Mozambique.

58
59
Bibliography
Addison, T. and C. de Sousa (1999). "Economic Reform and Economic Reconstruction in Mozambique". Evaluating Economic Liberalization. M. McGillivray and O. Morrissey. Basingstoke, Macmillan Press: 163-185.
Barrett, C. B., T. Reardon, et al. (2001). "Non farm Income Diversification and Household Livelihood Strategies in Rural Africa: Concepts, Dynamics, and Policy Implications." Food Policy 26(4): 315-31.
Brück, T. (2003). "Land Access, Tenure and Investment in Post-War Northern Mozambique". DIW Berlin Discussion Paper. 358.
Brück, T. (2004). "The Welfare Effects of Farm Household Coping Strategies in Post-War Mozambique". DIW Berlin Discussion Paper. Berlin. 413.
Castel-Branco, C. N. (1999). "The HIPC Initiative in Mozambique: A Missed Opportunity?" London, Africa Centre.
Castel-Branco, C. N. (2004). What is the Experience and Impact of South African Trade and Investment on Growth and Development of Host Economies? A View from Mozambique. Conference on Stability, Poverty Reduction and South African Trade and Investment in Southern Africa, Pretoria.
Colletta, N. J., M. Kostner, et al. (1996). The Transition from War to Peace in Sub-Saharan Africa. Washington, D.C., World Bank.
Cramer, C. and N. Pontara (1998). "Rural Poverty and Poverty Alleviation in Mozambique: What's Missing from the Debate?" Journal of Modern African Studies 36(1): 101-138.
Dercon, S. and P. Krishnan (1996). "Income Portfolios in Rural Ethiopia and Tanzania: Choices and Constraints." Journal of Development Studies 32(6): 850-875.
Elbers, C., P. Lanjouw, et al. (2004). "On the Unequal Inequality of Poor Communities." World Bank Economic Review 18(3): 401-421.
Falck, H. (1999). Mozambique in a Post-Washington Consensus Perspective. Stockholm, SIDA. 3.
Fox, L., E. Bardasi, et al. (2005). "Evolution of Poverty and Inequality in Mozambique, 1996/7-2002/3". Maputo, World Bank.
Gibson, J. and S. Rozelle (2003). "Poverty and Access to Roads in Papua New Guinea." Economic Development and Cultural Change 52(1): 159-85.
Government of Mozambique (1998). "Understanding Poverty and Well-Being in Mozambique: The First National Assessment (1996-97)". Maputo, Government of Mozambique, Eduardo Mondlane University, International Food Policy Research Institute.
Government of Mozambique (2001). "Action Plan For The Reduction Of Absolute Poverty (2001-2005) (PARPA)", Republic of Mozambique.
Government of Mozambique (2004). "Poverty and Well-Being in Mozambique: The Second National Assessment (2002-2003)". Maputo, Ministry of Planning and Finance, International Food Policy Research Institute and Purdue University.
Haddad, L. and J. Hoddinott (1994). "Women’s Income and Boy-Girl Anthropometric Status in the Cote D'Ivoire." World Development 22(4): 543-553.
Heltberg, R. and F. Tarp (2002). "Agricultural Supply Response and Poverty in Mozambique." Food Policy 27(2): 103-124.
60
Hoddinott, J. and L. Haddad (1995). "Does Female Income Share Influence Household Expenditures - Evidence From Cote d'Ivoire." Oxford Bulletin of Economics and Statistics 57(1): 77-96.
Instituto Nacional de Estatística (1999). "Inquérito Nacional aos Agregados Familiares sobre Condições de Vida 1996-1997: Quadros Gerais". Maputo.
Instituto Nacional de Estatística (2004). "Inquérito Nacional aos Agregados Familiares sobre Orçamento Familiar 2002/3". Maputo.
International Monetary Fund (1998). "Republic of Mozambique: Selected Issues". IMF Staff Country Report. Washington, D.C. 98/59.
International Monetary Fund and International Development Association (2000). Republic of Mozambique: Decision Point Document for the Enhanced Heavily Indebted Poor Countries (HIPC) Initiative. Washington D.C.
Isgut, A. E. (2004). "Non-farm Income and Employment in Rural Honduras: Assessing the Role of Locational Factors." Journal of Development Studies 40(3): 59-86(28).
James, R. C., C. Arndt, et al. (2005). "Has economic growth in Mozambique been pro-poor?". Ministry of Planning and Finance, Purdue University and International Food Policy Research Institute.
Justino, P. and J. Litchfield (2002). "Welfare in Vietnam during the 1990s: Poverty Inequality and Poverty Dynamics". The Poverty Research Unit, Sussex.
Klasen, S. and S. Woltermann (2004). "The Impact of Demographic Dynamics on Economic Development, Poverty and Inequality in Mozambique". Background Paper for CEM Mozambique.
Lanjouw, J. O. and P. Lanjouw (2001). "The Rural Non-farm Sector: Issues and Evidence from Developing Countries." Agricultural Economics 26(1): 1-23.
Lopes, P. S. and E. Sacerdoti (1991). "Mozambique: Economic Rehabilitation and the Poor". IMF Working Paper. Washington, D.C., International Monetary Fund. WP/91/101.
Maximiano, N., C. Arndt, et al. (2005). "Qual foi a Dinâmica dos Determinantes da Pobreza em Moçambique". Maputo, Direcção Nacional do Plano e Orçamento, Ministério de Planificação e Desenvolvimento.
Mecharla, P. (2002). "Determinants of inter-district variations in rural non-farm employment in Andhra Pradesh (India)". The Poverty Research Unit, Sussex.
Narayan, D. and L. Pritchett (1999). "Cents and sociability: Household income and social capital in rural Tanzania." Economic Development and Cultural Change 47(4): 871-897.
Ravallion, M. and M. Lokshin (2003). "On the utility consistency of poverty lines". World Bank Policy Research Working Paper. Washington D.C., World Bank. 3157.
Reardon, T. (2000). "Effects of Non-Farm Employment on Rural Income Inequality in Developing Countries: An Investment Perspective." Journal of Agricultural Economics 51(2): 266-88.
Reardon, T., C. Delgado, et al. (1992). "Determinants and Effects of Income Diversification Amongst Farm Households in Burkina-Faso." Journal of Development Studies 28(2): 264-296.
Tschirley, D. and R. Benfica (2001). "Smallholder agriculture, wage labour and rural poverty alleviation in land-abundant areas of Africa: evidence from Mozambique." Journal of Modern African Studies 39(2): 333-358.

61
Tschirley, D. L. and M. T. Weber (1994). "Food Security Strategies Under Extremely Adverse Conditions: The Determinants of Household Income and Consumption in Rural Mozambique." World Development 22(2): 159-73.
Ubide, A. (1997). "Determinants of Inflation in Mozambique". IMF Working Paper. Washington, D.C., International Monetary Fund. WP/97/145.
UNDP (1998). Mozambique Development Cooperation Report 1995-1997. Maputo. UNDP (1999). Mozambique National Human Development Report 1999. Maputo. UNDP (2001). Mozambique National Human Development Report 2001. Maputo. World Bank (1997). "Mozambique: Agricultural Sector Memorandum", Volume I.
Washington, D.C. 16529 MOZ. World Bank (2004). World Development Indicators. Washington D.C. --- (2005). World Development Indicators 2005 (CD-Rom). Washington D.C.

62
63
Issues in Employment and Poverty Discussion Papers
1. Azizur Rahman Khan: Employment Policies for Poverty Reduction (November 2001)
2. Rizwan Islam: Employment Implications of the Global Economic Slowdown 2001: Responding with a Social Focus (November 2001)
3. Rohini Nayyar: The Contribution of Public Works and Other Labour-Based Infrastructure to Poverty Alleviation: The Indian Experience (September 2002)
4. K. Sundaram and Suresh D. Tendulkar: The Working Poor In India: Employment-Poverty Linkages and Employment Policy Options (September 2002)
5. Stephen Devereux: From Workfare to Fair Work: The Contribution of Public Works and Other Labour-based Infrastructure Programmes to Poverty Alleviation (November 2002)
6. Mustafa K. Mujeri: Bangladesh: Bringing Poverty Focus in Rural Infrastructure Development (November 2002)
7. G.K. Chadha: Rural Employment in India: Current Situation, Challenges and Potential for Expansion (February 2003)
8. Rizwan Islam: Labour Market Policies, Economic Growth and Poverty Reduction: Lessons and Non-lessons from the Comparative Experience of East, South-East and South Asia (April 2003)
9. Pham Lan Huong, Bui Quang Tuan, Dinh Hien Minh: Employment Poverty Linkages and Policies for Pro-poor growth in Vietnam (May 2003)
10. Rushidan Islam Rahman and K.M. Nabiul Islam: Employment Poverty Linkages: Bangladesh (August 2003)
11. Luis Carlos Jemio and María del carmen Choque: Employment-Poverty Linkages and Policies: The Case of Bolivia (August 2003)
12. Mulat Demeke, Fantu Guta and Tadele Ferede :: Growth, employment, poverty and policies in Ethiopia: an empirical investigation (August 2003)
13. Nina Torm: The Nexus of Economic Growth, Employment and Poverty during Economic Transition: An Analysis of Armenia, Kazakhstan, Kyrgyzstan, Moldova, Tajikistan and Uzbekistan (October 2003)
14. Rizwanul Islam: The Nexus of Economic Growth, Employment and Poverty Reduction: An Empirical Analysis (January 2004)
15. Azizur Rahman Kahn: Growth, Inequality and Poverty: A Comparative Study of China’s Experience in the Periods Before and After the Asian Crisis (March 2004)
16. Kabann I.B. Kabananukye, Adrine E.K. Kabananukye, J.K. Krishnamurty, Daisy Owomugasho: Economic Growth, Employment, Poverty and Pro-Poor Policies in Uganda (April 2004)
17. Rushidan Islam Rahman: Employment Route to Poverty Reduction in Bangladesh: Role of Self-Employment and Wage Employment (November 2004)
18. S.R. Osmani: The role of employment in promoting the Millennium development goals (October 2005)

64
19. Azizur Rahman Khan: Growth, employment and poverty: An analysis of the vital nexus based on some recent UNDP and ILO/SIDA studies (October 2005)
20. Medhi Krongkaew, Suchittra Chamnivickorn and Isriya Nitithanprapas: Economic growth, employment and poverty reduction: The case of Thailand (January 2006)
21. Tilman Brück and Katleen van den Broeck: Growth, employment and poverty in Mozambique (January 2006)