Embed Size (px)
Citation preview

Guide to recessions:When is the next U.S. recession and how should you prepare for it?
Investments are not FDIC-insured, nor are they deposits of or guaranteed by a bank or any other entity, so they may lose value.Past results are not predictive of results in future periods.
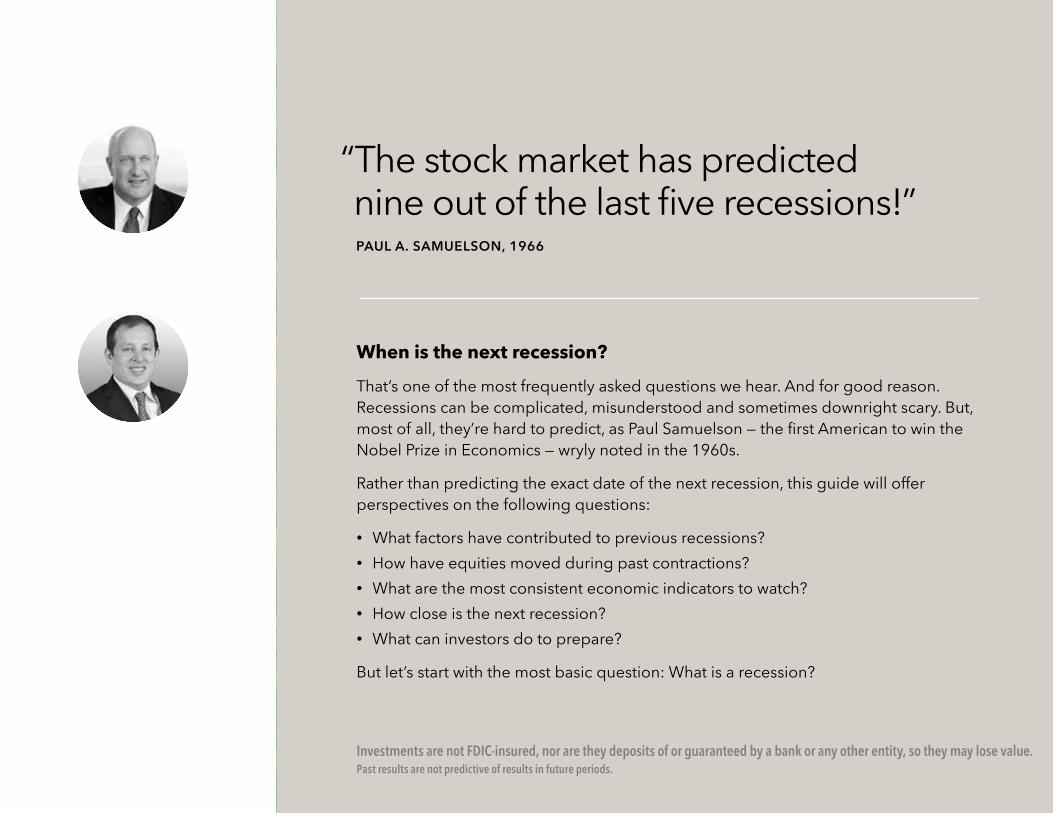
“The stock market has predicted nine out of the last five recessions!” PAUL A. SAMUELSON, 1966
When is the next recession?
That’s one of the most frequently asked questions we hear. And for good reason.
Recessions can be complicated, misunderstood and sometimes downright scary. But,
most of all, they’re hard to predict, as Paul Samuelson — the first American to win the Nobel Prize in Economics — wryly noted in the 1960s.
Rather than predicting the exact date of the next recession, this guide will offer
perspectives on the following questions:
• What factors have contributed to previous recessions?
• How have equities moved during past contractions?
• What are the most consistent economic indicators to watch?
• How close is the next recession?
• What can investors do to prepare?
But let’s start with the most basic question: What is a recession?
DARRELL SPENCE
Economist
JARED FRANZ
Economist
CE credit available
Earn one hour of CE credit from CFP
and CIMA by completing a short quiz
at the following link:
https://www.tfaforms.com/4721404
GUIDE TO RECESSIONS · 2
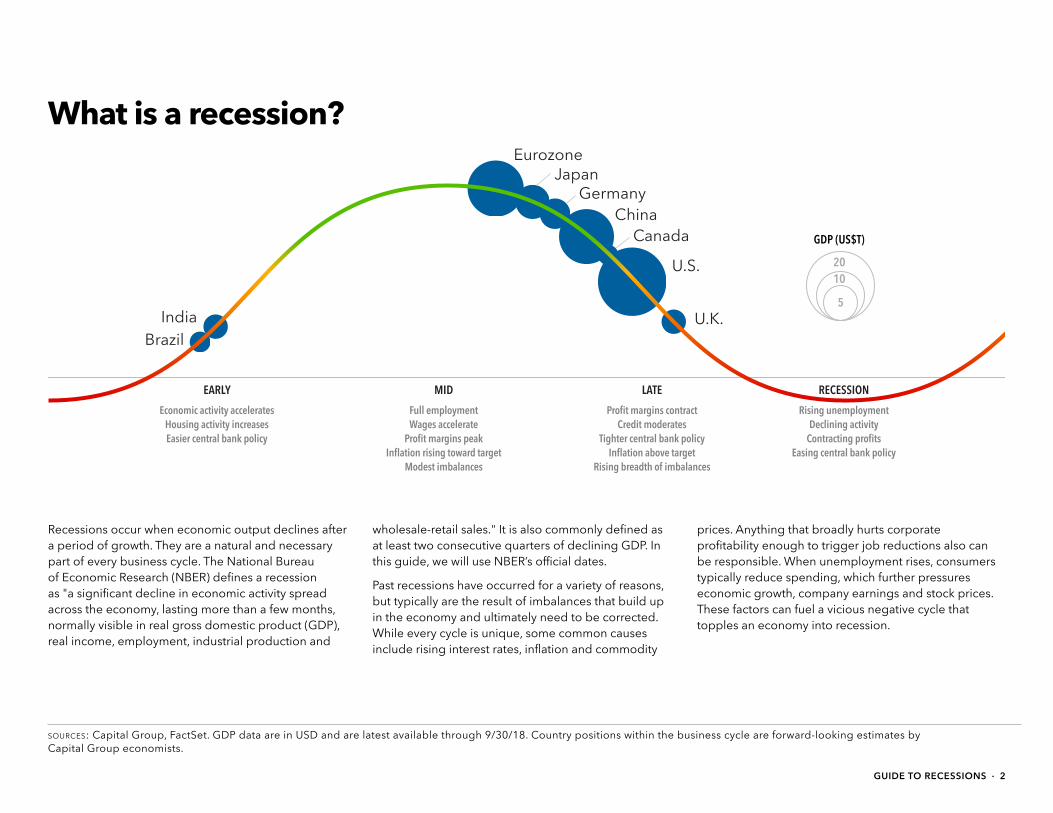
Recessions occur when economic output declines after
a period of growth. They are a natural and necessary
part of every business cycle. The National Bureau of Economic Research (NBER) defines a recession as "a significant decline in economic activity spread across the economy, lasting more than a few months,
normally visible in real gross domestic product (GDP), real income, employment, industrial production and
wholesale-retail sales." It is also commonly defined as at least two consecutive quarters of declining GDP. In this guide, we will use NBER’s official dates.
Past recessions have occurred for a variety of reasons, but typically are the result of imbalances that build up
in the economy and ultimately need to be corrected.
While every cycle is unique, some common causes include rising interest rates, inflation and commodity
prices. Anything that broadly hurts corporate
profitability enough to trigger job reductions also can be responsible. When unemployment rises, consumers
typically reduce spending, which further pressures
economic growth, company earnings and stock prices.
These factors can fuel a vicious negative cycle that topples an economy into recession.
U.S.
U.K.
Eurozone
China
JapanGermany
Brazil
India
Canada
20
10
5
GDP (US$T)
EARLY
Economic activity accelerates
Housing activity increases
Easier central bank policy
MID
Full employment
Wages accelerate
Profit margins peakInflation rising toward target
Modest imbalances
LATE
Profit margins contractCredit moderates
Tighter central bank policy
Inflation above targetRising breadth of imbalances
RECESSION
Rising unemployment
Declining activity
Contracting profitsEasing central bank policy
GDP (US$T)
What is a recession?
sources: Capital Group, FactSet. GDP data are in USD and are latest available through 9/30/18. Country positions within the business cycle are forward-looking estimates by Capital Group economists.

3 · GuIDe To recessIoNs
How long do recessions last?
The good news is that recessions generally don’t
last very long. Our analysis of 10 cycles since 1950 shows that recessions have ranged from eight to 18 months, with the average lasting about 11 months. For those directly affected by job loss or business closures, that can feel like an eternity. But investors with a long-term investment horizon would be better served looking at the full picture.
Recessions are relatively small blips in economic history. Over the last 65 years, the U.S. has been in an official recession less than 15% of all months. Moreover, the net economic impact of most recessions also is relatively small. The average expansion increased economic output by 24%, whereas the average recession only reduced GDP less than 2%. Equity returns can even be positive over the full length of a contraction, since some of the strongest stock rallies have occurred during the late stages of a recession.
50%
25
0
–5
1950 1955 1960 1965 1970 1975 1980 1985 1990 1995 2000 2005 2010 2015
Cumulative GDP growth (%)
AVERAGERECESSION
11–1.8%
3%
–1.9M
AVERAGEEXPANSION
6724.3%
117%
12M
Months
GDP growth
S&P 500 return
Net jobs added
sources: Capital Group, National Bureau of Economic Research, Thomson Reuters. As of 9/30/18. Since NBER announces recession start and end months rather than exact dates, we have used month-end dates as a proxy for calculations of S&P 500 returns and jobs added. Nearest quarter-end values used for GDP growth rates. GDP growth shown on a logarithmic scale.
Recessions are painful but expansions have been powerful

GUIDE TO RECESSIONS · 4
What happens to the stock market during a recession?
Even if a recession does not appear to be imminent, it’s never too early to think about how one could affect your portfolio. That’s because bear
markets and recessions usually overlap at times, with equities tending to peak about seven months before the economic cycle. NBER doesn’t officially identify recessions until well after they begin. By then,
equities already may have been declining for months.
Just as equities often lead the economy on the way
down, they have also led on the way back up. The Standard & Poor’s 500 Composite Index typically bottoms out about six months after the start of a
recession, and usually begins to rally before the
economy starts humming again. (Keep in mind,
these are just market averages and can vary widely between cycles.) Aggressive market-timing moves, such as shifting an entire portfolio into cash, often
can backfire. Some of the strongest returns can occur during the late stages of an economic cycle or
immediately after a market bottom. It’s often better
to stay invested to avoid missing out on the upswing.
–24 –22 –20 –18 –16 –14 –12 –10 –8 –6 –4 –2 0 2 4 6 8 10 12 14 16 18 20 22 24
Months before/after cycle peak
115
110
105
100
95
90
102
100
98
96
94
92
S&P 500
Cycle peak
Market peak
Industrial production
sources: Capital Group, Federal Reserve Board, Haver Analytics, National Bureau of Economic Research, Standard & Poor’s. Data reflects the average of all cycles from 1950 to present, indexed to 100 at each cycle peak.
Equities typically peak months before a recession, but can bounce back quickly

5 · GuIDe To recessIoNs
What economic indicators can warn of a recession?
Inverted yield curve
Corporate profits Unemployment
Housing starts
Leading Economic Index®
Recession warning
sign
10-year yields below two-year yields
Declining from cycle peak
Rising from cycle trough
Declining at least 10% from previous year
Declining at least 1% from previous year
Why it’s important
Often a sign the Fed has hiked short-term
rates too high or investors are seeking
long-term bonds over riskier assets
When profits decline, businesses
cut investment, employment and wages
When unemployment rises, consumers cut
back on spending
When the economic outlook is poor, homebuilders
often cut back on housing projects
Aggregation of multiple leading
economic indicators, gives broader look
at economy
Average months
until recession
15.7 26.2 6.1 5.3 4.1
source: Capital Group.
Wouldn’t it be great to know ahead of time when
a recession is coming? Despite Paul Samuelson’s warning about the hazards of predictions, there
are some generally reliable signals worth watching
closely as the economy reaches its late cycle.
Many factors can contribute to a recession and the
main causes often change each cycle. Therefore,
it’s helpful to look at many different aspects of the
economy to better gauge where excesses and
imbalances may be building. Keep in mind that any
indicator should be viewed more as a mile marker than a distance-to-destination sign. But here are five that provide a broad look at the economy.
For each, we will try to answer three key questions:
• Why is the indicator important?• What does history tell us?• Where are we now?

GUIDE TO RECESSIONS · 6
Indicator 1: Inverted yield curve
An inverted yield curve may sound like an elaborate gymnastics routine, but it actually
is one of the most accurate and widely cited
recession signals. The yield curve inverts when short-term rates are higher than long-
term rates. This market signal has preceded
every U.S. recession over the past 50 years. Short-term rates typically rise during Fed tightening cycles. Long-term rates can fall
when there is high demand for bonds. An
inverted yield curve is a bearish sign, because it indicates that many investors are moving to the perceived safe haven of long-term government bonds rather than buying riskier assets.
In December 2018, the yield curve between two-year and five-year Treasury notes inverted for the first time since 2007. Other parts of the curve — such as the more commonly referenced two-year/10-year yields — have not inverted thus far. However, even an inverted yield curve in that range is not cause for immediate panic, as there typically has been a
significant lag (16 months on average) before the start of a recession. There is debate over whether central bank interventions in the bond market have distorted the yield curve to the point where it now may be a less
reliable economic indicator, but that remains
to be seen.
–3
–2
–1
0
1
2
3
1962 1966 1970 1974 1978 1982 1986 1990 1994 1998 2002 2006 2010 2014 2018
Spread between 10-year and two-year Treasury yields
Upward sloping yield curve
Invertedyield curve
sources: Capital Group, Thomson Reuters. As of 12/31/18. One-year rates used instead of two-year rates prior to 6/30/76. Start dates in table do not include periods when the curve was only inverted at month-end for one month. Shaded bars represent U.S. recessions as defined by the National Bureau of Economic Research.
Inverted yield curve
Months until
recession
1968 20
1973 8
1978 17
1980 10
1989 18
2000 13
2005 24
Average 15.7
Yield curve is at its flattest level this cycle

7 · GuIDe To recessIoNs
Corporate profits as a % of GDP
2
4
6
8
10
12
14%
1950 1956 1962 1968 1974 1980 1986 1992 1998 2004 2010 2016
Indicator 2: Corporate profits
As profit margins expand, companies can ramp-up investment, hire more workers and increase wages. These benefit both the business and consumer sides of the economy,
supporting longer periods of expansion.
Profits as a percent of GDP usually peak midcycle for the overall economy and start decelerating long before the start of
a recession.
Corporate profits are still at high levels from a historical perspective but there is reason to believe they may have already peaked. Earnings likely will come under more pressure
in the face of rising wages and inflation, diminishing benefits of tax reform and higher input costs due to global trade uncertainty.
If 2012 was the peak of corporate profits as a percent of GDP, we already are past the average lead time of 26 months between the peak and the onset of the next recession.
sources: Bureau of Economic Analysis, Federal Reserve, Thomson Reuters. As of 9/30/18. Shaded bars represent U.S. recessions as defined by the National Bureau of Economic Research.
Peak corporate
profits
Months until
recession
1950 31
1955 20
1959 10
1965 48
1973 0
1979 7
1980 10
1984 76
1997 42
2006 18
Average 26.2
Corporate profits may have peaked years ago
GuIDe To recessIoNs · 8
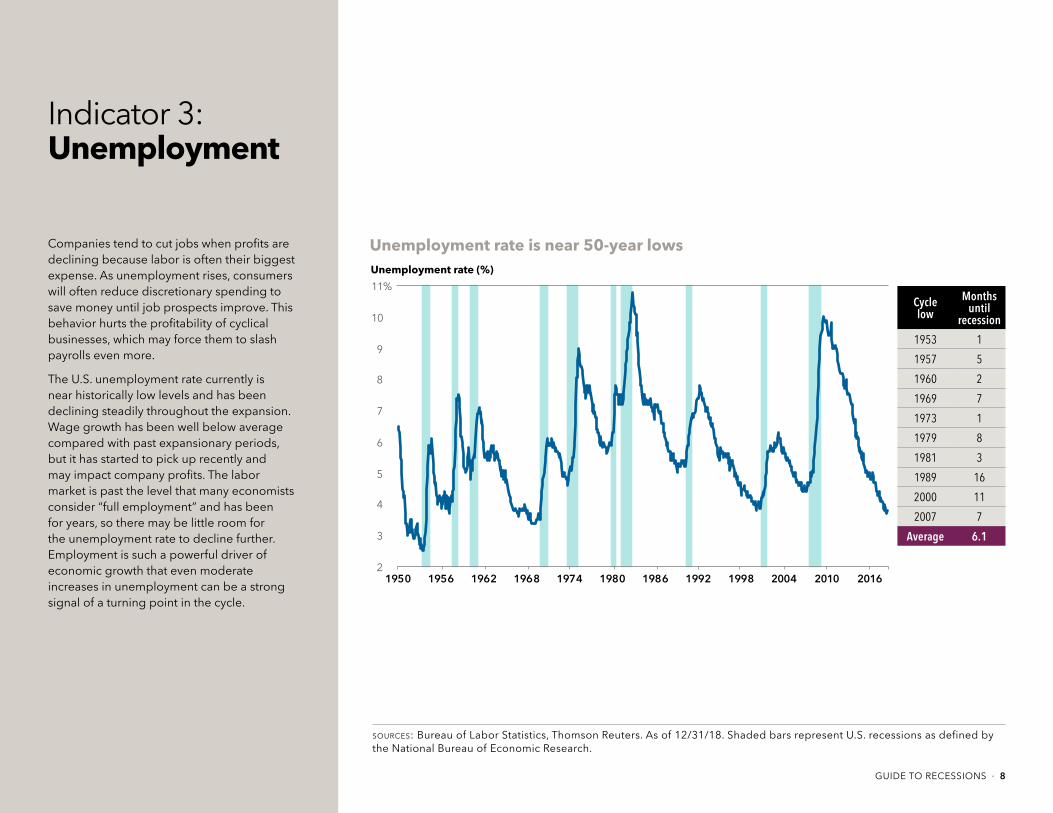
Indicator 3: Unemployment
Companies tend to cut jobs when profits are declining because labor is often their biggest
expense. As unemployment rises, consumers
will often reduce discretionary spending to
save money until job prospects improve. This behavior hurts the profitability of cyclical businesses, which may force them to slash
payrolls even more.
The U.S. unemployment rate currently is near historically low levels and has been declining steadily throughout the expansion.
Wage growth has been well below average compared with past expansionary periods,
but it has started to pick up recently and
may impact company profits. The labor market is past the level that many economists consider “full employment” and has been for years, so there may be little room for
the unemployment rate to decline further.
Employment is such a powerful driver of economic growth that even moderate increases in unemployment can be a strong
signal of a turning point in the cycle.
2
3
4
5
6
7
8
9
10
11%
1950 1956 1962 1968 1974 1980 1986 1992 1998 2004 2010 2016
Unemployment rate (%)
sources: Bureau of Labor Statistics, Thomson Reuters. As of 12/31/18. Shaded bars represent U.S. recessions as defined by the National Bureau of Economic Research.
Cycle low
Months until
recession
1953 1
1957 5
1960 2
1969 7
1973 1
1979 8
1981 3
1989 16
2000 11
2007 7
Average 6.1
Unemployment rate is near 50-year lows

Indicator 4: Housing starts
Housing represents a significant portion of U.S. GDP and can provide an important glimpse into the health of the broader
economy. A robust housing market can help
fuel the economy by supplying property
taxes for government spending, creating construction jobs and increasing homeowner wealth. Housing starts are a strong leading
indicator because construction projects can take several months, and homebuilders are reluctant to break ground on new projects if they fear the economy may slump later.
A 10% decline in housing starts has preceded most recessions, and a 25% drop is not uncommon near the start of a
contraction. As of November 2018, housing starts were essentially flat from the previous year and have been slowly decelerating in recent months. Higher mortgage rates have provided a headwind, but that may change if the Federal Reserve slows the pace of interest rate hikes in 2019.
Housing starts (year-over-year growth, six-month smoothed average)
–60
–40
–20
0
20
40
60
80
100%
1960 1966 1972 1978 1984 1990 1996 2002 2008 2014
THRESHOLD
sources: Thomson Reuters, U.S. Census Bureau. As of 11/30/18. To avoid double counting periods, the table excludes 1965, 1966 and 1987, which were periods when housing starts hit the decline threshold but had positive year-over-year growth again before the start of the next recession. Shaded bars represent U.S. recessions as defined by the National Bureau of Economic Research.
Housing starts
decline 10%
Months until
recession
1969 0
1973 1
1979 8
1981 0
1989 7
2006 16
Average 5.3
New housing starts have been flat over the past year
9 · GuIDe To recessIoNs

GuIDe To recessIoNs · 10
Indicator 5: The Leading Economic Index®
Since no economic indicator should be
viewed in a vacuum, many economists and market prognosticators form their own
aggregated scorecard of favorite indicators to gauge the health of the economy. The
Conference Board’s Leading Economic Index
(LEI) is one such readily available measure. The index reflects 10 factors that include wages, unemployment claims, manufacturing
orders, stock prices, housing permits and
consumer expectations.
In September 2018, the LEI had risen 7% over the previous year — its fastest growth in eight years. It has decelerated a bit since then,
rising 4.3% in December. The LEI has been remarkably consistent in signaling recessions,
but doesn’t provide much lead time once it starts declining. Over the last seven economic cycles, an LEI decline of at least 1% from the previous year preceded the start of a recession by an average of four months.
sources: The Conference Board, Thomson Reuters. As of 12/31/18. Start dates in table reflect periods when the LEI declined by at least 1% from the previous year in consecutive months. Shaded bars represent U.S. recessions as defined by the National Bureau of Economic Research.
Leading Economic Index (12-month % change)
–25
–20
–15
–10
-5
0
5
10
15
20%
1960 1965 1970 1975 1980 1985 1990 1995 2000 2005 2010 2015
THRESHOLD
Start of LEI
decline
Months until
recession
1969 1
1973 0
1979 7
1981 0
1990 6
2000 4
2007 11
Average 4.1
LEI is still rising, but has started to decelerate

11 · GuIDe To recessIoNs
How close are we to the next recession?
The previous indicators are a small sampling of ways to take the temperature of the U.S. economy. One or two negative readings can be meaningless. But when several key indicators start flashing red for a sustained period, the picture becomes clearer and
far more significant. In our view, that time has not yet arrived.
While some imbalances are developing, they don’t seem extreme enough to derail economic growth
in the near term. The culprit that ultimately sinks the
current expansion may one day be obvious: Rising interest rates, higher inflation, or unsustainable debt levels can be major triggers. Global trade conflicts may further pressure the economy and produce
unexpected consequences.
These events, if they continue, do suggest that the economy could weaken in the next two years,
placing a 2020 recession on the horizon. But we are
not there yet. If we have learned anything from Paul Samuelson, predicting exactly when a recession will
hit is little more than baseless speculation.
sources: Federal Reserve Bank of New York, Thomson Reuters. As of 12/31/18. Shaded bars represent U.S. recessions as defined by the National Bureau of Economic Research.
The likelihood of a recession in 2019 is rising, but remains low
NY Fed model: Probability of recession in 12 months
0
10
20
30
40
50
60
70
80
90
100%
1962 1967 1972 1977 1982 1987 1992 1997 2002 2007 2012 2017
A 30% threshold has been reached
before every recession

GuIDe To recessIoNs · 12
How should you position your stock portfolio for a recession?
SECTOR SCORECARD
SECTORS&P 500
ABOVE / BELOW DIVIDEND
YIELD (%) 1987 1990 1998 2000–02 2007–09 2010 2011
CONSUMER STAPLES 8 0 3.1
UTILITIES 8 0 3.4
HEALTH CARE 7 1 1.7
TELECOMMUNICATION SERVICES* 7 1 5.3
ENERGY 4 4 3.5
MATERIALS 3 5 2.1
CONSUMER DISCRETIONARY 2 6 1.4
FINANCIALS 2 6 2.1
INFORMATION TECHNOLOGY 2 6 1.6
INDUSTRIALS 1 7 2.2
Above S&P 500 Below S&P 500
2018
–32.9 –18.7 –19.2 –47.4 –55.3 –15.6 –18.6S&P 500 RETURN (%) –19.2
sources: Capital Group, FactSet. As of 12/31/18. Includes the last seven periods that the S&P 500 declined by more than 15% on a total return basis. Sector returns for 1987 are equally weighted, using index constituents from 1989, the earliest available.
*The telecommunication services sector dividend yield is as of 9/24/18. After this date the sector was renamed communication services and its company composition was materially changed. During the 2018 decline, the sector would have had a higher return than the S&P 500 using either the new or old company composition.
Through eight declines, some sectors have finished above the overall marketWe’ve already established that equities often do poorly during recessions, but trying to time the
market by selling stocks can be ill-advised. So should investors do nothing? Certainly not. Investors should take the opportunity to review their overall asset allocation — which may have changed significantly during the bull market — and ensure that their portfolio
is balanced and broadly diversified. Consulting a financial advisor can help immensely since these often can be emotional decisions for investors.
Not all stocks respond the same during periods
of economic stress. Through the last eight major declines, some sectors held up more consistently than
others. Consumer staples and utilities, for example,
often have paid meaningful dividends, which can offer steady return potential when stock prices are
broadly declining. Growth-oriented stocks still have a place in portfolios, but investors may want to consider companies with strong balance sheets, consistent cash
flows and long growth runways that can withstand short-term volatility. Even in a recession, many companies remain profitable. Focus on companies with products and services that people will continue to use every day.

13 · GuIDe To recessIoNs
How should you position your bond portfolio for a recession?
Fixed income investments can provide an essential measure of stability and capital preservation, especially when equity markets are volatile. Over the last six market corrections, U.S. bond market returns — as measured by the Bloomberg Barclays U.S. Aggregate Index — were flat or positive in five out of six periods.
Achieving the right fixed income allocation is always important. But with the U.S. economy entering 2019 in late-cycle territory, it’s critical for investors to ensure that core bond holdings provide balance to their portfolio. Investors don’t necessarily need to increase their bond allocation ahead of a recession,
but they should insure that their fixed income exposure provides elements of the four roles that bonds play: diversification from equities, income, capital preservation and inflation protection.
4/23/10–
7/2/10
4/29/11–
10/3/11
5/21/15–
8/25/15
11/3/15–
2/11/16
1/26/18–
2/8/18
3.05.4
0.01.9
–1.0
1.6
–15.6
–18.6
–11.9 –12.7
–10.1
–19.4Bloomberg Barclays U.S. Aggregate Index
S&P 500 Index
FLASHCRASH
U.S. INFLATION/RATE SCARE
OIL PRICESHOCK
CHINASLOWDOWN
U.S. DEBTDOWNGRADE
GLOBALSELLOFF
9/20/18–
12/24/18
sources: Bloomberg Index Services, Ltd., RIMES, Standard & Poor’s. Dates shown for market corrections are based on price declines of 10% or more (without dividends reinvested) in the S&P 500 with at least 50% recovery between declines for the earlier five periods shown. The most recent period is still in correction phase as of 12/31/18. The returns are based on total returns.
High-quality bonds have shown resilience when stock markets are unsettled

GuIDe To recessIoNs · 14
What should you do to prepare for a recession?
• Stay calm and keep a long-term perspective.
• Maintain a balanced and broadly diversified portfolio.
• Balance equity portfolios with a mix of dividend-paying companies and growth stocks.
• Choose funds with a strong history of weathering market declines.
• Use high-quality bonds to offset equity volatility.
• For some investors, income protection in the form of variable annuities can be a good strategy.
• Talk to your advisor about how to navigate periods of market volatility.
Investors should carefully consider investment objectives, risks, charges and expenses. This and other important information is contained in the fund prospectuses and summary prospectuses, which can be obtained from a financial professional and should be read carefully before investing. Standard & Poor’s 500 Composite Index is a market capitalization-weighted index based on the average weighted results for approximately 500 widely held common stocks. The S&P 500 is a product of S&P Dow Jones Indices LLC and/or its affiliates and has been licensed for use by Capital Group. Copyright © 2019 S&P Dow Jones Indices LLC, a division of S&P Global, and/or its affiliates. All rights reserved. Redistribution or reproduction in whole or in part are prohibited without written permission of S&P Dow Jones Indices LLC.
Bloomberg Barclays U.S. Aggregate Index represents the U.S. investment-grade fixed-rate bond market. This index is unmanaged, and its results include reinvested dividends and/or distributions but do not reflect the effect of sales charges, commissions, account fees, expenses or U.S. federal income taxes. Bloomberg® is a trademark of Bloomberg Finance L.P. (collectively with its affiliates, “Bloomberg”). Barclays® is a trademark of Barclays Bank Plc (collectively with its affiliates, “Barclays”), used under license. Neither Bloomberg nor Barclays approves or endorses this material, guarantees the accuracy or completeness of any information herein and, to the maximum extent allowed by law, neither shall have any liability or responsibility for injury or damages arising in connection therewith.
Investing outside the United States involves risks such as currency fluctuations, periods of illiquidity and price volatility, as more fully described in fund prospectuses. These risks may be heightened in connection with investments in developing countries. The return of principal for bond funds and for funds with significant underlying bond holdings is not guaranteed. Fund shares are subject to the same interest rate, inflation and credit risks associated with underlying bond holdings. Bond prices and a bond fund’s share price will generally move in the opposite direction of interest rates.
Market indexes are unmanaged and, therefore, have no expenses. Investors cannot invest directly in an index.
Statements attributed to an individual represent the opinions of that individual as of the date published and do not necessarily reflect the opinions of Capital Group or its affiliates. This information is intended to highlight issues and should not be considered advice, an endorsement or a recommendation.
Content contained herein is not intended to serve as impartial or fiduciary advice. The content has been developed by Capital Group, which receives fees for managing, distributing and/or servicing its investments.Securities offered through American Funds Distributors, Inc.
Guide to recessions: Key takeaways
• Recessions are a natural and necessary part of every business cycle. They occur when economic
output declines after a period of growth.
• Recessions have been infrequent. The U.S. has been in an official recession less than 15% of all months since 1950.
• Recessions have been relatively short. The current expansion has been longer than the last 10
recessions combined.
• Recessions have been less impactful compared with expansions. The average recession leads to a contraction of less than 2% in GDP. Expansions grow the economy by about 24% on average.
• An inverted yield curve has preceded each of the last seven recessions by an average of 16
months. It’s one of the most consistent signs that a slowing economy has reached a tipping point.
• Equities typically peak seven months before the economic cycle. They also often rebound before
a recession officially ends.
• Some equity sectors have held up better during severe declines. Consumer staples and utilities
have topped the S&P 500 during each of the last eight major market declines.
• A core bond portfolio can provide stability during recessions. When stock markets decline
sharply, high quality bonds have shown resilience.
CE credit available
Earn one hour of CE credit from CFP and CIMA by completing a short quiz at the following link:
https://www.tfaforms.com/4721404
Lit. No. MFGEBR-103-0219O CGD/9074-S70118 © 2019 Capital Group. All rights reserved.