Embed Size (px)
Citation preview

This PDF is a selection from an out-of-print volume from the NationalBureau of Economic Research
Volume Title: Explorations in Economic Research, Volume 4, number4
Volume Author/Editor: Victor Zarnowitz and Geoffrey H. Moore
Volume Publisher: NBER
Volume URL: http://www.nber.org/books/zarn77-1
Publication Date: October 1977
Chapter Title: The Recession and Recovery of 1973-1976
Chapter Author: Victor Zarnowitz, Geoffrey H. Moore
Chapter URL: http://www.nber.org/chapters/c9101
Chapter pages in book: (p. 1 - 87)
1VICTOR ZARNOWITZ
National Bureau of Economic Researchann the University of Chicago
GEOFFREY H. MOORENatioMI Bureau of Economic Research
The Recession and Recoveryof 1973-1976
ABSTRACT: Review of the evidence confirms the choice of November 1973 and March 1975 as the most recent business cycle peak andtrough dates, respectively. A period of slow growth, dated fromMarch 1973, preceded the recession. By most measures the recession wasthe most serious since 1937, but the decline in employment was brief andmoderate. One implication is that loss of jobs has become a smaller factorthan formerly in pushing up unemployment during recession. Another isthat the growth of the cyclically stable service industries may well continue to reduce the overall severity of recessions. ~ The recovery thatbegan in 1975 was of about average strength during its first two years interms of output, employment, real income, and retail sales but weak incapital investment. The inflation rate, which rose to unusually high levelsduring the 1970-1973 expansion and most of the ensuing recession,
NOTE: This paper was largely completed at the end of April 1'P7 and is based on the latest data available at thattime through December 1976.
We are gratefUl for the helpful comments and adVICe of the NBfR staff read;ng committee-Phillip Cagan,Solomon Fabricant and Daniel H. Weinbeig-as well as of Charlotte Boschan, Sidney Davidson, NicholasDopuch, Walter W. Ebanks, Murray Foss, Clayton Gehman, David O. Green. Jerome A. Mark, loel Popkin, andBeatrice N. Vaccara. The members of the NBER Directors read,ng committee-Otto Eckstein, ,\-\aurlce W. Lee,and Roy E. Moor-as \Yell as two other Board members-R'Jbert G. Dederick and David L. Grove-made usefUlsuggestions that we have tried to take into account We are indebted. also, to pdrtlcipants in the Workshop onEconomic History at the University of Chicago. The research assistance of Chantal Dubrin, the senetarial work ofJames Hayes and Mildred Courtney, and the editorial cont"buticils of Estpr MoskoWitz are gratefullyacknowledged.
472 Victor Zarnowitz and Geoffrey H. Moore
dropped sharply thereafter and continued to of'clinp during the first yearor so of recovery. Although the decline during the recovery was unusuallylarge, it was not altogether out of line with the historical relationship between rates of recovery in output and concurrent changes in the inflation
rate.
(1] INTRODUCTION AND SUMMARY
This paper has two main objectives. The first is to present an analytical accountof the major fluctuations in selected economic indicators and their timing inthe recent business cycle recession and recovery in the United States. The second is to measure the severity of the recession and the vigor of the recovery,especially by comparing the 1973-1976 movements with earlier contractions
and expansions.In a recent NBER study (Moore 1975), teiltative answers were given to the
questions, When did the u.s. business expansion of the early 1970s begin to510w down? When did it end? In the first part of this report, we examine somenew and revised data bearing on these questions and reconsider the answersin the light of this evidence. We also identify the most recent upturns in the selected indicators and use the information to date the business revival of1975-1976.
In the second part of the report, measures of duration, depth, and diffusionof recessions are analyzed so as to place the most recent business recession inthe United States in historical perspective. Patterns of recessions and recoveries during the last fifty years also are systematically compared. Throughoutthe paper, we concentrate attention upon the comprehensive time series onincome and expenditures, value of output and sales, volume of production,employment and unemployment. These data were recently used to reviewand revise the NBER reference chronology of business cyeie peaks and troughsduring 1948-1970 as well as the growth cycle chronology of downturns andupturns (Zarnowilz and Boschan, 1975a, 1977). In addition, we examine manyother important economic indicators in the areas of prices. trade, investment inplant and equipment, inventories, profits, money, credit, and interest rates.
Although several reports on the performance of the economy, policies, andexpectations at various times during the 1973-1976 period have already appeared,l we may still be too close to those events to reach a deeper understanding of them. Still, any account of what happened should be guided bysome notions about the proximate source of the observed changes. We therefore refer to several explanatory hypotheses with which our findings are (or arenot) consistent, but we do not undertake to study the success or failure of economic policy during the period.
Recession and Recovery of 1973-1976 473
Summary of Findings
1. The peak in business activity preceding the recession of 1973-1975came in November 1973. The trough marking the end of the recession came inMarch 1975. Thus the twenty-eighth recession in the National Bureau's business cycle chronology, which begins in 1854, lasted sixteen months. It waslonger than any of the five preceding recessions during 1948-1970, of whichthe longest lasted eleven months. But during the first ten months, i.e., untilSeptember 1974, total output declined only moderately and total employmentdid not decline at all. Hence the most serious part of the recession wasrelatively brief, about six months.
The recession was preceded by a phase of slower growth, starting inMarch 1973. The upturn two years later brought with it rapid growth. Hencethe slow-growth phase encompassing the recession lasted twenty-fourmonths, which also was longer than any of the five preceding phases of slowgrowth associated with recession.
Through the end of 1976, when our analysis stops, the recovery had lasted21 months. Business cycle expansions since 1948 have averaged 50 months, or36 months if one excludes the exceptionally long expansion of 1961-1969.Periods of rapid growth, however, have been shorter, averaging 20 months,with a range of from 8 to 30 months. In general, periods of rapid and slowgrowth have been more nearly equal in duration than periods of expansion andcontraction.
2. In terms of the overall decline in output and the rise in unemployment,the 1973-1975 recession was more severe than any of the five earlier recessions of the post-World War" period. But in terms of the reduction in employment, it was relatively moderate. One of the principal reasons for this anomalyis that the growth of the service industries, which are less affected by recession, offsets the decline in the goods-producing industries to a larger extentwith respect to employment than with respect to output. Another factor isthat the loss of jobs during recession in recent times has become a smallersource of unemployment than the increase in the labor force. As il result ofthese trends, employment has become more stable, relative both to outputand to unemployment.
3. The continued rise in inflation rates, which hit double-digit levels inmid-'1974, long after the recession began, stands in sharp contrast to the patterns of price behavior in earlier business cycle contractions during which therate of inflation promptly diminished or, as in 1949 and the 19305, deflation occurred. Probably more than in most business cycles of the past, the 1973-1974slowdown-and-recession sequence was influenced by cost increases affectingfood, fuel, and raw materials, and by supply restrictions, which tend to producerising prices along with falling output. Unit labor costs and interest rates alsorose more rapidly at a late stage of the recession than has been customary.
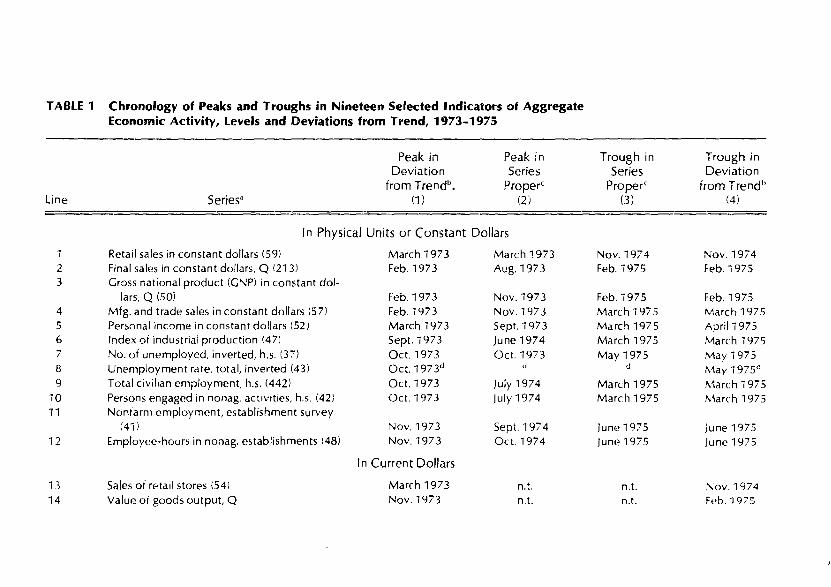
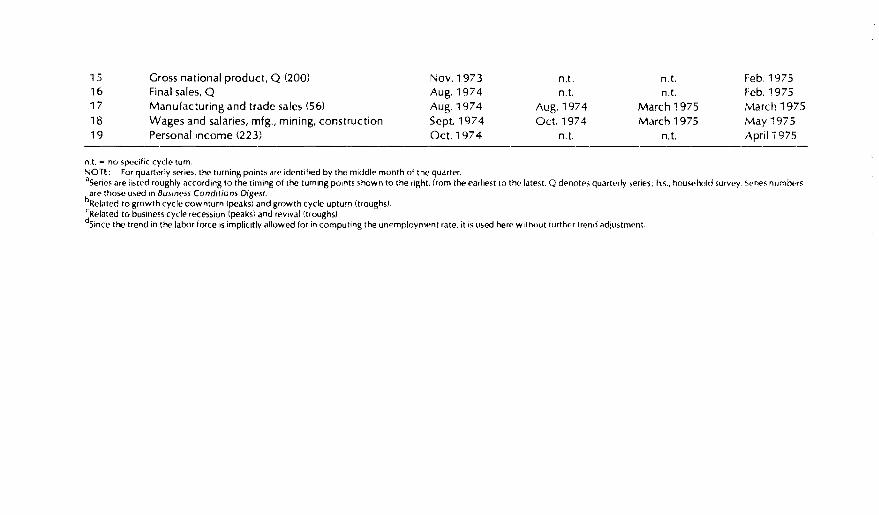
TABLE 1 Chronology of Peaks and Troughs in Nineteen Selected Indicators of AggregateEconomic Activity, Levels and Deviations from Trend, 1973-1975
Peak in Peak in Trough in Trough inDeviation Series Series Deviation
from Trendb• Properc Proper' from Trend b
Line Series" (1) (2) (3) (4)
In Physical Units or Constant Dollars
Retail sales in constant dollars (59) March 1973 March 1973 Nov. 1974 Nov. 19742 Final sales in constant dollars, Q (213) Feb. 1973 Aug. 1973 Feb. 1975 Feb.19753 Cross national product (GNP) in constant dol-
lars, Q (50i Feb. 1973 Nov. 1973 Feb. 1975 Feb. 19754 Mfg. and trade sales in constant dollars (57) Feb.1973 Nov.1973 March 1975 March 19755 Personal income in constant dollars (52) March 1973 Sept. 1973 March 1975 April 19756 Index of industrial production (47) Sept. 1973 june1974 March 1975 March 19757 No. of unemployed, inverted, h.s. (37) Oct. 1973 Oct. 1973 May 1975 May 19758 Unemployment rate. total, inverted (43) Oct. 197 3d d d May 1975d
9 Total civilian employment, h.s. (442) Oct. 1973 July 1974 March 1975 March 197510 Persons engaged in nonag. activities, h.s. (42) Oct. 1973 July 1974 March 1975 March 197511 Nonfarm employment, establishment survey
(41 ) Nov. 1973 Sept. 1974 June1975 June197512 Employee-hours in nonag. establishments 148) Nov. 1973 Oct. 1974 June1975 June 1975
In Current Dollars
13 Sales of retail stores (54) March 1973 n.t. n.t. 1\ov.197414 Value of goods output, Q Nov. 1973 n.t. 11.t. Feb.1975
n.t.n.t.
March 1975March 1975
n.t.
n.t.n.t.
Aug. 1974Oct. 1974
n.t.
Nov. 1973Aug. 1974Aug. 1974Sept. 1974Oct. 1974
Feb. 1975Feb. 1975March 1975May 1975
. -=-- ~::..._. t\pri11975
Gross national product, Q (200)Final sales, QManufacturing and trade sales (56)Wages and salaries, mfg., mining, constructionPersonal income (223)
151617
1819
n,t. .... no specific cycle turn.NOTE: For quarterly series. the turning points .u" identified by the middle month of the quarter.aSenes are listed roughly according to the timing ot the turning pOints shown to the right. from the ('arliest to the latest. Q denote, quarterly series; h.s .. housphold survey. Sen<'>$ numbf'rs
b~~:~~~:~~~~:~~~~;~o::~~~t~~~~~~:'~dgrowth cycle upturn (troughs)CRelated to bUSiness cycle recession (peaks) and revival (troughs).dSince the trend In the labor force is impliCitly allowed for in computing the unemployment rate. it IS used herp without furth"r trend adjustmpnt.
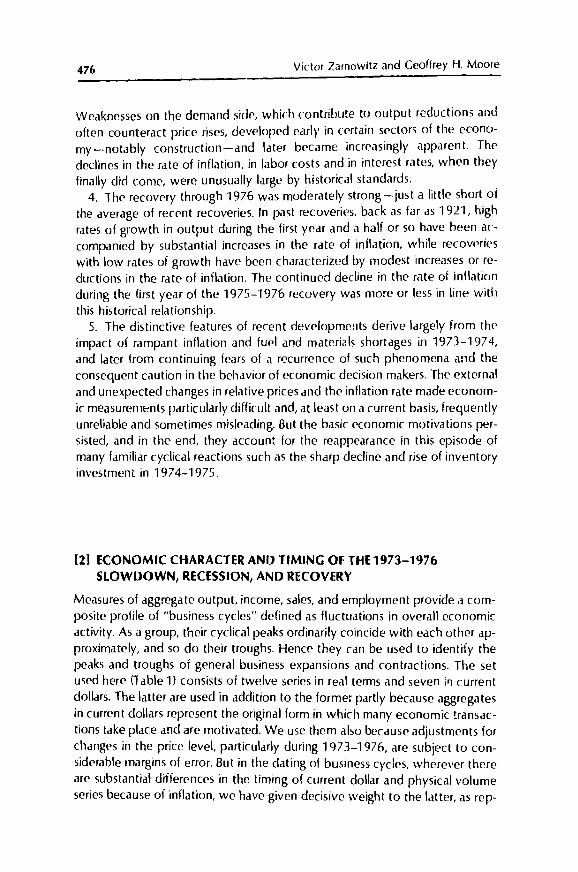
476 Victor Zarnowitz and Geoffrey H. Moore
Weaknesses on the demand sid£', which contribute to output reductions amIoften counteract price rises, developed early in certain sectors of the economy-notably construction-and later became increasingly apparent. Thedeclines in the rate of inflation, in labor costs and in interest rates, when theyfinally did come, were unusually large by historical standards.
4. The recovery through 1976 was moderately strong -just a little short ojthe average of recent recoveries. In past recoveries, back as far as 1921, highrates of growth in output during the first year and a half or so have been accompanied by substantial increases in the rate of inflation, while recoverieswith low rates of growth have been characterized by modest increases or reductions in the rate of inflation. The continued decline in the rate of inflationduring the first year of the 1975-1976 recovery was more or less in line withthis historical relationship.
5. The distinctive features of recent de\/elopments derive largely from theimpact of rampant inflation and fuel and materials shortages in 1973-1974,and later from continuing fears of a recurrence of such phenomena and theconsequent caution in the behavior of economic decision makers. The externaland unexpected changes in relative prices and the inflation rate made economic measurements particularly difficult and, at least on a current basis, frequentlyunreliable and sometimes misleading. But the basic economic motivations persisted, and in the end, they account for the reappearance in this episode ofmany familiar cyclical reactions such as thf' sharp decline and rise of inventoryinvestment in 1974-1975.
[2] ECONOMIC CHARACTER AND TIMING OF THE 1973-1976SLOWDOWN, RECESSION, AND RECOVERY
Measures of aggregate output. income, sales, and employment provide a composite profile of "business cycles" defined as fluctuations in overall economicactivity. As a group, their cyclical peaks ordinarily coincide with each other approximately, and so do their troughs. Hence they can be used to identify thepeaks and troughs of general business expansions and contractions. The setused here (Table 1) consists of twelve series in real terms and seven irJ currentdollars. The latter are used in addition to the former partly because aggregatesin current dollars represent the o(lginal form in which many economic transactions take place a!1d are motivated. We use them also because adjustments forchanges in the price level. particularly during 1973-1976, are subject to considerable margins of error. But in the dating of business cycles, wherever thereare substantial differences in the timing of current dollar and physical volumeseries because of inflation, we have given decisive weight to the latter, as rep-
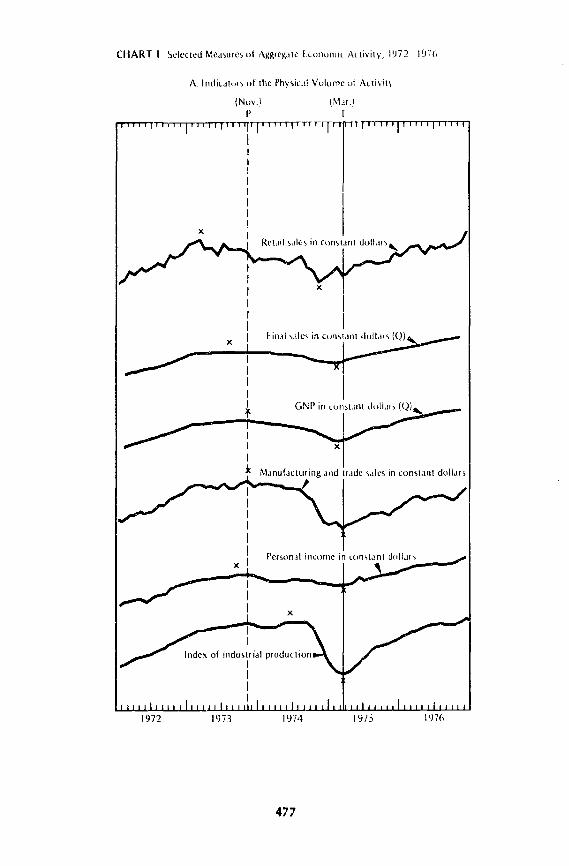
CHART 1 Selected Mealure, of Aggregate Lcollomic Activity, 1~72 19·,6
A. IndicJ1(Jrs of the Phl"iL.ll Vulume vr ALlivitl
(Nov.\ (MM.)P I
i'I" "'I' "'rr"I"fTT~
I .I IIIII
x
1975
GNP in comWlI <1"1;',,, (QII -,.--
1974
x
19731972
477
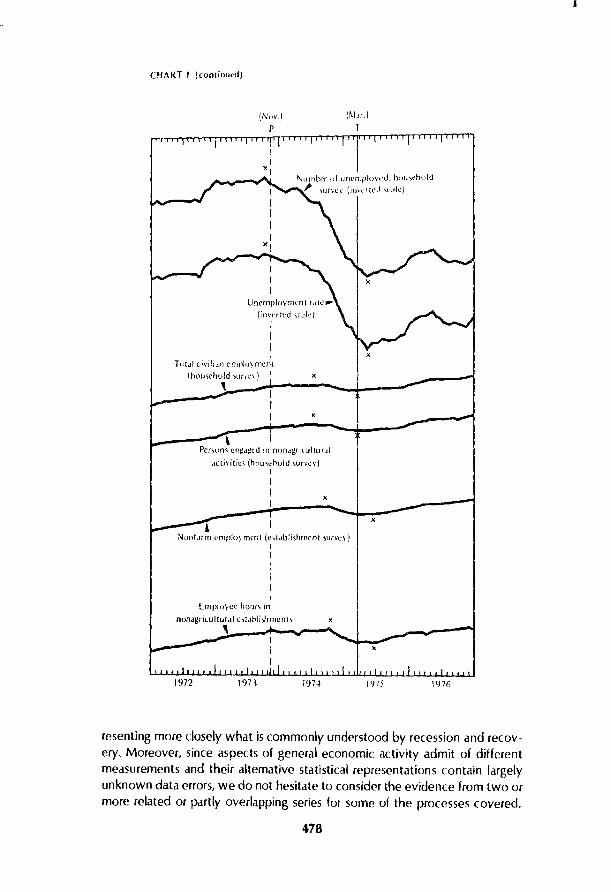
CHART 1 (co'lIinu,'<f)
x
(~I.,,)
T
Number of unemployed. hUll..,t'holJI- \ur\'l'V (inVl'flL'J \lJle)
I
Unemployment rJ:It:·~
(invcrted '\Cl/c'III
x
~PCf~on<; ep.gJgcd Ifl rHHlJgrilulturJI
"etll'it;'" (hou,thuld ;uney)I
III
li\!ullfJrm employmenl (c':tlJblishrn('nt ~un:l.·\')
II
x
I
Employe'..' hUl1r~ in
nOIlJ.griLultur ..t1l''ildbli"hmem... x,
I Y75 \'J76
resenting more closely what is commonly understood by recession and recovery. Moreover, since aspects of general economic activity admit of differentmeasurements and their alternative statistical representations contain largelyunknown data errors, we do not hesitate to consider the evidence from two ormore related or partly overlapping series for some of the processes covered.
478
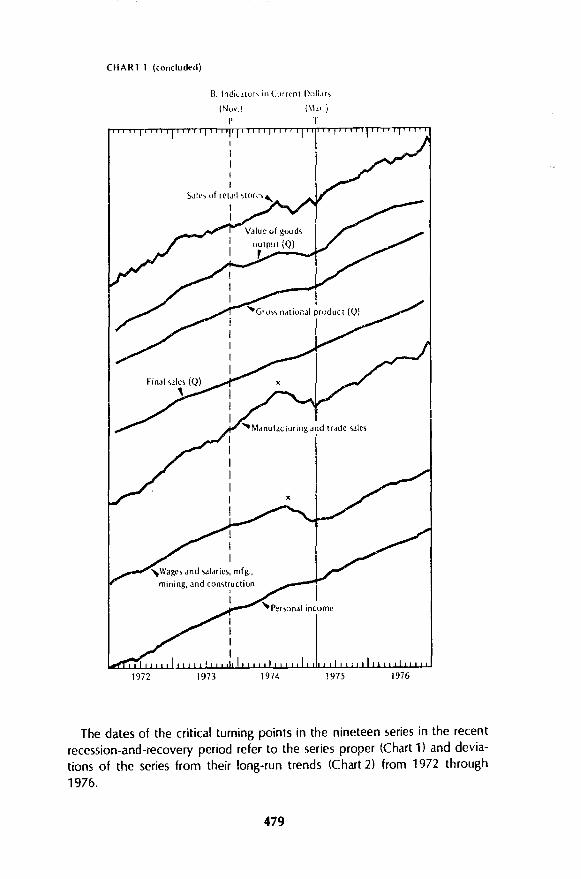
CHART 1 (concluded)
B. Indil.1tor ... in Curr.::nt Dolt.lh
(Nov.)
P
The dates of the critical turning points in the nineteen series in the recentrecession-and-recovery period refer to the series proper (Chart 1) and deviations of the series from their long-run trends (Chart 2) from 1972 through
1976.
479
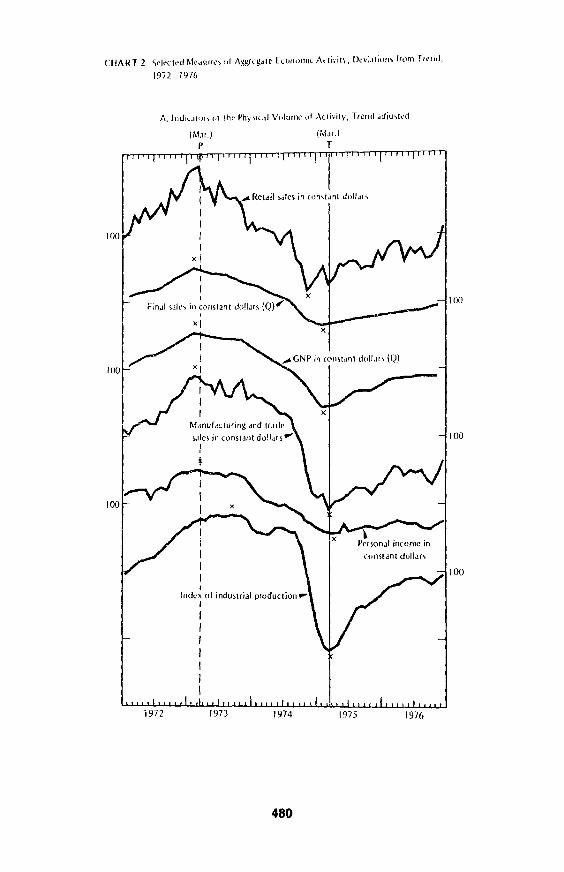
C/iAR12 5<'1t'clt'd Me.llur,·, ,,11\!l~rcg_lle EcunomlC Ad;-"l\" OrY;Jl;"'1\ f,um lrt'",I,
1972 1976
I~!.lr.)
p
IIndex of indullrial production
I
I!
480
(MJr.1T
1976
100
100
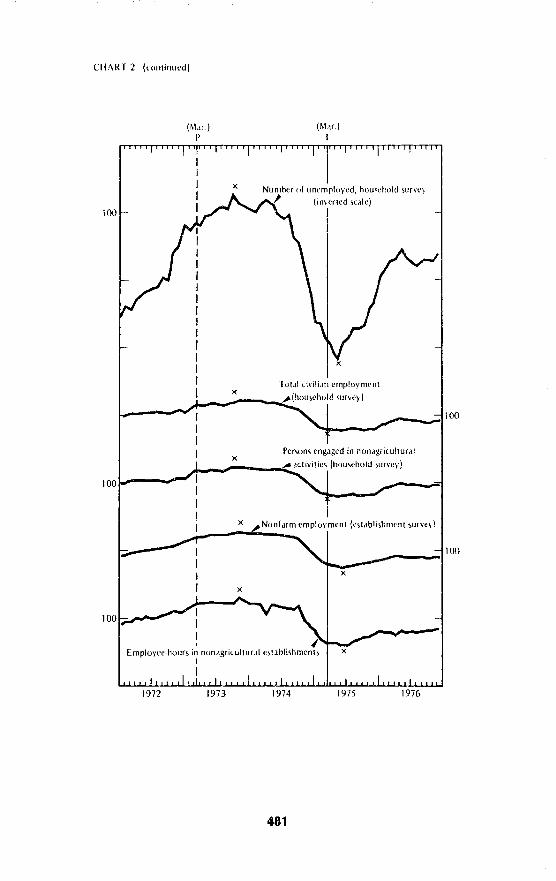
C11i\RT 2 (colllinlled)
(MM.)P
(MM.jr
iOO
x Numher of unemployed, hUlI,"bold ,uevc'y, (imerled "die)
I
Totd' tivili.m employmentx...+-__, ~~Ihouleho'd lurvey)
100~--__I
Perlon, engdged in nondg,iculturdlx
.....__~ ..~;;..::d:ctivitie' (houlehold lurvey)
100 .....----
1976
_----.1100
x
197519741973
Ix ,;Nonr",m employment (cltJblilhment 'lIIveyl
1972
IEmployedlOurl in Illmdgric()lturJI el!ablilhmentl x
I
I
481
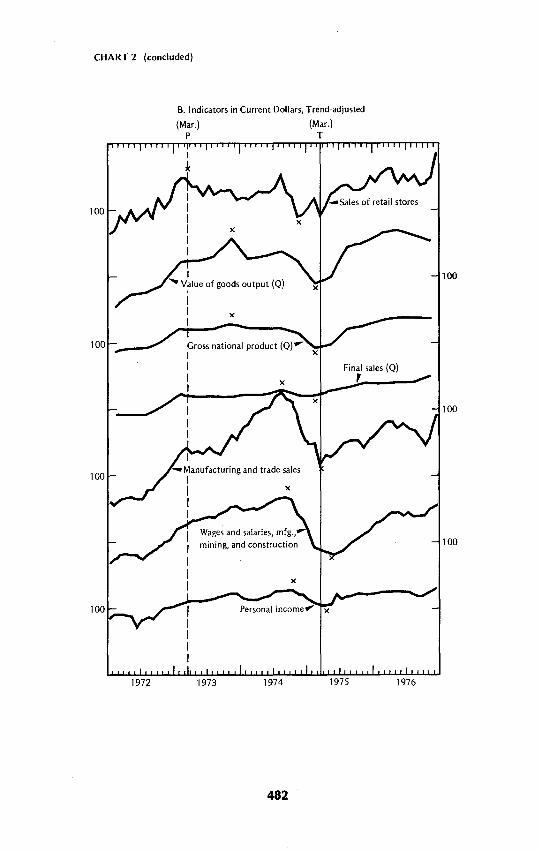
CHART 2 (concluded)
B. Indicators in Current Dollars, Trend-adjusted
(Mar.) (Mar.)P T
100
100
1976
Final sales (0),
1975
x
19741973
Gross national product (0)~IIII
1972
100
482
Recession and Recovery of 1973-1976 483
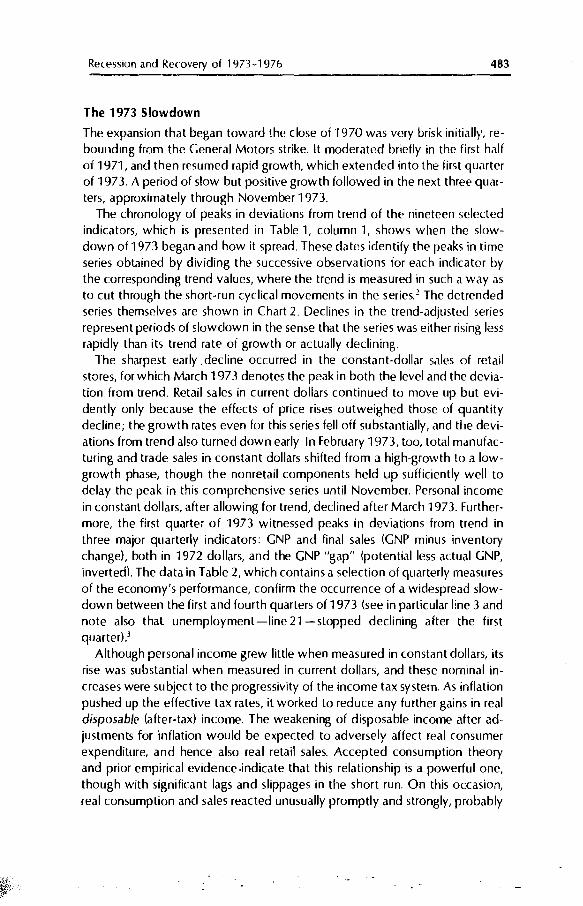
The 1973 Slowdown
The expansion that began toward the close of 1970 was very brisk initially. rebounding from the General Motors strike. It moderated briefly in the first halfof 1971, and then resumed rapid growth, which extended into the first quarterof 1973. A period of slow but positive growth followed in the next three quarters, approximately through November 1973.
The chronology of peaks in deviations from trend of the nineteen selectedindicators, which is presented in Table 1, column 1, shows when the slowdown of 1973 began and how it spread. These dates identify the peaks in timeseries obtained by dividing the successive observations for each indicator bythe corresponding trend values, where the trend is measured in such a way asto cut through the short-run cyclical movements in the series. 2 The detrendedseries themselves are shown in Chart 2. Declines in the trend-adjusted seriesrepresent periods of slowdown in the sense that the series was either rising lessrapidly than its trend rate of growth or actually declining.
The sharpest early.decline occurred in the constant-dollar sales of retailstores, for which March 1973 denotes the peak in both the level and the deviation from trend. Retail sales in current dollars continued to move up but evidently only because the effects of price rises outweighed those of quantitydecline; the growth rates even for this series fell off substantially, and the deviations from trend also turned down early. In February 1973, too, total manufacturing and trade sales in constant dollars shifted from a high-growth to a lowgrowth phase, though the nonretail components held LIp sufficiently well todelay the peak in this comprehensive series until November. Personal incomein constant dollars, after allowing for trend, declined after March 1973. Furthermore, the first quarter of 1973 witnessed peaks in deviations from trend inthree major quarterly indicators: GNP and final sales (GNP minus inventorychange), both in 1972 dollars, and the GNP "gap" (potential less actual GNP,invertedl. The data in Table 2, which contains a selection of quarterly measuresof the economy's performance, confirm the occurrence of a widespread slowdown between the first and fourth quarters of 1973 (see in particular line 3 andnote also that unemployment-line 21-stopped declining after the firstquarter).3
Although personal income grew little when measured in constant dollars, itsrise was substantial when measured in current dollars, and these nominal increases were su bject to the progressivity of the income tax system. As inflationpushed up the effective tax rates, it worked to reduce any further gains in realdisposable (after-tax) income. The weakening of disposable income after adjustments for inflation would be expected to adversely affect real consumerexpenditure, and hence also real retail sales. Accepted consumption theoryand prior empirical evidence .indicate that this relationship is a powerful one,though with significant lags and slippages in the short run. On this occasion,real consumption and sales reacted unusually promptly and strongly, probably
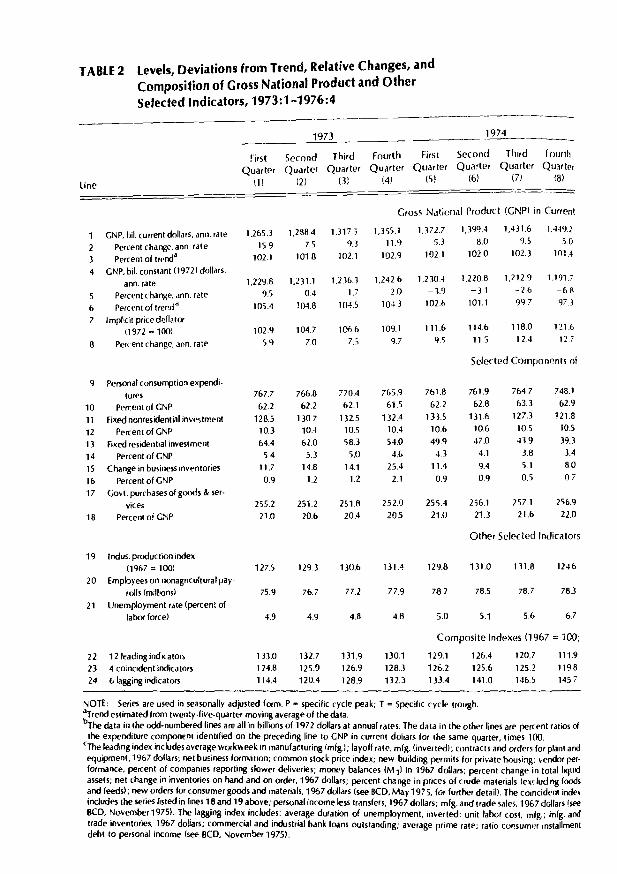
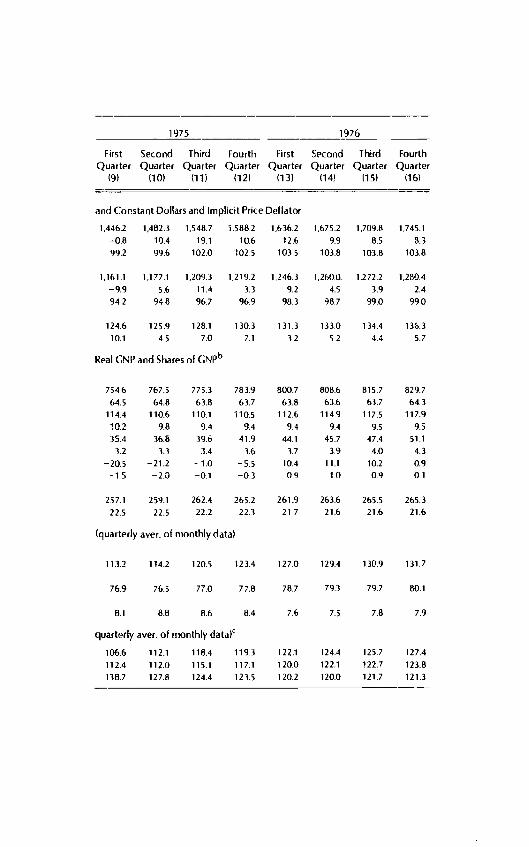
TABLE 2 levels, Deviations from Trend, Relative Changes, andComposition of Gross National Product and OtherSelected Indicators, 1973:1-1976:4
-1971 1974
First Second Third Fourth First Second Third fourth
Quarter Quarter Quarter Quarter Quarter Quarter Quarter Quarter
nl (2) (3) 14) (5) (6) (7) (8)line
GrosS Nation.ll Product (GNP) in Current
GNP, bi!. current dollars, ann. rate 1,265.3 1,288.4 1.3175 l.355.1 1,372.7 l.399.4 1,431.6 1.44921
15.9 7.5 9.3 11.9 5.3 11.0 9.5 5.02 Percent change, ann. rate
102.1 1020 1023 101.43 Percent of trenda 102.1 101.8 102.1 102.9
4 GNP, bi!. constant (19721 dollars,1,230.4 1,220.8 1,212.9 1,1917
ann. rate 1,229.8 1,231.1 1,236.3 1.2426
9.5 0.4 1.7 20 -3.9 -31 -2.6 ~685 Percent change, ann. rate
Percent of trer.d" 105.4 104.8 104.5 104) 102.0 101.1 'J97 97.36
7 Implicit price deflator111.6 114.6 118.0 12160972 = 1001 102.9 104.7 106.6 109.1
5.9 70 7.5 9.7 9.5 11.:; 12.4 12.78 Percent change. ann. rate
Selected Componrnts of
9 Personal consumption expend,-748.1767.7 766.8 770.4 765.9 761.8 761.9 764.7tures
10 Percent of GNP 622 622 62.1 61.5 62.2 62.8 63.3 62.9
11 Fixed ncnresidential investment 1285 130.7 132.5 132.4 Ins 131(, 127.3 121.8
12 Percent of GNP 10.3 10.4 10.5 10.4 10.6 10.6 10.5 10.5
13 Fixed residential investment 64.4 62.0 58.3 54.0 49.9 47.0 43.9 39.3
14 Percent of GNP 54 5.3 5.0 4.6 4.3 4.1 3.8 3.4
15 Change in business inventories 11.7 14.8 14.1 25.4 11.4 9.4 5.1 80
16 Percent of GNP 0.9 1.2 1.2 2.1 0.9 0.9 0.5 0)'
17 Govl. purchases of goods & ser-vices 2552 251.2 2516 252.0 255.4 256.1 257.1 256.9
18 Percent oi GNP 21.0 20.6 20.4 20.5 210 21.3 21.6 22.0
Other Selected Indicators
19 Indus. production index(1907 = 100) 127.5 129.3 130.6 131A 129.6 131.0 131.8 124.6
20 Employees on nonagricultural pay-rolls (miWons) 75.9 76.7 77.2 77.9 782 78.5 78.7 78.3
21 Unemployment rale (percen, oflabor/orce) 4.9 4.9 4.8 4.6 5.0 5.1 5.6 67
Composite Indexes (1967 = 100;
22 12 leading indICators 133.0 132.7 131.9 130.1 129.1 126.4 120.7 111.9
23 4 co;ncident indicators 124.8 125.9 126.9 1283 126.2 1256 125.2 1198
24 (, lagging indicators 114.4 120.4 128.9 132.3 133.4 141.0 146.5 1457
NOTE: Series are used in seasonally adjusted form. P =specific cycle peak; T =Specific cycle trough.aTrend estimated from twenty-five-quarter moving average of the data.!>.rhe data in the odd-numbered lines are all in billions of 1972 dollars at annual ratl's. The data in the other lines are percent ratios of
the expenditure component identified on the preceding line to GNP in current dohars for the same quarter, times 100.'The leading index includes average workweek in manufacturing (mfg.l; layoff ratl', mfg. (invenE'd); enntracts and orders for plant andequipment, 1967 dollars; net business forma lion; common stock price index; new building permits for private homing; vendor performallee, percent of companies reporting slower deliveries; money balallCl'S (M 11 in 1967 dollars; percent change in tolal liquidassets; net change in inventoril's on hand and on order, 1967 dollars; percent changl' in prices of crude materials lexduding foodsand feeds); new orders for consumer goods and materials, 1%7 dollars (see BCD, May 1975, for further detail). The co,"cid"nt indexincludes the series listed in lines 18 and 19 above; personal income less transfers, 1967 dollars; mfg. and trade sales, 1967 dollars lseeBCD, November 1975>' The lagging index includes: average duration of unemployment, inverted; unit labor cost, mfg.; mfg. andtrade inventories, 1%7 doliars; commercial and industrial bank loans outstanding; average prime rate; ratio consumer installmentdebt to personal income (see BCD, November 1975).
1975 1976
First Second Third Fourth First Second Third FourthQuarter Quarter Quarter Quarter Quarter Quarter Quarter Quarter
(9) (10) (11 ) (12) (1)) (14) (15) (16)
and Constant Dollars and Implicit Price Deflator
1,446.2 1,4823 1,548.7 1,588.2 1,636.2 1,675.2 1,709.8 1,745.1
-0.8 10.4 19.1 10.6 12.6 9.9 8.5 8.3'l9.2 99.6 102.0 1025 1035 103.8 103.8 1038
1,161.1 1,177.1 1,209.3 1,219.2 1,246.3 1,2600. 1.272.2 1,21l0.4
-9.9 5.6 11.4 3.3 9.2 4.5 3.9 2.4
94.2 94.8 96.7 969 983 98.7 99.0 99.0
124.6 125.9 128.1 130.3 131.3 133.0 134.4 136.3
10.1 4.5 7.0 7.1 3.2 52 4.4 5.7
Real GNP and Shares of GNpb
7546 767.5 775.3 783.9 800.7 808.6 815.7 829.7
64.5 64.8 63.8 63.7 63.8 63.6 63.7 64.3
114.4 110.6 110.1 110.5 112.1, 114.9 117.5 117.9
10.2 9.8 9.4 9.4 9.4 9.4 9.5 9.5
35.4 36.8 39.6 41.9 44.1 45.7 47.4 51.1
3.2 3.3 3.4 3.6 3.7 3.9 4.0 4.3
-20.5 -21.2 - 1.0 -5.5 10.4 11.1 10.2 0.9-15 -2.0 -0.1 -0.3 0.9 1.0 0.9 0.1
2';7.1 259.1 262.4 265.2 261.9 263.6 265.5 265.3
22.5 22.5 22.2 22.3 217 21.6 21.6 21.6
(quarterly aver. of monthly data)
113.2 114.2 120.5 123.4 127.0 129.4 130.9 131.7
76.9 76.5 77.0 77.8 78.7 79.3 79.7 80.1
8.1 8.8 8.6 8.4 7.6 7.5 7.8 7.9
quarterly aver. of monthly data)C
106.6 112.1 118.4 119.3 122.1 124.4 125.7 127.4
112.4 112.0 115.1 117.1 120.0 122.1 H2.7 123.8
138.7 127.8 124.4 123.5 120.2 120.0 121.7 121.3
486Victor Zarnowitz and Geoffrey H. Moore
=
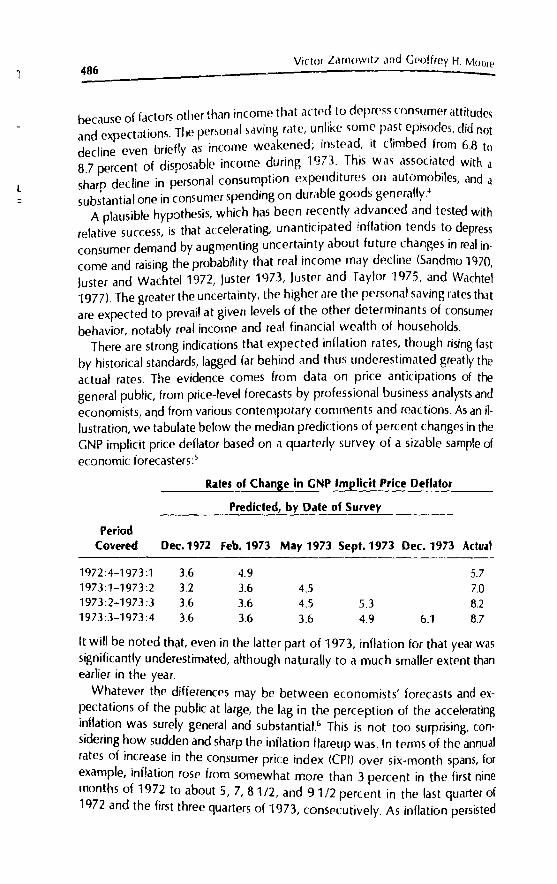
because of factors other than income that acted to depress consumer attitude,and expectations. The persondl saving rate, u~like som? past episodes, did notdecline even briefly as income weakened; Instead, It climbed from 6.8 to8.7 percent of disposable income d.uring 1973.. This was associat.ed with asham decline in personal consumption expenditures on automobiles, and asub;tantial one in consumer spending on durable goods generally.4
A plausible hypothesis, which has been recently advanced and tested withrelative success, is that accelerating, unanticipated inflation tends to depressconsumer demand by augmenting uncertainty about future changes in real income and raising the probability that real income may decline (Sandmo 1970,Juster and Wachtel 1972, Juster 1973, Juster and Taylor 1975, and Wachtel19771. The greater the uncertainty, the higher are the personal saving rates thatare expected to prevail at given levels of the other determinants of consumerbehavior, notably real income and real financial wealth of households.
There are strong indications that expected inflation rates, though rising fastby historical standards, lagged far behind and thus underestimated greatly theactual rates. The evidence comes from data on price anticipations of thegeneral public, from price-level forecasts by professional business analysts andeconomists, and from various contemporary comments and reactions. As an illustration, we tabulate below the median predictions of percent changes in theGNP implicit price deflator based on a quarterly survey of a sizable sample ofeconomic forecasters: 5
Rates of Change in CNP Imglicit Price Deflator
Predicted, by Date of Survey
PeriodCovered Dec.1972 Feb.1973 May 1973 Sept. 1973 Dec. 1973 Actual
1972:4-1973:1 3.6 4.9 5.71973:1-1973:2 3.2 3.6 4.5 7.01973:2-1973:3 3.6 3.6 4.5 5.3 8.21973:3-1973:4 3.6 3.6 3.6 4.9 6.1 8.7
l~ w~lI. be noted that, even in the latter part of 1973, inflation for that year wasslgmflCantly underestimated, although naturally to a much smaller extent thanearlier in the year.
Whatever the differences may be between economists' forecasts and ex~ect~tions of the public at large, the lag in the perception of the accelerating1~f1at.,on was surely general and substantial.6 This is not too surprising, consldermg ~ow sudden and sharp the inflation f1areup was. In terms of the annualrates of mcrease in the consumer price index ((PI) over six-month spans, forexample, inflation rose from somewhat more than 3 percent in the first ninemonths of 1972 to about 5, 7,81/2, and 91/2 percent in the last quarter of1972 and the first three quarters of 1973, consecutively. As inflation persisted
Recession and Recovery of 1973-1976 487
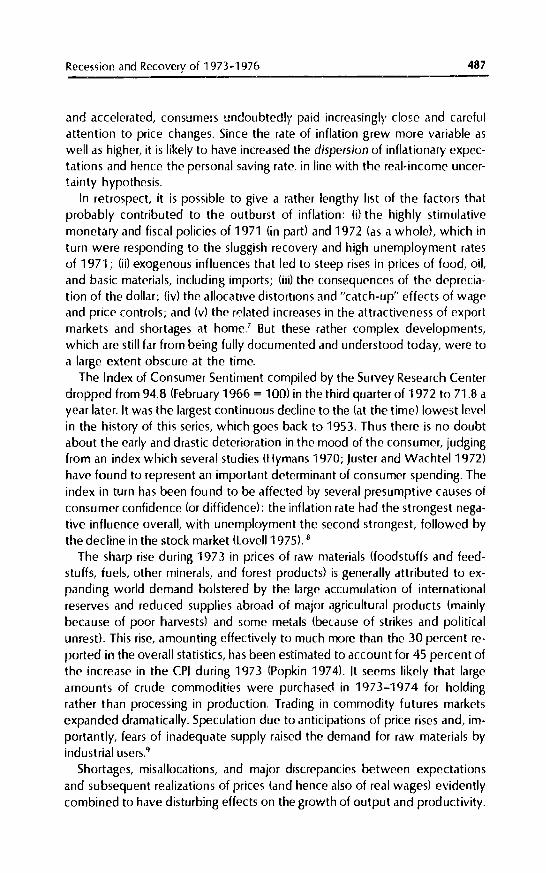
and accelerated, consumers undoubted!)' paid increasingly close and carefulattention to price changes. Since the rate of inflation grew more variable aswell as higher, it is likely to have increased the dispersion of inflationary expectations and hence the personal saving rate.. in line with the real-income uncertainty hypothesis.
In retrospect, it is possible to give a rather lengthy list of the factors thatprobably contributed to the outburst of inflation: (j) the highly stimulativemonetary and fiscal policies of 1971 (in part) and 1972 (as a whole), which inturn were responding to the sluggish recovery and high unemployment ratesof 1971; (iD exogenous influences that led to steep rises in prices of food, oil,and basic materials, including imports; (iii) the consequences of the depreciation of the dollar; (iv) the allocative distortions and "catch-up" effects of wageand price controls; and (v) the related increases in the attractiveness of exportmarkets and shortages at home.? But these rather complex developments,which are still far from being fully documented and understood today, were toa large extent obscure at the time.
The Index of Consumer Sentiment compiled by the Survey Research Centerdropped from 94.8 (february 1966 = 100) in the third quarter of 1972 to 71.8 ayear later. It was the largest continuous decline to the (at the time) lowest levelin the history of this series, which goes back to 1953. Thus there is no doubtabout the early and drastic deterioration in the mood of the consumer, judgingfrom an index which several studies (Hymans 1970; Juster and Wachtel 1972)have found to represent an important determinant of consumer spending. Theindex in turn has been fou nd to be affected by several presumptive causes ofconsumer confidence (or diffidence): the inflation rate had the strongest negative influence overall, with unemployment the second strongest, followed bythe decline in the stock market (Lovell 1975l. 8
The sharp rise during 1973 in prices of raw materials (foodstuffs and feedstuffs, fuels, other minerals, and forest products) is generally attributed to expanding world demand bolstered by the large accumulation of internationalreserves and reduced supplies abroad of major agricultural products (mainlybecause of poor harvests) and some metals (because of strikes and politicalunrest). This rise, amounting effectively to much more than the 30 percent reported in the overall statistics, has been estimated to account for 45 percent ofthe increase in the CPI during 1973 (Popkin 1974l. It seems likely that largeamounts of crude commodities were purchased in 1973-1974 for holdingrather than processing in production. Trading in commodity futures marketsexpanded dramatically. Speculation due to anticipations of price rises and, importantly, fears of inadequate supply raised the demand for raw materials byindustrialusers.9
Shortages, misallocations, and major discrepancies between expectationsand subsequent realizations of prices (and hence also of real wages) evidentlycombined to have disturbing effects on the growth of output and productivity.
488Victor Zarnowitz and Ceotirey H. Moore
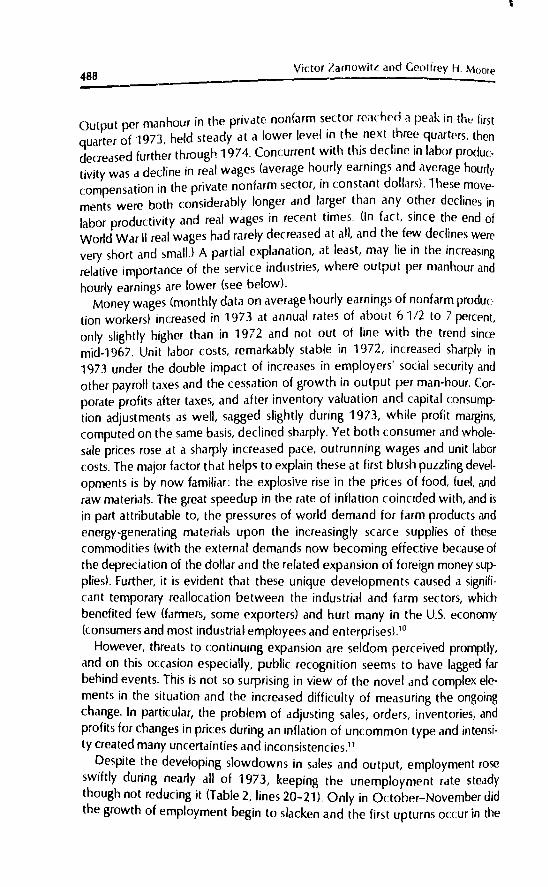
Output per man hour in the privatE nonfarm sector reachpo a peak in the firstquarter of 1973, held steady at a lower level i~ the. next thre: quarters, thendecreased further through 1974. Concurrent with this decline In labor productivity was a decline in real wages (average h~urly earnings and average hourlycompensation in the private nonfarm sector, In constant dollars). These movements were both considerably longer and larger than any other declines inlabor productivity and real wages in recent times. (In fact, since the end ofWorld War \I real wages had rarely decreased at all, and the few declines werevery short and small.) A partial explanation, at least, may lie in the increasingrelative importance of the service industries, where output per manhour andhourly earnings are lower (see belowl.
Money wages (monthly data on average hourly earnings of nonfarm production workers) increased in 1973 at annual rates of about 61/2 to 7 percent,only slightly higher than in 1972 and not out of line with the trend sincemid-19b7. Unit labor costs, remarkably stable in 1972, increased sharply in1973 under the double impact of increases in employers' social security andother payroll taxes and the cessation of growth in output per man-hour. Corporate profits after taxes, and after inventory valuation and capital consumption adjustments as well, sagged slightly during 1973, while profit margins,computed on the same basis, declined sharply. Yet both consumer and wholesale prices rose at a sharply increased pace, outrunning wages and unit laborcosts. The major factor that helps to explain these at first blush puzzling developments is by now familiar: the explosive rise in the prices of food, fuel. andraw materials. The great speedup in the rate of inflation coincided with, and isin part attributable to, the pressures of world demand for farm products andenergy-generating materials upon the increasingly scarce supplies of thesecommodities (with the external demands now becoming effective because ofthe depreciation of the dollar and the related expansion of foreign money supplies!. Further, it is evident that these unique developments caused a significant temporary reallocation between the industrial and farm sectors, whichbenefited few (farmers, some exporters) and hurt many in the U.s. economy(consumers and most industrial employees and enterprisesJ.lO
However, threats to continuing expansion are seldom perceived promptly,and on this occasion especially, public recognition seems to have lagged farbehind events. This is not so surprising in view of the novel and complex elements in the situation and the increased difficulty of measuring the ongoingchange. In particular, the problem of adjusting sales, orders, inventories, andprofits for changes in prices during an inflation of uncommon type and intensity created many uncertainties and inconsistencies.ll
Despite the developing slowdowns in sales and output, employment roseSWiftly during nearly all of 1973, keeping the unemployment rate steadythough not reducing it (Table 2, lines 20-21). Only in October-November didthe growth of employment begin to slacken and the first upturns occur in the
Recpssion and Recovery of 1973-1976 489
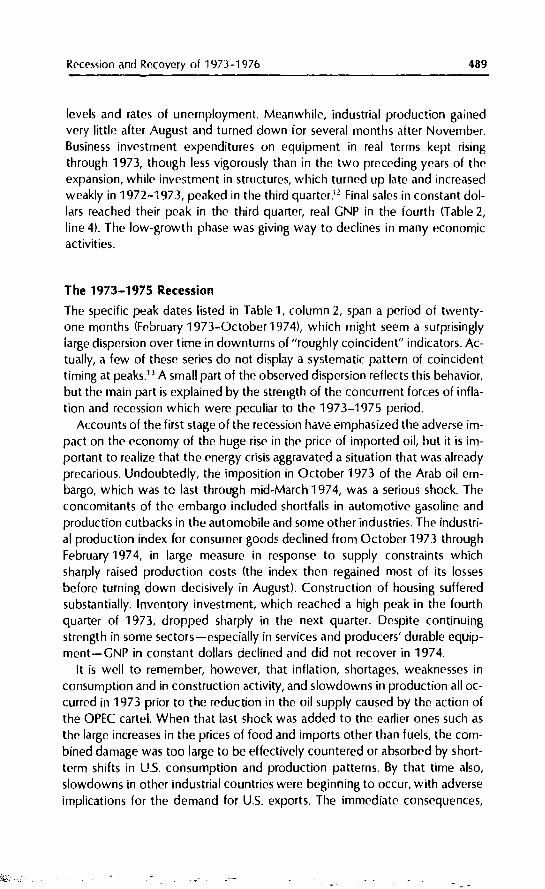
levels and rates of unemployment. Meanwhile, industrial production gainedvery little after August and turned down ior several months after November.Business investment expenditures on equipment in real terms kept risingthrough 1973, though less vigorously than in the two preceding years of theexpansion, while investment in structures, which turned up late and increasedweakly in 1972-1973, peaked in the third quarter.12 Final sales in constant dollars reached their peak in the third quarter, real GNP in the fourth (Table 2,line 4l. The low-growth phase was giving way to declines in many economicactivities.
The 1973-1975 Recession
The specific peak dates listed in Table "I, column 2, span a period of twentyone months (February 1973-0ctober 1974), which might seem a surprisinglylarge dispersion over time in downturns of "roughly coincident" indicators. Actually, a few of these series do not display a systematic pattern of coincidenttiming at peaks.13 A small part of the observed dispersion reflects this behavior,but the main part is explained by the strength of the concurrent forces of inflation and recession which were peculiar to the 1973-1975 period.
Accounts of the first stage of the recessiun have emphasized the adverse impact on the economy of the huge rise in the price of imported oil. but it is important to realize that the energy crisis aggravated a situation that was alreadyprecarious. Undoubtedly, the imposition in October 1973 of the Arab oil embargo, which was to last through mid-March 1974, was a serious shock. Theconcomitants of the embargo included shortfalls in automotive gasoline andproduction cutbacks in the automobile and some other industries. The industrial production index for consumer goods declined from October 1973 throughFebruary 1974, in large measure in response to supply constraints whichsharply raised production costs (the index then regained most of its lossesbefore turning down decisively in Augustl. Construction of housing sufferedsubstantially. Inventory investment, which reached a high peak in the fourthquarter of 1973, dropped sharply in the next quarter. Despite continuingstrength in some sectors-especially in services and producers' durable equipment-GNP in constant dollars declined and did not recover in 1974.
It is well to remember, however, that inflation, shortages, weaknesses inconsumption and in construction activity, and slowdowns in production all occurred in 1973 prior to the reduction in the oil supply caused by the action ofthe OPEC cartel. When that last shock was added to the earlier ones such asthe large increases in the prices of food and imports other than fuels, the combined damage was too large to be effectively countered or absorbed by shortterm shifts in U.S. consumption and production patterns. By that time also,slowdowns in other industrial countries were beginning to occur, with adverseimplications for the demand for U.s. exports. The immediate consequences,
Victor Zarnowitz and C('()ffrey H. Moore490:__----------------~-..:.:.::.
then included (i) the production cutbacks mentioned above, (iiJ mOle upwardpre~~ure on actual and expected inflation rates, clnd (iii) mort' uuwnward pressure on real income of the private nonfarm sector of the economy.
Consumer outlays on goods and housing continued to bear the brunt ofthese adversities. The decline in retail sales of durable goods stores, which hadbegun several months before the oil embargo, noW accelerated considerably;total retail sales in current dollars rose but slowly In the dosmg months of 1973
and registered a substantial loss in real terms. With interest rates moving upand stock prices down at increased rates, there was further erosion of realspendable income and real net worth of households in 1974. As inflation interms of the annual rates of change in the CPI rose to 11 and 12 percent andthe unemployment rate increased steadily from 5 to 6 and then 7 percent ofthe labor force, the consumer sentiment index fell from 76 in the fourth quarterof 1973 to 58 a year later, recording a further sharp drop in consumer confi-
dence.While there is, with the beneiit of hindsight. little doubt about the qualita-
tive nature or general diiection of these developments, it is worth noting againthat the available quantitative measures of changes in inflation and real economic activity are far from precise, particularly for a period as turbulent as1973-1974. Comparisons of deflated value aggregates with series in physicalunits for a given industry or sector provide forceful and instructive reminders of
this fact.14
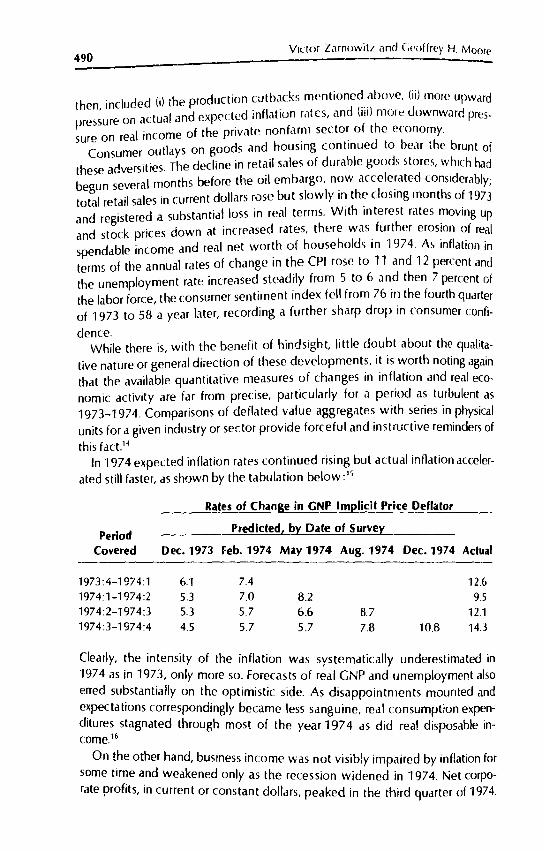
In 1974 expected inflation rates continued rising but actual inflation acceler-ated still faster, as shown by the tabulation below: 1
>
Rates of Change in GNP Implicit Price Deflator
PeriodCovered
Predicted, by Date of.~Sc=u=--,rv~eLY _
Dec.1973 Feb. 1974 May 1974 Aug. 1974 Dec.1974 Actual
1973:4-1974:11974:1-1974:21974:2-1974:31974:3-1974:4
6.1 7.45.3 7.0 8.25.3 5.7 6.6 8.74.5 5.7 5.7 7.8 10.8
12.69.5
12.114.3
(Iearty, the intensity of the inflation was systematically underestimated in1974 as in 197.3, only more so. Forecasts of real GNP and unemployment alsoerred substantially on the optimistic side. As disappointments mounted andexpectations correspondingly became less sanguine, real consumption expenditures stagnated through most of the year 1974 as did real disposable incomeH
On the other hand, business income was not Visibly impaired by inflation forsome time and weakened only as the recession widened in 1974. Net corporate profits, in current or constant dollars, peaked in the third quarter of 1974.
Recession and Recovery of 1973-1976 491
After inventory valuation and capital consumption adjustments, profits declined mildly in 1973 and sharply in1974, aCLOrding tu the prl'~ellt data; butthis is hardly how most businessmen perceived them at the time. Profits and inventories, always difficult to measure, were subject to especially large distortions in the current data for this inflationary period. In any event, businessspending, in contrast to consumer spending, continued strong well into the recession. Thus business fixed investment in current dollars rose throughout1974; in constan t dollars, it began to decline in the second quarter. Also, business inventories (book value) were being sharply increased through 1974,though again, inventory investment after valuation adjustment turns out tohave declined substantiall;' during that year.
The strength of business investment in materials and equipment (measuredin current dollars) is usudlly reilected in an expansion of unfilled orders held bymanufacturers, as new orders tend to rise faster than shipments for the products involved, mainly durable and in large part made-to-order goods (Zarnowitz 1973, chaps. 6, 8, ilnd 9). Indeed, the value of durable orders backlogsincreased continually and vigorously-over 70 percent-in the two years preceding September 1974, when it reached a peak of $189 billion. New ordersreceived by durable goods manufacturers crestEd at $51 billion in August;those for nondefense capital goods, at $14 billion in July. But adjustments iorinflation wipe out the 1974 rises in these series: in constant dollars, new ordersfor durabie goods gained little between March and November 1<)73 and declined thereafter, while new orders for capital goods rose strongly in 1973,then remained essentially unchanged for several months early in 1974, and fellsharply in the second half of the year. Contralts and expenditures for commercial and industrial plant construction show a definite contraction beginning latein 1973.
The reasons for this apparent turmoil and divergent movement in nominaland real investment are still far from clear. Many businessmen presumablyscrambled to place orders for materials because of anticipated capacity shortages and fears of more inflation, and their apprehensions proved only too true(and in part self-fulfilling). Some of the investmen t in commodity stocks, asnoted earlier, reflected speculation. At the same time, the accumulation of business on hand may have encouraged some firms to proceed with their capitalinvestment projects. However, real gains from investment dwindled, and eventhe nominal gains could continue only as long as many businessmen failed toperceive the spreading weakness of consumer demand and their own profitposition. The unusually long lag of recognition and adjustment was correspondingly costly; once it drew to a close, in mid-1974, business ordering wascut back drastically.17
The highly uneven incidence of the forces of contraction is reflected in boththe course and changing composition of the comprehensive aggregates of output and employment. Real GNP declined nearly 4 percent at annual rates in the
492Victor Zarnmvitz ilnd Ceo!frey H. Moore
'Nt in19671974 Peaks1973 Peaks
. f 1974· the index of industri,11 production lost 1.5Iwrcer.t be-fIrst quarter 0, ...
N ber 1973 and February t974. Alter the 011 embargo WJS Ilitedtween ovem ( .-rea! GNP contInued to dedine at somewhat. lower rates In the next two quar-ters (Table 2, line 2), while industrial productIon rose 1.7 percent between Feb-
d J e and then resumed a slow downward drift through Septemberruary an un . .Several of the current-dollar aggregates of sales, 10C0111<:> '. and thC' ~alue of out-put did not decline at all for periods long enough to q.ualrfy as cycltcal contrac-. nd those few that did turned down late, 10 August-October (seetlons, a ,
Chart 1 and Table 1). This, again, clearly reflects the strength of tne continuing
inflation.18
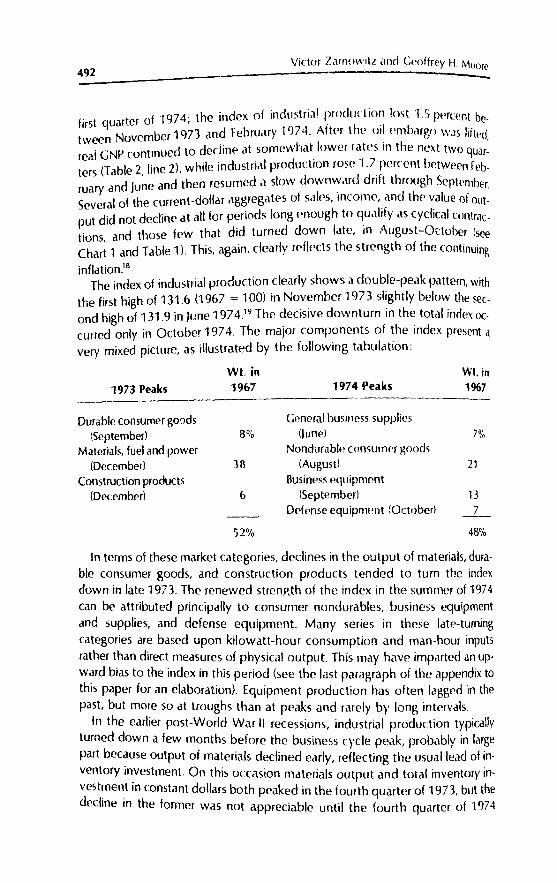
The index of industrial production clearly shows a double-peak pattern, withthe first high of 131.6 (1967 := 100) in November 1973 slightly below the second high of 131.9 in June 1974.19 The decisive downturn in the total index occurred only in October 1974. The major components of the index present avery mixed picture, as illustrated by the following tabulation:
wt. in1967
Durable consumer goads General business supplies(September) 8% (June} 70-1o
Materials, fuel and power Nondurable consumer goods(December) 38 (August) 21
Construction products Business eqUipment(December) b (September) 13
Defense equipment (October) 7
52% 48%
In terms of these market categories, declines in the output of materials, durable consumer goods, and construction products tended to turn the indexdown in late 1973. The renewed strenp,th of the index in the summer of 1974can be attributed principally to consumer nondurables, business equipmentand supplies, and defense equipment. Many series in these late-tumingcategories are based upon kilowatt-hour consumption and man-hour inputsrather than direct measures of physical output. This may have imparted an upward bias to the index in this period (see the last paragraph of the appendix tothis paper for an elaboration). Equipment production has often lagged in thepast, but more so at troughs than at peaks and rarely by long intervals.
In the earlier post-World War II recessions, industrial production typicallyturned down a few months before the business cycle peak, probably in largepart because output of materials declined early, reflecting the usual lead of inventory investment. On this occasion materials output and total inventory invest~en.t in constant dollars both peaked in the fourth quarter of 1973, but thedechne rn the former was not appreciable until the fourth quarter of 1974
Recession and Recovery oi 1973-1976 493
despite the sharp drop in the latter. Also, in previous cycles the industrial production index reached its peak at about the same time as or a few monthsbefore the peak in output of goods as measured in the national accounts. Butthis time goods output peaked in the fourth quarter of 1973 and declined continuously thereafter, while industrial production fell and then rose again. Itshould be noted that the industrial production index does not include the output of the construction industry, which had declined early and sharply in1973-1974. According to the national accounts, the output of goods andstructures leveled off after the first quarter of 1973, reached its final peak in thefourth quarter, and fell steadily thereafter, so that by the third quarter of 1974it was down more than 5 percent, whereas the industrial production index wasstill above its previous high. If construction activity were included in the industrial production index, as has long been urged, the weakness in the industrialsector of the economy in 1974 would have been plainer than the actual indexnow shows it to be.1o
Total employment-persons and hours-continued rising in 1974 for eightmonths or more afte'r aggregate output had turned down and unemploymenthad turned up (see Chart 1 and tables 1 and 2). Short lags of employment atbusiness cycle turns have occurred in the past, but the U.S. employment aggregates have generally exhibited roughly coincident timing. At the eight businesscycle peaks between 1929 and 1969, nonfarm employment lagged twice (bytwo and three months, respectively), led four times, and coincided twice. Partof the explanation for the unusually long lag in 1973-1974 probably lies in thecompositional shifts on both the demand and the supply side of the labormarket part in the widespread failure to recognize (or the tendency to underestimate) the weakness of the economy. The net accessions were concentrated in the service industries (jncluding government), which in terms of employment have long been growing more rapidly than the rest of the economy.Service employment is relatively stable cyclically because overhead labor,workers in white-collar occupations, and compensation on a piecework basisare all particularly important here. Furthermore, because services cannot bestored, inventory swings are not a factor. Employment in the goods-producingsector (mining, manufacturing, and construction) turned down in November 1973 and declined steadily thereafter. But the rise in the service sector,which now accounts for roughly two-thirds of total employment, offset thisdecline until the autumn of 1974.
It is interesting to note that the service industries have had a more powerfulstabilizing effect on employment than on output. The output of services, asmeasured in the national accounts, has usually risen during recessions, helpingto offset the decline in output of goods and structures, just as in the case ofemployment. Moreover, the long-run growth in services output has been fasterthan in goods output; so its stabiliZing effect on output, as well as on employment, has been rising. But the relative importance of services is significantly
494Victor Zarnowitz and Geoffrey H. Moore
greater in terms of employment than in terms of ?utput. Two-thirds of the employed are now engaged in the service industries, but they account for lessthan half of total output. As a result, total employment rose during 1974 whiletotal output fell, and the drop in employment in 1974-1975 was brief andmoderate while the drop in output was prolonged and severe. The trend hasbeen working in this direction during the entire postwar period, with the resultthat employment has become increasingly stable relative to output. In the1948-1949 recession the percent decline in total employment greatly exceeded the percent decline in real GNP; by 1973-1975, the decline in employment was only a third as large as in GNP (d. Table 6, lines 2 and 8, below). Oneeffect or this has been to lower the overall rate of productivity growth and
enlarge its cyclical swing.These effects of service industry growth can be readily documented. The
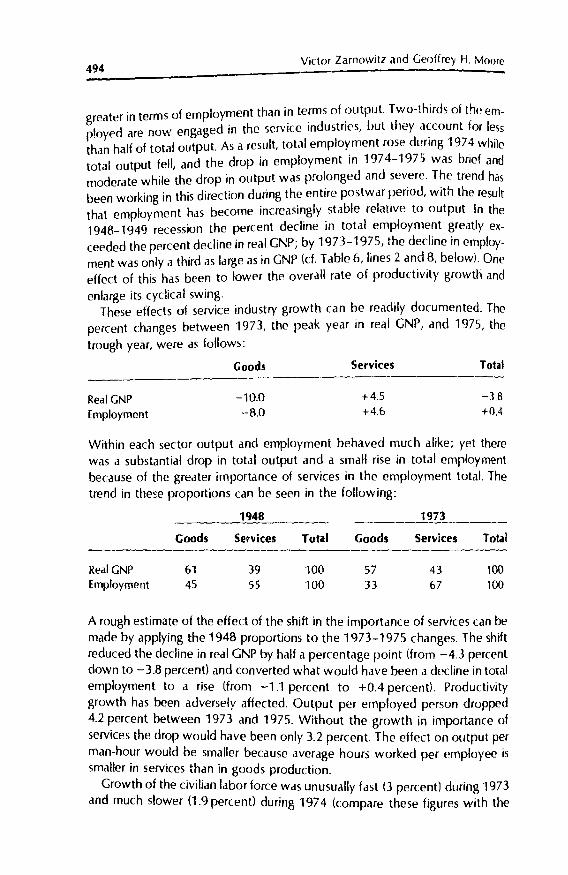
percent changes between 1973, the peak year in reai GNP, and 1975, thetrough year, were as follows:
Goods Services Total
Real GNPEmployment
-10.0--8.0
+4.5+4.6
-3.8+0.4
Within each sector output and employment behaved much alike; yet therewas a substantial drop in total output and a small rise in total employmentbecause of the greater importance of services in the employment total. Thetrend in the~e proportions can be seen in the following:
Real GNPEmployment
Goods
6145
1948
Services
39S5
Total
100100
Goods
5733
1973
Services
4367
Total
100100
A rough estimate of the effect of the shift in the importance of services can bemade by applying the 1948 proportions to the 1973-1975 changes. The shiftreduced the decline in real GNP by half a percentage point (from -4.3 percenldown to - 3.8 percent) and converted what would have been a decline in totalemployment to a rise (from -1.1 percent to +0.4 percent). Productivitygrowth has been adversely affected. Output per employed person dropped4.2 percent belween 1973 and 1975. Without the growth in importance ofservices the drop would have been only 3.2 percent. The effect on output p€rman-hour would be smaller because average hours worked per employee issmaller in services than in goods production.
Growth of the civilian labor force was unusually fast (J percent) during 1973and much slower (1.9 percent) during 1974 (compare these figures with the
Recessi!Jn and Recovery of 1973-1976 495
averages of 2.3 percent in 1968··1972 and 1.8 percent in 1963-1967). The acceleration of the labor force trend beginning in the years preceding the recession reflected primarily a more rapidly growing population of working age andincreases in certain participation rates, especially of women. Increased effortsof families to stem the inroads of inflation upon their living standards veryprobably drew additional persons into the labor market. During recessions"added workers" typically enter the market to bolster family income reducedor threatened by unemployment, shorter hours, or lower nonwage income, butthis is more often than not outweighed by the tendency for some unemployedworkers to become "discouraged" and withdraw from the job search. Semiannual comparisons indicate a net decline in the labor force growth rates duringthe second half of 1973 and both halves of 1974. The quit rate, which reacheda high plateau in 1973, declined early but not much and then remained ratherstable through mid-1974. Workers as well as employers seem to have adopteda cautious but still hopeful stance in face of an uncertain situation which manyviewed at the time as one of transitory troubles due to energy shortages ratherthan as an incipient recession. Thus businessmen continued to cut workinghours (the average workweek in manufacturing drifted downward after February 1973) but kept layoffs low, presumably hoping to weather a short slackperiod without incurring the risk of losing experienced employees and the costof high labor turnover.
Such tactics, however, can be followed but briefly, since they entail reduce~productivity and rising labor costs per unit of output, with adverse effects onprofits. Those tactics were not only dropped but sharply reversed as soon as itbecame clear that the economy was not going to rebound vigorously from thesetback attributed to the embargo. By the third quarter of 1974, the persistence of inflation at alarming two-digit rates could no longer disguise the deterioration of real sales and profits, and sharp cutbacks in production and employment ensued (see Table 2) as enterprises attempted to gain control overrising inventories of finished goods and accelerating costs of production.
This phase of the recession bears a close family resemblance to contractionsin aggregate demand that are typical of the "classical" business cycle. Much ofthe dramatic decline in total output during the last quarter of 1974 and the firstof 1975 can be traced to the rapid fall in inventory investment (see Table 2).Such developments are ordinarily explained by business attempts to reducestocks so as to bring them into a desired relationship with expected sales. (Thisrelationship is the core of the acceleration principle and the more generalstock-adjustment principle as applied to inventory investment.) With thisadded depressant effect on income and spending, manufacturing and tradesales contracted fast enough for several months to frustrate the apparent business intentions to reduce inventory-sales ratios.21 With the advent of 1975,however, inventory reductions took hold, and soon the rise in the overall ratioof business inventories to sales was arrested and reversed.
496 Victor Zarnowitz and Geoffrey H. Moore
Other factors also contributed to the economy's sharp contraction in thefall-winter season 1974-1975. Business capital outlays on plant and equipmentand consumer capital outlays on housing and automohiles declined in currentdollars and, substantially, in constant dollars. In particular, the decline in realresidential investment accelerated strongly in this period. In fact, all major expenditure components of real GNP decreased in the fourth quarter of 1974.But in the first quarter of 1975 total personal consumption expenditures turnedupward, and so did state and local government purchases of goods and services.
Changes in money and credit appear to have played a more moderate role inthe developments of 1973-1974 than in the earlier slowdown-and-recessionphases of recent business cycles. In the last years of expansion preceding thebusiness cycle peaks of 1953, 1960, and 1969, both the narrowly defined andthe broader monetary aggregates showed sharply falling rates of growth relative to their long trends; in late 1972 and in 1973, the monetary growth ratesdeclined also, but much less strongly and less abruptly.22 However, unlike theprevious business recessions, during each of which monetary aggregates increased at accelerated rates, the 1974 contraction was accompanied first byrelatively steady and then, particularly in the third quarter, by declining rates ofgrowth in these series. The slow growth of the money stock at this time hasbeen blamed by some analysts for the marked weakening of the demand forgoods and services (as represented by current-dollar GNP) in the two quartersending March 1975. But this particular linkage would imply an unusuallyprompt and strong reaction to what the present statistics show was a relativelybrief and mild dip in the growth of money stock in nominal terms, which is theunit of measure relevant to current-dollar GNP. In real terms, owing to the highand rising rate of inflation, the money stock entered upon an extended andsubstantial decline early in 1973, and by mid-1974 had dropped about asmuch as it did prior to and during the 1957-1958 recession. But real GNPdropped faster and further than it did then. Moreover, the hypothesis that theextensive decline in the real money stock was responsible for the severity ofthe recession runs up against the fact that reat GNP began a sustained recoveryearly in 1975 and a year later had regained its preceding peak level, whereasthe real money stock meanwhile experienced no growth whatever.
In the past, slowdowns in economic growth have always been accompaniedby reductions in the rate of inflation, but the lag in this relationship has beengetting longer. On this occasion, it took several months of recession accompanied by declining rates of monetary growth before the pace of inflationbegan to recede. Not until mid-1974 did decisive downturns occur in comprehensive measures of inflation-first in the rate of change in wholesale pricesfor industrial commodities and soon thereafter in the rate of change in consumer prices. (As usual, earlier signals of these reductions came from sensitiveprice indexes relating to selected crude and industrial materials'> This helped
Recession and Recovery of 1973-1976 497
greatly to check the decline in rcaI income and in consumer confidenrf'. Shortterm market interest rates and long-term bond yields generally turned down inthe third quarter of 1974, reducing the cost of credit. Stock prices stoppedfalling in the fourth quarter. Retail sales in constant dollars, which led the sequence of downturns in 1973, now headed the succession of upturns in comprehensive indicators of economic activity, as recorded in Table 1 (column 3l.From its low point in November 1974, consumer spendmg in real terms begana solid advance. Although it was not generally recognized at the time, the endof the recession was near.
The 1975-1976 Recovery
The revival of consumer expenditures on automobiles and durable goods ingeneral started well before the tax cut that took effect in May 1975, and evenbefore the prospect of lower tax payments began to exert a favorable influence upon people's spending plansP There are good reasons to think-thelikelihood of an inventory investment turnaround is onc of them-that the upturn of the economy in the spring of 1975 would have occurred when it didwithout the tax cut, but also that the fiscal stimulation contributed substantially to the recovery later, in the second half of the year. Fiscal actions probablyhad little, if any, net expansionary effect before 1975, whereas the initial signsof an upturn came earlier.24 Among these were the declines in the cost of credit and in the cost of materials, mentioned above.
Only seven months (November 1974-]une 1975) separate the earliest fromthe latest of the specific trough dates in the comprehensive series listed inTable 1, in sharp contrast to the 21-month period spanned by the peaks of1973-1974 (d. columns 2 and 3l. The transition from recession to recoverywas much swifter than the transition from expansion to recession. Lengthyperiods of economic slowdown in late expansion and relatively swift movements out of recession into recovery have been typical of other recent business cycles in the United States, particularly during 1955-1971.25
Initially, the recovery derived its strength almost entirely from consumerspending, which more than compensated for the weaknesses in business investment and federal purchases. In the second quarter of 1975, real GNP increased 5.6 percent at an annual rate, while personal consumption and residential construction increased approximately 7 and 17 p~rcent, respectively.At the same time and measured the same way, nonresidential fixed investmentfell 14 percent, and total government purchases of goods and services declined 3 percent. The liquidation of business inventories at all stages of fabrication proceeded at a rapid pace for another quarter, as shown in Table 2,line15.
In the second half of 1975, growth of real consumption expenditures moderated, but growth of real GNP soared to 11.4 percent in 1975:3 (among the
498 Victor Zarnowill and Ceoffrey H. Moore
highest rates ever recorded and exceeded only rlming thf' rapid expansion of19501, then fell to 3.3 percent in 1975:4. Of major importance here was thesharp diminution of the downward pull on the economy exerted by inventoryliquidation. Moreover, real investment in residential structures increasedstrongly, particularly in the third quarter. Nonresidential fixed investment in1972 dollars declined very slightly in the third quarter and rose similarly in thefourth. Purchases of goods and services at all levels of government increasedmoderately.
Growth in real GNP reaccelerated to over 9 percent per year in the firstquarter of 1976, with most expenditure components scoring good gains(Table 2). The gains for fixed investment, however, pertained to levels thatwere slilllow, not much above the 1975 troughs and well below their averagelevels for 1974. Inventory accumulation at the annual rate of $-10.4 billion replaced the liquidation phase of 1975. This turnaround, in fact, accounted for alarge part of the total rise in real GNP during winter 1976: final sales in 1972dollars increased at an annual rate of slightly less than 4 percent. Total government purchases of goods and services in constant dollars declined some 5 percent.
In the second quarter of 1976, growth in real GNP fell to slightly less thanhalf the rate in the first quarter, but this was due entirely to a cessation of thefast growth in business inventory investment. Final sales in real terms increaseda little over 4 percent owing to an equal proportional gain in consumption,much larger gains in nonresidential and residential fixed investment (over 8 and15 percent, respectively), and an unexpectedly small gain in governmentspending. The index of industrial production moved up almost 8 percent at annual rate in the second quarter, nonfarm employment almost 3 percent.
Finally, the data now available indicate that the expansion proceeded at astill slower pace in the second half of 1976. Real GNP rose at annual rates of 3.9and 2.6 percent in the third and fourth quarter, respectively. However, whatmany contemporary observers deplored as a "pause" in the expansion wasagain due largely to business inventory investment, which remained remarkably steady in the first three quarters of 1976, then dropped drastically in thelast.2b Fina! sales in constant dollars increased at annual rates of 4.3 percent inthe third and 5.5 percent in the fourth quarter. To some extent, the retardationin the growth of real GNP can also be traced to small gains or losses in the government sector and in fixed nonresidential investment.
These observations suggest that the recovery was widespread, but supported predominantly by gains in consumer spending (especially for automobiles and other durable goods) and by the transition from a massive disinvestment to a modest investment in business inventories. Capital outlays on plantand equipment and on housing, though rising at substantial rates, were still relatively low; their contribution to recovery during the filst two years was unusually small by historical standards.
Recession and Recovery of 1973-1976 499
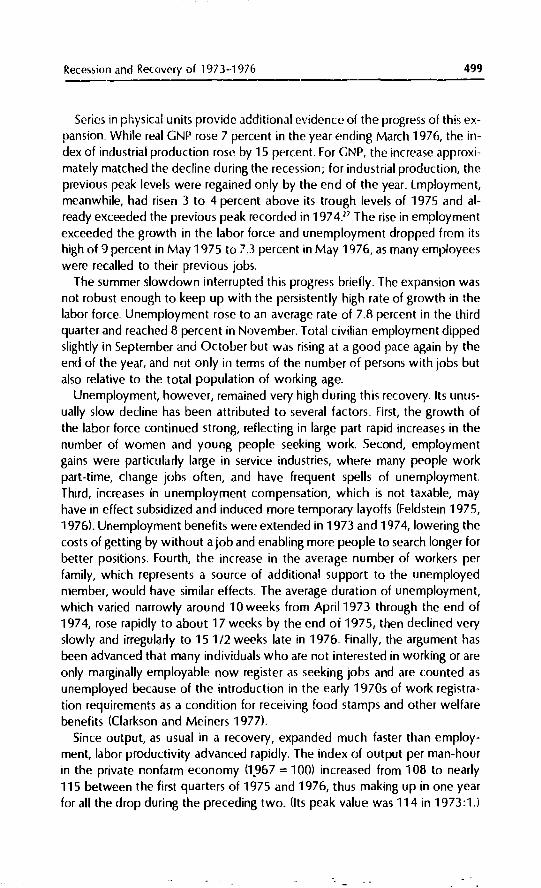
Series in physical units provide additional evidence of the progress of this expansion. While real GNP rose 7 percent in the year ending March 1976, the index of industrial production rose by 15 percent. For GNP, the increase approximately matched the decline during the recession; for industrial production, theprevious peak levels were regained only by the end of the year. Employment,meanwhile, had risen 3 to 4 percent above its trough levels of 1975 and already exceeded the previous peak recorded in 1974.27 The rise in employmentexceeded the growth in the labor force and unemployment dropped from itshigh of 9 percent in May 1975 to 7.3 percent in May 1976, as many employeeswere recalled to their previous jobs.
The summer slowdown interrupted this progress briefly. The expansion wasnot robust enough to keep up with the persistently high rate of growth in thelabor force. Unemployment rose to an average rate of 7.8 percent in the thirdquarter and reached 8 percent in November. Total civilian employment dippedslightly in September and October but was rising at a good pace again by theend of the year, and not only in terms of the number of persons with jobs butalso relative to the total population of working age.
Unemployment, however, remained very high during this recovery. Its unusually slow decline has been attributed to several factors. First, the growth ofthe labor force continued strong, reflecting in large part rapid increases in thenumber of women and young people seeking work. Second, employmentgains were particularly large in service industries, where many people workpart-time, change jobs often, and have frequent spells of unemployment.Third, increases in unemployment compensation, which is not taxable, mayhave in effect subsidized and induced more temporary layoffs (Feldstein 1975,1976l. Unemployment benefits were extended in 1973 and 1974, lowering thecosts of getting by without a job and enabling more people to search longer forbetter positions. Fourth, the increase in the average number of workers perfamily, which represents a source of additional support to the unemployedmember, would have similar effects. The average duration of unemployment,which varied narrowly around 10 weeks from April 1973 through the end of1974, rose rapidly to about 17 weeks by the end of 1975, then declined veryslowly and irregularly to 15 1/2 weeks late in 1976. Finally, the argument hasbeen advanced that many individuals who are not interested in working or areonly marginally employable now register as seeking jobs and are counted asunemployed because of the introduction in the early 1970s of work registration requirements as a condition for receiving food stamps and other welfarebenefits (Clarkson and Meiners 1977).
Since output, as usual in a recovery, expanded much faster than employment, labor productivity advanced rapidly. The index of output per man-hourin the private nonfarm economy (1.967 = 100) increased from 108 to nearly115 between the first quarters of 1975 and 1976, thus making up in one yearfor all the drop during the preceding two. lIts peak value was 114 in 1973:1.)
500 Victor Zarnowitz and Geoffrey H. Moore
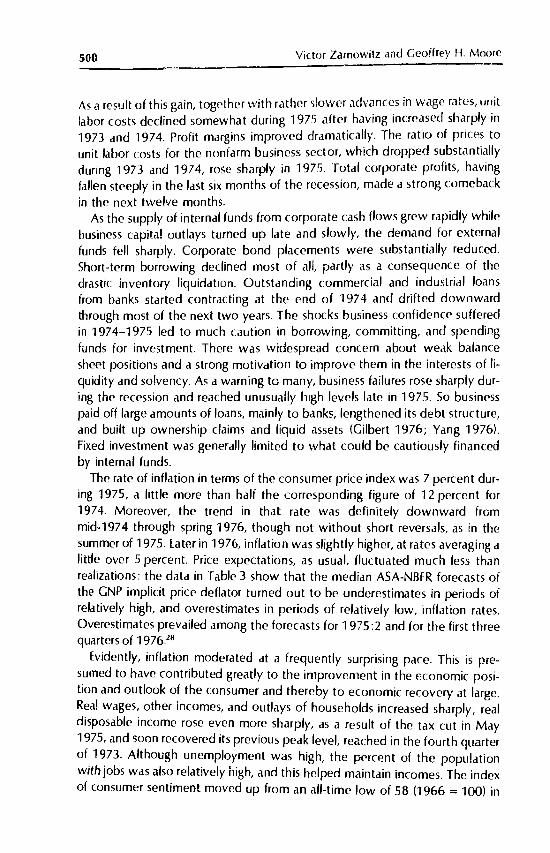
As a result of this gain, together with rather slower advances in wage rates, unitlabor costs declined somewha t during 1975 after having increased sharply in1973 and 1974. Profit margins improved dramatically. The ratio of prices tounit labor costs for the nonfarm business sector, which dropped substantiallyduring 1973 and 1974, rose sharply in 1975. Total corporate profits, havingfallen steeply in the last SIX months of the recession, made a strong comebackin the next twelve months.
As the supply of internal funds from corporate cash flows grew rapidly whilebusiness capita! outlays turned up late and slowly, the demand for externalfunds fell sharply. Corporate bond placements were substantially reduced.Short-term borrowing declined most of all, partly as a consequence of thedrastic inventory liquidation. Outstanding commercial and industrial loansfrom banks started contracting at the end of 1974 and drifted downwardthrough most of the next two years. The shocks business confidence sufferedin 1974-1975 led to much caution in borrowing, committing, and spendingfunds for inve5tment. There was widespread concern about weak balancesheet positions and a strong motivation to improve them in the interests of liquidity and solvency. As a warning to many, business failures rose sharply during the recession and reached unusually high levels late in 1975. So businesspaid off large amounts of loans, mainly to banks, lengthened its debt structure,and built up ownership claims and liquid assets (Gilbert '1976; Yang 19761.Fixed investment was generally limited to what could be cautiously financedby internal funds.
The rate of inflation in terms of the consumer price index was 7 percent during 1975, a little more than half the corresponding figure of 12 percent for1974. Moreover, the trend in that rate was definitely downward frommid-1974 through spring 1976, though not without short reversals, as in thesummer of 1975. later in 1976, inflation was slightly higher, at rates averaging alittle over 5 percent. Price expectations, as usual, fluctuated much less thanrealizations: the data in Table 3 show that the median ASA-NBER forecasts ofthe GNP implicit price deflator turned out to be underestimates in periods ojrelatively high, and overestimates in periods of relatively low, inflation rates.Overestimates prevailed among the forecasts for 1975:2 and for the first threequarters of 1976.26
Evidently, inflation moderated at a frequently surprising pace. This is presumed to have contributed greatly to the improvement in the economic position and outlook of the consumer and thereby to economic recovery at large.Real wages, other incomes, and outlays of households increased sharply; realdisposable income rose even more sharply, as a result of the tax cut in May1975, and soon recovered its previous peak level, reached in the fourth quarterof 1973. Although unemployment was high, the percent of the populationwith jobs was also relatively high, and this helped maintain incomes. The indexof consumer sentiment moved up from an all-time low of 58 (1966 = 100) in
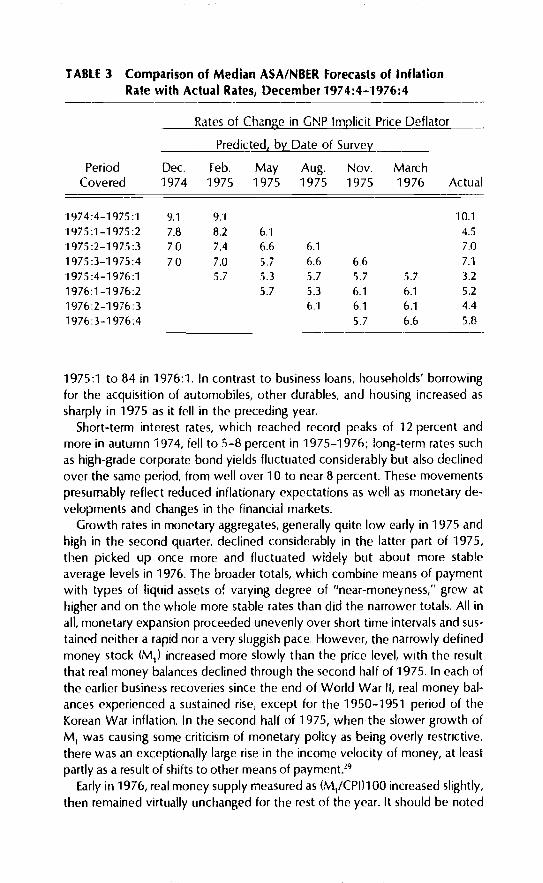
TABLE 3 Comparison of Median ASAINBER Forecasts of InflationRate with Actual Rates, December 1974:4-·1976:4
Rates of Change in GNP Implicit Price Deflator
Predicted, b'{Date of Survet-
Period Dec. Feb. May Aug. Nov. MarchCovered 1974 1975 1975 1975 1975 1976 Actual
1974:4-1975:1 9.1 9.1 10.11975:1-1975 :2 7.8 8.2 6.1 4.51975 :2-1975:3 7.0 7.4 6.6 6.1 7.01975 :3-1975:4 7.0 7.0 5.7 6.6 6.6 7.11975 :4-1976:1 5.7 5.3 5.7 5.7 5.7 3.21976:1-1976:2 5.7 5.3 6.1 6.1 5.21976:2-1976:3 6.1 6.1 6.1 4.41976:3-1976:4 5.7 6.6 5.8
1975:1 to 84 in 1976:1. In contrast to business loans, households' borrowingfor the acquisition of automobiles, other durables, and housing increased assharply in 1975 as it fell in the preceding year.
Short-term interest rates, which reached record peaks of 12 percent andmore in autumn 1974, fell to 5-8 percent in 1975-1976; long-term rates suchas high-grade corporate bond yields fluctuated considerably but also ueclinedover the same period, from well over 10 to near 8 percent. These movementspresumably reflect reduced inflationary expectations as well as monetary developments and changes in the financial markets.
Growth rates in monetary aggregates, generally quite low early in 1975 andhigh in the second quarter, declined considerably in the latter part of 1975,then picked up once more and fluctuated widely but about more stableaverage levels in 1976. The broader totals, which combine means of paymentwith types of liquid assets of varying degree of "near-moneyness," grew athigher and on the whole more stable rates than did the narrower totals. All inall, monetary expansion proceeded unevenly over short time intervals and sustained neither a rapid nor a very sluggish pace. However, the narrowly definedmoney stock (M1) increased more slowly than the price level, with the resultthat real money balances declined through the second half of 1975. In each ofthe earlier business recoveries since the end of World War II, real money balances experienced a sustained rise, except for the 1950-1951 period of theKorean War inflation. In the second half of 1975, when the slower growth ofM1 was causing some criticism of monetary policy as being overly restrictive,there was an exceptionally large rise in the income velocity of money, at leastpartly as a result of shifts to other means of payment.Z9
Early in 1976, real money supply measured as (tvVCPIl1 00 increased slightly,then remained virtually unchanged for the rest of the year. It should be noted
502 Victor Zarnowitz and Ceoffrey H. Moore
that when Ml
(which includes time deposits at commercial banks in additionto the demand deposits dnd Lurrenq induded in M I) is analogously expressedin real terms, the resulting series (M/CPI)100 shows a definite upturn in January 1975 followed by an expansion through 1976 interrupted only by severalmonths of nearly zero change in the second half of 1975.
Dating the Recession and the Recovery
The phase of slow growth preceding a recession is as a rule associated with aspreading decline in the number of economic activities that are still expanding.In short, as the overall pace of the expansion decreases, so too does its scope;indeed, the latter process accounts in large part for the former. This can be illustrated by the so-called diffusion indexes, which represent, for a particulareconomic aggregate or index, the percent of components rising in successive
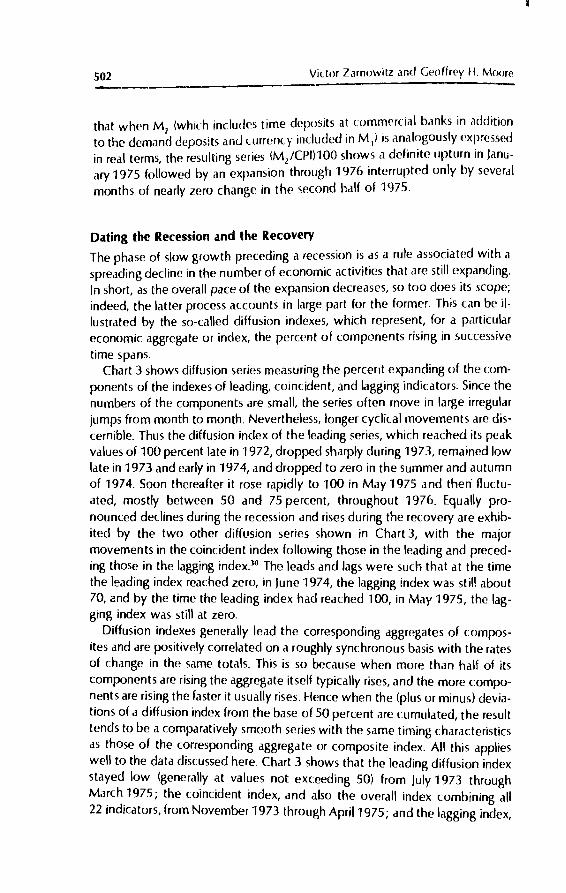
time spans.Chart 3 shows diffusion series measuring the percent expanding of the com
ponents of the indexes of leading, coincident, and lagging indicators. Since thenumbers of the components are small, the series often move in large irregularjumps from month to month. Nevertheless, longer cyclical movements are discernible. Thus the diffusion index of the leading series, which reached its peakvalues of 100 percent late in 1972, dropped sharply during 1973, remained lowlate in 1973 and early in 1974, and dropped to zero in the summer and autumnof 1974. Soon thereafter it rose rapidly to 100 in May 1975 and then· fluctuated, mostly between 50 and 75 percent, throughout 1976. Equally pronounced declines during the recession and rises during the recovery are exhibited by the two other diffusion series shown in Chart 3, with the majormovements in the coincident index follOWing those in the leading and preceding those in the lagging index.3D The leads and lags were such that at the timethe leading index reached zero, in June 1974, the lagging index was still about70, and by the time the leading index had reached 100, in May 1975, the lagging index was still at zero.
Diffusion indexes generally lead the corresponding aggregates of composites and are positively correlated on a roughly synchronous basis with the ratesof change in the same totals. This is so because when more than half of itscomponents are rising the aggregate itself typically rises, and the more components are rising the faster it usually rises. Hence when the (plus or minus) deviations of a diffusion index from the base of 50 percent are cumulated, the resulttends to be a comparatively smooth series with the same timing characteristicsas those of the corresponding aggregate or composite index. All this applieswell to the data discussed here. Chart 3 shows that the leading diffusion indexstayed low (generally at values not exceeding 50) from July 1973 throughMarch 1975; the coincident index, and also the overall index combining all22 indicators, from November 1973 through April 1975; and the lagging index,
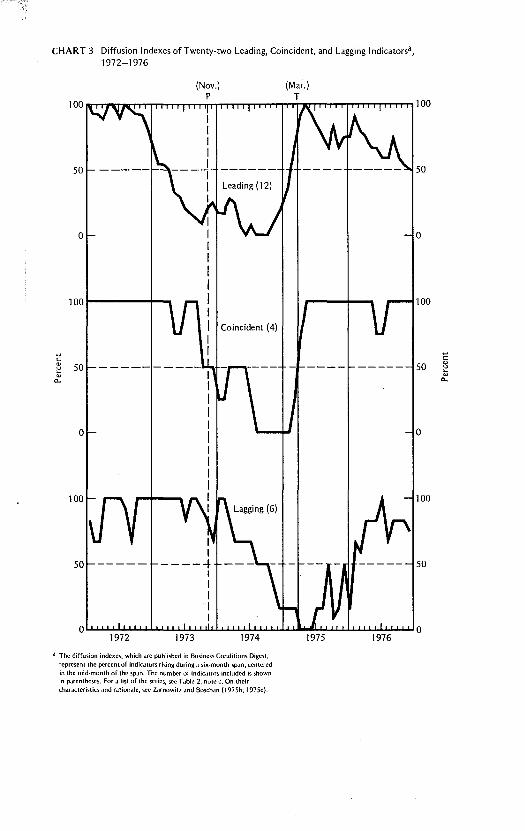
CHART 3 Diffusion Indexes of Twenty-two Leading, Coincident, and Lagging Indicatorsa,1972-1976
1001----4-...
c~ 50"0..
a
Coincident (4)
~
c----- 50 ~
"0..
a
100
50
II
-----+IIIII
100
50
aU-L..u..Lll..LJ..JuJ..L.U..L.L.J..U...uL1.l...L.l.J.JuJ..I..U..L.L.J..U......lI.LJ..l.J.Ju.J..L.U..L.L.J..U..J..I..LJ a1972 1973 1974 1975 1976
d The diffusion indexes, which Me pUblished in Business Condilions Digest,represent the percenl of jodie,iloT" rising during.1 six-month sp.m, ,cl~lcrcdin the mid-month of the sp,m. The number of indic.llnrs included is shownin p..trcnlhcscs. For .1 list of the St'rics, sec T.lble 2, note c. On their,h.tr.lctcrbti,s ,lnd rJ.liOlMlc, sec Z,lrnowit/.•md Bosch.m (1975b, 1975,).
504 Victor Zarnowilz and Geoffrey H. Moore
from October 1974 through February 1976. These data are either identiC,11with or close to the peaks and troughs in the composite indexes of the leading,coincident and lagging indicators. J1
Diffusion indexes help to show when recessions in economic activity become widespread. We use them also, together with composite indexes, tosummarize the evidence on the cyclical timing of the principal indicators of aggregate economic activity during 1973-1975 as it relates to the growth cycledownturn and upturn and to the business cycle peak and trough. The individual series used for this purpose, in seasonally adjusted form, are shown inChart 1; the corresponding series of deviations from the trend estimates, inChart 2. Composite indexes based on these series are computed by standardizing the monthly percent changes in the component series so as to prevent themore volatile series from dominating the index; averaging the standardizedchanges for the several components for each successive month; and cumulating the results into a monthly index. Diffusion indexes, based on the sameseries, show in cumulated form the excess of the percent of indicators expanding over the percent contracting, using cyclical peaks and troughs to definethese phases.Jl Both types of index are informative and in a sense compl~
mentary. A composite index has two distinguishing features as compared witha diffusion index: (j) it takes into account not just the direction, but the size, ofchanges in the series covered; (ii) it does not depend on the choice of specificpeak and trough dates in the individual indicators. On the other hand, the diffusion index reflects the consensus of cyclical highs and lows in the indicators,ignoring most of the blips due to such things as unusual weather or strikes. Itanswers more directly the question, When did contraction become morewidespread than expansion, or vice versa.
The composite index based on the deviations from trend of the eleven indicators in real terms listed in Table 1, lines 1-7, 9-12, reached a peak inMarch 1973 after a strong expansion that began in November 1970 (Chart 4).The index varied but little during the next nine months, marking the 1973phase of low growth. Similarly, the historical cumulative diffusion index basedon the same set of indicators reached a high plateau in March and remainedsubstantially unchanged through most of the year. This reflects peaking of thetrend-adjusted data early in 1973 in real income and sales, but late in 1973 inthe employment series (Chart 2).
The detrended current-dollar indicators reached their peaks generally between August and November of 1973 (Table 1, lines 13-19), but this, ofcourse, reflects the impact of inflation, which masked the slowdown in realgrowth during this period. In our judgment, based on the evidence in Table 1and charts 2 and 4, the best choice for a reference date to mark the beginningof the ~Iowdown (the peak of the growth cycle) is March 1973.
The indexes based on the series proper (i.e., without trend adjustment) pointto November 1973 as the last month of business cycle expansion. The com-
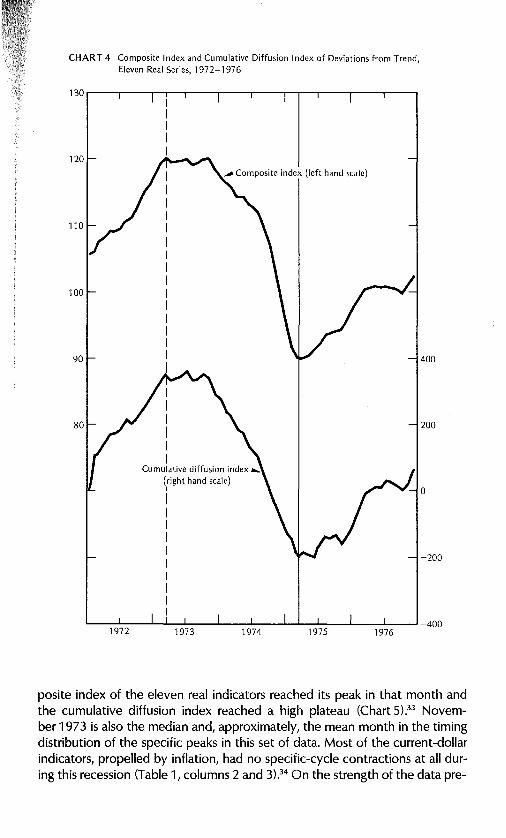
CHART 4 Composite Index and Cumulative Diffusion Index of Deviations from Trend,Eleven Real Series, 1972-1976
130 ~-..,-----.--.-.---....--,---.--.----.---,.--,.....-...,
80
IIIIII
Cumulative diffusion index ...(right hand scale)I
IIIIIIIIII
200
-200
1976197519741973'--_....L..._--'---'-_1..-_..l-_-.L__.L-.L--l-_---I.__..I...-_....J -400
1972
posite index of the eleven real indicators reached its peak in that month andthe cumulative diffusion index reached a high plateau (Chart 5),33 November 1973 is also the median and, approximately, the mean month in the timingdistribution of the specific peaks in this set of data. Most of the current-dollarindicators, propelled by inflation, had no specific-cycle contractions at all during this recession (Table 1, columns 2 and 3),34 On the strength of the data pre-
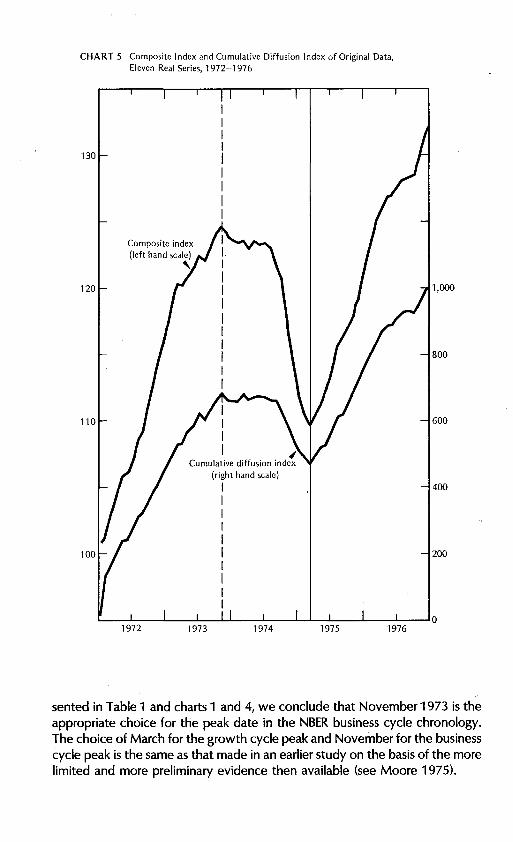
CHART 5 Composite Index and Cumulative Diffusion Index of Original Data,Eleven Real Series, 1972--1976
130
120
110
~Cumulative diffusion index
(right hand scale)
IIIIIIIIII
1,000
800
600
400
200
L..-_..L-_-'-_---L_-L..l..-_..L-_-'--'----L__l..-_...1-_-JO
1973 1974 1975 1976
sented in Table 1 and charts 1 and 4, we conclude that November 1973 is theappropriate choice for the peak date in the NBER business cycle chronology.The choice of March for the growth cycle peak and November for the businesscycle peak is the same as that made in an earlier study on the basis of the morelimited and more preliminary evidence then available (see Moore 1975).
Recession and Recovery of 1973-1976 507
A low-growth phase will start befure the aLlual dt:cline in general businessactivity if the economy grows at less than its long-terrn trend rate prior to thebusiness cycle peak; this often happens and the 1973 developments illustrateit well. Such a phase need not encompass it business cycle contraction (recession) but, if it does, it cannot, of course, end before the contraction ends. Itcan, however, end latEr and will do so if the economy expands after the business cycle trough at a slower rate than that of the growth trend. Timing discrepancies of the latter sort are not very frequent and tend to be small in anyevent, because business expansions in their early (recovery) stages are oftenvigorous. In 1975 the troughs in the business cycle and the growth cycle wereapproximately synchronous.
Indeed, as shown in Table 1 (columns 3 and 4) and charts 1 and 2, most ofthe indicators of aggregate economic activity turned up in the short intervalbetween February and June 1975, and so did the corresponding series of thedeviations from trend. The business cycle trough is easy to date on the evidence of Table1, column 3, and charts 1 and 5: the troughs in both the composite and cumulative diffusion indexes occur in March 1975 and the measuresof central tendency derived from the timing distribution of the specific troughsconfirm that choice. For the growth cycle upturn, a close reading of the evidence in Table 1, column 4, and charts 2 and 4 suggests that March, April, orMay 1975 are possible choices, with little to choose among them. We haveconcluded that there is a slight preponderance of evidence in favor of March,the same month as the business cycle trough. What this means is that economic activity reached its lowest point in March, and that the fate of growth veryquickly rose above the long-run trend rate.
Table 4 shows that in previous business cycles, as well as in 1973-1975, recession typically followed the onset of a low-growth phase, while recoverywas approximately synchronous with the onset ot a high-growth phase. (Onthree occasions since 1948-in 1951-1952, 1962-1964, and 1966-1967low-growth phases interrupted business expansions but did not degenerate into business contractions.) The chronologies listed in the table will help identifythe cyclical episodes that are included in the comparative analysis to follow.
[3) CYCLICAL MOVEMENTS DURING 1973-1976IN HISTORICAL PERSPECTIVE
Business cycles cannot be reduced to any single dimension: they consist of numerous, diverse, and intricately connected processes shaped by many economic and other events. Business contracttons have historically varied much inlength, amplitude, and scope, and so have business expansions. These threecriteria-duration, depth, and diffusion-can be used to compare cyclical
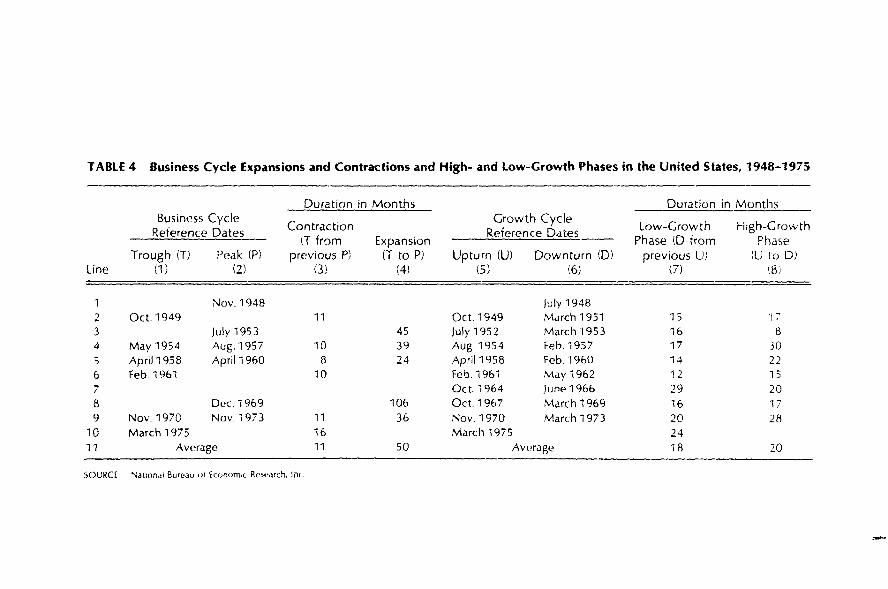
TABLE 4 Business Cycle Expansions and Contractions and High- and Low-Growth Phases in the United States, 1948-1975
Duration in Months Duration in MonthsBusiness Cycle
ContractionGrowth Cycle
low-Growth High-GrowthReference Dates Reference Dates
(T fr0m Expansion Phase (D from PhaseTrough (T) Peak rPl previous P) (T to Pl Upturn (Ul Downturn (0) previous U.l (U to D)
line (1) (2) (3) (4) (5) (6) (7) (8)
1 ,\Jov.1948 July 19482 Oct. 1949 11 Oct. 1949 March 1951 15 "i73 July 1953 45 July 1952 March'1953 16 84 May 1954 Aug.1957 10 39 Aug.1954 Feb.1957 17 305 April 1958 April 1960 8 24 April 1958 Feb. 1960 14 226 Feb. 1961 10 Feb. 1961 May 1962 12 157 Oct. 1964 June 1966 29 208 Dec. 1969 106 Oct. 1967 March 1969 16 179 Nov. 1970 Nov. 1973 11 36 Nov. 1970 March 1973 20 28
10 March 1975 16 March 1975 2411 Average 11 50 Average 18 20
SOURCE Nationdl BureJu oi EcunomlC Rest'.:uch. lilC.
Recession and Recovery of 1973-1976 509
movements. They refer to distinct, although not independent, aspecls of cyclical movement. Each is important, and each can be measured ex post III reasonably objective and accurate ways. Cyclical movements can also be comparedin detail as they proceed by computing cyclical patterns for different economicindicators, starting from business cycle peaks or troughs and moving forwardmonth by month or quarter by quarter. The similarities or differences betweencurrent developments and those at corresponding stages of earlier business cycles can be readily examined by this device. In the next section we comparethe 1973-1975 recession with its predecessors in terms of duration, depth, anddiffusion. In the following section, we take up the comparison of bOlh the recession and the ensuing recovery in terms of cyclical patterns.
Duration, Depth, and Diffusion of Recessions
Table 5, based on the revised and updated business cycle chronology of theNational Bureau, shows that the 1973-1975 recession lasted sixteen months,while the five earlier recessions since the end of World War II lasted from eightto eleven months Uine 1). However, different durations and ranks are obtaineddepending on which individual series or indexes are used, partly because ofsystematic differences in the cyclical timing of economic processes and partlybecause of random influences and measurement errors involved in the determination of cyclical turning points. Contractions in the principal indicators ofincome, sales, production, and employment generally overlap in each recession, but they are not exactly coincident and indeed their durations vary considerably. The correlations between ranks based on the duration measures forthe different series are in general positive but not high. Those between business cycle durations, on the one hand, and the index of coincident indicators,real GNP, and averages for thirteen selected indicators, on the other hand(lines 12-14 and 23) range from 0.5 to 0.7. 35 The ranks for the employmentseries (lines 18, 19, 22) are substantially different and show either no correlations or low negative correlations with the ranks based on the business cyclechronology.J6
That the consensus among the ranks for the five recessions of 1948-1970 isonly moderate is not surprising, since these recessions have not varied much induration according to the NBER chronology. On the other hand, all the measures in Table 5, except those derived from the industrial production, employment, and unemployment data, show the 1973-1975 recession to have beenthe longest since the end of World War II. Industrial production, as shown earlier, had a double-peak configuration in 1973-1974: it stopped rising in theautumn of 1973, though it did not definitely decline until almost a year later.
The exceptionally brief decline in employment (total employment declinedfor only eight months) was, at least in part, the consequence of the trendnoted earlier. Declines in employment in the service industries have been brief-
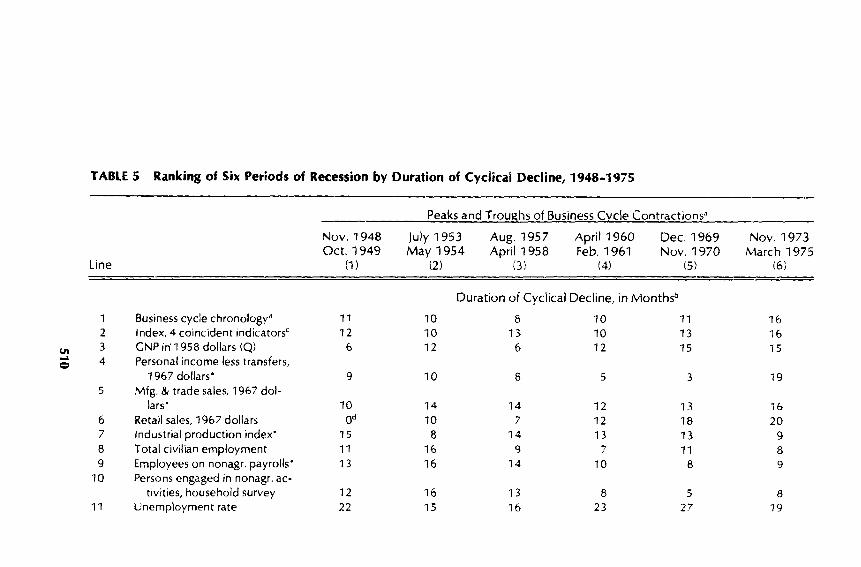
TABLE 5 Ranking of Six Periods of Recession by Duration of Cyclical Decline, 1948-1975
--Peaks and Troughs of Business Cycle Contractions"
Nov. 1948 July 1953 Aug. 1957 April 1960 Dec. 1969 Nov. 1973Oct. 1949 May 1954 April 1958 Feb. 1961 Nov. 1970 March 1975
Line (1 ) (2) (3) (4) (5) (6)
Duration of Cyclical Decline, in Monthsb
1 Business cycle chronology' 11 10 8 10 11 162 Index, 4 coincident indicatorsc 12 10 13 10 13 16
VI 3 GNP in' 1958 dollars (Q) 6 12 6 12 15 15""'" 4 Personal income less transfers,C>
1967 dollars· 9 10 6 5 3 195 Mfg. & trade sales, 1967 dol-
lars· 10 14 14 12 13 166 Retail sales, 1967 dollars ad 10 7 12 18 207 Industrial production index· 15 8 14 13 13 98 Total civilian employment 11 16 9 7 11 89 Employees on nonagr. payrolls· 13 16 14 10 8 9
10 Persons engaged in nonagr. ac-tivities, household survey 12 16 13 8 5 8
11 Unemployment rate 22 15 16 23 27 19
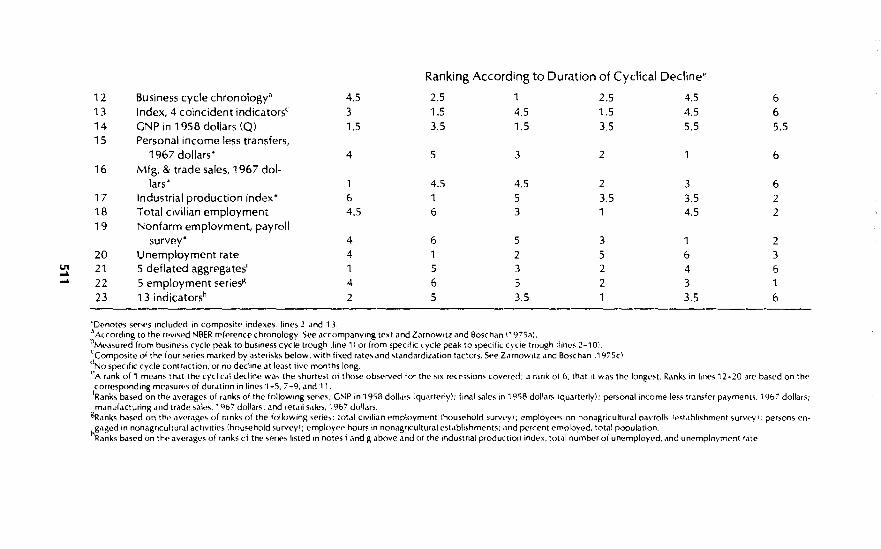
Ranking According to Duration of Cyclical Decline"
12 Business cycle chronology" 4.5 2.5 1 2.5 4.5 613 Index, 4 coincident indicators' 3 1.5 4.5 1.5 4.5 614 GNP in 1958 doliars (Q) 1.5 3.5 1.5 3.5 5.5 5.515 Personal income less transfers,
1967 dollars' 4 5 3 2 1 616 Mfg. & trade sales, 1967 dol-
lars' 1 4.5 4.5 2 3 61'7 Industrial production index' 6 1 5 3.5 3.5 218 Total civilian employment 4.5 6 3 1 4.5 219 Nonfarm employment, payroll
survey' 4 6 5 3 1 220 Unemployment rate 4 1 2 5 6 3
\J1 21 5 deflated aggregates' 1 5 3 2 4 6-l-l 22 5 employment series3 4 6 5 2 3 1
23 13 indicatorsh 2 5 3.5 1 3.5 6
'Denotes SNles Included in composite mdexes. lines 2 and 13"A,cording to the «'vised NBER refprence chronology See accompanYing text and Zarnowltz and Boschan 11975.1).bMeasured from business Cycll' peak to business cycle trough iline 1) or from specific cycle peak to specifiC cycle trough Ilines 2-101.(Composite of the four se.ies m",ked by asterisks below. with fixed rates and standard,z.1t,on factors. 51'''' Z",nowitz and Boschan 11975cldNa specifIC cycle contr."tion, or no decline at least five months long."A rank of 1 means that the cyclical decline was the shortest of those obs..rved for the SiX rec .."ions covered: a rank of 6. that It was the longest. Ranks in Iil1es 12-20·)1{' based on th..corresponding measUll's of durdtion In lines 1-5,7 -9. and 11.IRanks based on the averages of ranks of the follOWing series: GNP in 1958 doll",s (quarterly); final sales 1111958 dollars Iquarterly); personal income less transfer payments. ; %7 dollars;manufacturing and trade s.lles. 1967 dollars: and retail s"les. ;967 dollars.
BRanks based 011 the averages of ranks of the follOWing serres: :otal CIVilian employment (household survey): employees on nonagricultural payrolls I,es••lblishment surv,"y'; persons eng.'ged in n"nagricultural activities (household survey'; empioy..e hours In nonagrrcultural establishments; ,lnd percent employed. total population.
hRanks based on the averages of ranks ci the spril's listed in notes f and g "bove and of the I"dustrial productlollindex. tot.l! number of unemployed.•lnd un€'mpIOYlT1enl 'ate
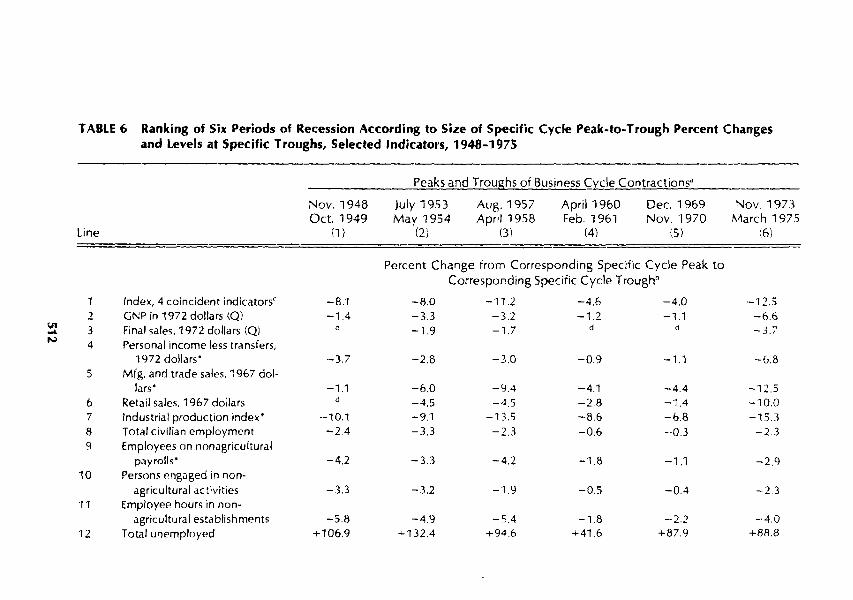
TABLE 6 Ranking of Sill Periods of Recession According to Size of Specific Cycle Peak-to-Trough Percent Changesand levels at Specific Troughs, Selected Indicators, 1948-1975
Peaks and Troughs of Business Cycle Contractions·
Nov. 1948 July 1953 Aug. 1957 April 1960 Dec. 1969 Nov. 1973Oct. 1949 May 1954 April 1958 Feb. 1961 Nov. 1970 March 1975
Line (1) (2) (3) (4) (5) (6)
Percent Change from Corresponding Specific Cycle Peak toCorresponding Specific Cycle Troughb
Index, 4 coincident indicatorsc -8.1 -8.0 -11.2 -4.6 -4.0 -12.52 GNP in 1972 dollars (Q) -1.4 -3.3 -3.2 -1.2 -1.1 -6.6
\,113 Final sales. 1972 dollars (Q) d -1.9 -1.7 d d 3 ..,.... - .1
N 4 Personal income less transfers,1972 dollars' -3.7 -2.6 -3.0 -0.9 -1.1 -6.8
5 Mfg. and trade sales, 1967 dol-lars' -1.1 -6.0 -9.4 -4.1 -4.4 -12.5
6 Retail sales. 1967 dollars d -4.5 -4.5 -2.8 -1.4 -10.07 Industrial production index' -10.1 -9.1 -13.5 -8.6 -6.8 -15.38 Total civilian employment -2.4 -3.3 -2.3 -0.6 --0.3 -2.39 Employees on nonagricultural
payrolls' -4.2 -3.3 -4.2 -1.8 -1.1 -2.910 Persons engilged in non-
agricultural ac tivities -3.3 -3.2 -1.9 -0.5 -0.4 -2.311 Employee hours in non-
agricultural establishments -5.8 -4.9 -SA -1.8 -2.2 -,4.0
12 Total unemployed +106.9 .... 132.4 +94.6 +41.6 +87.9 +88.8
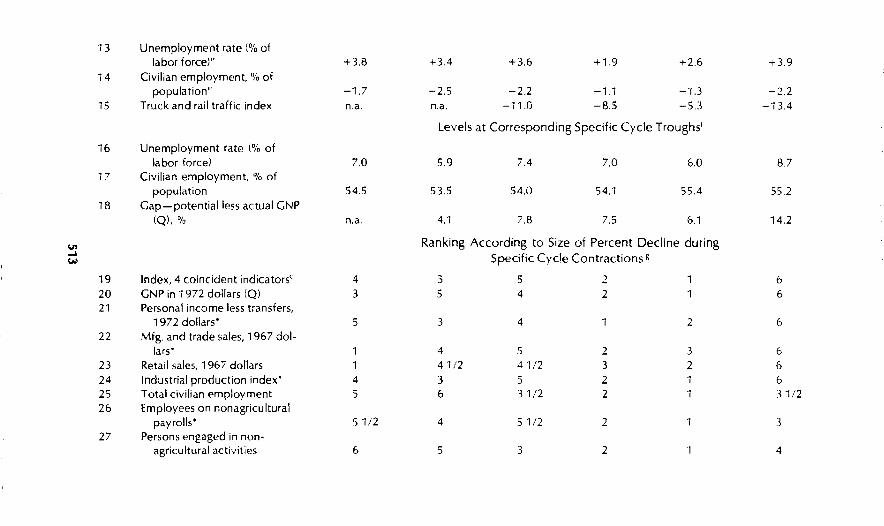
13 Unemployment rate (% oflabor force)" +3.8 +3.4 +3.6 +1.9 +2.6 +3.9
14 Civilian employment. % ofpopulation C -1.7 -2.5 --2.2 -1.1 -'1.3 -2.2
15 Truck and rail traHic index n.a. n.a. -11.0 -8.5 -5.3 -13.4
Levels at Corresponding Specific Cycle Troughs!
16 Unemployment rate (% oflabor force) 7.0 5.9 7.4 7.0 6.0 8.7
17 Civilian employment, % ofpopulation 54.5 53.5 54.0 54.1 55.4 55.2
18 Gap-potential less actual GNP(Q), % n.a. 4.1 7.8 7.5 6.1 14.2
{,n Ranking According to Size of Percent Decline during....Specific Cycle Contractions g~
19 Index. 4 coincident indicators< 4 3 5 2 1 620 GNP in 1972 dollars (Q) 3 5 4 2 1 621 Personal income less transfers,
1972 dollars' 5 3 4 1 2 622 Mfg, and trade sales, 1967 dol-
lars' 1 4 5 2 3 623 Retail sales. 1967 dollars 1 41/2 41/2 3 2 624 Industrial production index' 4 3 5 2 1 625 Total civilian employment 5 6 31/2 2 1 31/226 Employees on nonagricultural
payrolls' S 1J2 4 5112 2 1 327 Persons engaged in non-
agricultural acti .... ities 6 5 3 2 1 4
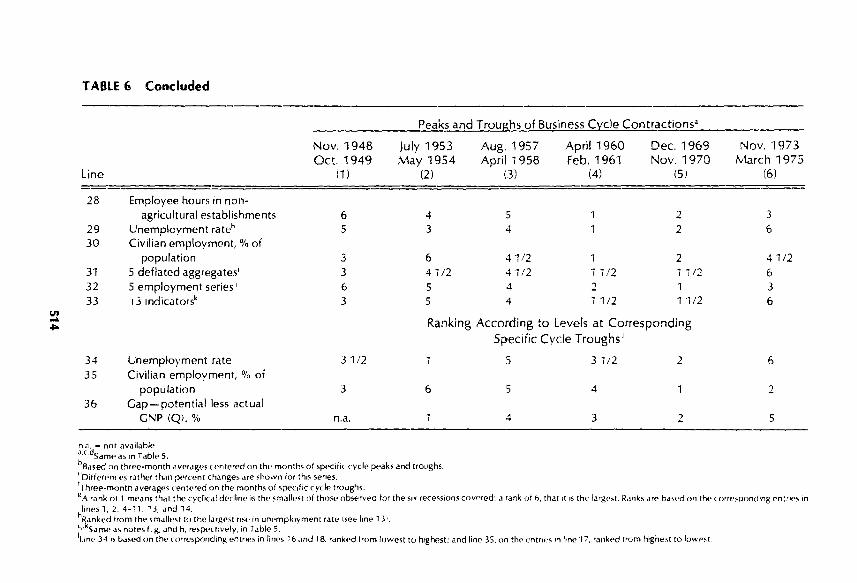
TABLE 6 Concluded
Peaks and Troughs of Business Cycle Contractions'
Nov. 1948 July 1953 Aug. 1957 April 1960 Dec. 1969 Nov. 1973Oct. 1949 May 1954 April 1958 Feb, 1961 Nov. 1970 March 1975
Line (1 ) (2) (3) (4) (5) (6)
28 Employee hours in non-agricultural establishments 6 4 5 1 2 3
29 Unemployment rateh 5 3 4 1 2 630 Civilian employment, % of
population 3 6 41/2 1 2 41/231 5 deflated aggregates' 3 41/2 41/2 1 1/2 1 1/2 632 5 employment series I 6 5 4 2 1 333 I j Indicatorsk 3 5 4 1 1/2 1 1/2 6
\J1i... Ranking According to Levels at Corresponding..Specific Cycle Troughs I
34 Unemployment rate 31/2 1 5 31/2 2 635 Civilian employment, % of
population 3 6 5 4 1 236 Cap·-potential less actual
GNP (Q), % n.a. 1 4 3 2 5
n.il. - not available,.cdSamp as In Table S.haased on three-month aver.1gt's centered on the monlhs of speclilC cycle peaks and trollghs."Differences rather than percent changes are shown iar this series.'Three-month averag'" centNed on the months of specific (yelp trough,.~A rank oi 1 means thdt the cyclical decline is the ~mJJlest of those observed for the si\' rece~sions covered; a rank ot b. that It IS the largest Ranks.up based on the (orre:-oponcPng pnlflP~ In
h~:~~:d ~;o~ ~~~:~~~~~t1[~. the large't rlSC' 10 unpmployment rate Ise(' Itne 13!.'·1, Same.1S notes f. g. and h. respectively, in Table 5.IL,n(' 3~ is bdSC'd on the corrt:spnnding entrif's in linC's "16 and 18. rank<,d from rawest to hlghpst; tlnd linC' 35, on thf' l'ntnr:s In Ime 17. ranked trom highe~t to IOWl.l~t
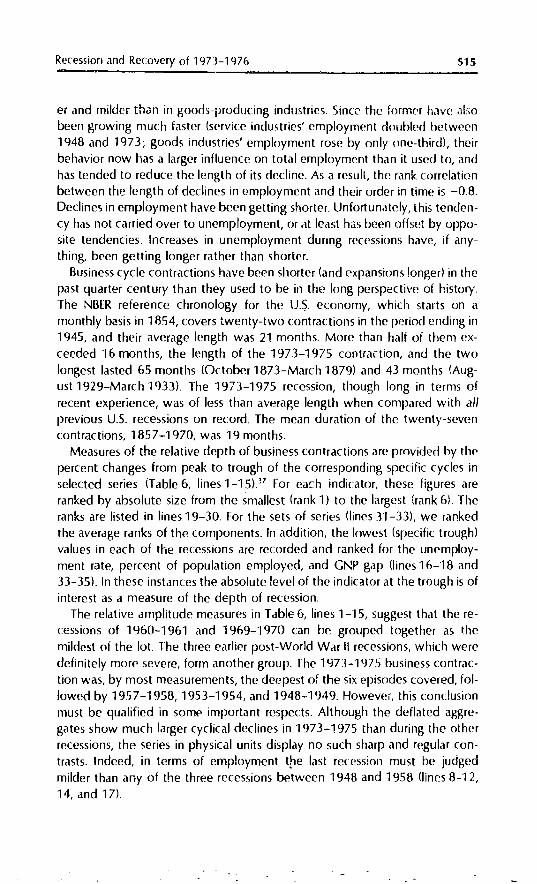
Recession ilnd Reco\j(~ry of 1973-1976 515
er and milder thon in goods-producing industries" Since the former have ,1lsobeen growing much faster (service industries' employment rlolJhled hetween1948 and 1973; goods industries' employment rose hy only one-third), theirbehavior now has a larger influence on total employment than it used to, andhas tended to reduce the length of its decline. As a result, the rank correlationbetween the length of declines in l'mployment and their order in time is -0.8.Declines in employment have been getting shorter. Unfortunately, this tendency has not carried over to unemployment, or at least has heen offset by opposite tendencies. Increases in unemployment dunng recessions have, if anything, been getting longer rather than shorter.
Business cycle contractions have been shorter (and expansions longed in thepast quarter century than they used to be in the long perspective of history.The NBER reference chronology for the u.s. economy, which starts on amonthly basis in 1854, covers twenty-two contractions in the period ending in1945, and their average length was 21 months. More than half of them exceeded '16 months, the length of the 1973-1975 contraction, and the twolongest lasted 65 months (October 1873-March 1879) and 43 months (August 1929-March 1933). The 1973-1975 recession, though long in terms ofrecent experience, was of less than average length when compared with allprevious U.S. recessions on record, The mean duration of the twenty-sevencontractions, 1857-1970, was 19 months.
Measures of the relative depth of business contractions are provided by thepercent changes from peak to trough of the corresponding specific cycles inselected series (Table 6, lines 1_15).J7 For each indicator, these figures areranked by absolute size from the smallest (rank 1) to the largest (rank 6). Theranks are listed in lines 19-30. For the sets of series (lines 31-33), we ran.kedthe average ranks of the components. In addition, the lowest (specific trough)values in each of the recessions are recorded and ranked for the unemployment rate, percent of population employed, and GNP gap (lines 16-"18 and33-35). In these instances the absolute level of the indicator at the trough is ofinterest as a measure of the depth of recession.
The relative amplitude measures in Table 6, lines 1-15, suggest that the recessions of 1960-1961 and 1969-1970 can be grouped together as themildest of the lot. The three earlier post-World War II recessions, which weredefinitely more severe, form another group. The 1973-1975 business contraction was, by most measurements, the deepest of the six episodes covered, followed by 1957-1958, 1953-1954, and 1948··1949. However, this conclusionmust be qualified in some important respects. Although the deflated aggregates show much larger cyclical declines in 1973-1975 than during the otherrecessions, the series in physical units display no such sharp and regular contrasts. Indeed, in terms of employment t~le last recession must be judgedmilder than any of the three recessions between 1948 and 1958 (lines 8-12,14, and 17).
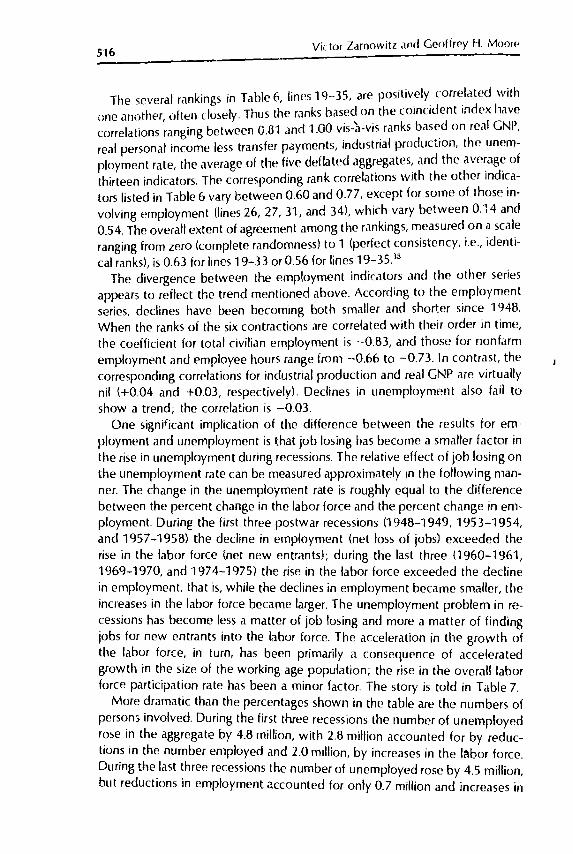
516Vic tor Zarnowitz .Ind Geoffrey H. Moore
The several rankings in Table 6, lines 19-35, are positively correlated withone another, often do~ely. Thus the ranks based on the coincident index havecorrelations ranging between 0.31 and 1.00 vis-a-vis ranks bas~d on real GNP,real personal income less transfer payments, industrial production, the unemployment rate, the average of the five deflated aggregates: and the ave~ag~ ofthirteen indicators. The corresponding rank correlations with the other Indicators listed in Table 6 vary between 0.60 and 0.77, except for some of those involving employment (lines 26,27,31, and 34), which vary between 0.14 and0.54. The overall extent of agreement among the rankings, measured on a scaleranging from zero (complete randomness) to 1 (perfect consistency, i.e., identical ranks), is 0.63 for lines 19-33 or 0.56 for lines 19-35.38
The divergence between the employment indicators and the other seriesappears to reflect the trend mentioned above. According to the employmentseries, declines have been becoming both smaller and shorter since 1948.When the ranks of the six contractions are correlated with their order in time,the coefficient for total civilian employment is -0.83, and those for nonfarmemployment and employee hours range from -0.66 to -0.73. In contrast, thecorresponding correlations for industrial production and real GNP are virtuallynil (+0.04 and +0.03, respectively). Declines in unemployment also fail toshow a trend; the correlation is -0.03.
One significant implication of the difference between the results for em··ployment and unemployment is that job losing has become a smaller factor inthe rise in unemployment during recessions. The relative effect of job losing onthe unemployment rate can be measured approximately in the following manner. The change in the unemployment rate is roughly equal to the differencebetween the percent change in the labor force and the percent change in employment. During the first three postwar recessions (1948-1949, 1953-1954,and 1957-1958) the decline in employment (net loss of jobs) exceeded therise in the labor force (net new entrants); during the last three (1960-1961,1969-1970, and 1974-1975) the rise in the labor force exceeded the declinein employment, that is, while the declines in employment became smaller, theincreases in the labor force became larger. The unemployment problem in recessions has become less a matter of job losing and more a matter of findingjobs for new entrants into the labor force. The acceleration in the growth ofthe labor force, in turn, has been primarily a consequence of acceleratedgrowth in the size of the working age population; the rise in the overall laborforce participation rate has been a minor factor. The story is told in Table 7.
More dramatic than the percentages shown in the table are the numbers ofpersons involved. During the first three recessions the number of unemployedrose in the aggregate by 4.8 million, with 2.8 million accounted for by reductions in the number employed and 2.0 million, by increases in the I~bor force.During the last three recessions the number of unemployed rose by 4.5 million,but reductions in employment accounted for only 0.7 million and increases in
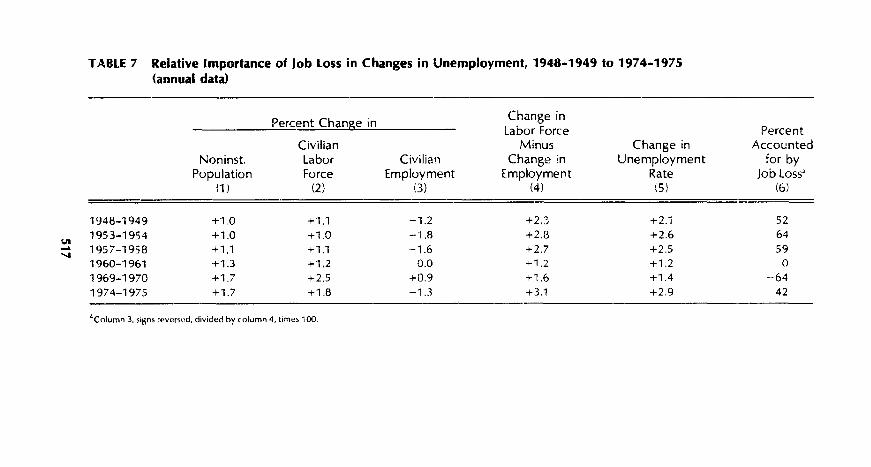
TABLE 7 Relative Importance of Job Loss in Changes in Unemployment, 1948-1949 to 1974-1975(annual data)
Percent Change in Change inLabor Force Percent
Civilian Minus Change in AccountedNoninst. Labor Civilian Change in Unemployment for by
Population Force Employment Employment Rate Job Loss·l1 ) (2) (3) (4) (5) (6)
1948-1949 +1.0 +1.1 -1.2 +2.3 +2.1 521953-1954 +1.0 +1.0 -1.8 +2.8 +2.6 64
l"n.. 1957-1958 +1.1 +1.1 -1.6 +2.7 +2.5 59....1960-1961 +1.3 +1.2 0.0 +1.2 +1.2 0
1969-1970 +1.7 +2.5 +0.9 +1.6 +1.4 --64
1974-1975 +1.7 +1.8 -1.3 +3.1 +2.9 42
"Column 3. signs reversed, divided by column 4, times 100.
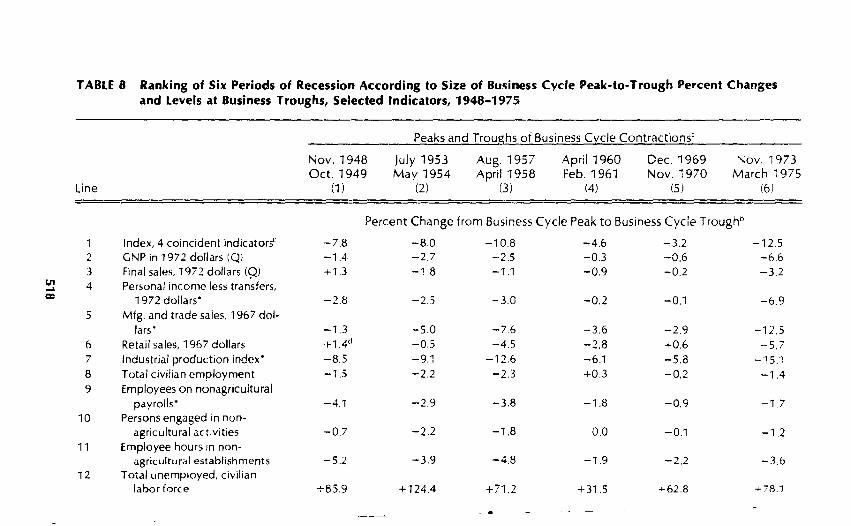
TABLE 8 Ranking of Six Periods of Recession According to Size of Business Cycle Peak-to-Trough Percent Changesand Levels at Business Troughs, Selected Indicators, 1948-1975
Peaks and Troughs of Business Cycle Contractions'
Nov. 1948 July 1953 Aug. 1957 April 1960 Dec. 1969 Nov. 1973Oct. 1949 May 1954 April 1958 Feb. 1961 Nov. 1970 March 1975
Line (1 ) (2) (3) (4) (5) (6)
Percent Change from Business Cycle Peak to Business Cycle Troughb
1 Index, 4 coincident indicators' -7.8 -8.0 -10.8 -4.6 -3.2 -12.52 GNP in 1972 dollars (Q) -1.4 -2.7 -2.5 -0.3 -0.6 -6.63 Final sales, 1972 dollars (9) +1.3 -1.8 -1.1 +0.9 -0.2 -3.2
VI 4 Personal income less transfers,-'co 1972 dollars' -2.8 -2.5 -3.0 -0.2 -0.1 -6.95 Mfg. and trade saies, 1967 dol-
lars' -1.3 -5.0 -7,6 -3.6 -2.9 -12.56 Retail sales, 1967 dollars +-l.4d -0.5 -4.5 -2.8 +0.6 --5,77 Industrial production index' -8.5 -9.1 -12.6 -6.1 -5.8 -15.:8 Total civilian employment -1.5 -2.2 -2.3 +0.3 -0.2 -1.49 Employees on nonagricultural
payrolls' -4.1 -2.9 -3.8 -1.8 -0.9 -1,710 Persons engaged in non-
agricultural activities -0.7 -2.2 -1.8 0.0 -0.1 -1,211 Employee hours in non-
agricultural establishments -5,2 -3,9 -4,8 -1,9 -2,2 -3,612 Total unemployed, civilian
labor force +85,9 + 124.4 +71,2 +31,5 "'62,8 ... 78:1
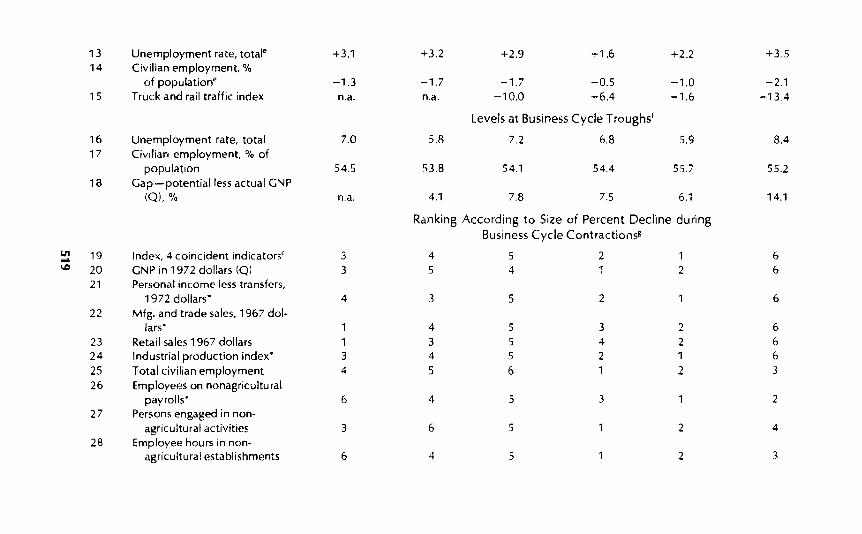
13 Unemployment rate, tota/" +3.1 +3.2 +2.9 +1.6 +2.2 +3.514 Civilian employment, %
of population· -1.3 -1.7 -1.7 -0.5 -1.0 -2.115 Truck and rail traffic index n.a. n.a. -10.0 -6.4 -1.6 -13.4
Leveis at Business Cycle Troughsf
16 Unemployment rate, total 7.0 5.8 7.2 6.8 5.9 8.417 Civilian employment, % of
population 54.5 53.8 54.1 54.4 55.7 55.218 Gap-potential less actual GNP
(Q),% n.a. 4.1 7.8 7.5 6.1 14.1
Ranking According to Size of Percent Decline duringBusiness Cycle Contractionss
{,/l 19 Index, 4 coincident indicatorsc 3 4 5 2 1 6...1.0 20 GNP in 1972 dollars (Q) 3 5 4 1 2 6
21 Personal income less transfers,1972 dollars' 4 3 5 2 1 6
22 Mfg. and trade sales, 1967 dol-lars· 1 4 5 3 2 6
23 Retail sales 1967 dollars 1 3 5 4 2 624 Industrial production index· 3 4 5 2 1 625 Total civilian employment 4 5 6 1 2 326 Employees on nonagricultural
payrolls· 6 4 5 3 1 227 Persons engaged in non-
agricultural activities 3 6 5 1 2 428 Employee hours in non-
agricultural establishments 6 4 5 1 2 3
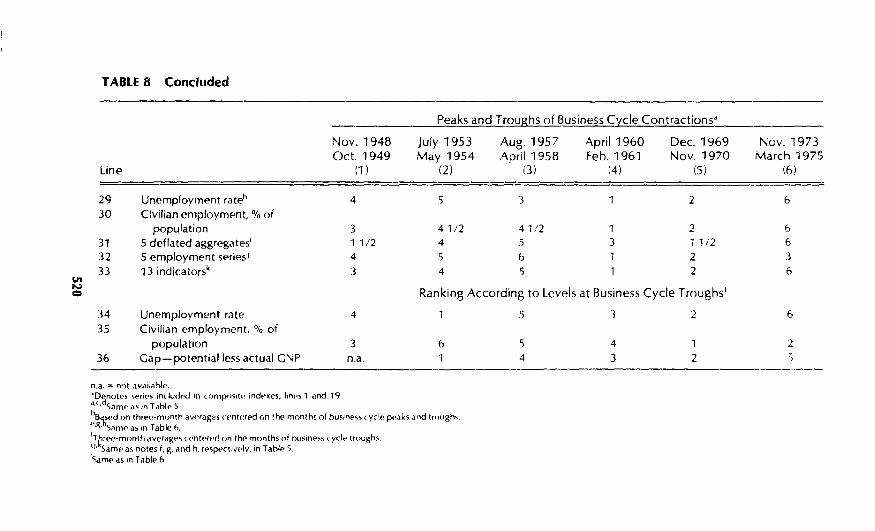
TABLE 8 Concluded
Peaks and Troughs of Business Cycle Contractions~
Nov. 1948 July 1953 Aug. 1957 April 1960 Dec. 1969 Nov. 1973Oct. 1949 May 1954 April 1958 Feb. 1961 Nov. 1970 March 1975
Line (1) (2) (3) (4) (5) (6)
29 Unemployment rateh 4 5 3 1 2 630 Civilian employment. % of
population 3 41/2 41/2 1 2 631 5 deflated aggregates' 1 1/2 4 5 3 1 1/2 632 Semployment series J 4 5 6 1 2 :333 13 indicatorsk 3 4 5 1 2 6
lJ1f',j
Ranking According to Levels at Business Cycle Troughs '=34 Unemployment rate 4 1 5 3 2 63S Civilian employment. % of
population 3 6 5 4 1 236 Gap-potential less actual GNP n.a. 1 4 3 2 S
n.a. : not ,wall,lOI".-Denote!o ~f:>rie~ inclurh·d in composite ind~·xes. Iint·~ 1 i:lnd 19.1I.c,dS.1m(· il~ in T~bl(' 5.
hB~('d on three-month ave'rages n'nterf'd on the monlh~ of busmp~ ... '- yrle peaks .lnd troug.h~.".g. Sam" a, In Table 6.fTrree-month (1v('ragp~«('ntprpd on. thea months of bLJsine~s cycle ttoughs,'-/. Sam" as notes f, g. ,lnd h. respectlvf>ly. In Table S.150me as ,n Tabl(' 6.
Recession and Recovery of 1973-1976 521
the labor force, for 3.8 million.The measures in Table 6 reflect the relative amplitudes of specific cycle
movements associated with business recessions. The results give full recognition to the timing differences among the indicators and measure the full cyclical swing in each indicator. In Tabie 8 we compare the size of movements thatoccurred strictly during the period of each recession, that is, the relativechanges between the business cycle, rather than the corresponding specificcycle, turning points. The percent change figures in Table 8 equal their counterparts in Table 6 whenever the specific cycle turns in the given series coincide with the business cycle turns, but this happens only about 15 percent ofthe time. Otherwise, the amplitude measures in Table 8 are smaller in absoluteterms than the corresponding entries in Table 6, but the differences are oftenminor.
The correlations among the rankings in Table 8, lines 19-35, are positive andin many cases quite high. Specifically, choosing once again the coincident index as the reference series, we find that its ranks are exactly the same as thoseof the industrial production index and closely correlated (r, ~ 0.9) with theranks of real GNP, real personal income, the percent of population employed,and the groups of five deilated aggregates and thirteen indicators. The corresponding correlations with the real sales aggregates, total nonfarm employment, and the unemployment rate vary between 0.71 and 0.83; those with theother employment and unemployment series, between 0.26 and 0.66. Thecoefficients of concordance (W) are 0.63 (lines 19-33) and 0.57(lines 19-35) .39
Since the amplitude measures in Table 8 use common fixed referenceperiods for the business recessions being compared, they are presumably lessaffected by the dispersion of cyclical timing of the different series than are theamplitude measures in Table 6 which relate to complete specific cycle contractions that vary in duration for each recession they match. As seen in Table 5,the rankings of the duration figures show some iarge disparities. Consequently,one might expect a closer agreement among the reference cycle than amongthe specific cycle measures of the relative depth of business recessions. In fact,the rank correlations based on changes between business cycle turns (Table 8)are mostly higher than those based on changes between specific cycle turns(Table 6), but on balance the difference between the two sets is small.
Averages of the ranks in both tables indicate that the six business recessionscan be arrayed in the following order from mildest to most severe: 1969-1970,1960-1961,1948-·1949,1953-1954,1957-1958, and 1973-1975. However,some of the distinctions involved are marginal and based on partly conflictingevidence; e.g., while the 1960-1961 and 1969-1970 recessions were definitely milder than the rest, it is difficult to establish firmly their relative position vis'a-vis one another. Also, it should be noted that our amplitude measures are notadjusted for any special events that occurred in the vicinity of business cycle
522VirlOf larnowill and C('o!frpy Ii. Moof!'
turning points (except inasmlH h as our lise of the three-month. aVf'rag:'\ atp(,i1b ,Ifld troughs reduces the influenn' of such events). It IS diffICult to ld(~n
tify such fartors and eliminate their effefts, and attempts to do so may wPlIresult in a nd imn'ase rather than reduction of measureml'nt error. 1hIS applies, in particular, to tlw two events that iue known to have coinci(~ed withreference turns: the major strikes of Octoher 1949 and November 1970. Asimple adjustment-excluding the strike months from the data-has seriousdisadvantages and, in any event, would not significantly alter our conelu
5ions.40
The larger a cyclical movement (expansion or contraltion), the more widespread it usually is, and vice versa. Thus a diffusion index, which showsmonthly the percent of components of an economic aggregate that are expanding, is as a rule positively correlated with the rate of chang(~ in the sameaggregate. But the correlation can hreak down when, for example, there aresharp out localized changes in the activity, or when the changes are small outwidespread. Mon'over, a diffusion index can be computed for groups of seriesfor which no aggregate exists. Hence, Ine size and scope of economif changeare two distinct aspects worth studying both separately and jointly.
In the present context, diffusion inc/exes based on series with roughly foincident timing are of particular intcrest. The indexes for nonagricultural employ·ment 00 and 172 industries) and industrial production (24 industries) recordthe percent of industries experiencing declining employment and output during each business mntraction.41 The larger these proportions are, and thelonger they persist, the greater the diffusion or scope of the contraction. Ineach of the six recessions of the post-World War II period, the percent of industries with falling employment (measured over six-month spans) rcached75 percent or more and stayed at these high levels for a number of months; atno other times during the period did this happen. Much the same statementcan be made about the diffusion index for industrial production. Thus a goodmea"-.ure of the scope of a business contraction is the average percent declin~':lg (d) over the interval during which that percent exceeded 75. In addition tod, we also examine the maximum perccnt of industries declining during anymonth related to a given recession (max d).
Table 9 shows that employment and production declines were least wide,·spread in the recession of 1969-1970; that tl1(' recessions of ., 960-1961 and1953-1954 were about the same in scope; and that the recessions of1973-1975,1957-1958, and 1948-'1949 wcre the most widely diffused. Veryfew industries were left unscathed by these recessions.
Patterns of Recession and Recovery
The course, speed, scope, and duration of contractions and expansions varyfrom one business cycle to another according to any acceptable measure of
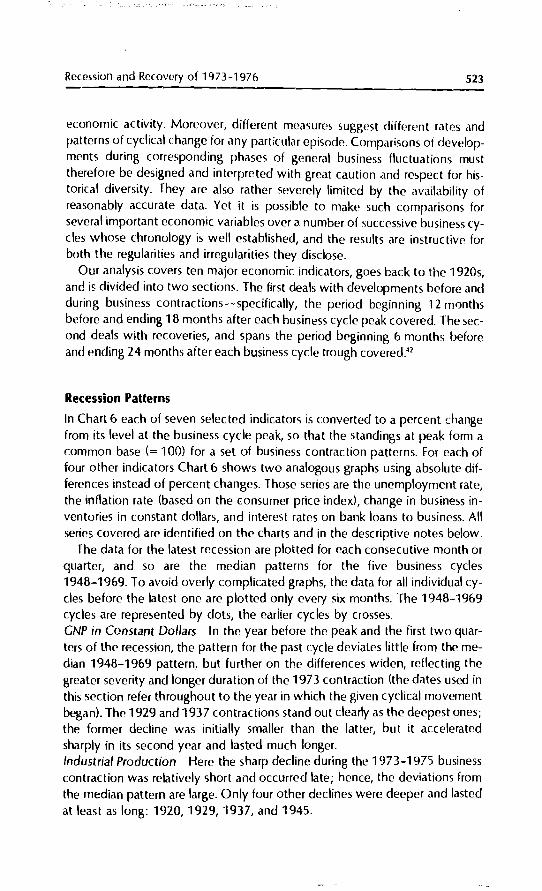
Recession and Recovery of 1973-1976 523
economic activity. Moreover, different measures suggest different rates andpatterns of cyclical change for any particular episode. Comparisons of developments during corresponding phases of general business fluctuations musttherefore be designed and interpreted with great caution and respect for historical diversity. They are also rather severely limited by the availability ofreasonably accurate data. Yet it is possible to make such comparisons forseveral important economic variables over a number of successive business cycles whose chronology is well established, and the results are instructive forboth the regularities and irregularities they disclose.
Our analysis covers ten major economic indicators, goes back to the 1920s,and is divided into two sections. The first deals with developments before andduring business contractions-specifically, the period beginning 12 monthsbefore and ending 18 months after each business cycle peak covered. The second deals with recoveries, and spans the period beginning 6 months beforeand ending 24 months after each business cycle trough covered.41
Recession Patterns
In Chart 6 each of seven selec ted indicators is converted to a percent changefrom its level at the business cycle peak, so that the standingsat peak form acommon base (= 100) for a set of business contraction patterns. For each offour other indicators Chart 6 shows two analogous graphs using absolute differences instead of percent changes. Those series are the unemployment rate,the inflation rate (based on the consumer price index), change in business inventories in constant dollars, and interest rates on bank loans to business. Allseries covered are identified on the charts and in the descriptive notes below.
The data for the latest recession are plotted for each consecutive month orquarter, and so are the median patterns for the five business cycles1948-1969. To avoid overly complicated graphs, the data for all individual cycles before the latest one are plotted only every six months. The 1948-1969cycles are represented by dots, the earlier cycles by crosses.GNP in Constant Dollars In the year before the peak and the first two quarters of the recession, the pattern for the past cycle deviates little from the median 1948-1969 pattern, but further on the differences widen, reflecting thegreater severity and longer duration of the 1973 contraction (the dates used inthis section refer throughout to the year in which the given cyclical movementbegan). The 1929 and 1937 contractions stand out clearly as the deepest ones;the former decline was initially smaller than the latter, but it acceleratedsharply in its second year and lasted much longer.Industrial Production Here the sharp decline during the 1973-1975 businesscontraction was relatively short and occurred late; hence, the deviations fromthe median pattern are large. Only four other declines were deeper and lastedat least as long: 1920,1929, "1937, and 1945.
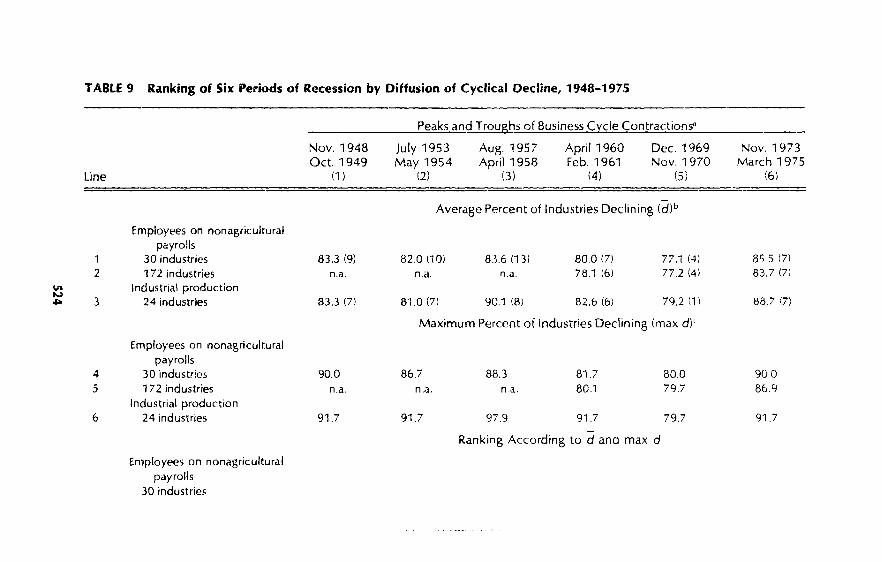
TABLE 9 Ranking of Six Periods of Recession by Diffusion of Cyclical Decline, 1948-1975
Peaks and Troughs of Business Cycle Contractions"
line
Nov. 1948Oct. 1949
(1)
July 1953May 1954
(2)
Aug. 1957April 1958
(3)
April 1960Feb. 1961
(4)
Dec. 1969Nov. 1970
(5)
Nov. 1973March 1975
(6)
Average Percent of Industries Declining (d)b
U1t.)
01:0
12
3
Employees on nonagriculturalpayrolls
30 industries172 industries
Industrial production24 industries
83.3 (9)n.a.
83.3 (7)
82.0 (10)n.C!.
81.0 (7)
83.6 (13)n.a.
90.1 (8)
800 (7)
78.1 (6)
82.6 (6)
77.1 (4)77.2 (4)
79.2 (1)
85.5 (7)
83.7 (7)
88.7 (7)
Employees on nonagriculturalpayrolls
4 30 industries5 172 industries
Industrial production6 24 industries
Employees on nonagriculturalpayrolls
30 industries
Maximum Percent of Industries Declining (max d)'
90.0 86.7 88.3 81.7 80.0 900n.a. n.a. na. 80.1 79.7 869
91.7 91.7 97.9 91.7 79.7 91.7
Ranking According to d and max d
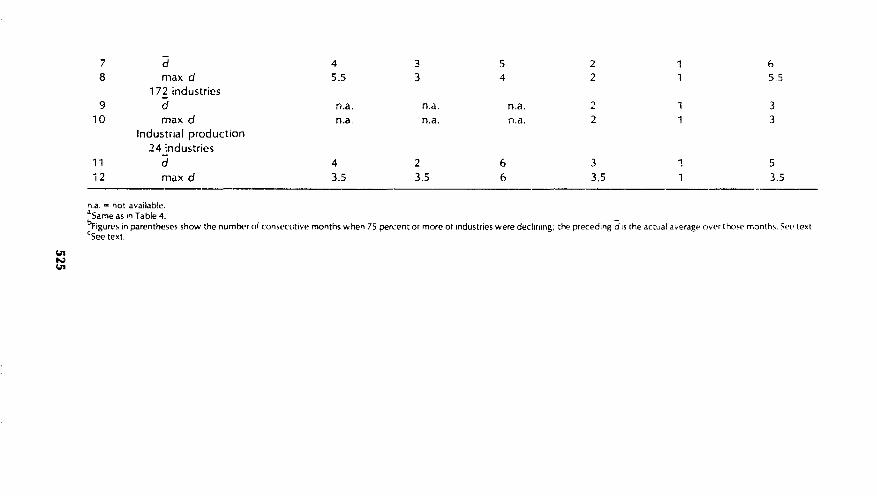
IJ1NIJ1
7 d 4 3 5 2 1 68 max d 5.5 3 4 2 1 5,5
172 industries9 d n.a. n.a. n.a. 2 1 3
10 max d n.a, n.a. n.a. 2 1 3Industrial production
24 industries11 d 4 2 6 3 '1 512 max d 3.5 3.5 6 3.5 1 3.5
n,a, - not available,'Same as on Table 4.bFigures in parentheses show the number of consecutive months when 75 percent or more ot mdustries were declirllng; the preceding d IS the actual average ovpr thosp months, S(,l~ text.<See text.
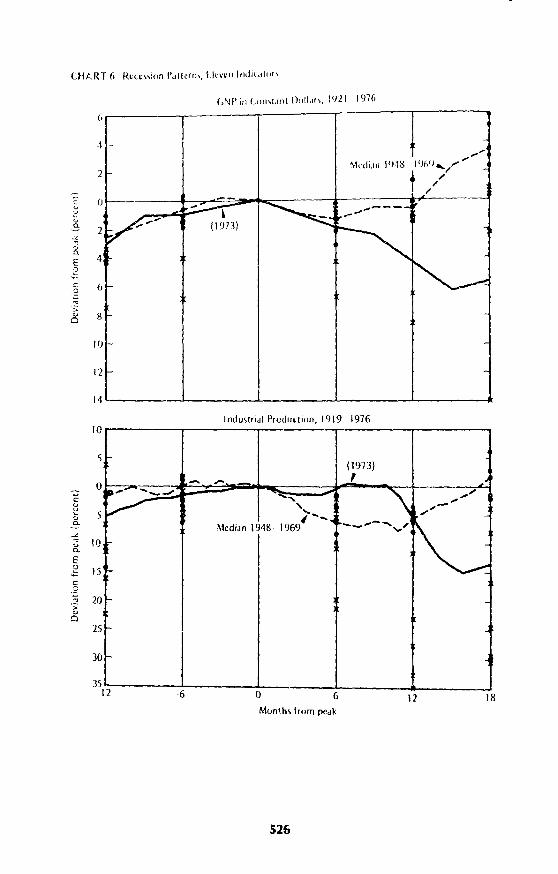
eNP in C"",LIII[ f)"II"". 1'.121 1976(I r--------.----------------,,--------...--------
·1 -
2
"()
'J ~<- ......~ 2
..- (1973)~,;0.
E 4
~c (,~
,::"-'" 1>Cl
If)
!2
14
18126o
InduWiJI ProdulCl;on 1919 19760
<;(1973)
- .... J.. .,..,. ............... -' """, "..... '"
~, -'",'- ",'
Mcdian 1948 1969 . ..,j ---""-""",,'
~I'-
f-. ..
12 6
o
35
30
25
~
~ 10a.E.E 15
.2
.:: 20>
"Cl
MUnl.h; frorn pCdk
526
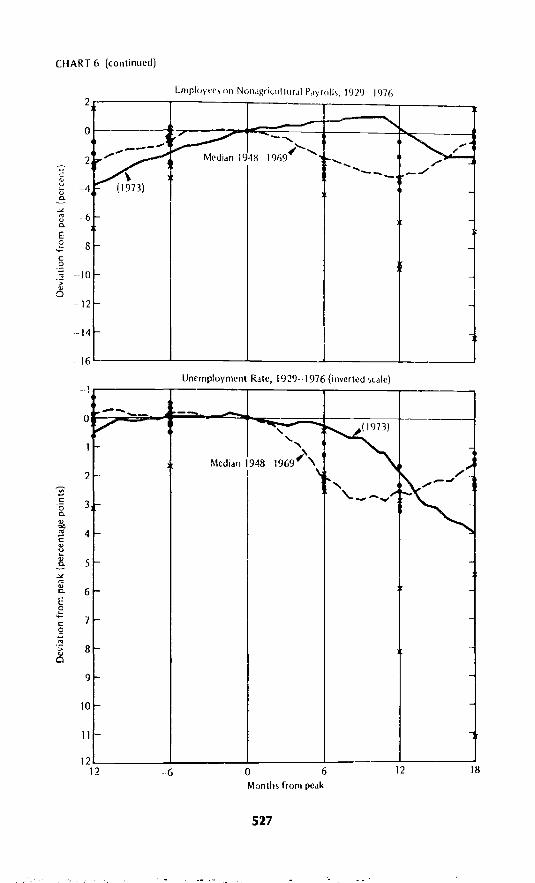
CHART 6 (continued)
2
o
.J.
;; -6c.EE .8c:.g.~ --10;>vo
12
14
16
Employeelon Non.lgricllllur.t1I'dyrolh, 1929 1976
.......
_---1~-, " ~
,.:-...~ Median 1948 1969,( ...... -.... ,.....~
'~--_../
~ (1~73) t -
f- -
l-
f-
I-
Unempluyment Rate, 1929-1976 (inverted scale)
1812o 6Months from peak
-6
7
5
2
1
lo--- - -....-V ....,
KI- " ~
Median 1948 1969,( '\,
Kf- I
1'-,'\.._ ..... ..,~
....
l-
I-
l-
I-
I-
9f-
I-
11-
2
3
8
4
6
to
1-12
o
527
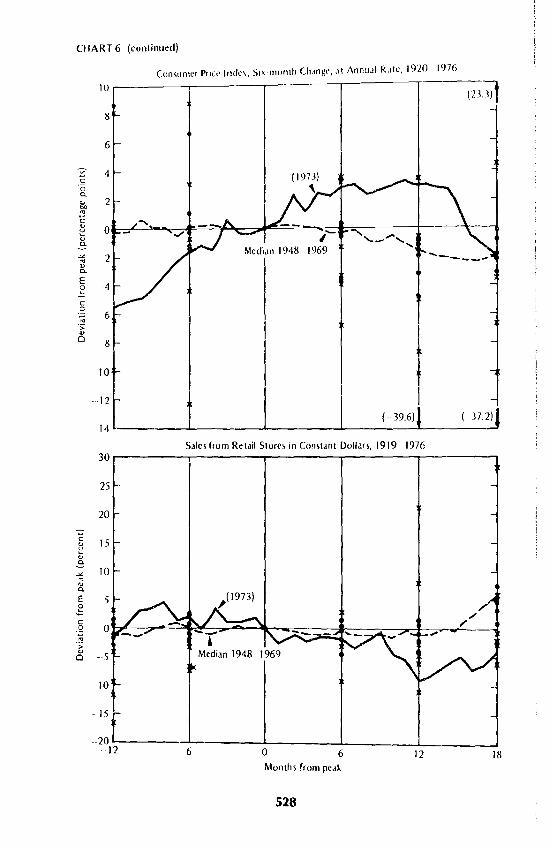
CHART 6 (conlillued)
COIlStlJl1N PriCl' Inde\, Six-lIlllll1h Ch,lIlgl', ,It I\nnu,11 R,lte, 1920 1976
18
( 37.2)
12
!I
-39.6)
o 6Months (rom pedk
r1"'
Medidll 1948 1969
Sales from Retail Slore\ in Constant Dollars, 1919 --1976
10
11
6
4
2
......0
2
4
6
8
10
12
14
30
25
20
15
10
- 5
10
15
-2012 6
528
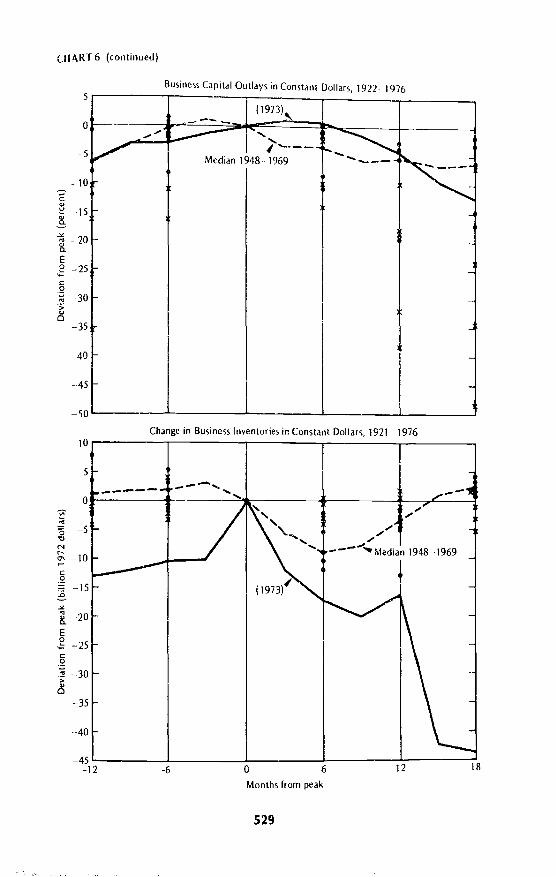
CHART 6 (conlinued)
..... ....., ......_-Mcdian 1948- 1969
oJ--------::I~.;-;'
-10
-5
~
c
~ -15~
Businc',s Capital OUllays in Constam Dollars, 1922- 19765r-----,-----r----~---___,r__--___.
~ -20 ~
E,g -25co:~-30;>
~-35
-40
-45L-50 ----''------.......----~------'-------'
Change in Busincss Inventories in Conslant Dollars, 1921-197610...-----r-----r-----r------r-----,
5
///
--_......... Median 1948-1969
+
'"~o -5"UN
:;, -10
-40
-45 L----L----L----~6-----:1~2:----""718-12-6 0
-35
co=- -15:::...><
[ -20E,g -25c.g.~ -30~
Months from peak
529
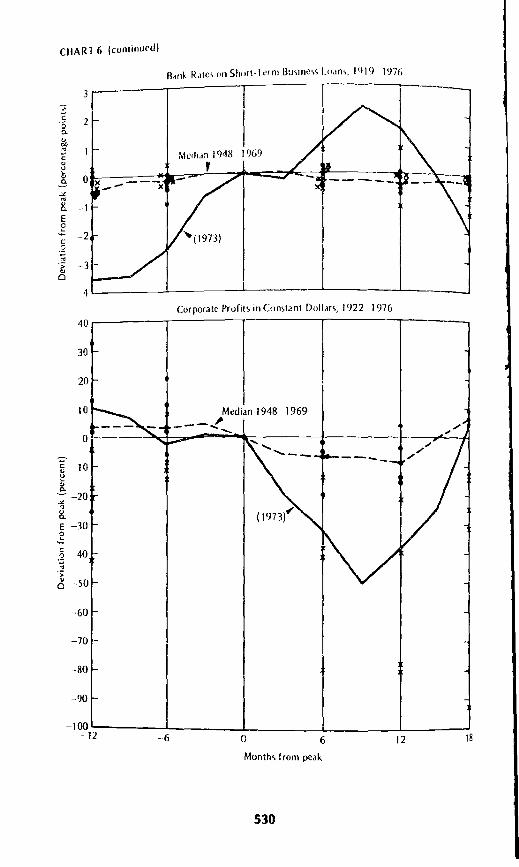
CIIART 6 (continued)
BAnk RJIC' on Short-Term B~l,jne" LO<lm, 1'119 1'176
1%9
2
-2co"~
'"'"~- 3 -o
4~ ...L- --'- .---.Jl...- ..L-__-J
Corporate Profih ill Con,tJnt Dollar\ 1922 197640r-----i---i----,--------,-----
30
20
~
c"'-'"0---; -20'"8-E -30,gt: 400.~
'"":;'" -50Cl
-60
-70 -
-80
--90
-100-12 -6 0 6 12 18
Month, from peak
530
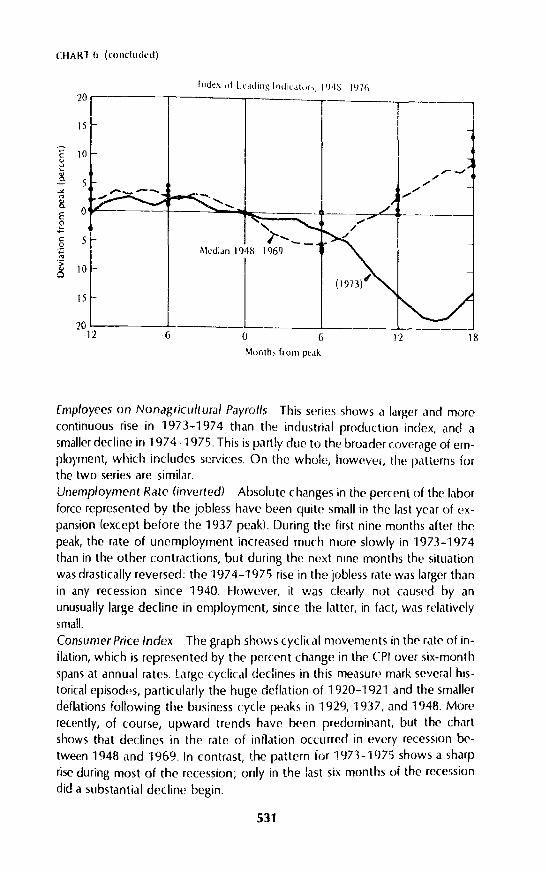
CHART 6 (olldulled)
1812
1 I
I /~~r--I-----=~~,::::.;;;:=-+--.//"" 1-r ....... __
MediJIl 194H 1969
~_L-L---L-.-o 6Munth, frum pe,IK
20
15
c 10OJu
i.>f...,8-
0Eg
5 Ic0.~
.;;10 -~
15
2012 6
Employees on Nonagricultural Payrolls This series shows a larger and morecontinuous rise in 1973-1974 than the industrial production index, and asmaller decline in 1974-1975. This is partly due to the broader coverage of em
ployment, which includes services. On the whole, however, the patterns forthe two series are similar.
Unemployment Rate (inverted) Absolute changes in the percent of the labor
force represented by the jobless have been quite small in the last year of ('x
pansion (except before the 1937 peakl. During the first nine months after thepeak, the rate of unemployment increased much more slowly in ·1973-1974than in the other contractions, but during the next nine months the situationwas drastically reversed: the 1974-1975 rise in the jobless rate was larger thanin any recession since 1940. However, it was clearly nut caused by an
unusually large decline in employment, since the latter, in fact, was relativelysmall.
Consumer Price Index The graph shows cyclical movements in the rate of in
flation, which is represented by the percent change in the CPI over six-month
spans at annual rates. Large cyclical declines in this measure mark several hIS
torical episodes, particularly the huge deflation of 1920-1921 and the smaller
deflations follOWing the business cycle peaks in 1929, 1937, and 1948. Morerecently, of course, upward trends have been predominant, but the chartshows that declines in the rate of inflation occurred in every recession be
tween 1948 and 1969. In contrast, the pattern for 1973-1975 shows a sharp
rise during most of the recession; only in the last six months of the recession
did a substantial decline begin.
531
532 Victor Zarnowitz ,md Cl'offrcy H. Moore
Sales of Retail Stores in Constant [)ol/,m Thi~ ~('rif's shows a long and sharpdecline in 1973-1974, beginning well abovp and ending well below the median 1948-1969 pattern. Indeed, the decline was larger than in 1929-19.31and was exceeded only by the 1937-1938 contraction. However, the databefore and after World War II are not strictly comparable.4l
Business Capital Outla)'s in Constant Dol/ars Real investment in plant andequipment declined late und at first slowly in 1974, holding up just about aswell as it did in the mild 1970 recession. it was only in the second half of the recession that real capital spending by business fell at an accelerated rate.Although the decline then was large, it was no larger than in some of the earlierpost-World War II contractions. Of course, nothing in the more recent U.S.economic history came even dose to the catastrophic slumps of investmentduring the two contractions of the 1930s, as the chart shows.Change in Business Inventories in Constant Dol/ar) Unlike fixed investment,business inventory investment in real terms had a sharp downward trendthroughout the 1973-1975 recession. Compared to the medi,1n pattern,1948-1969, and to all the other episodes shown, the 1973-1975 decline wasexceptionally largp. Since the patterns are expressed in billions of dollars inconstant prices, the growth of the economy needs to be taken into account inevaluating the differences between the earlier and later cycles.Bank Rates on Short- Term Business Loans The 1973-1975 pattern shows byfar the largest swing in interest rates on record, as indicated by the comparisonwith the median 1948-1969 pattern, which lies close to the base line, and bythe similar concentration of most entries for the individual cycles. However,the cyclical movements of bank rates were also large in 1969-1971. Clearly, interest rates have varied much more widely during the past decade than inearlier times.
The average of interest rates charged by banks on commercial loans is a lagging indicator, especially at troughs. In '1974 the lag at the business peak wasparticularly pronounced and very similar to the lag in the inflation rate. Indeed,a comparison of this graph with that for the rate of change in the CPI reveals astriking parallelism of the 1971 patterns as well as some more minor similaritiesfor the earlier cycles (including the 1948-1969 averages). This positive association has a familiar twofold theoretical explanation: (i) The observed (nominal)market interest rates tend to increase (decrease) in times when inflation (deflation) is anticipated. To the extent that lenders and borrowers agree on the expected rate of increase in prices, they are also apt to agree on the rorresponding inflation premium to be included in the interest rates. (ji) The expected rateof change in prices is positively related to the observed path of actual rates ofchange in the price level.
As noted before, however, price expectations adjusted to the large swing inthe inflation rates only with a lag and incompletely, that is, much oi the inflation was unanticipated. The amplitude of the interest rate pattern is consider-

Recession and Remvery of 1973-1976 533
ably smaller than that of the inflation pattern. Furthermore, bank interest rates(and rates of return in genera" have other determinants as well: they wouldvary even it no change in the inflation rate were expected. Thus interest ratesrose to high peak levels in the first three quarters of197 4 partly because business investment in current dollars continued strong and so, consequently, didthe overall demand for credit.Corporate Profits in Cons/ant Dollars In an attempt to measure cyclicalchanges in real profits, we use the latest data on corporate profits from production (i.e., with inventory valuation and capital consumption adjustments) deflated by the GNP implicit price index44 The decline in profits so measuredstarted early-a year before the reference peak date of 1973:4-but was initially slow and vacillating. In 1974, however, real profits slumped sharply, muchas they did in 1923-1924 and far worse than in the other contractions coveredexcept for the debacles of the 1930s.Index of Leading Indicators The decline in this series started five monthsbefore the November 1973 business cycle peak, a shorter iead than that indicated by the median 194B-1969 pattern. For about a year thereafter, themovement of the index was close to the median, but then the pattern for1974-1975 shows an accelerated decline which is in sharp contrast to the risein the median pattern. In terms of these comparisons, it is evident that the1973-1975 contraction in the leading indicators was both relatively long anddeep.
Recovery Patterns
Chart 7 is analogous in form ar.d content to Chart 6, but it is designed to showthe behavior of the same series immediately before and during the businessrecoveries. It should be noted that the data plotted for most series start from azero base line at the business cycle trough, and show changes from that troughlevel computed as a percent of the level at the preceding business cycle peak.The reason is that percents computed in the usual way, with the trough levelas the base, are apt to be very large if the trough is very low. For this arithmeticreason alone, deep recessions are apt to be followed by "rapid" recoveries.Moreover, since there is great variation in the depth of recessions but less variation in the height of booms, greater comparability among recoveries isachieved by using the peak level as the base for calculating percent changeduring recovery45 The same data can be used to show how far below or abovethe preceding peak level the indicator stands at any given point during therecovery by comparing the rise after the trough with the preceding declinefrom peak to trough. The charts as plotted, however, do not show this.
The follOWing observations Sl.'m up the main lessons from this graphical
analysis.GNP in Constant Dollars The path of this series in the current recovery re-
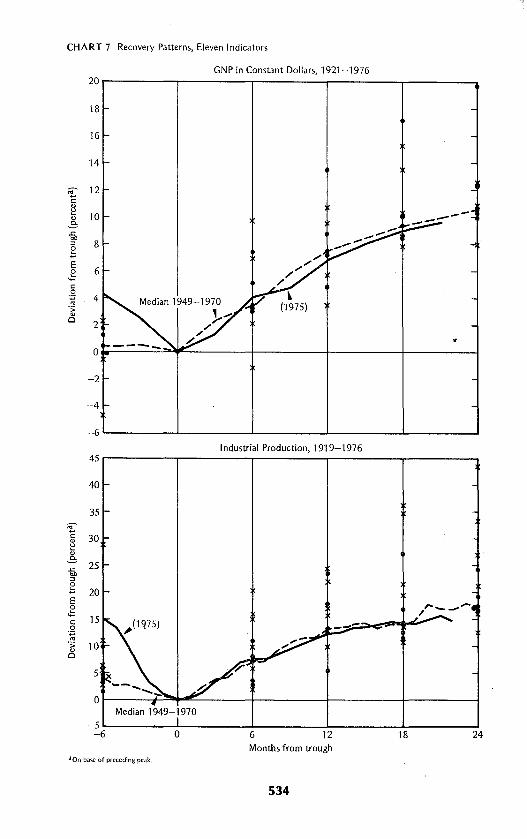
CHART 7 Recovery Patterns, Eleven Indicators
GN P in Constant Dollars, 1921-197620r------,-------,------r-----,-----.....
E.gco';:;
'".~Cl
18
16
14
12
10
8
6
4
2
O.....----=""-"E:----+----+-------I-----l
-2
-4
-6 '-- .1..- -1.- ...1- -1.... .....1
Industrial Production, 1919-197645 r-----,-------,------r-----...,...----.....,
40
35
5
01---+-""".-"'-------+-----+-----+-----1
20
25
15
30
10
Median 1949-1970-5'-- .1..- -1.- ...1- -1.... .....1
-6 0 6 12 18 24Months from trough
dOn base of preceding pc'lk.
534
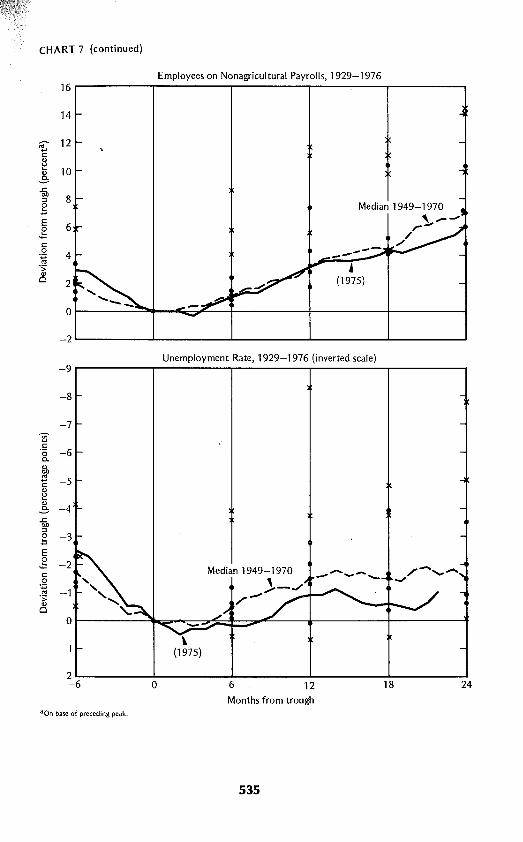
, ...._oJ
Median 1949-1970'- ..........r
/./
j(1975)
Median 1949-1970
)..- ....../-
Unemployment Rate, 1929-1976 (inverted scale)
Employees on Nonagricultural Payrolls, 1929-1976
CHART 7 (continued)
16
14
€" 12<:
'"~ 10'"3-6i,
8::l
gE 60
.)::<:0
4..,'".;;
'"Cl 2
0
-2
-9
-8
-7~<:'0 -60-
~
'" -5C'"~'" -43
..c:bll::l0 -3~
E0
-2.)::<:
~'" -1.;;
'"Cl0
~(1975)
~L.6------I.0-----6.L-----....J12L...-----""'18-------'24
Months from troughaOn base of preceding peak.
535
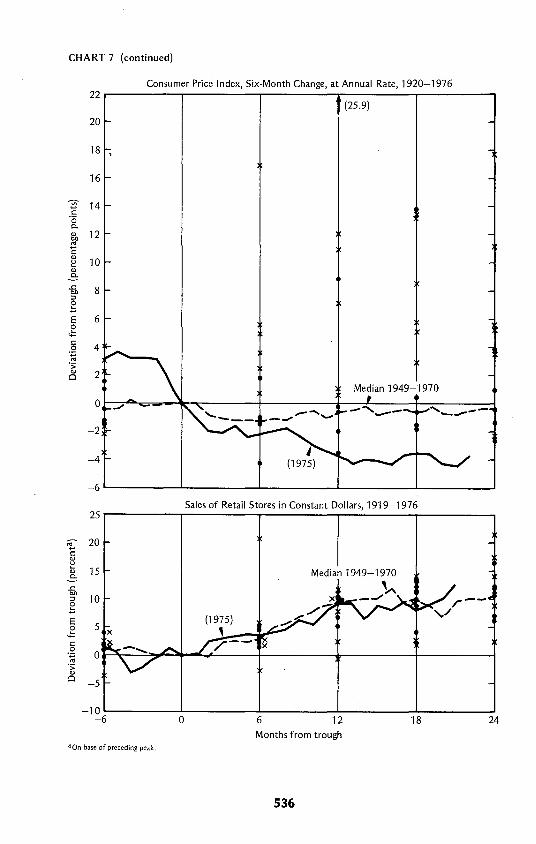
CHART 7 (continued)
Consumer Price Index, Six-Month Change, at Annual Rate, 1920-1976
Median 1949-1970
Months from trough
(25.9)
Sales of Retail Stores in Constant Dollars, 1919-1976
22
20
18
16
~ 14...c·0c.
'" 120.0
'"C'" 10~
'"~..c 80.0:J
gE 60.;:c
40.'"'".;;
'" 20
0
-2
-4
-6
25
€' 20c'"~
15'"c...c0.0
10:J
gE 50.;:c.g 0'".;;
'"0 -5
-10-6 0
aOn base of preceding peak.
536
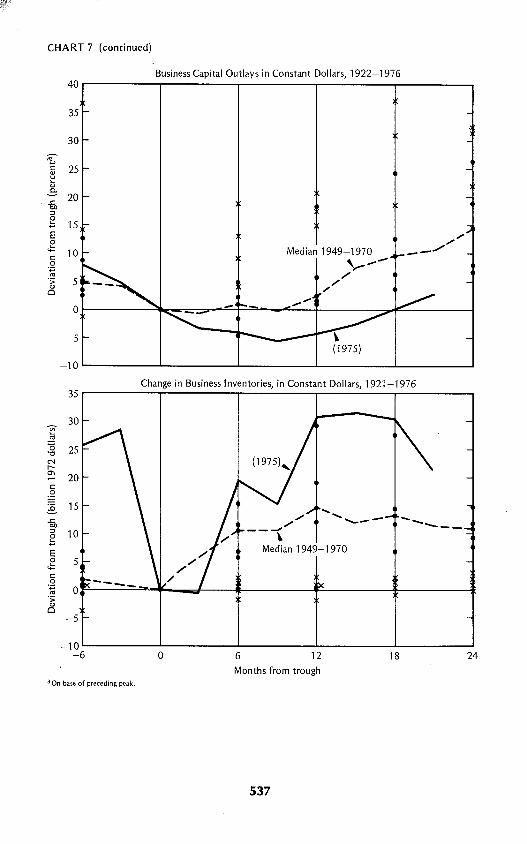
CHART 7 (continued)
Business Capital Outlays in Constant Dollars, 1922-197640 r-------,-------r--------,------r-----...,
35
30
Change in Business Inventories, in Constant Dollars, 1921-1976
24
---
18
.......................---
12
Median 1949-1970\,,--
/'
"'"/
6
Months from trough
o
€'c 25'"~'"..3: 20.cOIl::Jg 15E.g
10c0
";:;
'"";; 5'"Cl
0
-5
-10
35
30~
~
.!::!"0 25"0
'"r--0'\20
c"~
~ 15.cOIl::J 10gE0 5.;::c0
";:; 0'"";;'"Cl
-5
-10-6
aOn base of preceding peak.
537
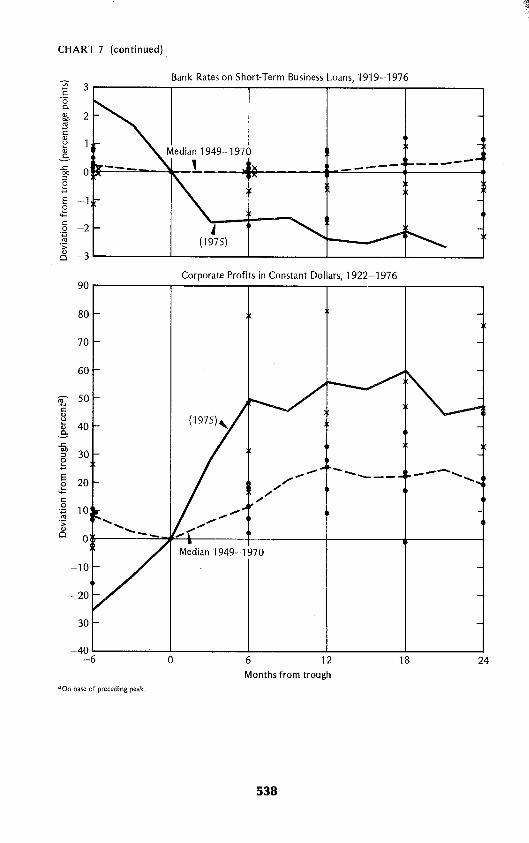
~(1975)
CHART 7 (continued),
Bank Rates on Short-Term Business Loans, 1919-1976~ 3 ,-----,..-------,------....--------r--------,'00.
:lh 2.C'lc"~"~g, 0~-=-=~---~:__-l.---4tfi_-----+-..."'--'=-=-=-=-----_1~-----..gE -1o~
§ -2';:;
'"';;o -3 ......------'---------'-------l----__-J. ---I
Corporate Profits in Constant Dollars, 1922-1976
Months from trough
90
80
70
60
€' 50c"ua; 40~.cOIl
30::l
gE 200~c0
10';:;
'"';;"Cl 0
-10
-20
-30
-40-6 0
aOn base of preceding peak.
6 12 18
..--- .......................
24
538
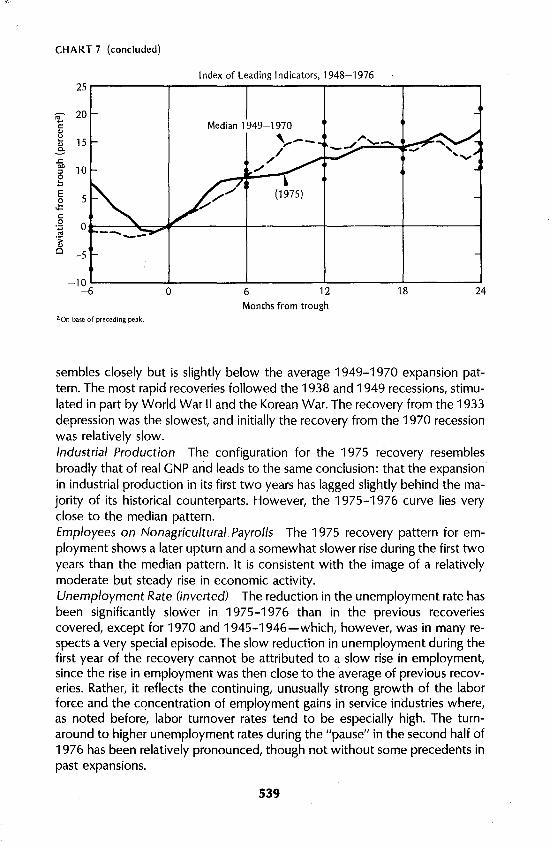
Index of Leading Indicators, 1948-1976
CHART 7 (concluded)
25
~20
c:<l>~ 15<l>
.Eo.c:00 10::>gE 50
.i:;c:.g 0'"';:<l>Cl -5
-10-6 0
aOn base of preceding peak.
Median 1949-1970
\..--,1'/
./
~(1975)
6 12
Months from trough
18 24
sembles closely but is slightly below the average 1949-1970 expansion pattern. The most rapid recoveries followed the 1938 and 1949 recessions, stimulated in part by World War II and the Korean War. The recovery from the 1933depression was the slowest, and initially the recovery from the 1970 recessionwas relatively slow.Industrial Production The configuration for the 1975 recovery resemblesbroadly that of real GNP arid leads to the same conclusion: that the expansionin industrial production in its first two years has lagged slightly behind the majority of its historical counterparts. However, the 1975-1976 curve lies veryclose to the median pattern.Employees on Nonagricultural Payrolls The 1975 recovery pattern for employment shows a later upturn and a somewhat slower rise during the first twoyears than the median pattern. It is consistent with the image of a relativelymoderate but steady rise in economic activity.Unemployment Rate (inverted) The reduction in the unemployment rate hasbeen significantly slower in 1975-1976 than in the previous recoveriescovered, except for 1970 and 1945-1946-which, however, was in many respects a very special episode. The slow reduction in unemployment during thefirst year of the recovery cannot be attributed to a slow rise in employment,since the rise in employment was then close to the average of previous recoveries. Rather, it reflects the continuing, unusually strong growth of the laborforce and the concentration of employment gains in service industries where,as noted before, labor turnover rates tend to be especially high. The turnaround to higher unemployment rates during the "pause" in the second half of1976 has been relatively pronounced, though not without some precedents inpast expansions.
539
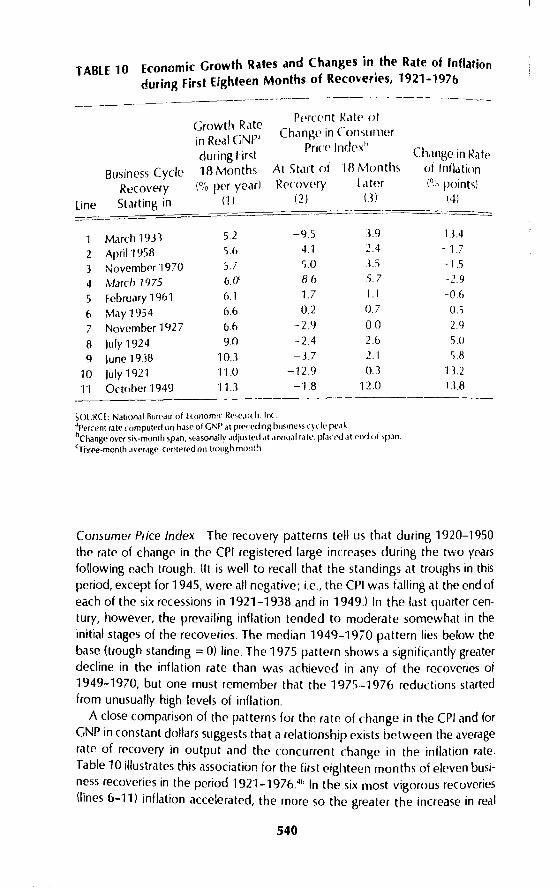
TABLE 10 Economic Growth Rates and Changes in, the Rate of Inflationduring First Eighteen Months of RecoverIes, 1921-1976
--------------~---~._--~-._~----
Business CycleRecovery
line Starting in
Growth Ratein Real GNp·1during First18 Months
(% per year)(1 )
Pprcent Ratp 01Change in Consumer
Price Indpxi>
At Start oflR MonthsRecovery La tpr
I.2l (J)
Change in Rateof Inflation("in points)
(41
1 March 1933 5.2 -9.5 3.9 13.4
2 April'1958 .1.6 4.1 2.4 -1.7
J November 1970 5.7 .1.0 3..1 -1 ..1
4 March 1975 6.(J 8.6 5.7 -2.9
5 February 1% 1 6.1 1.7 1.1 -06
6 May1954 6.6 0.2 n.7 0..1
7 November 1927 6.6 -2.9 00 29
8 July 1924 9.0 -2.4 2.6 .1.0
9 June 1938 10.3 -3.7 2.1 5.8
10 july 1921 11.0 -12.9 0.3 13.2
11 Octuber 1949 "11.3 -18 12.0 13.8
50URCE: National Rure<1u of hunumrc R""\HCh. In,aperfent rate computed on basI' of GNP al precpdlng hus,"e~s (y( I.. pt'akbChange oyer six-month sp,ln, seasonally adjusted ,lt ,lnnlhll ratl'. I'lac ed at l'nd (Of ~P,ln
cThrl'P-month a\"er,lge. (<'nteTed on trough m,,"l~
Consumer Price Index The recovery patterns tell us that during 1920-1950the rate of change in the (PI registered large increases during the two yearsfollOWing each trough. (It is well to recall that the standings at troughs in this
period, except for 1945, were all negative; i.e., the (PI was jailing at the end of
each of the six recessions in 1921-1938 and in 1949.) In the last quarter cen
tury, however, the prevailing inflation tended to moderate somewhat in the
initial stages of the recoveries. The median 1949-1970 pattern lies below the
base (trough standing = 0) line. The 1975 pattern shows a significantly greaterdecline in the inflation rate than was achieved in any of the recoveries ot
1949-1970, but one must remember that the 1975·-1976 reductions startedfrom unusually high levels of inflation.
A close comparison of the patterns for the rate of change in the (PI and forGNP in constant dollars suggests that a relationship exists between the average
rate of recovery in output and the concurrent change in the inflation rate.
Table 10 illustrates this association for the first eighteen months of eleven busi
ness recoveries in the period 1921-197646 In the six most vigorous recoveries
(lines 6-11) inflation accderated, the more so the greater the increase in real
540
Recession and Recovery of 1973-1976 541
GNP. In four of the five recent recoveries with below-median growth rates inreal GNP (lines 2-5) the rate of inflation fell, as indicated by the negative entries in column 4" The only strong exception is the recovery from the1929-1933 depression (line 1), which was initially sluggish but saw' a drastic reversal in the price level movement, from a steep decline at the March 1933business cycle trough to a fairly large rise eighteen months later. However,special factors promoted autonomous wage and price rises in this period, notably legislative measures such as the National Industrial Recovery Act passed inJune 1933, and the rise in costs may have retarded recovery. (For a detailedanalysis of cyclical changes in the 1930s, see Roose 1954, especially chaps. 3,4,8, and 9, and Friedman and Schwartz 1963, especially pp. 493-496'> Whenthe 1933 recovery is excluded, the correlation between the ranks of entries incolumns 1 and 4 of Table 10 is nearly perfect (I', = 0.%); when it is included,the correlation is still positive but much lower (I', = 0.56).47Sales of Retail Stores in Constant Dol/aI'S On the whole, the rise in this seriesduring 1975-1976 was fairly close to the 1949-1970 average.Business Capital Outlays in Constant Dol/aI'S These expenditures have beenunusually sluggish in the first two years of the current recovery. The 1975 pattern lies below all the preceding recoveries.Change in Business Inventories in Constant Dol/aI'S The 1973-1974 declinein real inventory investment, the largest since the 1930s, was followed by thestrongest rebound. The inventory decline and recovery were not only large inabsolute size but also relative to the change in total GNP. They accounted for56 percent of the decline in real GNP during the recession and for 30 percentof the first year's recovery.Bank Rates on SlJort- Term Business Loans Movements in this series duringthe 1975-1976 busip.ess recovery continued to resemble those in the inflationrate (CPI), as our graphs demonstrate, but again with smaller amplitude. Thepatterns for both variables show peaks about six months before the businesscycle trough of March 1975 and downward trends during the first year or moreof recovery. The decline in interest rates during this recovery has beenunusually large and long by historical standards, according to our comparisons,although bank rates behaved rather similarly in the recovery that followed theprevious (1970) recession. The 1933-1935 period provides another example ofdeclining interest rates during a recovery. Here the evident reason was thecontinuing depression of investment and bank credit demand, since there wasa sharp reversal in the rate of change of prices. In the current recovery the sluggishness of investment and ample supply of internal funds contributed to thedecline in interest rates, reinforcing the effects of reduced rates of inflation.Corporate Profits in Conslant Dol/ars The recovery pattern of real profitsshows a sharp rise in the first two quarters of the current recovery and oscillation with a mild upward drift thereafter. The 1975-"1976 curve lies above themedian 1949-1970 pattern. Only in the recoveries from the deep troughs of
542 Victor Z.1rnow;lI and Ceofffl'Y H. IvtoOfe
1933 and] 9JB have rpal profib shown larger rplativp iIKf('aWS tl1<ln in1975-1976, but in all three cases the preccding dec!inl's WPle Pxccptlorhtlly
I;\rge also.Index of Leading Indicators The pattern of this series, which rose almost continuously from Feowilry 1975 through Deccmbpr '1976, shows only small devidtions (in either direction} from the path of the median ·1949-1970 expansion.
In sum, the comparisons of cyclical patterns disclos£' several peculiarities ofrecent developments, the most important being the innedse in the rate of inflation during the early phase of the recession and its decline during the earlyphase of recovery. The re,Ktion can be described ,IS an unusually long lag. Themovement of interest rates was remarkdbly large, ancllagged in a manner similar to that of the ratp of price change. Huge swings downward in 1974 and upward in 1975 occurred in real net corporatp profits and in real inventory investment. Business capital outlays in constant dollars declined late in this recessionand rose late and with disappointing sluggishnl'ss in the current rerovery.
APPENDlh:: ON SOME PROBLEMS IN THE ESTIMATIONOF REAL OUTPUT
Comprehensive series in constant dollars show unusual divergencies of movement from series in physical units during '1973-1974. In particular, real GNPdeclined throughout 1974, whereas the indexes of industrial production andnonagricultural employment declined decisively only after June and September '1974, respectively. The declines in real GNP were unusually large relativeto those in previous recessions whereas those in industrial production and inemployment Were not especially large. This has led some contemporary observers to suspect "overdeflation" - that errors in the derivation of theconstant-dollar values of national income and expenditure have been not onlyunusually large, but also systematic, in the direction of biasing downward suchdata as real GNP, real retail sales, etc. (see Okun 1974, especially p.504, andMoore 1975).
One poss'ible source of such errors could be that some prices reflected incurrent outlays and shipments are set by contract several weeks or monthsbefore. If current rather than past prices are used to adjust the current-dollarseries, then in a period of generally rising prices overdeflation will result. Otcourse, escalator clauses in contracts would tend to prevent this and mighteven lead to underdeflation errors if the escalated prices accepted in the contracts exceeded the current prices. However, the speedup of inflation in1973-1974 was, we believe, largely unanticipated; therefore, for some timeduring that period overdeflation would seem on balance more likely.
Recession and Recovery of 1973-1976543
~\~,70,::::-_,·,.·.- ..
To resolve this empirical issue, then, it becomes important, especially intimes of rap!d ch,mges in price levels, to knuw the dating of contract prices andwhether and how such prices were escalated. This is by now well recognized,but information on these matters is still fragmentary. According to a currentstudy by the NBER, the deficiencies of the wholesale price data are such that afull assessment of. and proper adjustments to, the present deflation procedurescannot really be made. A sample of WPI reports indicates that the index consists of an almost equal mixture of order prices of capital goods and industrialmaterials bought on contract for future delivery and of shipment prices atwhich the past output of the various goods has been sold. The lags betweennew orders and shipments, according to the BlS price reporters, are substantial: more than half fall in the range of one to six months for both order andshipment prices, but are generally shorter for those products represented byshipment prices than for those represented by order prices (see Ruggles 1977,p.I-22l.
Contract prices are particularly important for types of output ordered forfuture delivery. Capital goods are largely of this type, and price indexes forsuch goods are on the whole weak. 48 The WPI prices of capital goods for agiven month are as a rule those at which current sales are made (new ordersare taken), not prices for deliveries in that month. The estimates of investmentin equipment, however, are based on deliveries in that month. They representnot only sales in the same month but also sales made in earlier months at thethen prevailing prices. Before 1974 current prices were used to deflate invest·ment in producers' durable equipment, in effect, deliveries for a given monthwere adjusted largely by the price index of orders taken in the same month. In1974, the procedure was substantially improved: the deflators now used areweighted averages of current and past prices, based on estimates of the typicaltime interval between the sale and delivery dates. The estimates of the orderdelivery lags are derived from average ratios of unfilled orders to shipments lUI5), differentiated by type of equipment (the ratio is expressed as the number ofmonths of current shipments represented by the current backlog of unfilled ordersl. The new procedure has been extended back to 1958 (see Rottenbergand Donahoe 1975, pp.20-23, 28l.
Adeficiency of the revised approach is that it uses fixed lags between ordersand delivery, whereas the actual lags vary with changes in the size and composition of the orders backlog. During business expansions, when rates ofcapacity utilization rise, delivery lags tend to lengthen; during contractions,they become shorter. The U/S ratios show, in fact, large cyclical movements(but often with rather irregular timing, notably long leads at business peaks andlong lags at troughs). For example, the ratio for durable goods manufacturersdeclined from 3.3 to 2.6 months and averaged 3.0 months in 1968-1972, theperiod used to provide the first approximations to the price lags incorporatedin the new deflators for equipment. However, it then rose from 2.7 to
544 Victor Zarnowitl ,1Od Ceoffrey II. Moore
3.6 months in 1973-1974 and fell hack to 2.8 months hy mid-197G. The use offixed (average) instead of cydic,1l1y variable U/S ratios and l'~til1ldtpd deliveryperiods would presumably make the price lags built into the equipment deflators too short in times of strong pressures of demand on capacity and too longotherwise. If so, some over- and underdeflation biases, respectively, wouldresult. but their timing and size seem very difficult to establish short of a de·tailed analysis of the data and procedures used.49
Another possibility is that the use of input rather than output prices indeflating expenditures could bias the results. The bias would be in the direction of overdeflation if output prices rose less than input prices, in the directionof underdeflation in the opposite case. In the long run, because of productivityincreases not accounted for in the input cost indexes, overdeflation would beexpected. Of the private-sector outlays, those on structures are particularly affected. 50 The problem also applies to the entire government sector, whereoutput measures are generally lacking and productivity estimation is especiallydifficult. 51 What statistical evidence there is, which pertains solely to the federal government, suggests that product!vity has been rising. Hence the growth ingovernment output in the national accounts may be underestimated.
In the short run the analytical situation is more complicated, however. It isoften uncertain what kind of error would be generated by the use of inputprices as deflators in a particular episode, and indeed whether any errors of systematic nature would necessarily result. In addition to an upward secular trend,productivity is subject to occasional short-term disturbances and cyclical variation which typically include declines late in expansion and early in contraction.Profit margins, which are a factor differentiating output prices from inputprices, show strong procyclical movements, usually also with leads. notably atpeaks. Relative prices of individual input and output categories vary considerably in ways not conforming to any simple or stable pattern.52 Our concernhere is not with any long-run biases which would affect recent and earlier yearsalike, but rather with measurement problems that could cause serioLls distortions in the statistical picture specifically for the 1973-1976 interval. From thispoint of view, the principal difficulty created by the use of input price deflatorsprobably is their failure to reflect the unusually sharp decline in profit marginsin this period. In these circumstances, actual prices received would not rise asmuch as input prices, and overdeflation would result.
Another serious estimation problem during this period occurred in the dreaof inventory investment -its accounting as well as economic aspects. In timesof rapid changes in the inflation rate, it is particularly difficult to evaluate thechange in business inventories (CBIl, a highly volatile component of GNP. Incurrent-dollar GNP accounts, this component is measured at current replace··ment costs. To do this, starting from the reported inventory book values, requires a separation of the stock valued by the last-in first-out (LIFO) aClOuntingmethod from the stock valued by the first-in first-out (FIFO) method, for the
Recession ilnd Recovery of 1973-1976 545
two methods produce different dollar figures for costs of sales, values of inventory, and profits in any situation where prices of the goods sold from stockchange over time. '3
When prices of goods helel in stock rise, the appreciation is counted as profits in the FIFO but not in the LIFO system. Commerce estimates of the inventory valuation adjustmen t (IVA) serve to correct reported profits for such unrealized and partly spurious "paper profits" from higher inventory prices. IVArepresents the difference between the change in book value of inventories, asreported by business firms using a mixture of accounting methods, and thechange in inventories at current replacement cost, as compLited by the Commerce Department from the business inventory reports. in 1974, the sharplyrising prices resulted in an unprecedented large IVA>4
The inventory profits which accrue under FIFO are taxable, while under LIFOsuch profits do not accrue (except for major inventory liquidations when profits from higher prices are realized -but such realizations can be avoided orpostponed). Hence, many companies were shifting toward the use of LIFOunder the impact of the high and rising inflation rates in 1973-1974.5\
The change in business inventories, like other expenditure components ofGNP, is estimated in both current and constant dollars. The price indexes usedto deflate the inventories are components of the wholesale price index (WPI)corresponding to the commodity composition of the given industry's stock. ForFIFO inventories, the deflators are based on average prices for the current andpreceding months, the number oi months being approximately equal to the inventory turnover period. Increases in LIFO stocks reflect increases in physicalvolume valued at prices of recent acquisitions; so they are deflated by price indexes for the current period. However, a reduction in the volume of inventorymeans that withdrawals exceed acquisitions, and withdrawals can then bestated only in terms of prices of those prior periods in which the sold goodsentered the stock, not in terms of Current replacement costs. Thus decreases inLIFO stocks reflect decreases in physical volume valued at earlier prices; hence,they are deflated by applying ratios of the base-period prices to the prices ofthe acquisition period (see Rottenberg 1974; Herman, Donahoe, and Hinrichs 19761.
Early estimates of the inventory change in 1973, particularly in the latter partof the year, and '1974:1 were beset by very large underestimation errors, as indicated by the major upward revisions of July 1974. This has been attributed inlarge measure to "a rather unique and unfortunate combination of events. Thelate reports and introduction of a new sample are infrequent events and the revisions in book values were all in one direction" (Young 1974, p. 38).% But it isrecognized that more basic problems exist.s7 Data on the commodity composition of inventories and the applicable price indexes are far from adequate. Information on inventory accounting methods available in 1973 was quite ob~o
lete. A system of mon itoring the changes in inventory valuation and reportingmethods was instituted by BEA in 1974.
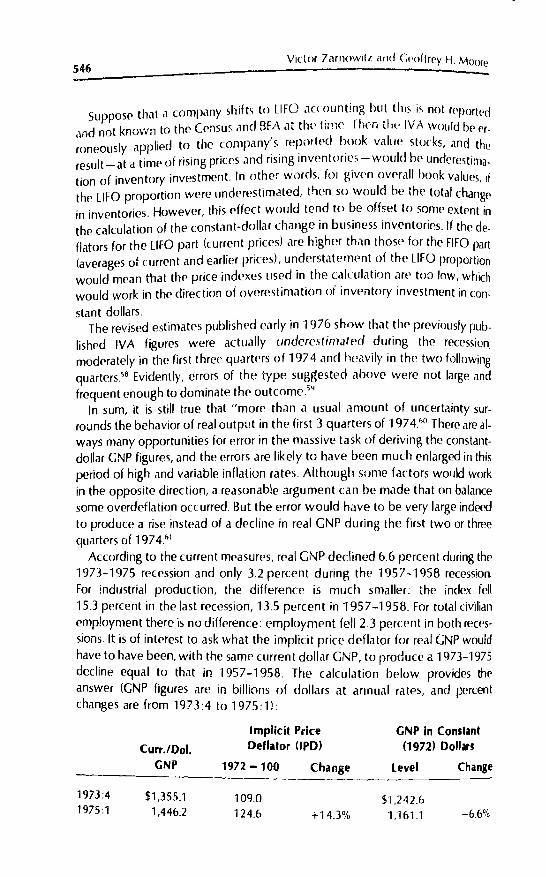
546Victor Zilrnowitz ilnc! Cl'oftH'Y H. Moore
Supposp thill a company shifts to LIFO a«~llmting but thi, ,is not reportedand not known to the Census and BEA at the time Then IIIl' IV t\ would bp er
roneously applied to the company:s. ref?orled book value stocks, and theresult-at a time of rising prices and rlsmg mventOrle, -would be underestimJ_tion of inventory investment. In other words, fOf given overall bonk values, iithe LIFO proportion were underestimated, then so would be the total changp
in inventories. However, this effect would tend to be offset to some extent inthe calculation of the constant-dollar change in business inventories. If thp deflators for the lifO part (current prices) are higher than those for the FIFO part
(averages of current and earlier pricps), understaternt'nt of the LIFO proportionwould mean that the price indexes used in the calculation are toa low, whichwould work in the direction of overestimation ot" inventory investment in con
stant dollars.The revised estimates published early in 1976 show that till:' previously pub.
lished IVA figures were actually underestimated during the recession,moderately in the first three quartprs of 1974 and heavily in the two following
quarters.58 Evidently, errors of the type suggested above were not large andfrequent enough to dominate the outcome.5~
In sum, it is still true that "more than a usual amount of uncertainty surrounds the behavior of real output in the first 3 quarters of 1974.60 There are always many opportunities for error in the massive task of deriving the constantdollar GNP figures, and the errors are likely to have been much enlarged in thisperiod of high and variable inflation rates. Although some factors would workin the opposite direction, a reasonable argument can be made that on balance
some overdeflation occurred. But the error would have to be very large indeedto produce a rise instead of a decline in real GNP during the first two or threequarters of 1974.61
According to the current measures, real GNP declined 6.6 percent during the1973-1975 recession and only 3.2 percent during the 1957-1958 recession.For industrial production, the difference is much smaller: the index fell15.3 percent in the last recession, 13.5 percent in 1957-1958. For total civilianemployment there is no difference: employment fell 2.3 percent in both recessions. It is of interest to ask what the implicit price deflator for real GNP would
have to have been, with the same current dollar GNP, to produce a 1973-1975decline equal to that in 1957-1958. The calculation below provides theanswer (GNP figures are in billions of dollars at annual rates, and percentchanges are from 1973:4 to 1975:1):
Implicit Price GNP in Conslant
Curr.lDol. Deflator (JpD) (1972) Dollm
GNP 1972 -100 Change Level Change
1973:4 $1,355.1 109.0 $'1,242.61975:1 1,446.2 124.6 +14.3% U61.1 -6.6%
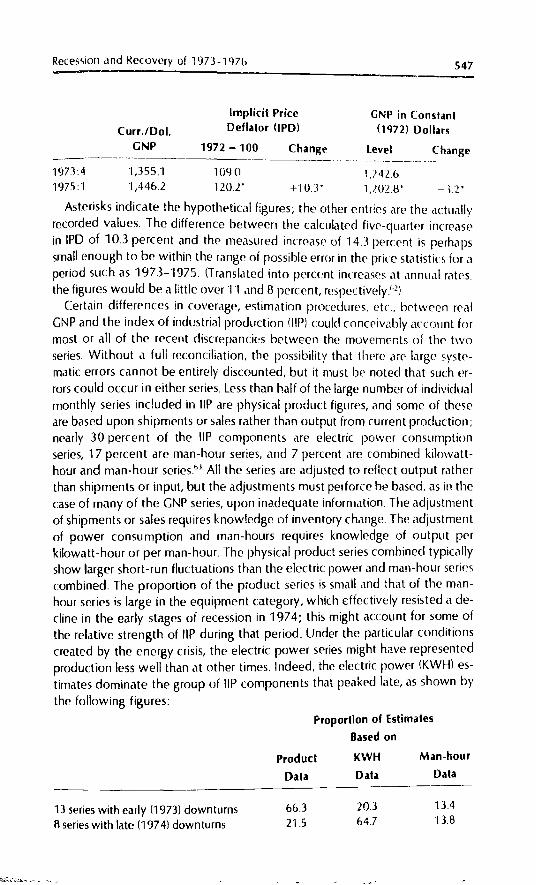
Recession and Recovery of 1973-197b 547
Curr.lDol.GNP
Implicit PriceDeflator (IPD)
1972 - 100 Change
GNP in Constant(1972) Dollars
level Change
1973:4 1,355.1 10lla U4261975:1 1,446.2 120.2· +"1OT 1,202.8" -IT
Asterisks indicate the hypothetical figures; the other entries are the actuallvrecorded values. The difference between the calculated five-quarter increas~
in IPO of 10.3 percent and the measured increase of 14.3 percent is perhapssmall enough to be within the range of possible error in the price statistics for aperiod suc h as 1973-1975. (Translated into percent increases at annual ratesthe figures would be a little over "11 and 8 percent, respectively"2)
Certain differences in coverage, estimation procedures, etc.. between realGNP and the index of industrial production (liP) could conceivilbly account formost or all of the recent discrepancies between the movements of the t\Voseries. Without a full reconciliiltion, the possibility that there are large systematic errors cannot be entirely discounted, but it must be noted that such errors could occur in either series. Less than half of the large number of individualmonthly series included in liP are physical product figures, and some of theseare based upon shipments or sales rather than output from current production;nearly 30 percent of the liP components are electric power consumptionseries, 17 percent are man-hour series, and 7 percent are combined kilowatthour and man-hour series bJ All the series are adjusted to reflect output ratherthan shipments or input, but the adjustments must perforce be based, as in thecase of many of the GNP series, upon inadequate information. The adjustmentof shipments or sales requires knowledge of inventory change. The adjustmentof power consumption and man-hours requires knowledge of output perkilowatt-hour or per man-hour. The physical product series combined typicallyshow larger short-run fluctuations than the electric power and man-hour seriescombined. The proportion of the product series is smail and that of the manhour series is large in the eqUipment category, which Effectively resisted a decline in the early stages of recession in 1974; this might account for some ofthe relative strength of liP during that period. Under the particular conditionscreated by the energy crisis, the electric power series might have representedproduction less well than at other times. Indeed, the electric power (KWH) estimates dominate the group of liP components that peaked late, as shown by
the following figures:
I'roportion of Estimates
Based on
Product KWH Man-hour
Data Data Data
13 series with early (1973) downturns 66.3 20.3 13.4
R series with late (1974) downturns 21.5 64.7 13.8
548Victor Zarnowltl and Ccoiirey H Moore
. I' . to 'ts I1St" rf'vision (in June 1976) liP was not rmlly eqUiDlwe! to re-Flna y, prior r , -' . . .'1 t' 'mport lnt shift~ in the Lurnpmrlloll of OLJ tput such as the risingteet cer aln I ,. ..share oj small cars in automobile production (which was very Important in theperiod under review), but this deficiency has been largely corrected in the Cur-
rent revised liP data.64
NOTES
1. In addition to Moore (1975, 19771, sel' Okun (1975.1) and othpr r!'ports in Brooking> Pdpm
on Economic Activit)', no. 1 (975) and Cagan (1976, 1977).2. The method of trend adjustment is ,l<hpted from thatusNI by Mintz 1.1970, 19741. Mintzl's·
timates the trend from the raw (but. whrre nrpdrd, seasonally ,ldjustedl data by a (enterrd75-month (or 25·quarterl moving ,wer,lge. WI' start with the samp step but derive more sta·ble and cycle-free trend r,ltes of growth as follows: The averagrs of the r,l\V data are com·puted for each of the intervals Iph,lSes) brtwel'n the specific turning points in the devla·
tions from the mOVing average, and a threr·point moving an'rage of the resulting phaseaverages is taken. The trend is then interpolatpd monthly (or quart!'r1yl hetwern tbl' valuesof the three-point moving average. Twelve-month moving av!'rages Me used to eliminatesharp transitions between the trend segments so obtain!'d. The trend segments in the endphases are extended by straight-line extlapolation to the beginning and end of the data. De·viations of the raw data from this trend yield the finaltrend·adjusted series, from which theset of turning points shown in Table 1 is derived.
3. limitations of space do not permit full documentation of the man}' statrments of fart madein this paper. Most of the reqUired material can be found in the Commerce Departme~t'5
Business Conditions Diges! (BCD) and the labor Department's Chartbook of Prices, Wagesand Productivity, two monthly reports that cover a large number of cyclical indicators andother economic time series of current interesl. T'lbles and graphs in this report prOVidesome additional evidence. Some of the developments during the slowdown-recessionrecovery period under discussion are presented in the cyclical comparison charts used inthe next section to place the recent changes in historical perspective.
4. These contractions are evident in both current-dollar aggregates and in the deflated series.On the other hand, expenditures on !londurable goods continued to expand in rurrent dol·lars, while declining gently in constant dollars, and expenditures on services rose in bothcurrent and constant dollars.
5. The source of the forecasts is the Business Outlook Survey conducted quartrrly by theAmerican Statistical Association and the National Bureau of Economic Research The num·ber of respondents in the five surveys included in the tabulation varied between 45 and 67;they included business, academic, and governmrnt economists professionally engaged inbusiness conditions analysis and forecasting. All figures are at annual rates. The "actual" fig·urI's are taken from the August 1974 issue of BCD.
6. The major source of data on price expectations of consumers is a representative nat;or.aisample (1,500 to 3,500 respondents) regularly surveyed by the Survey Rese.uch (enter atthe University of Michigan. See Sandmo (1970), Juster and Wachtel (1972), luster 09731,Juster and Taylor (19751, and Wachtel (1977l.
7. The list may not be complete, but all these factors are discussed in the recently mushroom·ing literature on inflation. To be sure, writers with differenttheoreliral views emphasize dif·ferent basic and proximate causes of the observed price-level movements. Some stress theeffects of monetary growth rates and !he dynamics of price and wage expectations verSusrealizatIOns, others stress the role of exogenous changes in wages and other costs and of
Recession and Recovery of 1973-1976 549
contractual arrangements in labor and product markets. For some recent reviews and contributions, with many bibliographic references, see Okun (lq75b~ and Gordon \·1976l.
8. In 1973, with tilt' unemployment rate remaining quitp stable near its local peak level of lessthan 'j percent, the principal reason for the fall of the index must be seen in the c1imhin
consumer prices, with the unfolding downturn in stock pricps playing a significant bU~smaller role.
9. Cooper and lawrence (19751. The authors oi this paper and its discussants also considerexchange-rate uncertainty and price controls as other possible reasons for the commodityspeculation.
10. The ratio of the CPI for food to the CPI for all other items (1967 = 100), which varied nar
rowly between 0.97 and 1.04 in 1954-1972, rose to 1.13 in 1973. Food prices accounted forslightly more than half of the rise in the CPI during 1973 Isee Hathaway 1974). The farmers'share in total personal income increased frorn 2.9 percent to 4.2 percent between December 1972 and December 1973 (by Decernber 1974 it had fallen back to 3 percent).
11. We relegate to an appendix the discussion of a major technical question. namely whetherthe errors produced by these adjustments would likely be systematic in the sense of seriously over- or underestimating the size and duration of the broad movements of the economy. Our tentati\'e answer is that there are serious questions or uncertaintips about the measures, but we have found no firm indications of bias.
12. Much of the strength of investment in producers' durable eqUipment may be attributable toincentives provided by the accelerated depreciation allowances and the investment taxcredit (both adopted in 1971l. Such incentives have been estimated to have a substantiallong-run stimulating effect on the rate of accumulation of capital in the form of machineryand equipment (see Jorgenson 19711.
13. Unemployment totals and rates tend to turn upward before business cycle peaks becauseemployment typically rises slowly in the late stages of expansion, while the labor forcegrows at a fairly steady rate. The reduced growth in employment is caused either by demand slowdowns or by supply constraints, or both. (In the initial stages of expansion, em
ployment often grows slowly as well because of the as yet uncertain outlook and the concurrent rises in the average workweek and labor productivity; hence, unemployment frequently lags at business cycle troughs.) For related reasons, the GNP gap (and other mea
sures of capacity utilization) also have leads at peaks.Sma!!er deviations from coinrident timing have been observed for some other indicators
on our list; e.g" the employee-hours series leads at peaks by short intervals, reflecting themuch longer and more systematic lead in the average workweek All such f,lets must be
taken into account in the interpretation of chronologies of the type shown in Table 1.14. Particularly difficult to interpret are the data for retail trade. Deflated retail sales show a
contraction of 11.8 percent between March 1973 and November ·1974. In contrast, employment in retail establishments is reported to have increased by 3.3 percent from March 1973through September 1974. Part of the puzzle seems explained by newly compiled statisticswhich show that tne average workweek in retail trade decreased gradually from 33.6 hoursin February 1973 to 32.4 hours in November 1974, i.e., by 3.6 percent. Total employeehours varied narrowly and irregularly between 12.3 and 12.9million per month in1973-1974. Thus, greater use was made of part-time workels, but total labor input was notreduced, despite the apparent decline in the volume of business. As they stand, the figuresimply that productivity (real sales per employee-hour) fell 11.4 percent in 1973-1974, an
extraordinary decline.15. This tabulation, based on the median forecasts from the ASA-NBER surveys, parallels that
given earlier in the text to illustrate the 1973 predictions. The number of participants in thesurveys covered varied between 49 and 62. The survey forecasts have been presented in
successive issues of Explorations ;n Economic Research, published by NBER. The data for
actual raIl'S are taken from the August 1975 issue of BCD.
550Victor l.lrrlowitz and (;poffrpy H. Moore
f n thpw md "tl,,'r dirp( t d,lLl ,,11 antl( ip,lt"d pm ('·I,·v,,1 (h,lIlgh It'll inil!!1 n16. It appe,HI ror ' . . .., ., I' .
ary ('xpe( tations we're' lornH'd Miapll\'~'l}' In _lh(. ~('n",p 1)1 rt''\pundlog (c> rPl t'nt rhlli,dti(m....
Models of e'pect,ltlom whit h S(,('nl (onmtpnl w,th thp,p d,lt,l \\,prl' d('v('lopf'd by
Cagan 11956), Frpnkel l1975i, and Mus-a 1197';)17. It is tftle th.lt businels prnductilln and 1f1\'l''<lnlPlll dpl isioll5 .UP b,I'PrJ lllmtly on "n1l(ro"
data, which Ml' mor£' familiar and morp p'"mptly .1v.1IIalJl" to r!(,( 1\I(,n'l1l,lk"rl than th.,"macro" vMiabh's observpd by the pcollomilt. But p( onomi, .lggrpg.ltp, .w' ball'd on a(.counting figures compiled at the level of the firm, ,md it is preci,ply th(',p mil rodata th~t.up
subject to v.uio'.\s complications, problp;]]s of interpretation, .1I1d possilJl" d"tlJrtions f~
periodl of ,l(e'e!erating inflation and oth(', unique dilturb.-.;l(pl. (For p'amplp, in additll'n tothe commodity and energy snOltagpI, 1971-1974 witn('<;\pc! IHI( (' and \\agp del ootroll ,lodincrease's in legal minimum wagesJ As indica t£'d bv data [('Villllns, (h,lOges ,n a( rountlngprocedurel, and contempor,lfy accounts, £'v,lluation of tl](' {lIrrent,l,ltp of bUline;s in.come. price-cost rplations, and i"ventorlps has bppn p,Hti( lila r1v difficult 10 thi'. t'Jrbul"ntperiod. 151'1' the ,lppendix for some illu,tratio;ll of til{' d.Jta problplllS Invol\'l'd.f tt IPnnsreasonable to assume that this causpd an imrp.Js(' ill tht' f;('qu{'fl( y and a\'('[,lg(' Ilze of theinformation,ll delays ar!d errors The source oj til(' 1,1Iter may li(' in ttw inability of ind,v,du,\bto distinguish promptly and properly bl'tween til" ablolutl' and rplat,vl' comp'.lfl!'flb (Ii '.In·
.Jnticipated price movemellts. nhis has uepn l'mphaSlzl'd in [('c{'nt work on the' aggregate'supply theory by Friedman, Phelps, lucas, ilnd othl'rs, se'e Pooll'l 976 for a sUf\'ey and referencesJ However, in the present contt'xl, it i, ne,'essary also to consider the die( ts of faultyadjustments for price changes of sales, inventoril's, arid protits, and tht' confounding of :ransitory and longer movements in these variables.
18. In the 1969-1970 recession, inflation continued at rates th,lI were sufficiently high to prevent the major aggregates in UJrrent dollars fronl declining, for there were only rdativelymild declines in the measures of re.Jler·onomic activity lin physical or dl'flated v,llup (lnit~1.
In most earlier U.S. recessions, pricps either fell or rose so slowly r ompared wit Ii thr contrani&fls in total output and I,lbor input that the real and nO/nin,ll indic,ltors tended tomove together. In the 1973-1975 [ecession, for the first time sinu' 1920. lYrlical downtumsin some of the major current-dollar series appeared with long bgs behind thp downturns inthe 'eal aggregates. As in the 1920-1921 recession, inflation was slrorlg enough to producpthese long lags. but recession was strong er!ough to c.wse the eventual declines in the nominal indicators.
19. Thil is so according to the most 'ecent general revision of the Federal Resprvp Board's index,completed in lune 1976. Seforp that revision. the mdex had ,1 IH"lK of 127.5 In Novem·ber 1973 and a secondary high of 125.8 in June 1974. iScl' the Fl'deral Reserw! press rekaseof June 26, 1976, and "Industrial Production -1 <)76 ReviSion," Federal Rest'f\'e Bulletin,June 1976, pp. 470-479.)
20. Even excluding construction, the GNP data show grpater weakness rn 1974 than the induItrial production index. Real GNP adjustf'd to be as compMab!e as possible with industrialproduction shows a peak in the fourth qlJarter of 1973 ,md dec!ll1es every quarler thereafter, reaching a trough in the first quarter of 1975 {se£' 51H\'{',' 01 Current BUI;m'sl, Octo-ber 1976, pp.9-10!. .
21. The intentions were reflected more clearly in the (hange rn :nventoflps on h,md a~d onorder than in the change in inventories alone; the former declined quite stNdily and sharplythroughout 1974 and early 1975, whereas the lalter bounc{'d up temporMily in the fourthquarter of 1974. Outstanding orders C,ln ordinarily b(' adjusted promptly by purchaserswhen they consider their inventories excessive.
22. !n this respect, the developments in 1972-197.1 resembled those !11 1956-1957, but the similarity Eextends only to the changes in the growth ratl'S in the supply of money and nearmoney (selected assets of high liquidity); the growth rates themselves were on the average
Recession and Recovery of 1<)73-1976 551
much higl\('r in 1972-1971 tlMn in 1'l56-1l)~7, a~ Wpr(' til!' gruwth rat{'~ In (urrpnt-doilarGNP.
23. The fir,t indication of a modl'ratl'ly ,timulating impact on consumer ,,-,ntimpnt of tl\(' proposed tax h'glslatlon was reported in th(· Fpbnwy1975 smvey by the UniVl'fsity of ;\\;chigan Survey Research Center.
24. Tax receipts, based all rate, applied to the rISing nominal levl'ls of irhomes and profits(which were falling in real termsl, increased sharply dunng the first three quarters of this recession, adding to the EConomy's w(,akncss. During previ'Jus rec('ssions tax payments tothe federal govemment declined morf> promptly. Then, during thl' next three quarters lending June 1975), federal receipts fell at an acceler,lling ratl', from $299 billion to 5250 billionor by 16.4 percent 1.111 dollar figures in this note are at annual rates). In thp same period, federal expenditures rosc Irom $307 billion to $352 b,lIion or by 147 percpnt Ito be comparedWith their increases of 13.5 percent in the first thrc'e quarters of 1974~the mild-dl'clinephase of recession-and of only 4 pern'nt in the last three qu.uters of 1'J73. the slowgrowth phase of expansion!. The fpderal dc·ficit, whi(h (wlipr in 1973-1974 staypd [l'lativl'Iy low (between $4 billion and 5B billion) skyrmketpd from 58 billion in 1974: 3 to S102 bil
lion in 1975'2.25. The dispersion of specific turning points over timl' has been greater at busine5s (yelc' peaks
than at troughs. For example, the stand,ml devi,1l.ion of leads and lags in 1948-1 '170 \\',15
6.B months at pmks and 5.7 months at troughs for the set of twenty-seven se[lc's includl'din the composite indexes of leading, coincident. and lagging indicator, (see BCD. Fpbrl;ary 1977, p. 106, fOI a tabulation of the cyclical timing measures for these sef;es).
26. At annual rates, the change in business inventories amounted to about $15 billion in each ofthe first three quarters of 1976 and $1.7 billion in thl' fourth quarter; the corresponding figures in 1972 dollars are approXimately $10 billion and 51 billion.
27. The number of employees on nonagric ultural payrolls (establ;shmen( survey' fell 3 per(cntfrom September 1974 to June 1975, then rose 3.8 percent by'lune 1'J76. The number of persons engaged in nonagriculllu,,1 activities (labor fOrle survey) fell 2.3 percent from July 1974to March 1975, then rose 4.1 percent by June 1976. Total civilian employment (labor forcesurvey) fell 2.4 percent from July 1974 to March 1975, then ;05C 3.9 percent by lune1976.
28. See the corresponding tabulations for 1973 and 1974 predictions in the section on the 1973slowdown. The membership in the surveys coveted varied betwpl'n 44 and 52. Tnl' data for
actual rates are taken from BCD, "·Iarch 1977.29. At annual'rates, growth in M.; declined to less than 3 percent in the last quarter of 1975 and
also in the first quarter of 1976, while GNP gained nearly 11 and 13 percl'nt respectively;hence velocity as measured by GNP/M1 increased about 6-10 percent. I.In the third quarterof 1975, both M
1and GNP rosp at much higher rates, but velocity retarded a similar ad
vance.) Although velocity increased during each of the recent business recoveries, it did 50
at much lower rates. It has been suggested that a decline occurred recentl}' in the volume ofdemand deposits that the public desirps to hold at given levels of income and interest rate::;because certain interest-earning ,lssets (notably savings accounts at commercial banks) callnow be used mare easily for making payments. For some details on the new economic andlegal developments in this area, see Federal Reserve Bulletin, March 1976, pp. 191-192.
30. Consider the following chronology of the last high iH) and low (U values in the diffusion in-
dexes:
H
leadrng
Coincident
lagging
August 1972Septembpr '1 <)7\
Febru",\, 1<)74
October 1<)74
Februari 1<)75
June 1975
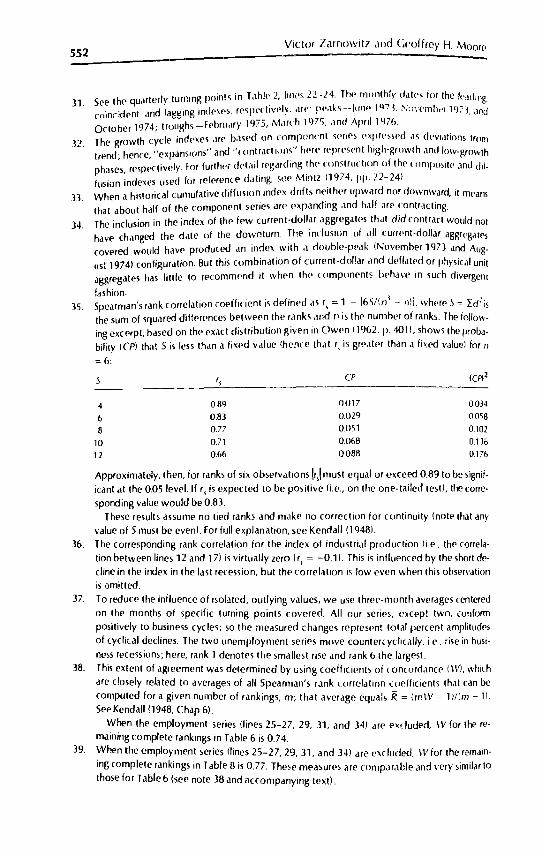
552Victor Zarnowllz and Geoffrey H. Moore
33.
See thp qu;uterly turning points in T.lhle 2, lilli'S 22-24. Thl' 1ll(lllt~ly datp, tor thelp'll!ing.31. ,nincinpn! ann lagging indexes. rpsppcllvl'lv . .lr(': !H'.lk<;--!t111,. IQ! 1. N"'oT·mb,·11971. ,1I)d
October 1974; troughs-Fpbruilfy 1975, M.lrch1975, .lnd April 1 'J76.
32. The growth cycle indpxes are baspd 011 (o~.r)()n('nt sprrps PXIHPssc'd as dpv;ations fromtrenn; hence, "expansions" and "contractlons hprp rPI',p<;c'nt high-growth and low-growth
h- rn-noctivply. For furthp; dpt"il rpgarding the ((Jnstrucllon of thp fOll1pmitp ,1I1d dii-P <Ises, <.)". . . ' .fusiun innexes used for refNence dating. sep Mintz 11974,1'1'.22-24)When a historical cumulative niffusion indp~ drrfts npither upw'lrd nor downwarn, it mpansthat about half of the component series arl' expanding .lon halt are contracting.
34. The inclusion in the index of Ihp few current-dollar aggregatps that did contract would nothave changed the date of the downturn. The inc lusion of .111 currpnt-nollar aggrpg.ltf'S
covered wouln have produced an index with .1 double-peak (November 1473 ann August 1974) configuration. But this combination of current-dollar and deflatpd or physical unitaggregates has little to recommend it when thp romponpnts !Jphave in such divergent
fashion. .' . . . I I \ _ ,35. Spearman's rank correlation coefflClpnt IS deflllpd as r, = 1 - [6S/ ,n - n,1. where S= ~d' is
the sum of squared differences between the ranks and p is the number of ranks. The foUmving excerpt, based on the exact distribution given in (lwpn (1962. p. 401), shows the proba
bility (CP) that S i~ less than a fixed value (hence that r, is grpatpr than ,) fi~pd valuel for n
= 6:
5 " CP ((p)2
4 089 0017 0.034
6 0.83 0.029 0058
8 0.77 0.051 0102
10 0.71 0.068 013&
12 0.66 0088 017&
Approximalely, then, for ranks of six observations Ir,1 must equal or exceed 0.89 to be signiiicant ilt the 0.05 level. If r, is expected to be positive /i.e., on the one-tailed test), the carre·
sponding value would be 0.83.These results assume no tied ranks and m.lke 110 correction for continuity (note that any
value of 5 must be even). For full explanation, see Kendall (1948l.36. The corresponding rank correlation for the index of industrial production li.e., the correla
tion between lines 12 and 17) is virtually zero (r, = -0.11. This is influenced by the short de
cline in the index in the last recession, but the correlation is low even when this observationis omitted.
37. To reduce the influence of isolated, outlying values, we use three-month averages centered
on the months of specific turning points covered. All our series, excep! two, conformpositively to business cycles; so the measured changes represent total percent amplitudes
of cyclical declines. The two unemployment series move countercyclically. ip.. rise in busi
ness recessions; here, rank 1 denotes the smallest rise and rank 6 the largest.38. This extent of agreement was determined by using coefficients of concordance (\\1, which
are closely related to averages of all Spearman's rank correlation copfficients that can becomputed for a given number of rankings, m; that averagp equals R= (mW - l,/(m - II.See Kendall (1948, Chap 6).
When the employment series (lines 25-27, 29, 31, and 34) arp ex! luded, IV for the remaining complete rankings in Table 6 is 0.74.
39. When the employment series (lines 25-27, 29, 31, and 34) are excluded. IV ior the remain
ing complete rankings in Table 8 is 0.77. These measures are comparable and very similar tothose for Table 6 (see note 3B and accompanying text).
Recession and Recovery of 1973-1976 553
40. If th., dfl·,l> of ,trikes I ouki be l'hmlnatl'd. thp dates ot p!'aks and :roughs might welllw al
fpcwd. as \,/pll as thl' amplitudl's. A fwther I ompiilation i, that som!' strikps,]fp antilipatl'd
and all have aft ..rmaths. [Xl Ius ion of the strikp month may limit the avprage to \hl' months
strongly affpcted by both thp anticipatory and Lll! hing-up activiti!'s (purlhases. production). Npvprthplpss. this adjustment would havp lhangl'd only .1 fl'\\' of thl' Irldivldual rankings in tables 6 and 8 and notthp ovprall rank aVPfages.
41. The diffusion indexes lor pmployment use components 01 BCD series 41-numher of em
ployees on nonagricultural p.lyroI!S. l'stablishml'nt SurVl'y (Bureau of Labor Statistil'l. Theindex based on the finer decomposition (172 ir.dustries) applips to .1 somewhat ll'sS com
prehensive aggregate than does the 30-industry index. and it COVl'rs only the last three ron
tral tions. The diffusion index for production uses the 24-industry rompOIll'nts of BCD series
47 - index of industrial production (Board of Covprnors of the Federal Reserve System!. For
e:<amples of diffusion indexl's of leading and lagging indilators see lharts 3. 4. an;l 5 and alcompanying text.
42. Except for the 1929-1 q3) p<.'f1od. all business contrartions covered were shorter than1Bmonths; so their full course plus thp last year of the prelPding and .1 short imtial part of
the following expansion are portrayed in the first sf'! of our graphs. On thl' othpr hand. all
but two of the business expansions cover..d lasted longer than 24 months (the eXI eptionsare the 1921-1923 and 1927-1929 phases. which lasted 22 and 21 monthsl; so graphs in
the second set show for the most part only the re(Overy ,tages of pxpansion plus the last6 months of the preceding contraction.
43. Total retail sales were used for 1947-1976; department store sales. fm 1919-1946. Depart
ment stales carry a general line of apparel and furnishings; they handle only to a minor ex
tent or not at <111 such goods as automobiles. tires and parts. gasolinp and other fuels. andfood. In the period covered by both series (since 1935). thp relative I ydil .11 amplitudes of
current-dollar sales of departml'nt store> were in most instances larger than those of
current-dollar retail sales. This lends additional emphasis to the showing in Chart 6 that the
1973-1975 percent decline i!l real retail sales was larger than the 1929-1931 decline in real
department store sales. However. the lomparison may sufier from unknown errors in th!'
adjustment for p,ice level changes.
44. Since profits after taxes are partly paid out in dividends and partly retained and used to fi
nance investment imainly in fixed but also in working capital) . .1 I omprehemive pril I' index
seemed to be the most appropriate deflator. We del ided to use the GNP implicit price de
flator The fixed-weight price ind!'x for the gross business product (BCD. 311) might have
been prefe~ablebut is not available prior to 1965.45. For example. assume that two recessions start from the same peak level. say 100. but one
recession is mild. with a trough at 90. the other severp. with a trough at 50. If now therecovery produces a five-point rise. to 95 and 55. respectively. the perl ent rise. calculated
in th!' usual way. would bp 5.6 percent in the first lase.l0 percent in the second. Rebtive to
the preceding peak le\'el. however. the rates of recovery in the two instances are the same.
and the higher percent increase in the second casp is due to the low base. IIll identally. con
trary to this example. past patterns of recovery tend to show larger illl reases in real output
when the preceding recession has been spvere tha!l what it has been mild. el'en when mea
sured relative 10 preceding ppak levels.46. There have been twelve business expansions since 1921: thp one that started in Octo
ber 1945. follOWing the eight-month del line connected with the World War II reconversion.
is not included because of the peculiarities of that episode.47. Consistent results are also obtained for the relation with noniarm employment and with un
employment. The larger the rise in employment or dpcline in the unemployment rate during
the eighteen months nf d recovery. the larger the rise in the CPI inflation rate. Here r = 0.93
554 Victor Zarnowitz and Geoffrey H. Moore
for employment and -0.81 for unemployment for the eight recoveries of 1933-1976 (excluding 1945). These observations remind one of the recently advanced "accelerationist"view of the unemployment-inflation relationship. See also Moore (1976).
48. In some cases, such as structures other than Single-family houses, they are indeed nonexistent, and indexes of cost of inputs (material, labor) are used instead as poor substitutes. Thepresence of a serious secular upward bias in the official price indexes is suggested in Robert]. Gordon's forthcoming study for NBER on the measurement of durable goods prices.
49. A comparison of output of capital equipment as measured in the industrial production index with deflated expenditures on capital equipment as measured in the national incomeaccounts shows an unusual divergence in 1974-1975, with deflated expenditures beginningto decline two quarters earlier and beginning to rise one quarter later than output, with atotal decline of 20 percent in expenditures and 13 percent in output. This suggests overdeflation of expenditures, but does not prove it. See Capital Goods Review (Machinery andAllied Products Institute), no. 104, October 1976.
50. In 1963 the Census Bureau introduced an index of sales prices for Single-family houses,which was a major improvement, and a further advance was made recently through thejoint development by BEA and Census of new prices indexes for structures. (For details onthe new measures, see "Revised Deflators for New Construction, 1947-63," Survey of Cur
rent Business, August 1974, pp. 18-27.) Still, for most types of construction the deflatorsmust be based on inadequate input price indexes.•
51. In 1962 a study by the u.s. Bureau of the Budget demonstrated that useful productivitymeasures could be developed for many activities of U.s. government organizations. In 1973the Office of Management and Budget decided that work to measure federal productivityshould continue, as a responsibility of the Bureau of labor Statistics. By 1974, about 1.7 million man-years, or 61 percent, of federal civilian government employment were covered bythe output per man-year measures developed for some two hundred organizational unitsgrouped into sixteen functional areas. Productivity for the to,al measured sample rose at anaverage annual rate of 1.6 percent a year during fiscal years 1967-1973. For the 96 annualchanges recorded for the sixteen groups, 66 were increases and 29 decreases in productivity (1 was unchanged). Most of the declines occurred in fiscal 1970, 1972, and 1973, with noapparent relation to the business cycle. See Ardolini and Hohenstein (1974).
52. For example, it is widely believed that in recent years real prices of land and raw materialsincreased more than real wag]s. The overall relationship between input and output prices inconstruction during 1973-1976 is very hard to assess, partly because of weaknesses in theavailable data. To cite just one ambiguous comparison, construction cost indexes (Department of Commerce composite) rose somewhat faster than the implicit price deflators forpurchases of residential structures in 1973-1975, but somewhat slower than the deflatorsfor nonresidential structures.
53. Under the FIFO method, the cost of goods sold (withdrawals from the stock) is computed atthe acquisition cost of those goods that have been in inventory the longest time. The LIFOmethod values the withdrawals at cost of the goods that have been in inventory the shortest time. Thus, the remaining inventory entered on the balance sheet is valued under FIFO atthe cost of the recently acquired items, under LIFO at the cost of the earlier acquired items.(The valuation of acquisitions is at current purchase price in either method.) Other methodsof inventory accounting yield intermediate results, but they are less important and may beignored here. For further explanations, see Rottenberg (1974, pp. 29-33, 58-61) and Shovenand Bulow (1975).
54. The present estimate of IVA in 1974 is a negative $38.5 billion. (IVA is negative when pricesincrease, positive when prices fall.) To appreciate this magnitude, note that before-tax
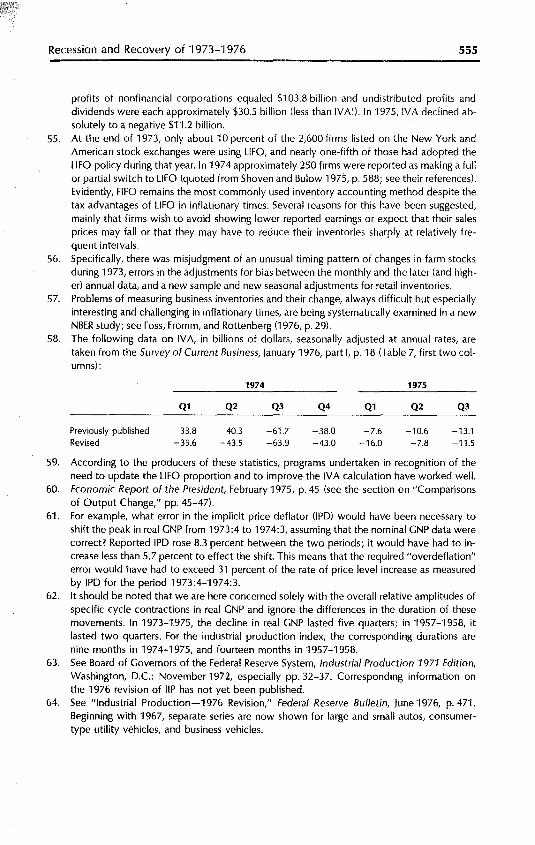
Recession and Recovery of 1973-1976 555
profits of nonfinancial corporations equaled $103.8 billion and undistributed profits anddividends were each approximately $30.5 billion (less than IVA!). In 1975, IVA declined absolutely to a negative $11.2 billion.
55. At the end of 1973, only about 10 percent of the 2,600 firms listed on the New York andAmerican stock exchanges were· using LIFO, and nearly one-fifth of those had adopted theLIFO policy during that year. In 1974 approximately 250 firms were reported as making a fullor partial switch to LIFO (quoted from Shoven and Bulow 1975, p. 588; see their references).Evidently, FIFO remains the most commonly used inventory accounting method despite thetax advantages of LIFO in inflationary times. Several reasons for this have been suggested,mainly that firms wish to avoid showing lower reported earnings or expect that their salesprices may fall or that they may have to reduce their inventories sharply at relatively frequent intervals.
56. Specifically, there was misjudgment of an unusual timing pattern of changes in farm stocksduring 1973, errors in the adjustments for bias between the monthly and the later (and higher) annual data, and a new sample and new seasonal adjustments for retail inventories.
57. Problems of measuring business inventories and their change, always difficult but especiallyinteresting and challenging in inflationary times, are being systematically examined in a newNBER study; see Foss, Fromm, and Rottenberg (1976, p. 29l.
58. The following data on IVA, in billions of dollars, seasonally adjusted at annual rates, aretaken from the Survey of Current Business, January 1976, part I, p. 18 (Table 7, first two columns):
Previously publishedRevised
Q1
-33.8-35.6
Q2
-40.3-43.5
1974
Q3
-61.7-63.9
Q4
-38.0-43.0
Q1
-7.6-16.0
1975
Q2
-10.6-7.8
Q3
-13.1-11.5
59. According to the producers of these statistics, programs undertaken in recognition of theneed to update the LIFO proportion and to improve the IVA calculation have worked well.
60. Economic Report of the President, February 1975, p.45 (see the section on "Comparisonsof Output Change," pp.45-47l.
61. For example, what error in the implicit price deflator (IPD) would have been necessary toshift the peak in real GNP from 1973:4 to 1974:3, assuming that the nominal GNP data werecorrect? Reported IPD rose 8.3 percent between the two periods; it would have had to increase less than 5.7 percent to effect the shift. This means that the required "overdeflation"error would have had to exceed 31 percent of the rate of price level increase as measuredby IPD for the period 1973:4-1974:3.
62. It should be noted that we are here concerned solely with the overall relative amplitudes ofspecific cycle contractions in real GNP and ignore the differences in the duration of thesemovements. In 1973-1.975, the decline in real GNP lasted five quarters; in 1957-1958, itlasted two quarters. For the industrial production index, the corresponding durations arenine months in 1974-1975, and fourteen months in 1957-1958.
63. See Board of Governors of the Federal Reserve System, Industrial Production 1971 Edition,Washington, D.C.: November 1972, especially pp.32-37. Corresponding information onthe 1976 revision of liP has not yet been published.
64. See "Industrial Production-1976 Revision," Federal Reserve Bulletin,June 1976, p.471.Beginning with 1967, separate series are now shown for large and small autos, consumertype utility vehicles, and business vehicles.
556
REFERENCES
Victor Zamowitz and Geoffrey H. Moore
Ardolini, Charles, and jeffrey Hohenstein. 1974. "Measuring Productivity in the Federal Government." Monthly Labor Review, November.
Cagan, Phillip. 1956. "The Monetary Dynamics of Hyperinflation." In Milton Friedman, ed.,Studies in the Quantity Theory of Money. Chicago: University of Chicago Press.
Clarkson, Kenneth W., and Roger E. Meiners. 1977. Inflated Unemployment Statistics- The Effectsof Welfare Work Registration Requirements. Coral Gables: University of Miami, School ofLaw, Law and Economics Center.
Cooper, Richard N., and Robert Z. Lawrence. 1975. "The 1972-75 Commodity Boom." BrookingsPapers on Economic Activity, no. 3.
Feldstein, Martin S. 1976. "Temporary Layoffs in the Theory of Unemployment." Journal of Political Economy, October.
___.1975. "The Importance of Temporary Layoffs: An Empirical Analysis." Brookings Paperson Economic Activity, no. 3.
Foss, Murray; Gary Fromm; and Irving Rottenberg. 1976. "Measurement of Business Inventories."56th Annual Report, National Bureau of Economic Research (September).
Frenkel, jacob A. 1975. "Inflation and the Formation of Expectations." Journal of Monetary Economics, October.
Friedman, Milton, and Anna j. Schwartz. 1963. A Monetary History of the United States,1867-1960. Princeton, N.j.: Princeton University Press for NBER.
Gilbert, R. Alton. 1976. "Bank Financing of the Recovery." Federal Reserve Bank of St. LouisReview, july.
Gordon, Robert j. 1976. "Recent Developments in the Theory of Inflation and Unemployment."Journal of Monetary Economics, April.
Hathaway, Dale E. 1974. "Food Prices and Inflation." Brookings Papers on Economic Activity,no. 1.
Herman, Shelby W.; Gerald F. Donahoe; and john C. Hinrichs. 1976. "Manufacturing and Trade Inventories and Sales in Constant Dollars, 1959 to First Quarter 1976." Survey of CurrentBusiness, May.
Hymans, Saul H. 1970. "Consumer Durable Spending: Explanation and Prediction." BrookingsPapers on Economic Activity, no. 2.
jorgenson, Dale W. 1971. "The Economic Impact of Investment Incentives." In Subcommittee onFiscal Policy of the joint Economic Committee, Hearings. 92nd Cong., 1st. sess.
juster, F. Thomas. 1973. "Savings Behavior, Uncertainty, and Price Expectations." The EconomicOutlook for 1974. Ann Arbor: University of Michigan.
juster, F. Thomas, and Lester D. Taylor. 1975. "Towards a Theory of Saving Behavior." AmericanEconomic Review, May.
juster, F. Thomas, and Paul Wachtel. 1972. "Inflation and the Consumer." Brookings Papers onEconomic Activity, no. 1.
Kendall, Maurice G. 1948. Rank Correlation Methods. London: Griffin.Lovell, Michael C. 1975. "Why Was the Consumer Feeling So Sad." Brookings Papers on Econom
ic Activity, no. 2.Mintz, lise. 1970. Dating Postwar Business Cycles: Methods and Their Application to Western
Germany, 1950-67. Occasional Paper 107. New York: NBER.___.1974. "Dating United States Growth Cycles." Explorations in Economic Research, Sum
mer.
Moore, Geoffrey H. 1975. "Slowdowns, Recessions, and Inflation: Some Issues and Answers." Explorations in Economic Research, Spring.
___. 1976. "Employment, Unemployment, and the Inflation-Recession Dilemma." In WilliamFellner, ed., Contemporary Economic Problems. Washington, D.C.: American EnterpriseInstitute.
Recession and Recovery of 1973-1976 557------------------------
Mussa, Michal-l. 1975. "Adaptive and Reg,psslve Expectations in a Rarional Mlld,,1 of the Inf!ationary Process." Journal of Monetar}' tconomin, October.
Okun, Arthur M. 1974. "Unemployment and Output in 1974." Brookings Papers on EconomicAc!ivity, no. 2.
__.197501. "A Postmortem of the 1974 Recession." Brookings Papers on tconomic Activity,no. 1.
--' 1975b. "Inilation: Its Mechanics and Welfare Costs." Brookings Papers on Economic Activi!y, no. 2.
Owen, D. B. 1962. Handbook of Statis!icaf Tdbles. Reading, Mass.: Addison-Wesley.
Poole, William. 1976. "Rational Expectations in the Macro ModeL" Brookings Papers on Economic Activity, no. 2.
Popkin, JoeL 1974. "Commodity Price; and the u.s. Price LeveL" Brookings Papers on tconomicActivity, no. 1.
Roose. Kenneth D. 1954. The ECOnOOli15 of Recession and Revival New Haven: Yale UniversityPress.
Rottenberg. Irving. 1974. "Invi'ntories and the Inventury Villuation Adjustmpnt." BfA Staff PaperNo. 25 (October!.
Rottenberg. Irving. and Gerald Donahoe. 1975. "Improved Deflation oi Producers' DlIfable Equip·ment." Survey of Current Business, lull'.
Ruggles, RIChard. 1977. The Wholesale Price Index: Review and Evaluation. Washington, D.C.: Ex
ecutive Office of the President. Council on Wage and Price Stability.
Sandmo, A. 1970. "The Effen of Uncertainty on SaVing Decisions" Review of Economic Studies,
July.Shoven, John B.. and Jeremy I. Bulow. 1975. "Inflation Accounting and Nonfinancial Corporate
Profits: PhySical Assets." Brookings Papers on Economic Activity, no. 3.
Yang. Jai·Hoon. 1977. "A COJide to Capital Outlays in the Current Recovery." Federal Reserve Bank
of St. louis Ret'iew, February.Young, Allan H. 1974. "The July 1974 Revisions." BEA Staff Paper No. 25 (October).
Wachtel, Paul. 1977. "Survey Measures of Expected Inilation and Their Potential Usefliiness." In
Analysis of Inflation: 1965-1974. Studies in Income and Wealth 42. Cambridge, Mass.:
Ballinger for NBER.Zarnowitz, Victor. 1973. Orders, Production, and Investment -a Cyclical and Structuraf Analysis.
New York: NBER.Zarnowitz, Victor, and Charlotte Boschan. 197501. "Cyclical Indicators." 55th Annual Report. Na
tional Bureau of Economic Research (September).__. 1975b. "Cyclical Indicators: An Evaluation ann New Leading Indexes." Business Condl
lions Digest. May.__. 1975c. New Composite Indexes of Coincident and Lagging ''Idici\tors.'' Business Condi-
tions Digest. November.__.1977. "Cyclical Indicators." 57th Annual Report, National Bureau of Economic Research
(September) .