Embed Size (px)
Citation preview
United States Department of CommerceTechnology AdministrationNational Institute of Standards and Technology
NIST Technical Note 12971994 Edition
Guidelines for Evaluating and Expressingthe Uncertainty of NIST Measurement Results
Barry N. Taylor and Chris E. Kuyatt

NIST Technical Note 12971994 Edition
Guidelines for Evaluating and Expressingthe Uncertainty of NIST Measurement Results
Barry N. Taylor and Chris E. Kuyatt
Physics LaboratoryNational Institute of Standards and TechnologyGaithersburg, MD 20899-0001
(Supersedes NIST Technical Note 1297, January 1993)
September 1994
U.S. Department of CommerceRonald H. Brown, Secretary
Technology AdministrationMary L. Good, Under Secretary for Technology
National Institute of Standards and TechnologyArati Prabhakar, Director
National Institute of Standards andTechnologyTechnical Note 12971994 Edition(Supersedes NIST Technical Note1297, January 1993)Natl. Inst. Stand. Technol.Tech. Note 12971994 Ed.24 pages (September 1994)CODEN: NTNOEF
U.S. Government Printing OfficeWashington: 1994
For sale by the Superintendent ofDocumentsU.S. Government Printing OfficeWashington, DC 20402
Guidelines for Evaluating and Expressing the Uncertainty of NIST Measurement Results
Preface to the 1994 Edition
The previous edition, which was the first, of this National
Institute of Standards and Technology (NIST) Technical
Note (TN 1297) was initially published in January 1993. A
second printing followed shortly thereafter, and in total
some 10 000 copies were distributed to individuals at NIST
and in both the United States at large and abroad — to
metrologists, scientists, engineers, statisticians, and others
who are concerned with measurement and the evaluation
and expression of the uncertainty of the result of a
measurement. On the whole, these individuals gave TN
1297 a very positive reception. We were, of course, pleased
that a document intended as a guide to NIST staff was also
considered to be of significant value to the international
measurement community.
Several of the recipients of the 1993 edition of TN 1297
asked us questions concerning some of the points it
addressed and some it did not. In view of the nature of the
subject of evaluating and expressing measurement
uncertainty and the fact that the principles presented in
TN 1297 are intended to be applicable to a broad range of
measurements, such questions were not at all unexpected.
It soon occurred to us that it might be helpful to the current
and future users of TN 1297 if the most important of these
questions were addressed in a new edition. To this end, we
have added to the 1993 edition of TN 1297 a new appendix
— Appendix D — which attempts to clarify and give
additional guidance on a number of topics, including the use
of certain terms such as accuracy and precision. We hope
that this new appendix will make this 1994 edition of
TN 1297 even more useful than its predecessor.
We also took the opportunity provided us by the preparation
of a new edition of TN 1297 to make very minor word
changes in a few portions of the text. These changes were
made in order to recognize the official publication in
October 1993 of the ISOGuide to the Expression of
Uncertainty in Measurementon which TN 1297 is based
(for example, the reference to theGuidewas updated); and
to bring TN 1297 into full harmony with theGuide (for
example, “estimated correction” has been changed to simply
“correction,” and “can be asserted to lie” has been changed
to “is believed to lie”).
September 1994
Barry N. Taylor
Chris E. Kuyatt
iii
Guidelines for Evaluating and Expressing the Uncertainty of NIST Measurement Results
FOREWORD(to the 1993 Edition)
Results of measurements and conclusions derived from them
constitute much of the technical information produced by
NIST. It is generally agreed that the usefulness of
measurement results, and thus much of the information that
we provide as an institution, is to a large extent determined
by the quality of the statements of uncertainty that
accompany them. For example, only if quantitative and
thoroughly documented statements of uncertainty accompany
the results of NIST calibrations can the users of our
calibration services establish their level of traceability to the
U.S. standards of measurement maintained at NIST.
Although the vast majority of NIST measurement results are
accompanied by quantitative statements of uncertainty, there
has never been a uniform approach at NIST to the expression
of uncertainty. The use of a single approach within the
Institute rather than many different approaches would ensure
the consistency of our outputs, thereby simplifying their
interpretation.
To address this issue, in July 1992 I appointed a NIST Ad
Hoc Committee on Uncertainty Statements and charged it
with recommending to me a NIST policy on this important
topic. The members of the Committee were:
D. C. CranmerMaterials Science and Engineering Laboratory
K. R. EberhardtComputing and Applied Mathematics Laboratory
R. M. JudishElectronics and Electrical Engineering Laboratory
R. A. KamperOffice of the Director, NIST/Boulder Laboratories
C. E. KuyattPhysics Laboratory
J. R. RosenblattComputing and Applied Mathematics Laboratory
J. D. SimmonsTechnology Services
L. E. SmithOffice of the Director, NIST; Chair
D. A. SwytManufacturing Engineering Laboratory
B. N. TaylorPhysics Laboratory
R. L. WattersChemical Science and Technology Laboratory
This action was motivated in part by the emerging
international consensus on the approach to expressing
uncertainty in measurement recommended by the
International Committee for Weights and Measures (CIPM).
The movement toward the international adoption of the CIPM
approach for expressing uncertainty is driven to a large
extent by the global economy and marketplace; its worldwide
use will allow measurements performed in different countries
and in sectors as diverse as science, engineering, commerce,
industry, and regulation to be more easily understood,
interpreted, and compared.
At my request, the Ad Hoc Committee carefully reviewed the
needs of NIST customers regarding statements of uncertainty
and the compatibility of those needs with the CIPM
approach. It concluded that the CIPM approach could be used
to provide quantitative expressions of measurement
uncertainty that would satisfy our customers’ requirements.
The Ad Hoc Committee then recommended to me a specific
policy for the implementation of that approach at NIST. I
enthusiastically accepted its recommendation and the policy
has been incorporated in the NIST Administrative Manual. (It
is also included in this Technical Note as Appendix C.)
To assist the NIST staff in putting the policy into practice,
two members of the Ad Hoc Committee prepared this
Technical Note. I believe that it provides a helpful discussion
of the CIPM approach and, with its aid, that the NIST policy
can be implemented without excessive difficulty. Further, I
believe that because NIST statements of uncertainty resulting
from the policy will be uniform among themselves and
consistent with current international practice, the policy will
help our customers increase their competitiveness in the
national and international marketplaces.
January 1993
John W. LyonsDirector,
National Institute of Standards and Technology
iv
Guidelines for Evaluating and Expressing the Uncertainty of NIST Measurement Results
GUIDELINES FOR EVALUATING AND EXPRESSING THEUNCERTAINTY OF NIST MEASUREMENT RESULTS
1. Introduction
1.1 In October 1992, a new policy on expressing
measurement uncertainty was instituted at NIST. This policy
is set forth in “Statements of Uncertainty Associated With
Measurement Results,” Appendix E, NIST Technical
Communications Program, Subchapter 4.09 of the
Administrative Manual (reproduced as Appendix C of these
Guidelines).
1.2 The new NIST policy is based on the approach to
expressing uncertainty in measurement recommended by the
CIPM1 in 1981 [1] and the elaboration of that approach
given in the Guide to the Expression of Uncertainty in
Measurement(hereafter called theGuide), which was
prepared by individuals nominated by the BIPM, IEC, ISO,
or OIML [2].1 The CIPM approach is founded on
1CIPM: International Committee for Weights and Measures; BIPM:International Bureau of Weights and Measures; IEC: InternationalElectrotechnical Commission; ISO: International Organization forStandardization; OIML: International Organization of Legal Metrology.2These dates have been corrected from those in the first (1993) edition ofTN 1297 and in theGuide.
Recommendation INC-1 (1980) of the Working Group on
the Statement of Uncertainties [3]. This group was convened
in 1980 by the BIPM as a consequence of a 19772 request
by the CIPM that the BIPM study the question of reaching
an international consensus on expressing uncertainty in
measurement. The request was initiated by then CIPM
member and NBS Director E. Ambler. A 19852 request by
the CIPM to ISO asking it to develop a broadly applicable
guidance document based on Recommendation INC-1
(1980) led to the development of theGuide. It is at present
the most complete reference on the general application of
the CIPM approach to expressing measurement uncertainty,
and its development is giving further impetus to the
worldwide adoption of that approach.
1.3 Although theGuiderepresents the current international
view of how to express uncertainty in measurement based
on the CIPM approach, it is a rather lengthy document. We
have therefore prepared this Technical Note with the goal of
succinctly presenting, in the context of the new NIST
policy, those aspects of theGuide that will be of most use
to the NIST staff in implementing that policy. We have also
included some suggestions that are not contained in the
Guideor policy but which we believe are useful.However,
none of the guidance given in this Technical Note is to be
interpreted as NIST policy unless it is directly quoted from
the policy itself. Such cases will be clearly indicated in the
text.
1.4 The guidance given in this Technical Note is intended
to be applicable to most, if not all, NIST measurement
results, including results associated with
– international comparisons of measurement standards,
– basic research,
– applied research and engineering,
– calibrating client measurement standards,
– certifying standard reference materials, and
– generating standard reference data.
Since theGuideitself is intended to be applicable to similar
kinds of measurement results, it may be consulted for
additional details. Classic expositions of the statistical
evaluation of measurement processes are given in references
[4-7].
2. Classification of Components of Uncertainty
2.1 In general, the result of a measurement is only an
approximation or estimate of the value of the specific
quantity subject to measurement, that is, themeasurand,and thus the result is complete only when accompanied by
a quantitative statement of its uncertainty.
2.2 The uncertainty of the result of a measurement
generally consists of several components which, in the
CIPM approach, may be grouped into two categories
according to the method used to estimate their numerical
values:
A. those which are evaluated by statistical methods,
B. those which are evaluated by other means.
2.3 There is not always a simple correspondence between
the classification of uncertainty components into categories
A and B and the commonly used classification of
uncertainty components as “random” and “systematic.” The
nature of an uncertainty component is conditioned by the
use made of the corresponding quantity, that is, on how that
1
Guidelines for Evaluating and Expressing the Uncertainty of NIST Measurement Results
quantity appears in the mathematical model that describes
the measurement process. When the corresponding quantity
is used in a different way, a “random” component may
become a “systematic” component and vice versa. Thus the
terms “random uncertainty” and “systematic uncertainty”
can be misleading when generally applied. An alternative
nomenclature that might be used is
“component of uncertainty arising from a random effect,”
“component of uncertainty arising from a systematic
effect,”
where a random effect is one that gives rise to a possible
random error in thecurrent measurement processand a
systematic effect is one that gives rise to a possible
systematic error in the current measurement process. In
principle, an uncertainty component arising from a
systematic effect may in some cases be evaluated by method
A while in other cases by method B (see subsection 2.2), as
may be an uncertainty component arising from a random
effect.
NOTE – The difference between error and uncertainty should always
be borne in mind. For example, the result of a measurement after
correction (see subsection 5.2) can unknowably be very close to the
unknown value of the measurand, and thus have negligible error, even
though it may have a large uncertainty (see theGuide [2]).
2.4 Basic to the CIPM approach is representing each
component of uncertainty that contributes to the uncertainty
of a measurement result by an estimated standard deviation,
termedstandard uncertainty with suggested symbolui ,
and equal to the positive square root of the estimated
varianceu2i .
2.5 It follows from subsections 2.2 and 2.4 that an
uncertainty component in category A is represented by a
statistically estimated standard deviationsi , equal to the
positive square root of the statistically estimated variances2i ,
and the associated number of degrees of freedomνi . For
such a component the standard uncertainty isui = si .
The evaluation of uncertainty by the statistical analysis of
series of observations is termed aType A evaluation (ofuncertainty).
2.6 In a similar manner, an uncertainty component in
category B is represented by a quantityuj , which may be
considered an approximation to the corresponding standard
deviation; it is equal to the positive square root ofu2j , which
may be considered an approximation to the corresponding
variance and which is obtained from an assumed probability
distribution based on all the available information (see
section 4). Since the quantityu2j is treated like a variance
anduj like a standard deviation, for such a component the
standard uncertainty is simplyuj .
The evaluation of uncertainty by means other than the
statistical analysis of series of observations is termed a
Type B evaluation (of uncertainty).
2.7 Correlations between components (of either category)
are characterized by estimated covariances [see Appendix A,
Eq. (A-3)] or estimated correlation coefficients.
3. Type A Evaluation of Standard Uncertainty
A Type A evaluation of standard uncertainty may be based
on any valid statistical method for treating data. Examples
are calculating the standard deviation of the mean of a
series of independent observations [see Appendix A, Eq. (A-
5)]; using the method of least squares to fit a curve to data
in order to estimate the parameters of the curve and their
standard deviations; and carrying out an analysis of variance
(ANOVA) in order to identify and quantify random effects
in certain kinds of measurements. If the measurement
situation is especially complicated, one should consider
obtaining the guidance of a statistician. The NIST staff can
consult and collaborate in the development of statistical
experiment designs, analysis of data, and other aspects of
the evaluation of measurements with the Statistical
Engineering Division, Computing and Applied Mathematics
Laboratory. Inasmuch as this Technical Note does not
attempt to give detailed statistical techniques for carrying
out Type A evaluations, references [4-7], and reference [8]
in which a general approach to quality control of
measurement systems is set forth, should be consulted for
basic principles and additional references.
4. Type B Evaluation of Standard Uncertainty
4.1 A Type B evaluation of standard uncertainty is usually
based on scientific judgment using all the relevant
information available, which may include
– previous measurement data,
– experience with, or general knowledge of, the
behavior and property of relevant materials and
instruments,
– manufacturer’s specifications,
– data provided in calibration and other reports, and
– uncertainties assigned to reference data taken from
handbooks.
2
Guidelines for Evaluating and Expressing the Uncertainty of NIST Measurement Results
Some examples of Type B evaluations are given in
subsections 4.2 to 4.6.
4.2 Convert a quoted uncertainty that is a stated multiple
of an estimated standard deviation to a standard uncertainty
by dividing the quoted uncertainty by the multiplier.
4.3 Convert a quoted uncertainty that defines a
“confidence interval” having a stated level of confidence
(see subsection 5.5), such as 95 or 99 percent, to a standard
uncertainty by treating the quoted uncertainty as if a normal
distribution had been used to calculate it (unless otherwise
indicated) and dividing it by the appropriate factor for such
a distribution. These factors are 1.960 and 2.576 for the two
levels of confidence given (see also the last line of Table
B.1 of Appendix B).
4.4 Model the quantity in question by a normal
distribution and estimate lower and upper limitsa anda+such that the best estimated value of the quantity is
(a+ + a )/2 (i.e., the center of the limits) and there is 1
chance out of 2 (i.e., a 50 percent probability) that the value
of the quantity lies in the intervala to a+. Thenuj ≈ 1.48a,
wherea = (a+ a )/2 is the half-width of the interval.
4.5 Model the quantity in question by a normal
distribution and estimate lower and upper limitsa anda+such that the best estimated value of the quantity is
(a+ + a )/2 and there is about a 2 out of 3 chance (i.e., a 67
percent probability) that the value of the quantity lies in the
interval a to a+. Thenuj ≈ a, wherea = (a+ a )/2.
4.6 Estimate lower and upper limitsa and a+ for the
value of the quantity in question such that the probability
that the value lies in the intervala to a+ is, for all practical
purposes, 100 percent. Provided that there is no
contradictory information, treat the quantity as if it is
equally probable for its value to lie anywhere within the
interval a to a+; that is, model it by a uniform or
rectangular probability distribution. The best estimate of the
value of the quantity is then (a+ + a )/2 with uj = a/√3,
wherea = (a+ a )/2.
If the distribution used to model the quantity is triangular
rather than rectangular, thenuj = a/√6.
If the quantity in question is modeled by a normal
distribution as in subsections 4.4 and 4.5, there are no finite
limits that will contain 100 percent of its possible values.
However, plus and minus 3 standard deviations about the
mean of a normal distribution corresponds to 99.73 percent
limits. Thus, if the limits a and a+ of a normally
distributed quantity with mean (a+ + a )/2 are considered to
contain “almost all” of the possible values of the quantity,
that is, approximately 99.73 percent of them, thenuj ≈ a/3,
wherea = (a+ a )/2.
The rectangular distribution is a reasonable default model in
the absence of any other information. But if it is known that
values of the quantity in question near the center of the
limits are more likely than values close to the limits, a
triangular or a normal distribution may be a better model.
4.7 Because the reliability of evaluations of components
of uncertainty depends on the quality of the information
available, it is recommended that all parameters upon which
the measurand depends be varied to the fullest extent
practicable so that the evaluations are based as much as
possible on observed data. Whenever feasible, the use of
empirical models of the measurement process founded on
long-term quantitative data, and the use of check standards
and control charts that can indicate if a measurement
process is under statistical control, should be part of the
effort to obtain reliable evaluations of components of
uncertainty [8]. Type A evaluations of uncertainty based on
limited data are not necessarily more reliable than soundly
based Type B evaluations.
5. Combined Standard Uncertainty
5.1 The combined standard uncertainty of a measure-
ment result, suggested symboluc, is taken to represent the
estimated standard deviation of the result. It is obtained by
combining the individual standard uncertaintiesui (and
covariances as appropriate), whether arising from a Type A
evaluation or a Type B evaluation, using the usual method
for combining standard deviations. This method, which is
summarized in Appendix A [Eq. (A-3)], is often called the
law of propagation of uncertaintyand in common parlance
the “root-sum-of-squares” (square root of the sum-of-the-
squares) or “RSS” method of combining uncertainty
components estimated as standard deviations.
NOTE – The NIST policy also allows the use of established and
documented methods equivalent to the “RSS” method, such as the
numerically based “bootstrap” (see Appendix C).
5.2 It is assumed that a correction (or correction factor) is
applied to compensate for each recognized systematic effect
that significantly influences the measurement result and that
every effort has been made to identify such effects. The
relevant uncertainty to associate with each recognized
systematic effect is then the standard uncertainty of the
applied correction. The correction may be either positive,
negative, or zero, and its standard uncertainty may in some
3

Guidelines for Evaluating and Expressing the Uncertainty of NIST Measurement Results
cases be obtained from a Type A evaluation while in other
cases by a Type B evaluation.
NOTES
1 The uncertainty of a correction applied to a measurement result to
compensate for a systematic effect is not the systematic error in the
measurement result due to the effect. Rather, it is a measure of the
uncertainty of the result due to incomplete knowledge of the required
value of the correction. The terms “error” and “uncertainty” should not
be confused (see also the note of subsection 2.3).
2 Although it is strongly recommended that corrections be applied for
all recognized significant systematic effects, in some cases it may not
be practical because of limited resources. Nevertheless, the expression
of uncertainty in such cases should conform with these guidelines to
the fullest possible extent (see theGuide [2]).
5.3 The combined standard uncertaintyuc is a widely
employed measure of uncertainty. The NIST policy on
expressing uncertainty states that (see Appendix C):
Commonly, uc is used for reporting results of
determinations of fundamental constants, fundamental
metrological research, and international comparisons
of realizations of SI units.
Expressing the uncertainty of NIST’s primary cesium
frequency standard as an estimated standard deviation is an
example of the use ofuc in fundamental metrological
research. It should also be noted that in a 1986
recommendation [9], the CIPM requested that what is now
termed combined standard uncertaintyuc be used “by all
participants in giving the results of all international
comparisons or other work done under the auspices of the
CIPM and Comités Consultatifs.”
5.4 In many practical measurement situations, the
probability distribution characterized by the measurement
result y and its combined standard uncertaintyuc(y) is
approximately normal (Gaussian). When this is the case and
uc(y) itself has negligible uncertainty (see Appendix B),
uc(y) defines an intervaly uc(y) to y + uc(y) about the
measurement resulty within which the value of the
measurandY estimated byy is believed to lie with a level
of confidence of approximately 68 percent. That is, it is
believed with an approximate level of confidence of 68
percent thaty uc(y) ≤ Y ≤ y + uc(y), which is commonly
written asY = y ± uc(y).
The probability distribution characterized by the
measurement result and its combined standard uncertainty is
approximately normal when the conditions of the Central
Limit Theorem are met. This is the case, often encountered
in practice, when the estimatey of the measurandY is not
determined directly but is obtained from the estimated
values of a significant number of other quantities [see
Appendix A, Eq. (A-1)] describable by well-behaved
probability distributions, such as the normal and rectangular
distributions; the standard uncertainties of the estimates of
these quantities contribute comparable amounts to the
combined standard uncertaintyuc(y) of the measurement
resulty; and the linear approximation implied by Eq. (A-3)
in Appendix A is adequate.
NOTE – If uc( y) has non-negligible uncertainty, the level of confidence
will differ from 68 percent. The procedure given in Appendix B has
been proposed as a simple expedient for approximating the level of
confidence in these cases.
5.5 The term “confidence interval” has a specific
definition in statistics and is only applicable to intervals
based onuc when certain conditions are met, including that
all components of uncertainty that contribute touc be
obtained from Type A evaluations. Thus, in these
guidelines, an interval based onuc is viewed as
encompassing a fractionp of the probability distribution
characterized by the measurement result and its combined
standard uncertainty, andp is the coverage probabilityor
level of confidenceof the interval.
6. Expanded Uncertainty
6.1 Although the combined standard uncertaintyuc is used
to express the uncertainty of many NIST measurement
results, for some commercial, industrial, and regulatory
applications of NIST results (e.g., when health and safety
are concerned), what is often required is a measure of
uncertainty that defines an interval about the measurement
result y within which the value of the measurandY is
confidently believed to lie. The measure of uncertainty
intended to meet this requirement is termedexpandeduncertainty, suggested symbolU, and is obtained by
multiplying uc(y) by a coverage factor, suggested symbol
k. Thus U = kuc(y) and it is confidently believed that
y U ≤ Y ≤ y + U, which is commonly written as
Y = y ± U.
It is to be understood that subsection 5.5 also applies to the
interval defined by expanded uncertaintyU.
6.2 In general, the value of the coverage factork is
chosen on the basis of the desired level of confidence to be
associated with the interval defined byU = kuc. Typically,
k is in the range 2 to 3. When the normal distribution
applies anduc has negligible uncertainty (see subsection
5.4),U = 2uc (i.e., k = 2) defines an interval having a level
of confidence of approximately 95 percent, andU = 3uc
4
Guidelines for Evaluating and Expressing the Uncertainty of NIST Measurement Results
(i.e., k = 3) defines an interval having a level of confidence
greater than 99 percent.
NOTE – For a quantityz described by a normal distribution with
expectation µz and standard deviationσ, the interval µz ± kσencompasses 68.27, 90, 95.45, 99, and 99.73 percent of the distribution
for k = 1, k = 1.645,k = 2, k = 2.576, andk = 3, respectively (see the
last line of Table B.1 of Appendix B).
6.3 Ideally, one would like to be able to choose a specific
value ofk that produces an interval corresponding to a well-
defined level of confidencep, such as 95 or 99 percent;
equivalently, for a given value ofk, one would like to be
able to state unequivocally the level of confidence
associated with that interval. This is difficult to do in
practice because it requires knowing in considerable detail
the probability distribution of each quantity upon which the
measurand depends and combining those distributions to
obtain the distribution of the measurand.
NOTE – The more thorough the investigation of the possible existence
of non-trivial systematic effects and the more complete the data upon
which the estimates of the corrections for such effects are based, the
closer one can get to this ideal (see subsections 4.7 and 5.2).
6.4 The CIPM approach does not specify how the relation
betweenk and p is to be established. TheGuide [2] and
Dietrich [10] give an approximate solution to this problem
(see Appendix B); it is possible to implement others which
also approximate the result of combining the probability
distributions assumed for each quantity upon which the
measurand depends, for example, solutions based on
numerical methods.
6.5 In light of the discussion of subsections 6.1- 6.4, and
in keeping with the practice adopted by other national
standards laboratories and several metrological
organizations, the stated NIST policy is (see Appendix C):
Use expanded uncertaintyU to report the results of all
NIST measurements other than those for whichuc has
traditionally been employed. To be consistent with
current international practice, the value ofk to be
used at NIST for calculatingU is, by convention,
k = 2. Values ofk other than 2 are only to be used for
specific applications dictated by established and
documented requirements.
An example of the use of a value ofk other than 2 is taking
k equal to at-factor obtained from thet-distribution whenuchas low degrees of freedom in order to meet the dictated
requirement of providing a value ofU = kuc that defines an
interval having a level of confidence close to 95 percent.
(See Appendix B for a discussion of how a value ofk that
produces such a value ofU might be approximated.)
6.6 The NIST policy provides for exceptions as follows
(see Appendix C):
It is understood that any valid statistical method that
is technically justified under the existing
circumstances may be used to determine the
equivalent ofui , uc, or U. Further, it is recognized
that international, national, or contractual agreements
to which NIST is a party may occasionally require
deviation from NIST policy. In both cases, the report
of uncertainty must document what was done and
why.
7. Reporting Uncertainty
7.1 The stated NIST policy regarding reporting
uncertainty is (see Appendix C):
ReportU together with the coverage factork used to
obtain it, or reportuc.
When reporting a measurement result and its
uncertainty, include the following information in the
report itself or by referring to a published document:
– A list of all components of standard uncertainty,
together with their degrees of freedom where
appropriate, and the resulting value ofuc. The
components should be identified according to the
method used to estimate their numerical values:
A. those which are evaluated by statistical
methods,
B. those which are evaluated by other
means.
– A detailed description of how each component of
standard uncertainty was evaluated.
– A description of howk was chosen whenk is not
taken equal to 2.
It is often desirable to provide a probability
interpretation, such as a level of confidence, for the
interval defined byU or uc. When this is done, the
basis for such a statement must be given.
7.2 The NIST requirement that a full description of what
was done be given is in keeping with the generally accepted
view that when reporting a measurement result and its
uncertainty, it is preferable to err on the side of providing
5
Guidelines for Evaluating and Expressing the Uncertainty of NIST Measurement Results
too much information rather than too little. However, when
such details are provided to the users of NIST measurement
results by referring to published documents, which is often
the case when such results are given in calibration and test
reports and certificates, it is imperative that the referenced
documents be kept up-to-date so that they are consistent
with the measurement process in current use.
7.3 The last paragraph of the NIST policy on reporting
uncertainty (see subsection 7.1 above) refers to the
desirability of providing a probability interpretation, such as
a level of confidence, for the interval defined byU or uc.
The following examples show how this might be done when
the numerical result of a measurement and its assigned
uncertainty is reported, assuming that the published detailed
description of the measurement provides a sound basis for
the statements made. (In each of the three cases, the
quantity whose value is being reported is assumed to be a
nominal 100 g standard of massms.)
ms = (100.021 47 ± 0.000 70) g, where the number
following the symbol ± is the numerical value of an
expanded uncertaintyU = kuc, with U determined from
a combined standard uncertainty (i.e., estimated standard
deviation) uc = 0.35 mg and a coverage factork = 2.
Since it can be assumed that the possible estimated
values of the standard are approximately normally
distributed with approximate standard deviationuc, the
unknown value of the standard is believed to lie in the
interval defined byU with a level of confidence of
approximately 95 percent.
ms = (100.021 47 ± 0.000 79) g, where the number
following the symbol ± is the numerical value of an
expanded uncertaintyU = kuc, with U determined from
a combined standard uncertainty (i.e., estimated standard
deviation)uc = 0.35 mg and a coverage factork = 2.26
based on thet-distribution forν = 9 degrees of freedom,
and defines an interval within which the unknown value
of the standard is believed to lie with a level of
confidence of approximately 95 percent.
ms = 100.021 47 g with a combined standard uncertainty
(i.e., estimated standard deviation) ofuc = 0.35 mg.
Since it can be assumed that the possible estimated
values of the standard are approximately normally
distributed with approximate standard deviationuc, the
unknown value of the standard is believed to lie in the
interval ms ± uc with a level of confidence of
approximately 68 percent.
When providing such probability interpretations of the
intervals defined byU and uc, subsection 5.5 should be
recalled. In this regard, the interval defined byU in the
second example might be a conventional confidence interval
(at least approximately) if all the components of uncertainty
are obtained from Type A evaluations.
7.4 Some users of NIST measurement results may
automatically interpretU = 2uc and uc as quantities that
define intervals having levels of confidence corresponding
to those of a normal distribution, namely, 95 percent and 68
percent, respectively. Thus, when reporting eitherU = 2ucor uc, if it is known that the interval whichU = 2uc or ucdefines has a level of confidence that differs significantly
from 95 percent or 68 percent, it should be so stated as an
aid to the users of the measurement result. In keeping with
the NIST policy quoted in subsection 6.5, when the measure
of uncertainty is expanded uncertaintyU, one may use a
value of k that does lead to a value ofU that defines an
interval having a level of confidence of 95 percent if such
a value ofU is necessary for a specific application dictated
by an established and documented requirement.
7.5 In general, it is not possible to know in detail all of
the uses to which a particular NIST measurement result will
be put. Thus, it is usually inappropriate to include in the
uncertainty reported for a NIST result any component that
arises from a NIST assessment of how the result might be
employed; the quoted uncertainty should normally be the
actual uncertainty obtained at NIST.
7.6 It follows from subsection 7.5 that for standards sent
by customers to NIST for calibration, the quoted uncertainty
should not normally include estimates of the uncertainties
that may be introduced by the return of the standard to the
customer’s laboratory or by its use there as a reference
standard for other measurements. Such uncertainties are due,
for example, to effects arising from transportation of the
standard to the customer’s laboratory, including mechanical
damage; the passage of time; and differences between the
environmental conditions at the customer’s laboratory and
at NIST. A caution may be added to the reported
uncertainty if any such effects are likely to be significant
and an additional uncertainty for them may be estimated and
quoted. If, for the convenience of the customer, this
additional uncertainty is combined with the uncertainty
obtained at NIST, a clear statement should be included
explaining that this has been done.
Such considerations are also relevant to the uncertainties
assigned to certified devices and materials sold by NIST.
However, well-justified, normal NIST practices, such as
including a component of uncertainty to account for the
instability of the device or material when it is known to be
6

Guidelines for Evaluating and Expressing the Uncertainty of NIST Measurement Results
significant, are clearly necessary if the assigned uncertainties
are to be meaningful.
8. References
[1] CIPM, BIPM Proc.-Verb. Com. Int. Poids et Mesures
49, 8-9, 26 (1981) (in French); P. Giacomo, “News
from the BIPM,” Metrologia 18, 41-44 (1982).
[2] ISO, Guide to the Expression of Uncertainty in
Measurement (International Organization for
Standardization, Geneva, Switzerland, 1993). This
Guide was prepared by ISO Technical Advisory
Group 4 (TAG 4), Working Group 3 (WG 3).
ISO/TAG 4 has as its sponsors the BIPM, IEC, IFCC
(International Federation of Clinical Chemistry), ISO,
IUPAC (International Union of Pure and Applied
Chemistry), IUPAP (International Union of Pure and
Applied Physics), and OIML. Although the individual
members of WG 3 were nominated by the BIPM,
IEC, ISO, or OIML, theGuideis published by ISO in
the name of all seven organizations. NIST staff
members may obtain a single copy of theGuidefrom
the NIST Calibration Program.
[3] R. Kaarls, “Rapport du Groupe de Travail sur
l’Expression des Incertitudes au Comité International
des Poids et Mesures,”Proc.-Verb. Com. Int. Poids et
Mesures49, A1-A12 (1981) (in French); P. Giacomo,
“News from the BIPM,”Metrologia17, 69-74 (1981).
(Note that the final English-language version of
Recommendation INC-1 (1980), published in an
internal BIPM report, differs slightly from that given
in the latter reference but is consistent with the
authoritative French-language version given in the
former reference.)
[4] C. Eisenhart, “Realistic Evaluation of the Precision
and Accuracy of Instrument Calibration Systems,”J.
Res. Natl. Bur. Stand.(U.S.) 67C, 161-187 (1963).
Reprinted, with corrections, inPrecision Measurement
and Calibration: Statistical Concepts and Procedures,
NBS Special Publication 300, Vol. I, H. H. Ku, Editor
(U.S. Government Printing Office, Washington, DC,
1969), pp. 21-48.
[5] J. Mandel,The Statistical Analysis of Experimental
Data (Interscience-Wiley Publishers, New York, NY,
1964, out of print; corrected and reprinted, Dover
Publishers, New York, NY, 1984).
[6] M. G. Natrella, Experimental Statistics, NBS
Handbook 91 (U.S. Government Printing Office,
Washington, DC, 1963; reprinted October 1966 with
corrections).
[7] G. E. P. Box, W. G. Hunter, and J. S. Hunter,
Statistics for Experimenters(John Wiley & Sons, New
York, NY, 1978).
[8] C. Croarkin,Measurement Assurance Programs, Part
II: Development and Implementation, NBS Special
Publication 676-II (U.S. Government Printing Office,
Washington, DC, 1985).
[9] CIPM, BIPM Proc.-Verb. Com. Int. Poids et Mesures
54, 14, 35 (1986) (in French); P. Giacomo, “News
from the BIPM,” Metrologia 24, 45-51 (1987).
[10] C. F. Dietrich, Uncertainty, Calibration and
Probability, second edition (Adam Hilger, Bristol,
U.K., 1991), chapter 7.
Appendix A
Law of Propagation of Uncertainty
A.1 In many cases a measurandY is not measured
directly, but is determined fromN other quantities
X1, X2, . . . , XN through a functional relationf:
(A-1)Y f (X1, X2 , . . . , XN) .
Included among the quantitiesXi are corrections (or
correction factors) as described in subsection 5.2, as well as
quantities that take into account other sources of variability,
such as different observers, instruments, samples,
laboratories, and times at which observations are made (e.g.,
different days). Thus the functionf of Eq. (A-1) should
express not simply a physical law but a measurement
process, and in particular, it should contain all quantities
that can contribute a significant uncertainty to the
measurement result.
A.2 An estimate of the measurand oroutput quantity Y,
(A-2)y f (x1, x2 , . . . , xN) .
denoted byy, is obtained from Eq. (A-1) usinginput
estimates x1, x2, . . . , xN for the values of theN input
quantities X1, X2, . . . , XN. Thus theoutput estimate y,
which is the result of the measurement, is given by
7
Guidelines for Evaluating and Expressing the Uncertainty of NIST Measurement Results
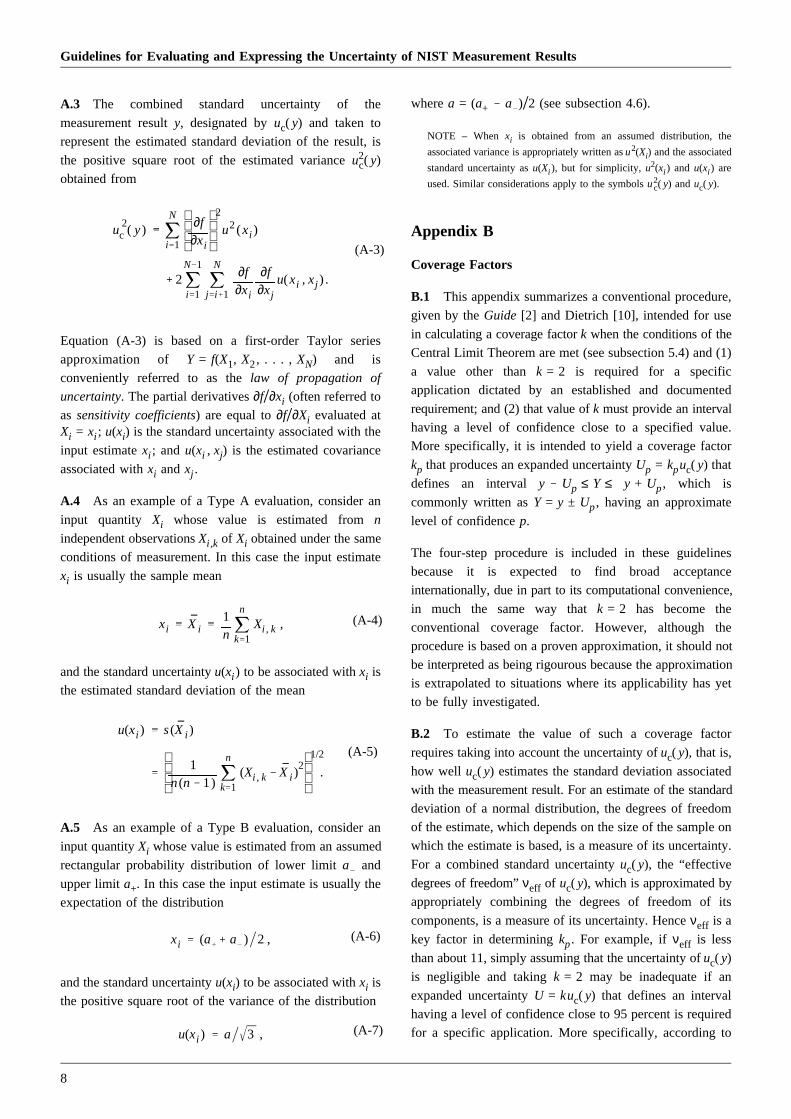
A.3 The combined standard uncertainty of the
measurement resulty, designated byuc( y) and taken to
represent the estimated standard deviation of the result, is
the positive square root of the estimated varianceu2c( y)
obtained from
(A-3)
u2c ( y)
N
i 1
∂f∂xi
2
u2(xi )
2N 1
i 1
N
j i 1
∂f∂xi
∂f∂xj
u(xi , xj ) .
Equation (A-3) is based on a first-order Taylor series
approximation of Y = f(X1, X2, . . . , XN) and is
conveniently referred to as thelaw of propagation of
uncertainty. The partial derivatives∂f/∂xi (often referred to
as sensitivity coefficients) are equal to∂f/∂Xi evaluated atXi = xi ; u(xi) is the standard uncertainty associated with the
input estimatexi ; and u(xi , xj) is the estimated covariance
associated withxi andxj .
A.4 As an example of a Type A evaluation, consider an
input quantity Xi whose value is estimated fromn
independent observationsXi,k of Xi obtained under the same
conditions of measurement. In this case the input estimate
xi is usually the sample mean
(A-4)xi Xi1n
n
k 1Xi , k ,
and the standard uncertaintyu(xi ) to be associated withxi is
the estimated standard deviation of the mean
(A-5)
u(xi ) s(Xi )
1n(n 1)
n
k 1(Xi , k Xi )
21/2
.
A.5 As an example of a Type B evaluation, consider an
input quantityXi whose value is estimated from an assumed
rectangular probability distribution of lower limita and
upper limita+. In this case the input estimate is usually the
expectation of the distribution
(A-6)xi (a a ) 2 ,
and the standard uncertaintyu(xi) to be associated withxi is
(A-7)u(xi ) a 3 ,
the positive square root of the variance of the distribution
wherea = (a+ a )/2 (see subsection 4.6).
NOTE – When xi is obtained from an assumed distribution, the
associated variance is appropriately written asu2(Xi) and the associated
standard uncertainty asu(Xi ), but for simplicity, u2(xi ) and u(xi ) are
used. Similar considerations apply to the symbolsu2c( y) anduc( y).
Appendix B
Coverage Factors
B.1 This appendix summarizes a conventional procedure,
given by theGuide [2] and Dietrich [10], intended for use
in calculating a coverage factork when the conditions of the
Central Limit Theorem are met (see subsection 5.4) and (1)
a value other thank = 2 is required for a specific
application dictated by an established and documented
requirement; and (2) that value ofk must provide an interval
having a level of confidence close to a specified value.
More specifically, it is intended to yield a coverage factor
kp that produces an expanded uncertaintyUp = kpuc( y) that
defines an interval y Up ≤ Y ≤ y + Up, which is
commonly written asY = y ± Up, having an approximate
level of confidencep.
The four-step procedure is included in these guidelines
because it is expected to find broad acceptance
internationally, due in part to its computational convenience,
in much the same way thatk = 2 has become the
conventional coverage factor. However, although the
procedure is based on a proven approximation, it should not
be interpreted as being rigourous because the approximation
is extrapolated to situations where its applicability has yet
to be fully investigated.
B.2 To estimate the value of such a coverage factor
requires taking into account the uncertainty ofuc( y), that is,
how well uc( y) estimates the standard deviation associated
with the measurement result. For an estimate of the standard
deviation of a normal distribution, the degrees of freedom
of the estimate, which depends on the size of the sample on
which the estimate is based, is a measure of its uncertainty.
For a combined standard uncertaintyuc( y), the “effective
degrees of freedom”νeff of uc( y), which is approximated by
appropriately combining the degrees of freedom of its
components, is a measure of its uncertainty. Henceνeff is a
key factor in determiningkp. For example, ifνeff is less
than about 11, simply assuming that the uncertainty ofuc( y)
is negligible and takingk = 2 may be inadequate if an
expanded uncertaintyU = kuc( y) that defines an interval
having a level of confidence close to 95 percent is required
for a specific application. More specifically, according to
8
Guidelines for Evaluating and Expressing the Uncertainty of NIST Measurement Results
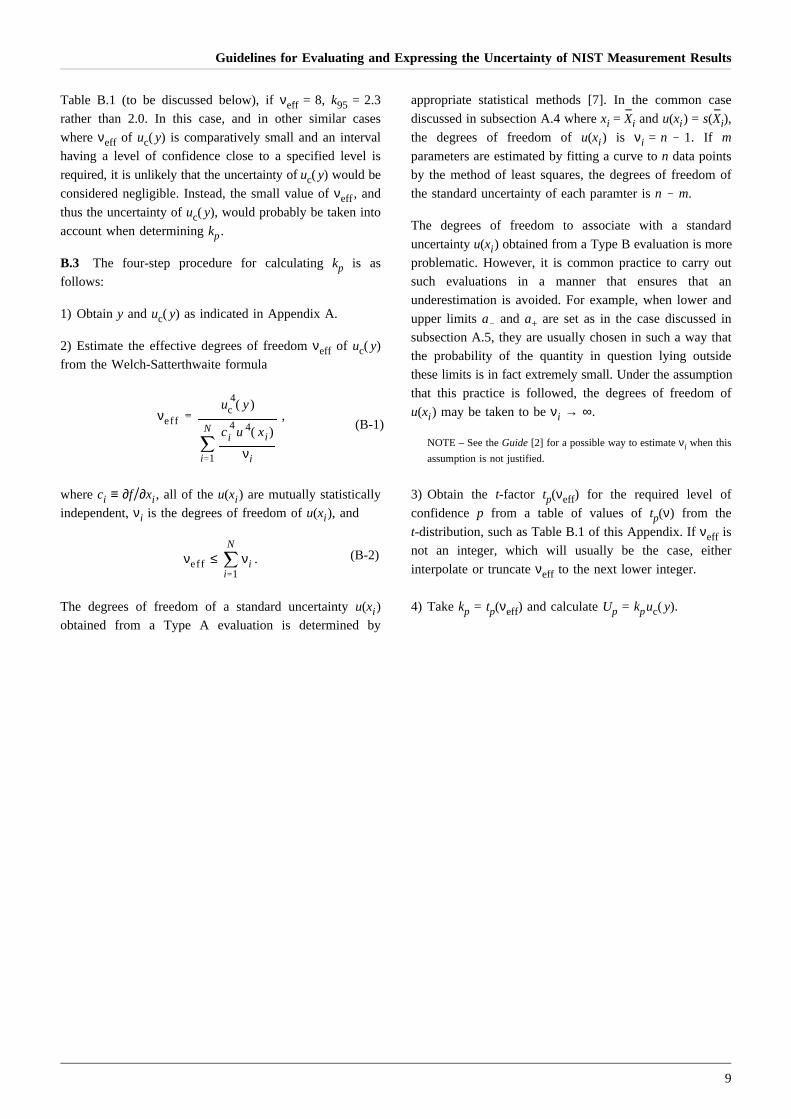
Table B.1 (to be discussed below), ifνeff = 8, k95 = 2.3
rather than 2.0. In this case, and in other similar cases
whereνeff of uc( y) is comparatively small and an interval
having a level of confidence close to a specified level is
required, it is unlikely that the uncertainty ofuc( y) would be
considered negligible. Instead, the small value ofνeff, and
thus the uncertainty ofuc( y), would probably be taken into
account when determiningkp.
B.3 The four-step procedure for calculatingkp is as
follows:
1) Obtainy anduc( y) as indicated in Appendix A.
2) Estimate the effective degrees of freedomνeff of uc( y)
from the Welch-Satterthwaite formula
(B-1)νeff
u4c ( y)
N
i 1
c4i u 4( xi )
νi
,
whereci ≡ ∂f/∂xi , all of theu(xi ) are mutually statistically
independent,νi is the degrees of freedom ofu(xi ), and
(B-2)νeff ≤N
i 1νi .
The degrees of freedom of a standard uncertaintyu(xi )
obtained from a Type A evaluation is determined by
appropriate statistical methods [7]. In the common case
discussed in subsection A.4 wherexi = Xi andu(xi ) = s(Xi),
the degrees of freedom ofu(xi ) is νi = n 1. If m
parameters are estimated by fitting a curve ton data points
by the method of least squares, the degrees of freedom of
the standard uncertainty of each paramter isn m.
The degrees of freedom to associate with a standard
uncertaintyu(xi ) obtained from a Type B evaluation is more
problematic. However, it is common practice to carry out
such evaluations in a manner that ensures that an
underestimation is avoided. For example, when lower and
upper limitsa and a+ are set as in the case discussed in
subsection A.5, they are usually chosen in such a way that
the probability of the quantity in question lying outside
these limits is in fact extremely small. Under the assumption
that this practice is followed, the degrees of freedom of
u(xi ) may be taken to beνi → ∞.
NOTE – See theGuide[2] for a possible way to estimateνi when this
assumption is not justified.
3) Obtain the t-factor tp(νeff) for the required level of
confidencep from a table of values oftp(ν) from the
t-distribution, such as Table B.1 of this Appendix. Ifνeff is
not an integer, which will usually be the case, either
interpolate or truncateνeff to the next lower integer.
4) Takekp = tp(νeff) and calculateUp = kpuc( y).
9

Guidelines for Evaluating and Expressing the Uncertainty of NIST Measurement Results
Table B.1 — Value of tp(ν) from the t-distribution for degrees of freedomν that defines an interval tp(ν) to
+tp(ν) that encompasses the fractionp of the distribution
Degrees offreedom
ν
Fractionp in percent
68.27(a) 90 95 95.45(a) 99 99.73(a)
1 1.84 6.31 12.71 13.97 63.66 235.80
2 1.32 2.92 4.30 4.53 9.92 19.21
3 1.20 2.35 3.18 3.31 5.84 9.22
4 1.14 2.13 2.78 2.87 4.60 6.62
5 1.11 2.02 2.57 2.65 4.03 5.51
6 1.09 1.94 2.45 2.52 3.71 4.90
7 1.08 1.89 2.36 2.43 3.50 4.53
8 1.07 1.86 2.31 2.37 3.36 4.28
9 1.06 1.83 2.26 2.32 3.25 4.09
10 1.05 1.81 2.23 2.28 3.17 3.96
11 1.05 1.80 2.20 2.25 3.11 3.85
12 1.04 1.78 2.18 2.23 3.05 3.76
13 1.04 1.77 2.16 2.21 3.01 3.69
14 1.04 1.76 2.14 2.20 2.98 3.64
15 1.03 1.75 2.13 2.18 2.95 3.59
16 1.03 1.75 2.12 2.17 2.92 3.54
17 1.03 1.74 2.11 2.16 2.90 3.51
18 1.03 1.73 2.10 2.15 2.88 3.48
19 1.03 1.73 2.09 2.14 2.86 3.45
20 1.03 1.72 2.09 2.13 2.85 3.42
25 1.02 1.71 2.06 2.11 2.79 3.33
30 1.02 1.70 2.04 2.09 2.75 3.27
35 1.01 1.70 2.03 2.07 2.72 3.23
40 1.01 1.68 2.02 2.06 2.70 3.20
45 1.01 1.68 2.01 2.06 2.69 3.18
50 1.01 1.68 2.01 2.05 2.68 3.16
100 1.005 1.660 1.984 2.025 2.626 3.077
∞ 1.000 1.645 1.960 2.000 2.576 3.000
(a)For a quantityz described by a normal distribution with expectationµz and standard deviationσ, the
intervalµz ± kσ encompassesp = 68.27, 95.45, and 99.73 percent of the distribution fork = 1, 2, and
3, respectively.
10
Guidelines for Evaluating and Expressing the Uncertainty of NIST Measurement Results
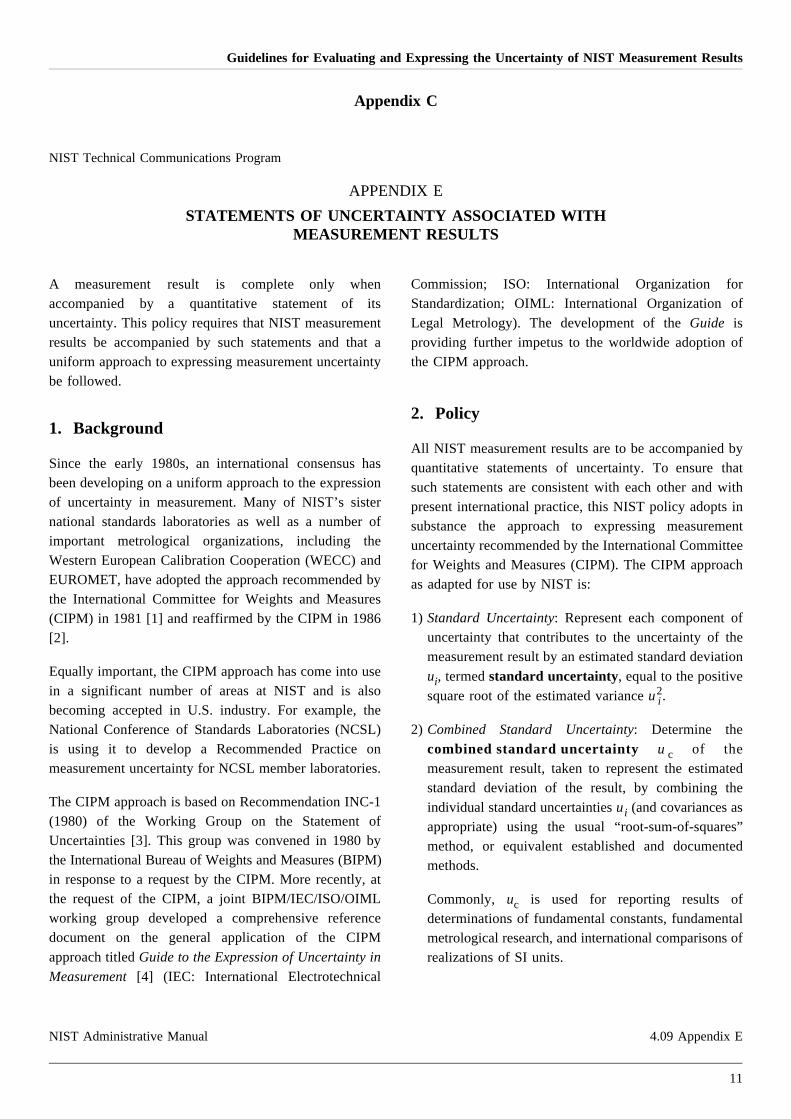
Appendix C
NIST Technical Communications Program
APPENDIX E
STATEMENTS OF UNCERTAINTY ASSOCIATED WITHMEASUREMENT RESULTS
A measurement result is complete only whenaccompanied by a quantitative statement of itsuncertainty. This policy requires that NIST measurementresults be accompanied by such statements and that auniform approach to expressing measurement uncertaintybe followed.
1. Background
Since the early 1980s, an international consensus hasbeen developing on a uniform approach to the expressionof uncertainty in measurement. Many of NIST’s sisternational standards laboratories as well as a number ofimportant metrological organizations, including theWestern European Calibration Cooperation (WECC) andEUROMET, have adopted the approach recommended bythe International Committee for Weights and Measures(CIPM) in 1981 [1] and reaffirmed by the CIPM in 1986[2].
Equally important, the CIPM approach has come into usein a significant number of areas at NIST and is alsobecoming accepted in U.S. industry. For example, theNational Conference of Standards Laboratories (NCSL)is using it to develop a Recommended Practice onmeasurement uncertainty for NCSL member laboratories.
The CIPM approach is based on Recommendation INC-1(1980) of the Working Group on the Statement ofUncertainties [3]. This group was convened in 1980 bythe International Bureau of Weights and Measures (BIPM)in response to a request by the CIPM. More recently, atthe request of the CIPM, a joint BIPM/IEC/ISO/OIMLworking group developed a comprehensive referencedocument on the general application of the CIPMapproach titledGuide to the Expression of Uncertainty in
Measurement[4] (IEC: International Electrotechnical
Commission; ISO: International Organization forStandardization; OIML: International Organization ofLegal Metrology). The development of theGuide isproviding further impetus to the worldwide adoption ofthe CIPM approach.
2. Policy
All NIST measurement results are to be accompanied byquantitative statements of uncertainty. To ensure thatsuch statements are consistent with each other and withpresent international practice, this NIST policy adopts insubstance the approach to expressing measurementuncertainty recommended by the International Committeefor Weights and Measures (CIPM). The CIPM approachas adapted for use by NIST is:
1) Standard Uncertainty: Represent each component ofuncertainty that contributes to the uncertainty of themeasurement result by an estimated standard deviationui, termedstandard uncertainty, equal to the positivesquare root of the estimated varianceu2
i .
2) Combined Standard Uncertainty: Determine thecombined standard uncertainty u c of themeasurement result, taken to represent the estimatedstandard deviation of the result, by combining theindividual standard uncertaintiesui (and covariances asappropriate) using the usual “root-sum-of-squares”method, or equivalent established and documentedmethods.
Commonly, uc is used for reporting results ofdeterminations of fundamental constants, fundamentalmetrological research, and international comparisons ofrealizations of SI units.
NIST Administrative Manual 4.09 Appendix E
11
Guidelines for Evaluating and Expressing the Uncertainty of NIST Measurement Results
NIST Technical Communications Program ii
3) Expanded Uncertainty: Determine an expandeduncertainty U by multiplyinguc by acoverage factork: U = kuc. The purpose ofU is to provide an intervaly U to y + U about the resulty within which thevalue of Y, the specific quantity subject tomeasurement and estimated byy, can be asserted to liewith a high level of confidence. Thus one canconfidently assert thaty U ≤ Y ≤ y + U, which iscommonly written asY = y ± U.
Use expanded uncertaintyU to report the results of allNIST measurements other than those for whichuc hastraditionally been employed. To be consistent withcurrent international practice, the value ofk to beused at NIST for calculatingU is, by convention,k = 2. Values ofk other than 2 are only to be used forspecific applications dictated by established anddocumented requirements.
4) Reporting Uncertainty: Report U together with thecoverage factork used to obtain it, or reportuc.
When reporting a measurement result and itsuncertainty, include the following information in thereport itself or by referring to a published document:
– A list of all components of standard uncertainty,together with their degrees of freedom whereappropriate, and the resulting value ofuc. Thecomponents should be identified according to themethod used to estimate their numerical values:
A. those which are evaluated by statisticalmethods,
B. those which are evaluated by other means.
– A detailed description of how each component ofstandard uncertainty was evaluated.
– A description of howk was chosen whenk is nottaken equal to 2.
It is often desirable to provide a probabilityinterpretation, such as a level of confidence, for theinterval defined byU or uc. When this is done, thebasis for such a statement must be given.
Additional guidance on the use of the CIPM approach atNIST may be found inGuidelines for Evaluating and
Expressing the Uncertainty of NIST Measurement Results[5]. A more detailed discussion of the CIPM approach isgiven in theGuide to the Expression of Uncertainty in
Measurement[4]. Classic expositions of the statisticalevaluation of measurement processes are given inreferences [6-8].
3. Responsibilities
a. Operating Unit Directors are responsible for compliancewith this policy.
b. The Statistical Engineering Division, Computing andApplied Mathematics Laboratory, is responsible forproviding technical advice on statistical methods forevaluating and expressing the uncertainty of NISTmeasurement results.
c. NIST Editorial Review Boards are responsible forensuring that statements of measurement uncertainty areincluded in NIST publications and other technical outputsunder their jurisdiction which report measurement resultsand that such statements are in conformity with thispolicy.
d. The Calibrations Advisory Group is responsible forensuring that calibration and test reports and othertechnical outputs under its jurisdiction are in compliancewith this policy.
e. The Standard Reference Materials and StandardReference Data programs are responsible for ensuring thattechnical outputs under their jurisdiction are incompliance with this policy.
f. Authors, as part of the process of preparingmanuscripts and other technical outputs, are responsiblefor formulating measurement uncertainty statementsconsistent with this policy. These statements must bepresent in drafts submitted for NIST review and approval.
NIST Administrative Manual 4.09 Appendix E
12
Guidelines for Evaluating and Expressing the Uncertainty of NIST Measurement Results
NIST Technical Communications Program iii
4. Exceptions
It is understood that any valid statistical method that istechnically justified under the existing circumstances maybe used to determine the equivalent ofui , uc, or U.Further, it is recognized that international, national, orcontractual agreements to which NIST is a party mayoccasionally require deviation from this policy. In bothcases, the report of uncertainty must document what wasdone and why.
5. References Cited
[1] CIPM, BIPM Proc. Verb. Com. Int. Poids et Mesures
49, 8-9, 26 (1981) (in French); P. Giacomo, “Newsfrom the BIPM,” Metrologia 18, 41-44 (1982).
[2] CIPM, BIPM Proc.-Verb. Com. Int. Poids et Mesures
54, 14, 35 (1986) (in French); P. Giacomo, “Newsfrom the BIPM,” Metrologia 24, 45-51 (1987).
[3] R. Kaarls, “Rapport du Groupe de Travail surl’Expression des Incertitudes au ComitéInternational des Poids et Mesures,”Proc.-Verb.
Com. Int. Poids et Mesures49, A1-A12 (1981) (inFrench); P. Giacomo, “News from the BIPM,”Metrologia 17, 69-74 (1981). (Note that the finalEnglish-language version of Recommendation INC-1 (1980), published in an internal BIPM report,differs slightly from that given in the latterreference but is consistent with the authoritativeFrench-language version given in the formerreference.)
[4] ISO, Guide to the Expression of Uncertainty in
Measurement, prepared by ISO Technical AdvisoryGroup 4 (TAG 4), Working Group 3 (WG 3),
October 1993. ISO/TAG 4 has as its sponsors theBIPM, IEC, IFCC (International Federation ofClinical Chemistry), ISO, IUPAC (InternationalUnion of Pure and Applied Chemistry), IUPAP(International Union of Pure and Applied Physics),and OIML. Although the individual members ofWG 3 were nominated by the BIPM, IEC, ISO, orOIML, the Guide is published by ISO in the nameof all seven organizations. NIST staff members mayobtain a single copy of theGuide from the NISTCalibration Program.
[5] B. N. Taylor and C. E. Kuyatt,Guidelines for
Evaluating and Expressing the Uncertainty of NIST
Measurement Results, NIST Technical Note 1297,prepared under the auspices of the NIST Ad HocCommittee on Uncertainty Statements (U.S.Government Printing Office, Washington, DC,January 1993).
[6] C. Eisenhart, “Realistic Evaluation of the Precisionand Accuracy of Instrument Calibration Systems,”J. Res. Natl. Bur. Stand. (U.S.)67C, 161-187 (1963).Reprinted, with corrections, in Precision
Measurement and Calibration: Statistical Concepts
and Procedures, NBS Special Publication 300, Vol.I, H. H. Ku, Editor (U.S. Government PrintingOffice, Washington, DC, 1969), pp. 21-48.
[7] J. Mandel,The Statistical Analysis of Experimental
Data (Interscience-Wiley Publishers, New York,NY, 1964, out of print; corrected and reprinted,Dover Publishers, New York, NY, 1984).
[8] M. G. Natrella, Experimental Statistics, NBSHandbook 91 (U.S. Government Printing Office,Washington, DC, 1963; reprinted October 1966 withcorrections).
NIST Administrative Manual 4.09 Appendix E
13
Guidelines for Evaluating and Expressing the Uncertainty of NIST Measurement Results
Appendix D
Clarification and Additional Guidance
As indicated in our Preface to this second (1994) edition of
TN 1297, Appendix D has been added to clarify and
provide additional guidance on a number of topics. It was
prepared in response to questions asked since the publication
of the first (1993) edition.
D.1 Terminology
D.1.1 There are a number of terms that are commonly
used in connection with the subject of measurement
uncertainty, such as accuracy of measurement,
reproducibility of results of measurements, and correction.
One can avoid confusion by using such terms in a way that
is consistent with other international documents.
Definitions of many of these terms are given in the
International Vocabulary of Basic and General Terms in
Metrology[D.1], the title of which is commonly abbreviated
VIM. The VIM and theGuidemay be viewed as companion
documents inasmuch as the VIM, like theGuide, was
developed by ISO Technical Advisory Group 4 (TAG 4), in
this case by its Working Group 1 (WG 1); and the VIM,
like the Guide, was published by ISO in the name of the
seven organizations that participate in the work of TAG 4.
Indeed, theGuide contains the VIM definitions of 24
relevant terms. For the convenience of the users of
TN 1297, the definitions of eight of these terms are included
here.
NOTE – In the following definitions, the use of parentheses around
certain words of some terms means that the words may by omitted if
this is unlikely to cause confusion. The VIM identification number for
a particular term is shown in brackets after the term.
D.1.1.1 accuracy of measurement[VIM 3.5]closeness of the agreement between the result of a
measurement and the value of the measurand
NOTES
1 “Accuracy” is a qualitative concept.
2 The termprecision should not be used for “accuracy.”
TN 1297 Comments:
1 The phrase “a true value of the measurand” (or
sometimes simply “a true value”), which is used in the VIM
definition of this and other terms, has been replaced here
and elsewhere with the phrase “the value of the measurand.”
This has been done to reflect the view of theGuide, which
we share, that “a true value of a measurand” is simply the
value of the measurand. (See subclause D.3.5 of theGuide
for further discussion.)
2 Because “accuracy” is a qualitative concept, one should
not use it quantitatively, that is, associate numbers with it;
numbers should be associated with measures of uncertainty
instead. Thus one may write “the standard uncertainty is
2 µΩ” but not “the accuracy is 2 µΩ.”
3 To avoid confusion and the proliferation of undefined,
qualitative terms, we recommend that the word “inaccuracy”
not be used.
4 The VIM does not give a definition for “precision”
because of the many definitions that exist for this word. For
a discussion of precision, see subsection D.1.2.
D.1.1.2 repeatability (of results of measurements)[VIM
3.6]closeness of the agreement between the results of successive
measurements of the same measurand carried out under the
same conditions of measurement
NOTES
1 These conditions are calledrepeatability conditions
2 Repeatability conditions include:
– the same measurement procedure
– the same observer
– the same measuring instrument, used under the same
conditions
– the same location
– repetition over a short period of time.
3 Repeatability may be expressed quantitatively in terms of the
dispersion characteristics of the results.
D.1.1.3 reproducibility (of results of measurements)[VIM 3.7]closeness of the agreement between the results of
measurements of the same measurand carried out under
changed conditions of measurement
NOTES
1 A valid statement of reproducibility requires specification of the
conditions changed.
2 The changed conditions may include:
– principle of measurement
– method of measurement
– observer
14
Guidelines for Evaluating and Expressing the Uncertainty of NIST Measurement Results
– measuring instrument
– reference standard
– location
– conditions of use
– time.
3 Reproducibility may be expressed quantitatively in terms of the
dispersion characteristics of the results.
4 Results are here usually understood to be corrected results.
D.1.1.4 error (of measurement)[VIM 3.10]result of a measurement minus the value of the measurand
NOTES
1 Since the value of the measurand cannot be determined, in practice
a conventional value is [sometimes] used (see [VIM] 1.19 and 1.20).
2 When it is necessary to distinguish “error” from “relative error,” the
former is sometimes calledabsolute error of measurement. This
should not be confused withabsolute value of error, which is the
modulus of the error.
TN 1297 Comments:
1 As pointed out in theGuide, if the result of a
measurement depends on the values of quantities other than
the measurand, the errors of the measured values of these
quantities contribute to the error of the result of the
measurement.
2 In general, the error of measurement is unknown because
the value of the measurand is unknown. However, the
uncertainty of the result of a measurement may be
evaluated.
3 As also pointed out in theGuide, if a device (taken to
include measurement standards, reference materials, etc.) is
tested through a comparison with a known reference
standard and the uncertainties associated with the standard
and the comparison procedure can be assumed to be
negligible relative to the required uncertainty of the test, the
comparison may be viewed as determining the error of the
device.
D.1.1.5 random error [VIM 3.13]result of a measurement minus the mean that would result
from an infinite number of measurements of the same
measurand carried out under repeatability conditions
NOTES
1 Random error is equal to error minus systematic error.
2 Because only a finite number of measurements can be made, it is
possible to determine only an estimate of random error.
TN 1297 Comment:
The concept of random error is also often applied when the
conditions of measurement are changed (see subsection
D.1.1.3). For example, one can conceive of obtaining
measurement results from many different observers while
holding all other conditions constant, and then calculating
the mean of the results as well as an appropriate measure of
their dispersion (e.g., the variance or standard deviation of
the results).
D.1.1.6 systematic error[VIM 3.14]mean that would result from an infinite number of
measurements of the same measurand carried out under
repeatability conditions minus the value of the measurand
NOTES
1 Systematic error is equal to error minus random error.
2 Like the value of the measurand, systematic error and its causes
cannot be completely known.
3 For a measuring instrument, see “bias” ([VIM] 5.25).
TN 1297 Comments:
1 As pointed out in theGuide, the error of the result of a
measurement may often be considered as arising from a
number of random and systematic effects that contribute
individual components of error to the error of the result.
2 Although the term bias is often used as a synonym for
the term systematic error, because systematic error is
defined in a broadly applicable way in the VIM while bias
is defined only in connection with a measuring instrument,
we recommend the use of the term systematic error.
D.1.1.7 correction[VIM 3.15]value added algebraically to the uncorrected result of a
measurement to compensate for systematic error
NOTES
1 The correction is equal to the negative of the estimated systematic
error.
2 Since the systematic error cannot be known perfectly, the
compensation cannot be complete.
D.1.1.8 correction factor [VIM 3.16]numerical factor by which the uncorrected result of a
measurement is multiplied to compensate for systematic
error
15

Guidelines for Evaluating and Expressing the Uncertainty of NIST Measurement Results
NOTE – Since the systematic error cannot be known perfectly, the
compensation cannot be complete.
D.1.2 As indicated in subsection D.1.1.1, TN 1297
comment 4, the VIM does not give a definition for the word
“precision.” However, ISO 3534-1 [D.2] defines precision
to mean “the closeness of agreement between independent
test results obtained under stipulated conditions.” Further, it
views the concept of precision as encompassing both
repeatability and reproducibility (see subsections D.1.1.2 and
D.1.1.3) since it defines repeatability as “precision under
repeatability conditions,” and reproducibility as “precision
under reproducibility conditions.” Nevertheless, precision is
often taken to mean simply repeatability.
The term precision, as well as the terms accuracy,
repeatability, reproducibility, variability, and uncertainty, are
examples of terms that represent qualitative concepts and
thus should be used with care. In particular, it is our strong
recommendation that such terms not be used as synonyms
or labels for quantitative estimates. For example, the
statement “the precision of the measurement results,
expressed as the standard deviation obtained under
repeatability conditions, is 2 µΩ” is acceptable, but the
statement “the precision of the measurement results is 2
µΩ” is not. (See also subsection D.1.1.1, TN 1297 comment
2.)
Although reference [D.2] states that “The measure of
precision is usually expressed in terms of imprecision and
computed as a standard deviation of the test results,” we
recommend that to avoid confusion, the word “imprecision”
not be used; standard deviation and standard uncertainty are
preferred, as appropriate (see subsection D.1.5).
It should also be borne in mind that the NIST policy on
expressing the uncertainty of measurement results normally
requires the use of the terms standard uncertainty, combined
standard uncertainty, expanded uncertainty, or their
“relative” forms (see subsection D.1.4), and the listing of all
components of standard uncertainty. Hence the use of terms
such as accuracy, precision, and bias should normally be as
adjuncts to the required terms and their relationship to the
required terms should be made clear. This situation is
similar to the NIST policy on the use of units that are not
part of the SI: the SI units must be stated first, with the
units that are not part of the SI in parentheses (see
subsection D.6.2).
D.1.3 The designations “A” and “B” apply to the two
distinct methodsby which uncertainty components may be
evaluated. However, for convenience, a standard uncertainty
obtained from a Type A evaluation may be called aType A
standard uncertainty; and a standard uncertainty obtained
from a type B evaluation may be called aType B standard
uncertainty. This means that:
(1) “A” and “B” have nothing to do with the traditional
terms “random” and “systematic”;
(2) there are no “Type A errors” or “Type B errors”; and
(3) “Random uncertainty” (i.e., an uncertainty component
that arises from a random effect) is not a synonym for
Type A standard uncertainty; and “systematic
uncertainty” (i.e., an uncertainty component that arises
from a correction for a systematic error) is not a
synonym for Type B standard uncertainty.
In fact, we recommend that the terms “random uncertainty”
and “systematic uncertainty” be avoided because the
adjectives “random” and “systematic,” while appropriate
modifiers for the word “error,” are not appropriate modifiers
for the word “uncertainty” (one can hardly imagine an
uncertainty component that varies randomly or that is
systematic).
D.1.4 If u(xi) is a standard uncertainty, thenu(xi)/ xi ,
xi≠0, is the correspondingrelative standard uncertainty; if
uc( y) is a combined standard uncertainty, thenuc( y)/ y ,
y≠0, is the correspondingrelative combined standard
uncertainty; and if U=kuc( y) is an expanded uncertainty,
then U/ y , y≠0, is the correspondingrelative expanded
uncertainty. Such relative uncertainties may be readily
indicated by using a subscript “r” for the word “relative.”
Thusur(xi )≡u(xi )/ xi , uc,r( y)≡uc( y)/ y , andUr≡U/ y .
D.1.5 As pointed out in subsection D.1.2, the use of the
terms standard uncertainty, combined standard uncertainty,
expanded uncertainty, or their equivalent “relative” forms
(see subsection D.1.4), is normally required by NIST policy.
Alternate terms should therefore play a subsidiary role in
any NIST publication that reports the result of a
measurement and its uncertainty. However, since it will take
some time before the meanings of these terms become well
known, they should be defined at the beginning of a paper
or when first used. In the latter case, this may be done by
writing, for example, “the standard uncertainty (estimated
standard deviation) isu(R)=2 µΩ”; or “the expanded
uncertainty (coverage factork=2 and thus a two-standard-
deviation estimate) isU=4 µΩ.”
It should also be recognized that, while an estimated
standard deviation that is a component of uncertainty of a
measurement result is properly called a “standard
16
Guidelines for Evaluating and Expressing the Uncertainty of NIST Measurement Results
uncertainty,” not every estimated standard deviation is
necessarily a standard uncertainty.
D.1.6 Words such as “estimated” or “limits of” should
normally not be used to modify “standard uncertainty,”
“combined standard uncertainty,” “expanded uncertainty,”
the “relative” forms of these terms (see subsection D.1.4),
or more generally “uncertainty.” The word “uncertainty,” by
its very nature, implies that the uncertainty of the result of
a measurement is an estimate and generally does not have
well-defined limits.
D.1.7 The phrase “components of uncertainty that
contribute to the uncertainty of the measurement result” can
have two distinct meanings. For example, if the input
estimatesxi are uncorrelated, Eq. (A-3) of Appendix A may
be written as
(D-1)
whereci ≡ ∂f/∂xi andui( y) ≡ ci u(xi).
In Eq. (D-1), both u(xi) and ui( y) can be considered
components of uncertainty of the measurement resulty. This
is because theu(xi) are the standard uncertainties of the
input estimatesxi on which the output estimate or
measurement resulty depends; and theui( y) are the
standard uncertainties of which the combined standard
uncertaintyuc( y) of the measurement resulty is composed.
In short, bothu(xi) andui( y) can be viewed as components
of uncertainty that give rise to the combined standard
uncertaintyuc( y) of the measurement resulty. This implies
that in subsections 2.4 to 2.6, 4.4 to 4.6, and 6.6; in 1) and
2) of section 2 of Appendix C; and in section 4 of Appendix
C, the symbolsui, si, or uj may be viewed as representing
eitheru(xi) or ui( y).
When one gives the components of uncertainty of a result
of a measurement, it is recommended that one also give the
standard uncertaintiesu(xi) of the input estimatesxi, the
sensitivity coefficients ci ≡ ∂f/∂xi, and the standard
uncertaintiesui( y) = ci u(xi) of which the combined
standard uncertaintyuc( y) is composed (so-called standard
uncertainty components of combined standard uncertainty).
D.1.8 The VIM gives the name “experimental standard
deviation of the mean” to the quantitys(Xi) of Eq. (A-5) of
Appendix A of this Technical Note, and the name
“experimental standard deviation” to the quantitys(Xi,k) =
√n s(Xi). We believe that these are convenient, descriptive
terms, and therefore suggest that NIST authors consider
using them.
D.2 Identification of uncertainty components
D.2.1 The NIST policy on expressing measurement
uncertainty states that all components of standard
uncertainty “should be identified according to the method
used to estimate their numerical values: A. those which are
evaluated by statistical methods, B. those which are
evaluated by other means.”
Such identification will usually be readily apparent in the
“detailed description of how each component of standard
uncertainty was evaluated” that is required by the NIST
policy. However, such identification can also be given in a
table which lists the components of standard uncertainty.
Tables D.1 and D.2, which are based on the end-gauge
Table D.1 – Uncertainty Budget:End-Gauge Calibration
Source ofuncertainty
Standarduncertainty
(nm)
Calibration of standard endgauge 25 (B)
Measured difference betweenend gauges:
repeated observations 5.8 (A)
random effects ofcomparator 3.9 (A)
systematic effects ofcomparator 6.7 (B)
Thermal expansion ofstandard end gauge 1.7 (B)
Temperature of test bed:
mean temperature of bed 5.8 (A)
cyclic variation oftemperature of room 10.2 (B)
Difference in expansioncoefficients of end gauges 2.9 (B)
Difference in temperatures ofend gauges 16.6 (B)
Combined standard uncertainty:uc(l ) = 34 nm
17
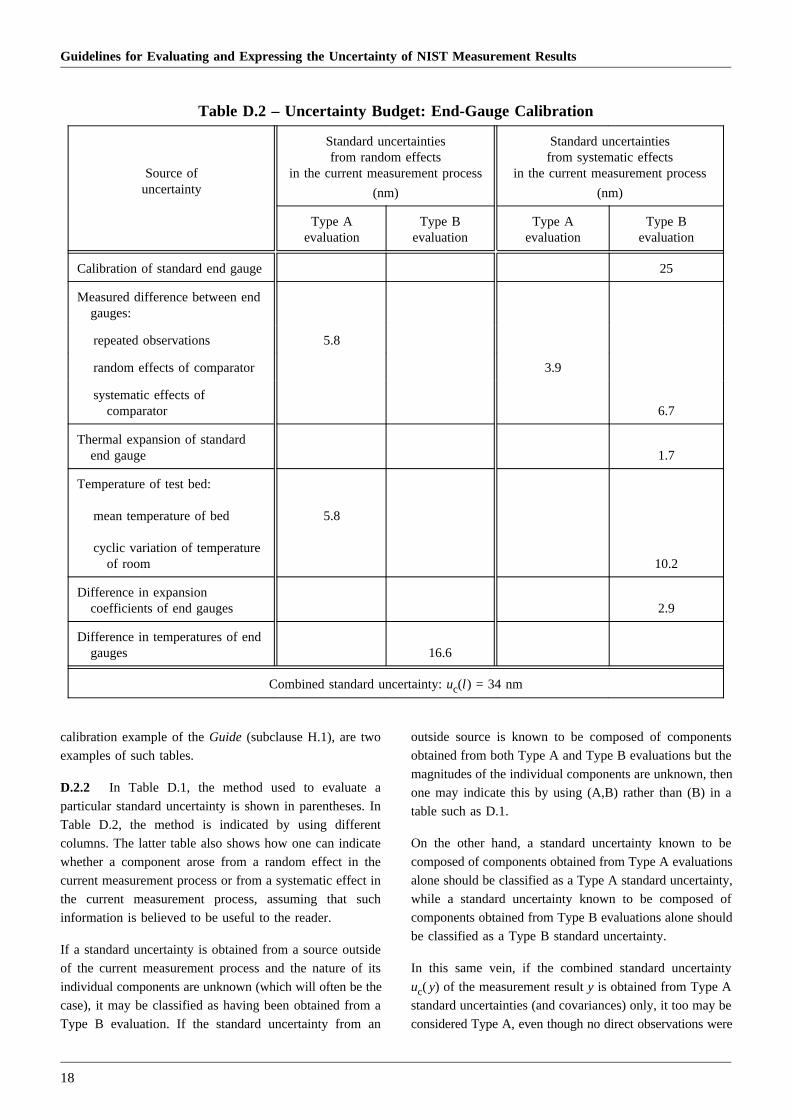
Guidelines for Evaluating and Expressing the Uncertainty of NIST Measurement Results
calibration example of theGuide (subclause H.1), are two
Table D.2 – Uncertainty Budget: End-Gauge Calibration
Source ofuncertainty
Standard uncertaintiesfrom random effects
in the current measurement process
(nm)
Standard uncertaintiesfrom systematic effects
in the current measurement process
(nm)
Type Aevaluation
Type Bevaluation
Type Aevaluation
Type Bevaluation
Calibration of standard end gauge 25
Measured difference between endgauges:
repeated observations 5.8
random effects of comparator 3.9
systematic effects ofcomparator 6.7
Thermal expansion of standardend gauge 1.7
Temperature of test bed:
mean temperature of bed
cyclic variation of temperatureof room
5.8
10.2
Difference in expansioncoefficients of end gauges 2.9
Difference in temperatures of endgauges 16.6
Combined standard uncertainty:uc(l ) = 34 nm
examples of such tables.
D.2.2 In Table D.1, the method used to evaluate a
particular standard uncertainty is shown in parentheses. In
Table D.2, the method is indicated by using different
columns. The latter table also shows how one can indicate
whether a component arose from a random effect in the
current measurement process or from a systematic effect in
the current measurement process, assuming that such
information is believed to be useful to the reader.
If a standard uncertainty is obtained from a source outside
of the current measurement process and the nature of its
individual components are unknown (which will often be the
case), it may be classified as having been obtained from a
Type B evaluation. If the standard uncertainty from an
outside source is known to be composed of components
obtained from both Type A and Type B evaluations but the
magnitudes of the individual components are unknown, then
one may indicate this by using (A,B) rather than (B) in a
table such as D.1.
On the other hand, a standard uncertainty known to be
composed of components obtained from Type A evaluations
alone should be classified as a Type A standard uncertainty,
while a standard uncertainty known to be composed of
components obtained from Type B evaluations alone should
be classified as a Type B standard uncertainty.
In this same vein, if the combined standard uncertainty
uc( y) of the measurement resulty is obtained from Type A
standard uncertainties (and covariances) only, it too may be
considered Type A, even though no direct observations were
18
Guidelines for Evaluating and Expressing the Uncertainty of NIST Measurement Results
made of the measurandY of which the measurement result
y is an estimate. Similarly, if a combined standard
uncertainty is obtained from Type B standard uncertainties
(and covariances) only, it too may be considered Type B.
D.3 Equation (A-2)
D.3.1 In the most general sense, Eq. (A-2) of Appendix
A of this Technical Note,
(A-2)
is a symbolic representation of the procedure (or algorithm)
used to obtain the output estimatey, which is the result of
the measurement, from the individual input estimatesxi. For
example, some of thexi may themselves depend on
additional input estimates:
Or the output estimatey may be expressible simply as
where theCi are corrections, for example, for the operator,
for the ambient temperature, for the laboratory, etc. Some or
all of theCi may be estimated to be near zero based on the
available information, but they can still have standard
uncertainties that are large enough to contribute significantly
to the combined standard uncertainty of the measurement
result and which therefore must be evaluated.
NOTE – In some situations, a correction for a particular effect and its
standard uncertainty are estimated to be negligible relative to the
required combined standard uncertainty of the measurement result, and
for added confidence, an experimental test is carried out that confirms
the estimate but the standard uncertainty of the test result is not
negligible. In such cases, if other evidence indicates that the estimate
is in fact reliable, the standard uncertainty of the test result need not be
included in the uncertainty budget and both the correction and its
standard uncertainty can be taken as negligible.
D.4 Measurand defined by the measurement method;characterization of test methods; simple calibration
D.4.1 The approach to evaluating and expressing the
uncertainty of a measurement result on which the NIST
policy and this Technical Note are based is applicable to
evaluating and expressing the uncertainty of the estimated
value of a measurand that isdefinedby a standard method
of measurement. In this case, the uncertainty depends not
only on the repeatability and reproducibility of the
measurement results (see subsections D.1.1.2 and D.1.1.3),
but also on how well one believes the standard measurement
method has been implemented. (See example H.6 of the
Guide.)
When reporting the estimated value and uncertainty of such
a measurand, one should always make clear that the
measurand is defined by a particular method of
measurement and indicate what that method is. One should
also give the measurand a name which indicates that it is
defined by a measurement method, for example, by adding
a modifier such as “conventional.” (See also subsection
D.6.1)
D.4.2 There are national as well as international standards
that discuss the characterization of test methods by
interlaboratory comparisons. Execution of test methods
according to these standards, both in the characterization
stage and in subsequent measurement programs, often calls
for the expression of uncertainties in terms of defined
measures of repeatability and reproducibility. When NIST
authors participate in such characterization or measurement
programs, NIST policy allows for the results to be expressed
as required by the relevant standards (see Appendix C,
section 4). However, when NIST authors document work
according to such standards, they should consider making
the resulting publication understandable to a broad audience.
This might be achieved in part by giving definitions of the
terms used, perhaps in a footnote. If possible, NIST authors
should relate these terms to those of this Technical Note and
of the Guide.
If a test method is employed at NIST to obtain measurement
results for reasons other than those described above, it is
expected that the uncertainties of these measurement results
will be evaluated and reported according to section 2 of the
NIST policy (see Appendix C). This would be the case, for
example, if measurement results from a characterized test
method are compared to those from a new method of
measurement which has not been characterized by
interlaboratory comparisons.
D.4.3 When an unknown standard is calibrated in terms
of a known reference standard at lower levels of the
measurement hierarchy, the uncertainty of the result of
calibration may have as few as two components: a single
Type A standard uncertainty evaluated from the pooled
experimental standard deviation that characterizes the
calibration process; and a single Type B (or possibly
19

Guidelines for Evaluating and Expressing the Uncertainty of NIST Measurement Results
Type A) standard uncertainty obtained from the calibration
certificate of the known reference standard.
NOTE – The possibility of unsuspected systematic effects in the
calibration process used to calibrate the unknown standard should,
however, not be overlooked.
D.5 tp and the quantile t1 α
D.5.1 As pointed out in theGuide, the t-distribution is
often tabulated in quantiles. That is, values of the quantile
t1 α are given, where 1 α denotes the cumulative
probability and the relation
1 α ⌡⌠
∞
t1–αf (t , ν )dt
defines the quantile, wheref is the probability density
function of t. Thus tp of this Technical Note and of the
Guideandt1 α are related byp 1 2α. For example, the
value of the quantilet0.975, for which 1 α 0.975 and
α 0.025 , is the same astp(ν ) for p 0.95. It should be
noted, however, that in reference [D.2] the symbolp is used
for the cumulative probability 1 α, and the resultingtp(ν)
is called the “quantile of orderp of the t variable withνdegrees of freedom.” Clearly, the values oftp(ν ) defined in
this way differ from the values oftp(ν ) defined as in this
Technical Note and in theGuide, and given in Table B.1
(which is of the same form as that given in reference [10]).
Thus, one must use tables of tabulated values oftp(ν ) with
some care.
D.6 Uncertainty and units of the SI; proper use of theSI and quantity and unit symbols
D.6.1 As pointed out in theGuide, the result of a
measurement is sometimes expressed in terms of the
adopted value of a measurement standard or in terms of a
conventional reference value rather than in terms of the
relevant unit of the SI. (This is an example of a situation in
which all significant components of uncertainty are not
taken into account.) In such cases the magnitude of the
uncertainty ascribable to the measurement result may be
significantly smaller than when that result is expressed in
the relevant SI unit. This practice is not disallowed by the
NIST policy, but it should always be made clear when the
practice is being followed. In addition, one should always
give some indication of the values of the components of
uncertainty not taken into account. The following example
is taken from theGuide. (See also subsection D.4.1.)
EXAMPLE – A high-quality Zener voltage standard is calibrated by
comparison with a Josephson effect voltage reference based on the
conventional value of the Josephson constant recommended for
international use by the CIPM. The relative combined standard
uncertaintyuc(VS )/VS of the calibrated potential differenceVS of the
Zener standard is 2×10⁸ when VS is reported in terms of the
conventional value, butuc(VS )/VS is 4×10 7 when VS is reported in
terms of the SI unit of potential difference, the volt (V), because of the
additional uncertainty associated with the SI value of the Josephson
constant.
D.6.2 NIST Special Publication 811, 1995 Edition [D.3],
gives guidance on the use of the SI and on the rules and
style conventions regarding quantity and unit symbols. In
particular, it elaborates upon the NIST policy regarding the
SI and explains why abbreviations such as ppm and ppb and
terms such as normality and molarity should not be used.
NIST authors should consult NIST SP 811 if they have any
questions concerning the proper way to express the values
of quantities and their uncertainties.
D.7 References
[D.1] ISO, International Vocabulary of Basic and General
Terms in Metrology, second edition (International
Organization for Standardization, Geneva, Switzerland,
1993). This document (abbreviated VIM) was prepared by
ISO Technical Advisory Group 4 (TAG 4), Working Group
1 (WG 1). ISO/TAG 4 has as its sponsors the BIPM, IEC,
IFCC (International Federation of Clinical Chemistry), ISO,
IUPAC (International Union of Pure and Applied
Chemistry), IUPAP (International Union of Pure and
Applied Physics), and OIML. The individual members of
WG 1 were nominated by BIPM, IEC, IFCC, ISO, IUPAC
IUPAP, or OIML, and the document is published by ISO in
the name of all seven organizations. NIST staff members
may obtain a single copy of the VIM from the NIST
Calibration Program.
[D.2] ISO 3534-1:1993,Statistics — Vocabulary and symbols
— Part 1: Probability and general statistical terms
(International Organization for Standardization, Geneva,
Switzerland, 1993).
[D.3] B. N. Taylor, Guide for the Use of the International
System of Units (SI), NIST Special Publication 811, 1995
Edition (U.S. Government Printing Office, Washington, DC,
April 1995).
20