Embed Size (px)
Citation preview
Guidelines for REDD+ Reference Levels: Principles and Recommendations
Prepared for The Government of Norway
Authors
Disclaimer: Any views expressed in this report are those of the authors. They do not necessarily represent the views of the authors’ institutions, Meridian Institute, or the financial sponsors of this report.
ISBN: 978-0-615-56023-6
Date of publication: November 2011
This report is in the public domain. The authors encourage the circulation of this paper as widely as possible. Users are welcome to download, save, or distribute this report electronically or in any other format, including in foreign language translation, without written permission. We do ask that, if you distribute this report, you credit the authors and mention the website www.REDD-OAR.org and not alter the text. An electronic copy of this report is available at www.REDD-OAR.org.
The correct citation for this report is:
Meridian Institute. 2011. “Guidelines for REDD+ Reference Levels: Principles and Recommendations” Prepared for the Government of Norway, by Arild Angelsen, Doug Boucher, Sandra Brown, Valérie Merckx, Charlotte Streck, and Daniel Zarin. Available at www.REDD-OAR.org.
Arild AngelsenProfessor, Norwegian University of Life Sciences & CIFOR
Doug BoucherDirector, Climate Research and Analysis, and Director, Tropical Forest and Climate Initiative, Union of Concerned Scientists
Sandra BrownDirector and Chief Scientist, Ecosystem Services Unit, Winrock International
Valérie MerckxREDD Team Leader, EU REDD Facility, European Forest Institute
Charlotte StreckDirector, Climate Focus
Daniel Zarin (Project Leader)Director of Programs, Climate and Land Use Alliance
Preface
The Government of Norway commissioned the Meridian Institute to facilitate the assessment of a set of proposed options for critical elements of the REDD+ components of a Copenhagen United Nations Framework Convention on Climate Change (UNFCCC) agreement. In December 2008, this assessment led to a consultative and analytical process whose results were summarized in the REDD Options Assessment Report (REDD-OAR) released in April 2009. In July 2009, the Meridian Institute conducted a follow-up assessment in the REDD+ Institutional Options Assessment (REDD+-IOA). Leading to the present report, the Meridian Institute conducted an assessment of technical and procedural issues for modalities for REDD+ Reference Levels (REDD+-RLs) in June 2011. (These reports can be found at www.REDD-OAR.org). These reports were well received and proved helpful to UNFCCC negotiators and other stakeholders.
Looking toward the Conference of the Parties (COP)-17 in Durban, South Africa in December 2011, the Government of Norway commissioned the Meridian Institute to undertake a similar process on the development of modalities for REDD+ reference levels to help support and inform UNFCCC Parties and other stakeholders. Specifically, the Subsidiary Body on Scientific and Technical Advice (SBSTA) has been mandated to develop modalities relating to forest reference emission levels and forest reference levels for consideration at COP-17.
Reference levels (RLs) are an essential component of an international REDD+ incentive framework. RLs establish business-as-usual baselines against which actual emissions are measured, whereby emission reductions are estimated as the difference between RLs and actual emissions. RLs thus provide the basis for measuring REDD+ success.
This report on guidelines for the preparation of REDD+ RLs aims at informing the preparation of RLs by developing-country Parties to the UNFCCC. The assessment was conducted in a similar fashion to the REDD-OAR and REDD+ IOA, that is, through systematic analysis and assessment completed by a diverse and independent group of experts and a facilitated dialogue among UNFCCC negotiators, experts, and other stakeholders.
The Meridian Institute, a nonprofit nongovernmental organization internationally recognized for convening and facilitating neutral and independent dialogues and assessments, in our view, was the ideal facilitator of this process. We are hopeful that the process facilitated by Meridian Institute on Guidelines for the Preparation of REDD+ Reference Levels: Principles and Recommendations can contribute to this important dialogue.
Hans Brattskar Ambassador
Special Envoy on International Climate Change Policy
ii Guidelines for REDD+ Reference Levels: Principles and Recommendations
Executive Summary
This report proposes guidelines for developing REDD+ reference levels (RLs) under the United Nations Framework Convention on Climate Change (UNFCCC).1 It identifies principles that should be adhered to, the steps that must be taken, the data that will be required, and shows how the data can be analyzed to produce scientifically credible estimates of historic GHG emissions and removals from forests, which can then be used to project RLs.
REDD+ RLs will provide the benchmark against which future greenhouse gas (GHG) emission reductions and removals can be measured to assess progress that developing-country Parties to the UNFCCC make in reducing forest-related emissions. In line with decisions taken by the conference of the Parties to the UNFCCC, RLs can be understood as business-as-usual (BAU) baselines developed by taking into account historic emissions and removals, adjusted for national circumstances where necessary to improve reliability.
Preparation of REDD+ RLs should follow the Intergovernmental Panel on Climate Change’s (IPCC) principles for reporting of national emissions and removals of GHGs. These principles include: (1) transparency, (2) completeness, (3) consistency, (4) comparability, and (5) accuracy. They imply that RLs submitted to the UNFCCC should be substantiated with information that allows for technical assessment of the data, methodologies, and procedures used in their development, and documentation of how the proposed RLs meets these principles.
1 REDD + is Reducing Emissions from Deforestation and Forest Degradation, and the Role of Conservation of Forest Carbon Stocks, Sustainable Management of Forests and Enhancement of Carbon Stocks.
Developing countries should start the construction of their RLs by developing scientifically credible estimates of their historic emissions and removals based on data collected according to commonly accepted standards. Such estimates can build on the three IPCC categories of forest and nonforest land-use change that cover the full scope of REDD+. These categories include “forests converted to other lands” (equivalent to deforestation), “forest remaining as forest” (covering degradation, conservation, enhancement of carbon stocks in existing forests, and sustainable management of forests) and “other lands converted to forest” (covering afforestation and reforestation). The IPCC provides methods for estimating emissions in all three categories. Single RLs can capture the outcomes of all these activities, expressed in terms of emissions or removals.
Developing countries should establish “activity data” and “emission factors” to estimate emissions and removals. Activity data for REDD+ activities refer to the area change data, expressed in hectares per year. Emission factors refer to GHG emissions or removals per unit area, (e.g. tons of CO
2 emitted
per hectare of deforestation). The generation of the relevant activity data and emission factors for RLs should include the following steps:
•Definition of forest used by the country
•Definition of pools and greenhouse gases included in the RL
•Establishment of the applicable historical time period for emissions estimates
•Description of methods used to estimate carbon stocks
•Estimation of area converted to other land uses
•Establishment of trends in forest conversion
•Estimation of the area of forest degradation
•Description of methods used to estimate emission factors for degradation
Executive Summary iii
Where relevant data do not exist, or are inadequate, countries should acquire such data to prepare a RL. Countries could start by designing a plan, including steps and data needed, that will lead to robust estimates of historic emission and removals. If existing data do not meet established quality criteria, then new data will need to be collected, including:
•Spatially explicit data for stratifying lands
•Spatially explicit activity data on gross deforestation and gross forestation
•Activity data for forest degradation and carbon stock enhancement
•Key agents or proximate drivers of deforestation and degradation
•Analysis of key pools
•Estimates of emission factors for each stratum and activity type
An RL may be adjusted from the historically based projection when doing so will improve its reliability as a benchmark for emission measurements. Such adjustments should be justified and be supported by robust and verifiable empirical data. Adjustments may be justified, for example, where there is sufficient evidence that implementation of national policies, such as investment and development programs, will have major impacts on future forest use.
Generalized circumstances, such as the stage in forest transition, income levels, or global deforestation drivers, have sometimes been considered to be relevant national circumstances. However, at this time we do not have sufficient empirical evidence to suggest a general adjustment of RLs based on these factors. These circumstances may be relevant for establishing benchmarks and adjustments for results-based finance, which lies outside of the scope of this report.
Subnational RLs should be developed according to the same rules and principles as national RLs. They should follow a common set of criteria that facilitate the subsequent reconciliation of RLs on the national level. When a country adopts a national RL, the subnational RL could remain valid until the period scheduled for its review, as long as the national government ensures consistency between the national and the existing subnational RL.
The appendices to this report include an illustration of how its recommendations could translate into UNFCCC guidelines for the preparation of REDD+ RLs, as well as examples of RL development from Brazil and Guyana.
iv Guidelines for REDD+ Reference Levels: Principles and Recommendations
Contents
Preface.............................................................................................................. i
Executive Summary ........................................................................................ ii
Acknowledgments .........................................................................................v
Acronyms .......................................................................................................vi
Guidelines for REDD+ Reference Levels: Principles and Recommendations .............................................................1
1. Principles ........................................................................................................................2
2. Historic Emissions and Removals ..................................................................................2
2.1 Applying IPCC categories to the scope of REDD+ ..............................................3
2.2 Key inputs: activity data and emission factors ...................................................3
2.3 Steps for estimating emissions and removals .....................................................3
2.4 Data needs and data analysis methods ..............................................................4
3. Adjusting for National Circumstances...........................................................................8
4. Subnational Reference Levels ........................................................................................8
Appendix 1. Guidelines for the Submission of Information on REDD+ Reference (Emissions) Levels ...............................................10
National circumstances ...........................................................................................11
Subnational reference (emissions) levels ................................................................11
Appendix 2. Two examples of Reference Level development ............................................................12
References.....................................................................................................14
vAcknowledgments
Acknowledgments
We gratefully acknowledge the involvement of the following people who participated in a consultation in Panama City, Panama in October 2011 where a draft version of this report was reviewed and discussed.
These individuals were asked for input on the scope, structure, and content of this report, but were not asked to seek consensus or to endorse any of the views expressed, for which the authors are solely responsible.
The authors thank Juan Pablo Castro of Climate Focus for his assistance and input, Mary Paden for her assistance with editing, Wenceslao Almazan for his assistance with graphic design, Pascale Ledeur-Kraus of Interprenet and her team for their assistance with translation. The authors also thank Michael Lesnick, Mallorie Bruns, and Liz Duxbury of the Meridian Institute for organizing and facilitating the process that produced this report.
This report was made possible by financial support from the Government of Norway’s International Climate and Forest Initiative.
Josefina Braña Varela
Michael Bucki
Augusto Castro
Bas Clabbers
Stephen Cornelius
Christine Dragisic
Peter Graham
Ragna John
Antonio La Viña
Catherine Potvin
Audun Rosland
Lucio Santos
Natalie Unterstell
Andrew Ure
Gerardo Vergara Asenjo
vi Guidelines for REDD+ Reference Levels: Principles and Recommendations
Acronyms
A/R Afforestation/reforestation
AFOLU Agriculture, forestry, and other land use
BAU Business as usual
CO2
Carbon dioxide
COP Conference of Parties
EU European Union
FAO Food and Agriculture Organization of the United Nations
FRA FAO’s Forest Resource Assessment
FT Forest transition
GDP Gross domestic product
GHG Greenhouse gas
GPG Good Practice Guidance
GOFC GOLD Global Observation of Forest and Land Cover Dynamics
Ha Hectare
HFLE High-forest, low-emissions
IOA Institutional Options Assessment
IPCC Intergovernmental Panel on Climate Change
MRV Measurement, reporting, and verification
NGO Nongovernmental Organization
OAR Options Assessment Report
QA/QC Quality assurance and quality control
REDD Reducing Emissions from Deforestation and Forest Degradation
REDD+ Reducing Emissions from Deforestation and Forest Degradation, and the Role of Conservation of Forest Carbon Stocks, Sustainable Management of Forests and Enhancement of Carbon Stocks
RL Reference level
RS Remote sensing
SBSTA Subsidiary Body for Scientific and Technical Advice
UNFCCC United Nations Framework Convention on Climate Change
Guidelines for REDD+ Reference Levels: Principles and Recommendations 1
Guidelines for REDD+ Reference Levels: Principles and Recommendations
financing mechanism linked to GHG emissions and removals, but is distinct from the decision on how to link REDD+ finance to the RLs.
In line with decisions taken by the COP, RLs can be understood as business-as-usual (BAU) baselines developed by taking into account historic GHG emissions and removals, adjusted for national circumstances where necessary to improve reliability.
The UNFCCC:
•Refers to RLs as a tool to demonstrate reductions in GHG emissions from deforestation;6
•Recognizes that RLs should be established transparently taking into account historic data, and adjusted for national circumstances;7 and
•States that subnational RLs can be developed as an interim measure toward developing national reference levels.8
This report is intended to inform the guidelines for RL development that could be included in a recommendation for a COP-17 decision on modalities for REDD+ RLs. It identifies what steps need to be taken, what data are required, and how the data can be analyzed to produce scientifically credible estimates of emissions and removals. This report builds on Modalities for REDD+ Reference Levels – Technical and Procedural Issues,9 disseminated at the thirty-fourth session of the SBSTA in June 2011, which provided a comprehensive overview of both substance and process considerations for the adoption of REDD+ RLs. At that time, various UNFCCC negotiators requested specific additional analysis and recommendations to inform the development of guidelines for the preparation of REDD+ RLs by developing-country Parties. 6 Decision 2/CP.13 para. 7(a).
7 Decision 4/CP.15, para. 7.
8 Decision 1/CP.16. para 71(b).
9 Meridian Institute. 2011.
The Conference of the Parties (COP) to the United Nations Framework Convention on Climate Change (UNFCCC) adopted at its
sixteenth session (COP-16) a milestone decision on Reducing Emissions from Deforestation and Forest Degradation (REDD+).2 This decision encourages developing countries to develop a “national forest reference emission level and/or forest reference level or, if appropriate, as an interim measure, subnational forest reference emission levels and/or forest reference levels, in accordance with national circumstances.”3 It also mandates the Subsidiary Body on Scientific and Technological Advice (SBSTA) to develop modalities relating to forest reference emission levels and forest reference levels (RLs) for REDD+ for consideration at the seventeenth session of the COP (COP-17).4
REDD+ RLs provide the benchmark against which greenhouse gas (GHG) emission reductions and removals can be measured to assess progress that developing-country Parties make in reducing forest-related emissions. Developing such a benchmark is a fundamental step in ensuring that REDD+ contributes to the ultimate goal of the Convention of stabilizing GHG concentrations at a level that prevents dangerous climate change.5 The development of RLs to estimate emission reductions is also a necessary step for the design of a results-based
2 REDD+ is Reducing Emissions from Deforestation and Forest Degradation, and the Role of Conservation of Forest Carbon Stocks, Sustainable Management of Forests and Enhancement of Carbon Stocks.
3 Decision 1/CP.16. para 71(b).
4 Decision 1/CP.16. Appendix 2 (b).
5 Article 2 of the UNFCCC states: “The ultimate objective of this Convention and any related legal instruments that the Conference of the Parties may adopt is to achieve, in accordance with the relevant provisions of the Convention, stabilization of greenhouse gas concentrations in the atmosphere at a level that would prevent dangerous anthropogenic interference with the climate system.”
2 Guidelines for REDD+ Reference Levels: Principles and Recommendations
This report reviews principles relevant to the preparation of REDD+ RLs and describes a methodological framework for developing-country Parties that is consistent with those principles. In Appendix 1, we provide an illustration of how these principles and the methodological framework could translate into UNFCCC guidelines for the preparation of REDD+ RLs for consideration by negotiators as part of a SBSTA decision on modalities for REDD+ RLs. Appendix 2 gives examples of how RLs were established in two countries, including: (1) a subnational (Amazon only) RL based on historic deforestation data developed by Brazil and used as the basis for compensation through the Amazon Fund; and (2) a national RL for Guyana that has been used, in combination with global deforestation data, to calculate compensation under a bilateral agreement with Norway.
1. Principles Under the UNFCCC, and as elaborated by the IPCC, five general principles guide the reporting of estimates of national emissions and removals of GHGs. These five principles should be equally applicable to the preparation of RLs. These principles are: (1) transparency, (2) completeness, (3) consistency, (4) comparability, and (5) accuracy.
Transparency implies that the assumptions and methods used to prepare RLs are clearly and fully described. RLs should be complete with respect to relevant pools and categories of activities; where pools or activities are missing, their absence should be documented along with a justification for their exclusion. RLs should be prepared in a way that is consistent with accepted standards of carbon accounting, and that allows for comparison of RLs among countries. To ensure accuracy, bias must be avoided and uncertainty must be reduced.10 When necessary to address large uncertainties in emission and removal estimates for key sources, the additional 10 IPCC (2006).
principle of conservativeness should be applied: conservativeness requires that, when completeness and accuracy are lacking, the risk of overestimation is lower than the risk of underestimation.11
RLs submitted to the UNFCCC should be substantiated with information that: (1) allows for technical assessment of the data, methodologies, and procedures used in its development; and (2) documents how the RL meets the principles described above. The RL guidelines should refer to existing methodologies and standards but should also take into account data constraints in developing countries.
2. Historic Emissions and Removals Developing countries should start their construction of RLs by developing scientifically credible estimates of their historic emissions and removals based on data collected according to commonly accepted standards. Not only will a scientifically robust estimate of historic emissions and removals provide the basis against which performance can be measured, but it will also help countries better understand the cause, magnitude, and location of historic emissions and removals and inform the development of REDD+ strategies.
Many developing countries have produced national communications that include estimates of GHG emissions and removals from changes in the use and management of forest land. However, the quality of these data is often poor, and they are rarely updated regularly. The data are often based on default Intergovernmental Panel on Climate Change (IPCC) Tier 1 emission factors. Thus, most countries will be better served by designing, and then building capacity for, a robust system for data collection and analysis as they initiate the process of RL development.
The first step in developing a RL is the construction of a scenario based on historic emissions and removals. To develop this scenario, one must identify and quantify the land areas that show decreases and increases in forest carbon stocks. 11 Grassi, et al (2008).
3Guidelines for REDD+ Reference Levels: Principles and Recommendations
2.1 Applying IPCC categories to the scope of REDD+
To accomplish this first step, countries can either: (1) attempt to define each REDD+ activity based on a variety of unique criteria, taking into account national circumstances, a process that can be difficult and time consuming,12 or (2) use the 2003 IPCC Good Practice Guidance (GPG) framework, which provides approaches and methods for estimating GHG emissions and removals from changes in the use and management of forest lands. Under this framework, which is already accepted by all Parties, the full scope of REDD+ is covered by the following three land-cover change categories:
• “Forests converted to other lands” is equivalent to deforestation.
• “Forest remaining as forest” includes the results of activities involving forest degradation, conservation of forest carbon stocks, sustainable management of forests, and enhancement of forest carbon stocks through increases in the carbon density of degraded forests.
• “Other lands converted to forest” includes enhancement of carbon stocks through afforestation or reforestation of nonforest land.
The inclusion of these categories in the scope of REDD+ does not mean that each has to have its own separate RL. Rather, RLs may correspond to the outcomes of all of these activities, expressed in terms of GHG emissions and/or removals.
2.2 Key inputs: activity data and emission factors
The GPG offers two basic inputs with which to generate inventories of GHG emissions/removals: (1) activity data, and (2) emission factors.
12 IPCC (2003).
Activity data refer to the extent of an emission/removal category. In the cases of deforestation, forestation (afforestation/reforestation), forest degradation, and enhancement of forest carbon stocks, activity data refer to the areal extent of those activities, that is, the area change data expressed in hectares per year. Forest area change data should be expressed as gross changes, they should be spatially explicit, and they should be able to be tracked into the future (i.e. monitoring how a given pixel changes through time). Such data would be based on interpretation of remote-sensing imagery.
It is also relevant to include trends in activity data for deforestation, degradation, and forestation. Not only are estimates of annual averages over a period of time needed, but also systematic patterns of change over the same period. A partial extrapolation of such historic trends could improve the reliability of BAU projections.13
Emission factors refer to GHG emissions and/or removals per unit area, for example, tons of carbon dioxide (CO
2) emitted per hectare of
deforestation. Emissions/removals resulting from land-use conversion can be estimated by one of two methods: either the difference in carbon stock (i.e., difference between forest and annual cropland) or the difference between the gain and loss of carbon (e.g., loss due to timber harvesting and gain from regrowth) of the pre- and post-conversion land cover category.
2.3 Steps for estimating emissions and removals
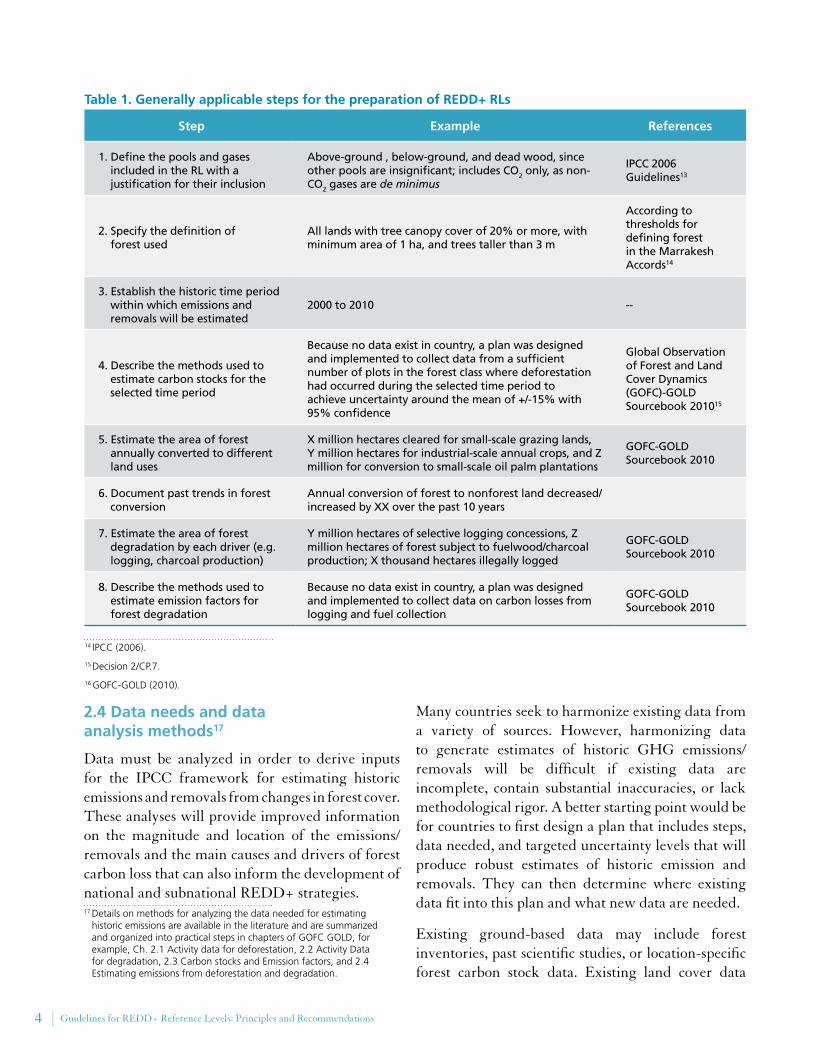
Although the process followed to prepare RLs will likely vary by country, certain steps will be common to all. Table 1 lists some of these common steps, with examples and references that explain how to fulfill them.
13 Such trends (changes in rates of deforestation and forestation) can also be indicative of the stage in the forest transition.
4 Guidelines for REDD+ Reference Levels: Principles and Recommendations
Table 1. Generally applicable steps for the preparation of REDD+ RLs
Step Example References
1. Define the pools and gases included in the RL with a justification for their inclusion
Above-ground , below-ground, and dead wood, since other pools are insignificant; includes CO2 only, as non-CO2 gases are de minimus
IPCC 2006 Guidelines13
2. Specify the definition of forest used
All lands with tree canopy cover of 20% or more, with minimum area of 1 ha, and trees taller than 3 m
According to thresholds for defining forest in the Marrakesh Accords14
3. Establish the historic time period within which emissions and removals will be estimated
2000 to 2010 --
4. Describe the methods used to estimate carbon stocks for the selected time period
Because no data exist in country, a plan was designed and implemented to collect data from a sufficient number of plots in the forest class where deforestation had occurred during the selected time period to achieve uncertainty around the mean of +/-15% with 95% confidence
Global Observation of Forest and Land Cover Dynamics (GOFC)-GOLD Sourcebook 201015
5. Estimate the area of forest annually converted to different land uses
X million hectares cleared for small-scale grazing lands, Y million hectares for industrial-scale annual crops, and Z million for conversion to small-scale oil palm plantations
GOFC-GOLD Sourcebook 2010
6. Document past trends in forest conversion
Annual conversion of forest to nonforest land decreased/increased by XX over the past 10 years
7. Estimate the area of forest degradation by each driver (e.g. logging, charcoal production)
Y million hectares of selective logging concessions, Z million hectares of forest subject to fuelwood/charcoal production; X thousand hectares illegally logged
GOFC-GOLD Sourcebook 2010
8. Describe the methods used to estimate emission factors for forest degradation
Because no data exist in country, a plan was designed and implemented to collect data on carbon losses from logging and fuel collection
GOFC-GOLD Sourcebook 2010
14 IPCC (2006).
15 Decision 2/CP.7.
16 GOFC-GOLD (2010).
2.4 Data needs and data analysis methods17
Data must be analyzed in order to derive inputs for the IPCC framework for estimating historic emissions and removals from changes in forest cover. These analyses will provide improved information on the magnitude and location of the emissions/removals and the main causes and drivers of forest carbon loss that can also inform the development of national and subnational REDD+ strategies.17 Details on methods for analyzing the data needed for estimating
historic emissions are available in the literature and are summarized and organized into practical steps in chapters of GOFC GOLD, for example, Ch. 2.1 Activity data for deforestation, 2.2 Activity Data for degradation, 2.3 Carbon stocks and Emission factors, and 2.4 Estimating emissions from deforestation and degradation.
Many countries seek to harmonize existing data from a variety of sources. However, harmonizing data to generate estimates of historic GHG emissions/removals will be difficult if existing data are incomplete, contain substantial inaccuracies, or lack methodological rigor. A better starting point would be for countries to first design a plan that includes steps, data needed, and targeted uncertainty levels that will produce robust estimates of historic emission and removals. They can then determine where existing data fit into this plan and what new data are needed.
Existing ground-based data may include forest inventories, past scientific studies, or location-specific forest carbon stock data. Existing land cover data
5Guidelines for REDD+ Reference Levels: Principles and Recommendations
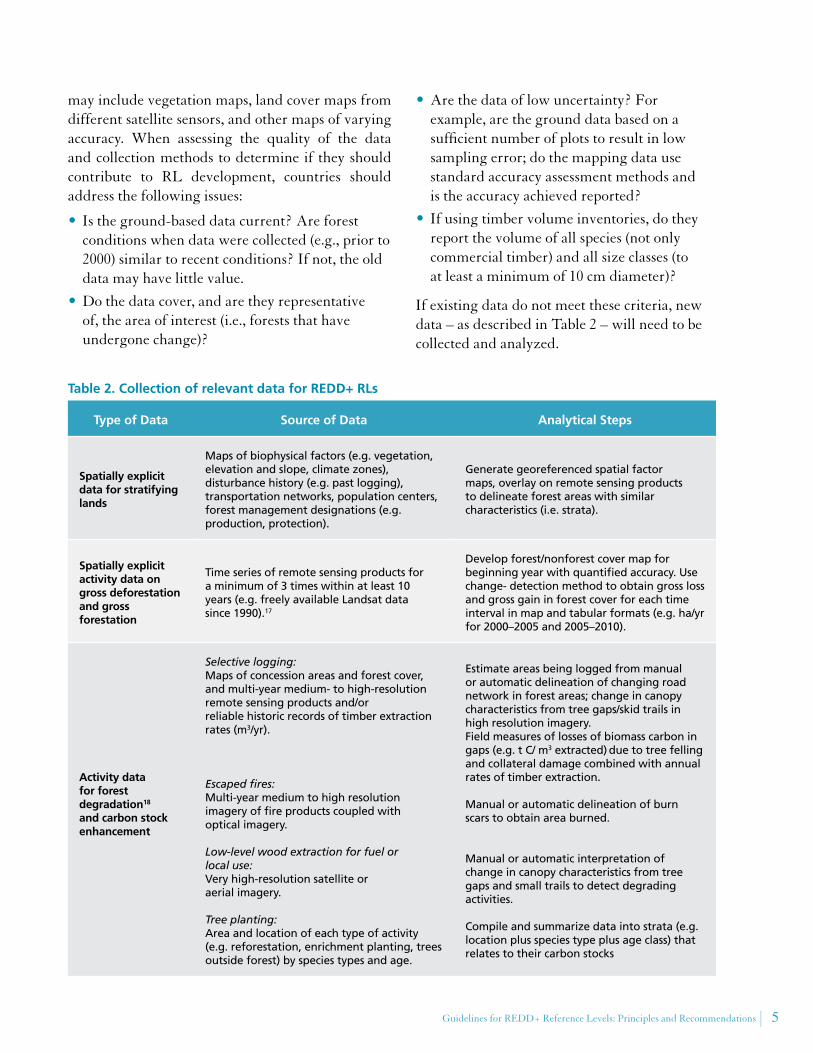
may include vegetation maps, land cover maps from different satellite sensors, and other maps of varying accuracy. When assessing the quality of the data and collection methods to determine if they should contribute to RL development, countries should address the following issues:
• Is the ground-based data current? Are forest conditions when data were collected (e.g., prior to 2000) similar to recent conditions? If not, the old data may have little value.
•Do the data cover, and are they representative of, the area of interest (i.e., forests that have undergone change)?
•Are the data of low uncertainty? For example, are the ground data based on a sufficient number of plots to result in low sampling error; do the mapping data use standard accuracy assessment methods and is the accuracy achieved reported?
• If using timber volume inventories, do they report the volume of all species (not only commercial timber) and all size classes (to at least a minimum of 10 cm diameter)?
If existing data do not meet these criteria, new data – as described in Table 2 – will need to be collected and analyzed.
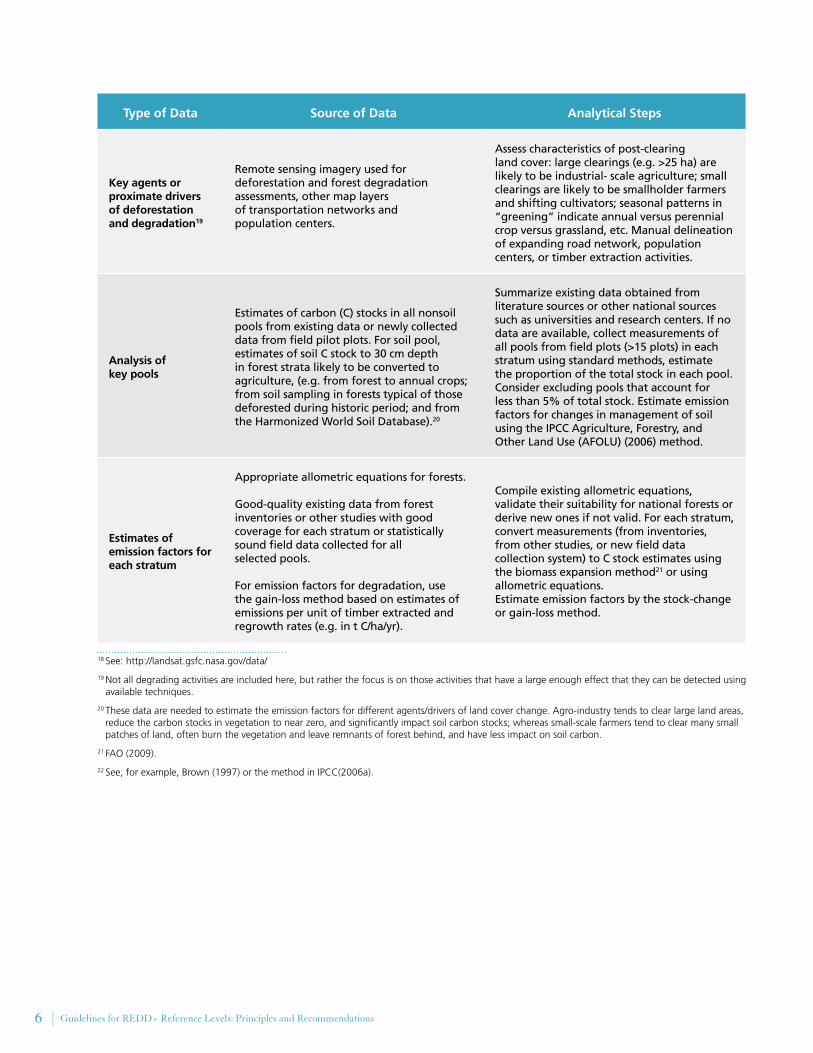
Table 2. Collection of relevant data for REDD+ RLs
Type of Data Source of Data Analytical Steps
Spatially explicit data for stratifying lands
Maps of biophysical factors (e.g. vegetation, elevation and slope, climate zones), disturbance history (e.g. past logging), transportation networks, population centers, forest management designations (e.g. production, protection).
Generate georeferenced spatial factor maps, overlay on remote sensing products to delineate forest areas with similar characteristics (i.e. strata).
Spatially explicit activity data on gross deforestation and gross forestation
Time series of remote sensing products for a minimum of 3 times within at least 10 years (e.g. freely available Landsat data since 1990).17
Develop forest/nonforest cover map for beginning year with quantified accuracy. Use change- detection method to obtain gross loss and gross gain in forest cover for each time interval in map and tabular formats (e.g. ha/yr for 2000–2005 and 2005–2010).
Activity data for forest degradation18 and carbon stock enhancement
Selective logging: Maps of concession areas and forest cover, and multi-year medium- to high-resolution remote sensing products and/or reliable historic records of timber extraction rates (m3/yr).
Escaped fires: Multi-year medium to high resolution imagery of fire products coupled with optical imagery.
Low-level wood extraction for fuel or local use: Very high-resolution satellite or aerial imagery.
Tree planting:Area and location of each type of activity (e.g. reforestation, enrichment planting, trees outside forest) by species types and age.
Estimate areas being logged from manual or automatic delineation of changing road network in forest areas; change in canopy characteristics from tree gaps/skid trails in high resolution imagery. Field measures of losses of biomass carbon in gaps (e.g. t C/ m3 extracted) due to tree felling and collateral damage combined with annual rates of timber extraction.
Manual or automatic delineation of burn scars to obtain area burned.
Manual or automatic interpretation of change in canopy characteristics from tree gaps and small trails to detect degrading activities.
Compile and summarize data into strata (e.g. location plus species type plus age class) that relates to their carbon stocks
6 Guidelines for REDD+ Reference Levels: Principles and Recommendations
Type of Data Source of Data Analytical Steps
Key agents or proximate drivers of deforestation and degradation19
Remote sensing imagery used for deforestation and forest degradation assessments, other map layers of transportation networks and population centers.
Assess characteristics of post-clearing land cover: large clearings (e.g. >25 ha) are likely to be industrial- scale agriculture; small clearings are likely to be smallholder farmers and shifting cultivators; seasonal patterns in “greening” indicate annual versus perennial crop versus grassland, etc. Manual delineation of expanding road network, population centers, or timber extraction activities.
Analysis of key pools
Estimates of carbon (C) stocks in all nonsoil pools from existing data or newly collected data from field pilot plots. For soil pool, estimates of soil C stock to 30 cm depth in forest strata likely to be converted to agriculture, (e.g. from forest to annual crops; from soil sampling in forests typical of those deforested during historic period; and from the Harmonized World Soil Database).20
Summarize existing data obtained from literature sources or other national sources such as universities and research centers. If no data are available, collect measurements of all pools from field plots (>15 plots) in each stratum using standard methods, estimate the proportion of the total stock in each pool. Consider excluding pools that account for less than 5% of total stock. Estimate emission factors for changes in management of soil using the IPCC Agriculture, Forestry, and Other Land Use (AFOLU) (2006) method.
Estimates of emission factors for each stratum
Appropriate allometric equations for forests.
Good-quality existing data from forest inventories or other studies with good coverage for each stratum or statistically sound field data collected for all selected pools.
For emission factors for degradation, use the gain-loss method based on estimates of emissions per unit of timber extracted and regrowth rates (e.g. in t C/ha/yr).
Compile existing allometric equations, validate their suitability for national forests or derive new ones if not valid. For each stratum, convert measurements (from inventories, from other studies, or new field data collection system) to C stock estimates using the biomass expansion method21 or using allometric equations.Estimate emission factors by the stock-change or gain-loss method.
18 See: http://landsat.gsfc.nasa.gov/data/
19 Not all degrading activities are included here, but rather the focus is on those activities that have a large enough effect that they can be detected using available techniques.
20 These data are needed to estimate the emission factors for different agents/drivers of land cover change. Agro-industry tends to clear large land areas, reduce the carbon stocks in vegetation to near zero, and significantly impact soil carbon stocks; whereas small-scale farmers tend to clear many small patches of land, often burn the vegetation and leave remnants of forest behind, and have less impact on soil carbon.
21 FAO (2009).
22 See, for example, Brown (1997) or the method in IPCC(2006a).
7Guidelines for REDD+ Reference Levels: Principles and Recommendations
Historic Emissions Estimate for REDD+
Activity Data Emission/Removal Factors
Rates of deforestation
Rates of tree planting
Rates of forest degradation/enhancement
by activity type
Emission factors for
deforestation
Removal factors for C stock
enhancement
Emission factors for forest
degradation
Step 3. Combine Activity Data and Emission Factors
Develop land cover change maps and perform accuracy
assessment
Collect data to �ll gaps
Identify data gaps
Develop data collection plan by activity/driver
Determine best methods for quantifying areas of
degradation/C stock enhancement:
• RS imagery interpretation• statistical data
collection/processing• survey data
Compile existing data for activities included in RL:• timber extraction rates
• fuelwood collection• trees outside forests• enrichment planting
Collect ancillary spatial data on locations of forest
plantations
Fill data gaps to obtain desired number of images
Determine number of additional images to be incorporated into analysis
Interpret imagery in base year of reference period to create benchmark land cover map
that meets accuracy target
De�ne area of interest for change detection
Collect C stock data
Develop sampling design for C stock measurements
Compile and evaluate existing data on allometric equations, biomass expansion factors, inventory data, �eld plots,
identify gaps
De�ne area of interest for sampling C stocks (develop potential for change maps)
De�ne accuracy/precision targets and QA/QC protocols
Analysis of key C pools to include
Stratify landscape • by activity/driver
• by C impact
Collect data on C gains/losses
Develop data collection plan by activity/driver
Compile and evaluate existing data on timber and
fuelwood volumes extracted, regrowth rates
Gross deforestation/forestation
Forest degradation/C stockenhancement
Gross deforestation/forestation/C stock enhancement
(stock-change approach)
Forest degradation(gain-loss approach)
De�ne area of interest for sampling areas of
degradation/enhancement:• logging impacts
• fuelwood impacts• small scale clearing
• escaped fires
Compile spatial data and develop strati�cation factors
ACTIVITY DATA EMISSION/REMOVAL FACTORS
Step 2. Compile and Analyze Data
Finalize forest de�nition
Determine scope of activities to be included in RL
De�ne reference time period for analysis
Determine scale(national or subnational)
Compile existing RS data, identify
gaps
De�ne accuracy
targets and QA/QC
protocols for RS interpretation
Step 1. Make Key Decisions On Scope and De�nitions of RL
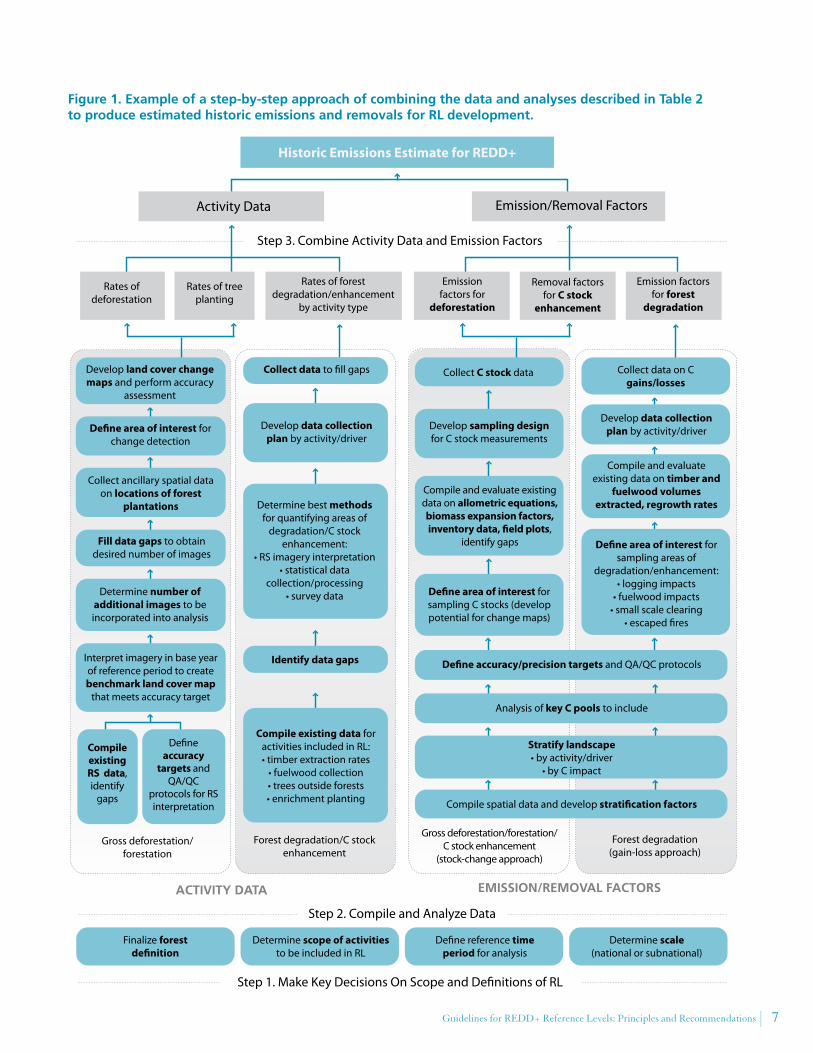
Figure 1. Example of a step-by-step approach of combining the data and analyses described in Table 2 to produce estimated historic emissions and removals for RL development.Figure 1. Example of a step-by-step approach of combining the data and analyses described in Table 2
to produce estimated historic emissions and removals for RL development.
8 Guidelines for REDD+ Reference Levels: Principles and Recommendations
3. Adjusting for National CircumstancesTo improve their reliability as a benchmark for emission measurements, RLs may be adjusted from projections of historical data when warranted by national circumstances that affect the country’s forest emissions and removals. A second type of adjustment that reflects considerations such as equity (e.g. on the basis of biophysical or economic disparities) may subsequently be made to link RLs to REDD+ results-based finance(see Box 1).23 This report focuses only on the first type of adjustment. The second type is beyond the scope of our analysis.
In calculating the first type of adjustment, a country may identify national circumstances that are relevant for improving the reliability of historically-based BAU projections. UNFCCC guidelines could either leave it to each country to identify such circumstances or could provide an illustrative list of applicable circumstances that conforms with the principles of consistency, comparability, and transparency.
Overall, historic (e.g. the past 10 years) deforestation helps to predict future deforestation, taking into account both the rates of deforestation and trends in deforestation rates (increasing or decreasing). Thus, our recommendation is to use historic deforestation data as the main variable for setting BAUs. Nonetheless, there may be individual cases in which national circumstances warrant adjustments to BAUs. Although historic rates can be adjusted either upward or downward, we suggest that negotiators allow upward adjustment only when a country can justify the adjustment on the basis of empirical evidence.
National policies, such as road-building, investment, and development programs, can have major impacts on future forest use. If a country can justify how a national development policy will affect deforestation rates and thus forest emissions, the policy may be considered in adjusting the BAU. However, the effect of policies on forest emissions can be easily 23 Meridian Institute (2011) refers to this second adjustment as a
“compensation baseline.”
overestimated, leading to emission projections that are not realistic. Accounting for national policies where there is insufficient evidence for implementation could threaten the environmental integrity of REDD+ and the political credibility of a REDD+ mechanism. An assessment of whether national plans and policies can be used to adjust BAU should therefore consider, inter alia, their stage of implementation, their funding, and their level of institutional development.
If countries refer to national policies, programs, investment projects or other measures to justify an upwards adjustment of the RL, they should bring reasonable proof that the relevant measures will be indeed impact their country’s emissions trajectory. This proof could be in the form of third-party assessments of likely forest impacts of the programs and projects and should relate both to the prospects of realizing the potential impact and the relevant time frame for such realization.
4. Subnational Reference LevelsDeveloping-country Parties may choose to start piloting REDD+ in a stepwise manner either (1) by establishing a RL on the basis of one kind of land-use change such as deforestation, and/or by (2) establishing RLs at subnational scales, such as for selected states or provinces. As a general rule, subnational RLs should be developed according to the same rules and principles as national RLs. However, when establishing subnational RLs, a number of special considerations apply:
•Harmonized national criteria. Subnational RLs should follow a common set of criteria that facilitate the subsequent reconciliation of RLs at the national level. Countries may further define methodologies for use in the development of subnational RLs. Such methodologies should also include guidance on how to account for leakage.
• Integration of subnational RLs. When a country adopts a national RL, the subnational RL could remain valid until the period scheduled for its review, as long as the national government ensures coherence between the national and the existing subnational RL.
9Guidelines for REDD+ Reference Levels: Principles and Recommendations
Box 1. Assessment of Forest Transition Stage and Deforestation Drivers as Potential “National Circumstances.”In Meridian’s June 2011 report Modalities for REDD+ Reference Levels – Technical and Procedural Issues, we identified two items – the stage in forest transition and deforestation drivers – as potentially relevant national circumstances. These circumstances may lead to adjustments that reflect equity considerations. However, they are unlikely to provide sufficiently supported evidence for concrete deforestation threats.
Stage in forest transition
High forest cover with low deforestation (and assumed low emissions) indicates that a country is at an early stage in forest transition (FT), and that deforestation/emissions could be expected to rise over time. This situation could justify setting the BAU scenario above historic emissions (upward adjustment). However, an empirical basis for a generalized adjustment to national BAU projections on this basis is lacking. Although the Food and Agriculture Organization of the United Nation’s Forest Resource Assessment24 data are flawed, they nonetheless show a positive correlation between forest cover and deforestation rate when 1991–2000 deforestation data are used to predict 2001–2010 deforestation, as suggested by FT theory. 25 But very little explanatory power is gained by adding forest cover as a variable to the historic emissions and removals, and the impact of adding forest cover is not robust.
Furthermore, FT theory postulates the long-term trends (several decades), and the time periods relevant for setting RLs might be too short for FT effects to be seen. High deforestation rates are indicative of strong deforestation processes, and in the short and medium terms they are likely to continue, rather than being counter-balanced by the increased forest scarcity resulting from high deforestation rates.
Thus, at this time we do not have sufficient empirical evidence to recommend a uniform adjustment of RLs based on forest cover.
Income (GDP) per capita has also been used as an indicator, but the empirical evidence of its impact on deforestation is mixed. Rather than becoming factors in setting RLs, GDP and other economic indicators could be considered as factors for linking RLs to results-based financing.
Drivers of deforestation
Higher demand and thus higher prices for relevant commodities are dominant drivers of deforestation. Commercial agriculture is responsible for the majority of deforestation, and thus overall demand and prices for agricultural commodities are proxies for these drivers. One might envision a BAU formula that includes an index of the relevant (to the country) agricultural commodity prices, combined with estimated price-area elasticities (an increase in agricultural land area when prices go up) and encroachment factors (share of agricultural land expansion into forests). However, there is insufficient empirical basis to recommend this approach as a national circumstance for the adjustment of BAU projections.
There are several reasons why a formula that includes an index of the agricultural commodity prices, combined with estimated price-area elasticities and encroachment factors, is not generally relevant for adjusting for national circumstances. First, the link between prices and land expansion varies considerably. Second, predicting future agricultural prices is challenging, and adds another layer of uncertainty. Third, prices of different agricultural commodities are correlated, so that price changes may not predict variations in deforestation across countries (beyond what is given by the historical deforestation). These drivers of deforestation are, therefore, not just national circumstances but also global circumstances.
24 FAO (2010).
25 The Forest Transition theory (FT) refers to a commonly observed pattern of change in the forest cover over time in a country or region. Initially, a country has a high and relatively stable portion of land under forest cover. Deforestation begins, then accelerates and forest cover declines. At some point deforestation slows, forest cover stabilizes and begins to recover.
10 Guidelines for REDD+ Reference Levels: Principles and Recommendations
3.3 Provide a description of approaches, methods, models, and assumptions, used in the RL construction, referring, where relevant, to published reports.
3.4 Provide a description of how the following elements were estimated or treated in developing estimates of the historic emissions and removals:
(a) Definition of forest
(b) Changes in the national forest cover and area within at least ten years prior to 2010;
(c) Relevant forest characteristics, e.g.:
•descriptions of strata or forest classes
•carbon stocks and losses and gains in carbon stocks for each strata or forest class
•carbon stocks of deforested land
•area under timber and woodfuel concessions, wood extraction rates, and length or area of logging infrastructure (e.g. roads, skid trails)
(d) Estimates of the area of forest converted to different land uses, on an annual basis
(e) Estimates of the trends in the rates of forest conversion.
4. Data used for estimating historic emissions and removals should be:
4.1 Representative of forest conditions at the time of constructing the RL;
4.2 Representative of the area of interest (i.e. those forests that have undergone changes);
4.3 Consistent through time (e.g. the same forest strata are mapped through time);
Appendix 1. Guidelines for the Submission of Information on REDD+ Reference (Emissions) Levels
1. Developing-country Parties aiming to undertake REDD+ activities shall submit a reference level or reference emissions level to the Secretariat.
2. The objectives of the submission are:
2.1 To provide transparent, complete, consistent, comparable and accurate information for the purpose of allowing a technical assessment of the data, methodologies, and procedures used in the construction of their proposed REDD+ reference levels (RLs);
2.2 To present information taking into account the general reporting principles set out by the Convention and elaborated by the IPCC;26
2.3 To document the information that was used by Parties in constructing their REDD+ RLs in a comprehensive and transparent way;
2.4 To describe the development of reference (emissions) levels applying the principle of conservativeness, in particular where data constraints apply.
3. In their submission, Parties shall:
3.1 Provide a general description of the key agents or drivers of forest cover change and forest degradation taken into account in the construction of the REDD+ RL.
3.2 Identify pools and gases which have been included in the REDD+ RL and explain the reasons for omitting a pool and or gas from the RL construction (e.g. through use of a key category analysis).
26 IPCC (2003a) UNFCCC Annex I Reporting Guidelines. Change and Forestry.
Appendix 1. Guidelines for the Submission of Information on REDD+ Reference (Emissions) Levels 11
4.4 Of low uncertainty and with the level of uncertainty reported, (e.g. ground data should contain sufficient number of plots to result in low sampling error, and mapping data should be based on use of standard accuracy assessment methods).
National circumstances
5. Predictions of future rates of emissions and removals should be based on historic rates, but can be adjusted both upwards and downwards based on national circumstances. Proposed adjustments from historical data (rates and trends) should be substantiated with transparent, reliable, and conservative data and evidence.
6. Business–as-usual national policies and programs can be used to justify an upward adjustment of historical trends/data if it can be demonstrated that such national policies and programs were implemented before the end of 2010.27
Subnational reference (emissions) levels
7. Developing-country Parties choosing to develop subnational reference (emissions) levels as a step toward a national reference (emissions) level should:
a. Describe the harmonized national criteria that they have adopted to facilitate the subsequent reconciliation of subnational reference (emissions) levels at national level.
b. Describe how leakage will be assessed and accounted for.
27 Adoption of Decision 1/CP.16.
12 Guidelines for REDD+ Reference Levels: Principles and Recommendations
Appendix 2. Two examples of Reference Level development
The initial RL is set equal to the average annual historic emissions for the 10-year period from 1996 to 2005 with no adjustments for national circumstances.29 The RL will be updated every five years, thus the average emissions for the period 2001–2010 will apply for a five-year period beginning 2011.
Brazil’s RL for the Legal Amazon region is used to determine compensation through the Amazon Fund by a straightforward process: it is calculated by multiplying the emissions reduction calculated based on the RL in tons of CO
2, by the carbon price of US$5 per ton of CO
2.
This RL is subnational, covering the Legal Amazon region only, (whereas emissions from the cerrado region may be as large), limited to deforestation (whereas degradation is increasing in relative importance and emissions from escaped understory fires may now rival deforestation emissions), includes only above-ground biomass, and does not distinguish different emission factors on the basis of drivers.
Guyana
Guyana is a high-forest, low-emissions (HFLE) country with a very low deforestation rate. Thus the Norway-Guyana agreement established the mean of its 2000–2009 deforestation rate and the global average rate as a provisional RL to be used as the basis for compensation under their bilateral agreement. Using this calculation,
29 This is the same as the RL period used by Brazil for its National Climate Change Policy, adopted by the Brazilian Congress in December 2009 with implementing regulations provided in a Presidential decree in December 2010 (Lei No. 12.187, December 29, 2009; Decreto No 7390, Dec 9 2010), including a higher carbon density factor of 132.3 tC/ha = 485.1 tCO2/ha. BAU levels are also established for other biomes in the decree.
This section provides brief descriptions of how two countries are establishing RLs for REDD+. Brazil used a historic average of deforestation, based on conservative assumptions, to set a subnational RL that was used as the basis for compensation through the Amazon Fund. Guyana’s national RL is based on the historical average of deforestation and the global average deforestation rate, and is used as the basis for compensation through its bilateral agreement with Norway.
Brazil
In 2009, in connection with setting up the Amazon Fund and the commitment of the government of Norway of up to US$1 billion in results- based compensation for emissions reductions, Brazil established a subnational RL for gross deforestation of aboveground biomass for the Legal Amazon28 region. The RL is fairly simple and straightforward. It is based on the deforestation assessments produced annually by INPE, the Brazilian National Institute for Space Research, through its PRODES program (http://www.obt.inpe.br/prodes/index.html). These assessments of deforestation are in area (square kilometers) over an “Amazon year” (August through July).
These area-based estimates (square kilometers) are converted into estimates of emissions (tons of CO
2) by multiplying the area deforested by a
conservative assumed average carbon density of the forests of 100 tons of carbon per hectare (i.e. 367 tCO
2/ha).
28 The Legal Amazon is a socio-geographic division of Brazil that includes seven states that encompass the Amazon River Basin.
Appendix 2. Two examplesof Reference Level development 13
Appendix 2. Two examples of Reference Level development
•The key carbon pools have been selected (above-and-below-ground trees and dead wood pools, and soil for forests likely to be converted to permanent agriculture).
•Sampling design for developing emission factors for deforestation was finalized based on preliminary field data needed to estimate the number of sample plots needed to reach the desired uncertainty target; the plan will be implemented and completed by end of 2011.
•Data for emission factors for logging were analyzed and additional data are being collected to reach the targeted precision.
•Methods for estimating regrowth in gaps after logging are being tested (chronosequence of logging gaps).
•Methods and approaches for quantifying extent and emission factors for forest degradation other than selective logging are being developed.
Based on the above estimates, Guyana’s RL will be national in scope; include deforestation and forest degradation; include above- and below-ground tree biomass, dead wood, and soil; and distinguish different emission factors on the basis of drivers.
the interim level of 0.450 percent deforestation annually in the original agreement will be lowered to 0.275 percent based on the most recent (2009–2010 data.
If the deforestation rate rises above the 2009–2010 level of 0.056 percent, Guyana will not receive full compensation, and if it rises above 0.100 percent, Guyana will not receive any compensation. The carbon density is assumed to be 100 tons of carbon per hectare, and the compensation level will be US$5 per ton of CO
2. Both figures are the
same as those used in Brazil under the Amazon Fund (see above). Very approximate estimates of emissions from forest degradation are also included using a separate calculation.
Since 2010, Guyana has made great strides in improving its historic emissions estimate:
•The forest areas assessment work has been completed for the periods 1990-2000, 2001–2005, 2006–2009, 2009–2010 using a variety of satellite data. (See http://www.forestry.gov.gy/Downloads/Guyana_MRVS_Interim_Measures_Report_16_March_2011.pdf), with a framework developed for annual reporting. Preparation for 2010 to 2011 is underway.)
•Extensive capacity building was completed with training for biomass carbon plots, sampling design, and spatial analysis.
•Forests have been classified into six strata based on three threat classes (low-to- high threat for deforestation and degradation) and two accessibility classes (more- or-less accessible for field crews as a cost consideration).
14 Guidelines for REDD+ Reference Levels: Principles and Recommendations
References
Brown, S. 1997. Estimating biomass and biomass change of tropical forests: A primer. FAO Forestry Paper 134, Rome, Italy.
Food and Agriculture Organization of the United Nations (FAO). 2010. Global Forest Resources Assessment 2010. FAO, Rome, Italy, http://www.fao.org/forestry/fra/fra2010/en/
FAO/IIASA/ISRIC/ISS-CAS/JRC. 2009. Harmonized World Soil Database (version 1.1). FAO, Rome, Italy and IIASA, Laxenburg, Austria, www.iiasa.ac.at/Research/LUC/luc07/External-World-soil-database/HWSD_Documentation.pdf
GOFC-GOLD. 2010. A sourcebook of methods and procedures for monitoring and reporting anthropogenic greenhouse gas emissions and removals caused by deforestation, gains and losses of carbon stocks in forests remaining forests, and forestation. GOFC-GOLD Report version COP16-1, (GOFC-GOLD Project Office, Natural Resources Canada, Alberta, Canada), http://www.gofc-gold.uni-jena.de/redd
Grassi, G., S. Monni, S. Federici, F. Achard, and D. Mollicone. 2008. Applying the conservativeness principle to REDD to deal with the uncertainties of the estimates, Environmental Research Letters 3: (1-12).
Intergovernmental Panel on Climate Change (IPCC). 2003. Definitions and methodological options to inventory emissions from direct human-induced degradation of forests and devegetation of other vegetation types, http://www.ipcc-nggip.iges.or.jp/public/gpglulucf/degradation_contents.html
_____. 2003a. Good Practice Guidance for Land Use, Land-Use Change and Forestry. Published by the Institute for Global Environmental Strategies (IGES) for the IPCC, http://www.ipcc-nggip.iges.or.jp/public/gpglulucf/gpglulucf_files/0_Task1_Cover/Cover_TOC.pdf
____. 2006. Guidelines for National Greenhouse Gas Inventories, Vol. 1, General Guidance and Reporting, Section 1.4, http://www.ipcc-nggip.iges.or.jp/p u b l i c / 2 0 0 6 g l / p d f / 1 _ Vo l u m e 1 / V 1 _ 1 _ C h 1 _Introduction.pdf
_____. 2006a. Guidelines for National Greenhouse Gas Inventories, Vol. 4, Agriculture, Forestry and Other Land Use, http://www.ipcc-nggip.iges.or.jp/public/2006gl/vol4.html
Meridian Institute. 2011. Modalities for REDD+ Reference Levels: Technical and procedural issues. Prepared for the Government of Norway, by Arild Angelsen, Doug Boucher, Sandra Brown, Valérie Merckx, Charlotte Streck, and Daniel Zarin, http://www.REDD-OAR.org.
United Nations Framework Convention on Climate Change. 2007. Report of the Conference of the Parties on its seventh session, held in Marrakech from 29 October to 9 November 2001, http://unfccc.int/resource/docs/cop7/13a01.pdf#page=54
______. 2007a. Report of the Conference of the Parties on its thirteenth session, held in Bali from 3 to 15 December 2007, http://unfccc.int/resource/docs/2007/cop13/eng/06a01.pdf#page=8
_____. 2009. Report of the Conference of the Parties on its sixteenth session, held in Copenhagen from 7 to 18 December 2009, http://unfccc.int/resource/docs/2009/cop15/eng/11a01.pdf#page=11
_____. 2010. Report of the Conference of the Parties on its sixteenth session, held in Cancun from 29 November to 10 December 2010, http://unfccc.int/resource/docs/2010/cop16/eng/07a01.pdf#page=2
15References
Meridian Institute is a not-for-profit organization whose mission is to help people solve problems, make informed decisions, and find solutions to some of society’s most complex and controversial issues. Meridian’s mission is accomplished through applying collaborative problem-solving approaches including facilitation, mediation, and other strategic consultation services. Meridian works at the local, national, and international levels and focuses on a wide range of issues related to natural resources and environment, science and technology, agriculture and food security, sustainability, global stability, and health. For more information, please visit www.merid.org.
Meridian Institute1920 L Street NW, Suite 500Washington, DC 20036 USAPhone: +1 202-354-6440Fax: +1 202-354-6441www.merid.org
About Meridian Institute
Guidelines for REDD+ Reference Levels: Principles and Recommendations
www.REDD-OAR.org