Embed Size (px)
Citation preview

20th
July, 2011
ANS Research Desk (Research Wing of ANS Pvt Ltd)
“ARHAM” Financial Centre
Harihar Chowk, Rajkot (Guj)
Speak to: 0281 – 6699401
Drop a line to: [email protected]
Gujarat Gas Limited (Initiating Coverage)

Nifty 5616
Sensex 18661
Script Details
Equity Capital `̀̀̀ 25.65 Cr
Face Value ` ` ` ` 2
Market Cap `̀̀̀ 5253
52 Weeks High/Low 454/296
6-month avg. volume
(BSE) 9268
(NSE) 3077
Shareholding Pattern As On Sep’10 (%)
Promoters 65.12
Corporate Bodies & 25.48
Institutions
Public 9.40
Research Analyst: Pranav Mehta
Company
Background:
Gujarat Gas Company Limited (GGCL)
largest private sector player in the natural gas transmission and
GGCL has been a pioneer in the natural gas distribution to industrial, commercial and
domestic customers.
since 1997 and currently BG group is the company’s
shareholder.
The company currently
Surat, Ankleshwar and Bharuch.
commercial &
(CNG) users. It has a pipeline network spread over 3700 kms.
Promoter’s background:
The BG group
across 5 continent
chain. It is listed on the London stock exchange and on the US over the counter
market known as OTCQX.
65%
25%10%
PROMOTER CB & INST PUBLIC
Recomm
BSE Code
NSE Code:
Company Overview
Background:
Gujarat Gas Company Limited (GGCL) was incorporated in 19
largest private sector player in the natural gas transmission and
GGCL has been a pioneer in the natural gas distribution to industrial, commercial and
domestic customers. The company has been a part of the British Gas (BG) group
since 1997 and currently BG group is the company’s
shareholder.
The company currently operates in the state of Gujarat in the industrialized regions of
Surat, Ankleshwar and Bharuch. It supplies gas to more than 317000 domestic,
commercial & domestic customers while serving over 144000 compressed natural gas
(CNG) users. It has a pipeline network spread over 3700 kms.
Promoter’s background:
The BG group is located in United Kingdom and it currently
across 5 continents. The company has in-depth experience across the entire gas
chain. It is listed on the London stock exchange and on the US over the counter
market known as OTCQX.
Recommendation: Accumulate Coverage Initiated on:
BSE Code: 523477 Bloomberg Code: GGAS IN CMP
NSE Code: GUJARATGAS Reuters Code: GGAS.BO Buy at
was incorporated in 1980 and is India’s
largest private sector player in the natural gas transmission and distribution business.
GGCL has been a pioneer in the natural gas distribution to industrial, commercial and
The company has been a part of the British Gas (BG) group
since 1997 and currently BG group is the company’s promoter and largest
in the industrialized regions of
supplies gas to more than 317000 domestic,
domestic customers while serving over 144000 compressed natural gas
(CNG) users. It has a pipeline network spread over 3700 kms.
is located in United Kingdom and it currently operates in 27 countries
depth experience across the entire gas
chain. It is listed on the London stock exchange and on the US over the counter
Coverage Initiated on: 20th
July, 2011
GGAS IN CMP `̀̀̀ 410
Buy at `̀̀̀ 385 or less

Promoter’s Presence in India
BG E&P India
Limited
BGIES
GGCL
MGL
Industrial Production in Gujarat
Promoter’s Presence in India :
BG E&P India
Limited
Panna Mukti Tapti(PMT): Jointly operated
Co-venturers: BG (30%), ONGC (40%),
Krishna Godavari Basin -Block KG-OSN
Co-venturers: BG (45%), ONGC (operator 55%)
Mahanadi Basin -MN-DWN-2002/02
Co-venturers: BG (25%), ONGC (operator 75%)
Krishna Godavari Basin -KG-DWN-2009/1
venturers: BG 30% (Operator), ONGC (45%), OIL (15%), APGIC
(10%), BG (25%), ONGC (operator 75%)
BGIES LNG importers, Gas Aggregators ,Bulk Industrial,
operators, Power
GGCL India’s largest private CGD company (by volumes)
India’s largest private CGD company (by customers)
JV with GAIL (49.75% each), State Govt. (0.5%)
Source: Company Presentation, BG Group Data book 2 010
Industrial Production in Gujarat
Source: Company presentation Govt. of Gujarat
33%
21%
9%
7%
6%24%
0%
Petro Prod. Chemicals Food Textile Basic Mat
Panna Mukti Tapti(PMT): Jointly operated
venturers: BG (30%), ONGC (40%), RIL (30%)
OSN-2004/1 (Exploration Block)
BG (45%), ONGC (operator 55%)
2002/02(Exploration Block)
BG (25%), ONGC (operator 75%)
2009/1 (Exploration Block) Co-
venturers: BG 30% (Operator), ONGC (45%), OIL (15%), APGIC
(25%), ONGC (operator 75%)
LNG importers, Gas Aggregators ,Bulk Industrial, Fertilizer, CGD
India’s largest private CGD company (by volumes)
India’s largest private CGD company (by customers)
JV with GAIL (49.75% each), State Govt. (0.5%)
Source: Company Presentation, BG Group Data book 2 010
Source: Company presentation Govt. of Gujarat
Others
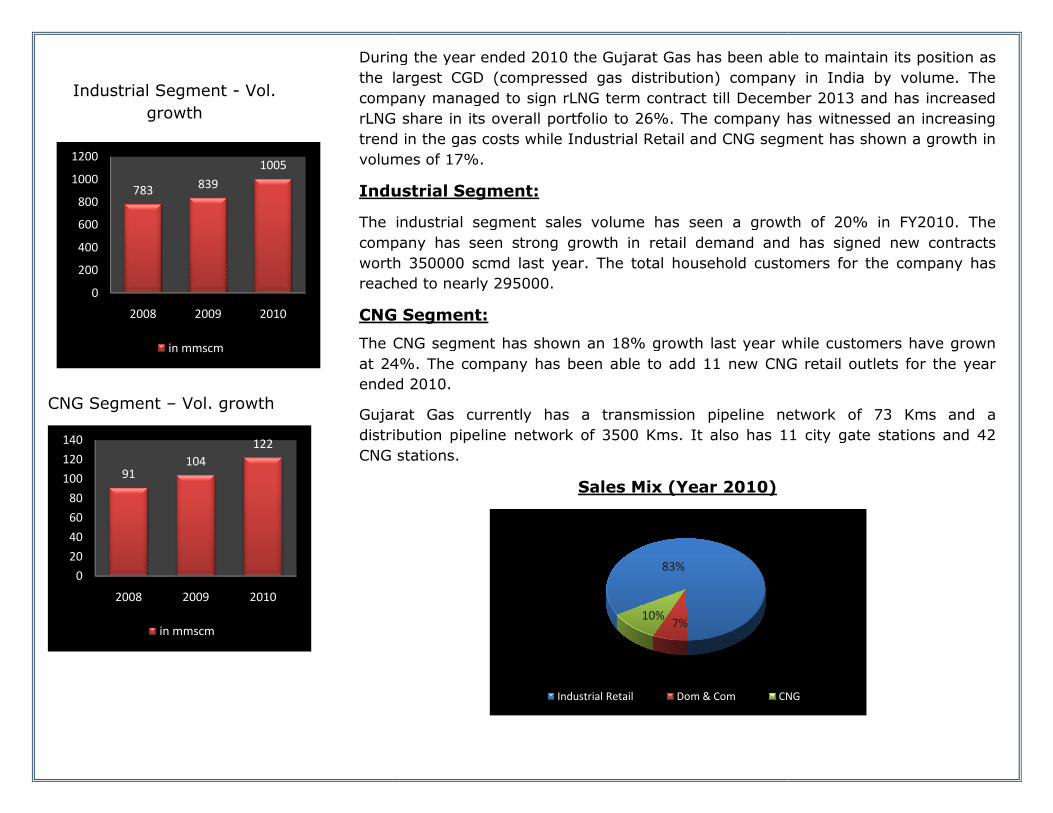
Industrial Segment - Vol.
growth
CNG Segment – Vol. growth
During the year ended 2010 the
the largest CGD (compressed gas distribution) company in India by volume. The
company managed to sign
rLNG share in
trend in the gas costs while Industrial Retail and CNG segment has shown a growth
volumes of
Industrial Segment:
The industrial segment
company has seen strong growth in retail demand
worth 350000 scmd last year. The total household customers for the company has
reached to nearly 295000
CNG
The CNG segment has shown an 18% growth last year while
at 24%. The company has been able to add 11 new CNG retail outlets for the year
ended 2010.
Gujarat Gas currently has a transmission pipeline network of 73 Kms and a
distribution pipeline network of 3500 Kms. It also has 11 city gate s
CNG stations.
91104
122
0
20
40
60
80
100
120
140
2008 2009 2010
in mmscm
783839
1005
0
200
400
600
800
1000
1200
2008 2009 2010
in mmscm
During the year ended 2010 the Gujarat Gas has been able to
the largest CGD (compressed gas distribution) company in India by volume. The
company managed to sign rLNG term contract till December 2013 and has increase
rLNG share in its overall portfolio to 26%. The company has witnessed an increasing
trend in the gas costs while Industrial Retail and CNG segment has shown a growth
volumes of 17%.
Industrial Segment:
The industrial segment sales volume has seen a growth of
company has seen strong growth in retail demand and has signed new contracts
worth 350000 scmd last year. The total household customers for the company has
reached to nearly 295000.
CNG Segment:
The CNG segment has shown an 18% growth last year while
at 24%. The company has been able to add 11 new CNG retail outlets for the year
ended 2010.
Gujarat Gas currently has a transmission pipeline network of 73 Kms and a
distribution pipeline network of 3500 Kms. It also has 11 city gate s
CNG stations.
Sales Mix (Year 2010)
83%
7%10%
Industrial Retail Dom & Com CNG
has been able to maintain its position as
the largest CGD (compressed gas distribution) company in India by volume. The
contract till December 2013 and has increased
portfolio to 26%. The company has witnessed an increasing
trend in the gas costs while Industrial Retail and CNG segment has shown a growth in
seen a growth of 20% in FY2010. The
and has signed new contracts
worth 350000 scmd last year. The total household customers for the company has
The CNG segment has shown an 18% growth last year while customers have grown
at 24%. The company has been able to add 11 new CNG retail outlets for the year
Gujarat Gas currently has a transmission pipeline network of 73 Kms and a
distribution pipeline network of 3500 Kms. It also has 11 city gate stations and 42
CNG

Expected Sectoral Gas Utilization
for XI-XII five year plans
Source: Working Group for P&NG
sector for XI plan (2007-12)
Industry Scenario
Presently Natural Gas
and is rapidly gaining popularity in India due to its ease of handling, better energy
efficiency and environmental friendliness. It is expected that by 2020 natural gas will
constitute about 23% o
With the starting of supplies from KG D6 fields there has been a rapid growth in
India’s gas production. The ministry of Petroleum and Natural Gas under the
direction of empowered group of ministers allocates gas from the D6 fiel
Gas Utilization policy. There is
while the demand is expected to
will remain dependent on imported LNG for some years to come.
Currently the main consumers of natural gas are power and fertilizer units. The
demand from City Gas Distribution customers, natural gas vehicles, households and
commercial establishments has also shown good growth over past few years.
GAIL PMT
49%GAIL APM
5%
NIKO
5%
CAIRN
15%rLNG
26%
Gas Sourcing Mix
45%
25%
6%8%13%3%
Power Fertilizer City Gas
Industrial Petrochem Sponge Iron
Industry Scenario
Presently Natural Gas currently forms about 11% of India’s primary energy basket
and is rapidly gaining popularity in India due to its ease of handling, better energy
efficiency and environmental friendliness. It is expected that by 2020 natural gas will
constitute about 23% of India’s energy basket.
With the starting of supplies from KG D6 fields there has been a rapid growth in
India’s gas production. The ministry of Petroleum and Natural Gas under the
direction of empowered group of ministers allocates gas from the D6 fiel
Gas Utilization policy. There is a shortage in availability of gas from indigenous
while the demand is expected to remain on an upward trajectory. As a result
ill remain dependent on imported LNG for some years to come.
Currently the main consumers of natural gas are power and fertilizer units. The
demand from City Gas Distribution customers, natural gas vehicles, households and
commercial establishments has also shown good growth over past few years.
Source: Working Group for P&NG sector for XI plan (2007
Source: Company Annual Report
0
50
100
150
200
250
300
350
2010 2011 2012 2013
Demand
currently forms about 11% of India’s primary energy basket
and is rapidly gaining popularity in India due to its ease of handling, better energy
efficiency and environmental friendliness. It is expected that by 2020 natural gas will
With the starting of supplies from KG D6 fields there has been a rapid growth in
India’s gas production. The ministry of Petroleum and Natural Gas under the
direction of empowered group of ministers allocates gas from the D6 fields as per
availability of gas from indigenous fields
remain on an upward trajectory. As a result India
ill remain dependent on imported LNG for some years to come.
Currently the main consumers of natural gas are power and fertilizer units. The
demand from City Gas Distribution customers, natural gas vehicles, households and
commercial establishments has also shown good growth over past few years.
Group for P&NG sector for XI plan (2007-12)
Source: Company Annual Report, Company Presentation
2014

LATEST QUARTER’S FINANCIAL HIGHLIGHTS
Source: ACE Equity, ANS Research
PROFIT & LOSS (6 months ended 2010) (CONSOLIDATED RESULTS)
(In Crores)
Particulars Mar-2011 Mar-2010 % VAR
Net Sales 520.30 401.40 29.62
Other Income 10.13 3.96 156
Total Exp. 420.36 307.49 36.71
Op. Profit 118.90 106.50 11.64
Interest 0.04 0.03 9.38
Depreciation 14.51 12.84 13.02
PBT 104.36 93.63 11.45
Tax 32.06 31.64 1.33
PAT 72.30 62.0 16.61
Adjusted EPS (Annualized) 22.48 19.24 16.86
PBIDTM % 22.11 25.58 13.55
PATM% 13.45 14.89 9.69

PROFIT & LOSS (CONSOLIDATED
Particulars Dec 13 (E) Dec 12 (E) Dec 11 (E) Dec
Net Sales 2885.74 2531.35 2182.20 1849.33
Total Exp. 2258.08 1980.77 1707.56 1435.15
Other Income 40.40 35.44 30.55 23.83
EBIDTA 627.66 550.58 474.63 438.01
Depreciation 78.40 71.64 62.60 54.21
Interest 0.65 0.57 0.49 0.46
EBT 548.60 478.36 411.54 383.34
Tax 177.91 155.13 133.46 124.32
PAT/ Net Profit 369.42 321.96 276.80 257.75
Adjusted EPS 28.84 25.15 21.64 20.20
Div (%) 225 200 200 600
BALANCE SHEET (CONSOLIDATED
Particulars Dec 13 (E) Dec 12 (E) Dec 11 (E) Dec
Share Capital 40.05 40.05 40.05 40.05
Total Funds 1636.21 1335.49 1074.74 859.14
Total Debts 242.41 212.64 183.31 155.35
Net Block 1050.92 906.11 775.05 661.46
Net Current Assets -284.17 -243.52 -208.69 -174.78
Total Assets 1851.48 1586.66 1359.72 1165.24
Cont. Liabilities 41.84 41.84 41.84 41.84
Book Value/Share 127.31 103.91 83.62 66.99
0
300
600
900
1200
1500
1800
2100
2400
2700
3000
3300
3600
Net Sales Total Exp.
2009 2010 2011 (E)
0
200
400
600
800
1000
1200
1400
1600
1800
2000
Funds Debt
2009 2010 2011 (E) 2012 (E)
CONSOLIDATED RESULTS)
(IN CRORES)
Dec 10 Dec 09
1849.33 1419.67
1435.15 1140.17
23.83 26.65
438.01 306.15
54.21 47.38
0.46 0.14
383.34 258.63
124.32 83.61
257.75 174.16
20.20 13.65
600 400
CONSOLIDATED RESULTS)
(IN CRORES)
Dec 10 Dec 09
40.05 40.05
859.14 779.70
155.35 127.37
661.46 606.43
174.78 -144.05
1165.24 1021.71
41.84 35.0
66.99 60.80
EBIDTA PAT
2012 (E) 2013 (E)
Total Assets B.V./Share
2012 (E) 2013 (E)

CASH FLOW (CONSOLIDATED RESULTS)
(IN CRORES)
Particulars Dec 13 (E) Dec 12 (E) Dec 11 (E) Dec 10 Dec 09
EBIT 548.60 478.36 411.54 383.34 258.63
Depreciation 78.40 71.64 62.60 54.21 47.38
Working Capital Changes -40.64 -34.83 -33.91 -14.0 -36.42
Taxes -177.91 -155.13 -133.46 -123.62 -77.84
Cash From Operations 409.01 360.52 307.17 287.36 178.16
Capital Expenditure 148.12 126.93 108.78 115.15 155.31
Free Cash Flow 260.89 233.59 198.39 172.21 22.85
Cash From Investments -199.37 -162.46 -154.79 -216.41 -196.60
Cash From Financing -39.58 -32.45 -33.74 -69.5 3.89
Net Cash Inflow/Outflow 170.06 165.61 118.64 1.45 -14.55
Opening Cash & Cash Equity 293.62 128 9.36 7.91 22.47
Closing Cash & Cash Equiv. 463.67 293.62 128 9.36 7.91
Z-Score Sheet
Particulars 06 07 08 09 10
Working Capital/Total Assets -0.12 -0.09 -0.08 -0.15 -0.16
Retained Earn/Total Assets 0.13 0.19 0.16 0.06 0.07
EBIT/Total Assets 0.24 0.33 0.27 0.28 0.36
MCAP/Total Liabilities 0.31 1.77 1.07 3.43 4.88
Net Worth/Total Liabilities 5.16 5.28 5.72 5.05 4.17
Z-Score 6.64 7.75 7.88 6.34 5.96
Safe Safe Safe Safe Safe
IMPORTANT RATIOS (CONSOLIDATED RESULTS)
Particulars Dec 13 (E) Dec 12 (E) Dec 11 (E) Dec 10 Dec 09
EBIDTA Margin (%) 21.45 21.45 21.45 23.38 21.17
Net Profit Margin (%) 12.62 12.54 12.51 13.76 12.04
D/E 0.15 0.16 0.17 0.18 0.16
Financial Leverage (X) 1.16 1.22 1.31 1.33 1.30
Current Ratio 3.53 3.53 3.53 4.10 3.42
Cash Ratio 1.30 1.0 0.57 0.24 0.20
ROANW (%) 24.86 26.72 28.63 31.46 23.15
ROAIC (%) 37.84 38.50 38.65 40.35 32.09
EV/Sales 1.74 2.04 2.43 2.91 2.20
EV/EBIDTA 8.0 9.38 11.16 13 11.16
Profit Plough back (%) 84.40 84.10 81.51 40.58 41.38
Total Asset Turnover (X) 1.68 1.72 1.73 1.69 1.45

DCF Valuation (Per share):
Source: ANS Research
FY 11 FY 12 FY 13 FY 14 FY 15 Terminal
EBIDTA 474.63 550.58 627.66 702.98 787.33
Tax Payable 133.46 155.13 177.91 198.24 220.84
Changes in W.C. 33.91 34.83 40.64 47.43 55.34
Capex 108.78 126.93 148.12 172.84 201.69
Free Cash Flow 265.81 302.77 341.62 378.59 419.34 241.29
Intermediate growth rate 8%
Terminal growth rate 3%
WACC 7.56%
Enterprise Value 6414
Debt 155.35
Per Share value 487

Investment Positives
Changing perception about Natural Gas will result in good growth potential for the
company
Natural gas consumption is slowly gaining acceptance among both the industrial and
retail users. With the green initiative being launched across the world to counter global
warming, natural gas has been accepted as one of the preferred sources of energy due
to its greener and cleaner image. This change in perception will definitely play a very
important role in helping Gujarat gas grow its business.
Rapid Growth expected in company’s region of operations
The southern belt of Gujarat consisting of Ankleshwar, Bharuch and Surat has been
seeing rapid development for past few years and these regions are slowly being
heavily industrialized due to the efforts of Gujarat Government. Surat is one of India’s
fastest growing cities and many MOUs have been signed by the Gujarat government
during the Vibrant Gujarat Global Investors’ summit in 2011 for investments in and
around Surat and Bharuch districts. These factors would help Gujarat Gas in achieving
good growth going forward as more and more industries set up their operations in the
region and switch to cleaner fuels like natural gas for their energy needs.
Parent’s strong global positioning and focus on increasing rLNG in supply mix
BG’s global rLNG portfolio will help Gujarat gas ride out these tough times wherein the
input costs have been increasing due to higher LNG prices. Due to its proximity to BG
the company will be able to source rLNG at competitive prices. Moreover Gujarat Gas
is also expected to increasingly target industrial segments which might provide greater
headroom for price hikes thereby helping it maintain its margins.
Investment Risks
Sourcing of Gas will remain a key challenge
Gujarat gas may face supply problems from indigenous sources of natural gas due to
shortfall in the overall supply. To protect itself from the domestic shortfall of natural
gas the company has entered into a contract with its parent BG group for receiving
rLNG supply for the medium term.
Increasing prices of Natural Gas
Due to strained supplies and higher demand, the prices of natural gas have
been increasing resulting in margin pressures building up on the company.
Other Risks
Regulatory Challenges
Competitive Challenges

Peer Comparison Particulars (Mar 2011) GSPL Petronet LNG Indraprastha Gas
(In Crores) Standalone Standalone Standalone
Net Sales 1046 13197.29 1966.92
Total Expenditure 77.16 11980.98 1263.49
EBIDTA 990.99 1284.26 505.48
PAT 506.38 619.62 259.77
EPS 8.97 8.26 18.55
Equity Capital 562.58 750 140
Total Reserves 1442.42 1930.16 1003
Total Debt 1483.50 3216.14 463.30
Latest Enterprise Value 6354.26 14184 5934.69
D/E 0.74 1.20 0.46
PBIDTM (%) 92.63 9.73 25.70
PATM (%) 48.39 4.70 13.21
ROCE (%) 28.29 20.69 34.30
ROE (%) 28.38 25.21 28.40
Dividend (%) 10 20 50
Sources: ANS Research
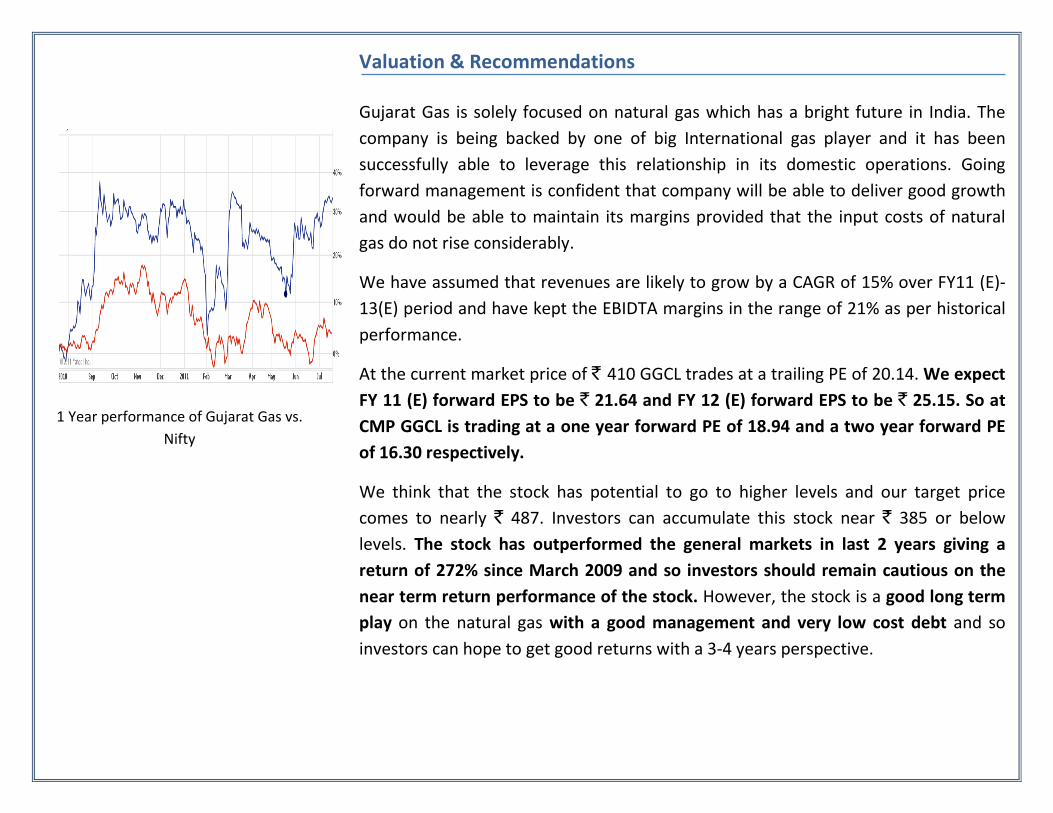
1 Year performance of Gujarat Gas vs.
Nifty
Valuation & Recommendations
Gujarat Gas is solely focused on natural gas which has a bright future in India. The
company is being backed by one of big International gas player and it has been
successfully able to leverage this relationship in its domestic operations. Going
forward management is confident that company will be able to deliver good growth
and would be able to maintain its margins provided that the input costs of natural
gas do not rise considerably.
We have assumed that revenues are likely to grow by a CAGR of 15% over FY11 (E)-
13(E) period and have kept the EBIDTA margins in the range of 21% as per historical
performance.
At the current market price of ` 410 GGCL trades at a trailing PE of 20.14. We expect
FY 11 (E) forward EPS to be ` 21.64 and FY 12 (E) forward EPS to be ` 25.15. So at
CMP GGCL is trading at a one year forward PE of 18.94 and a two year forward PE
of 16.30 respectively.
We think that the stock has potential to go to higher levels and our target price
comes to nearly ` 487. Investors can accumulate this stock near ` 385 or below
levels. The stock has outperformed the general markets in last 2 years giving a
return of 272% since March 2009 and so investors should remain cautious on the
near term return performance of the stock. However, the stock is a good long term
play on the natural gas with a good management and very low cost debt and so
investors can hope to get good returns with a 3-4 years perspective.

Disclaimer: The information being provided to you is compiled from sources we believe to be reliable. ANS Pvt. Ltd cannot and does not take any
guarantees about the accuracy, reliability, validity or timeliness of the information and/or data provided/made available to you in this document.
The views are purely indicative. Neither ANSPL nor any of its associates, subsidiaries, affiliates, directors, and/or officials become liable or have any
kind of responsibility for any loss or damage that you may incur from any decisions taken by you based on our recommendations. None of the
information contained herein constitutes a solicitation from ANSPL to Buy and/or Sell securities and/or any Future, Options or Other Financial
Contracts. Clients may exercise their own caution and double check or verify the information contained in our recommendations.