Embed Size (px)
Citation preview

HAL Trust
Report on the first half year 2013
Interim report of the Executive Board HAL Holding N.V. 3
Condensed Interim Consolidated Financial Statements HAL Trust 6

3
First half year net income of € 260 million (2012: € 213 million)
Net asset value decreases by € 266 million (4%)
Net income of HAL Holding N.V. for the first six months of 2013 amounted to € 260 million (€ 3.74 per
share) compared to € 213 million (€ 3.07 per share) for the same period last year, representing an increase
of € 47 million (€ 0.67 per share). This increase was primarily due to higher income from the quoted
minority interests.
The net asset value based on the market value of the quoted associates and the liquid portfolio and on the
book value of the unquoted companies, decreased by € 266 million (4%) during the first six months of
2013. Taking into account the cash portion of the 2012 dividend (€ 59 million) and the sale of treasury
shares (€ 1 million), the net asset value decreased from € 7,241 million (€ 104.35 per share) on December
31, 2012 to € 6,917 million (€ 96.67 per share) on June 30, 2013. The main reason for this change was the
decrease in the share prices of Koninklijke Vopak N.V. and Koninklijke Boskalis Westminster N.V. The
net asset value does not include the positive difference between estimated value and book value of the
unquoted companies. This difference is calculated annually and, based on the principles and assumptions
set out in the 2012 annual report, amounted to € 621 million (€ 8.95 per share) on December 31, 2012.
The net asset value as of December 31, 2012 was restated from € 7,255 million to € 7,241 million due to
the implementation of IAS 19R which resulted in a decrease of € 14 million.
During the period from June 30, 2013 through August 23, 2013, the value of the ownership interests in
quoted associates and the liquid portfolio decreased by € 55 million (€ 0.77 per share).
The financial information in this report is unaudited.
Results
Revenues for the first half year amounted to € 2,043 million (2012: € 1,990 million) representing an
increase of € 53 million (2.7%). Excluding the effect of acquisitions (€ 82 million) and currency exchange
differences (€ -8 million), revenues decreased by € 21 million (1.1%).
Revenues from the optical retail companies for the first half year amounted to € 1,266 million (2012:
€ 1,194 million) representing an increase of € 72 million (6%). Excluding the effect of acquisitions (€ 52
million) and currency exchange differences (€-6 million), revenues from the optical retail companies
increased by € 26 million (2.2%). The same store sales, based on constant exchange rates, increased by
1.2 % during the first half year when compared with the same period last year. The operating income of
the optical retail companies (income before interest, exceptional and non-recurring items, taxes and
amortization of intangible assets but including amortization of software) for the first half year amounted to
€ 128 million (2012: € 125 million).
Revenues from the other unquoted subsidiaries for the first half year amounted to € 777 million (2012:
€ 797 million) representing a decrease of € 20 million (2.5%). Excluding the effect of acquisitions (€ 30
million) and currency exchange differences (€ -2 million), revenues from the other unquoted subsidiaries
decreased by € 48 million (6.0%). This decrease is mainly the result of lower sales at PontMeyer N.V.,
AudioNova International B.V., Broadview Holding B.V. and Koninklijke Ahrend N.V. The operating
income of the other unquoted companies (income before interest, exceptional and non-recurring items,
taxes and amortization of intangible assets but including amortization of software) for the first half year
4
amounted to € 21 million (2012: € 40 million). This decrease is primarily due to lower operating income of
AudioNova International B.V. (mainly due to lower sales in the Netherlands as a result of a change in the
regulations for the reimbursement of hearing aids), Broadview Holding B.V., and Koninklijke Ahrend
N.V.
Income from associates increased by € 22 million to € 155 million, primarily due to the capital gain of
€ 22 million on the sale of the 31.6% ownership interest in Dockwise Ltd. to Koninklijke Boskalis
Westminster N.V.
Income from other financial assets increased by € 26 million to € 33 million, primarily due to a capital
gain of € 26 million on the redemption at par of the € 68 million Senior 9⅝% Notes issued by Safilo Group
S.p.A.
Exceptional and non recurring items had a negative effect of € 1 million on profit before income tax (2012:
a negative effect of € 18 million).
The statement of income for 2012 was restated for the effects of the implementation of IAS 19R.
Liquid portfolio and net debt
The corporate liquid portfolio at the end of June 2013 amounted to € 268 million (December 31, 2012:
€ 171 million). The consolidated net debt as of June 30, 2013 (defined as short-term and long-term bank
debt less cash and cash equivalents and marketable securities) amounted to € 800 million (December 31,
2012: € 968 million). The decrease in consolidated net debt is primarily due to the proceeds from the sale
of the ownership interest in Dockwise Ltd. to Koninklijke Boskalis Westminster N.V. (€ 274 million) and
the redemption of Senior Notes issued by Safilo Group S.p.A (€ 68 million) offset by investments in quoted
minority interests (€ 138 million) and the payment of the cash portion of the 2012 dividend (€ 59 million).
As of June 30, 2013, 64% of the corporate liquid portfolio was invested in short-term time -deposits
amounting to € 172 million (December 31, 2012: € 82 million) and 36% in equities for an amount of € 96
million (December 31, 2012: € 89 million). The corporate liquid portfolio provided a total return of 8.6%
during the first half of 2013 compared to -2% for the same period last year.
Acquisitions and divestitures
In January, HAL participated for its proportionate 33.9% share (€ 108.4 million) in a capital increase of
Koninklijke Boskalis Westminster N.V.
In March, the 31.6% ownership interest including the preference shares in Dockwise Ltd. was sold to
Koninklijke Boskalis Westminster N.V. for a total consideration of € 273.7 million resulting in a capital
gain of € 22 million.
In April, HAL participated for € 29.4 million in a rights issue of SBM Offshore N.V. This rights issue was
underwritten by HAL. HAL’s current interest in SBM Offshore N.V. is 13.5% (before the rights issue:
13.3%).
In May, the € 68 million Senior 9⅝% Notes issued by Safilo Group S.p.A. were redeemed at par, resulting
in a capital gain of € 26 million.
5
Risks
In the 2012 annual report, the Company included a description of risks associated with its strategy and its
implementation such as, but not limited to: market value risk, interest rate risk, currency risk, credit risk,
liquidity risk, concentration risk, acquisition risk and other risks. The descriptions of these risks are deemed
to be incorporated in this report by reference. We expect that the above risk factors will continue to exist
for the second half of 2013. In the Company’s view, the nature of these risk factors has not materially
changed in the first half of 2013. We also refer to the statement on page 20 of this report.
Prospects
In view of the fact that a significant part of the Company’s net income is determined by the results of the
quoted associates and potential capital gains and losses we do not express an expectation as to the net
income for 2013.
Supervisory Board
Mr. A.H. Land, member of the Supervisory Board, has announced he will resign from the Supervisory
Board for personal reasons effective August 28, 2013.
Mr. Land was appointed member of the Supervisory Board in 1999.
The Supervisory Board and the Executive Board are most grateful for Mr. Land’s support and valuable
contributions to the Company.
It is expected that the vacancy resulting from Mr. Land’s resignation will be filled during the general
meeting of shareholders in May 2014.
Financial calendar
Interim statement November 14, 2013
Publication of preliminary net asset value January 23, 2014
Publication of 2013 annual results March 27, 2014
Shareholders’ meeting HAL Trust and interim statement May 16, 2014
The Executive Board of HAL Holding N.V.
August 28, 2013
HAL Trust
Condensed Interim Consolidated Financial Statements June 30, 2013
6
Contents
Interim Consolidated Statement of Financial Position 7
Interim Consolidated Statement of Income 8
Interim Consolidated Statement of Comprehensive Income 9
Interim Consolidated Statement of Changes in Equity 10
Interim Consolidated Statement of Cash Flows 11
Notes to the Condensed Interim Consolidated Financial Statements 12
List of Principal Subsidiaries and Associates 19
Statement by the Executive Board 20
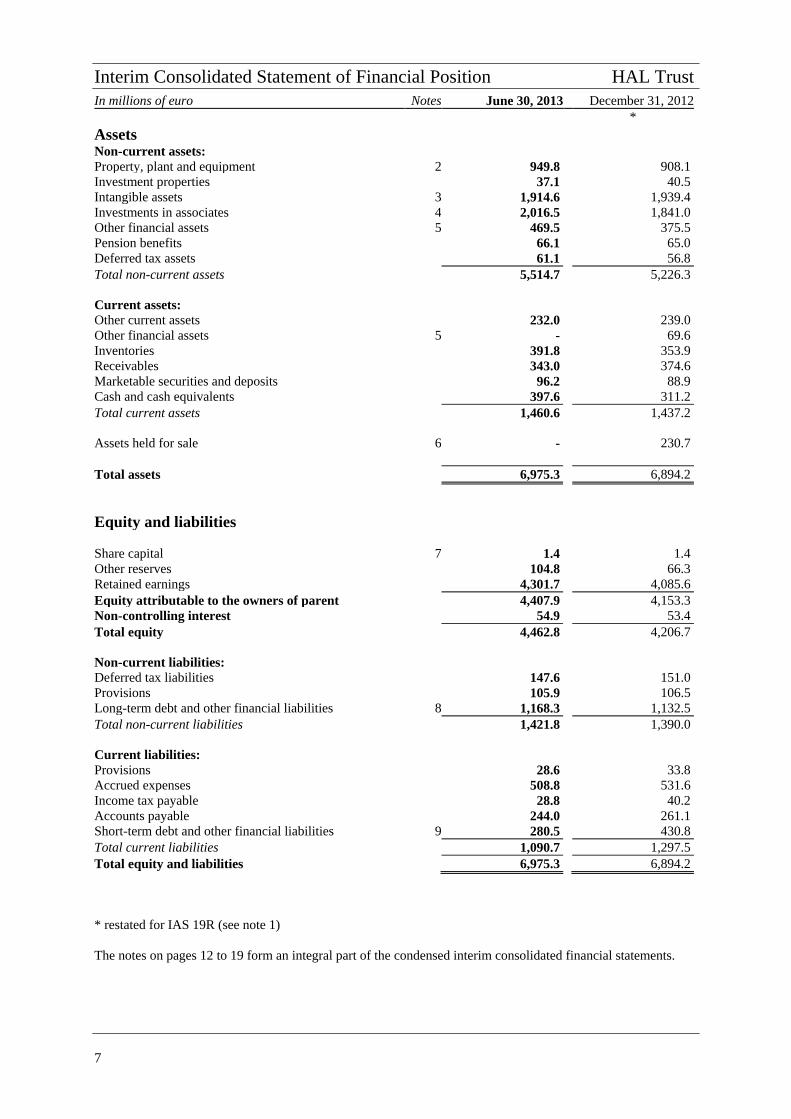
Interim Consolidated Statement of Financial Position HAL Trust
7
In millions of euro Notes June 30, 2013 December 31, 2012
*
Assets Non-current assets:
Property, plant and equipment 2 949.8 908.1
Investment properties 37.1 40.5
Intangible assets 3 1,914.6 1,939.4
Investments in associates 4 2,016.5 1,841.0
Other financial assets 5 469.5 375.5
Pension benefits 66.1 65.0
Deferred tax assets 61.1 56.8
Total non-current assets 5,514.7 5,226.3
Current assets:
Other current assets 232.0 239.0
Other financial assets 5 - 69.6
Inventories 391.8 353.9
Receivables 343.0 374.6
Marketable securities and deposits 96.2 88.9
Cash and cash equivalents 397.6 311.2
Total current assets 1,460.6 1,437.2
Assets held for sale 6 - 230.7
Total assets 6,975.3 6,894.2
Equity and liabilities
Share capital 7 1.4 1.4
Other reserves 104.8 66.3
Retained earnings 4,301.7 4,085.6
Equity attributable to the owners of parent 4,407.9 4,153.3
Non-controlling interest 54.9 53.4
Total equity 4,462.8 4,206.7
Non-current liabilities:
Deferred tax liabilities 147.6 151.0
Provisions 105.9 106.5
Long-term debt and other financial liabilities 8 1,168.3 1,132.5
Total non-current liabilities 1,421.8 1,390.0
Current liabilities:
Provisions 28.6 33.8
Accrued expenses 508.8 531.6
Income tax payable 28.8 40.2
Accounts payable 244.0 261.1
Short-term debt and other financial liabilities 9 280.5 430.8
Total current liabilities 1,090.7 1,297.5
Total equity and liabilities 6,975.3 6,894.2
* restated for IAS 19R (see note 1)
The notes on pages 12 to 19 form an integral part of the condensed interim consolidated financial statements.
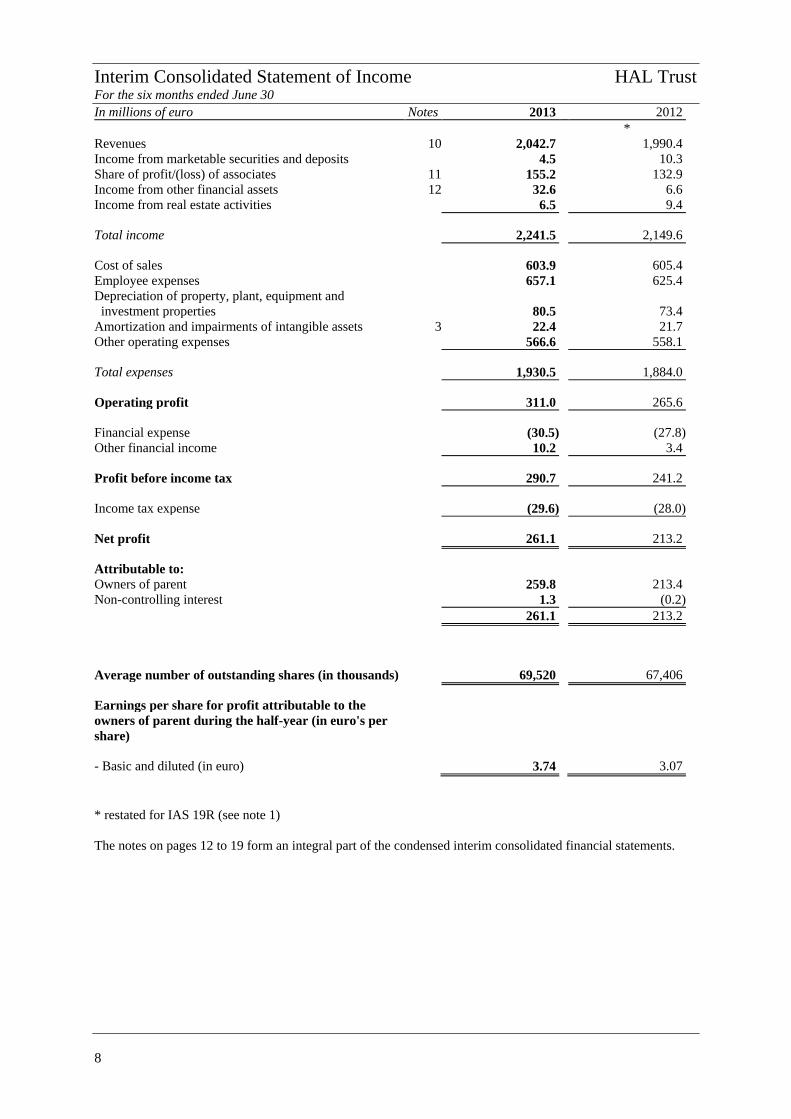
Interim Consolidated Statement of Income HAL Trust For the six months ended June 30
8
In millions of euro Notes 2013 2012
*
Revenues 10 2,042.7 1,990.4
Income from marketable securities and deposits 4.5 10.3
Share of profit/(loss) of associates 11 155.2 132.9
Income from other financial assets 12 32.6 6.6
Income from real estate activities 6.5 9.4
Total income 2,241.5 2,149.6
Cost of sales 603.9 605.4
Employee expenses 657.1 625.4
Depreciation of property, plant, equipment and
investment properties 80.5 73.4
Amortization and impairments of intangible assets 3 22.4 21.7
Other operating expenses 566.6 558.1
Total expenses 1,930.5 1,884.0
Operating profit 311.0 265.6
Financial expense (30.5) (27.8)
Other financial income 10.2 3.4
Profit before income tax 290.7 241.2
Income tax expense (29.6) (28.0)
Net profit 261.1 213.2
Attributable to:
Owners of parent 259.8 213.4
Non-controlling interest 1.3 (0.2)
261.1 213.2
Average number of outstanding shares (in thousands) 69,520 67,406
Earnings per share for profit attributable to the
owners of parent during the half-year (in euro's per
share)
- Basic and diluted (in euro) 3.74 3.07
* restated for IAS 19R (see note 1)
The notes on pages 12 to 19 form an integral part of the condensed interim consolidated financial statements.
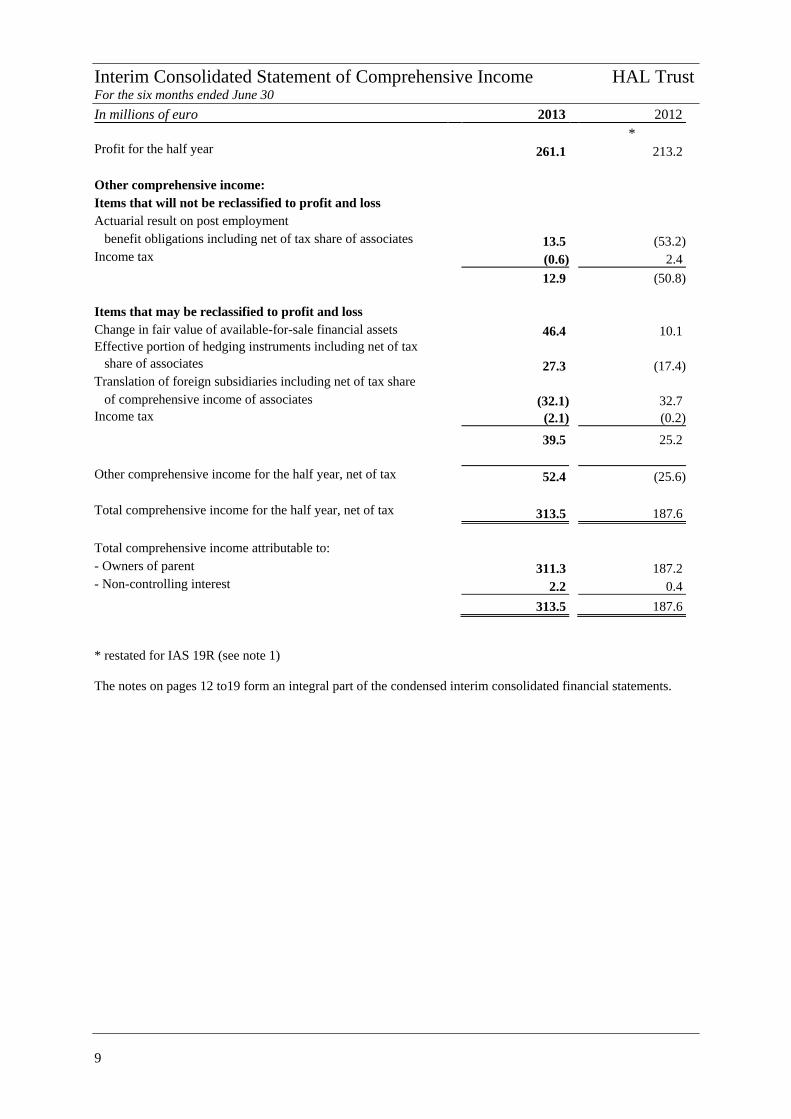
Interim Consolidated Statement of Comprehensive Income HAL Trust For the six months ended June 30
9
In millions of euro 2013 2012
* Profit for the half year 261.1 213.2
Other comprehensive income:
Items that will not be reclassified to profit and loss
Actuarial result on post employment
benefit obligations including net of tax share of associates 13.5 (53.2)
Income tax (0.6) 2.4
12.9 (50.8)
Items that may be reclassified to profit and loss
Change in fair value of available-for-sale financial assets 46.4 10.1
Effective portion of hedging instruments including net of tax
share of associates 27.3 (17.4)
Translation of foreign subsidiaries including net of tax share
of comprehensive income of associates (32.1) 32.7
Income tax (2.1) (0.2)
39.5 25.2
Other comprehensive income for the half year, net of tax 52.4 (25.6)
Total comprehensive income for the half year, net of tax 313.5 187.6
Total comprehensive income attributable to:
- Owners of parent 311.3 187.2
- Non-controlling interest 2.2 0.4
313.5 187.6
* restated for IAS 19R (see note 1)
The notes on pages 12 to19 form an integral part of the condensed interim consolidated financial statements.

Interim Consolidated Statement of Changes in Equity HAL Trust
10
Attributable to owners of parent
In millions of euro Non- *
Share Retained Other controlling Total
capital earnings reserves Total interest equity
Balance on January 1, 2012 1.3 3,877.2 91.4 3,969.9 51.6 4,021.5 Restatement as a result of the implementation
of IAS 19R (net of tax) - (57.0) - (57.0) - (57.0)
Restated balance on January 1, 2012 1.3 3,820.2 91.4 3,912.9 51.6 3,964.5
Change in fair value of financial assets
available-for-sale
- Marketable securities - - (18.5) (18.5) - (18.5)
- Other financial assets and associates - - 28.6 28.6 - 28.6
Translation of foreign subsidiaries
including share of other comprehensive
income of associates - - 31.9 31.9 0.8 32.7 Effective portion of hedging instruments
including share of associates - - (17.4) (17.4) (0.2) (17.6)
Actuarial result on post employment
obligations (net of tax) - (50.8) - (50.8) - (50.8)
Net profit for the half year - 213.4 - 213.4 (0.2) 213.2
Total comprehensive income for the period - 162.6 24.6 187.2 0.4 187.6
Acquisitions, disposals and
reclassifications - - - - (8.4) (8.4) Treasury shares - 0.7 - 0.7 - 0.7
Dividend paid 0.1 (52.3) (0.1) (52.3) - (52.3)
Transactions with owners of the Company
recognized directly in equity 0.1 (51.6) (0.1) (51.6) (8.4) (60.0)
Balance on June 30, 2012 1.4 3,931.2 115.9 4,048.5 43.6 4,092.1
Balance on January 1, 2013 1.4 4,232.6 66.3 4,300.3 53.4 4,353.7
Restatement as a result of the implementation
of IAS 19R (net of tax) - (147.0) - (147.0) - (147.0)
Restated balance on January 1, 2013 1.4 4,085.6 66.3 4,153.3 53.4 4,206.7
Change in fair value of financial assets
available-for-sale
- Marketable securities - - 6.5 6.5 - 6.5
- Other financial assets and associates - - 39.9 39.9 - 39.9
Translation of foreign subsidiaries
including share of other comprehensive
income of associates - - (32.3) (32.3) 0.2 (32.1)
Effective portion of hedging instruments
including share of associates - - 24.5 24.5 0.7 25.2
Actuarial result on post employment
obligations (net of tax) - 12.9 - 12.9 - 12.9 Net profit for the half year - 259.8 - 259.8 1.3 261.1
Total comprehensive income for the period - 272.7 38.6 311.3 2.2 313.5
Acquisitions, disposals and
reclassifications - 1.1 - 1.1 (0.7) 0.4 Treasury shares - 1.2 - 1.2 - 1.2
Dividend paid - (59.0) - (59.0) - (59.0)
Transactions with owners of the Company
recognized directly in equity - (56.7) - (56.7) (0.7) (57.4)
Balance on June 30, 2013 1.4 4,301.6 104.9 4,407.9 54.9 4,462.8
* restated for IAS 19R (see note 1)
The notes on pages 12 to 19 form an integral part of the condensed interim consolidated financial statements.
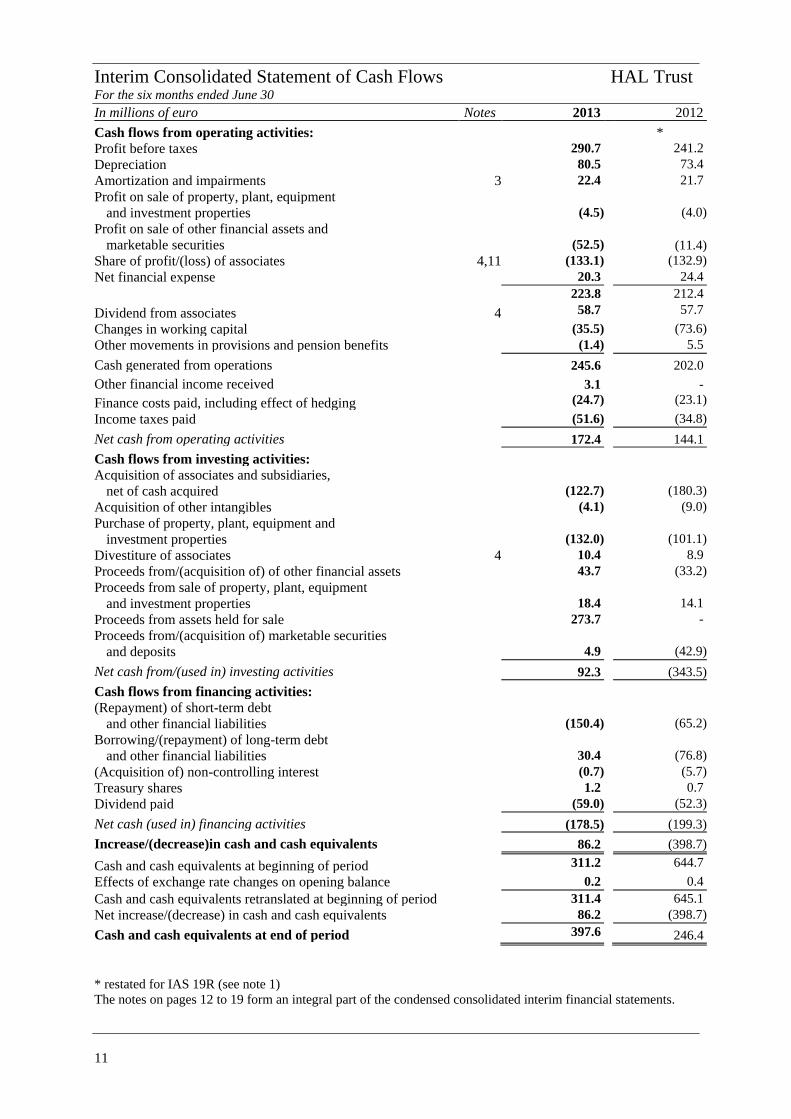
Interim Consolidated Statement of Cash Flows HAL Trust For the six months ended June 30
11
In millions of euro Notes 2013 2012
Cash flows from operating activities: *
Profit before taxes 290.7 241.2
Depreciation 80.5 73.4
Amortization and impairments 3 22.4 21.7
Profit on sale of property, plant, equipment
and investment properties (4.5) (4.0)
Profit on sale of other financial assets and
marketable securities (52.5) (11.4)
Share of profit/(loss) of associates 4,11 (133.1) (132.9)
Net financial expense 20.3 24.4
223.8 212.4
Dividend from associates 4 58.7 57.7
Changes in working capital (35.5) (73.6)
Other movements in provisions and pension benefits (1.4) 5.5
Cash generated from operations 245.6 202.0
Other financial income received 3.1 -
Finance costs paid, including effect of hedging (24.7) (23.1)
Income taxes paid (51.6) (34.8)
Net cash from operating activities 172.4 144.1
Cash flows from investing activities:
Acquisition of associates and subsidiaries,
net of cash acquired (122.7) (180.3)
Acquisition of other intangibles (4.1) (9.0)
Purchase of property, plant, equipment and
investment properties (132.0) (101.1)
Divestiture of associates 4 10.4 8.9
Proceeds from/(acquisition of) of other financial assets 43.7 (33.2)
Proceeds from sale of property, plant, equipment
and investment properties 18.4 14.1
Proceeds from assets held for sale 273.7 -
Proceeds from/(acquisition of) marketable securities
and deposits 4.9 (42.9)
Net cash from/(used in) investing activities 92.3 (343.5)
Cash flows from financing activities:
(Repayment) of short-term debt
and other financial liabilities (150.4) (65.2)
Borrowing/(repayment) of long-term debt
and other financial liabilities 30.4 (76.8)
(Acquisition of) non-controlling interest (0.7) (5.7)
Treasury shares 1.2 0.7
Dividend paid (59.0) (52.3)
Net cash (used in) financing activities (178.5) (199.3)
Increase/(decrease)in cash and cash equivalents 86.2 (398.7)
Cash and cash equivalents at beginning of period 311.2 644.7
Effects of exchange rate changes on opening balance 0.2 0.4
Cash and cash equivalents retranslated at beginning of period 311.4 645.1
Net increase/(decrease) in cash and cash equivalents 86.2 (398.7)
Cash and cash equivalents at end of period 397.6 246.4
* restated for IAS 19R (see note 1)
The notes on pages 12 to 19 form an integral part of the condensed consolidated interim financial statements.
Notes to the Condensed Interim Consolidated Financial Statements
12
General
Reporting entity
The condensed interim consolidated financial
statements 2013 comprise HAL Trust (‘the
Trust’), a Bermuda trust formed in 1977, and its
subsidiaries as well as the interests in associates
and jointly controlled entities. HAL Trust shares
are listed and traded on NYSE Euronext in
Amsterdam. The Trust’s only asset consists of all
outstanding shares of HAL Holding N.V. (‘the
Company’), a Curaçao corporation. The
condensed interim consolidated financial
statements have not been audited nor reviewed by
an external auditor.
The Company’s strategy is focused on acquiring
and holding significant shareholdings in
companies, with the objective of increasing long-
term shareholders’ value. When selecting
investment candidates, the Company emphasizes,
in addition to investment and return criteria, the
potential of playing an active role as a shareholder
and/or board member. Given the emphasis on the
longer term, the Company does not have a pre-
determined investment horizon. HAL also owns
real estate. The real estate investment activities
are concentrated in the greater Seattle
metropolitan area with an emphasis on the
development and rental of multi-family properties
and office buildings.
Basis of preparation
Statement of compliance
The condensed interim consolidated financial
statements for the six months ended June 30, 2013
have been prepared in accordance with
International Financial Reporting Standard (IFRS)
IAS 34 -Interim Financial Reporting-, and were
authorized for issue on August 28, 2013. The
condensed interim consolidated financial
statements do not include all the information and
disclosures as required in the annual financial
statements and should therefore be read in
conjunction with the annual financial statements
for the year ended December 31, 2012 as
published on March 27, 2013, which have been
prepared in accordance with IFRS as adopted by
the European Union. In the schedules on the
following pages, the columns June 30, 2013 and
June 30, 2012 represent the six-month periods
ended June 30, 2013 and June 30, 2012. The
column December 31, 2012 represents the twelve-
month period ended December 31, 2012.
Due to the nature of the Company’s activities,
investments and disposals can have a significant
impact on net income. Accordingly, the results for
the first six months might not be representative of
the results for 2013 as a whole.
Estimates
The preparation of these condensed interim
consolidated financial statements requires
management to make judgements, estimates and
assumptions that affect the application of
accounting policies and reported amounts of
assets and liabilities and disclosure of contingent
assets and liabilities at the date of the condensed
interim consolidated financial statements and the
reported amounts of revenue and expenses during
the reporting period. Although these estimates are
based on management’s best knowledge, actual
results may ultimately differ from those estimates.
Accordingly, it is reasonably possible that
outcomes in future accounting periods that are
different from the estimates and assumptions
could have an impact on the carrying amount of
the asset or liability affected. In preparing these
condensed interim consolidated financial
statements, the significant judgements made by
management in applying the accounting policies
of HAL Trust and the key sources of estimation
uncertainty were the same as those applied to the
consolidated financial statements as of and for the
year ended December 31, 2012.
Significant accounting policies
The significant accounting policies applied in
these condensed interim consolidated financial
statements are consistent with those applied in the
consolidated financial statements as of and for the
year ended December 31, 2012 except for the
following changes in accounting policies and
disclosures:
- The revised IAS 19 is effective as from January
1, 2013. The impact is as follows: the corridor
approach has been eliminated and all actuarial
gains and losses are recognized in other
comprehensive income as they occur; all past
service costs are immediately recognized; and
13
interest cost and expected return on plan assets are
replaced with an net interest amount that is
calculated by applying the discount rate to the net
defined benefit liability (asset). In accordance
with IAS 8 the financial statements of the
comparable interim period and the financial
statements as of December 31, 2012 were
restated. The effect of the restatement is disclosed
in Note 1.
- IFRS 13, “Fair Value Measurement” is effective
as from January 1, 2013. This standard does not
extend the use of fair value accounting but
provides guidance on how it should be applied
where its use is already required or permitted by
other standards within IFRS. The adoption of
IFRS 13 did not materially impact the condensed
interim consolidated financial statements.
Additional disclosures were included in the
condensed interim consolidated financial
statements.
- Amendments to IAS 1, Presentation of Financial
Statements are effective as from January 1, 2013.
The main change was a requirement to group
items in other comprehensive income on the basis
whether they are potentially reclassifiable to profit
or loss.
- Income taxes have been accrued using the tax
rate that is expected to be applicable to the total
annual profit or loss. The annual tax rate for the
year ended December 31, 2012 was 26.8%. The
estimated tax rate for the six months June 30,
2013 was 26.5%.
- Annual impairment tests on goodwill and
intangible assets with indefinite useful lives are
performed in the fourth quarter of each year.
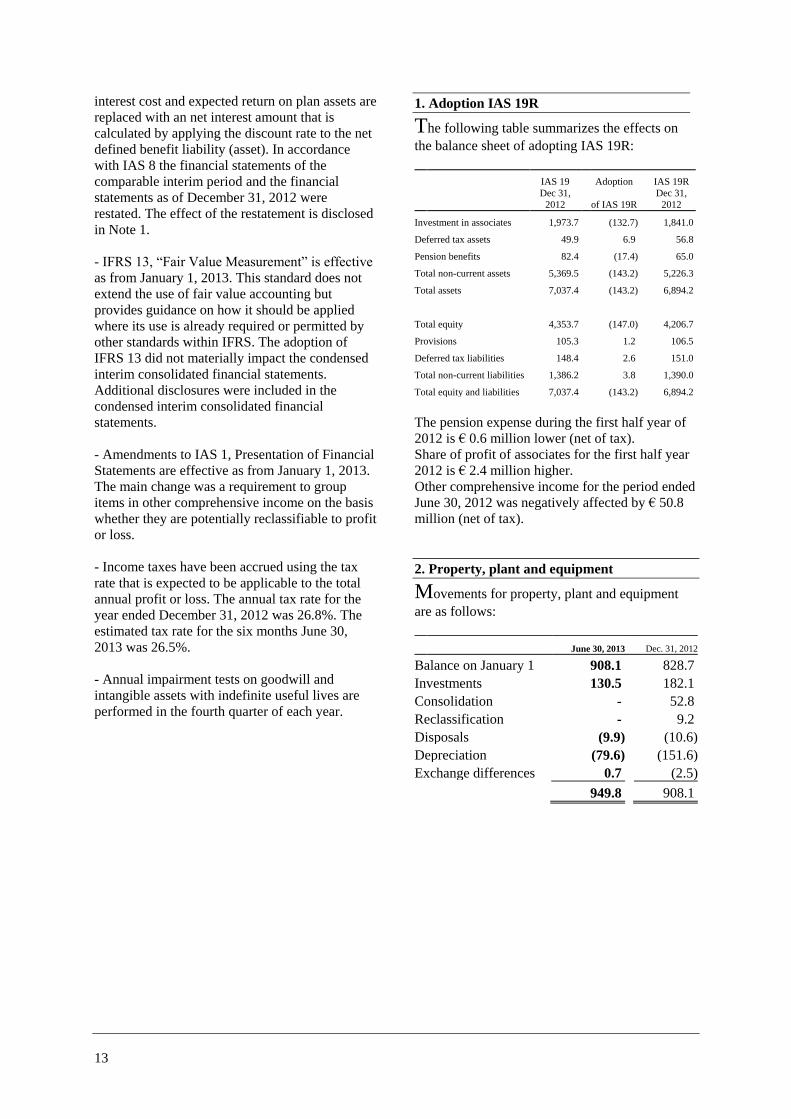
1. Adoption IAS 19R
The following table summarizes the effects on
the balance sheet of adopting IAS 19R:
IAS 19 Adoption IAS 19R
Dec 31,
2012 of IAS 19R
Dec 31,
2012
Investment in associates 1,973.7 (132.7) 1,841.0
Deferred tax assets 49.9 6.9 56.8
Pension benefits 82.4 (17.4) 65.0
Total non-current assets 5,369.5 (143.2) 5,226.3
Total assets 7,037.4 (143.2) 6,894.2
Total equity 4,353.7 (147.0) 4,206.7
Provisions 105.3 1.2 106.5
Deferred tax liabilities 148.4 2.6 151.0
Total non-current liabilities 1,386.2 3.8 1,390.0
Total equity and liabilities 7,037.4 (143.2) 6,894.2
The pension expense during the first half year of
2012 is € 0.6 million lower (net of tax).
Share of profit of associates for the first half year
2012 is € 2.4 million higher.
Other comprehensive income for the period ended
June 30, 2012 was negatively affected by € 50.8
million (net of tax).
2. Property, plant and equipment
Movements for property, plant and equipment
are as follows:
June 30, 2013 Dec. 31, 2012
Balance on January 1 908.1 828.7
Investments 130.5 182.1
Consolidation - 52.8
Reclassification - 9.2
Disposals (9.9) (10.6)
Depreciation (79.6) (151.6)
Exchange differences 0.7 (2.5)
949.8 908.1
14
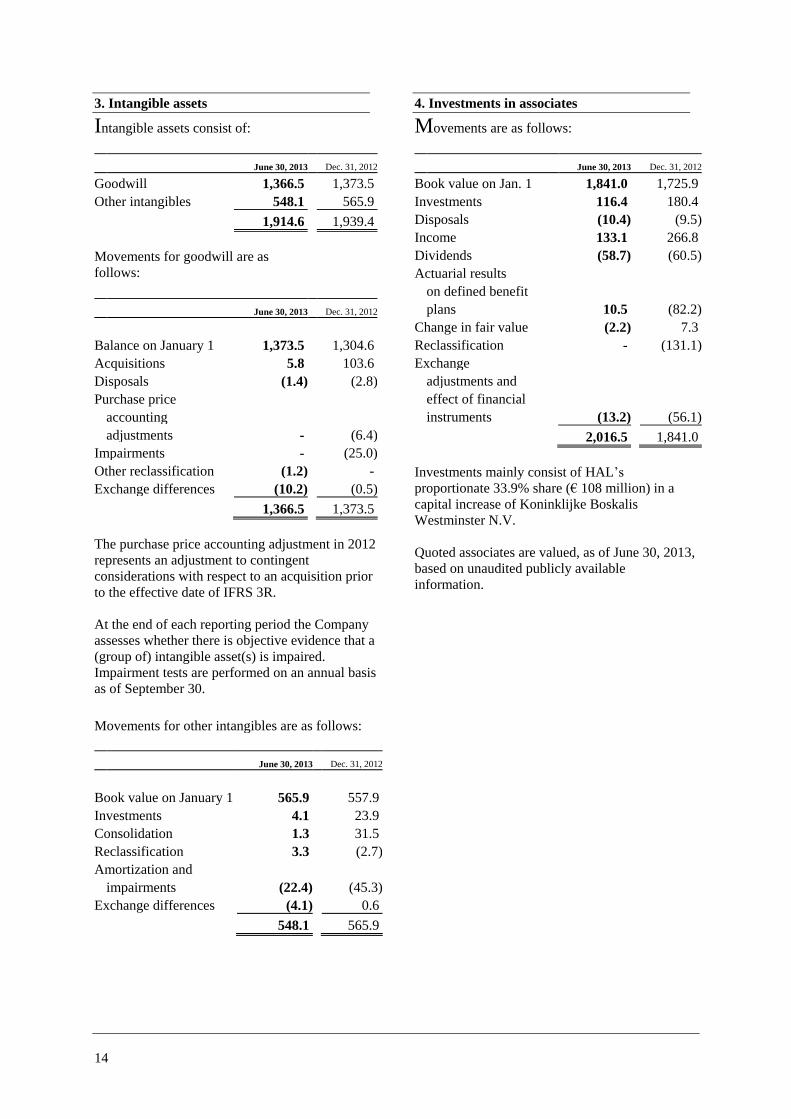
3. Intangible assets
Intangible assets consist of:
June 30, 2013 Dec. 31, 2012
Goodwill 1,366.5 1,373.5
Other intangibles 548.1 565.9
1,914.6 1,939.4
Movements for goodwill are as
follows:
June 30, 2013 Dec. 31, 2012
Balance on January 1 1,373.5 1,304.6
Acquisitions 5.8 103.6
Disposals (1.4) (2.8)
Purchase price
accounting
adjustments - (6.4)
Impairments - (25.0)
Other reclassification (1.2) -
Exchange differences (10.2) (0.5)
1,366.5 1,373.5
The purchase price accounting adjustment in 2012
represents an adjustment to contingent
considerations with respect to an acquisition prior
to the effective date of IFRS 3R.
At the end of each reporting period the Company
assesses whether there is objective evidence that a
(group of) intangible asset(s) is impaired.
Impairment tests are performed on an annual basis
as of September 30.
Movements for other intangibles are as follows:
June 30, 2013 Dec. 31, 2012
Book value on January 1 565.9 557.9
Investments 4.1 23.9
Consolidation 1.3 31.5
Reclassification 3.3 (2.7)
Amortization and
impairments (22.4) (45.3)
Exchange differences (4.1) 0.6
548.1 565.9
4. Investments in associates
Movements are as follows:
June 30, 2013 Dec. 31, 2012
Book value on Jan. 1 1,841.0 1,725.9
Investments 116.4 180.4
Disposals (10.4) (9.5)
Income 133.1 266.8
Dividends (58.7) (60.5)
Actuarial results
on defined benefit
plans 10.5 (82.2)
Change in fair value (2.2) 7.3
Reclassification - (131.1)
Exchange
adjustments and
effect of financial
instruments (13.2) (56.1)
2,016.5 1,841.0
Investments mainly consist of HAL’s
proportionate 33.9% share (€ 108 million) in a
capital increase of Koninklijke Boskalis
Westminster N.V.
Quoted associates are valued, as of June 30, 2013,
based on unaudited publicly available
information.
15
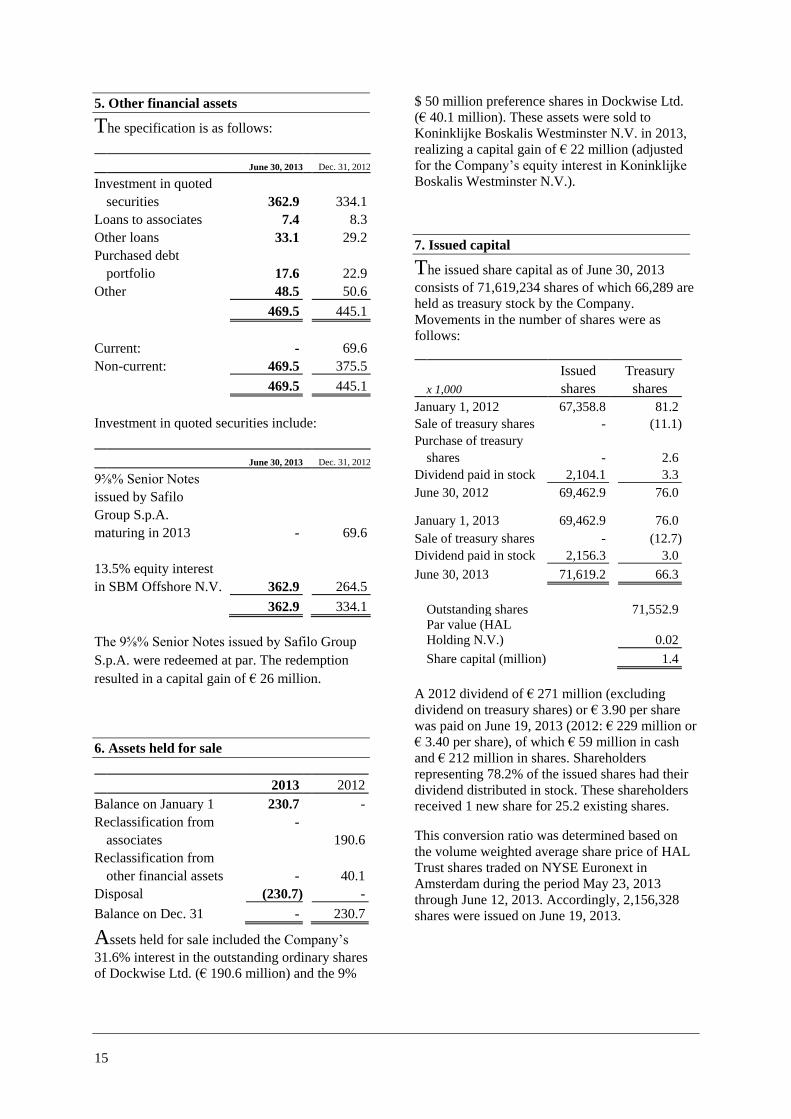
5. Other financial assets
The specification is as follows:
June 30, 2013 Dec. 31, 2012
Investment in quoted
securities 362.9 334.1
Loans to associates 7.4 8.3
Other loans 33.1 29.2
Purchased debt
portfolio 17.6 22.9
Other 48.5 50.6
469.5 445.1
Current: - 69.6
Non-current: 469.5 375.5
469.5 445.1
Investment in quoted securities include:
June 30, 2013 Dec. 31, 2012
9⅝% Senior Notes
issued by Safilo
Group S.p.A.
maturing in 2013 - 69.6
13.5% equity interest
in SBM Offshore N.V. 362.9 264.5
362.9 334.1
The 9⅝% Senior Notes issued by Safilo Group
S.p.A. were redeemed at par. The redemption
resulted in a capital gain of € 26 million.
6. Assets held for sale
2013 2012
Balance on January 1 230.7 -
Reclassification from -
associates 190.6
Reclassification from
other financial assets - 40.1
Disposal (230.7) -
Balance on Dec. 31 - 230.7
Assets held for sale included the Company’s
31.6% interest in the outstanding ordinary shares
of Dockwise Ltd. (€ 190.6 million) and the 9%
$ 50 million preference shares in Dockwise Ltd.
(€ 40.1 million). These assets were sold to
Koninklijke Boskalis Westminster N.V. in 2013,
realizing a capital gain of € 22 million (adjusted
for the Company’s equity interest in Koninklijke
Boskalis Westminster N.V.).
7. Issued capital
The issued share capital as of June 30, 2013
consists of 71,619,234 shares of which 66,289 are
held as treasury stock by the Company.
Movements in the number of shares were as
follows:
Issued Treasury
x 1,000 shares shares
January 1, 2012 67,358.8 81.2
Sale of treasury shares - (11.1)
Purchase of treasury
shares - 2.6
Dividend paid in stock 2,104.1 3.3
June 30, 2012 69,462.9 76.0
January 1, 2013 69,462.9 76.0
Sale of treasury shares - (12.7)
Dividend paid in stock 2,156.3 3.0
June 30, 2013 71,619.2 66.3
Outstanding shares 71,552.9
Par value (HAL
Holding N.V.) 0.02
Share capital (million) 1.4
A 2012 dividend of € 271 million (excluding
dividend on treasury shares) or € 3.90 per share
was paid on June 19, 2013 (2012: € 229 million or
€ 3.40 per share), of which € 59 million in cash
and € 212 million in shares. Shareholders
representing 78.2% of the issued shares had their
dividend distributed in stock. These shareholders
received 1 new share for 25.2 existing shares.
This conversion ratio was determined based on
the volume weighted average share price of HAL
Trust shares traded on NYSE Euronext in
Amsterdam during the period May 23, 2013
through June 12, 2013. Accordingly, 2,156,328
shares were issued on June 19, 2013.
16
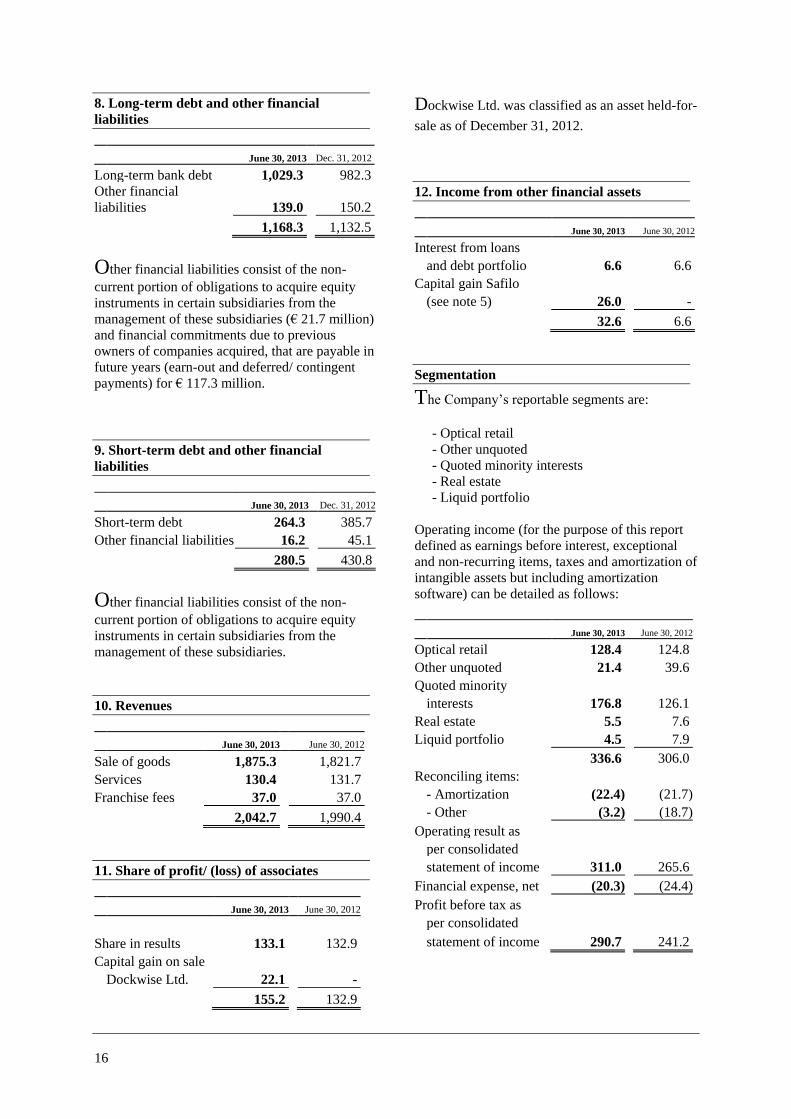
8. Long-term debt and other financial
liabilities
June 30, 2013 Dec. 31, 2012
Long-term bank debt 1,029.3 982.3
Other financial
liabilities 139.0 150.2
1,168.3 1,132.5
Other financial liabilities consist of the non-
current portion of obligations to acquire equity
instruments in certain subsidiaries from the
management of these subsidiaries (€ 21.7 million)
and financial commitments due to previous
owners of companies acquired, that are payable in
future years (earn-out and deferred/ contingent
payments) for € 117.3 million.
9. Short-term debt and other financial
liabilities
June 30, 2013 Dec. 31, 2012
Short-term debt 264.3 385.7
Other financial liabilities 16.2 45.1
280.5 430.8
Other financial liabilities consist of the non-
current portion of obligations to acquire equity
instruments in certain subsidiaries from the
management of these subsidiaries.
10. Revenues
June 30, 2013 June 30, 2012
Sale of goods 1,875.3 1,821.7
Services 130.4 131.7
Franchise fees 37.0 37.0
2,042.7 1,990.4
11. Share of profit/ (loss) of associates
June 30, 2013 June 30, 2012
Share in results 133.1 132.9
Capital gain on sale
Dockwise Ltd. 22.1 -
155.2 132.9
Dockwise Ltd. was classified as an asset held-for-
sale as of December 31, 2012.
12. Income from other financial assets
June 30, 2013 June 30, 2012
Interest from loans
and debt portfolio 6.6 6.6
Capital gain Safilo
(see note 5) 26.0 -
32.6 6.6
Segmentation
The Company’s reportable segments are:
- Optical retail
- Other unquoted
- Quoted minority interests
- Real estate
- Liquid portfolio
Operating income (for the purpose of this report
defined as earnings before interest, exceptional
and non-recurring items, taxes and amortization of
intangible assets but including amortization
software) can be detailed as follows:
June 30, 2013 June 30, 2012
Optical retail 128.4 124.8
Other unquoted 21.4 39.6
Quoted minority
interests 176.8 126.1
Real estate 5.5 7.6
Liquid portfolio 4.5 7.9
336.6 306.0
Reconciling items:
- Amortization (22.4) (21.7)
- Other (3.2) (18.7)
Operating result as
per consolidated
statement of income 311.0 265.6
Financial expense, net (20.3) (24.4)
Profit before tax as
per consolidated
statement of income 290.7 241.2
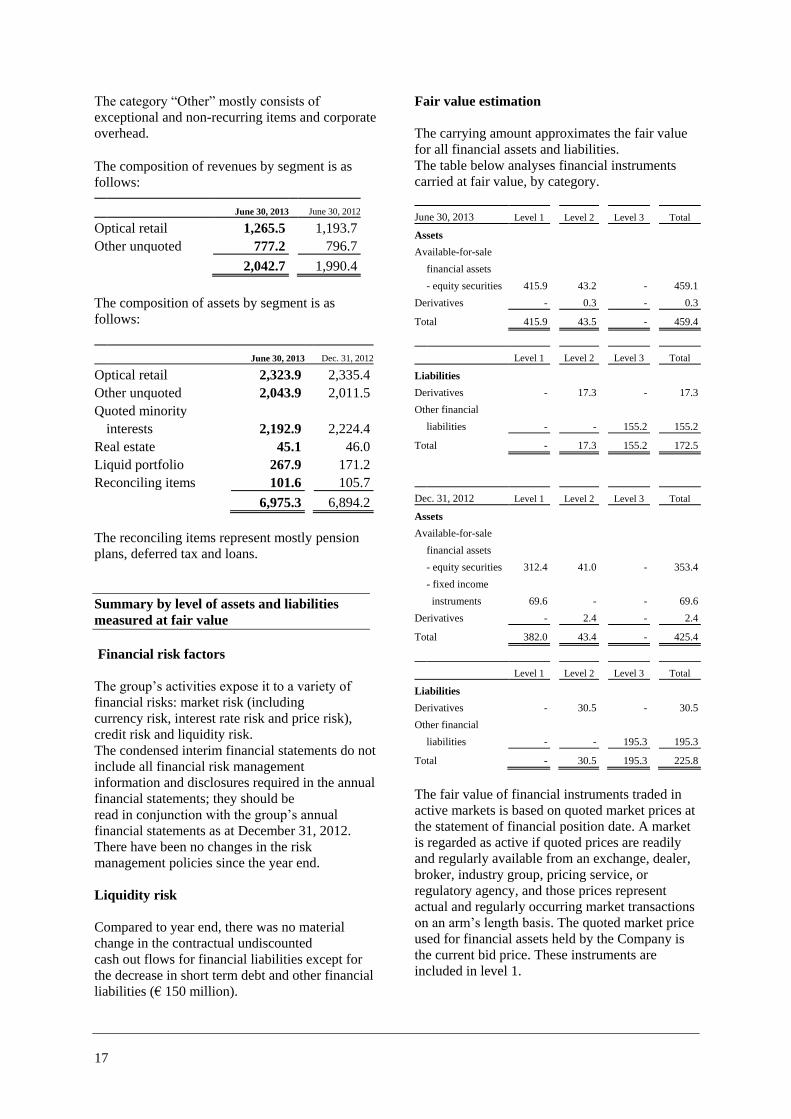
17
The category “Other” mostly consists of
exceptional and non-recurring items and corporate
overhead.
The composition of revenues by segment is as
follows: June 30, 2013 June 30, 2012
Optical retail 1,265.5 1,193.7
Other unquoted 777.2 796.7
2,042.7 1,990.4
The composition of assets by segment is as
follows:
June 30, 2013 Dec. 31, 2012
Optical retail 2,323.9 2,335.4
Other unquoted 2,043.9 2,011.5
Quoted minority
interests 2,192.9 2,224.4
Real estate 45.1 46.0
Liquid portfolio 267.9 171.2
Reconciling items 101.6 105.7
6,975.3 6,894.2
The reconciling items represent mostly pension
plans, deferred tax and loans.
Summary by level of assets and liabilities
measured at fair value
Financial risk factors
The group’s activities expose it to a variety of
financial risks: market risk (including
currency risk, interest rate risk and price risk),
credit risk and liquidity risk.
The condensed interim financial statements do not
include all financial risk management
information and disclosures required in the annual
financial statements; they should be
read in conjunction with the group’s annual
financial statements as at December 31, 2012.
There have been no changes in the risk
management policies since the year end.
Liquidity risk
Compared to year end, there was no material
change in the contractual undiscounted
cash out flows for financial liabilities except for
the decrease in short term debt and other financial
liabilities (€ 150 million).
Fair value estimation
The carrying amount approximates the fair value
for all financial assets and liabilities.
The table below analyses financial instruments
carried at fair value, by category.
June 30, 2013 Level 1 Level 2 Level 3 Total
Assets
Available-for-sale
financial assets
- equity securities 415.9 43.2 - 459.1
Derivatives - 0.3 - 0.3
Total 415.9 43.5 - 459.4
Level 1 Level 2 Level 3 Total
Liabilities
Derivatives - 17.3 - 17.3
Other financial
liabilities - - 155.2 155.2
Total - 17.3 155.2 172.5
Dec. 31, 2012 Level 1 Level 2 Level 3 Total
Assets
Available-for-sale
financial assets
- equity securities 312.4 41.0 - 353.4
- fixed income
instruments 69.6 - - 69.6
Derivatives - 2.4 - 2.4
Total 382.0 43.4 - 425.4
Level 1 Level 2 Level 3 Total
Liabilities
Derivatives - 30.5 - 30.5
Other financial
liabilities - - 195.3 195.3
Total - 30.5 195.3 225.8
The fair value of financial instruments traded in
active markets is based on quoted market prices at
the statement of financial position date. A market
is regarded as active if quoted prices are readily
and regularly available from an exchange, dealer,
broker, industry group, pricing service, or
regulatory agency, and those prices represent
actual and regularly occurring market transactions
on an arm’s length basis. The quoted market price
used for financial assets held by the Company is
the current bid price. These instruments are
included in level 1.
18
Equity funds classified in level 2 are fairly valued
using the net asset value of the fund, as reported
by the respective fund’s administrator as it
represents the fair value of the assets held by the
fund. For these funds, management believes the
Company could have redeemed its investment at
the net asset value per share at the statement of
financial position date.
In the case of financial instruments that are not
traded in an active market such as certain
derivatives, fair value is determined by using
valuation techniques. These valuation techniques
use observable market data where it is available.
If all significant inputs required to fair value an
instrument are observable, the instrument is
included in level 2. If one or more of the
significant inputs is not based on observable
market data, the instrument is included in level 3.
There were no transfers between levels 1 and 2
during the period.
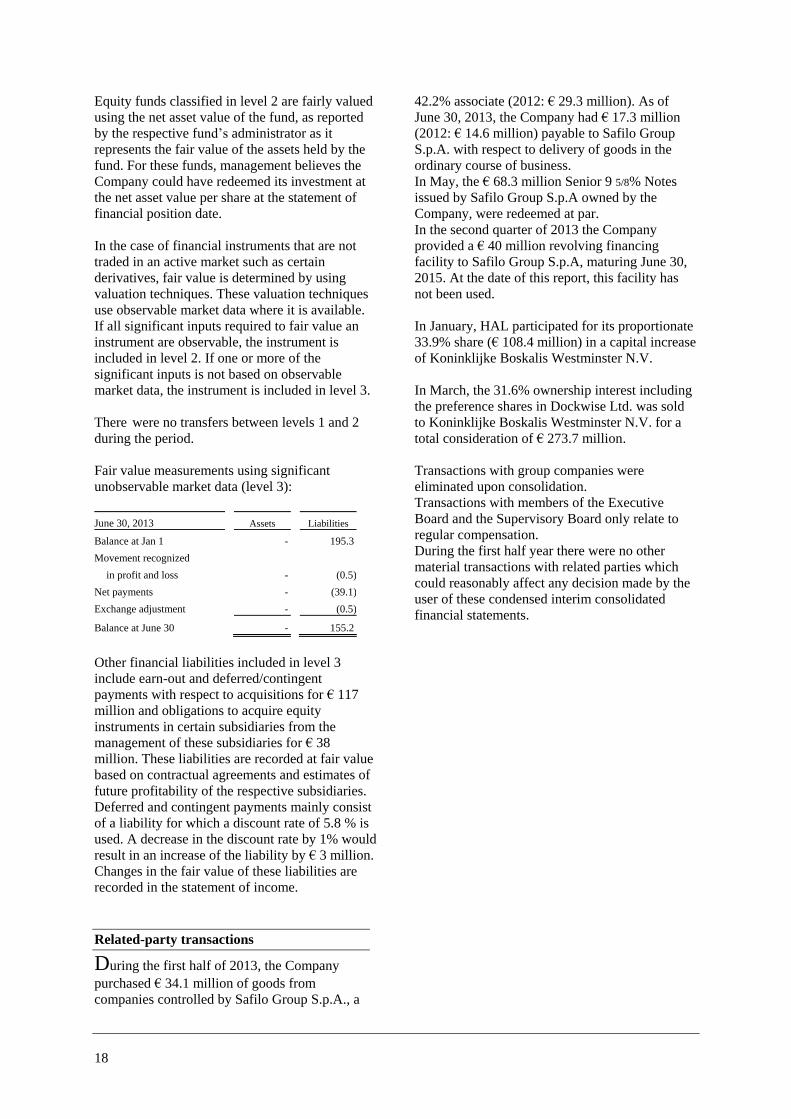
Fair value measurements using significant
unobservable market data (level 3):
June 30, 2013 Assets Liabilities
Balance at Jan 1 - 195.3
Movement recognized
in profit and loss - (0.5)
Net payments - (39.1)
Exchange adjustment - (0.5)
Balance at June 30 - 155.2
Other financial liabilities included in level 3
include earn-out and deferred/contingent
payments with respect to acquisitions for € 117
million and obligations to acquire equity
instruments in certain subsidiaries from the
management of these subsidiaries for € 38
million. These liabilities are recorded at fair value
based on contractual agreements and estimates of
future profitability of the respective subsidiaries.
Deferred and contingent payments mainly consist
of a liability for which a discount rate of 5.8 % is
used. A decrease in the discount rate by 1% would
result in an increase of the liability by € 3 million.
Changes in the fair value of these liabilities are
recorded in the statement of income.
Related-party transactions
During the first half of 2013, the Company
purchased € 34.1 million of goods from
companies controlled by Safilo Group S.p.A., a
42.2% associate (2012: € 29.3 million). As of
June 30, 2013, the Company had € 17.3 million
(2012: € 14.6 million) payable to Safilo Group
S.p.A. with respect to delivery of goods in the
ordinary course of business.
In May, the € 68.3 million Senior 9 5/8% Notes
issued by Safilo Group S.p.A owned by the
Company, were redeemed at par.
In the second quarter of 2013 the Company
provided a € 40 million revolving financing
facility to Safilo Group S.p.A, maturing June 30,
2015. At the date of this report, this facility has
not been used.
In January, HAL participated for its proportionate
33.9% share (€ 108.4 million) in a capital increase
of Koninklijke Boskalis Westminster N.V.
In March, the 31.6% ownership interest including
the preference shares in Dockwise Ltd. was sold
to Koninklijke Boskalis Westminster N.V. for a
total consideration of € 273.7 million.
Transactions with group companies were
eliminated upon consolidation.
Transactions with members of the Executive
Board and the Supervisory Board only relate to
regular compensation.
During the first half year there were no other
material transactions with related parties which
could reasonably affect any decision made by the
user of these condensed interim consolidated
financial statements.
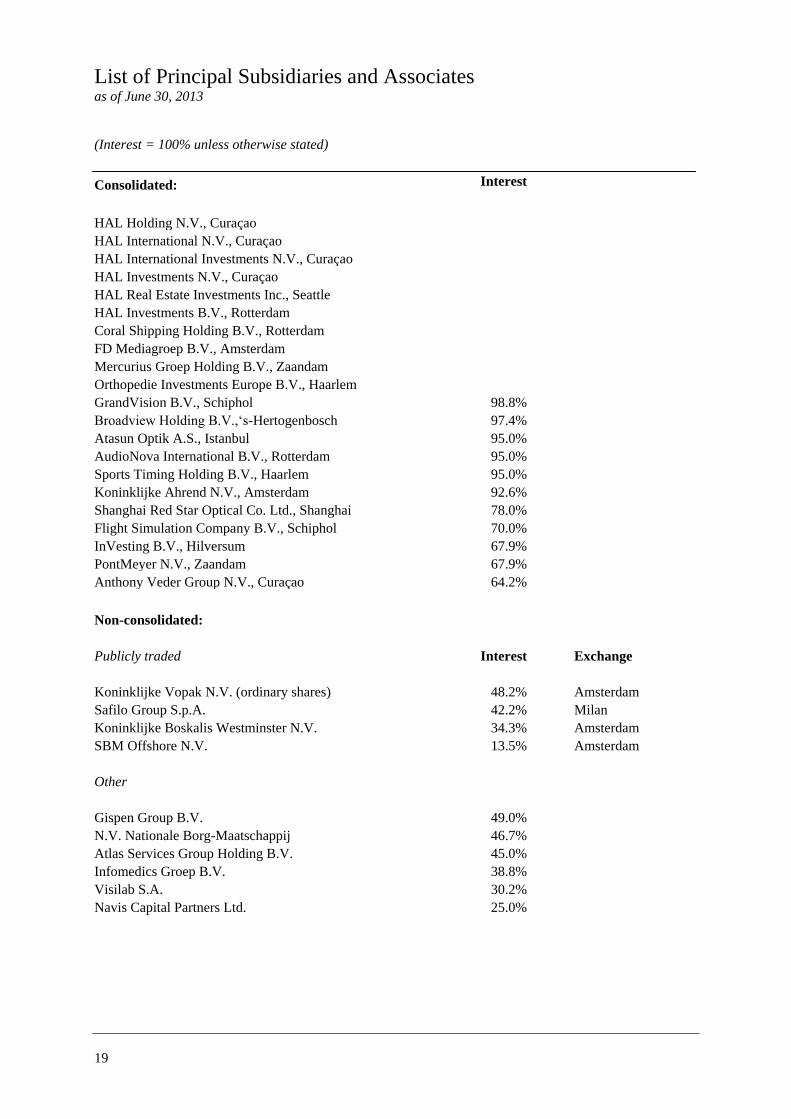
List of Principal Subsidiaries and Associates
as of June 30, 2013
(Interest = 100% unless otherwise stated)
19
Consolidated: Interest
HAL Holding N.V., Curaçao
HAL International N.V., Curaçao
HAL International Investments N.V., Curaçao
HAL Investments N.V., Curaçao
HAL Real Estate Investments Inc., Seattle
HAL Investments B.V., Rotterdam
Coral Shipping Holding B.V., Rotterdam
FD Mediagroep B.V., Amsterdam
Mercurius Groep Holding B.V., Zaandam
Orthopedie Investments Europe B.V., Haarlem
GrandVision B.V., Schiphol 98.8%
Broadview Holding B.V.,‘s-Hertogenbosch 97.4%
Atasun Optik A.S., Istanbul 95.0%
AudioNova International B.V., Rotterdam 95.0%
Sports Timing Holding B.V., Haarlem 95.0%
Koninklijke Ahrend N.V., Amsterdam 92.6%
Shanghai Red Star Optical Co. Ltd., Shanghai 78.0%
Flight Simulation Company B.V., Schiphol 70.0%
InVesting B.V., Hilversum 67.9%
PontMeyer N.V., Zaandam 67.9%
Anthony Veder Group N.V., Curaçao 64.2%
Non-consolidated:
Publicly traded Interest Exchange
Koninklijke Vopak N.V. (ordinary shares) 48.2% Amsterdam
Safilo Group S.p.A. 42.2% Milan
Koninklijke Boskalis Westminster N.V. 34.3% Amsterdam
SBM Offshore N.V. 13.5% Amsterdam
Other
Gispen Group B.V. 49.0%
N.V. Nationale Borg-Maatschappij 46.7%
Atlas Services Group Holding B.V. 45.0%
Infomedics Groep B.V. 38.8%
Visilab S.A. 30.2%
Navis Capital Partners Ltd. 25.0%
20
Statement by the Executive Board
The administrative procedures, the risk management and internal control systems associated with the
Company’s strategy and its implementation, the financial reporting and compliance are all designed to
provide a reasonable degree of assurance that significant risk factors are identified, their development is
monitored and, where appropriate, action is taken on a timely basis. The Board of Supervisory Directors is
regularly informed about these matters.
The companies in which HAL has invested differ in industry, size, culture, geographical diversity and stage
of development. Each company is subject to specific risks relating to strategy, operations, finance and
(fiscal) legislation. HAL has therefore chosen not to institute a centralized management approach and not to
develop a central risk management system. Each investee company has its own financial structure and is
responsible for evaluating and managing its own risks. The companies generally have a supervisory board
of which the majority of members are not affiliated with HAL. This corporate governance structure allows
the operating companies to fully concentrate on developments which are relevant to them and to assess
which risks to accept and which risks to avoid. Accordingly, in addition to risks associated with HAL’s
strategy and its implementation as referred to in the report on the first half year of 2013 and which are
further described in the 2012 annual report, there are specific risk factors associated with each individual
investee company. It is the responsibility of each investee company to evaluate these specific risks.
HAL’s objective is, in the context of the inherent limitations of the decentralized management approach
described above, that its internal and external financial reporting is complete, accurate, valid and timely.
Financial reporting risk can be defined as any event that impedes HAL to achieve its financial reporting
objectives.
Based on the above, taking into account the inherent limitations referred to, we declare that, to the best of
our knowledge, the condensed interim consolidated financial statements for the six-months period ended
June 30, 2013, which have been prepared in accordance with IAS 34, ‘Interim Financial Reporting’, give a
true and fair view of the assets, liabilities, financial position and net income of the consolidated entities
taken as a whole, and the interim report of the Executive Board includes a fair view of the information
required pursuant to section 5:25d. subsections 8 and 9 of the Dutch Financial Markets Supervision Act
(Wet op het financieel toezicht).
Executive Board HAL Holding N.V.
M. van der Vorm (Chairman)
M.F. Groot
August 28, 2013