Embed Size (px)
Citation preview
get more out of your plant.
Half-Year Financial Report 2020
KHD Humboldt Wedag International AG, Cologne, Germany
Half-year Financial Report 2020
ISIN: DE0006578008
GERMAN SECURITIES IDENTIFICATION NUMBER (WKN): 657800
Stock Exchange Symbol: KWG
www.khd.com

1
Summary of the First Half Year 2020
- Adverse impact of the COVID-19 pandemic clearly visible
- Order intake in the amount of € 28.8 million below the previous year's figure
- Despite decrease in revenue from € 82.9 million to € 69.5 million, adjusted gross
profit improved – adjusted gross profit margin reached 13.5% (previous year: 9.9%).
- Positive effects from reorganization implemented in the previous year – significant
reduction in structural costs
- Group net result improved considerably from € -12.7 million to € -1.7 million
Key Figures at a Glance
in € million Jan. 1 –
June 30, 2020 Jan. 1 –
June 30, 2019 Variance
in %
Order intake 28.8 44.0 -34.5
Revenue 69.5 82.9 -16.2
Adjusted gross profit 9.4 8.2 14.6
Adjusted gross profit margin (in %) 13.5 9.9 36.7
Adjusted EBIT -3.7 -5.6 33.9
Adjusted EBIT margin (in %) -5.3 -6.8 21.2
EBT -0.9 -10.6 91.5
Group net result -1.7 -12.7 86.6
Earnings per share (in €) -0.03 -0.26 88.5
Cash flow from operating activities -7.6 -10.8 29.6
Cash flow from investing activities 1.9 0.7 -171.4
Cash flow from financing activities -1.1 -2.0 45.0
in € million June 30, 2020 Dec. 31, 2019 Variance
in %
Equity 98.0 101.5 -3.4
Equity ratio (in %) 38.7 39.6 -2.3
Cash and intercompany loans * 173.9 182.6 -4.8
Net working capital ** -47.4 -51.2 7.4
Order backlog 263.2 307.8 -14.5
Employees 653 664 -1.7
* Including intercompany loan of € 100 million, € 50 million of which with entitlement to call for early repayment by giving
30 days’ notice.
** Balance of current assets (less cash equivalents and current loans granted) and current liabilities.
Please note that differences can result from the use of rounded amounts and percentages.
2
MANAGEMENT REPORT REGARDING THE INTERIM
GROUP FINANCIAL STATEMENTS AS OF JUNE 30, 2020
Fundamental Group Principles
KHD Humboldt Wedag International AG (hereinafter also referred to as “KHD” or the
“Group”) made no fundamental changes to its business model, strategy or management
system (see combined management report of December 31, 2019, pp. 11-17) during the
first half-year 2020. In 2020, the focus at KHD is to make use of its sales activities in the
Capex segment in a targeted manner with regard to business opportunities where the
position of KHD as a technology leader can be exploited appropriately. Additional goals are
to increase competitiveness, support a culture of excellence and performance, and
implement target oriented research and development activities.
Management, monitoring and reporting within the Group continue to be based on the
financial indicators listed below. With respect to the basic determination and calculation of
these financial performance indicators, reference is made to the combined management
report of December 31, 2019, page 15 et seq. The significant performance indicators of the
Group are:
- Order intake and order backlog;
- Group revenue;
- Group earnings before taxes and interest (EBIT) as well as the ratio to revenue
(EBIT margin);
- Operating cash flow.
For Group management purposes, KHD adjusts EBIT as necessary with regard to special
effects. The adjusted EBIT as of June 30, 2020 is determined as follows:
in € million June 30, 2020 June 30, 2019 EBIT prior to adjustments -4.3 -14.3 Idle capacity costs 0.6 1.5 Reorganization costs 0.0 7.2
Adjusted EBIT -3.7 -5.6
The adjustments include idle capacity costs of € 0.6 million (previous year: € 1.5 million)
due to under-utilization of existing capacities.

3
In addition, the comprehensive reorganization of the subsidiary Humboldt Wedag GmbH
(HW GmbH) resulted in one-time expenses of € 7.2 million during the previous year.
Management and Supervision
Management Board
Effective February 1, 2020, Mr. Matthias Mersmann was appointed as another member of
the Management Board of KHD. As Chief Technology Officer on the Management Board,
Mr. Mersmann is specifically responsible for expanding the position of the KHD Group as a
technology leader.
Economic Report
Market Environment
In view of the increasing barriers to trade (e. g. between China and the USA), structural
economic downturns, and geopolitical tensions, 2019 was one of the most challenging years
for the global economy since the financial crisis of 2008/2009. Emerging countries and other
aspiring economies, with China, India, Brazil, and Russia topping the list, struggled with a
slowdown in economic growth in 2019. According to the International Monetary Fund, global
economic growth amounted to only 2.9% in 2019 after totaling 3.6% in 2018. Due to the
effects of the COVID-19 pandemic, the original growth forecast for 2020 is no longer valid;
now a considerable decrease in global economic output must be expected. In addition to
the effects of the COVID-19 pandemic, which are difficult to estimate at best, antagonism
with regard to the price of oil in the first half-year 2020 resulted in further market insecurities.
Based on the current perspective, extreme uncertainty with respect to the future
development of global growth will remain for the rest of 2020 as well as at least the first half-
year 2021.
Even though, according to a study by CW Research, the demand for cement recovered to
a relatively low level in most of the key markets in the 2019 calendar year, a decrease in
cement consumption is forecast for all markets for the ongoing year 2020. Due to the
reduction in cement consumption, there is excess capacity for cement production in all of
the key markets for KHD. However, even though there is excess capacity, there is still
demand for KHD's portfolio of products and services.

4
The Group can continue to take advantage of good business opportunities, particularly in
increasing cement plant efficiency and reducing energy consumption, in the use of
alternative fuels and the greater attention paid to environmental issues, and in the area of
niche products. Even if the investment tendency and the financial options available to our
customers for investment projects have declined during the current crisis, the major factors
for a future increase in cement consumption remain unchanged. The increase in population,
the need for additional living space, infrastructure projects, increasing industrialization and
last, but not least, the greater purchasing power of consumers in emerging and developing
countries will contribute to an improvement in the market environment in the medium term.
Overall Assessment of the Economic Situation
Economic development for the first half-year 2020 as measured by the result has much
improved over that in the corresponding period in the previous year. The profitability of KHD,
however, remains at an unsatisfactory level – in particular, due to the negative effects of the
COVID-19 pandemic. With regard to all significant performance indicators, and especially
for order intake, development within the reporting period fell short of the planned amount.
However, a normalization of economic circumstances is tentatively expected in the second
half-year, so KHD can confirm the forecast for order intake, increased revenue, and the
significantly improved adjusted EBIT and adjusted EBIT margin over the entire year.
Revenue of € 69.5 million was below that of the corresponding period in the previous year
(€ 82.9 million), but at € 9.4 million, the adjusted gross profit was considerable higher than
that of the previous year's figure (€ 8.2 million). The adjusted gross profit margin of 9.9% in
the corresponding period in the previous year has now improved to 13.5% accordingly. In
the Capex segment, orders from previous years that were achieved only with price
concessions and low margins made up a lower percentage of the revenue in comparison
with previous periods. Moreover, unexpected cost overruns in the execution of orders were
prevented for the most part. The focus on markets and products with which KHD offers
customers real added value is clearly demonstrated in greater value creation and an
improved gross profit margin. In addition, the significant reduction in structural costs related
to the reorganization had a positive effect. Accordingly, despite noticeably decreased
revenue, the adjusted EBIT improved from € -5.6 million in the previous year to the current
figure of € -3.7 million.

5
Cash flow from operating activities amounted to € -7.6 million (previous year:
€ - 10.8 million), essentially in line with the submitted outlook.
The successful implementation of the reorganization at the Cologne location and the
adjustment of the strategy to focus on markets and products with which we offer customers
real added value have generated very positive outcomes. In spite of the continuing
unfavorable market conditions and the significant increase in uncertainty due to the
COVID-19 pandemic, the KHD Group is convinced that, by taking further measures to
increase competitiveness and support a culture of excellence and performance, sustainable
positive results will be achieved again in the medium term. In the current 2020 financial
year, however, based on current planning, earnings before tax (EBT) will not reach a
positive value.
Business Development
In the first half-year 2020, order intake was € 28.8 million, lower than the level reached in
the previous year (€ 44.0 million). In addition to the previously existing restraint with regard
to investment in the cement industry, the risks and uncertainty associated with the COVID-
19 pandemic had a very significant impact. Customers reacted with great caution and
postponed their investment decisions. Due to the lockdowns instituted in some countries
due to the pandemic, cement plants were temporarily shut down, so even permanently
scheduled maintenance work and spare parts orders were postponed.
Orders of € 17.6 million were placed in the Capex segment in the first half-year 2020, a
lower volume than in the previous year (€ 25.3 million). Order intake in China, the USA,
India, and South Korea contributed significantly. In the Plant Services segment, order intake
of € 11.2 million was significantly lower than the previous year's figure (€ 18.7 million). Spare
parts and services activities contributed 39.0% to the overall order intake (previous year:
42.5%).
As a result of the lower order intake volume and taking the progress in execution of existing
projects into consideration, order backlog as of June 30, 2020 decreased – compared with
the figure of December 31, 2019 – by € -14.5 million to € 263.2 million. As in the previous
year, in this reporting year adjustments caused by the reduction of order values
(€ -2.8 million; previous year: € -1.0 million) and effects of exchange rate fluctuations (€ 1.0
million; previous year: € 1.0 million) were reported as changes to order backlog.

6
As a result of the significant decrease in order intake and also due to regional differences
in the distribution of the order backlog, complete utilization of existing capacities was not
ensured at all KHD locations. Consequently, there were also idle capacity costs in the first
half-year 2020 of € 0.6 million, which were considerably lower than in the previous year
(€ 1.5 million) due to the reduced capacity resulting from the reorganization. Due to the
considerable regional differences in the distribution of the order backlog as of
June 30, 2020, at some locations complete utilization of capacities may still not be possible
in the second half-year 2020.
Group Earning Situation
KHD's revenue of € 69.5 million did not reach the level of the previous year (€ 82.9 million).
Significant contributions to revenue in the Capex segment came primarily from projects in
the USA, India and China. The main reason for the decrease in revenue of 16.1% is the
COVID-19 pandemic and the related restrictions. Several customers came to agreements
with KHD to extend the agreed upon schedule for projects currently in the execution phase.
The gross profit for the first half-year 2020 was € 8.8 million (previous year:
€ 6.8 million). The costs of sales comprise € 0.6 million (previous year: € 1.5 million) in idle
capacity costs that resulted from under-utilization of existing capacities. Because these
costs are not directly associated with the revenues recognized, they were corrected when
determining adjusted gross profit. Adjusted gross profit for the first half-year 2020 was
€ 9.4 million (previous year: € 8.2 million). The adjusted gross profit margin increased from
9.9% to 13.5%. The focus on markets and products with which KHD offers customers real
added value is clearly demonstrated in greater value creation and an improved gross profit
margin. Moreover, unexpected cost overruns in the execution of orders were prevented for
the most part. The significant reduction in structural costs related to the reorganization also
had a positive effect on the gross profit margin.
In contrast to the first six months of the 2019 financial year, sales expenses decreased
considerably by 26.9%, from € 6.7 million to € 4.9 million.

7
On one hand, this is due to lower personnel expenses; on the other hand, the tendering
costs (including travel expenses) decreased because there were fewer customer inquiries
due to the COVID-19 pandemic. General and administrative expenses in the amount of
€ 6.4 million (previous year: € 5.9 million) increased by 8.8%. There were no expenses for
reorganization in the first half-year 2020 (previous year: € 7.2 million). Other expenses
increased slightly from € 2.3 million to € 2.6 million. Besides € 1.3 million of expenses for
research and development (previous year: € 1.1 million), other expenses also include
exchange rate effects (including foreign exchange forward contracts) of € 0.9 million
(previous year: € 0.8 million). Expenses resulting from exchange rate effects are offset
against the revenue from exchange rate effects in the amount of € 0.5 million (previous
year: € 0.6 million).
Earnings before interest and taxes (EBIT) is still negative at € -4.3 million, but improved
quite significantly in comparison with the same period in the previous year (€ -14.3 million).
The primary reasons for this are the improved gross profit with respect to the previous year,
reduced sales expenses, and the elimination of the one-time effect of the reorganization
(previous year: expenses of € 7.2 million). The EBIT margin is negative at -6.1%, but
improved significantly in comparison with the previous year. The adjusted EBIT of
€ - 3.7 million (after eliminating idle capacity costs and expenses related to reorganization)
was also greater than the previous year's figure (€ -5.6 million).
The Group's net finance income decreased from € 3.7 million in the previous year to
€ 3.3 million in the first half-year 2020. Finance income of € 4.1 million (previous year:
€ 4.4 million), which includes interest received in the amount of € 2.9 million (previous
year: € 2.9 million) from two loans granted in the 2017 financial year to AVIC International
Kairong Limited ("AVIC Kairong"), Hong Kong, for a total amount of € 100.0 million, is offset
by finance expenses of € 0.7 million (previous year: € 0.7 million).
The Group net result for the first half-year 2020 was slightly negative at € -1.7 million, but
demonstrated significant improvement in comparison with the result of the first half-year
2019 (€ -12.7 million). Basic and diluted earnings per share totaled € -0.03 (previous year:
€ -0.26).

8
Segment Earnings Situation
Revenue in the Capex segment in the six-month period in 2020 reached € 56.9 million,
following a figure of € 58.9 million in the first half-year 2019, a decrease of 3.5%. The
COVID-19 pandemic had a very clear effect on the Plant Services segment, which
experienced a decrease in revenue. Though revenue of € 23.9 million was achieved in the
first six months of 2019, in the same period in 2020 revenue was just € 12.6 million, a 47.3%
reduction. The primary reasons for decrease in revenue in this business segment include a
significantly lower order backlog at the beginning of the year, lower order intake in the first
half-year 2020, and delays initiated by customers, which affected revenue from spare parts
orders. The Plant Services segment contributed 18.2% to the total revenue; during the same
period in the previous year, it contributed 28.9%.
In the reporting period, despite the decrease in revenue, the Capex segment achieved a
significantly improved gross profit of € 4.8 million (previous year: € 0.5 million). The focus
on markets and products with which KHD offers customers real added value is clearly
demonstrated in greater value creation and an improved gross profit margin, which
increased from 0.9% to 8.5%. Moreover, unexpected cost overruns in the execution of
orders were prevented for the most part. Idle capacity costs apply only to the Capex
segment, so the adjusted gross profit for this segment is € 5.4 million (previous year:
€ 1.9 million). As a result, the adjusted gross profit margin in the Capex segment was 9.5%
(previous year: 3.2%). In the Plant Services segment, a gross profit of € 4.0 million was
achieved (previous year: € 6.3 million). As such, the gross profit margin of 31.7%
demonstrates an improvement with respect to the previous year's figure of 26.4%.
In the reporting period, EBIT in the Capex segment was € -5.2 million, a considerable
improvement in comparison with the same period during the previous year (€ -16.6 million).
Primarily responsible for this positive development, in addition to the previously mentioned
increase in gross profit, is the elimination of the one-time expenses for reorganization of
€ 6.4 million in the first half-year 2019, attributable to the Capex segment. EBIT in the Plant
Services segment was also negatively affected in the first half-year 2019 by the one-time
effects of reorganization (€ 0.8 million). Despite the improved cost structure, due to the
decreases in revenue and gross profit in the first half-year 2020, the segment was unable
to achieve the EBIT figure of the corresponding period in the previous year (€ 2.3 million),
instead reaching a positive EBIT of € 1.0 million.

9
Financial Position and Net Assets
Liquidity
The total cash and cash equivalents decreased in the first half-year 2020 by € 8.7 million,
from € 82.6 million as of December 31, 2019 to € 73.9 million as of June 30, 2020. The
primary reason for this decline is a negative cash flow from operating activities of
€ -7.6 million (previous year: € -10.8 million).
For further details regarding operating cash flow, see the following table:
Cash flow effect from operating activities for the first half-year 2020 in €
thousand
Cash flow from customer contacts with revenue recognition over time
(26,491) Cash flow from current liabilities/ invoices from suppliers 21,458 Cash flow from changes in receivables 5,391
Cash flow from utilization of provisions and long term liabilities
(3,748) Cash outflow from result (EBITDA) (2,901) Cash flow from tax payments made/ received (896) Other cash inflows and outflows (421) Cash flow from operating activities (7,608)
Cash flow from investment activities of € 1.9 million is greater than the previous year’s figure
(€ 0.7 million) and primarily includes interest payments received for the loans extended to
AVIC Kairong (€ 2.9 million) and cash outflow for fixed assets (€ 1.0 million). Cash flow from
financing activities is € -1.1 million (previous year: € -2.0 million) is affected by payments
and interest in the amount of € 0.9 million on the lease liabilities recognized since January 1,
2019. In addition, as in the previous year, interest payments for a bank loan in the amount
of € 0.2 million were due and payable. Taking the effects of negative currency exchange
rates in the amount of € 1.9 million into consideration, cash and cash equivalents as of
June 30, 2020 amount to € 73.9 million (December 31, 2019: € 82.6 million).
10
Total Assets
Balance sheet total of the KHD Group slightly decreased from the figure at the end of 2019
(€ 256.7 million) by € 3.5 million to a current total of € 253.2 million. The Group's non-current
assets (€ 123.3 million; previous year: € 23.4 million) are determined by two loans to AVIC
Kairong, each for € 50 million. Because they were originally due for repayment in July and
November 2020, these loans were recognized in the current assets as of December 31,
2019. According to the contractual agreement of June 30, 2020, the term of the two loans
was extended by three years, so they were reclassified under the non-current assets.
Interest on the two loans as of the beginning of the extended terms (July 22, 2020 and
November 13, 2020) amounts to 5% per annum. Other non-current assets differed only
slightly. Within the current assets, the contract assets increased by € 4.2 million and the
advance payments increased by € 6.0 million, while the receivables decreased by € 5.6
million. Cash and cash equivalents decreased by € 8.7 million from € 82.6 to € 73.9 million.
Financing
On the liabilities side, non-current liabilities decreased in comparison with December 31,
2019 by € 1.4 million to € 51.8 million. A reduction of € 1.5 million in pension commitments
significantly affected this decrease.
Within the current liabilities, there were considerable changes within trade and other
payables on one hand and in contract liabilities and advance payments received on the
other. Due to (progress) billings, contract liabilities and payments received decreased by
€ 16.8 million, while trade and other payables increased by € 21.6 million.
The net working capital – the difference between current assets (less cash and cash
equivalents and short-term loans) and current liabilities – of € -47.4 million decreased
slightly in comparison with the figure as of December 31, 2019 (€ -51.2 million), but still
remains at a very good level.

11
Equity decreased during the reporting period by € 3.5 million from € 101.5 to € 98.0 million.
In addition to the negative Group net result of € -1.7 million in the first half-year, this
reduction primarily results from the differences due to currency translation in the amount of
€ 2.7 million reported in equity. Despite the slight reduction in equity, at 38.7%, the equity
ratio remains at a good level.
Non-Financial Performance Indicators
Non-financial performance indicators include mainly employee development, customer
satisfaction, the impact of our products on the environment, product quality and individual
employee-related performance indicators.
Target achievement in relation to non-financial performance indicators is measured with the
help of various instruments, such as annual employee appraisal, or the systematic
measuring of emissions values and energy consumption of individual products. Value-
oriented management in the KHD Group means that, for example, customer satisfaction
and the minimization of our products’ impact on the environment are more important than
short-term profit maximization.
The expenses for research and development in the KHD Group were € 1.3 million in the
first half-year 2020 (previous year: € 1.1 million). Despite the ongoing unsatisfactory result
situation, KHD invested in targeted further development of its technology for cement plants.
In addition to improving major plant components, the primary focus of research and
development (R&D) is improving the efficiency of cement production plants. Other crucial
R&D topics include developing environmentally friendly products and solution concepts,
with a particular emphasis on energy efficiency and emissions reduction, as well as using
alternative fuels in cement plants. An important goal is to continue to minimize the CO2
footprint associated with cement production in addition to reducing nitrogen oxide emissions
(NOX).
The KHD Group had 653 employees (excluding trainees) at the end of June 2020 (end of
2019: 664). The primary reason for the decrease is the reduction in staff related to
reorganization at Humboldt Wedag GmbH at the Cologne headquarters of KHD.

12
Report on Events after the Reporting Period
There were no further substantial developments or events of particular significance after the
balance sheet date of June 30, 2020.
Risk and Opportunities Report
KHD’s approach to risk management ensures that changes in the risk position are promptly
identified. To the extent required, provisions are set up for specific risks. The risks identified
do not pose a threat to the KHD Group as a going concern, either individually or in
combination.
In comparison with the balance sheet date in 2019, there has been no significant change in
the assessment of risks and opportunities as of the date of this half-year report. The risk of
regional or trans-regional epidemics or illness noted under "Country Risks" in the KHD
Group’s combined management report was realized in the first half-year 2020 as the
COVID-19 pandemic and has had serious and negative consequences for business
development. However, the assessment of risks and opportunities for the KHD Group has
not changed for the medium or long term as a result.
For a detailed description of the risks and opportunities, please refer to the relevant section
in the KHD Group’s combined management report as of December 31, 2019 (page 41 et
seq. of the Group Annual Report).

13
Outlook
According to analysis by the market research institute CW Research, global cement
consumption will decrease in 2020 in comparison with the previous year by 9%. In 2021,
another reduction in cement consumption of 4% is expected globally. The predicted
decrease in cement consumption outside of China is somewhat lower: 8% in 2020 and 3%
in 2021. The percentage China contributes to global cement consumption is expected to
remain stable at over 50%.
To a great extent, the KHD Group is able to confirm the outlook provided for the 2020
financial year in the 2019 annual report despite the serious and negative effects of the
COVID-19 pandemic. Because order intake for the 2019 financial year was influenced
significantly by a large project concluded in July 2019, the outlook published in March 2020
already indicated that the order intake and order backlog will both remain significantly below
last year's level. However, in comparison with the first half-year 2020, which was severely
impacted by the COVID-19 pandemic, we still expect significant improvement in the order
intake in both the Capex and the Plant Services segments in the second half-year. In
addition to the ongoing development of the pandemic, the expected order intake in the 2020
financial year is also highly dependent on geopolitical factors as well as the financial options
available to our customers for investment projects. As the recording of order intake, even
for contracts already signed, is often based on the fulfillment of further conditions, there may
well be shifts of order intake in the 2021 financial year.
The KHD Group confirms the outlook for revenue, adjusted EBIT and adjusted EBIT margin.
Revenue will be considerably higher than the previous year’s level. Due in particular to the
unsatisfactory margins of the order intake in previous years and insufficient business
volume in the Plant Services segment, adjusted EBIT will remain at a disappointing level in
the 2020 financial year as well. With respect to the previous year, however, adjusted EBIT
and the adjusted EBIT margin will improve considerably, but due to the effects of the
COVID-19 pandemic in particular, the KHD Group will likely not meet the original result
target entirely. Despite the clearly positive financial result, earnings before tax (EBT) will be
slightly negative. Due to scheduled project-related cash outflows and the low cash inflow
associated with advance payments by customers, KHD continues to expect a negative
operating cash flow in the low double digit millions range for the 2020 financial year.

14
Despite the negative impact of the COVID-19 pandemic and a slightly negative EBT, our
outlook shows that the KHD Group’s financial and net asset position will remain stable in
the 2020 financial year. The liquidity situation and the high equity ratio remain at a
comfortable level, which provides us with the flexibility to successfully cope with difficult
market phases as well as the current, unsatisfactory earnings situation. The successful
implementation of the reorganization at the Cologne site and the adjustment of the strategy
to focus on markets and products with which we offer customers real added value have
generated very positive outcomes. In spite of the currently unfavorable market conditions
and the negative effects and uncertainty due to the COVID-19 pandemic, the KHD Group
is convinced that, by taking further measures to increase competitiveness and support a
culture of excellence and performance, sustainable positive results will be achieved again
in the medium term.
Opportunities and Risks Relating to the Outlook for the Second Half-Year 2020
While the risk management system is, in principle, oriented toward the medium and long
term, during the planning process special consideration is given to the opportunities and
risks that can have an effect within the forecast period. Due to the special characteristics of
long-term plant engineering, risks and opportunities can also lead to significant deviations
from forecast figures in short-term outlook. Moreover, the outbreak of the COVID-19
pandemic significantly increased the uncertainty associated with the development of order
intake the earnings position.
There are significant risks, but also opportunities with regard to the predicted figures for
order intake, particularly in the Capex segment. The awarding of individual large contracts
to the KHD Group can significantly affect the order intake in the second half of the 2020
financial year. Despite close collaboration with customers during the tendering process,
customer investment decisions and the awarding of individual projects to the KHD Group
can only be forecast with substantial uncertainty, which can lead to either higher or lower
order intake.
15
The revenue and earnings forecast is mainly based on order backlog in the Capex segment
and on the planning of business in the Plant Services segment, which is significantly less
cyclical. The risks and opportunities relating to the planned revenue and earnings figures
are nevertheless significant in the second half of the 2020 financial year as well because,
in addition to the ongoing COVID-19 pandemic, delays or accelerations in project execution,
postponement of awarding projects included in the planned order intake, and unexpected
changes in the results of specific projects can affect these figures.
Cologne, Germany, August 14, 2020
The Management Board
(s) Yizhen Zhu (s) Jürgen Luckas (s) Dr. Matthias Jochem
(s) Tao Xing (s) Matthias Mersmann

16
INTERIM GROUP FINANCIAL STATEMENT
1 GROUP INCOME STATEMENT of
KHD Humboldt Wedag International AG
for the Period from January 1 to June 30, 2020
in € thousand Jan. 1 -
June 30, 2020 Jan. 1 -
June 30, 2019
Revenue 69,480 82,853
Cost of sales (60,646) (76,099)
Gross profit 8,834 6,754
Other operating income 868 1,118 Sales expenses (4,926) (6,737) General and administrative expenses (6,433) (5,912) Reorganization costs 0 (7,200) Other expenses (2,599) (2,302)
Earnings before interest and taxes (EBIT) (4,256) (14,279)
Finance income 4,089 4,431 Finance expenses (751) (754)
Net finance income 3,338 3,677
Earnings before tax (EBT) (918) (10,602)
Income tax expense (808) (2,141)
Group net result (1,726) (12,743)
Of which are attributable to: Parent company shareholders (1,728) (12,748) Non-controlling interests 2 5
(1,726) (12,743)
EARNINGS PER SHARE
Jan. 1 -
June 30, 2020 Jan. 1 -
June 30, 2019
Net profit attributable to shareholders (in € thousand) (1,728) (12,748)
Weighted average number of shares outstanding 49,703,573 49,703,573
Basic (undiluted) and diluted earnings per share in € (0.03) (0.26)
17
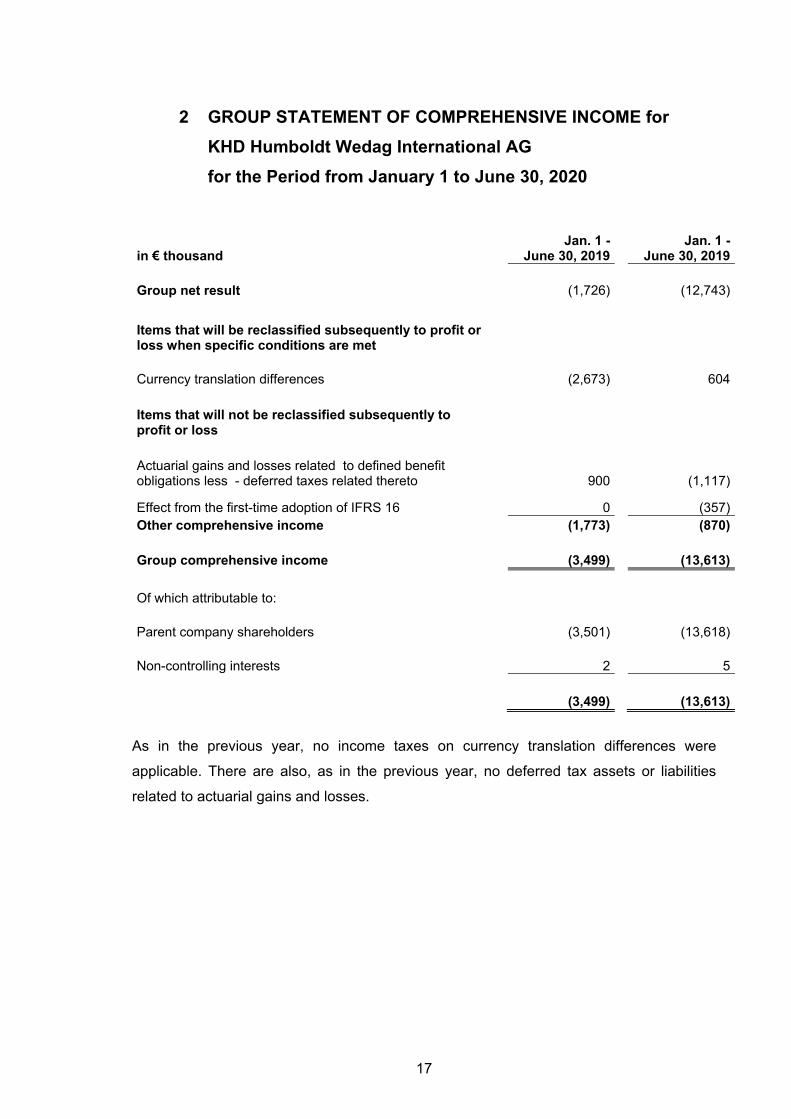
2 GROUP STATEMENT OF COMPREHENSIVE INCOME for
KHD Humboldt Wedag International AG
for the Period from January 1 to June 30, 2020
in € thousand Jan. 1 -
June 30, 2019 Jan. 1 -
June 30, 2019 Group net result (1,726) (12,743)
Items that will be reclassified subsequently to profit or loss when specific conditions are met Currency translation differences (2,673) 604
Items that will not be reclassified subsequently to profit or loss
Actuarial gains and losses related to defined benefit obligations less - deferred taxes related thereto 900 (1,117)
Effect from the first-time adoption of IFRS 16 0 (357) Other comprehensive income (1,773) (870) Group comprehensive income (3,499) (13,613)
Of which attributable to: Parent company shareholders (3,501) (13,618) Non-controlling interests 2 5 (3,499) (13,613)
As in the previous year, no income taxes on currency translation differences were
applicable. There are also, as in the previous year, no deferred tax assets or liabilities
related to actuarial gains and losses.
18
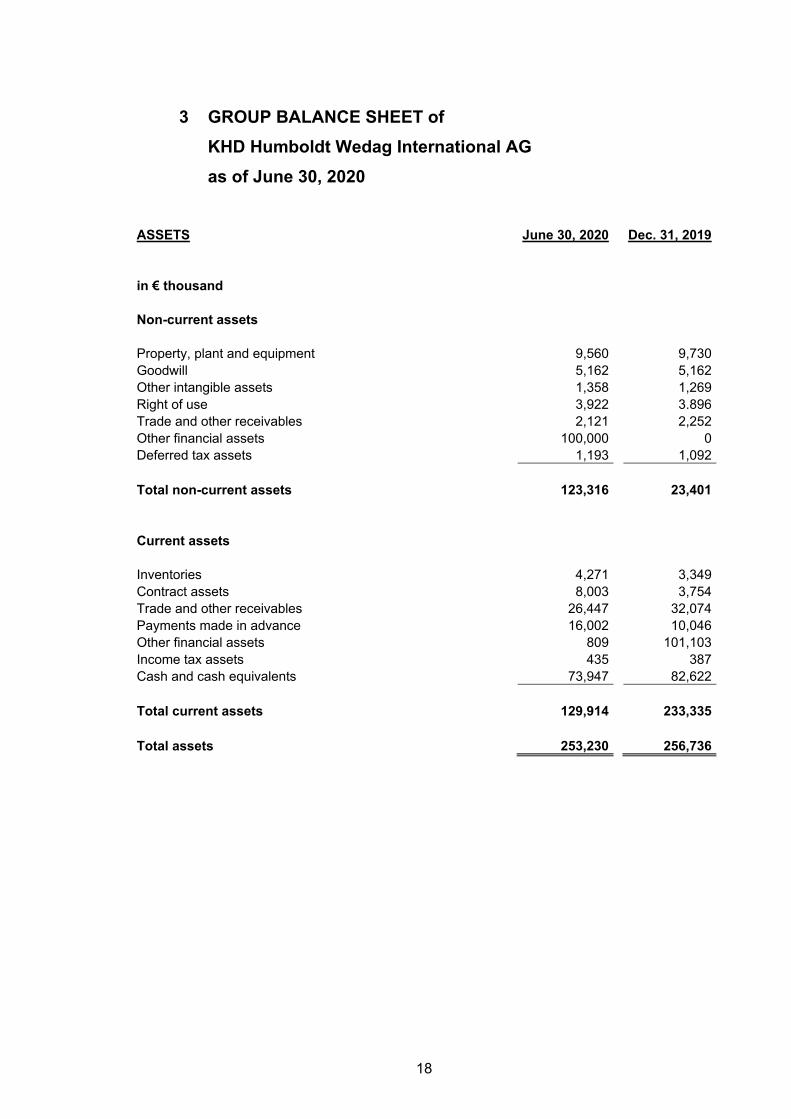
3 GROUP BALANCE SHEET of
KHD Humboldt Wedag International AG
as of June 30, 2020
ASSETS June 30, 2020 Dec. 31, 2019
in € thousand Non-current assets Property, plant and equipment 9,560 9,730 Goodwill 5,162 5,162 Other intangible assets 1,358 1,269 Right of use 3,922 3.896 Trade and other receivables 2,121 2,252 Other financial assets 100,000 0 Deferred tax assets 1,193 1,092
Total non-current assets 123,316 23,401
Current assets
Inventories 4,271 3,349 Contract assets 8,003 3,754 Trade and other receivables 26,447 32,074 Payments made in advance 16,002 10,046 Other financial assets 809 101,103 Income tax assets 435 387 Cash and cash equivalents 73,947 82,622
Total current assets 129,914 233,335
Total assets 253,230 256,736
19
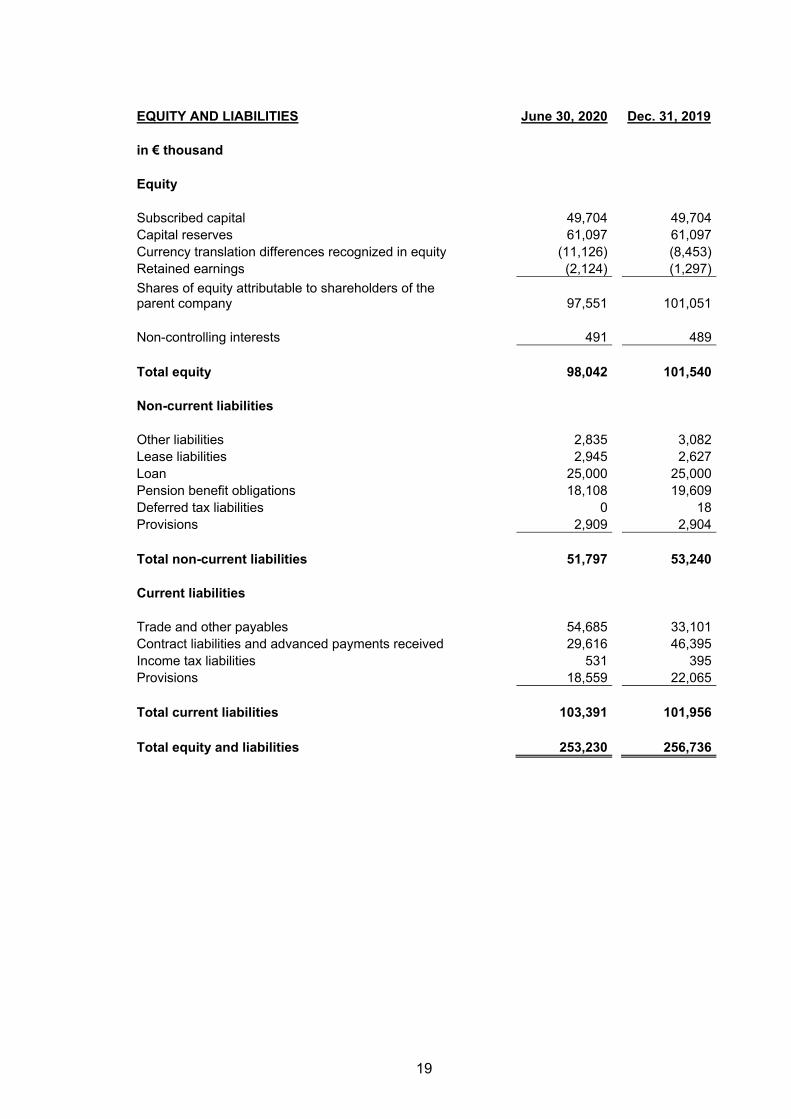
EQUITY AND LIABILITIES June 30, 2020 Dec. 31, 2019
in € thousand Equity Subscribed capital 49,704 49,704 Capital reserves 61,097 61,097 Currency translation differences recognized in equity (11,126) (8,453) Retained earnings (2,124) (1,297)
Shares of equity attributable to shareholders of the parent company 97,551 101,051
Non-controlling interests 491 489
Total equity 98,042 101,540
Non-current liabilities Other liabilities 2,835 3,082 Lease liabilities 2,945 2,627 Loan 25,000 25,000 Pension benefit obligations 18,108 19,609 Deferred tax liabilities 0 18 Provisions 2,909 2,904
Total non-current liabilities 51,797 53,240
Current liabilities
Trade and other payables 54,685 33,101 Contract liabilities and advanced payments received 29,616 46,395 Income tax liabilities 531 395 Provisions 18,559 22,065
Total current liabilities 103,391 101,956
Total equity and liabilities 253,230 256,736

20
4 GROUP STATEMENT OF CASH FLOW for
KHD Humboldt Wedag International AG
for the Period from January 1 to June 30, 2020
in € thousand Jan. 1 -
June 30, 2020 Jan. 1 -
June 30, 2019 Cash flow from operating activities Group net result (1,726) (12,743) Income tax expense recognized in the income statement 808 2,141 Net finance income recognized in the income statement (3,338) (3,677) Earnings before interest and taxes (EBIT) (4,256) (14,279) Amortization and depreciation of non-current assets 1,355 628
Increase(-)/decrease in trade receivables and financial assets 6,002 7,711 Increase (-)/decrease in inventories and contract assets (5,170) 6,235
Increase (-)/decrease in payments made in advance and other financial assets (5,662) 2,945 Increase (+)/decrease in trade and other payables and contract liabilities and advance payments received 4,944 (9,740) Increase (+)/decrease in pension benefit obligations (601) (601)
Increase (+)/decrease in provisions and non-current liabilities (3,748) (3,984) Other non-cash-transactions 329 268 Other translation differences (774) 173 Interest received 872 698 Interest paid (3) (153) Income tax received 0 145 Income tax paid (896) (848) Cash flow from operating activities (7,608) (10,802) Cash flow from investing activities Cash outflow for intangible assets (254) (235) Cash outflow for property, plant and equipment (778) (482)
Cash inflow from the disposal of property, plant and equipment 0 2 Interest received from Intercompany loans 2,974 1,463 Cash flow from investing activities 1,942 748

21
in € thousand Jan. 1 -
June 30, 2020 Jan. 1 -
June 30, 2019 Cash flow from financing activities Dividends paid 0 (852) Interest paid for loans (240) (239) lease payments (871) (861) Cash flow from financing activities (1,111) (1,952) Change in unrestricted cash and cash equivalents (6,777) (12,006
Opening balance of unrestricted cash and cash equivalents 82,622 72,228 Exchange rate effects (1,898) 431
Closing balance of unrestricted cash and cash equivalents 73,947 60,653
in € thousand June 30, 2020 June 30, 2019
Composition of unrestricted cash and cash equivalents Current bank accounts and cash 45,411 36,579 Short-term bank deposits and restricted cash 28,536 24,074 Total cash and cash equivalents 73,947 60,653
Closing balance of unrestricted cash and cash equivalents 73,947 60,653
22
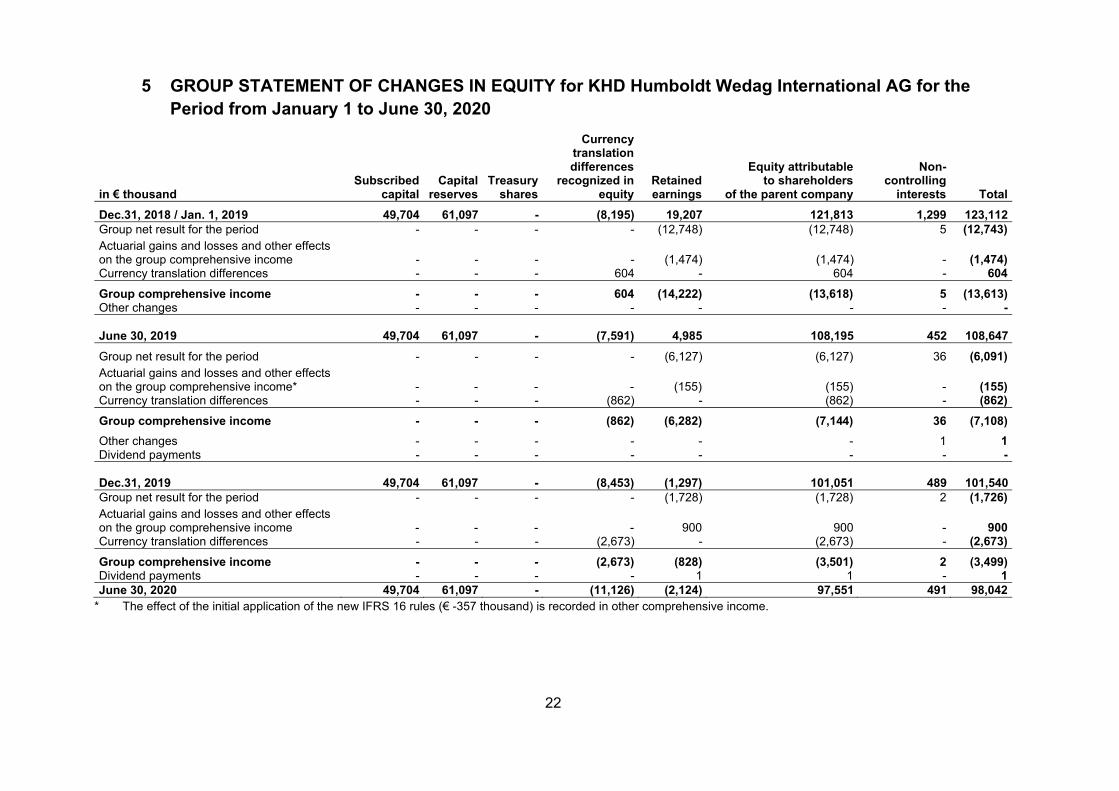
5 GROUP STATEMENT OF CHANGES IN EQUITY for KHD Humboldt Wedag International AG for the Period from January 1 to June 30, 2020
in € thousand Subscribed
capital Capital
reserves Treasury
shares
Currency translation differences
recognized in equity
Retained earnings
Equity attributable to shareholders
of the parent company
Non-controlling
interests Total
Dec.31, 2018 / Jan. 1, 2019 49,704 61,097 - (8,195) 19,207 121,813 1,299 123,112 Group net result for the period - - - - (12,748) (12,748) 5 (12,743) Actuarial gains and losses and other effects on the group comprehensive income - - - - (1,474) (1,474) - (1,474) Currency translation differences - - - 604 - 604 - 604
Group comprehensive income - - - 604 (14,222) (13,618) 5 (13,613) Other changes - - - - - - - -
June 30, 2019 49,704
61,097 - (7,591) 4,985 108,195 452 108,647
Group net result for the period - - - - (6,127) (6,127) 36 (6,091) Actuarial gains and losses and other effects on the group comprehensive income*
-
-
-
- (155) (155)
- (155)
Currency translation differences - - - (862) - (862) - (862)
Group comprehensive income - - - (862) (6,282) (7,144) 36 (7,108)
Other changes - - - - - - 1 1 Dividend payments - - - - - - - -
Dec.31, 2019 49,704
61,097 - (8,453) (1,297) 101,051 489 101,540 Group net result for the period - - - - (1,728) (1,728) 2 (1,726) Actuarial gains and losses and other effects on the group comprehensive income
-
-
-
- 900 900
- 900
Currency translation differences - - - (2,673) - (2,673) - (2,673)
Group comprehensive income - - - (2,673) (828) (3,501) 2 (3,499) Dividend payments - - - - 1 1 - 1 June 30, 2020 49,704 61,097 - (11,126) (2,124) 97,551 491 98,042
* The effect of the initial application of the new IFRS 16 rules (€ -357 thousand) is recorded in other comprehensive income.
23
6 NOTES TO THE GROUP FINANCIAL STATEMENTS of KHD
Humboldt Wedag International AG as of June 30, 2020
1. Group Structure and Affiliated Companies
KHD Humboldt Wedag International AG (“KHD” or “Group”) is one of the world’s leading
providers of equipment and services for cement producers. In its capacity as the managing
holding company of the Group, KHD holds a 100% interest in KHD Humboldt Wedag GmbH,
Cologne/Germany as of June 30, 2020, unchanged since December 31, 2019. The core
business areas of KHD’s 11 Group companies are industrial plant engineering and providing
related services. The strategic and operational focus of the Group entities is on planning
and supplying equipment for constructing plants for the cement industry and providing a
comprehensive range of services.
2. Reporting Principles
The interim financial statements of KHD are prepared using uniform accounting principles.
The interim financial statements of KHD and of the subsidiaries that are included in the
consolidated financial statements were prepared in accordance with International Financial
Reporting Standards (IFRS) and the related interpretations of the International Accounting
Standards Board (IASB), as applicable pursuant to regulation No. 1606/2002 of the
European Parliament and Council concerning the application of International Accounting
Standards in the EU for interim financial reporting. In accordance with IAS 34, this interim
report does not contain all of the information and notes to the financial statements that the
IFRS requires for consolidated financial statements at the end of a financial year.
These consolidated financial statements and the Group management report for the first half-
year 2020 were neither audited pursuant to Section 317 of the German Commercial Code
(HGB) nor were they subjected to an auditor’s review.
The accounting and measurement methods applied in these interim financial statements
are consistent with those applied as of December 31, 2019, unless changes are described.
The methods are described in detail in KHD’s Group Annual Report on the IFRS
consolidated financial statements as of December 31, 2019 on page 63 et seq.
24
These interim consolidated financial statements give a true and fair view of the net assets,
financial position and result of operations during the reporting period.
The preparation of interim financial statements requires that estimates are used and
assumptions made that impact the assets, liabilities, provisions, deferred tax assets and
liabilities as well as income and expenses. Over time, the estimates and assumptions can
change and significantly affect the net assets, financial position and result of operations of
KHD. Although the estimates and assumptions are made carefully and conscientiously, it
cannot be ruled out that the actual amounts might deviate from the estimates used in the
interim financial statements.
The assumptions and estimates apply for the most part to the group-wide determination of
economic useful life, the assumptions for the impairment test of goodwill, the measurement
of provisions and the usability of tax loss carryforwards as well as the estimation of project
costs and the percentage of completion in case of customer contracts with revenue
recognition over time.
The KHD Group operates in the area of plant engineering and construction. Contracts in
this area are frequently customer contracts with revenue recognition over time. In these
cases, KHD determines the result and revenue according to the stage of completion based
on the proportion of contract costs already incurred for the project to the estimated total
contract costs, i.e. an input method is applied. In the result, the revenue recognition over
time for customer contracts is equivalent to the recognition of profit based on the stage of
completion. An expected loss from customer contracts with revenue recognition over time
is immediately recorded in full as an expense. When revenue is recognized over time, the
estimate of the stage of completion is particularly important. Significant estimates include,
in particular, the overall project costs, overall contract revenues, contract risks and other
relevant figures. When revenue is recognized over time, changes in estimates can lead to
an increase or decrease in revenue.
25
These interim consolidated financial statements have been prepared in euro. All amounts,
including figures used for comparison, are stated in thousands of euros (€ thousand). All
amounts have been rounded in accordance with standard commercial practice.
3. Applying New or Revised International Financial Reporting Standards
In the reporting period, the Group applied all International Accounting Standards Board
(IASB) standards and International Financial Reporting Interpretations Committee (IFRIC)
interpretations required to be applied, provided that the standards and interpretations have
already been endorsed by the European Union (EU).
Initial Application of Recently Published Standards
KHD has already made a detailed statement regarding the initial application of IFRS 16
"Leases" and its effect on the net assets, financial position, and result of operations in the
IFRS consolidated financial statements as of December 31, 2019 on page 74 et seq.
The following rules and amendments in EU law were adopted in the first half-year 2020:
- Amendment to IFRS 3: "Definition of a Business", published in October 2018,
endorsed into EU law in April 2020;
- Amendments to IFRS 9, IAS 39, and IFRS 7: According to the "Interest Benchmark
Reform", existing interest benchmarks such as "IBOR" are to be replaced by new,
less risky benchmarks developed by the Financial Stability Board (FSB). This affects
hedge accounting rules, for example, and the continuation of hedge accounting in
the balance sheet. Endorsed into EU law in January 2020.
The application of these rules and amendments does not result in any significant effects on
the Group's net assets, financial position and result of operations.

26
Published Standards for which application is not yet required
In the current reporting period, the IASB has published a variety of standards,
interpretations and changes to standards and interpretations, the application of which is not
yet mandatory and, in part, still require endorsement into EU law.
- Amendments to IFRS 3, IAS 16, and IAS 37: Published in May 2020, initial
application in the 2022 financial year, endorsement into EU law still pending;
- Amendments to IFRS 16: "Rent Concessions", published in May 2020, initial
application in the 2020 financial year, endorsement into EU law still pending.
KHD does not expect these amendments to result in any significant effects on the Group's
net assets, financial position and result of operations.
4. Consolidation
Subsidiaries are the companies in which investments are held and in which KHD has power
over the investee, has an exposure to variable returns from its involvement with the
investee, and has the ability to use its power over the investee to affect the amount of KHD’s
returns. At KHD this is regularly the case when KHD holds, directly or indirectly, more than
50% of the voting rights or controls the business activities in another manner. These
companies are, as a general rule, consolidated. Subsidiaries are consolidated from the date
when actual control is transferred to KHD and are deconsolidated from the date when
control no longer exists. All intercompany transactions, balances, and unrealized profits or
losses on intra-Group transactions are eliminated. The accounting and measurement
principles applicable to subsidiaries pursuant to statutory law are adjusted in order to ensure
consistency with the accounting and valuation principles of KHD. Non-controlling interests
are presented and commented on separately.
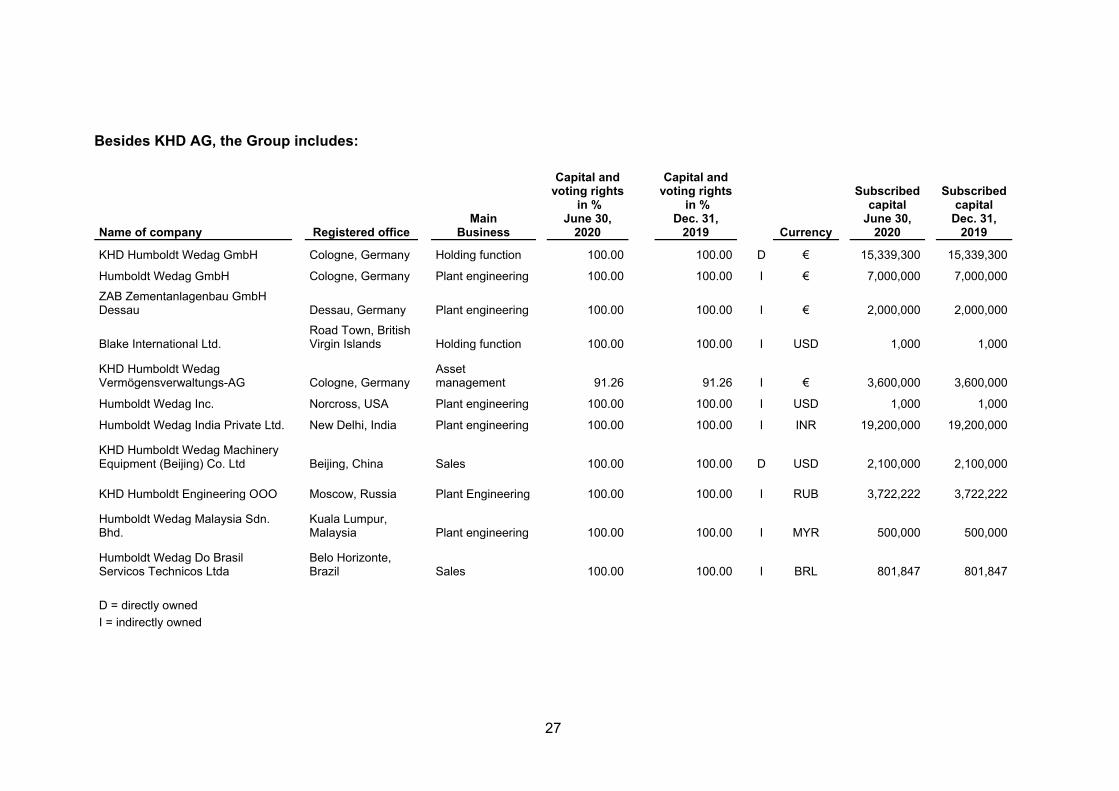
27
Besides KHD AG, the Group includes:
Name of company
Registered office Main
Business
Capital and voting rights
in % June 30,
2020
Capital and voting rights
in % Dec. 31,
2019
Currency
Subscribed capital
June 30, 2020
Subscribed capital
Dec. 31, 2019
KHD Humboldt Wedag GmbH Cologne, Germany Holding function 100.00 100.00 D € 15,339,300 15,339,300
Humboldt Wedag GmbH Cologne, Germany Plant engineering 100.00 100.00 I € 7,000,000 7,000,000
ZAB Zementanlagenbau GmbH Dessau Dessau, Germany Plant engineering 100.00 100.00 I € 2,000,000 2,000,000
Blake International Ltd. Road Town, British Virgin Islands Holding function 100.00 100.00 I USD 1,000 1,000
KHD Humboldt Wedag Vermögensverwaltungs-AG Cologne, Germany
Asset management 91.26 91.26 I € 3,600,000 3,600,000
Humboldt Wedag Inc. Norcross, USA Plant engineering 100.00 100.00 I USD 1,000 1,000
Humboldt Wedag India Private Ltd. New Delhi, India Plant engineering 100.00 100.00 I INR 19,200,000 19,200,000
KHD Humboldt Wedag Machinery Equipment (Beijing) Co. Ltd Beijing, China Sales 100.00 100.00 D USD 2,100,000 2,100,000
KHD Humboldt Engineering OOO Moscow, Russia Plant Engineering 100.00 100.00 I RUB 3,722,222 3,722,222
Humboldt Wedag Malaysia Sdn. Bhd.
Kuala Lumpur, Malaysia Plant engineering 100.00 100.00 I MYR 500,000 500,000
Humboldt Wedag Do Brasil Servicos Technicos Ltda
Belo Horizonte, Brazil Sales 100.00 100.00 I BRL 801,847 801,847
D = directly owned I = indirectly owned
28
5. Segment Reporting
For KHD, reporting is done in two separate segments. The Capex segment (project
business) is differentiated from the Plant Services segment (after sales business). Segment
reporting is oriented towards internal Group management control and internal financial
reporting, i. e. it is based on the management approach. The business activities of the two
reportable segments include the following services:
- Capex (project business)
In the Capex segment, the KHD Group reports all revenues and expenses resulting
from supplying equipment for cement plants and providing services directly linked to
the equipment supply. This encompasses process technology, design, engineering,
project management and the supply of technology and equipment. In addition,
supervision of erection and commissioning of cement plants are allocated to this
segment. General and administrative expenses, sales expenses and other
expenses (in particular research and development costs) are allocated to this
segment, accordingly.
- Plant Services
The Plant Services segment is engaged in after sales business. It comprises all
revenues and expenses resulting from supplying spare parts and providing services
to existing cement plants. Services include optimizing cement plants, maintenance
services, carrying out plant audits, creating optimization concepts and training plant
personnel. General and administrative expenses, sales expenses and other
expenses are allocated to the segment accordingly.
Management and controlling of the KHD Group is based in particular on key figures for the
balance sheet and income statement. However, for the operating segments, key figures are
determined only for the income statement and for order intake, but not for the balance sheet.
In its function as the chief operating decision maker, the Management Board assesses the
profitability of the segments based on the operating result (earnings before interest and
taxes – EBIT, or rather, adjusted EBIT).
29
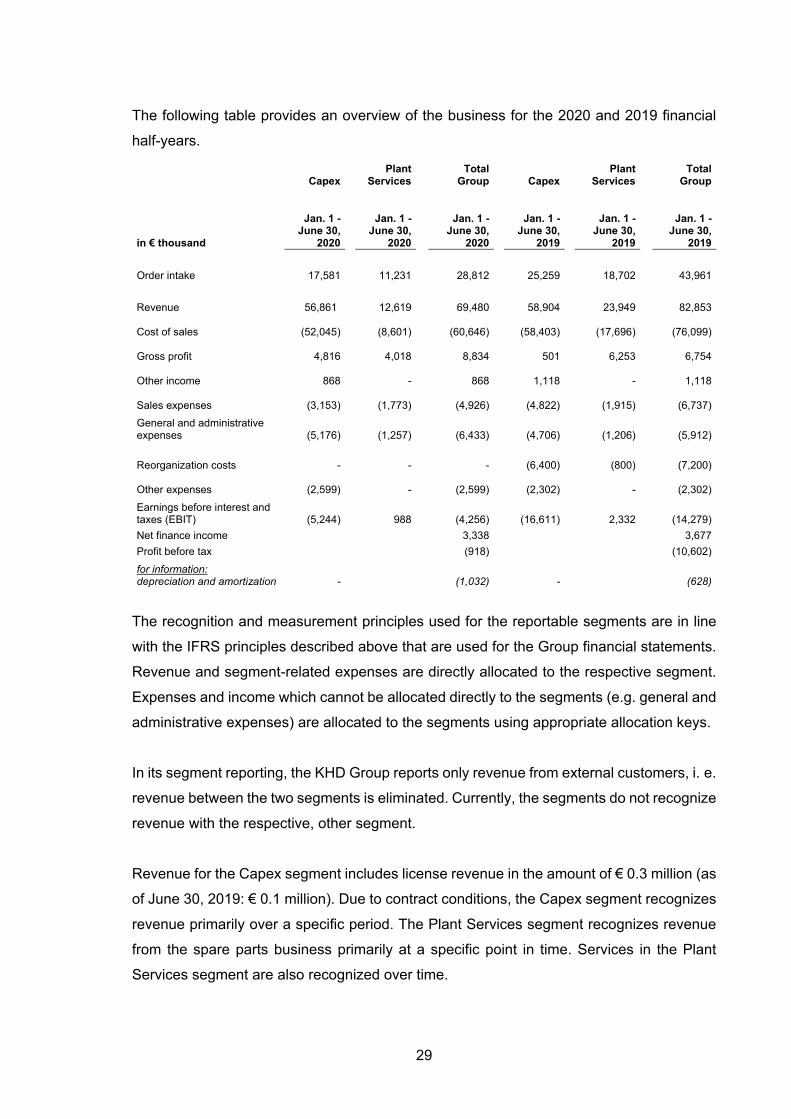
The following table provides an overview of the business for the 2020 and 2019 financial
half-years.
Capex Plant
Services Total
Group Capex Plant
Services Total
Group
in € thousand
Jan. 1 - June 30,
2020
Jan. 1 - June 30,
2020
Jan. 1 - June 30,
2020
Jan. 1 - June 30,
2019
Jan. 1 - June 30,
2019
Jan. 1 - June 30,
2019
Order intake 17,581 11,231 28,812 25,259 18,702 43,961
Revenue 56,861 12,619 69,480 58,904 23,949 82,853
Cost of sales
(52,045)
(8,601) (60,646)
(58,403)
(17,696) (76,099)
Gross profit 4,816 4,018 8,834
501 6,253 6,754
Other income 868
- 868
1,118
- 1,118
Sales expenses (3,153)
(1,773) (4,926)
(4,822)
(1,915)
(6,737)
General and administrative expenses (5,176)
(1,257)
(6,433)
(4,706)
(1,206)
(5,912)
Reorganization costs - - - (6,400) (800) (7,200)
Other expenses
(2,599) -
(2,599)
(2,302)
-
(2,302)
Earnings before interest and taxes (EBIT) (5,244) 988 (4,256) (16,611) 2,332 (14,279)
Net finance income 3,338 3,677
Profit before tax (918) (10,602)
for information: depreciation and amortization - (1,032) - (628)
The recognition and measurement principles used for the reportable segments are in line
with the IFRS principles described above that are used for the Group financial statements.
Revenue and segment-related expenses are directly allocated to the respective segment.
Expenses and income which cannot be allocated directly to the segments (e.g. general and
administrative expenses) are allocated to the segments using appropriate allocation keys.
In its segment reporting, the KHD Group reports only revenue from external customers, i. e.
revenue between the two segments is eliminated. Currently, the segments do not recognize
revenue with the respective, other segment.
Revenue for the Capex segment includes license revenue in the amount of € 0.3 million (as
of June 30, 2019: € 0.1 million). Due to contract conditions, the Capex segment recognizes
revenue primarily over a specific period. The Plant Services segment recognizes revenue
from the spare parts business primarily at a specific point in time. Services in the Plant
Services segment are also recognized over time.

30
The following project data was allocated to the different geographical areas according to
the place of performance or delivery of the products and services.
Revenue Non-current assets
in € thousand Jan. 1 -
June 30, 2020 Jan. 1 -
June 30, 2019 June 30, 2020 Dec. 31, 2019 North America 35,354 2,952 897 186 Rest of Asia 8,829 26,726 - 2 India 8,051 10,597 8,727 9,406 China 5,205 736 155 218 Germany 4,955 4,069 7,183 7,203 Middle East 1,866 8,638 - - Rest of Europe 1,841 10,530 - - Russia 1,122 2,363 3,040 3,042 Africa 924 13,154 - - South America 830 3,060 - - Other 503 28 - - 69,480 82,853 20,002 20,057
Order Intake Order Backlog
in € thousand Jan. 1 -
June 30, 2020 Jan. 1 -
June 30, 2019 June 30, 2020 Dec. 31, 2019 China 8,738 4,287 9,217 5,763 North America 8,187 5,524 179,519 206,558 India 3,872 17,179 24,901 30,637 Rest of Asia 2,734 8,259 18,729 25,890 Middle East 1,429 1,739 3,104 3,541 Germany 1,133 1,645 4,278 9,291 Rest of Europe 952 3,099 2,647 3,535 Russia 728 1,245 7,201 7,724 Africa 671 476 4,947 5,200 South America 303 458 995 1,519 Other 65 41 7,703 8,142 28,812 43,961 263,241 307,800
31
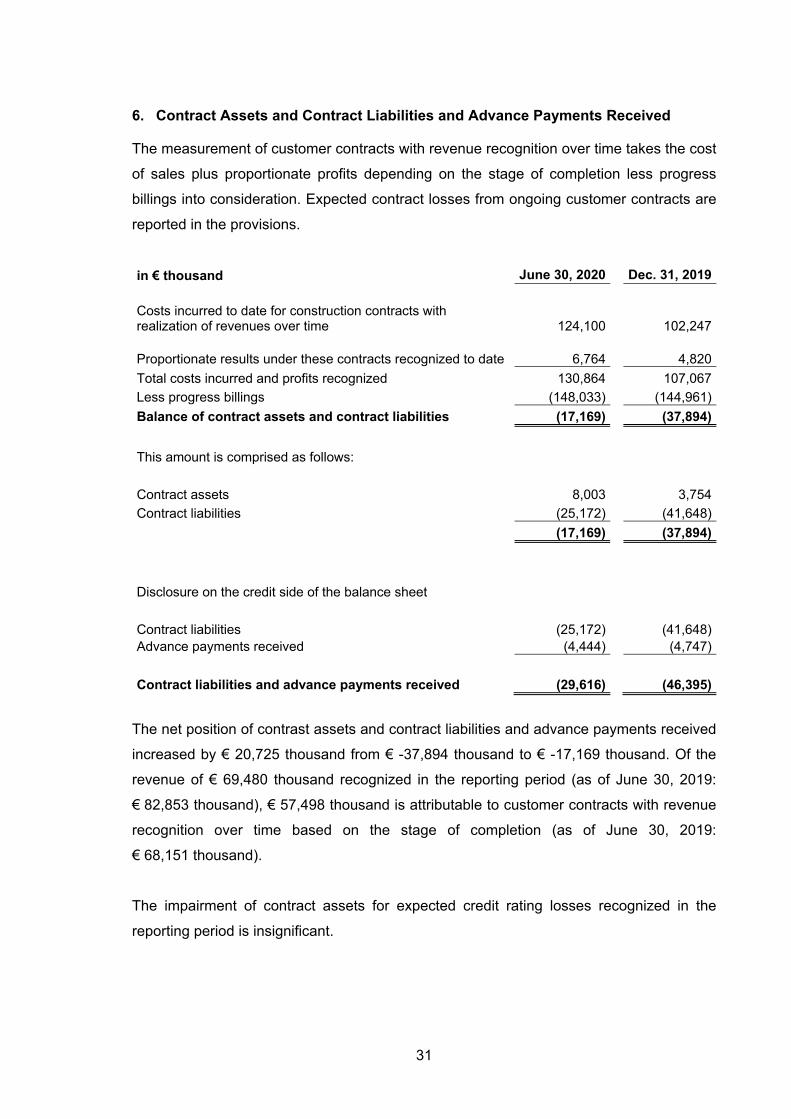
6. Contract Assets and Contract Liabilities and Advance Payments Received
The measurement of customer contracts with revenue recognition over time takes the cost
of sales plus proportionate profits depending on the stage of completion less progress
billings into consideration. Expected contract losses from ongoing customer contracts are
reported in the provisions.
in € thousand June 30, 2020 Dec. 31, 2019 Costs incurred to date for construction contracts with realization of revenues over time 124,100 102,247
Proportionate results under these contracts recognized to date 6,764 4,820
Total costs incurred and profits recognized 130,864 107,067
Less progress billings (148,033) (144,961)
Balance of contract assets and contract liabilities (17,169) (37,894)
This amount is comprised as follows:
Contract assets 8,003 3,754
Contract liabilities (25,172) (41,648)
(17,169) (37,894)
Disclosure on the credit side of the balance sheet
Contract liabilities (25,172) (41,648) Advance payments received (4,444) (4,747)
Contract liabilities and advance payments received (29,616) (46,395)
The net position of contrast assets and contract liabilities and advance payments received
increased by € 20,725 thousand from € -37,894 thousand to € -17,169 thousand. Of the
revenue of € 69,480 thousand recognized in the reporting period (as of June 30, 2019:
€ 82,853 thousand), € 57,498 thousand is attributable to customer contracts with revenue
recognition over time based on the stage of completion (as of June 30, 2019:
€ 68,151 thousand).
The impairment of contract assets for expected credit rating losses recognized in the
reporting period is insignificant.

32
The measurement of customer contracts with revenue recognition over time is affected by
estimations with respect to project revenue and project costs. Here, particularly in terms of
the additional incurred costs up to completion and, therefore, the total project costs,
changes in estimates can occur. Changes in estimates for projects are recorded in the
calculation of the amount for earnings and expenses in the profit or loss for the period in
which the change was made as well as in the following periods. In this way, changes in
estimates have a direct effect on the recognized result from customer contracts with
revenue recognition over time. There were no negative effects from changes in estimates
in the first half-year 2020 (as of June 30, 2019: € 5 – 7 million).
7. Cash and Cash Equivalents
The Group discloses cash and cash equivalents in the amount of € 73,947 thousand (as of
December 31, 2019: € 82,622 thousand).
in € thousand June 30, 2020 Dec. 31, 2019 Bank balances and cash on hand 45,411 51,889 Short-term bank deposits 28,536 30,733 73,947 82,622
8. Other Expenses
in € thousand Jan. 1 -
June 30, 2020 Jan. 1 -
June 30, 2019 Research and development 1,264 1,123 Exchange rate losses and expenses from derivatives 940 791 Miscellaneous expenses 395 388 2,599 2,302

33
9. Income Tax Expenses
The expenses recognized in the first half-year 2020 for income taxes amount to
€ 808 thousand (as of June 30, 2019: € 2,141 thousand). The income tax expense is
composed as follows:
in T€ Jan. 1 -
June 30, 2020 Jan. 1 -
June 30, 2019 Current tax expense (1,008) (1,307) Deferred tax expense (-) / income (+) 200 (834)
Tax expense for the year (808) (2,141)
The taxes disclosed in the interim period are calculated using the estimated effective tax
rate of the respective KHD Group company.
10. Transactions with Related Parties
As defined by IAS 24, in addition to the subsidiaries of KHD, the related companies also
include those companies that have a controlling or joint management interest in KHD or
exercise considerable influence as well as those other related companies of AVIC Group
that are affiliated with these. As business transactions between KHD and its consolidated
subsidiaries were eliminated in the consolidation process, the following presents only the
transactions with respect to direct and indirect parent companies of KHD and the other
related companies or persons that were not eliminated.
Relationships to Indirect Parent Companies
There has been a cooperation agreement with AVIC Beijing since 2010, reinforced since
February 2011 by the capital interest in KHD amounting to 20% that is held by Max Glory
Industries Limited (Max Glory), an AVIC Beijing group company. As a consequence of a
public takeover offer, AVIC Beijing further increased its indirect share in KHD in the 2014
financial year. As of June 30, 2020, AVIC Beijing continues to hold the majority of KHD
shares indirectly with 89.02%.
34
Relationships to other Related Companies
KHD concluded a consulting contract in the 2019 financial year with 4-stream consulting
GmbH, Roetgen, a company related to Management Board member Dr. Matthias Jochem
(since June 1, 2019) as an affiliated company. According to the contractual agreement,
€ 104 thousand was recorded by KHD as expenses for consulting service provided in the
period from January 1 through June 30, 2020. The liabilities due to 4-stream consulting
GmbH amounted to € 26 thousand as of June 30, 2020 (as of December 31, 2019:
€ 15 thousand).
KHD granted two loans to AVIC International Kairong Limited (AVIC Kairong), Hong Kong,
each for € 50,000 thousand, in the 2017 financial year. According to the contractual
agreement of June 30, 2020, the term of the two loans was extended by three years. Interest
on the two loans as of the beginning of the extended terms (July 22, 2020 and November
13, 2020) amounts to 5% per annum. The loans bear interest of 6% and 5.7% per annum,
respectively. KHD has the right to demand full or partial repayment of a loan at any time
before the due date with a notification period of 30 days. AVIC Kairong also has the right to
repay the loan in full or in part before the due date with a written notification period of 30
days. Both loans are secured by a corporate guarantee from AVIC. Because the remaining
term of the loans is longer than 12 months, they are reported under other non-current
financial assets.
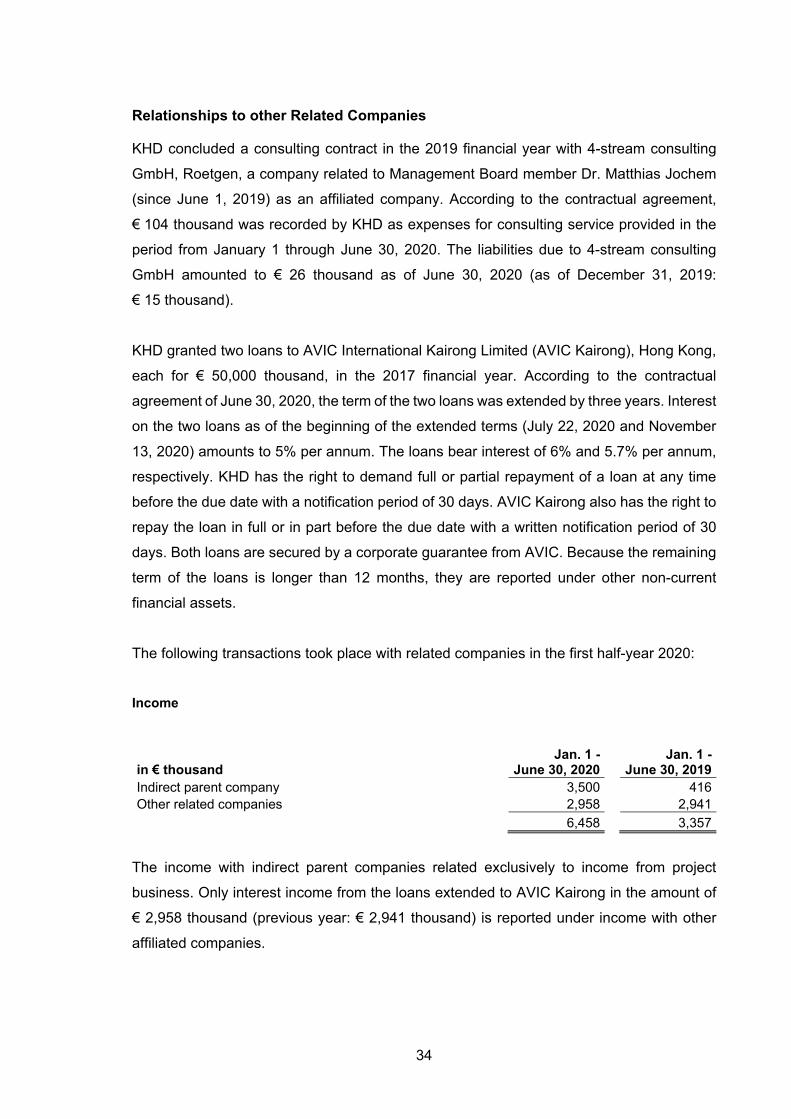
The following transactions took place with related companies in the first half-year 2020:
Income
in € thousand Jan. 1 -
June 30, 2020 Jan. 1 -
June 30, 2019 Indirect parent company 3,500 416 Other related companies 2,958 2,941
6,458 3,357
The income with indirect parent companies related exclusively to income from project
business. Only interest income from the loans extended to AVIC Kairong in the amount of
€ 2,958 thousand (previous year: € 2,941 thousand) is reported under income with other
affiliated companies.

35
Expenses
In the first half-year 2020 there were no expenses from transactions with indirect parent
companies (as of June 30, 2019: € 2,179 thousand). The expenses in the previous year
were a result of contract costs for projects in which AVIC is KHD’s customer.
Current assets
in € thousand June 30, 2020 Dec. 31, 2019 Indirect parent company 3,283 3,005 Other related companies 1,709 1,495
4,992 4,500
As of June 30, 2020, current assets due from the companies of the AVIC Group amounted
to € 4,992 thousand (as of December 31, 2019: € 4,500 thousand). These are primarily the
result of receivables (including advance payments) from projects and interest receivables.
In addition, the loans granted to AVIC Kairong for a total of € 100,000 thousand were
reported as current assets from other related companies as of December 31, 2019.
Non-current Assets
Following the extension, the two loans granted to AVIC Kairong were reclassified under the
non-current assets as of June 30, 2020. As a result, € 100,000 thousand (as of
December 31, 2019: € 0 thousand) are reported as non-current assets from other related
companies.
Liabilities
Liabilities due to indirect parent companies amount to € 933 thousand (as of December 31,
2019: € 984 thousand).
36
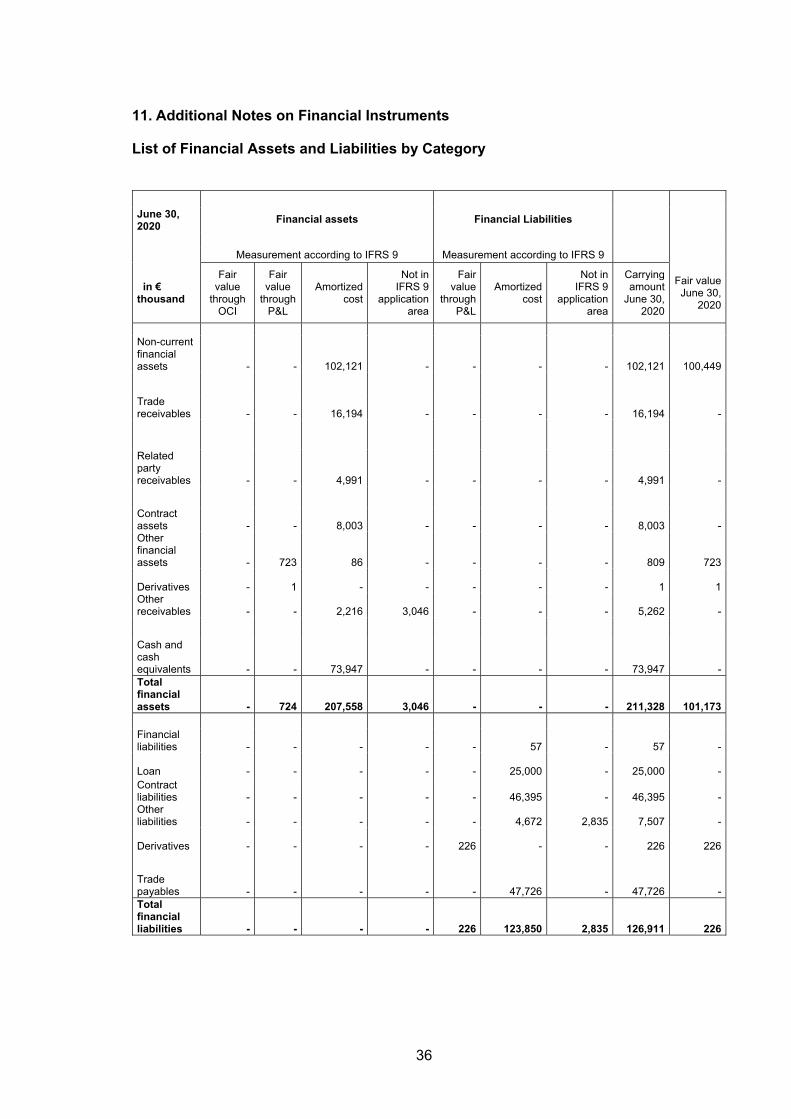
11. Additional Notes on Financial Instruments
List of Financial Assets and Liabilities by Category
Financial assets Financial Liabilities
June 30, 2020
Measurement according to IFRS 9 Measurement according to IFRS 9
in € thousand
Fair value
through OCI
Fair value
through P&L
Amortized cost
Not in IFRS 9
application area
Fair value
through P&L
Amortized cost
Not in IFRS 9
application area
Carrying amount
June 30, 2020
Fair value June 30,
2020
Non-current financial assets
-
-
102,121
-
-
-
-
102,121
100,449
Trade receivables
-
-
16,194
-
-
-
-
16,194
-
Related party receivables
-
-
4,991
-
-
-
-
4,991
-
Contract assets
-
- 8,003
-
-
-
-
8,003
-
Other financial assets
-
723
86
-
-
-
-
809
723
Derivatives
- 1
-
-
-
-
-
1
1 Other receivables
-
-
2,216
3,046
-
-
-
5,262
-
Cash and cash equivalents
-
-
73,947
-
-
-
-
73,947
-
Total financial assets
- 724 207,558
3,046
-
-
-
211,328
101,173
Financial liabilities
-
-
-
-
-
57
-
57
-
Loan
-
-
-
-
-
25,000
-
25,000
- Contract liabilities
-
-
-
-
-
46,395
-
46,395
-
Other liabilities
-
-
-
-
-
4,672 2,835
7,507
-
Derivatives
-
-
-
-
226
-
-
226
226
Trade payables
-
-
-
-
-
47,726
-
47,726
-
Total financial liabilities
-
-
-
-
226
123,850
2,835
126,911
226

37
Financial assets Financial Liabilities
Dec.31, 2019
Measurement according to IFRS 9 Measurement according to IFRS 9
in € thousand
Fair value
through OCI
Fair value
through P&L
Amortized cost
Not in IFRS 9
application area
Fair value
through P&L
Amortized cost
Not in IFRS 9
application area
Carrying amount
Dec. 31, 2019
Fair value Dec. 31,
2019
Non-current financial assets
-
- 2,252
-
-
-
-
2,252 -
Trade receivables
-
-
23,342
-
-
-
-
23,342
-
Related party receivables
-
-
3,855
-
-
-
-
3,855
-
Contract assets
-
- 3,754
-
-
-
-
3,754
-
Other financial assets
-
1,017
100,086
-
-
-
-
101,103
101,074
Derivatives
-
53
-
-
-
-
-
53
53
Other receivables
-
-
1,659 3,165
-
-
-
4,824
-
Cash and cash equivalents
-
-
82,622
-
-
-
-
82,622
-
Total financial assets
-
1,070
217,570 3,165
-
-
-
221,805
101,127
Financial liabilities
-
-
-
-
-
57
-
57
-
Loan
-
-
-
-
-
25,000
-
25,000
-
Contract liabilities
-
-
-
-
-
46,395
-
46,395
-
Other liabilities
-
-
-
-
-
5,190
3,082
8,272
-
Derivatives
-
-
- -
-
-
-
Trade payables
-
-
-
-
-
26,082
-
26,082
-
Total financial liabilities
-
-
-
- -
102,724
3,082
105,806
-
The carrying amounts reported as of June 30, 2020 are equivalent to the fair values in the
instances where there is no explicit disclosure.
38
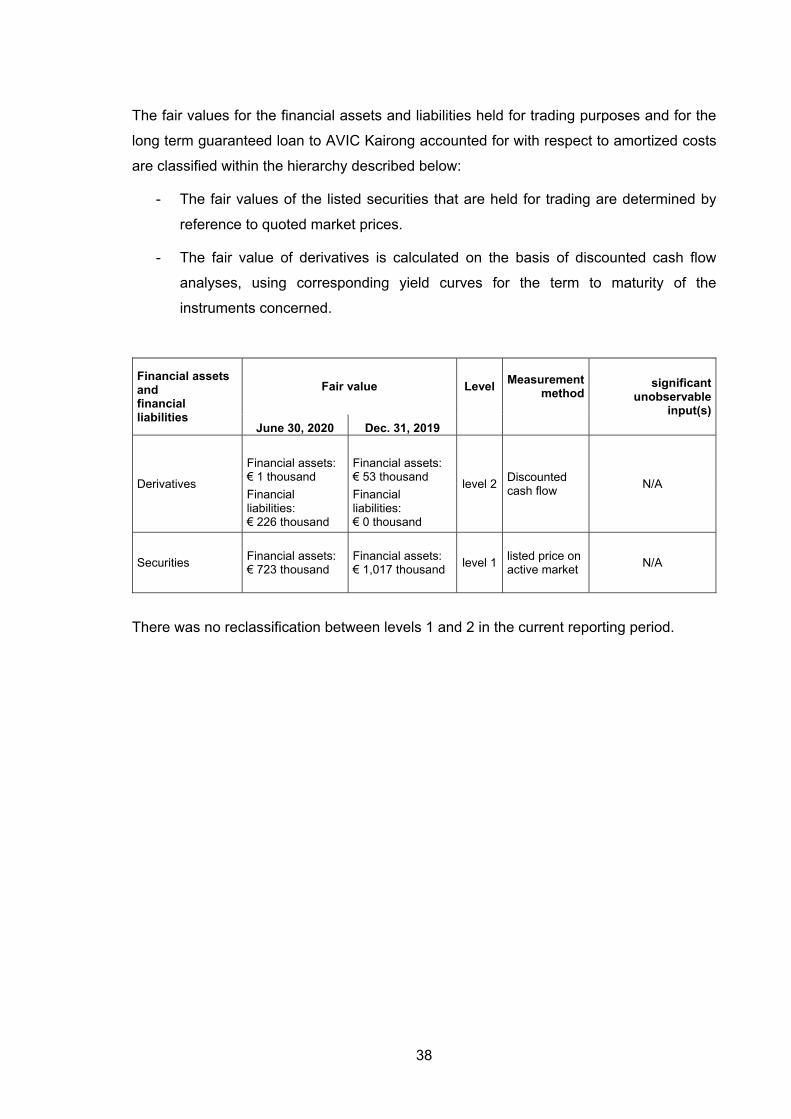
The fair values for the financial assets and liabilities held for trading purposes and for the
long term guaranteed loan to AVIC Kairong accounted for with respect to amortized costs
are classified within the hierarchy described below:
- The fair values of the listed securities that are held for trading are determined by
reference to quoted market prices.
- The fair value of derivatives is calculated on the basis of discounted cash flow
analyses, using corresponding yield curves for the term to maturity of the
instruments concerned.
Financial assets and financial liabilities
Fair value Level Measurement
method significant
unobservable input(s)
June 30, 2020 Dec. 31, 2019
Derivatives
Financial assets: € 1 thousand
Financial assets: € 53 thousand
level 2 Discounted cash flow
N/A Financial liabilities: € 226 thousand
Financial liabilities: € 0 thousand
Securities Financial assets: € 723 thousand
Financial assets: € 1,017 thousand
level 1 listed price on active market
N/A
There was no reclassification between levels 1 and 2 in the current reporting period.

39
12. Other Information
Within the scope of its normal business activities, the KHD Group has contingent liabilities
due to advance guarantees, performance bonds, and guarantees for warranty obligations.
The Group does not anticipate any material liabilities due to these commitments. The
arranged bank guarantee credit facilities allow individual KHD Group companies to provide
bank guarantees for its customers worldwide. As part of these guarantee facilities, the
Group has provided bank guarantees within the scope of its normal business activities in
the amount of € 49.5 million (as of December 31, 2019: € 44.9 million).
13. Responsibility Statement
To the best of our knowledge we assure that, in accordance with the applicable reporting
standards for interim financial reporting, the interim consolidated financial statements, in
accordance with the accounting standards generally accepted in Germany, give a true and
fair view of the net assets, financial position, and result of operations of the Group, and the
interim Group management report includes a fair review of the development and
performance of the business and the position of the Group along with a description of the
principal opportunities and risks associated with the expected development of the Group for
the remainder of the financial year.
In addition, we assure that the interim financial report complies with the regulations of
IAS 34 in addition to further applicable International Accounting Standards and the
applicable interpretations of the IFRS Interpretations Committee.
Cologne, Germany, August 14, 2020
The Management Board
(s) Yizhen Zhu (s) Jürgen Luckas Dr. Matthias Jochem
(s) Tao Xing (s) Matthias Mersmann