Embed Size (px)
Citation preview
Halimeda Dynamics Relative to Nutrients Availability in The Florida
Keys National Marine Sanctuary: A Good Indicator of Productivity and
Acidification.
Ligia Collado-Vides and James W. FourqureanFlorida International University
Linking Science with managementOctober 2010

Linking science to management:Search for a Miner’s Canary
– Describe the spatial and temporal dynamics of the genus Halimeda in the seagrass beds in the FKNMS.
– Evaluate the mass production and correlate it with nutrient availability.
– Evaluate the potential use of Halimeda as an indicator for changes in productivity and acidification.
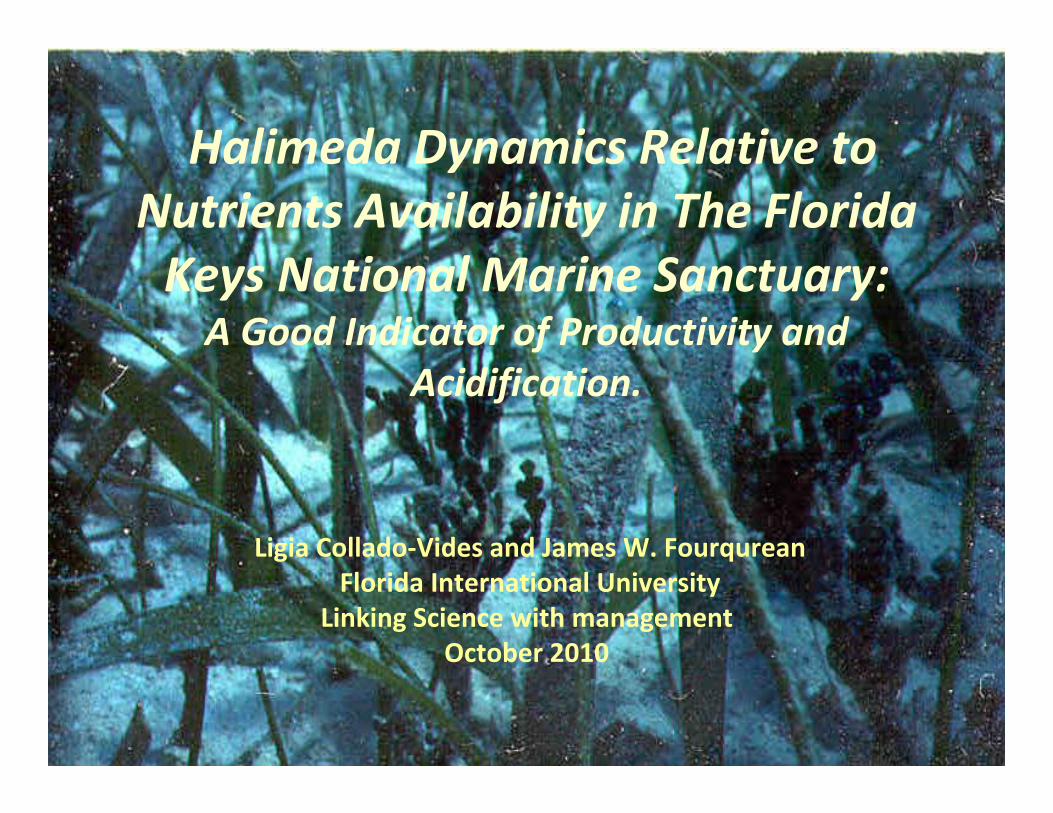
Why Halimeda?
•Calcareous green macroalgaeare the dominant non-vascular flora found in seagrass in the FKNMS (Fourqurean and Rutten 2001).
•Seagrass monitoring program show that calcareous green species of the genus Halimeda are increasing in the FKNMS. (Collado-Vides et al 2005, 2007).
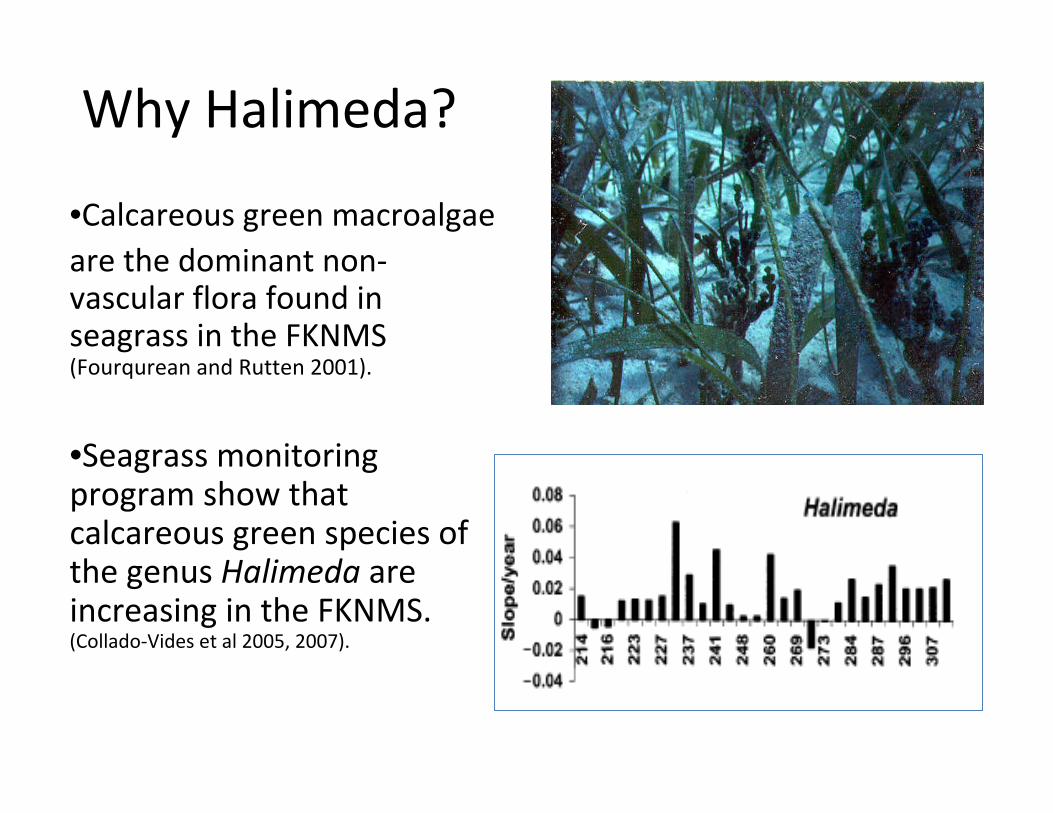
Why Halimeda?Halimeda is a genus of considerableimportance in coral reef areas including seagrass beds, contributing both organicproduction and significant amounts of calcareous sediment.
Deposition of calcium carbonate by marine algae (in shallow and deep sea environments) is an important aspect of the global carbon cycle (blue carbon).
Carbonate sediments produced by the Codiacean genus Halimeda make a major contribution to reef mass in regions such as the Bahamas, Tahiti and the Great Barrier Reef.
Good indicators for historic climatic reconstructions.(Drew and Abel 1985, Blair and Norris 1988; Drew and Abel 1988; Payri 1988, Flügel 1988; Marshall and Davies 1988)
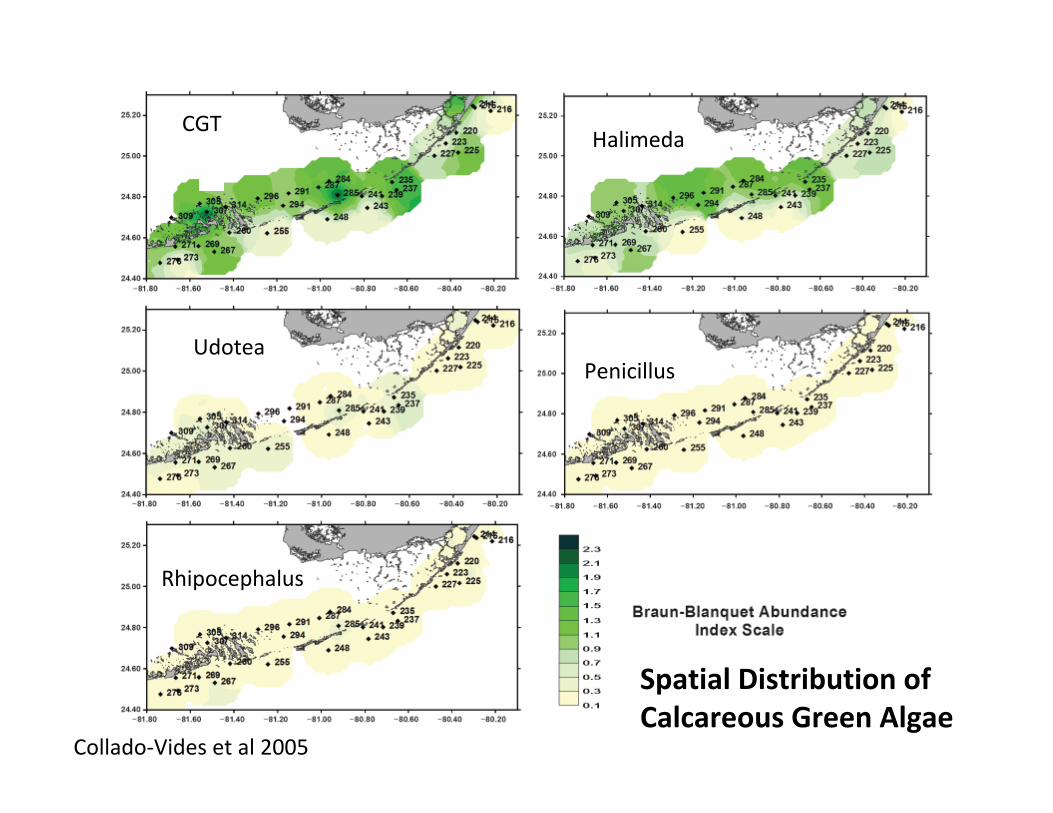
Collado-Vides et al 2005
CGTHalimeda
UdoteaPenicillus
Rhipocephalus
Spatial Distribution of Calcareous Green Algae

30 sites in the FKNMS studied during 2005-2006 and a long term study in Sprigger Bank
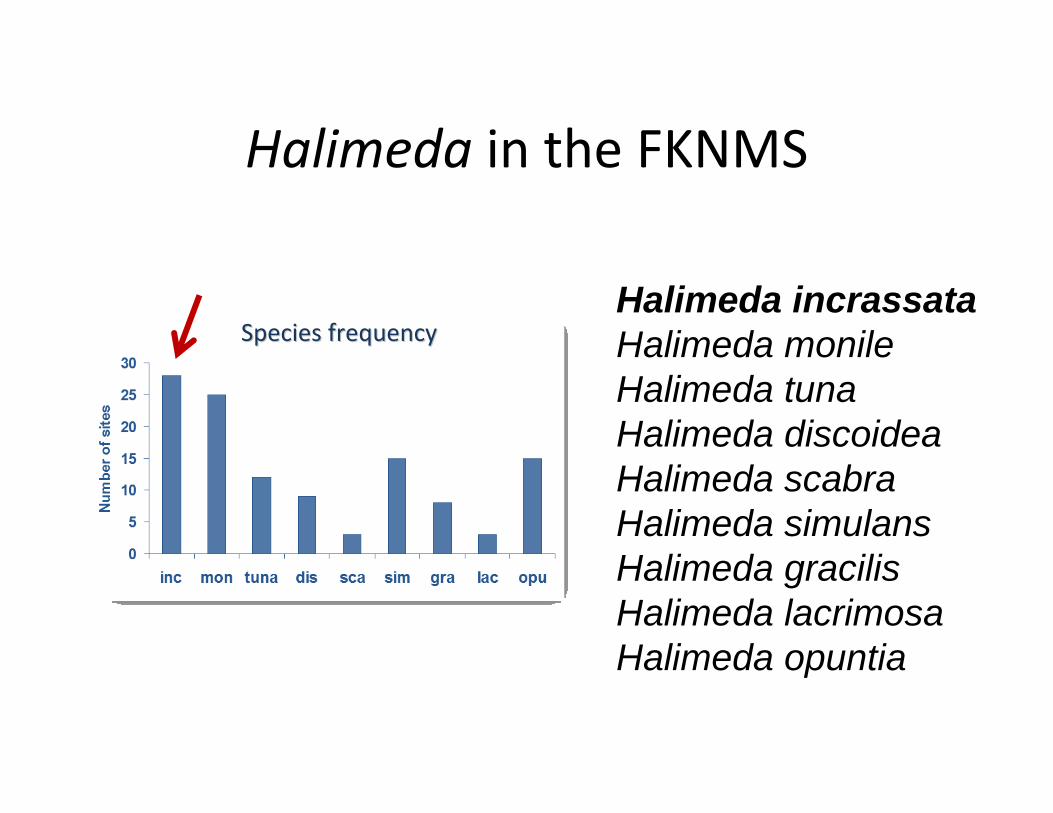
Halimeda in the FKNMS
Halimeda incrassataHalimeda monileHalimeda tunaHalimeda discoideaHalimeda scabraHalimeda simulansHalimeda gracilisHalimeda lacrimosaHalimeda opuntia
Species frequencySpecies frequency

Halimeda Halimeda is widely distributed in is widely distributed in the FKNMS seagrass bedsthe FKNMS seagrass beds
Spatial distribution
Number of species per siteNumber of species per site Thallus frequencyThallus frequency
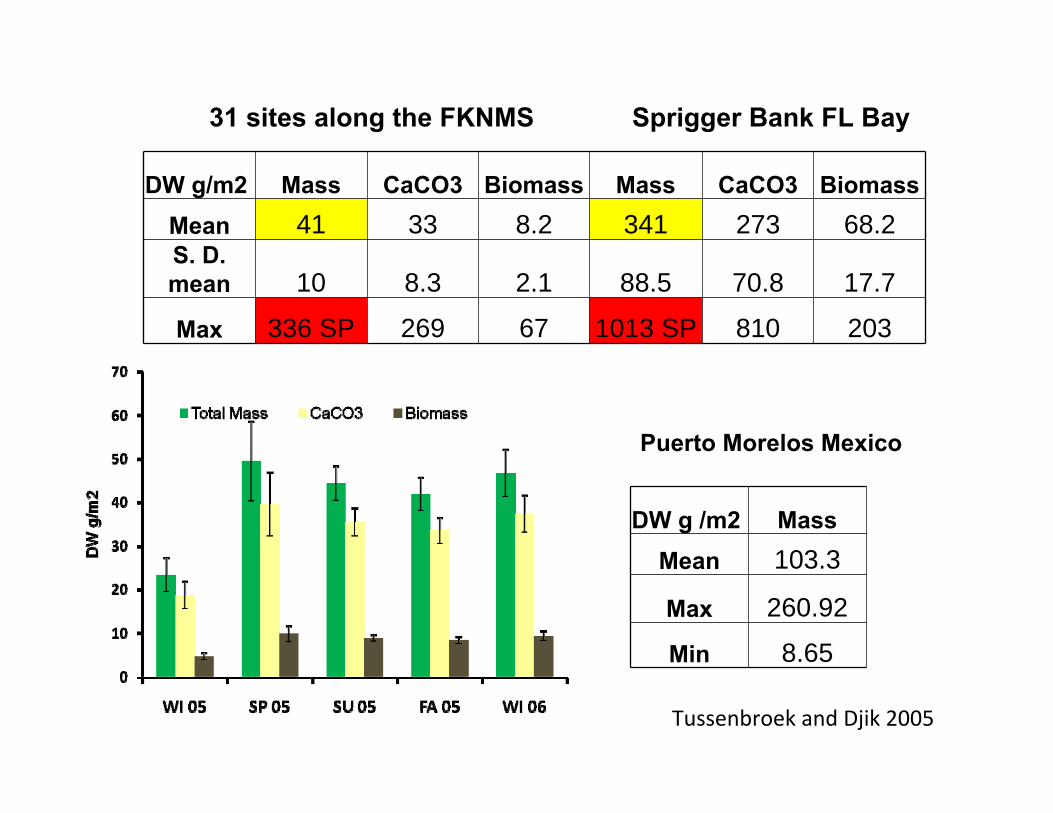
31 sites along the FKNMS
DW g/m2 Mass CaCO3 Biomass Mass CaCO3 BiomassMean 41 33 8.2 341 273 68.2S. D. mean 10 8.3 2.1 88.5 70.8 17.7
Max 336 SP 269 67 1013 SP 810 203
Sprigger Bank FL Bay
Puerto Morelos Mexico
DW g /m2 MassMean 103.3
Max 260.92
Min 8.65
Tussenbroek and Djik 2005
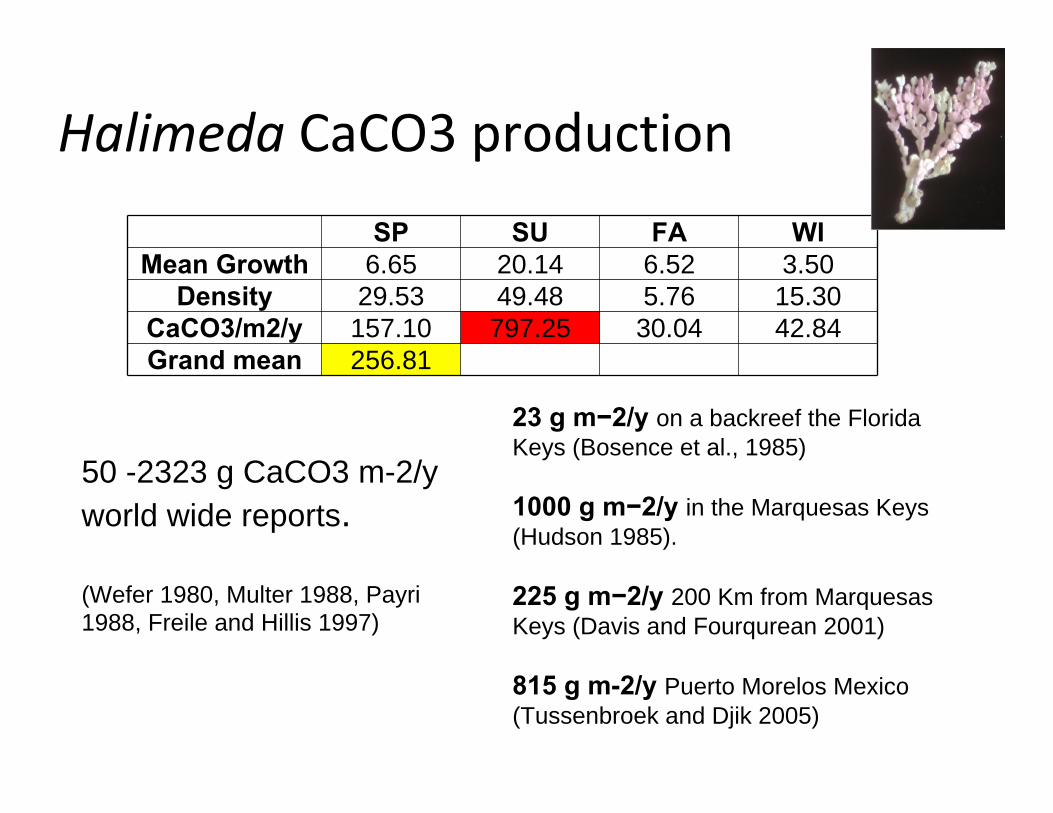
Halimeda CaCO3 production
23 g m−2/y on a backreef the Florida Keys (Bosence et al., 1985)
1000 g m−2/y in the Marquesas Keys (Hudson 1985).
225 g m−2/y 200 Km from Marquesas Keys (Davis and Fourqurean 2001)
815 g m-2/y Puerto Morelos Mexico(Tussenbroek and Djik 2005)
50 -2323 g CaCO3 m-2/y world wide reports.
(Wefer 1980, Multer 1988, Payri 1988, Freile and Hillis 1997)
SP SU FA WIMean Growth 6.65 20.14 6.52 3.50
Density 29.53 49.48 5.76 15.30CaCO3/m2/y 157.10 797.25 30.04 42.84Grand mean 256.81
0.50 1.50 2.50 3.50
Distance from shore in Km
8
10
12
14
16
Thal
lus
leng
th in
cm
0-5 5-9 9-12
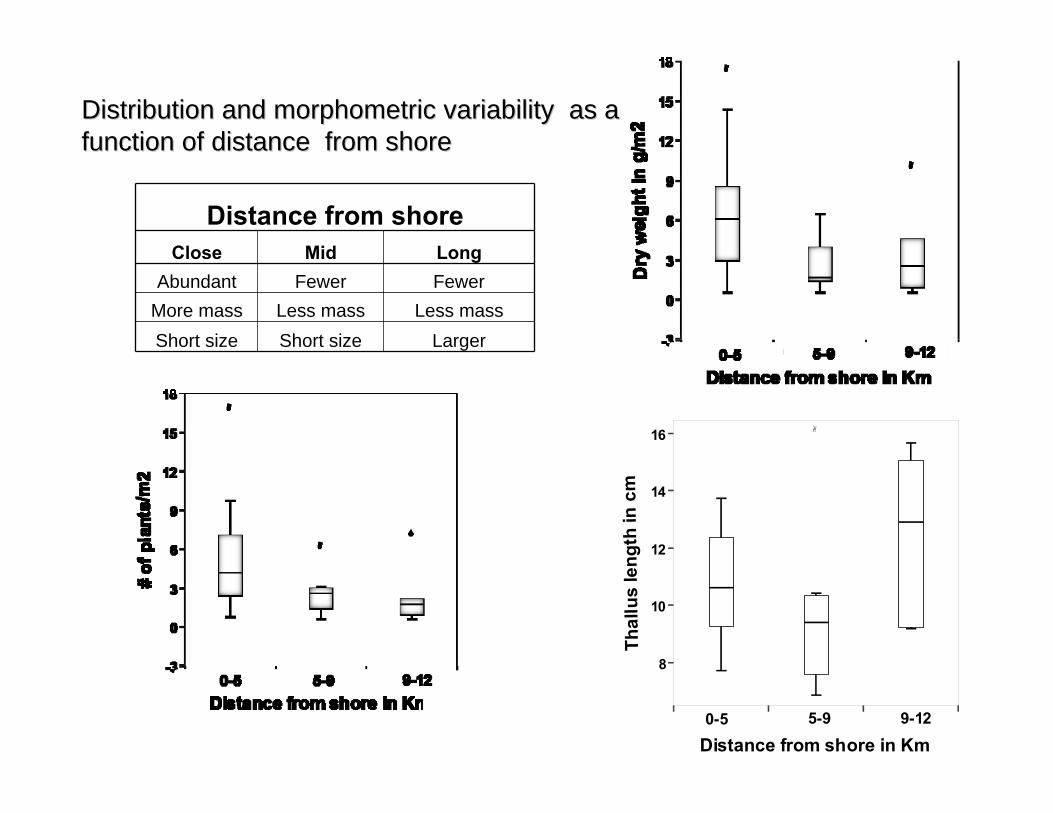
Distribution and morphometric variability as a Distribution and morphometric variability as a function of distance from shorefunction of distance from shore
Distance from shoreClose Mid Long
Abundant Fewer FewerMore mass Less mass Less massShort size Short size Larger
-81.80 -81.60 -81.40 -81.20 -81.00 -80.80 -80.60 -80.40 -80.20 -80.0024.40
24.60
24.80
25.00
25.20
25.40
214215216
220223
225227
235237239241243
248255260
267269271273276
284285287291
294296305307309
314
8 µM
10 µM
12 µM
14 µM
16 µM
18 µM
Florida
TN
-81.80 -81.60 -81.40 -81.20 -81.00 -80.80 -80.60 -80.40 -80.20 -80.0024.40
24.60
24.80
25.00
25.20
25.40
214215216
220223
225227
235237239241
243248
255260267269271
273276
284285287291
294296305307309
314
0.14 µM
0.16 µM
0.18 µM
0.2 µM
0.22 µM
0.24 µM
0.26 µM
0.28 µM
0.3 µM
Florida
TP
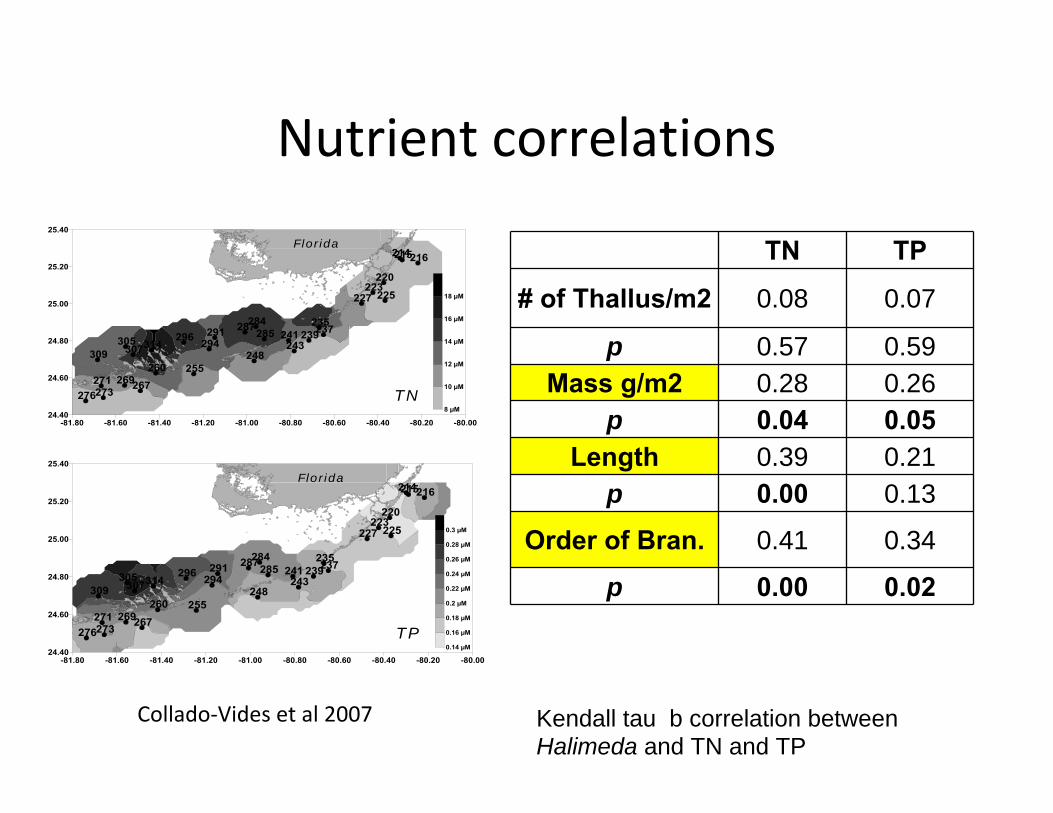
Collado-Vides et al 2007
TN TP
# of Thallus/m2 0.08 0.07
p 0.57 0.59Mass g/m2 0.28 0.26
p 0.04 0.05Length 0.39 0.21
p 0.00 0.13
Order of Bran. 0.41 0.34
p 0.00 0.02
Kendall tau b correlation between Halimeda and TN and TP
Nutrient correlations
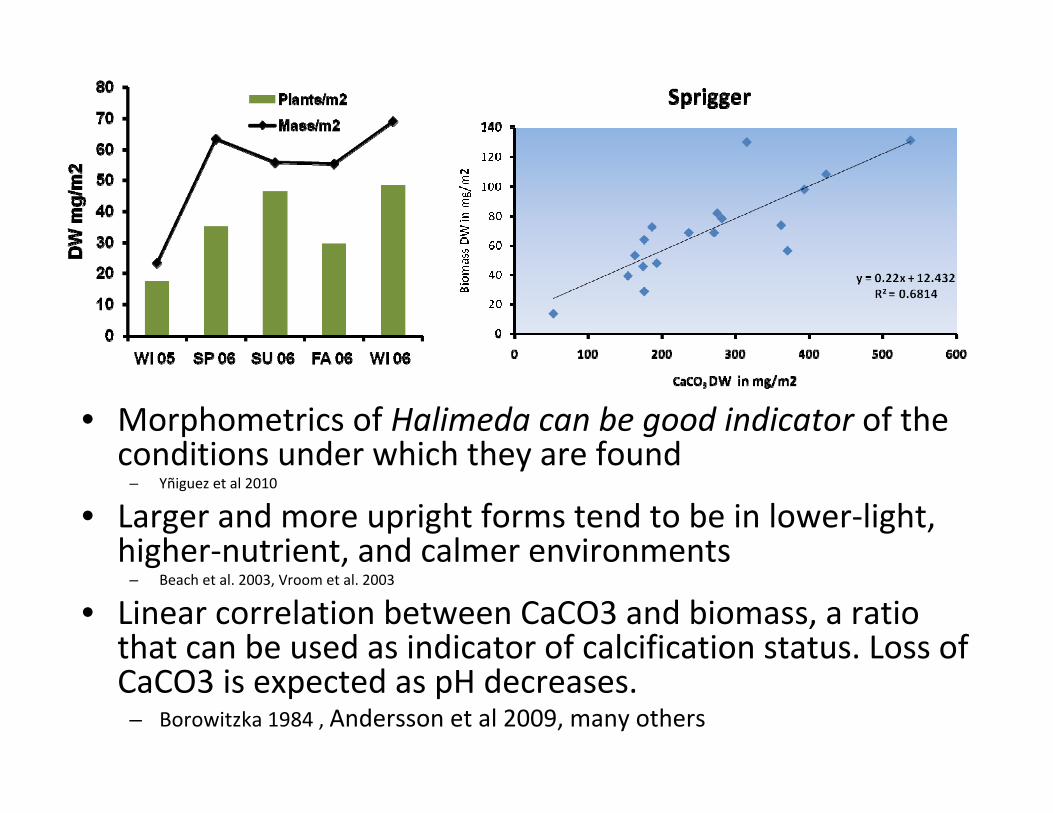
• Morphometrics of Halimeda can be good indicator of the conditions under which they are found
– Yñiguez et al 2010
• Larger and more upright forms tend to be in lower-light, higher-nutrient, and calmer environments
– Beach et al. 2003, Vroom et al. 2003
• Linear correlation between CaCO3 and biomass, a ratio that can be used as indicator of calcification status. Loss of CaCO3 is expected as pH decreases. – Borowitzka 1984 , Andersson et al 2009, many others
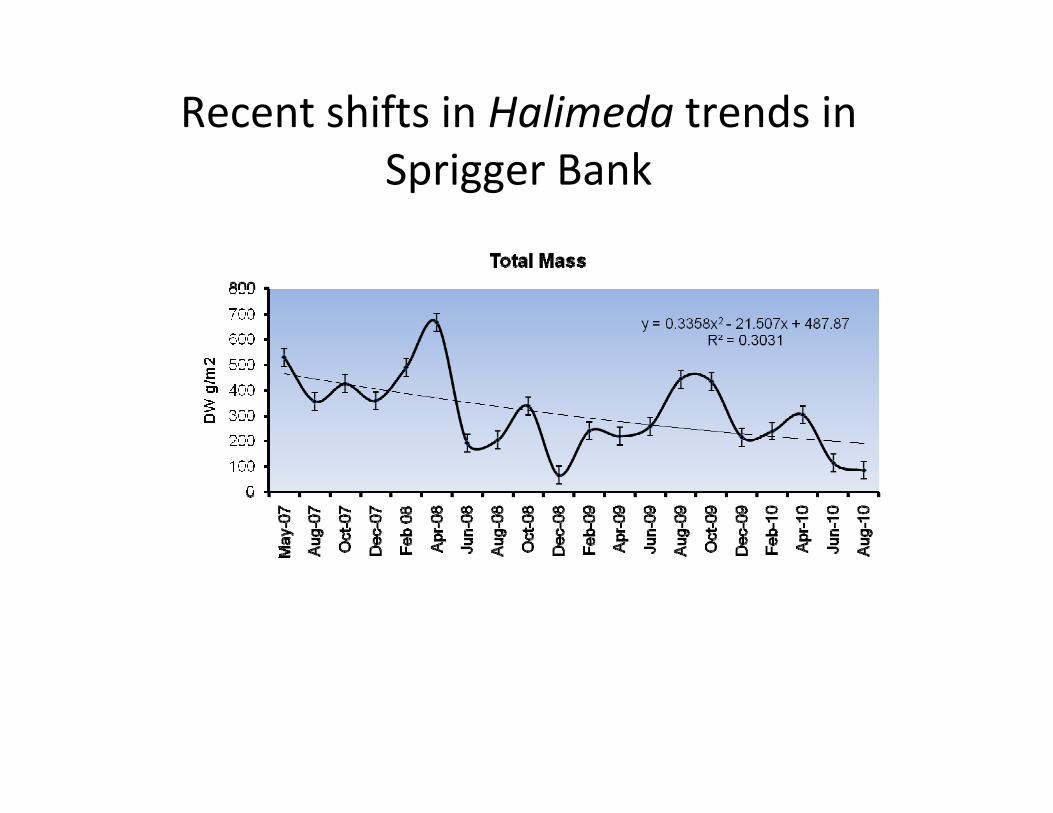
Recent shifts in Halimeda trends in Sprigger Bank
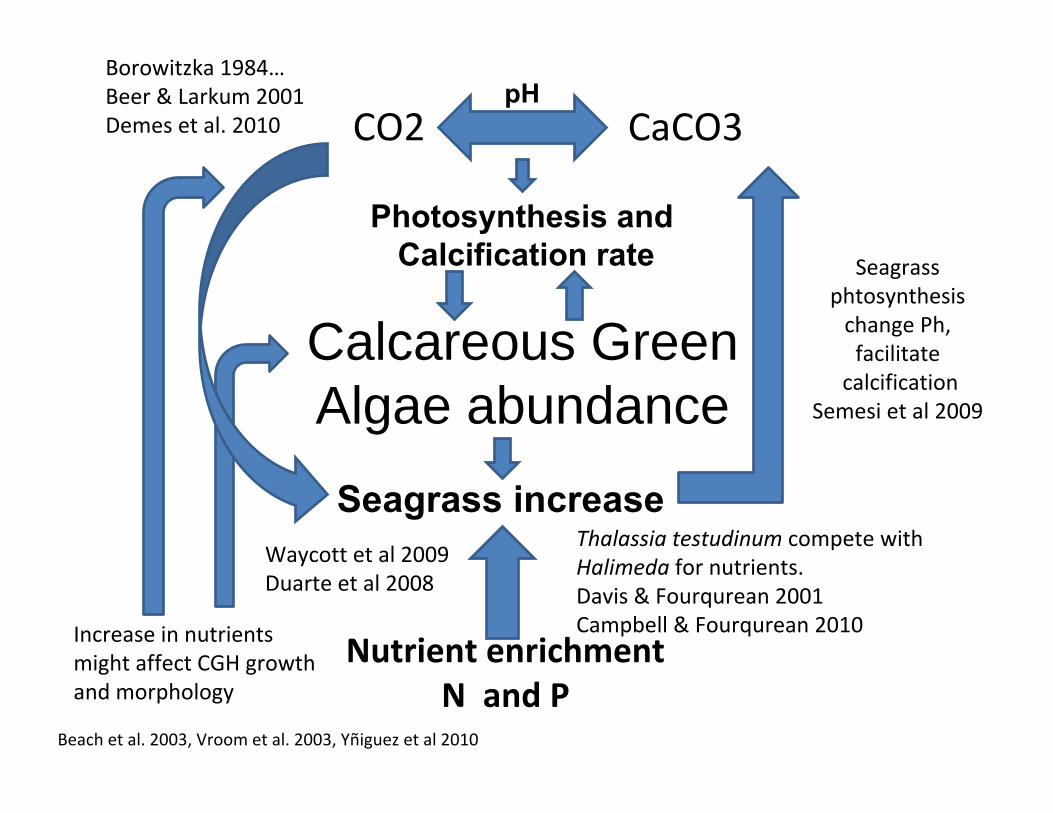
Calcareous Green Algae abundance
Nutrient enrichmentN and P
Seagrass increase
Photosynthesis and Calcification rate
CO2 CaCO3
Seagrass phtosynthesis
change Ph, facilitate
calcificationSemesi et al 2009
Thalassia testudinum compete with Halimeda for nutrients. Davis & Fourqurean 2001Campbell & Fourqurean 2010
pH
Increase in nutrients might affect CGH growth and morphology
Borowitzka 1984…Beer & Larkum 2001Demes et al. 2010
Beach et al. 2003, Vroom et al. 2003, Yñiguez et al 2010
Waycott et al 2009Duarte et al 2008
Conclusions• Our data set is a base-line that will allow us
detect potential changes in CaCO3 expected to happen under change of CO2 and pH scenarios.
• Changes in Halimeda will be the result of a set of complex processes in which nutrients and competition will play an important role in the final output, as well as CO2 and pH changes.
• We suggest that Halimeda should be included in long term monitoring programs as indicators of productivity and acidification at large scales in the FKNMS.
Acknowledgments• Water Quality Protection Program of the FKNMS, funded
by the U.S. EPA • NOAA • FCE- LTER
• Field work in the FKNMS was supported by many students and technicians, including Sergio Ruíz, Bryan Dewsbury and Fernando Maldonado.
• Field work in Sprigger Bank was supported by many students including Alex Perez, Glauco Puig-Santana, Jorge Bello, and Amanda Torres.
• Many thanks to Capt. David Ward