Embed Size (px)
Citation preview
Harris, Bernard and Floud, Roderick and Hong, Sok Chul (2015) How
many calories? Food availability in England and Wales in the 18th and
19th centuries. Research in Economic History, 31. pp. 111-191. ISSN
0363-3268 , http://dx.doi.org/10.1108/S0363-326820150000031003
This version is available at https://strathprints.strath.ac.uk/50435/
Strathprints is designed to allow users to access the research output of the University of
Strathclyde. Unless otherwise explicitly stated on the manuscript, Copyright © and Moral Rights
for the papers on this site are retained by the individual authors and/or other copyright owners.
Please check the manuscript for details of any other licences that may have been applied. You
may not engage in further distribution of the material for any profitmaking activities or any
commercial gain. You may freely distribute both the url (https://strathprints.strath.ac.uk/) and the
content of this paper for research or private study, educational, or not-for-profit purposes without
prior permission or charge.
Any correspondence concerning this service should be sent to the Strathprints administrator:
The Strathprints institutional repository (https://strathprints.strath.ac.uk) is a digital archive of University of Strathclyde research
outputs. It has been developed to disseminate open access research outputs, expose data about those outputs, and enable the
management and persistent access to Strathclyde's intellectual output.
1 This article is © Emerald Group Publishing and permission has been granted for this version to appear here (http://strathprints.strath.ac.uk/50435/). Emerald does not grant permission for this article to be further copied/distributed or hosted elsewhere without the express permission from Emerald Group Publishing Limited.
Forthcoming in Research in Economic History, 31 (2015)
HOW MANY CALORIES? FOOD AVAILABILITY IN ENGLAND AND WALES IN THE
18TH AND 19TH CENTURIES
Bernard Harris,† Roderick Floud‡ and Sok Chul Hong.
ABSTRACT
In The Changing Body (Cambridge University Press and NBER, 2011), we presented a series of estimates showing the number of calories available for human consumption in England and Wales at various points in time between 1700 and 1909/13. We now seek to correct an error in our original figures and to compare the corrected figures with those published by a range of other authors. We also include new estimates showing the calorific value of meat and grains imported from Ireland. Disagreements with other authors reflect differences over a number of issues, including the amount of land under cultivation, the extraction and wastage rates for cereals and pulses and the number of animals supplying meat and dairy products. We consider recent attempts to achieve a compromise between these estimates and challenge claims that there was a dramatic reduction in either food availability or the average height of birth cohorts in the late-eighteenth century.
JEL No. N01, N33, N53, O1, O13, O52.
An earlier version of this paper was published as an NBER Working Paper (Working Paper 20177).
Earlier versions were also presented at conferences on ‘Global inequality and poverty since 1800: evidence, analysis and data sources’, held at the University of Sussex on 27-28 September 2013; and ‘The Health Transition: A Conference in Memory of Robert Fogel’, held at the University of Chicago on 4 October 2013. We would also like to thank Stanley Engerman, David Meredith, Cormac Ó Gráda and Deborah Oxley for their helpful comments on previous versions, and Steve Broadberry for permission to cite unpublished work from his forthcoming co-authored book (Broadberry et al. forthcoming).
† School of Social Work and Social Policy, Lord Hope Building, University of Strathclyde, 141 St James Road, Glasgow G4 0LT. Email: [email protected]
‡ NBER and 15 Flint Street, Haddenham, Bucks HP17 8AL. Email: [email protected].
Department of Economics, Sogang University, 35 Baekbeom-ro, Mapo-gu, Seoul, Korea 121-742. Email: [email protected].
2 This article is © Emerald Group Publishing and permission has been granted for this version to appear here (http://strathprints.strath.ac.uk/50435/). Emerald does not grant permission for this article to be further copied/distributed or hosted elsewhere without the express permission from Emerald Group Publishing Limited.
Forthcoming in Research in Economic History, 31 (2015)
Recent years have witnessed the publication of several efforts to estimate the
number of calories available for human consumption in Britain from the thirteenth
century onwards. Although these papers have often drawn on similar sources, they
have sometimes reached divergent conclusions about both levels and trends. These
disagreements have profound implications for our understanding of a range of
issues, including the measurement of basic living standards, the relationship
between diet and health, and the impact of food availability on economic growth,
both in the British Isles and more widely.
We now seek to contribute to these debates in a number of different ways. We
begin by correcting an arithmetical error in Floud et al.’s original findings and
offering a more detailed summary of several of the major publications in the field.
The second section compares Floud et al.’s corrected estimates with the results of
recent work by Stephen Broadberry and his coauthors. The third section introduces
a significant amount of new data on the number of calories obtained from food
imported into Britain from Ireland. The final section highlights some of the
problems associated with recent authors’ attempts to construct a composite series
and relates this discussion to the analysis of trends in real wages, height and
mortality in Britain.
We pay particular attention to two sets of issues. In the first place, we revisit
the controversial question of how to make appropriate allowances for the
conversion of cereal crops into edible human food, and recalculate Floud et al.’s
corrected estimates using the extraction rates which were first discussed by
Overton and Campbell in 1996. We also introduce a substantial amount of new
information about the calorific value of Irish imports. We suggest that these items
may have contributed almost 90 additional calories per person per day in 1800 and
more than 150 additional calories in 1850.
3 This article is © Emerald Group Publishing and permission has been granted for this version to appear here (http://strathprints.strath.ac.uk/50435/). Emerald does not grant permission for this article to be further copied/distributed or hosted elsewhere without the express permission from Emerald Group Publishing Limited.
Forthcoming in Research in Economic History, 31 (2015)
In their original study, Floud, Fogel, Harris and Hong (2011, pp. 155-7, 205-9)
presented two different sets of estimates, based on the use of different sources to
estimate levels of agricultural productivity. The first set of figures (Estimate A)
suggested that the total number of calories fell between 1700 and 1750 but rose
during each of the next two half-centuries. Estimate B suggested that there was a
very small increase in food availability during the first half of the eighteenth century,
followed by further increases between 1750 and 1800 and between 1800 and 1850.
However, the contrast between the revised estimates is somewhat greater. The
revised version of Estimate A suggests that calorie availability increased between
1700 and 1750 and between 1750 and 1800, with little change between 1800 and
1850. The revised version of Estimate B suggests that there was a much larger
increase in food availability during the first half of the eighteenth century, followed
by a small decline and then an increase.
A key issue in these debates concerns the representativeness of the sources
on which the two sets of estimates are based. The figures showing the total
number of calories derived from domestically-produced cereals and pulses in
Estimate A were derived from Holderness’ (1989) assessment of a range of returns
compiled by contemporary investigators in the eighteenth and nineteenth centuries.
The equivalent figures in Estimate B were based on Turner, Beckett and Afton’s
(2001) reconstruction of contemporary estate inventories. These authors provided
a much more detailed account of the methods used to derive their figures but the
number of records was relatively small and they were drawn from counties which
may not have been entirely representative of the country as a whole (Thirsk, 2002).
These revised estimates have significant implications for our understanding of
the precise relationship between the chronology of changes in food availability and
changes in health and mortality. In their original study, Floud et al. (2011, pp. 162-
4 This article is © Emerald Group Publishing and permission has been granted for this version to appear here (http://strathprints.strath.ac.uk/50435/). Emerald does not grant permission for this article to be further copied/distributed or hosted elsewhere without the express permission from Emerald Group Publishing Limited.
Forthcoming in Research in Economic History, 31 (2015)
3) argued that changes in food availability were ‘broadly consistent’ with changes in
height and life expectancy during the late-eighteenth and early-nineteenth centuries
and this supported the view that improvements in food availability were one cause
of improvements in height and mortality during this period. Although this
statement is still true of the revised version of Estimate A, it is less true of the
revised version of Estimate B. The difference between the two estimates therefore
helps to reinforce Joyce Burnette’s (2014, p. 115) recent call for new research into
the changing level of agricultural productivity before 1870.
The revised figures also have significant implications for Floud et al.’s
arguments about the extent to which the total amount of food available was
sufficient to meet nutritional needs. After taking account of the nutritional needs of
an adult male engaged in ‘heavy work’, they argued that the amount of food
available was insufficient to meet the needs of the whole population before circa
1850. The revised versions of both Estimates suggest that the amount of food may
have started to exceed this threshold at a somewhat earlier date even though a
substantial proportion of the population was likely to have remained at risk of
nutritional inadequacy for much of the nineteenth century (see also Gazeley and
Newell, 2014).
Although the new estimates are significantly higher than Floud et al.’s original
figures, they are still much lower than the estimates produced by Allen (2005) and
Muldrew (2011). We offer a detailed discussion of the methods which Allen used to
estimate the number of calories derived from potatoes but pay particular attention
to Muldrew’s figures. We argue that these figures rest on very generous
assumptions about the amount of land devoted to cereal cultivation, the proportion
of the total cereal crop which became available for human consumption, and the
number of animals producing milk, butter and cheese.
5 This article is © Emerald Group Publishing and permission has been granted for this version to appear here (http://strathprints.strath.ac.uk/50435/). Emerald does not grant permission for this article to be further copied/distributed or hosted elsewhere without the express permission from Emerald Group Publishing Limited.
Forthcoming in Research in Economic History, 31 (2015)
We also compare our revised estimates with the composite series presented by
Kelly and Ó Gráda (2013a; 2013b) and, more especially, Meredith and Oxley (2014).
Meredith and Oxley applied the figures which Floud et al. used to calculate the
proportion of domestically-produced cereals entering gross product to Muldrew’s
data on land use and productivity, and then added them to Floud et al.’s own data
on food imports to produce a revised set of eighteenth-century calorie estimates.
They then extended the resulting series by combining it with Floud et al.’s original
estimates for 1850 and 1909/13. They also compared their new series with
Gregory Clark’s (2007) price data and with a number of different sets of
anthropometric data. The majority of these series were derived from convict data
but they also presented a new set of military height estimates, based on their own
recalculation of Floud, Wachter and Gregory’s (1990) estimates.
Although Meredith and Oxley’s paper represents an important contribution to
the study of historical patterns of food availability, we argue that this exercise was
flawed because it failed to take account of the excessive nature of the figures which
Muldrew used to estimate land use and the number of dairy animals. Although the
available data remain problematic, we argue that there is little evidence to support
the view that there was a substantial decline in food availability before the end of
the eighteenth century and, as we have seen, the revised version of Floud et al.’s
Estimate A suggests that there was actually a significant increase. We also question
the principles which Meredith and Oxley followed when they attempted to
recalculate Floud, Wachter and Gregory’s height series. Although this topic remains
controversial, the available evidence continues to suggest that there were
significant improvements in both height and life expectancy before circa 1820.
6 This article is © Emerald Group Publishing and permission has been granted for this version to appear here (http://strathprints.strath.ac.uk/50435/). Emerald does not grant permission for this article to be further copied/distributed or hosted elsewhere without the express permission from Emerald Group Publishing Limited.
Forthcoming in Research in Economic History, 31 (2015)
1. Estimating food availability
During the 1980s and 1990s, a number of authors attempted to reconstruct the
dietary history of the British population using evidence from the household budgets
collected by contemporary investigators such as David Davies (1795), Frederick
Morton Eden (1797), William Neild (1842), Edward Smith (Parliamentary Papers,
1863; 1864) and others (see Oddy, 1990, p. 269). However, these reconstructions
were marred by disagreements over the selection of relevant budgets and the
representativeness of the populations from which they were drawn (Harris 2004, pp.
386-7; Floud et al. 2011, pp. 152-4). This helped to fuel a growing interest in the
use of agricultural accounts to estimate the total amount of food which was
produced in Britain at different points in time.
One of the earliest attempts to estimate food availability from these sources
was made by Mark Overton and Bruce Campbell in a paper which was originally
published (in French) in Histoire et Mésure in 1996 (Overton and Campbell, 1996).
An English-language version was presented to a session at the World Economic
History Congress in Helsinki ten years later (Overton and Campbell, 2006). The
authors estimated the total number of calories provided by a number of different
cereal crops and by potatoes for a series of years between 1300 and 1871. Based
on these figures, they estimated that the total number of calories provided by these
crops fell from a possible peak of around 1669 calories per head per day in 1380 to
1060 calories per head per day 491 years later. However, when these figures were
added to the number of calories supplied by imported foods, the total number of
calories from potatoes and grains in 1871 rose from 1060 to 1796 (Overton and
Campbell, 1996, p. 296; 2006, p. 45).
Overton and Campbell’s original paper has not always received the attention it
deserved. It was overlooked by Fogel (2004) and by Floud et al. (2011), and was
7 This article is © Emerald Group Publishing and permission has been granted for this version to appear here (http://strathprints.strath.ac.uk/50435/). Emerald does not grant permission for this article to be further copied/distributed or hosted elsewhere without the express permission from Emerald Group Publishing Limited.
Forthcoming in Research in Economic History, 31 (2015)
also omitted from the Bibliography of Robert Allen’s unpublished but widely-cited
discussion paper (Allen 2005). However, it has formed the basis of the food
calculations which Overton and Campbell have undertaken with Stephen Broadberry,
Alexander Klein and Bas van Leeuwen for their forthcoming study of British
economic growth from 1270 to 1870 (Broadberry, Campbell, Klein, Overton and Van
Leeuwen, forthcoming). This study incorporates a number of changes to Overton
and Campbell’s original estimates and combines them with estimates of the number
of calories derived from non-arable sources. The most recent version (5 August
2013) suggests that aggregate consumption rose after the Black Death and reached
a peak of 2467 calories per person per day during the 1380s. This level was not
regained until the 1860s.
A further attempt to estimate food production and consumption levels was
undertaken by Robert Allen in 2005. Allen estimated the number of calories
generated by domestically-provided and imported foodstuffs in 1300, 1500, 1700,
1750, 1800 and 1850. His calculations suggested that per capita food
consumption almost doubled between 1300 and 1500. It fell slightly between 1500
and 1700 and rose dramatically between 1700 and 1750. It then declined even
more dramatically over the course of the next century (Allen, 2005, p. 39).
Allen’s estimates for the period after 1700 contrast sharply with those
published by Robert Fogel. After comparing the number of calories available in
England with the figure for France, he argued that ‘England’s supply of food per
capita exceeded that of France by several hundred calories but was still exceedingly
low by current standards’. He concluded that ‘the prevalence of meagre diets in
much of Europe, and the cycling of stature even in a country as bountiful in food as
the United States, shows how persistent misery was down almost to the end of the
8 This article is © Emerald Group Publishing and permission has been granted for this version to appear here (http://strathprints.strath.ac.uk/50435/). Emerald does not grant permission for this article to be further copied/distributed or hosted elsewhere without the express permission from Emerald Group Publishing Limited.
Forthcoming in Research in Economic History, 31 (2015)
nineteenth century and how diverse were the factors that prolonged misery’ (Fogel,
2004, pp. 8-19).
Although Fogel’s initial estimates have been cited on a number of occasions
(see e.g. Kelly and Ó Gráda, 2013a, p. 1137; Meredith and Oxley, 2014, p. 165), it
is important to remember that they were also provisional. He did not provide any
information about the sources on which they were based and referred readers to a
forthcoming publication for further details (Fogel, 2004, p. 9). When this study
appeared, it included a number of significant revisions. However, the new figures
continued to suggest that ‘a significant proportion of the British population may not
have had access to the number of calories which they needed to undertake
physically-demanding work on a regular basis at the start of the nineteenth century’
(Floud et al., 2011, p. 168).
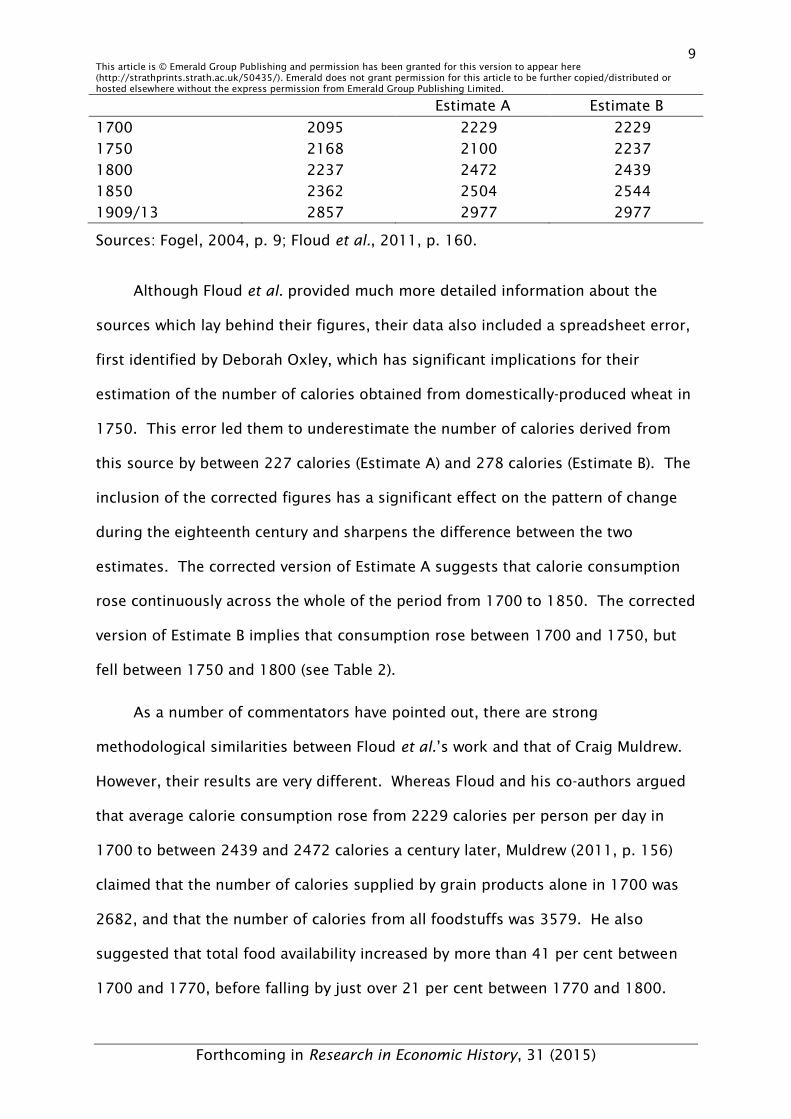
We can gain a more detailed picture of the differences between Fogel’s original
estimates and those which were subsequently published from Table 1. Fogel’s
original estimates suggested that average calorie consumption rose by between 60
and 70 calories per day between 1700 and 1750, and again between 1750 and
1800. The pace of change accelerated after 1800 and increased rapidly after 1850.
By contrast, Floud et al. presented two different sets of estimates, based on
different assumptions about the productivity of cereal crops between 1750 and
1850. The first set of figures suggested that average consumption fell during the
first half of the eighteenth century whereas the second set of figures showed a very
minor increase. However, both sets of figures suggested that average calorie
consumption rose from 1750 onwards.
Table 1. Average per capita food consumption, 1700-1850: Fogel versus Floud et al.
Fogel (2004) Floud et al. (2011)
9 This article is © Emerald Group Publishing and permission has been granted for this version to appear here (http://strathprints.strath.ac.uk/50435/). Emerald does not grant permission for this article to be further copied/distributed or hosted elsewhere without the express permission from Emerald Group Publishing Limited.
Forthcoming in Research in Economic History, 31 (2015)
Estimate A Estimate B
1700 2095 2229 2229
1750 2168 2100 2237
1800 2237 2472 2439
1850 2362 2504 2544
1909/13 2857 2977 2977
Sources: Fogel, 2004, p. 9; Floud et al., 2011, p. 160.
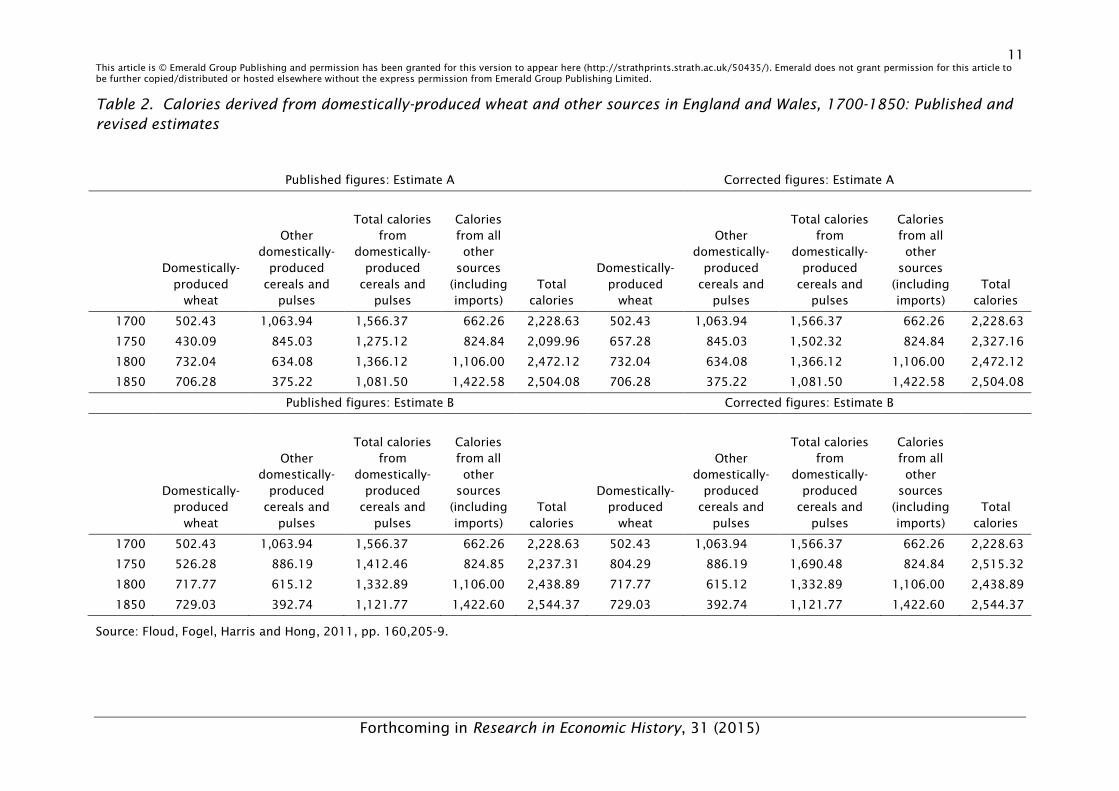
Although Floud et al. provided much more detailed information about the
sources which lay behind their figures, their data also included a spreadsheet error,
first identified by Deborah Oxley, which has significant implications for their
estimation of the number of calories obtained from domestically-produced wheat in
1750. This error led them to underestimate the number of calories derived from
this source by between 227 calories (Estimate A) and 278 calories (Estimate B). The
inclusion of the corrected figures has a significant effect on the pattern of change
during the eighteenth century and sharpens the difference between the two
estimates. The corrected version of Estimate A suggests that calorie consumption
rose continuously across the whole of the period from 1700 to 1850. The corrected
version of Estimate B implies that consumption rose between 1700 and 1750, but
fell between 1750 and 1800 (see Table 2).
As a number of commentators have pointed out, there are strong
methodological similarities between Floud et al.’s work and that of Craig Muldrew.
However, their results are very different. Whereas Floud and his co-authors argued
that average calorie consumption rose from 2229 calories per person per day in
1700 to between 2439 and 2472 calories a century later, Muldrew (2011, p. 156)
claimed that the number of calories supplied by grain products alone in 1700 was
2682, and that the number of calories from all foodstuffs was 3579. He also
suggested that total food availability increased by more than 41 per cent between
1700 and 1770, before falling by just over 21 per cent between 1770 and 1800.
10 This article is © Emerald Group Publishing and permission has been granted for this version to appear here (http://strathprints.strath.ac.uk/50435/). Emerald does not grant permission for this article to be further copied/distributed or hosted elsewhere without the express permission from Emerald Group Publishing Limited.
Forthcoming in Research in Economic History, 31 (2015)
Unfortunately, his figures did not extend beyond that date. However, they implied
that average daily calorie consumption per head in 1800 was exactly one thousand
calories greater than the figure which Floud et al. derived from the data published
by the Royal Society for the period 1909-13 (Floud et al., 2011, p. 160).
A number of authors have attempted to steer a middle way between these
conflicting estimates. Although Morgan Kelly and Cormac Ó Gráda drew on some of
the work published by Fogel and Floud et al., they focused most of their attention
on the estimates of Broadberry et al. and Muldrew. After looking at the individual
components of each set of estimates, they concluded that, whilst Muldrew’s figures
were clearly ‘over-generous’, those published by Broadberry and his coauthors were
in need of ‘upward revision’ (Kelly and Ó Gráda, 2013a, pp. 1150, 1153; 2013b, p.
2). However, even with these revisions, their own suggestions still included quite a
wide margin of error for particular years (see Appendix 1).
A rather different approach has been taken by David Meredith and Deborah
Oxley (2014). They compared Muldrew’s estimates with those published by Floud
et al., and then experimented with different scenarios in which they applied the
conversion ratios employed by the different authors to each other’s data. They also
compared the results with a reassessment of anthropometric trends and data from
household budgets. They concluded that the most plausible scenario was one in
which Floud et al.’s conversion ratios (for seeding, animal feed, processing and
wastage) were applied to Muldrew’s data for the eighteenth century and then
merged with Floud et al.’s own results for the nineteenth and early-twentieth
centuries. These calculations led to a substantial reduction in the size of Muldrew’s
eighteenth-century estimates, but still left room for a sharp fall in food availability
between circa 1770 and 1850.
11 This article is © Emerald Group Publishing and permission has been granted for this version to appear here (http://strathprints.strath.ac.uk/50435/). Emerald does not grant permission for this article to be further copied/distributed or hosted elsewhere without the express permission from Emerald Group Publishing Limited.
Forthcoming in Research in Economic History, 31 (2015)
Table 2. Calories derived from domestically-produced wheat and other sources in England and Wales, 1700-1850: Published and
revised estimates
Published figures: Estimate A Corrected figures: Estimate A
Domestically-produced
wheat
Other domestically-
produced cereals and
pulses
Total calories from
domestically-produced
cereals and pulses
Calories from all other
sources (including imports)
Total calories
Domestically-produced
wheat
Other domestically-
produced cereals and
pulses
Total calories from
domestically-produced
cereals and pulses
Calories from all other
sources (including imports)
Total calories
1700 502.43 1,063.94 1,566.37 662.26 2,228.63 502.43 1,063.94 1,566.37 662.26 2,228.63
1750 430.09 845.03 1,275.12 824.84 2,099.96 657.28 845.03 1,502.32 824.84 2,327.16
1800 732.04 634.08 1,366.12 1,106.00 2,472.12 732.04 634.08 1,366.12 1,106.00 2,472.12
1850 706.28 375.22 1,081.50 1,422.58 2,504.08 706.28 375.22 1,081.50 1,422.58 2,504.08
Published figures: Estimate B Corrected figures: Estimate B
Domestically-produced
wheat
Other domestically-
produced cereals and
pulses
Total calories from
domestically-produced
cereals and pulses
Calories from all other
sources (including imports)
Total calories
Domestically-produced
wheat
Other domestically-
produced cereals and
pulses
Total calories from
domestically-produced
cereals and pulses
Calories from all other
sources (including imports)
Total calories
1700 502.43 1,063.94 1,566.37 662.26 2,228.63 502.43 1,063.94 1,566.37 662.26 2,228.63
1750 526.28 886.19 1,412.46 824.85 2,237.31 804.29 886.19 1,690.48 824.84 2,515.32
1800 717.77 615.12 1,332.89 1,106.00 2,438.89 717.77 615.12 1,332.89 1,106.00 2,438.89
1850 729.03 392.74 1,121.77 1,422.60 2,544.37 729.03 392.74 1,121.77 1,422.60 2,544.37
Source: Floud, Fogel, Harris and Hong, 2011, pp. 160,205-9.
12 This article is © Emerald Group Publishing and permission has been granted for this version to appear here (http://strathprints.strath.ac.uk/50435/). Emerald does not grant permission for this article to be further copied/distributed or hosted elsewhere without the express permission from Emerald Group Publishing Limited.
Forthcoming in Research in Economic History, 31 (2015)
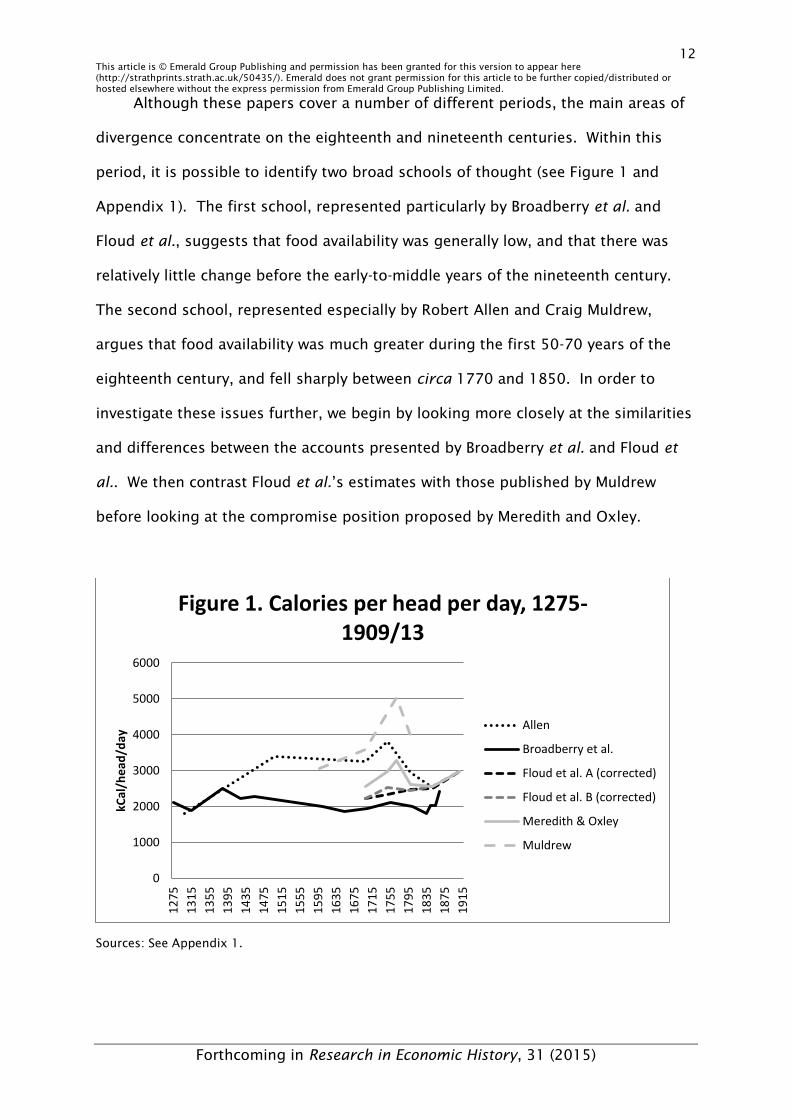
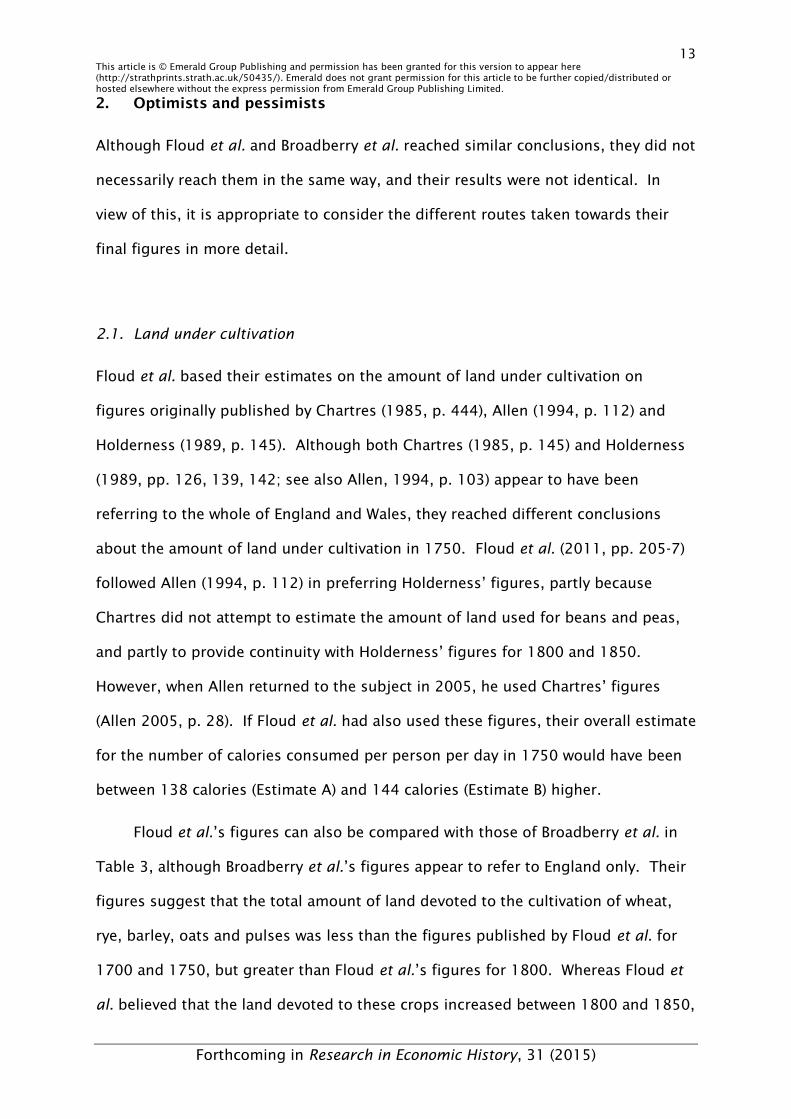
Although these papers cover a number of different periods, the main areas of
divergence concentrate on the eighteenth and nineteenth centuries. Within this
period, it is possible to identify two broad schools of thought (see Figure 1 and
Appendix 1). The first school, represented particularly by Broadberry et al. and
Floud et al., suggests that food availability was generally low, and that there was
relatively little change before the early-to-middle years of the nineteenth century.
The second school, represented especially by Robert Allen and Craig Muldrew,
argues that food availability was much greater during the first 50-70 years of the
eighteenth century, and fell sharply between circa 1770 and 1850. In order to
investigate these issues further, we begin by looking more closely at the similarities
and differences between the accounts presented by Broadberry et al. and Floud et
al.. We then contrast Floud et al.’s estimates with those published by Muldrew
before looking at the compromise position proposed by Meredith and Oxley.
Sources: See Appendix 1.
0
1000
2000
3000
4000
5000
6000
12
75
13
15
13
55
13
95
14
35
14
75
15
15
15
55
15
95
16
35
16
75
17
15
17
55
17
95
18
35
18
75
19
15
kC
al/
he
ad
/da
y
Figure 1. Calories per head per day, 1275-
1909/13
Allen
Broadberry et al.
Floud et al. A (corrected)
Floud et al. B (corrected)
Meredith & Oxley
Muldrew
13 This article is © Emerald Group Publishing and permission has been granted for this version to appear here (http://strathprints.strath.ac.uk/50435/). Emerald does not grant permission for this article to be further copied/distributed or hosted elsewhere without the express permission from Emerald Group Publishing Limited.
Forthcoming in Research in Economic History, 31 (2015)
2. Optimists and pessimists
Although Floud et al. and Broadberry et al. reached similar conclusions, they did not
necessarily reach them in the same way, and their results were not identical. In
view of this, it is appropriate to consider the different routes taken towards their
final figures in more detail.
2.1. Land under cultivation
Floud et al. based their estimates on the amount of land under cultivation on
figures originally published by Chartres (1985, p. 444), Allen (1994, p. 112) and
Holderness (1989, p. 145). Although both Chartres (1985, p. 145) and Holderness
(1989, pp. 126, 139, 142; see also Allen, 1994, p. 103) appear to have been
referring to the whole of England and Wales, they reached different conclusions
about the amount of land under cultivation in 1750. Floud et al. (2011, pp. 205-7)
followed Allen (1994, p. 112) in preferring Holderness’ figures, partly because
Chartres did not attempt to estimate the amount of land used for beans and peas,
and partly to provide continuity with Holderness’ figures for 1800 and 1850.
However, when Allen returned to the subject in 2005, he used Chartres’ figures
(Allen 2005, p. 28). If Floud et al. had also used these figures, their overall estimate
for the number of calories consumed per person per day in 1750 would have been
between 138 calories (Estimate A) and 144 calories (Estimate B) higher.
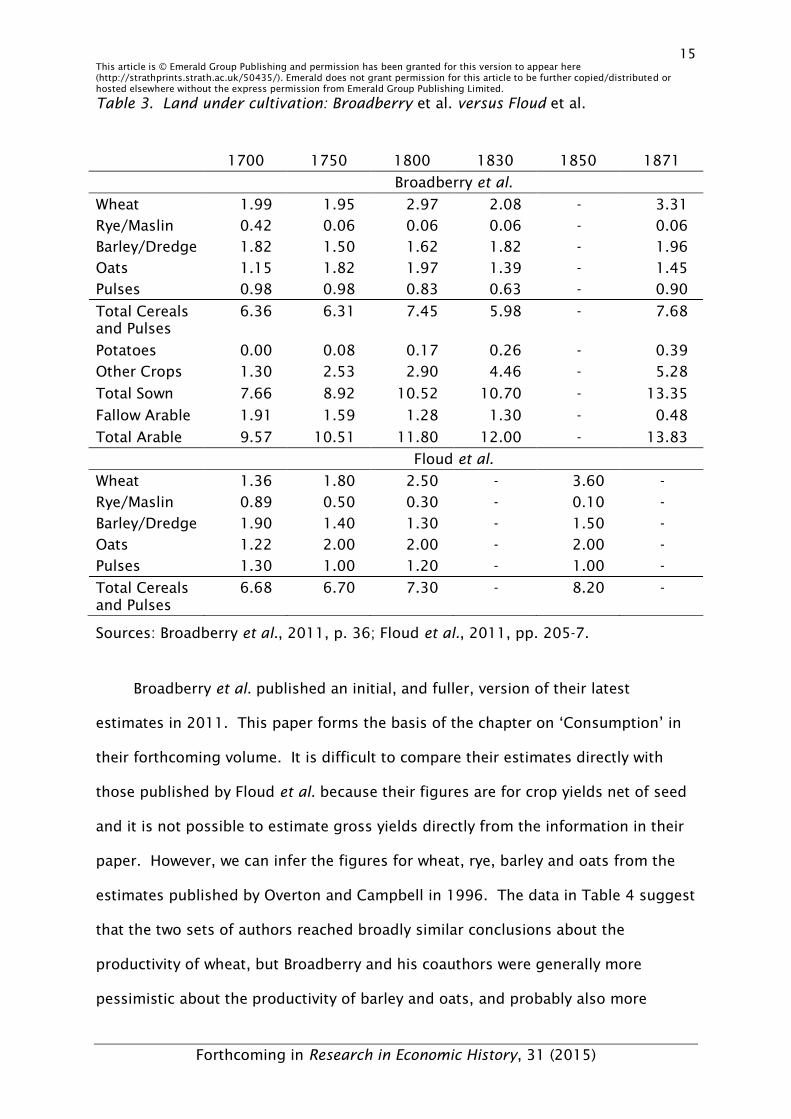
Floud et al.’s figures can also be compared with those of Broadberry et al. in
Table 3, although Broadberry et al.’s figures appear to refer to England only. Their
figures suggest that the total amount of land devoted to the cultivation of wheat,
rye, barley, oats and pulses was less than the figures published by Floud et al. for
1700 and 1750, but greater than Floud et al.’s figures for 1800. Whereas Floud et
al. believed that the land devoted to these crops increased between 1800 and 1850,
14 This article is © Emerald Group Publishing and permission has been granted for this version to appear here (http://strathprints.strath.ac.uk/50435/). Emerald does not grant permission for this article to be further copied/distributed or hosted elsewhere without the express permission from Emerald Group Publishing Limited.
Forthcoming in Research in Economic History, 31 (2015)
Broadberry et al. suggested a decline. However, they also claimed that the acreage
devoted to other crops increased, so that the total amount of land under cultivation
rose by just under 1.2 million acres.
2.2. Yields per acre
Floud et al. (2011) published two different sets of estimates for yields per acre.
Their initial estimates were based on the yields reported by Chartres (1985, p. 444)
and Allen (1994, p. 112) for 1700, and by Holderness (1989, p. 145) for 1750,
1800 and 1850. They also published a second set of estimates, based on work by
Turner et al. (2001, pp. 129, 153, 158, 163-4) for the period from 1750 onwards.
However, Turner and his co-authors did not publish estimates for the productivity of
rye in 1750, and their results may not have been entirely representative (Thirsk,
2002). The corrected version of Floud et al.’s study suggests that the first of these
two estimates may therefore provide a more appropriate guide to the general trend
over the period as a whole (Floud et al., forthcoming).
15 This article is © Emerald Group Publishing and permission has been granted for this version to appear here (http://strathprints.strath.ac.uk/50435/). Emerald does not grant permission for this article to be further copied/distributed or hosted elsewhere without the express permission from Emerald Group Publishing Limited.
Forthcoming in Research in Economic History, 31 (2015)
Table 3. Land under cultivation: Broadberry et al. versus Floud et al.
1700 1750 1800 1830 1850 1871
Broadberry et al.
Wheat 1.99 1.95 2.97 2.08 - 3.31
Rye/Maslin 0.42 0.06 0.06 0.06 - 0.06
Barley/Dredge 1.82 1.50 1.62 1.82 - 1.96
Oats 1.15 1.82 1.97 1.39 - 1.45
Pulses 0.98 0.98 0.83 0.63 - 0.90
Total Cereals and Pulses
6.36 6.31 7.45 5.98 - 7.68
Potatoes 0.00 0.08 0.17 0.26 - 0.39
Other Crops 1.30 2.53 2.90 4.46 - 5.28
Total Sown 7.66 8.92 10.52 10.70 - 13.35
Fallow Arable 1.91 1.59 1.28 1.30 - 0.48
Total Arable 9.57 10.51 11.80 12.00 - 13.83
Floud et al.
Wheat 1.36 1.80 2.50 - 3.60 -
Rye/Maslin 0.89 0.50 0.30 - 0.10 -
Barley/Dredge 1.90 1.40 1.30 - 1.50 -
Oats 1.22 2.00 2.00 - 2.00 -
Pulses 1.30 1.00 1.20 - 1.00 -
Total Cereals and Pulses
6.68 6.70 7.30 - 8.20 -
Sources: Broadberry et al., 2011, p. 36; Floud et al., 2011, pp. 205-7.
Broadberry et al. published an initial, and fuller, version of their latest
estimates in 2011. This paper forms the basis of the chapter on ‘Consumption’ in
their forthcoming volume. It is difficult to compare their estimates directly with
those published by Floud et al. because their figures are for crop yields net of seed
and it is not possible to estimate gross yields directly from the information in their
paper. However, we can infer the figures for wheat, rye, barley and oats from the
estimates published by Overton and Campbell in 1996. The data in Table 4 suggest
that the two sets of authors reached broadly similar conclusions about the
productivity of wheat, but Broadberry and his coauthors were generally more
pessimistic about the productivity of barley and oats, and probably also more
16 This article is © Emerald Group Publishing and permission has been granted for this version to appear here (http://strathprints.strath.ac.uk/50435/). Emerald does not grant permission for this article to be further copied/distributed or hosted elsewhere without the express permission from Emerald Group Publishing Limited.
Forthcoming in Research in Economic History, 31 (2015)
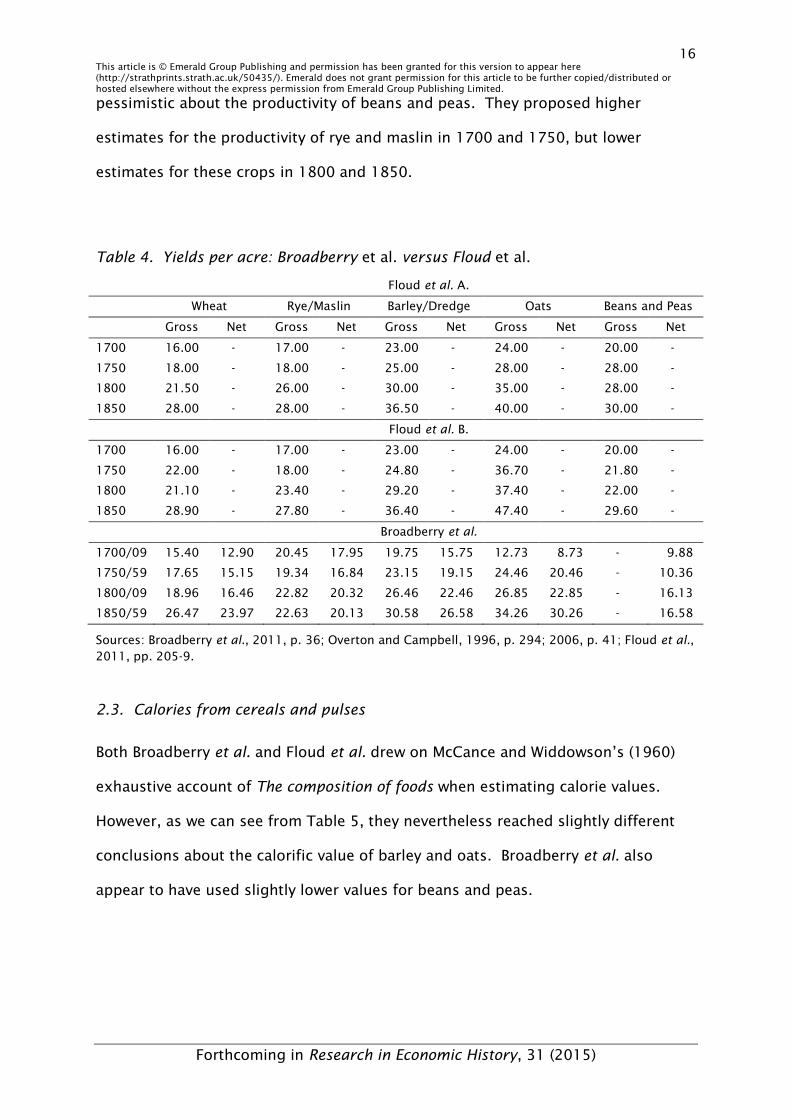
pessimistic about the productivity of beans and peas. They proposed higher
estimates for the productivity of rye and maslin in 1700 and 1750, but lower
estimates for these crops in 1800 and 1850.
Table 4. Yields per acre: Broadberry et al. versus Floud et al.
Floud et al. A.
Wheat Rye/Maslin Barley/Dredge Oats Beans and Peas
Gross Net Gross Net Gross Net Gross Net Gross Net
1700 16.00 - 17.00 - 23.00 - 24.00 - 20.00 -
1750 18.00 - 18.00 - 25.00 - 28.00 - 28.00 -
1800 21.50 - 26.00 - 30.00 - 35.00 - 28.00 -
1850 28.00 - 28.00 - 36.50 - 40.00 - 30.00 -
Floud et al. B.
1700 16.00 - 17.00 - 23.00 - 24.00 - 20.00 -
1750 22.00 - 18.00 - 24.80 - 36.70 - 21.80 -
1800 21.10 - 23.40 - 29.20 - 37.40 - 22.00 -
1850 28.90 - 27.80 - 36.40 - 47.40 - 29.60 -
Broadberry et al.
1700/09 15.40 12.90 20.45 17.95 19.75 15.75 12.73 8.73 - 9.88
1750/59 17.65 15.15 19.34 16.84 23.15 19.15 24.46 20.46 - 10.36
1800/09 18.96 16.46 22.82 20.32 26.46 22.46 26.85 22.85 - 16.13
1850/59 26.47 23.97 22.63 20.13 30.58 26.58 34.26 30.26 - 16.58
Sources: Broadberry et al., 2011, p. 36; Overton and Campbell, 1996, p. 294; 2006, p. 41; Floud et al., 2011, pp. 205-9.
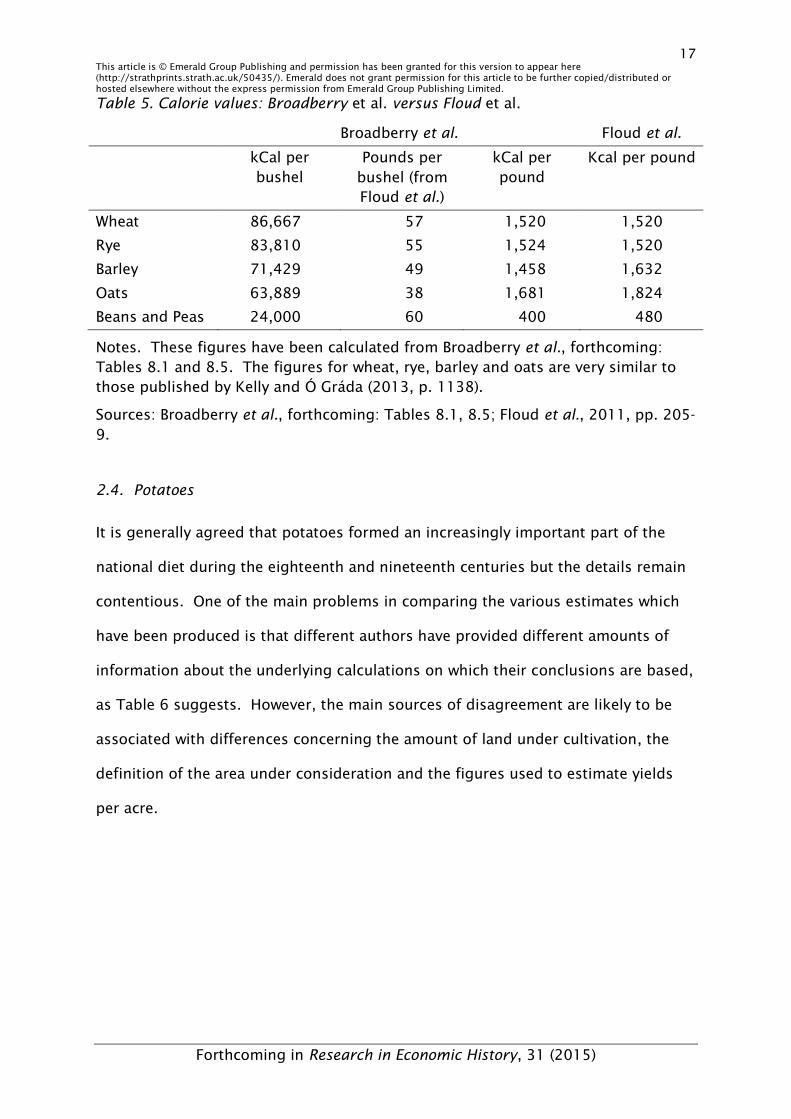
2.3. Calories from cereals and pulses
Both Broadberry et al. and Floud et al. drew on McCance and Widdowson’s (1960)
exhaustive account of The composition of foods when estimating calorie values.
However, as we can see from Table 5, they nevertheless reached slightly different
conclusions about the calorific value of barley and oats. Broadberry et al. also
appear to have used slightly lower values for beans and peas.
17 This article is © Emerald Group Publishing and permission has been granted for this version to appear here (http://strathprints.strath.ac.uk/50435/). Emerald does not grant permission for this article to be further copied/distributed or hosted elsewhere without the express permission from Emerald Group Publishing Limited.
Forthcoming in Research in Economic History, 31 (2015)
Table 5. Calorie values: Broadberry et al. versus Floud et al.
Broadberry et al. Floud et al.
kCal per bushel
Pounds per bushel (from Floud et al.)
kCal per pound
Kcal per pound
Wheat 86,667 57 1,520 1,520
Rye 83,810 55 1,524 1,520
Barley 71,429 49 1,458 1,632
Oats 63,889 38 1,681 1,824
Beans and Peas 24,000 60 400 480
Notes. These figures have been calculated from Broadberry et al., forthcoming: Tables 8.1 and 8.5. The figures for wheat, rye, barley and oats are very similar to those published by Kelly and Ó Gráda (2013, p. 1138).
Sources: Broadberry et al., forthcoming: Tables 8.1, 8.5; Floud et al., 2011, pp. 205-9.
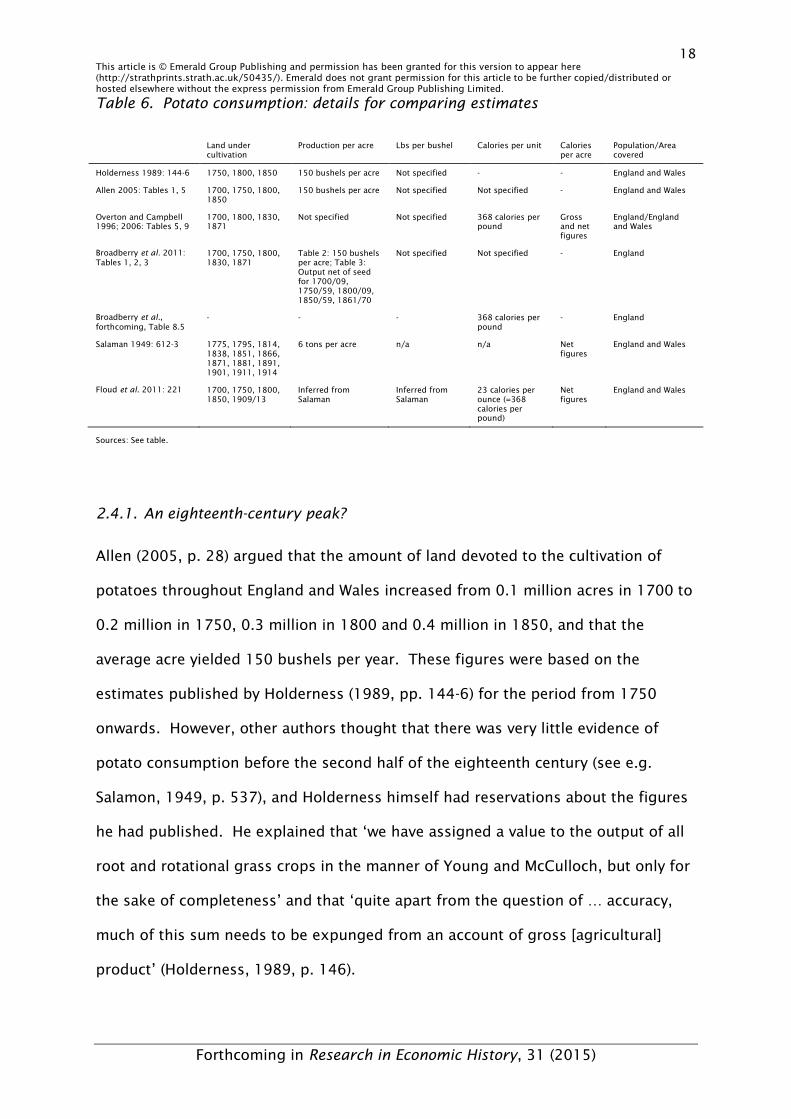
2.4. Potatoes
It is generally agreed that potatoes formed an increasingly important part of the
national diet during the eighteenth and nineteenth centuries but the details remain
contentious. One of the main problems in comparing the various estimates which
have been produced is that different authors have provided different amounts of
information about the underlying calculations on which their conclusions are based,
as Table 6 suggests. However, the main sources of disagreement are likely to be
associated with differences concerning the amount of land under cultivation, the
definition of the area under consideration and the figures used to estimate yields
per acre.
18 This article is © Emerald Group Publishing and permission has been granted for this version to appear here (http://strathprints.strath.ac.uk/50435/). Emerald does not grant permission for this article to be further copied/distributed or hosted elsewhere without the express permission from Emerald Group Publishing Limited.
Forthcoming in Research in Economic History, 31 (2015)
Table 6. Potato consumption: details for comparing estimates
Land under cultivation
Production per acre Lbs per bushel Calories per unit Calories per acre
Population/Area covered
Holderness 1989: 144-6 1750, 1800, 1850 150 bushels per acre Not specified - - England and Wales
Allen 2005: Tables 1, 5 1700, 1750, 1800, 1850
150 bushels per acre Not specified Not specified - England and Wales
Overton and Campbell 1996; 2006: Tables 5, 9
1700, 1800, 1830, 1871
Not specified Not specified 368 calories per pound
Gross and net figures
England/England and Wales
Broadberry et al. 2011: Tables 1, 2, 3
1700, 1750, 1800, 1830, 1871
Table 2: 150 bushels per acre; Table 3: Output net of seed for 1700/09, 1750/59, 1800/09, 1850/59, 1861/70
Not specified Not specified - England
Broadberry et al., forthcoming, Table 8.5
- - - 368 calories per pound
- England
Salaman 1949: 612-3 1775, 1795, 1814, 1838, 1851, 1866, 1871, 1881, 1891, 1901, 1911, 1914
6 tons per acre n/a n/a Net figures
England and Wales
Floud et al. 2011: 221 1700, 1750, 1800, 1850, 1909/13
Inferred from Salaman
Inferred from Salaman
23 calories per ounce (=368 calories per pound)
Net figures
England and Wales
Sources: See table.
2.4.1. An eighteenth-century peak?
Allen (2005, p. 28) argued that the amount of land devoted to the cultivation of
potatoes throughout England and Wales increased from 0.1 million acres in 1700 to
0.2 million in 1750, 0.3 million in 1800 and 0.4 million in 1850, and that the
average acre yielded 150 bushels per year. These figures were based on the
estimates published by Holderness (1989, pp. 144-6) for the period from 1750
onwards. However, other authors thought that there was very little evidence of
potato consumption before the second half of the eighteenth century (see e.g.
Salamon, 1949, p. 537), and Holderness himself had reservations about the figures
he had published. He explained that ‘we have assigned a value to the output of all
root and rotational grass crops in the manner of Young and McCulloch, but only for
the sake of completeness’ and that ‘quite apart from the question of … accuracy,
much of this sum needs to be expunged from an account of gross [agricultural]
product’ (Holderness, 1989, p. 146).
19 This article is © Emerald Group Publishing and permission has been granted for this version to appear here (http://strathprints.strath.ac.uk/50435/). Emerald does not grant permission for this article to be further copied/distributed or hosted elsewhere without the express permission from Emerald Group Publishing Limited.
Forthcoming in Research in Economic History, 31 (2015)
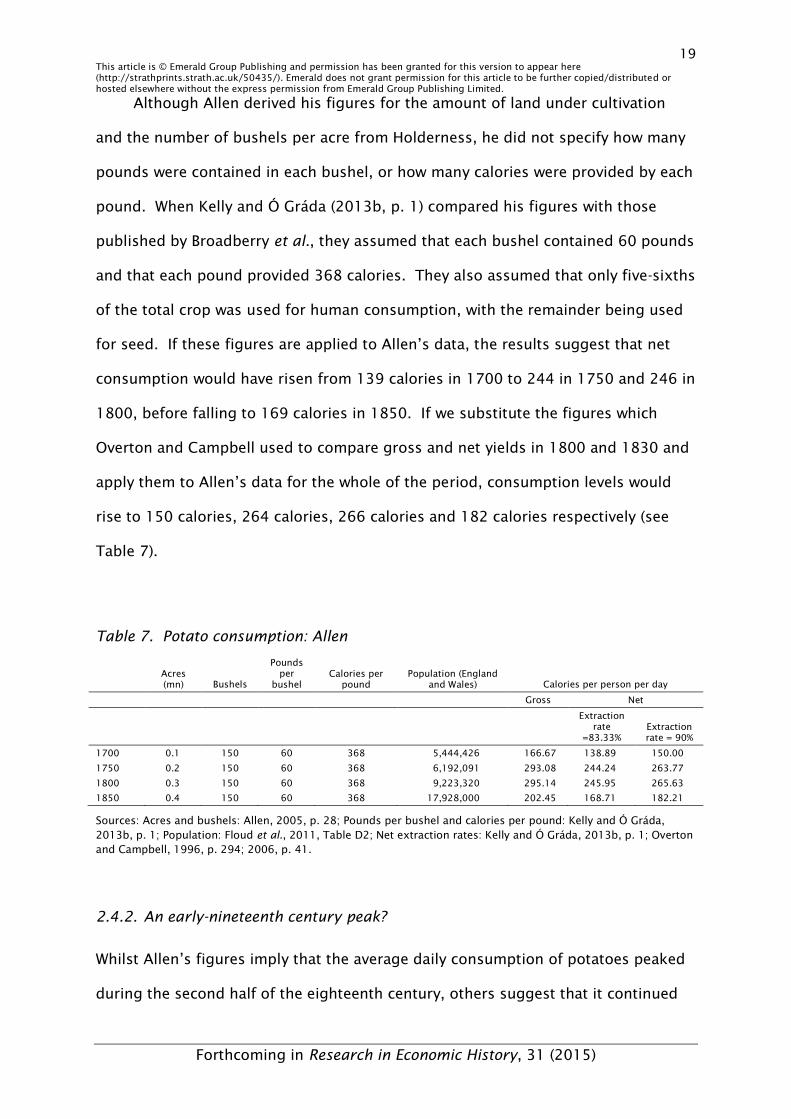
Although Allen derived his figures for the amount of land under cultivation
and the number of bushels per acre from Holderness, he did not specify how many
pounds were contained in each bushel, or how many calories were provided by each
pound. When Kelly and Ó Gráda (2013b, p. 1) compared his figures with those
published by Broadberry et al., they assumed that each bushel contained 60 pounds
and that each pound provided 368 calories. They also assumed that only five-sixths
of the total crop was used for human consumption, with the remainder being used
for seed. If these figures are applied to Allen’s data, the results suggest that net
consumption would have risen from 139 calories in 1700 to 244 in 1750 and 246 in
1800, before falling to 169 calories in 1850. If we substitute the figures which
Overton and Campbell used to compare gross and net yields in 1800 and 1830 and
apply them to Allen’s data for the whole of the period, consumption levels would
rise to 150 calories, 264 calories, 266 calories and 182 calories respectively (see
Table 7).
Table 7. Potato consumption: Allen
Acres (mn) Bushels
Pounds per
bushel Calories per
pound Population (England
and Wales) Calories per person per day
Gross Net
Extraction rate
=83.33% Extraction rate = 90%
1700 0.1 150 60 368 5,444,426 166.67 138.89 150.00
1750 0.2 150 60 368 6,192,091 293.08 244.24 263.77
1800 0.3 150 60 368 9,223,320 295.14 245.95 265.63
1850 0.4 150 60 368 17,928,000 202.45 168.71 182.21
Sources: Acres and bushels: Allen, 2005, p. 28; Pounds per bushel and calories per pound: Kelly and Ó Gráda, 2013b, p. 1; Population: Floud et al., 2011, Table D2; Net extraction rates: Kelly and Ó Gráda, 2013b, p. 1; Overton and Campbell, 1996, p. 294; 2006, p. 41.
2.4.2. An early-nineteenth century peak?
Whilst Allen’s figures imply that the average daily consumption of potatoes peaked
during the second half of the eighteenth century, others suggest that it continued
20 This article is © Emerald Group Publishing and permission has been granted for this version to appear here (http://strathprints.strath.ac.uk/50435/). Emerald does not grant permission for this article to be further copied/distributed or hosted elsewhere without the express permission from Emerald Group Publishing Limited.
Forthcoming in Research in Economic History, 31 (2015)
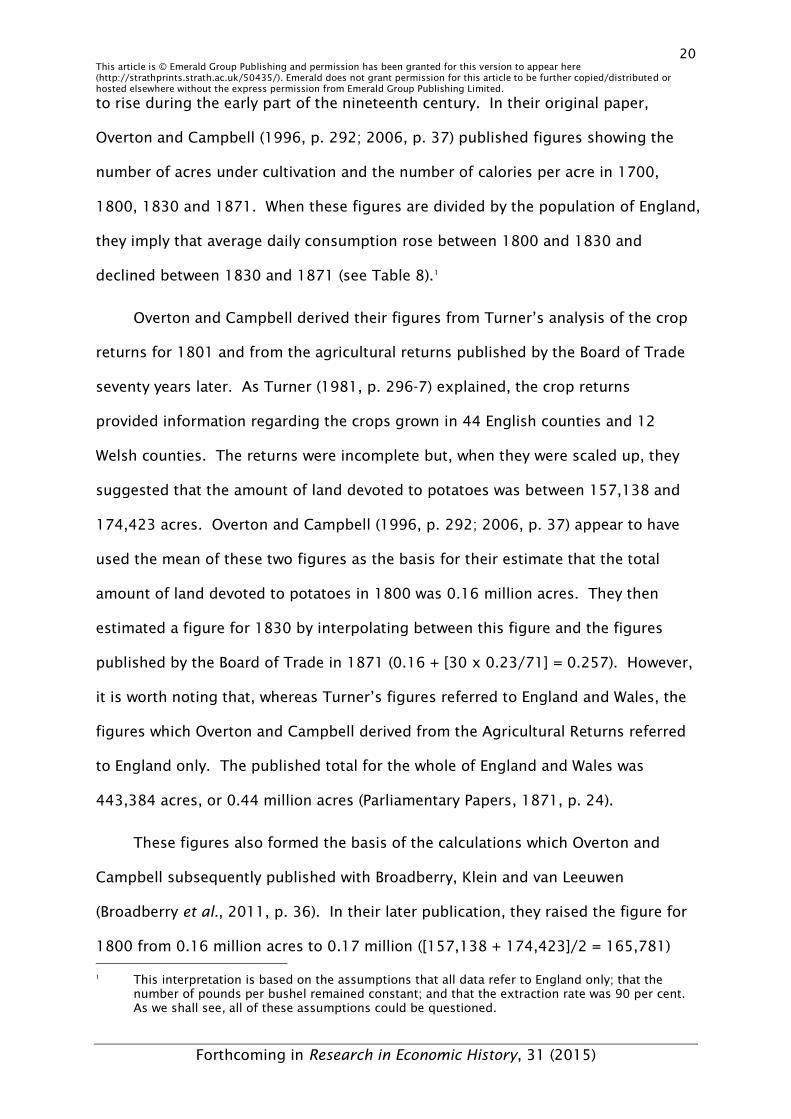
to rise during the early part of the nineteenth century. In their original paper,
Overton and Campbell (1996, p. 292; 2006, p. 37) published figures showing the
number of acres under cultivation and the number of calories per acre in 1700,
1800, 1830 and 1871. When these figures are divided by the population of England,
they imply that average daily consumption rose between 1800 and 1830 and
declined between 1830 and 1871 (see Table 8).1
Overton and Campbell derived their figures from Turner’s analysis of the crop
returns for 1801 and from the agricultural returns published by the Board of Trade
seventy years later. As Turner (1981, p. 296-7) explained, the crop returns
provided information regarding the crops grown in 44 English counties and 12
Welsh counties. The returns were incomplete but, when they were scaled up, they
suggested that the amount of land devoted to potatoes was between 157,138 and
174,423 acres. Overton and Campbell (1996, p. 292; 2006, p. 37) appear to have
used the mean of these two figures as the basis for their estimate that the total
amount of land devoted to potatoes in 1800 was 0.16 million acres. They then
estimated a figure for 1830 by interpolating between this figure and the figures
published by the Board of Trade in 1871 (0.16 + [30 x 0.23/71] = 0.257). However,
it is worth noting that, whereas Turner’s figures referred to England and Wales, the
figures which Overton and Campbell derived from the Agricultural Returns referred
to England only. The published total for the whole of England and Wales was
443,384 acres, or 0.44 million acres (Parliamentary Papers, 1871, p. 24).
These figures also formed the basis of the calculations which Overton and
Campbell subsequently published with Broadberry, Klein and van Leeuwen
(Broadberry et al., 2011, p. 36). In their later publication, they raised the figure for
1800 from 0.16 million acres to 0.17 million ([157,138 + 174,423]/2 = 165,781) 1 This interpretation is based on the assumptions that all data refer to England only; that the
number of pounds per bushel remained constant; and that the extraction rate was 90 per cent. As we shall see, all of these assumptions could be questioned.
21 This article is © Emerald Group Publishing and permission has been granted for this version to appear here (http://strathprints.strath.ac.uk/50435/). Emerald does not grant permission for this article to be further copied/distributed or hosted elsewhere without the express permission from Emerald Group Publishing Limited.
Forthcoming in Research in Economic History, 31 (2015)
and then used interpolation to estimate a figure for 1750 (165,781/2 = 82,915).
When these figures were combined with Overton and Campbell’s earlier calculations,
they implied that the average daily consumption of calories from potatoes in 1750
was approximately 114 calories (Table 8).
Although these figures may be regarded, in some respects, as an advance on
Holderness’ and Allen’s figures, they raise further questions of their own. As we
have already seen, the geographical coverage of the different estimates oscillates
between England and England and Wales, and the figures for both 1750 and 1830
are based on interpolation rather than observation. However, there are also
problems with the way in which Overton and Campbell measured the total yield and
with their efforts to estimate net extraction rates. As we can see from Table 8, their
overall figures imply that the number of pounds per bushel rose from 60 in 1800
and 61 in 1830 to 76 in 1871 (col. 7), whilst the extraction rate rose from
approximately 90 per cent in 1800 and 1830 to 100 per cent at the start of the
1870s (col. 4).
These problems mean that we should exercise a degree of caution before
attaching too much weight to the detail of these figures. If we hold the number of
pounds per bushel and the extraction rates constant and assume that the figures
only refer to England, they imply that average consumption rose from zero calories
in 1700 and 114 in 1750 to 161 in 1800 and 162 in 1830, before falling to 148 in
1871 (Table 8, col. 12). If we divide the total number of calories in 1800 by the
population of England and Wales, rather than England alone, the figure for that year
falls to 151 calories (Table 8, col. 16, row 1800B). If we include the Board of
Trade’s figures for England and Wales and divide the net output by the population
of both countries, average daily consumption in 1871 rises to 158 calories (Table 8,
col. 16, row 1871B). If we use Overton and Campbell’s own figures, and assume
22 This article is © Emerald Group Publishing and permission has been granted for this version to appear here (http://strathprints.strath.ac.uk/50435/). Emerald does not grant permission for this article to be further copied/distributed or hosted elsewhere without the express permission from Emerald Group Publishing Limited.
Forthcoming in Research in Economic History, 31 (2015)
that there were 76 pounds in each bushel in 1871 and a net extraction rate of 100
per cent, net consumption rises to 210 calories in England (Table 8, col. 14, row
1871B) and 224 in England and Wales as a whole (Table 8, col. 18, row 1871B).
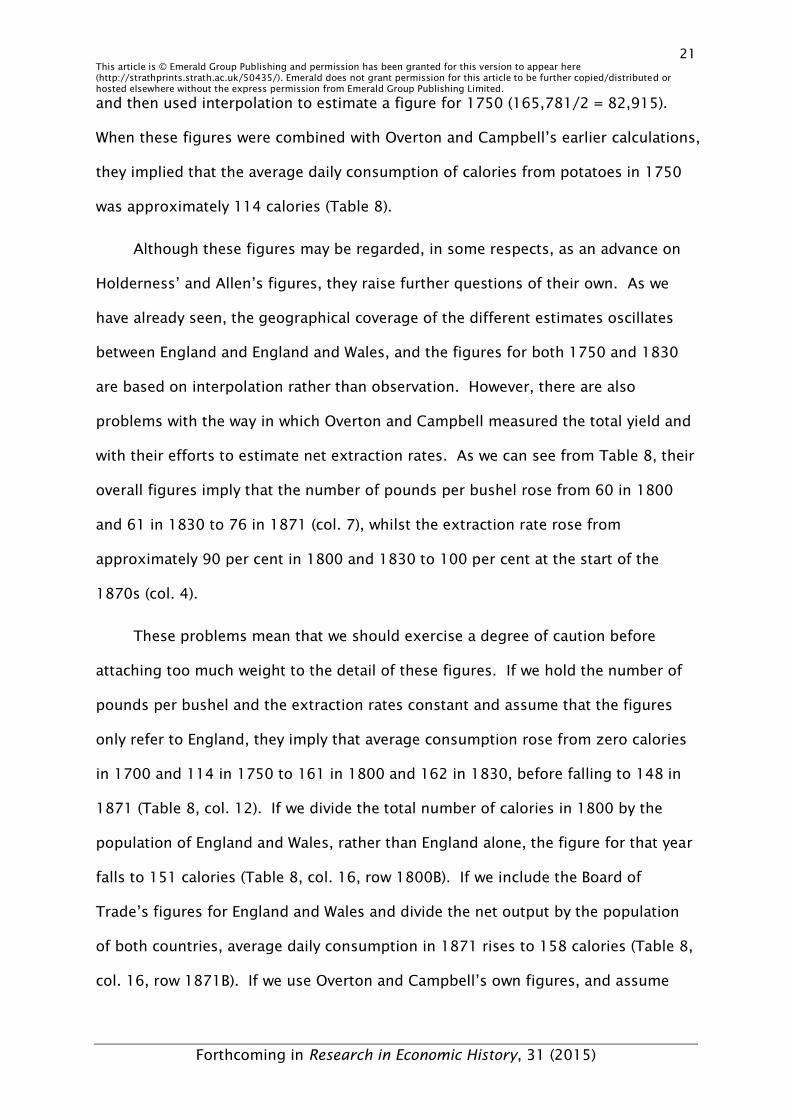
2.4.3. Weights and measures
As the previous paragraphs have demonstrated, there is a fair amount of
uncertainty surrounding the interpretation of historical weights and measures.
Kelly and Ó Gráda (2013b, p. 1) assumed that each bushel contained 60 pounds,
and this is consistent with the figures which Overton and Campbell (1996, p. 294;
2006, p. 41) used to estimate the total yield in 1800 and 1830, but their figures for
1871 imply that each bushel contained 76.45 pounds. Overton and Campbell also
assumed that each acre produced 150 bushels of crop, which implies that the
average yield ranged from 9000 pounds in 1800 and 1830 to 11,465 pounds in
1871. By contrast, Salaman (1949, p. 613) claimed that each acre produced six
tons, or 13,440 pounds, for human consumption.
23 This article is © Emerald Group Publishing and permission has been granted for this version to appear here (http://strathprints.strath.ac.uk/50435/). Emerald does not grant permission for this article to be further copied/distributed or hosted elsewhere without the express permission from Emerald Group Publishing Limited.
Forthcoming in Research in Economic History, 31 (2015)
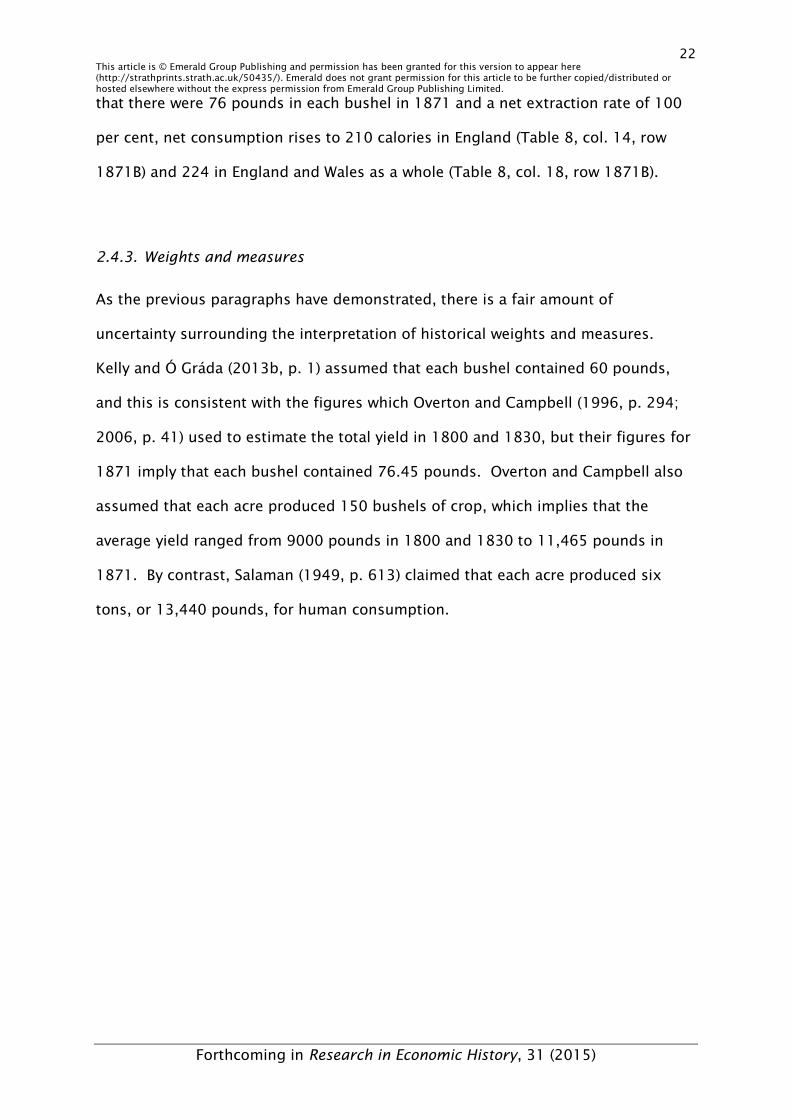
Table 8. Potato consumption: Overton and Campbell, and Broadberry et al.
Calories per acre Bushels per acre Lbs per bushel
Calories per
pound Population Calories per person per day
Acres Gross Net Extraction
rate Constant Derived England England
and Wales England England and Wales
Constant lbs/bushel Derived lbs/bushel Constant lbs/bushel Derived lbs/bushel
Gross Net Gross Net Gross Net Gross Net
(1) (2) (3) (4) (5) (6) (7) (8) (9) (10) (11) (12) (13) (14) (15) (16) (17) (18)
1700 0.00 0.00 0.00 90.00 150.00 60.00 - 368.00 5,026,877 5,444,426 0.00 0.00 0.00 0.00 0.00 0.00 0.00 0.00
1750 0.08 3.31 2.98 90.00 150.00 60.00 - 368.00 5,739,364 6,192,091 126.48 113.83 0.00 0.00 117.23 105.51 0.00 0.00
1800A 0.16 3.30 2.97 90.00 150.00 60.00 59.78 368.00 8,606,033 9,223,320 168.70 151.83 168.09 151.28 157.41 141.67 156.84 141.16
1800B 0.17 3.30 2.97 90.00 150.00 60.00 59.78 368.00 8,606,033 9,223,320 179.24 161.32 178.59 160.73 167.25 150.52 166.64 149.98
1830 0.26 3.37 3.03 90.00 150.00 60.00 61.05 368.00 13,105,539 14,446,128 180.02 162.02 183.17 164.85 163.31 146.98 166.17 149.56
1871A 0.39 4.22 3.80 90.00 150.00 60.00 76.45 368.00 21,500,720 - 164.59 148.13 209.72 188.74 - - - -
1871B 0.39 4.22 4.22 100.00 150.00 60.00 76.45 368.00 21,500,720 - 164.59 164.59 209.72 209.72 - - - -
1871A 0.44 4.22 3.80 90.00 150.00 60.00 76.45 368.00 - 22,712,000 - - - - 175.79 158.21 223.98 201.59
1871B 0.44 4.22 4.22 100.00 150.00 60.00 76.45 368.00 - 22,712,000 - - - - 175.79 175.79 223.98 223.98
Notes and sources:
Col. 1. 1700, 1800A, 1830 and 1871A: Overton and Campbell (1996, p. 292; 2006, Table V); 1750 and 1800B: Broadberry et al. (2011, p. 36 [Table 1]); 1871B: Parliamentary Papers, 1871, p. 24.
Cols. 2-3: Overton and Campbell, 1996, p. 294 (Table 9); 2006, p. 41 (Table IX). The figures for 1871A are based on the assumption that the extraction rate was 90 per cent. The figures for 1871B are the ones reported in the published papers.
Col. 4: Figures for 1700 and 1750 assume the same extraction rate as for 1800; figures for 1871A assume the same extraction rate as 1830.
Col. 5: Broadberry et al., 2011, p. 37 (Table 2).
Col. 6: Kelly and O Grada, 2013b, p. 1.
Col. 7. Calculated from cols. 1-3, 8.
Col. 8. Overton and Campbell, 1996, p. 294 (Table 9); 2006, p. 41 (Table IX).
Col. 9: Wrigley and Schofield, 1981, pp. 533-5
Col. 10: 1700, 1750 and 1800: Floud et al., 2011, Table D2; 1830: interpolated from Floud et al.'s figures for 1800 [1801] and 1850 [1851]; 1871: Mitchell, 1988, Table 1.02.
Cols. 11-18: Calculated from cols. 1-10.
24 This article is © Emerald Group Publishing and permission has been granted for this version to appear here (http://strathprints.strath.ac.uk/50435/). Emerald does not grant permission for this article to be further copied/distributed or hosted elsewhere without the express permission from Emerald Group Publishing Limited.
Forthcoming in Research in Economic History, 31 (2015)
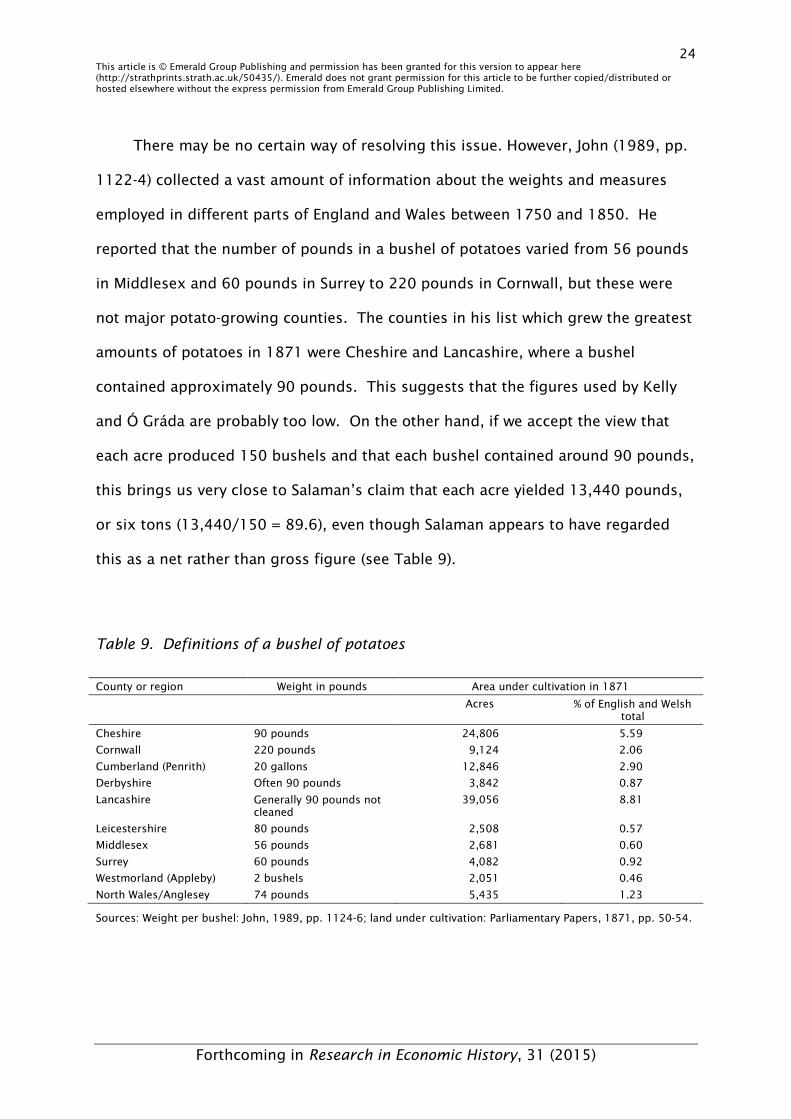
There may be no certain way of resolving this issue. However, John (1989, pp.
1122-4) collected a vast amount of information about the weights and measures
employed in different parts of England and Wales between 1750 and 1850. He
reported that the number of pounds in a bushel of potatoes varied from 56 pounds
in Middlesex and 60 pounds in Surrey to 220 pounds in Cornwall, but these were
not major potato-growing counties. The counties in his list which grew the greatest
amounts of potatoes in 1871 were Cheshire and Lancashire, where a bushel
contained approximately 90 pounds. This suggests that the figures used by Kelly
and Ó Gráda are probably too low. On the other hand, if we accept the view that
each acre produced 150 bushels and that each bushel contained around 90 pounds,
this brings us very close to Salaman’s claim that each acre yielded 13,440 pounds,
or six tons (13,440/150 = 89.6), even though Salaman appears to have regarded
this as a net rather than gross figure (see Table 9).
Table 9. Definitions of a bushel of potatoes
County or region Weight in pounds Area under cultivation in 1871
Acres % of English and Welsh total
Cheshire 90 pounds 24,806 5.59
Cornwall 220 pounds 9,124 2.06
Cumberland (Penrith) 20 gallons 12,846 2.90
Derbyshire Often 90 pounds 3,842 0.87
Lancashire Generally 90 pounds not cleaned
39,056 8.81
Leicestershire 80 pounds 2,508 0.57
Middlesex 56 pounds 2,681 0.60
Surrey 60 pounds 4,082 0.92
Westmorland (Appleby) 2 bushels 2,051 0.46
North Wales/Anglesey 74 pounds 5,435 1.23
Sources: Weight per bushel: John, 1989, pp. 1124-6; land under cultivation: Parliamentary Papers, 1871, pp. 50-54.
25 This article is © Emerald Group Publishing and permission has been granted for this version to appear here (http://strathprints.strath.ac.uk/50435/). Emerald does not grant permission for this article to be further copied/distributed or hosted elsewhere without the express permission from Emerald Group Publishing Limited.
Forthcoming in Research in Economic History, 31 (2015)
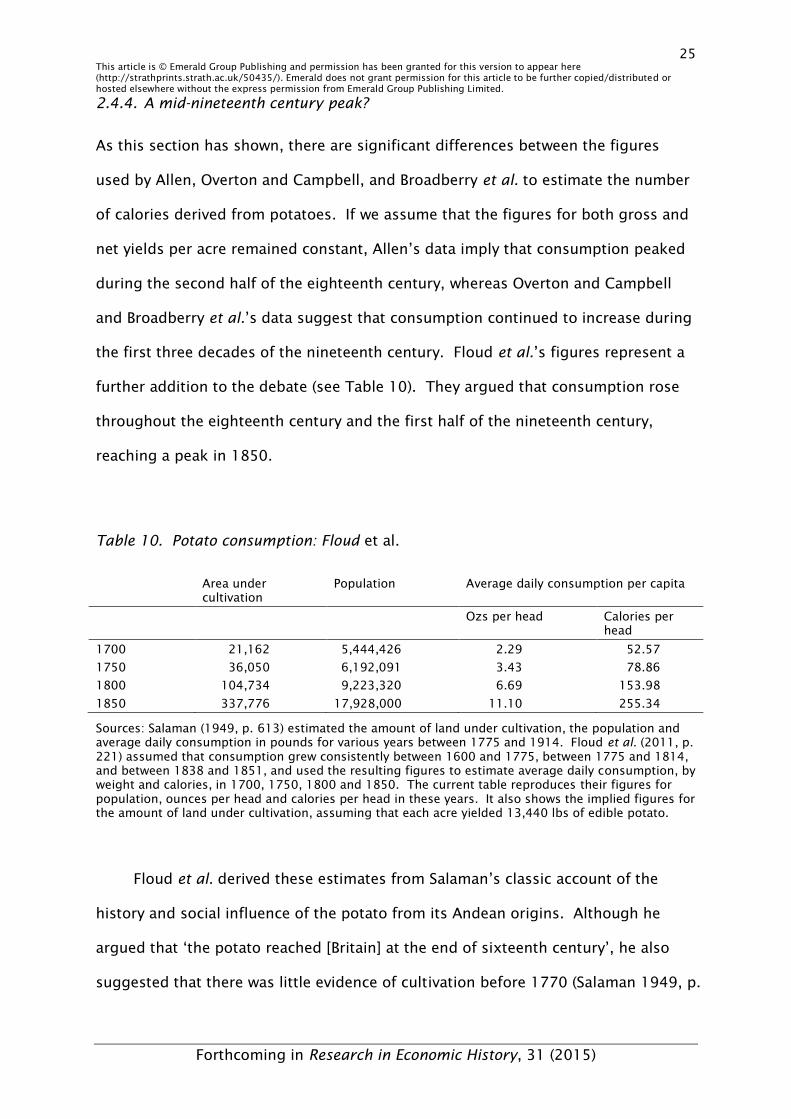
2.4.4. A mid-nineteenth century peak?
As this section has shown, there are significant differences between the figures
used by Allen, Overton and Campbell, and Broadberry et al. to estimate the number
of calories derived from potatoes. If we assume that the figures for both gross and
net yields per acre remained constant, Allen’s data imply that consumption peaked
during the second half of the eighteenth century, whereas Overton and Campbell
and Broadberry et al.’s data suggest that consumption continued to increase during
the first three decades of the nineteenth century. Floud et al.’s figures represent a
further addition to the debate (see Table 10). They argued that consumption rose
throughout the eighteenth century and the first half of the nineteenth century,
reaching a peak in 1850.
Table 10. Potato consumption: Floud et al.
Area under cultivation
Population Average daily consumption per capita
Ozs per head Calories per head
1700 21,162 5,444,426 2.29 52.57
1750 36,050 6,192,091 3.43 78.86
1800 104,734 9,223,320 6.69 153.98
1850 337,776 17,928,000 11.10 255.34
Sources: Salaman (1949, p. 613) estimated the amount of land under cultivation, the population and average daily consumption in pounds for various years between 1775 and 1914. Floud et al. (2011, p. 221) assumed that consumption grew consistently between 1600 and 1775, between 1775 and 1814, and between 1838 and 1851, and used the resulting figures to estimate average daily consumption, by weight and calories, in 1700, 1750, 1800 and 1850. The current table reproduces their figures for population, ounces per head and calories per head in these years. It also shows the implied figures for the amount of land under cultivation, assuming that each acre yielded 13,440 lbs of edible potato.
Floud et al. derived these estimates from Salaman’s classic account of the
history and social influence of the potato from its Andean origins. Although he
argued that ‘the potato reached [Britain] at the end of sixteenth century’, he also
suggested that there was little evidence of cultivation before 1770 (Salaman 1949, p.
26 This article is © Emerald Group Publishing and permission has been granted for this version to appear here (http://strathprints.strath.ac.uk/50435/). Emerald does not grant permission for this article to be further copied/distributed or hosted elsewhere without the express permission from Emerald Group Publishing Limited.
Forthcoming in Research in Economic History, 31 (2015)
537). He derived his figures for 1775 and 1795 from contemporary accounts of the
consumption of potatoes in northern England at the end of the eighteenth century,
and estimated the amount of land under cultivation in 1814 and 1838 from
contemporary Scottish figures. He then used James Caird’s (1852) account of the
total amount of land used for the cultivation of potatoes, turnips and mangolds to
estimate a separate figure for potatoes in 1851. He also used the Board of Trade’s
official returns to estimate the extent of potato cultivation in 1866 and 1871, and in
1881, 1891, 1901, 1911 and 1914. However, unlike Overton and Campbell, he
included both English and Welsh figures, and he added a further 70,000 acres for
allotments, gardens and small ‘potato-patches’ (Salaman, 1949, pp. 611-3).
This account raises two main issues. In the first place, as we have already
seen, Salaman (1949, p. 537) argued that potato cultivation rose rapidly ‘from a
very small, though quite uncertain, initial acreage in 1770’. However, he also
argued that it ‘reached this country at the end of the sixteenth century’ and made
‘rapid progress in Lancashire and the north’ (Salaman, 1949, pp. 434, 451). When
Floud et al. (2011, p. 157) used these data, they allowed their figures for potato
consumption to rise consistently from 1600 to 1775. If Salaman was right to
suggest that potatoes were grown on a very small number of acres before 1770,
this assumption may have led them to overestimate the number of calories derived
from potatoes in both 1700 and 1750.
The second question concerns the compatibility of Salaman’s figures with
those of later authors. The most direct point of comparison is with Turner’s
suggestion that between 0.157 and 0.173 million acres were devoted to the
cultivation of potatoes in 1801 (Turner, 1981, pp. 296-7). By contrast, Salaman
argued that only 0.1 million acres were devoted to potatoes in 1795 and that the
figure of 0.16 million was not reached until 1814 (Salaman, 1949, p. 613). If we
27 This article is © Emerald Group Publishing and permission has been granted for this version to appear here (http://strathprints.strath.ac.uk/50435/). Emerald does not grant permission for this article to be further copied/distributed or hosted elsewhere without the express permission from Emerald Group Publishing Limited.
Forthcoming in Research in Economic History, 31 (2015)
were to recalculate Floud et al.’s figures for 1800 using Turner’s proposed acreage,
the number of calories supplied in this year would rise by between 77 and 102
([157,138 x 153.98]/104,734 = 231.02; [174,423 x 153.98]/104,734 = 256.44).
Although Turner’s figures for this period are clearly derived from a much more
complete source of quantitative information than Salaman’s, there are two potential
problems. As we have already seen, Salaman (1949, p. 613) was explicit in stating
that his figures were based on the amount of land devoted to the cultivation of
potatoes for human consumption, but others have been less so. According to
Holderness (1989, p. 144), a large proportion of the potatoes which were cultivated
at the end of the eighteenth century were likely to have been consumed by animals,
and this impression is reinforced by a number of contemporary accounts. Sir
Archibald Grant (1766, p. 11) complained that ‘potatoes are good for none but
swine and those they won’t fatten’, and Arthur Young (1771a, p. 409) claimed that
‘the object in cultivating potatoes is not Covent Garden but the food of cattle’ (see
also Bourke, 1993, p. 38). Salaman (1949, pp. 503-17) argued that the use of
potatoes for human consumption increased rapidly at the end of the eighteenth
century but the prejudice against them continued well into the nineteenth (see e.g.
Burnett, 1979, p. 28). It may therefore be dangerous to infer the number of ‘human’
calories from contemporary estimates of the amount of land devoted to the
cultivation of potatoes without taking some account of changing patterns of potato
usage.
It is also important to consider the methods which Turner used to generate his
figures. As he pointed out, none of his calculations took any account of the ‘untold
acres of potatoes’ grown on small plots or gardens (Turner, 1981, p. 293).
However, his method of calculation may have encouraged him to overestimate the
amount of land devoted to the cultivation of potatoes on farms. As we have already
28 This article is © Emerald Group Publishing and permission has been granted for this version to appear here (http://strathprints.strath.ac.uk/50435/). Emerald does not grant permission for this article to be further copied/distributed or hosted elsewhere without the express permission from Emerald Group Publishing Limited.
Forthcoming in Research in Economic History, 31 (2015)
noted, he developed these estimates by comparing the total amount of land
devoted to potatoes in the extant crop returns (76,679 acres) with the total amount
of recorded arable acreage (3,453,391 acres). He then offered two alternative
estimates of ‘true’ arable coverage (7,077,194 acres and 7,680,105 acres) and used
the ratio of recorded potato acres to recorded arable acres to estimate total potato
coverage. However, the coverage of the returns varied by county and some
counties grew more potatoes than others. If we were to scale the figures up at the
level of each county, rather than the country as a whole, the total amount of land
devoted to potatoes would be somewhat lower. If the ‘true’ amount of arable land
was 7,077,194 acres, the amount devoted to potatoes would have been 140,827; if
the ‘true’ total was 7,860,105, the amount devoted to potatoes would have been
156,406. These figures are approximately ten per cent lower than the figures on
which Overton and Campbell and Broadberry et al.’s estimates were based.
2.5. Extraction rates
In order to estimate the proportion of the total crop which became available for
human consumption, it is necessary to make allowances for seeding, the
consumption of grain by animals, processing, distribution and wastage. Floud et al.
(2011, pp. 205-9) used data from the United States to estimate the proportion of
cereals and pulses ‘lost’ as a result of seeding, animal consumption and processing,
and allowed an extra ten per cent for wastage. They assumed that the gross
extraction rate (the amount of food available for human consumption as a
proportion of the gross yield of each crop) remained constant over the whole of the
period from 1700 to 1850.
These assumptions have not escaped criticism. Kelly and Ó Gráda (2013b, p.
2) argued that ‘Floud et al.’s assumed proportions of wheat, barley and rye entering
29 This article is © Emerald Group Publishing and permission has been granted for this version to appear here (http://strathprints.strath.ac.uk/50435/). Emerald does not grant permission for this article to be further copied/distributed or hosted elsewhere without the express permission from Emerald Group Publishing Limited.
Forthcoming in Research in Economic History, 31 (2015)
gross product … seem to be on the low side’ and that ‘the assumed losses from
processing and distribution may be too high except, perhaps, in the case of barley’.
Meredith and Oxley (2014, p. 180) also thought that Floud et al.’s ‘assumptions
regarding loss … are arguably very high’ although, as we shall see, this did not
prevent them from accepting the same rates when performing their final
calculations.
It is difficult to compare the impact of these assumptions directly with those
made by Broadberry et al. because Broadberry and his co-authors only showed the
proportion of the total crop which remained available for human consumption after
making an initial allowance for seeding. However, we can address this for some
crops using the figures on gross and net yields in Overton and Campbell’s paper
(1996, pp. 292-5; 2006, pp. 37-44), and we can also compare their figures with
those published by Austin Bourke (1993, pp. 162-3). These figures enable us to
make separate calculations for the proportions of the original crop which were ‘lost’
in the form of seeds, animal consumption, wastage and processing for wheat, rye,
barley and oats.
As we can see from Table 11, both Bourke (1993, pp. 159-63) and Overton
and Campbell (1996, p. 294; 2006, p. 41) attempted to estimate the proportion of
the main cereal crops which were lost as a result of processing. Bourke derived his
figures from a series of contemporary British and Irish estimates, whereas the
origins of some of Overton and Campbell’s figures are a little less clear. However,
the initial estimates were actually very similar. Bourke estimated that the ‘costs’ of
converting grain to meal were equal to 17 per cent of the original crop in the case
of barley and 22 per cent in the case of rye, whereas Overton and Campbell used
figures of 22 per cent and 20 per cent respectively, but the figures for wheat and
oats were identical. However, Overton and Campbell included separate allowances
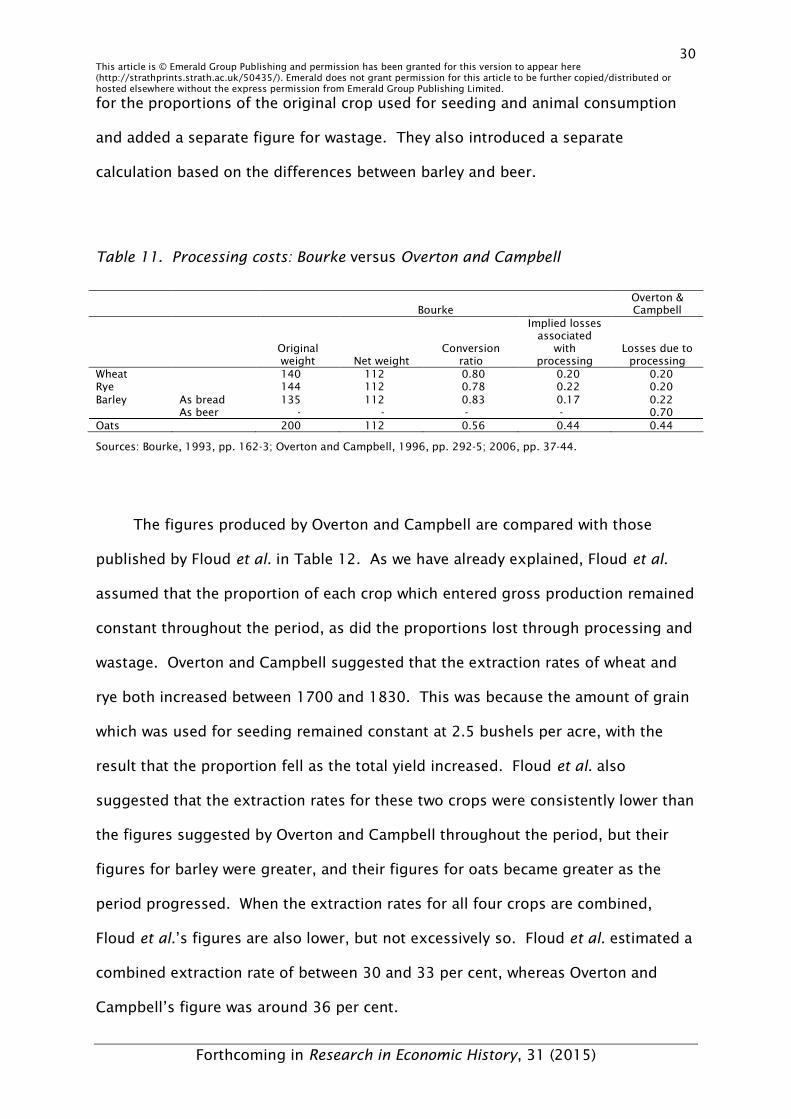
30 This article is © Emerald Group Publishing and permission has been granted for this version to appear here (http://strathprints.strath.ac.uk/50435/). Emerald does not grant permission for this article to be further copied/distributed or hosted elsewhere without the express permission from Emerald Group Publishing Limited.
Forthcoming in Research in Economic History, 31 (2015)
for the proportions of the original crop used for seeding and animal consumption
and added a separate figure for wastage. They also introduced a separate
calculation based on the differences between barley and beer.
Table 11. Processing costs: Bourke versus Overton and Campbell
Bourke Overton & Campbell
Original weight Net weight
Conversion ratio
Implied losses associated
with processing
Losses due to processing
Wheat 140 112 0.80 0.20 0.20 Rye 144 112 0.78 0.22 0.20 Barley As bread 135 112 0.83 0.17 0.22
As beer - - - - 0.70 Oats 200 112 0.56 0.44 0.44
Sources: Bourke, 1993, pp. 162-3; Overton and Campbell, 1996, pp. 292-5; 2006, pp. 37-44.
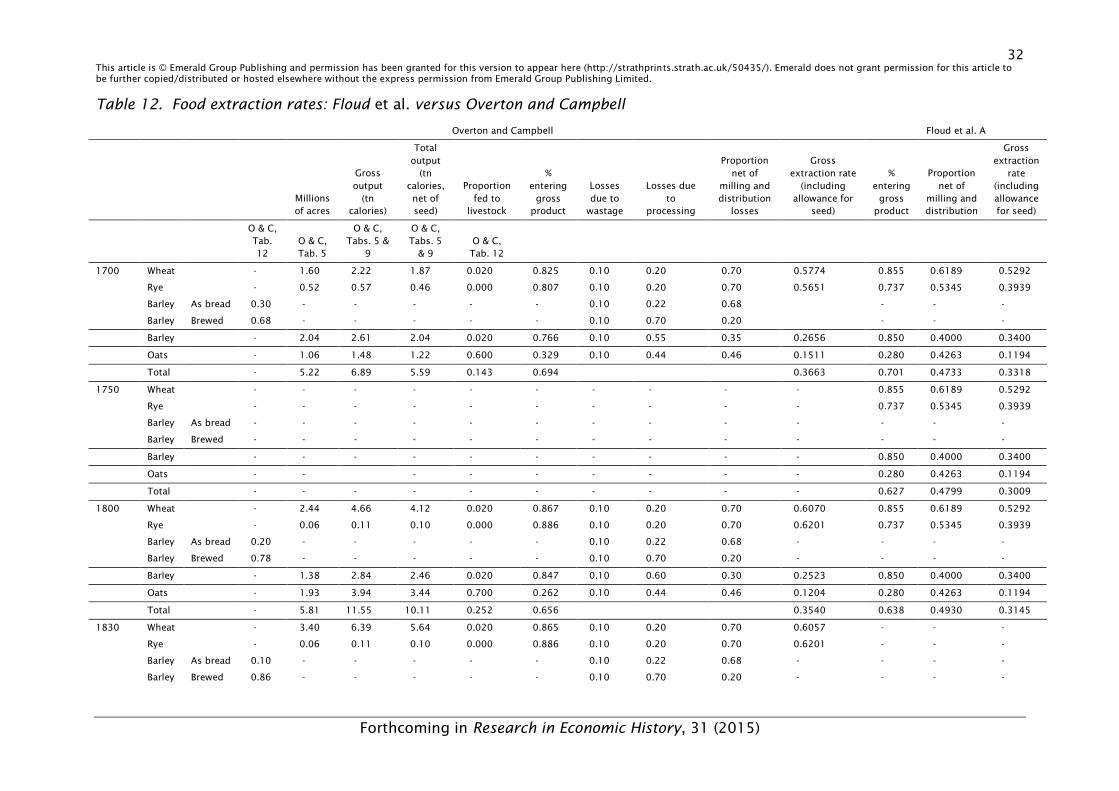
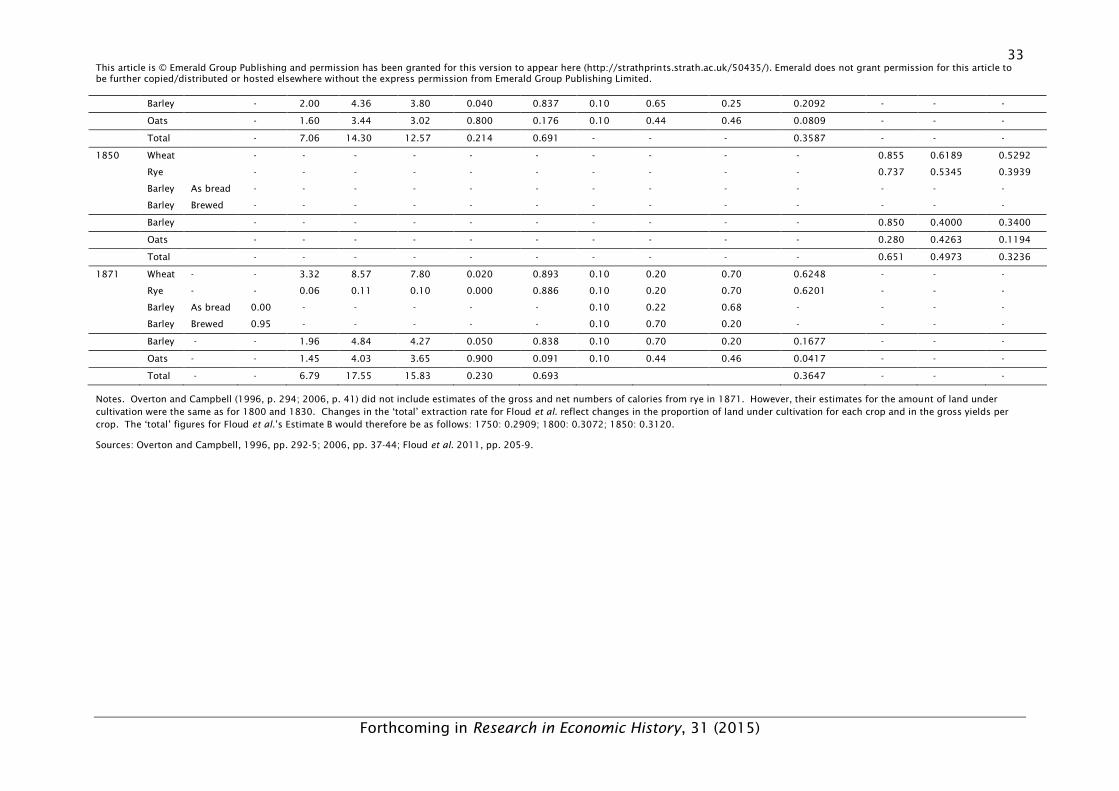
The figures produced by Overton and Campbell are compared with those
published by Floud et al. in Table 12. As we have already explained, Floud et al.
assumed that the proportion of each crop which entered gross production remained
constant throughout the period, as did the proportions lost through processing and
wastage. Overton and Campbell suggested that the extraction rates of wheat and
rye both increased between 1700 and 1830. This was because the amount of grain
which was used for seeding remained constant at 2.5 bushels per acre, with the
result that the proportion fell as the total yield increased. Floud et al. also
suggested that the extraction rates for these two crops were consistently lower than
the figures suggested by Overton and Campbell throughout the period, but their
figures for barley were greater, and their figures for oats became greater as the
period progressed. When the extraction rates for all four crops are combined,
Floud et al.’s figures are also lower, but not excessively so. Floud et al. estimated a
combined extraction rate of between 30 and 33 per cent, whereas Overton and
Campbell’s figure was around 36 per cent.
31 This article is © Emerald Group Publishing and permission has been granted for this version to appear here (http://strathprints.strath.ac.uk/50435/). Emerald does not grant permission for this article to be further copied/distributed or hosted elsewhere without the express permission from Emerald Group Publishing Limited.
Forthcoming in Research in Economic History, 31 (2015)
It is also possible to use these data to examine the effect of substituting
Overton and Campbell’s extraction rates for Floud et al.’s rates, whilst leaving all
other aspects of Floud et al.’s estimates unchanged. Table 13 suggests that the
answer depends on the mixture of crops in Floud et al.’s tables. If we apply
Overton and Campbell’s figures to the combination of crops in Estimate A, average
daily consumption rises by 56 calories in 1700 and 72 calories in both 1750 and
1800, before falling in 1850. If we apply their figures to the mixture of crops in
Estimate B, average consumption rises by 99 calories in 1750 and 67 calories in
1800, and falls by 32 calories in 1850. If we were to apply these figures to the
totals in Table 2, the effect would be to accentuate the differences between the two
sets of Estimates. The application of Overton and Campbell’s extraction rates to
the figures in Estimate A would mean that consumption rose between 1700 and
1750 and again between 1750 and 1800, before falling between 1800 and 1850. If
we were to apply their figures to Estimate B, total consumption would rise more
sharply between 1700 and 1750 and fall between 1750 and 1800, with little change
over the next half-century.
32 This article is © Emerald Group Publishing and permission has been granted for this version to appear here (http://strathprints.strath.ac.uk/50435/). Emerald does not grant permission for this article to be further copied/distributed or hosted elsewhere without the express permission from Emerald Group Publishing Limited.
Forthcoming in Research in Economic History, 31 (2015)
Table 12. Food extraction rates: Floud et al. versus Overton and Campbell
Overton and Campbell Floud et al. A
Millions of acres
Gross output
(tn calories)
Total output
(tn calories, net of seed)
Proportion fed to
livestock
% entering
gross product
Losses due to
wastage
Losses due to
processing
Proportion net of
milling and distribution
losses
Gross extraction rate
(including allowance for
seed)
% entering
gross product
Proportion net of
milling and distribution
Gross extraction
rate (including allowance for seed)
O & C, Tab. 12
O & C, Tab. 5
O & C, Tabs. 5 &
9
O & C, Tabs. 5
& 9 O & C, Tab. 12
1700 Wheat - 1.60 2.22 1.87 0.020 0.825 0.10 0.20 0.70 0.5774 0.855 0.6189 0.5292
Rye - 0.52 0.57 0.46 0.000 0.807 0.10 0.20 0.70 0.5651 0.737 0.5345 0.3939
Barley As bread 0.30 - - - - - 0.10 0.22 0.68 - - -
Barley Brewed 0.68 - - - - - 0.10 0.70 0.20 - - -
Barley - 2.04 2.61 2.04 0.020 0.766 0.10 0.55 0.35 0.2656 0.850 0.4000 0.3400
Oats - 1.06 1.48 1.22 0.600 0.329 0.10 0.44 0.46 0.1511 0.280 0.4263 0.1194
Total - 5.22 6.89 5.59 0.143 0.694 0.3663 0.701 0.4733 0.3318
1750 Wheat - - - - - - - - - - 0.855 0.6189 0.5292
Rye - - - - - - - - - - 0.737 0.5345 0.3939
Barley As bread - - - - - - - - - - - - -
Barley Brewed - - - - - - - - - - - - -
Barley - - - - - - - - - - 0.850 0.4000 0.3400
Oats - - - - - - - - - 0.280 0.4263 0.1194
Total - - - - - - - - - - 0.627 0.4799 0.3009
1800 Wheat - 2.44 4.66 4.12 0.020 0.867 0.10 0.20 0.70 0.6070 0.855 0.6189 0.5292
Rye - 0.06 0.11 0.10 0.000 0.886 0.10 0.20 0.70 0.6201 0.737 0.5345 0.3939
Barley As bread 0.20 - - - - - 0.10 0.22 0.68 - - - -
Barley Brewed 0.78 - - - - - 0.10 0.70 0.20 - - - -
Barley - 1.38 2.84 2.46 0.020 0.847 0.10 0.60 0.30 0.2523 0.850 0.4000 0.3400
Oats - 1.93 3.94 3.44 0.700 0.262 0.10 0.44 0.46 0.1204 0.280 0.4263 0.1194
Total - 5.81 11.55 10.11 0.252 0.656 0.3540 0.638 0.4930 0.3145
1830 Wheat - 3.40 6.39 5.64 0.020 0.865 0.10 0.20 0.70 0.6057 - - -
Rye - 0.06 0.11 0.10 0.000 0.886 0.10 0.20 0.70 0.6201 - - -
Barley As bread 0.10 - - - - - 0.10 0.22 0.68 - - - -
Barley Brewed 0.86 - - - - - 0.10 0.70 0.20 - - - -
33 This article is © Emerald Group Publishing and permission has been granted for this version to appear here (http://strathprints.strath.ac.uk/50435/). Emerald does not grant permission for this article to be further copied/distributed or hosted elsewhere without the express permission from Emerald Group Publishing Limited.
Forthcoming in Research in Economic History, 31 (2015)
Barley - 2.00 4.36 3.80 0.040 0.837 0.10 0.65 0.25 0.2092 - - -
Oats - 1.60 3.44 3.02 0.800 0.176 0.10 0.44 0.46 0.0809 - - -
Total - 7.06 14.30 12.57 0.214 0.691 - - - 0.3587 - - -
1850 Wheat - - - - - - - - - - 0.855 0.6189 0.5292
Rye - - - - - - - - - - 0.737 0.5345 0.3939
Barley As bread - - - - - - - - - - - - -
Barley Brewed - - - - - - - - - - - - -
Barley - - - - - - - - - - 0.850 0.4000 0.3400
Oats - - - - - - - - - - 0.280 0.4263 0.1194
Total - - - - - - - - - - 0.651 0.4973 0.3236
1871 Wheat - - 3.32 8.57 7.80 0.020 0.893 0.10 0.20 0.70 0.6248 - - -
Rye - - 0.06 0.11 0.10 0.000 0.886 0.10 0.20 0.70 0.6201 - - -
Barley As bread 0.00 - - - - - 0.10 0.22 0.68 - - - -
Barley Brewed 0.95 - - - - - 0.10 0.70 0.20 - - - -
Barley - - 1.96 4.84 4.27 0.050 0.838 0.10 0.70 0.20 0.1677 - - -
Oats - - 1.45 4.03 3.65 0.900 0.091 0.10 0.44 0.46 0.0417 - - -
Total - - 6.79 17.55 15.83 0.230 0.693 0.3647 - - -
Notes. Overton and Campbell (1996, p. 294; 2006, p. 41) did not include estimates of the gross and net numbers of calories from rye in 1871. However, their estimates for the amount of land under cultivation were the same as for 1800 and 1830. Changes in the ‘total’ extraction rate for Floud et al. reflect changes in the proportion of land under cultivation for each crop and in the gross yields per crop. The ‘total’ figures for Floud et al.’s Estimate B would therefore be as follows: 1750: 0.2909; 1800: 0.3072; 1850: 0.3120.
Sources: Overton and Campbell, 1996, pp. 292-5; 2006, pp. 37-44; Floud et al. 2011, pp. 205-9.
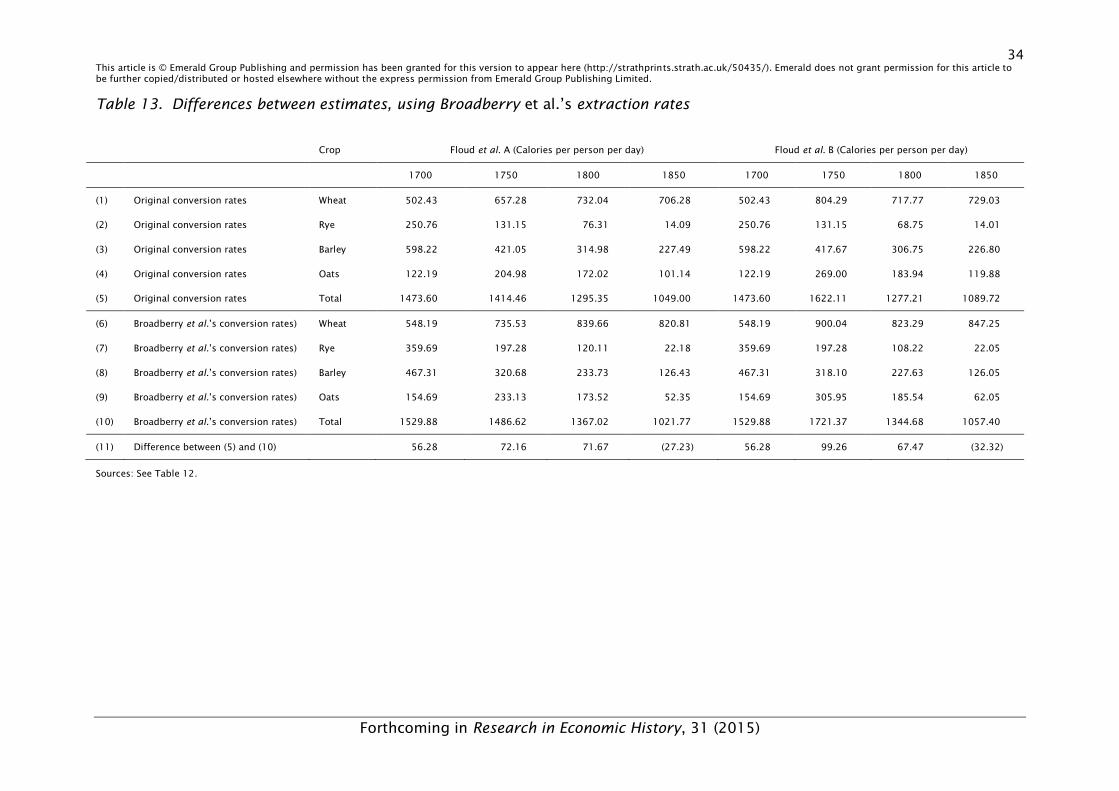
34 This article is © Emerald Group Publishing and permission has been granted for this version to appear here (http://strathprints.strath.ac.uk/50435/). Emerald does not grant permission for this article to be further copied/distributed or hosted elsewhere without the express permission from Emerald Group Publishing Limited.
Forthcoming in Research in Economic History, 31 (2015)
Table 13. Differences between estimates, using Broadberry et al.’s extraction rates
Crop Floud et al. A (Calories per person per day) Floud et al. B (Calories per person per day)
1700 1750 1800 1850 1700 1750 1800 1850
(1) Original conversion rates Wheat 502.43 657.28 732.04 706.28 502.43 804.29 717.77 729.03
(2) Original conversion rates Rye 250.76 131.15 76.31 14.09 250.76 131.15 68.75 14.01
(3) Original conversion rates Barley 598.22 421.05 314.98 227.49 598.22 417.67 306.75 226.80
(4) Original conversion rates Oats 122.19 204.98 172.02 101.14 122.19 269.00 183.94 119.88
(5) Original conversion rates Total 1473.60 1414.46 1295.35 1049.00 1473.60 1622.11 1277.21 1089.72
(6) Broadberry et al.’s conversion rates) Wheat 548.19 735.53 839.66 820.81 548.19 900.04 823.29 847.25
(7) Broadberry et al.’s conversion rates) Rye 359.69 197.28 120.11 22.18 359.69 197.28 108.22 22.05
(8) Broadberry et al.’s conversion rates) Barley 467.31 320.68 233.73 126.43 467.31 318.10 227.63 126.05
(9) Broadberry et al.’s conversion rates) Oats 154.69 233.13 173.52 52.35 154.69 305.95 185.54 62.05
(10) Broadberry et al.’s conversion rates) Total 1529.88 1486.62 1367.02 1021.77 1529.88 1721.37 1344.68 1057.40
(11) Difference between (5) and (10) 56.28 72.16 71.67 (27.23) 56.28 99.26 67.47 (32.32)
Sources: See Table 12.
35 This article is © Emerald Group Publishing and permission has been granted for this version to appear here (http://strathprints.strath.ac.uk/50435/). Emerald does not grant permission for this article to be further copied/distributed or hosted elsewhere without the express permission from Emerald Group Publishing Limited.
Forthcoming in Research in Economic History, 31 (2015)
2.6. Meat and dairy products
Floud et al. and Broadberry et al. derived their estimates of the numbers of calories
from meat and dairy products from different sources. Broadberry et al. derived
their information from studies by John (1989, pp. 1042-6), Clark (1991, p. 216) and
Allen (2005, pp. 29, 33). Floud et al. drew their information from King (1696, pp.
54-5) and Holderness (1989, pp. 155, 170). They also sought to estimate the
number of calories derived from lard with information from US sources (Bennett and
Pierce, 1961, pp. 114-5).
Although meat and dairy products only accounted for a minority of total
calories between 1700 and 1850, the differences between the two sets of estimates
are noticeable. Broadberry et al. (2011, p. 59; forthcoming, Table 8.7) increased
the total value of ‘non-arable’ foods by adding 200 calories per person per day for
fish and poultry, whereas Floud et al. (2011, p. 156) only allowed 24 extra calories
from fish and made no allowances for poultry, game or rabbits before the twentieth
century. However, Broadberry et al.’s other estimates were much lower. They
suggested that the number of calories derived from beef, mutton, pork and dairy
products accounted for no more than 380 calories per day between 1700/09 and
1850/59, whereas Floud et al.’s estimates ranged from 538 calories to 786.
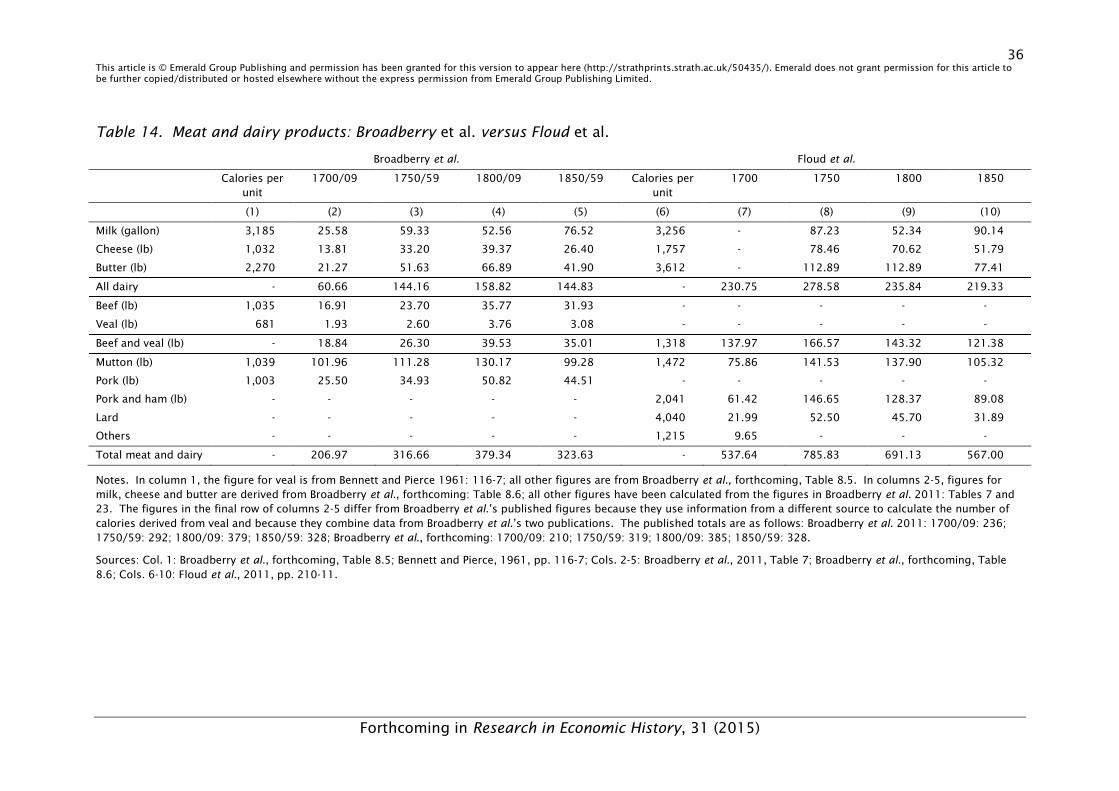
36 This article is © Emerald Group Publishing and permission has been granted for this version to appear here (http://strathprints.strath.ac.uk/50435/). Emerald does not grant permission for this article to be further copied/distributed or hosted elsewhere without the express permission from Emerald Group Publishing Limited.
Forthcoming in Research in Economic History, 31 (2015)
Table 14. Meat and dairy products: Broadberry et al. versus Floud et al.
Broadberry et al. Floud et al.
Calories per unit
1700/09 1750/59 1800/09 1850/59 Calories per unit
1700 1750 1800 1850
(1) (2) (3) (4) (5) (6) (7) (8) (9) (10)
Milk (gallon) 3,185 25.58 59.33 52.56 76.52 3,256 - 87.23 52.34 90.14
Cheese (lb) 1,032 13.81 33.20 39.37 26.40 1,757 - 78.46 70.62 51.79
Butter (lb) 2,270 21.27 51.63 66.89 41.90 3,612 - 112.89 112.89 77.41
All dairy - 60.66 144.16 158.82 144.83 - 230.75 278.58 235.84 219.33
Beef (lb) 1,035 16.91 23.70 35.77 31.93 - - - - -
Veal (lb) 681 1.93 2.60 3.76 3.08 - - - - -
Beef and veal (lb) - 18.84 26.30 39.53 35.01 1,318 137.97 166.57 143.32 121.38
Mutton (lb) 1,039 101.96 111.28 130.17 99.28 1,472 75.86 141.53 137.90 105.32
Pork (lb) 1,003 25.50 34.93 50.82 44.51 - - - - -
Pork and ham (lb) - - - - - 2,041 61.42 146.65 128.37 89.08
Lard - - - - - 4,040 21.99 52.50 45.70 31.89
Others - - - - - 1,215 9.65 - - -
Total meat and dairy - 206.97 316.66 379.34 323.63 - 537.64 785.83 691.13 567.00
Notes. In column 1, the figure for veal is from Bennett and Pierce 1961: 116-7; all other figures are from Broadberry et al., forthcoming, Table 8.5. In columns 2-5, figures for milk, cheese and butter are derived from Broadberry et al., forthcoming: Table 8.6; all other figures have been calculated from the figures in Broadberry et al. 2011: Tables 7 and 23. The figures in the final row of columns 2-5 differ from Broadberry et al.’s published figures because they use information from a different source to calculate the number of calories derived from veal and because they combine data from Broadberry et al.’s two publications. The published totals are as follows: Broadberry et al. 2011: 1700/09: 236; 1750/59: 292; 1800/09: 379; 1850/59: 328; Broadberry et al., forthcoming: 1700/09: 210; 1750/59: 319; 1800/09: 385; 1850/59: 328.
Sources: Col. 1: Broadberry et al., forthcoming, Table 8.5; Bennett and Pierce, 1961, pp. 116-7; Cols. 2-5: Broadberry et al., 2011, Table 7; Broadberry et al., forthcoming, Table 8.6; Cols. 6-10: Floud et al., 2011, pp. 210-11.
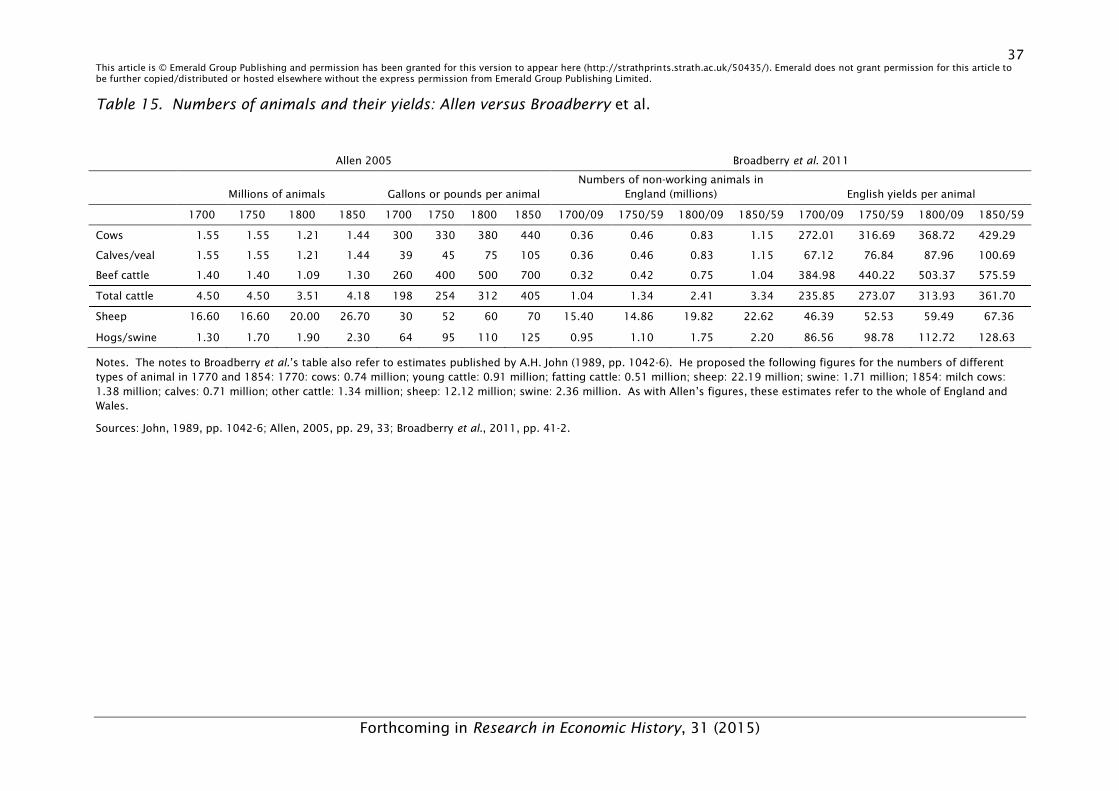
37 This article is © Emerald Group Publishing and permission has been granted for this version to appear here (http://strathprints.strath.ac.uk/50435/). Emerald does not grant permission for this article to be further copied/distributed or hosted elsewhere without the express permission from Emerald Group Publishing Limited.
Forthcoming in Research in Economic History, 31 (2015)
Table 15. Numbers of animals and their yields: Allen versus Broadberry et al.
Allen 2005 Broadberry et al. 2011
Millions of animals Gallons or pounds per animal Numbers of non-working animals in
England (millions) English yields per animal
1700 1750 1800 1850 1700 1750 1800 1850 1700/09 1750/59 1800/09 1850/59 1700/09 1750/59 1800/09 1850/59
Cows 1.55 1.55 1.21 1.44 300 330 380 440 0.36 0.46 0.83 1.15 272.01 316.69 368.72 429.29
Calves/veal 1.55 1.55 1.21 1.44 39 45 75 105 0.36 0.46 0.83 1.15 67.12 76.84 87.96 100.69
Beef cattle 1.40 1.40 1.09 1.30 260 400 500 700 0.32 0.42 0.75 1.04 384.98 440.22 503.37 575.59
Total cattle 4.50 4.50 3.51 4.18 198 254 312 405 1.04 1.34 2.41 3.34 235.85 273.07 313.93 361.70
Sheep 16.60 16.60 20.00 26.70 30 52 60 70 15.40 14.86 19.82 22.62 46.39 52.53 59.49 67.36
Hogs/swine 1.30 1.70 1.90 2.30 64 95 110 125 0.95 1.10 1.75 2.20 86.56 98.78 112.72 128.63
Notes. The notes to Broadberry et al.’s table also refer to estimates published by A.H. John (1989, pp. 1042-6). He proposed the following figures for the numbers of different types of animal in 1770 and 1854: 1770: cows: 0.74 million; young cattle: 0.91 million; fatting cattle: 0.51 million; sheep: 22.19 million; swine: 1.71 million; 1854: milch cows: 1.38 million; calves: 0.71 million; other cattle: 1.34 million; sheep: 12.12 million; swine: 2.36 million. As with Allen’s figures, these estimates refer to the whole of England and Wales.
Sources: John, 1989, pp. 1042-6; Allen, 2005, pp. 29, 33; Broadberry et al., 2011, pp. 41-2.
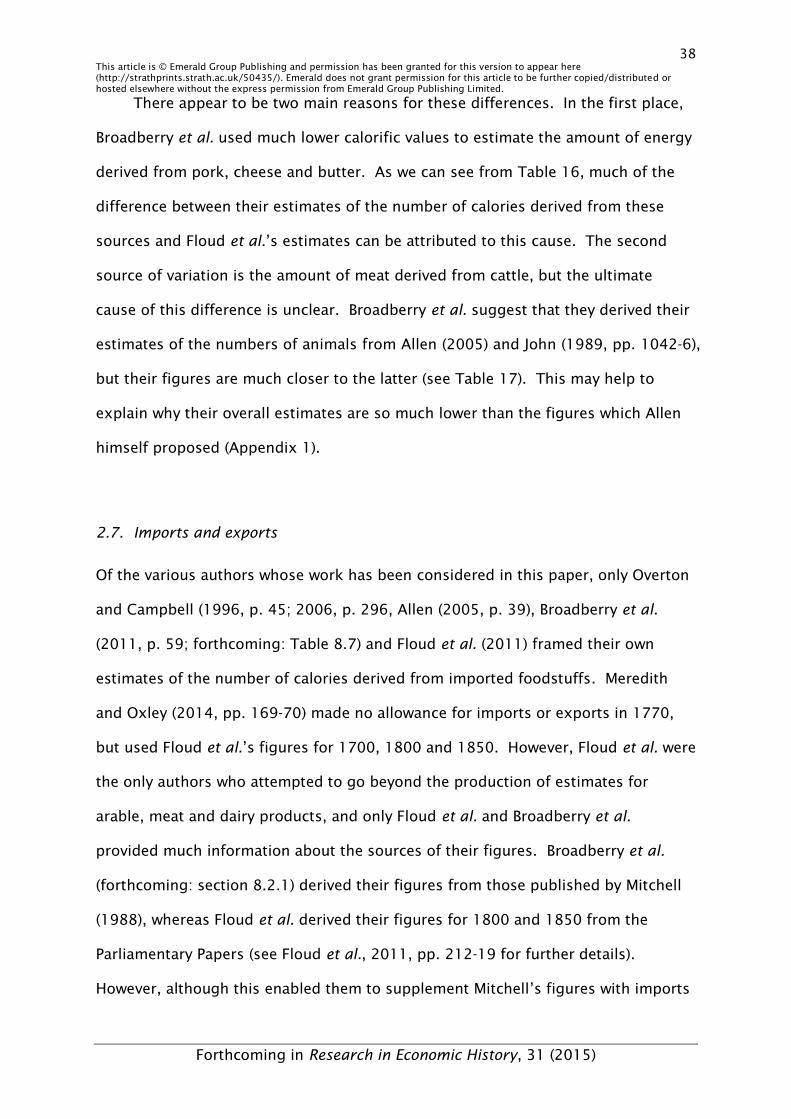
38 This article is © Emerald Group Publishing and permission has been granted for this version to appear here (http://strathprints.strath.ac.uk/50435/). Emerald does not grant permission for this article to be further copied/distributed or hosted elsewhere without the express permission from Emerald Group Publishing Limited.
Forthcoming in Research in Economic History, 31 (2015)
There appear to be two main reasons for these differences. In the first place,
Broadberry et al. used much lower calorific values to estimate the amount of energy
derived from pork, cheese and butter. As we can see from Table 16, much of the
difference between their estimates of the number of calories derived from these
sources and Floud et al.’s estimates can be attributed to this cause. The second
source of variation is the amount of meat derived from cattle, but the ultimate
cause of this difference is unclear. Broadberry et al. suggest that they derived their
estimates of the numbers of animals from Allen (2005) and John (1989, pp. 1042-6),
but their figures are much closer to the latter (see Table 17). This may help to
explain why their overall estimates are so much lower than the figures which Allen
himself proposed (Appendix 1).
2.7. Imports and exports
Of the various authors whose work has been considered in this paper, only Overton
and Campbell (1996, p. 45; 2006, p. 296, Allen (2005, p. 39), Broadberry et al.
(2011, p. 59; forthcoming: Table 8.7) and Floud et al. (2011) framed their own
estimates of the number of calories derived from imported foodstuffs. Meredith
and Oxley (2014, pp. 169-70) made no allowance for imports or exports in 1770,
but used Floud et al.’s figures for 1700, 1800 and 1850. However, Floud et al. were
the only authors who attempted to go beyond the production of estimates for
arable, meat and dairy products, and only Floud et al. and Broadberry et al.
provided much information about the sources of their figures. Broadberry et al.
(forthcoming: section 8.2.1) derived their figures from those published by Mitchell
(1988), whereas Floud et al. derived their figures for 1800 and 1850 from the
Parliamentary Papers (see Floud et al., 2011, pp. 212-19 for further details).
However, although this enabled them to supplement Mitchell’s figures with imports
39 This article is © Emerald Group Publishing and permission has been granted for this version to appear here (http://strathprints.strath.ac.uk/50435/). Emerald does not grant permission for this article to be further copied/distributed or hosted elsewhere without the express permission from Emerald Group Publishing Limited.
Forthcoming in Research in Economic History, 31 (2015)
of other cereals and pulses (including maize, rye, peas, beans, buckwheat, beer or
bigg and malt) their calorie totals were lower. This may have been because they
applied the same allowances for losses due to milling and distribution as they
applied to domestic cereals.
Overall, Broadberry et al.’s estimates differ from those published by Floud et
al. in two important respects (see Table 18). In the first place, they argued that the
calorific value of imported grain products increased steadily from the 1750s
onwards. Floud et al. argued that Britain was a net exporter of grain calories in
1700 and 1750, and – as we have already noted – they believed that the calorific
value of imported grains in 1800 and 1850 was below the level suggested by
Broadberry et al. for 1800/09 and 1850/59. The second major difference arises
from the fact that Floud et al. also estimated the calorific value of other imported
foods. Broadberry et al. (forthcoming, Table 8.10) acknowledged the importance of
sugar and other imported items when they discussed the per capita consumption of
imported luxury foodstuffs (including tobacco) but failed to incorporate these
figures in their estimation of food values.
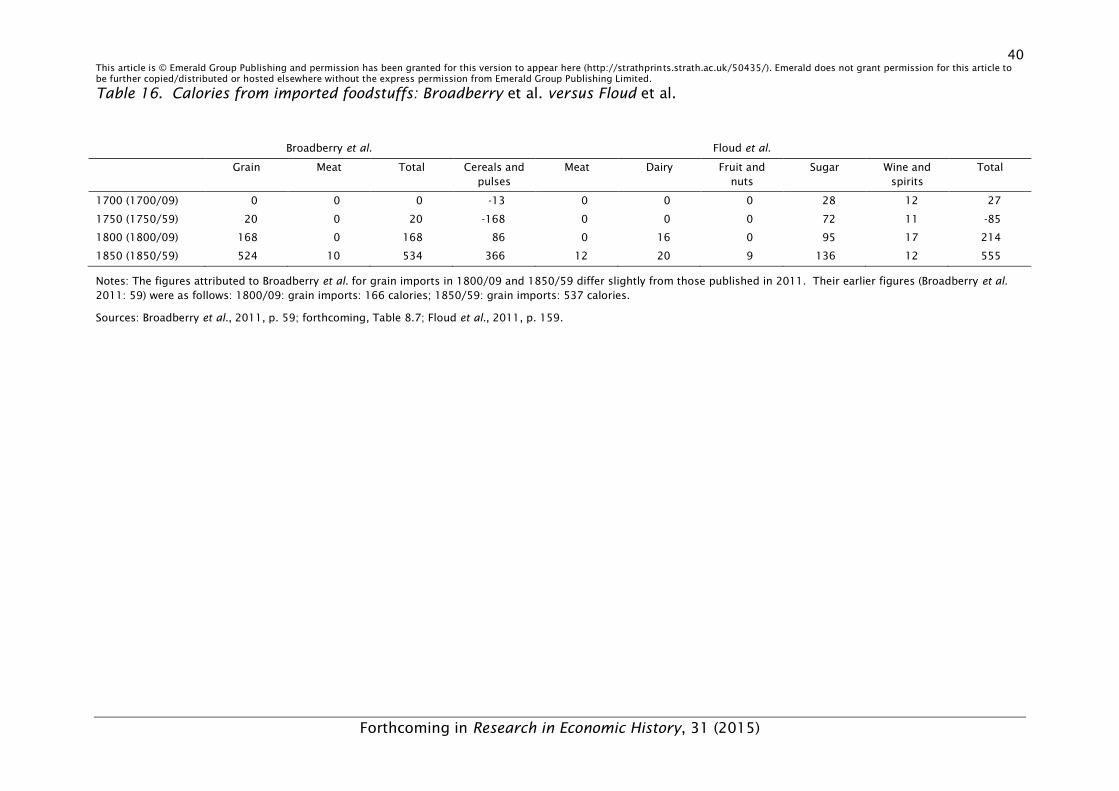
40 This article is © Emerald Group Publishing and permission has been granted for this version to appear here (http://strathprints.strath.ac.uk/50435/). Emerald does not grant permission for this article to be further copied/distributed or hosted elsewhere without the express permission from Emerald Group Publishing Limited.
Forthcoming in Research in Economic History, 31 (2015)
Table 16. Calories from imported foodstuffs: Broadberry et al. versus Floud et al.
Broadberry et al. Floud et al.
Grain Meat Total Cereals and pulses
Meat Dairy Fruit and nuts
Sugar Wine and spirits
Total
1700 (1700/09) 0 0 0 -13 0 0 0 28 12 27
1750 (1750/59) 20 0 20 -168 0 0 0 72 11 -85
1800 (1800/09) 168 0 168 86 0 16 0 95 17 214
1850 (1850/59) 524 10 534 366 12 20 9 136 12 555
Notes: The figures attributed to Broadberry et al. for grain imports in 1800/09 and 1850/59 differ slightly from those published in 2011. Their earlier figures (Broadberry et al. 2011: 59) were as follows: 1800/09: grain imports: 166 calories; 1850/59: grain imports: 537 calories.
Sources: Broadberry et al., 2011, p. 59; forthcoming, Table 8.7; Floud et al., 2011, p. 159.
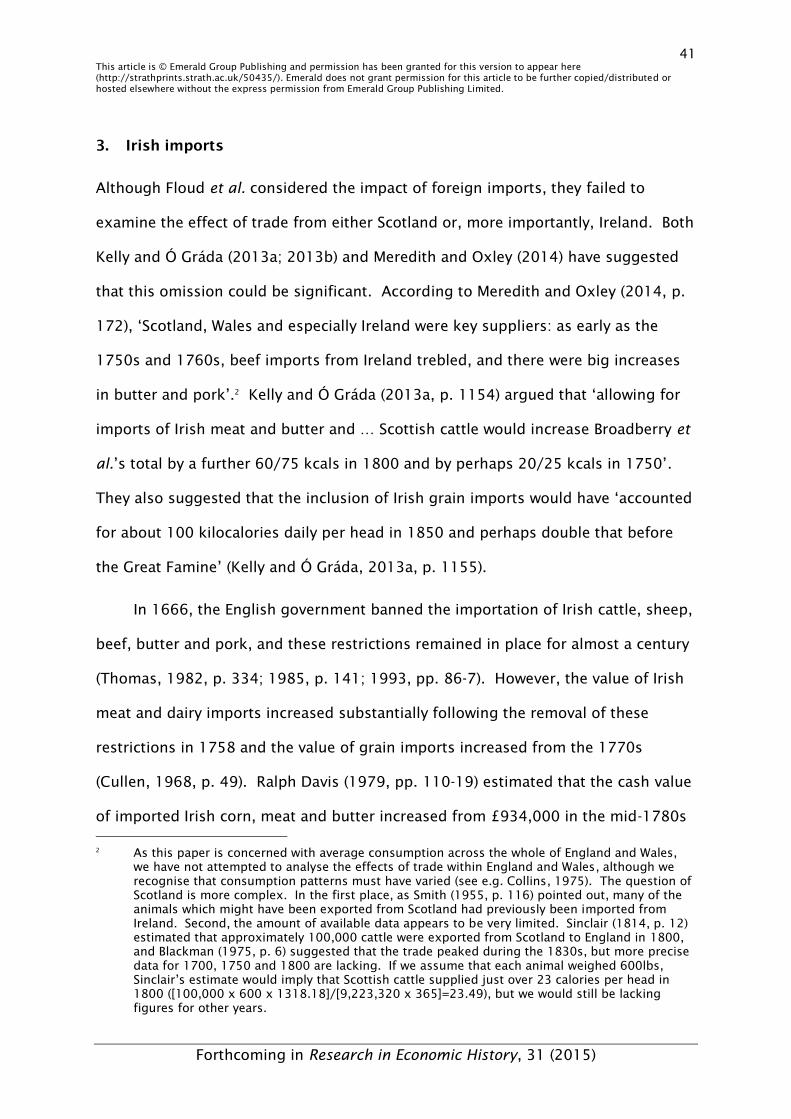
41 This article is © Emerald Group Publishing and permission has been granted for this version to appear here (http://strathprints.strath.ac.uk/50435/). Emerald does not grant permission for this article to be further copied/distributed or hosted elsewhere without the express permission from Emerald Group Publishing Limited.
Forthcoming in Research in Economic History, 31 (2015)
3. Irish imports
Although Floud et al. considered the impact of foreign imports, they failed to
examine the effect of trade from either Scotland or, more importantly, Ireland. Both
Kelly and Ó Gráda (2013a; 2013b) and Meredith and Oxley (2014) have suggested
that this omission could be significant. According to Meredith and Oxley (2014, p.
172), ‘Scotland, Wales and especially Ireland were key suppliers: as early as the
1750s and 1760s, beef imports from Ireland trebled, and there were big increases
in butter and pork’.2 Kelly and Ó Gráda (2013a, p. 1154) argued that ‘allowing for
imports of Irish meat and butter and … Scottish cattle would increase Broadberry et
al.’s total by a further 60/75 kcals in 1800 and by perhaps 20/25 kcals in 1750’.
They also suggested that the inclusion of Irish grain imports would have ‘accounted
for about 100 kilocalories daily per head in 1850 and perhaps double that before
the Great Famine’ (Kelly and Ó Gráda, 2013a, p. 1155).
In 1666, the English government banned the importation of Irish cattle, sheep,
beef, butter and pork, and these restrictions remained in place for almost a century
(Thomas, 1982, p. 334; 1985, p. 141; 1993, pp. 86-7). However, the value of Irish
meat and dairy imports increased substantially following the removal of these
restrictions in 1758 and the value of grain imports increased from the 1770s
(Cullen, 1968, p. 49). Ralph Davis (1979, pp. 110-19) estimated that the cash value
of imported Irish corn, meat and butter increased from £934,000 in the mid-1780s 2 As this paper is concerned with average consumption across the whole of England and Wales,
we have not attempted to analyse the effects of trade within England and Wales, although we recognise that consumption patterns must have varied (see e.g. Collins, 1975). The question of Scotland is more complex. In the first place, as Smith (1955, p. 116) pointed out, many of the animals which might have been exported from Scotland had previously been imported from Ireland. Second, the amount of available data appears to be very limited. Sinclair (1814, p. 12) estimated that approximately 100,000 cattle were exported from Scotland to England in 1800, and Blackman (1975, p. 6) suggested that the trade peaked during the 1830s, but more precise data for 1700, 1750 and 1800 are lacking. If we assume that each animal weighed 600lbs, Sinclair’s estimate would imply that Scottish cattle supplied just over 23 calories per head in 1800 ([100,000 x 600 x 1318.18]/[9,223,320 x 365]=23.49), but we would still be lacking figures for other years.
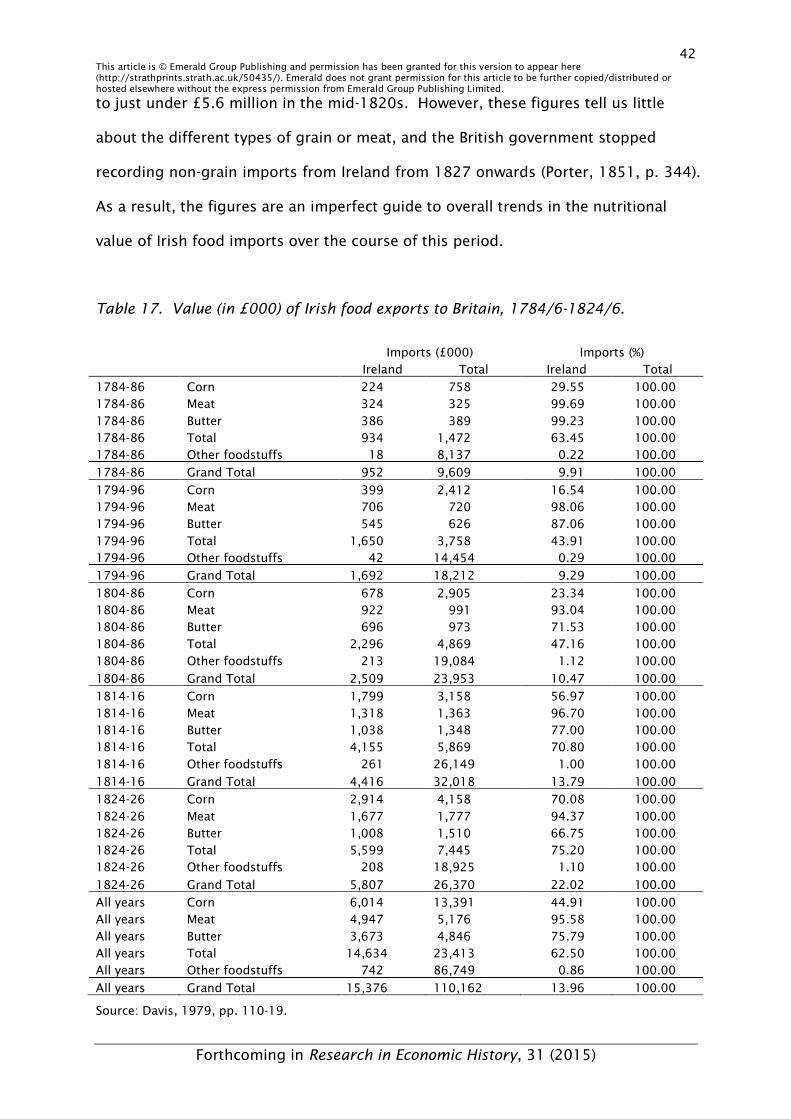
42 This article is © Emerald Group Publishing and permission has been granted for this version to appear here (http://strathprints.strath.ac.uk/50435/). Emerald does not grant permission for this article to be further copied/distributed or hosted elsewhere without the express permission from Emerald Group Publishing Limited.
Forthcoming in Research in Economic History, 31 (2015)
to just under £5.6 million in the mid-1820s. However, these figures tell us little
about the different types of grain or meat, and the British government stopped
recording non-grain imports from Ireland from 1827 onwards (Porter, 1851, p. 344).
As a result, the figures are an imperfect guide to overall trends in the nutritional
value of Irish food imports over the course of this period.
Table 17. Value (in £000) of Irish food exports to Britain, 1784/6-1824/6.
Imports (£000) Imports (%)
Ireland Total Ireland Total
1784-86 Corn 224 758 29.55 100.00 1784-86 Meat 324 325 99.69 100.00
1784-86 Butter 386 389 99.23 100.00 1784-86 Total 934 1,472 63.45 100.00 1784-86 Other foodstuffs 18 8,137 0.22 100.00
1784-86 Grand Total 952 9,609 9.91 100.00
1794-96 Corn 399 2,412 16.54 100.00 1794-96 Meat 706 720 98.06 100.00 1794-96 Butter 545 626 87.06 100.00
1794-96 Total 1,650 3,758 43.91 100.00 1794-96 Other foodstuffs 42 14,454 0.29 100.00
1794-96 Grand Total 1,692 18,212 9.29 100.00
1804-86 Corn 678 2,905 23.34 100.00 1804-86 Meat 922 991 93.04 100.00 1804-86 Butter 696 973 71.53 100.00 1804-86 Total 2,296 4,869 47.16 100.00
1804-86 Other foodstuffs 213 19,084 1.12 100.00
1804-86 Grand Total 2,509 23,953 10.47 100.00
1814-16 Corn 1,799 3,158 56.97 100.00 1814-16 Meat 1,318 1,363 96.70 100.00 1814-16 Butter 1,038 1,348 77.00 100.00 1814-16 Total 4,155 5,869 70.80 100.00
1814-16 Other foodstuffs 261 26,149 1.00 100.00
1814-16 Grand Total 4,416 32,018 13.79 100.00
1824-26 Corn 2,914 4,158 70.08 100.00
1824-26 Meat 1,677 1,777 94.37 100.00 1824-26 Butter 1,008 1,510 66.75 100.00 1824-26 Total 5,599 7,445 75.20 100.00 1824-26 Other foodstuffs 208 18,925 1.10 100.00
1824-26 Grand Total 5,807 26,370 22.02 100.00
All years Corn 6,014 13,391 44.91 100.00 All years Meat 4,947 5,176 95.58 100.00
All years Butter 3,673 4,846 75.79 100.00 All years Total 14,634 23,413 62.50 100.00 All years Other foodstuffs 742 86,749 0.86 100.00
All years Grand Total 15,376 110,162 13.96 100.00
Source: Davis, 1979, pp. 110-19.
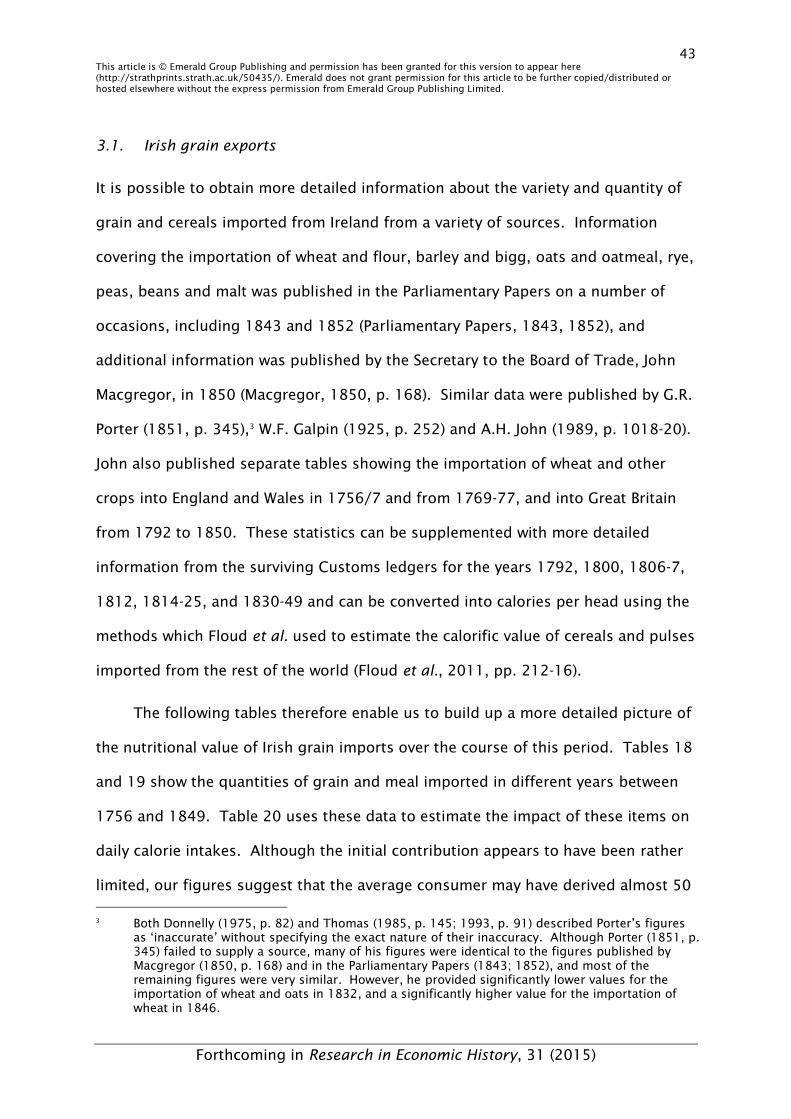
43 This article is © Emerald Group Publishing and permission has been granted for this version to appear here (http://strathprints.strath.ac.uk/50435/). Emerald does not grant permission for this article to be further copied/distributed or hosted elsewhere without the express permission from Emerald Group Publishing Limited.
Forthcoming in Research in Economic History, 31 (2015)
3.1. Irish grain exports
It is possible to obtain more detailed information about the variety and quantity of
grain and cereals imported from Ireland from a variety of sources. Information
covering the importation of wheat and flour, barley and bigg, oats and oatmeal, rye,
peas, beans and malt was published in the Parliamentary Papers on a number of
occasions, including 1843 and 1852 (Parliamentary Papers, 1843, 1852), and
additional information was published by the Secretary to the Board of Trade, John
Macgregor, in 1850 (Macgregor, 1850, p. 168). Similar data were published by G.R.
Porter (1851, p. 345),3 W.F. Galpin (1925, p. 252) and A.H. John (1989, p. 1018-20).
John also published separate tables showing the importation of wheat and other
crops into England and Wales in 1756/7 and from 1769-77, and into Great Britain
from 1792 to 1850. These statistics can be supplemented with more detailed
information from the surviving Customs ledgers for the years 1792, 1800, 1806-7,
1812, 1814-25, and 1830-49 and can be converted into calories per head using the
methods which Floud et al. used to estimate the calorific value of cereals and pulses
imported from the rest of the world (Floud et al., 2011, pp. 212-16).
The following tables therefore enable us to build up a more detailed picture of
the nutritional value of Irish grain imports over the course of this period. Tables 18
and 19 show the quantities of grain and meal imported in different years between
1756 and 1849. Table 20 uses these data to estimate the impact of these items on
daily calorie intakes. Although the initial contribution appears to have been rather
limited, our figures suggest that the average consumer may have derived almost 50
3 Both Donnelly (1975, p. 82) and Thomas (1985, p. 145; 1993, p. 91) described Porter’s figures
as ‘inaccurate’ without specifying the exact nature of their inaccuracy. Although Porter (1851, p. 345) failed to supply a source, many of his figures were identical to the figures published by Macgregor (1850, p. 168) and in the Parliamentary Papers (1843; 1852), and most of the remaining figures were very similar. However, he provided significantly lower values for the importation of wheat and oats in 1832, and a significantly higher value for the importation of wheat in 1846.
44 This article is © Emerald Group Publishing and permission has been granted for this version to appear here (http://strathprints.strath.ac.uk/50435/). Emerald does not grant permission for this article to be further copied/distributed or hosted elsewhere without the express permission from Emerald Group Publishing Limited.
Forthcoming in Research in Economic History, 31 (2015)
calories per day from Irish grain imports by 1792. However the number of calories
declined during the remainder of the decade and fell dramatically during the early
years of the Napoleonic War, before recovering. It then rose substantially after
1815 and reached a peak of 183 calories per head at the end of the 1830s. The
calorific value of Irish grain imports fluctuated during the first half of the 1840s
before declining dramatically during the Famine years.
These figures suggest that, over the period as a whole, Irish grain imports did
indeed make a substantial contribution to the British diet but a focus on individual
years, such as 1800, could be misleading. As a result, when adding these data to
our existing information for this year, it may be more appropriate to use the results
for 1799. The interpretation of the figures for 1850 is more complex. In the first
place, although data do exist for this year, they do not distinguish between grain
and flour; and, second, even the published data suggest that the volume of imports
had still not regained pre-Famine levels (see Parliamentary Papers, 1852). We have
therefore decided to use the data for 1849, but with the caveat that these data do
underestimate the extent of Ireland’s contribution in previous years.4
4 Having said this, it should also be noted that there was a substantial increase in the volume of
non-Irish food imports from overseas during the 1840s. Net imports of wheat, flour, barley and oats more than doubled between 1840 and 1849 (Mitchell, 1988, p. 225).
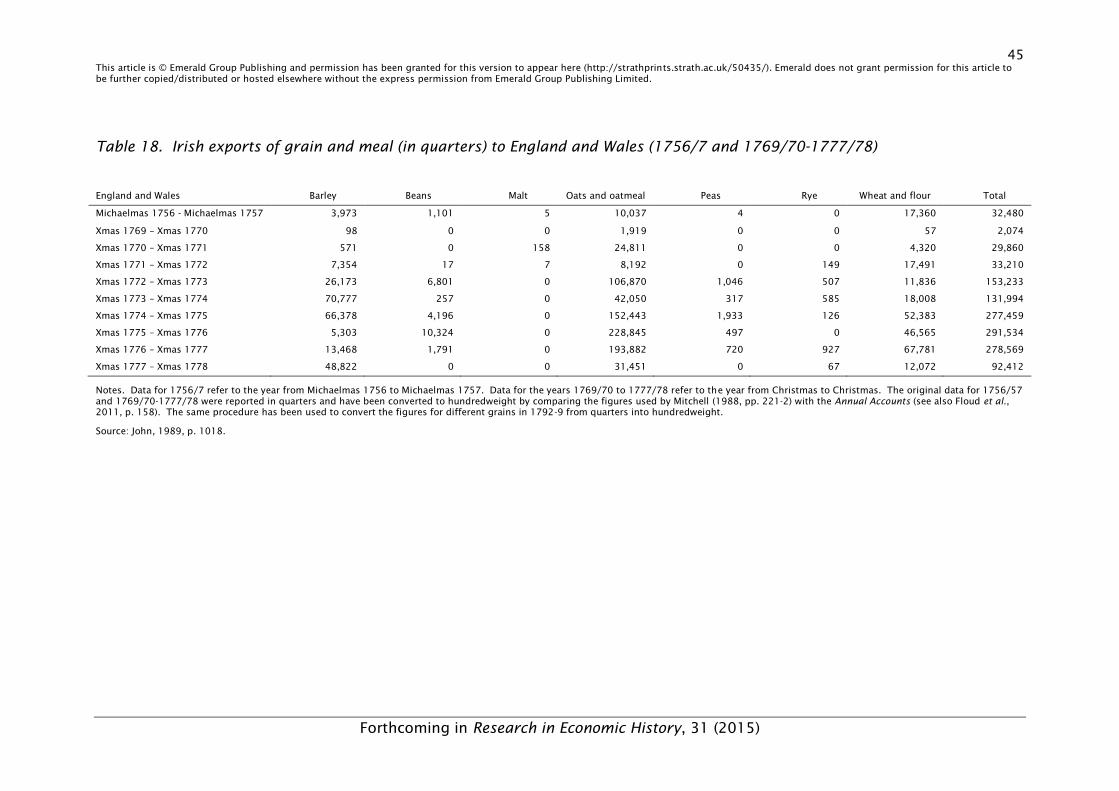
45 This article is © Emerald Group Publishing and permission has been granted for this version to appear here (http://strathprints.strath.ac.uk/50435/). Emerald does not grant permission for this article to be further copied/distributed or hosted elsewhere without the express permission from Emerald Group Publishing Limited.
Forthcoming in Research in Economic History, 31 (2015)
Table 18. Irish exports of grain and meal (in quarters) to England and Wales (1756/7 and 1769/70-1777/78)
England and Wales Barley Beans Malt Oats and oatmeal Peas Rye Wheat and flour Total
Michaelmas 1756 - Michaelmas 1757 3,973 1,101 5 10,037 4 0 17,360 32,480
Xmas 1769 – Xmas 1770 98 0 0 1,919 0 0 57 2,074
Xmas 1770 – Xmas 1771 571 0 158 24,811 0 0 4,320 29,860
Xmas 1771 – Xmas 1772 7,354 17 7 8,192 0 149 17,491 33,210
Xmas 1772 – Xmas 1773 26,173 6,801 0 106,870 1,046 507 11,836 153,233
Xmas 1773 – Xmas 1774 70,777 257 0 42,050 317 585 18,008 131,994
Xmas 1774 – Xmas 1775 66,378 4,196 0 152,443 1,933 126 52,383 277,459
Xmas 1775 – Xmas 1776 5,303 10,324 0 228,845 497 0 46,565 291,534
Xmas 1776 – Xmas 1777 13,468 1,791 0 193,882 720 927 67,781 278,569
Xmas 1777 – Xmas 1778 48,822 0 0 31,451 0 67 12,072 92,412
Notes. Data for 1756/7 refer to the year from Michaelmas 1756 to Michaelmas 1757. Data for the years 1769/70 to 1777/78 refer to the year from Christmas to Christmas. The original data for 1756/57 and 1769/70-1777/78 were reported in quarters and have been converted to hundredweight by comparing the figures used by Mitchell (1988, pp. 221-2) with the Annual Accounts (see also Floud et al., 2011, p. 158). The same procedure has been used to convert the figures for different grains in 1792-9 from quarters into hundredweight.
Source: John, 1989, p. 1018.
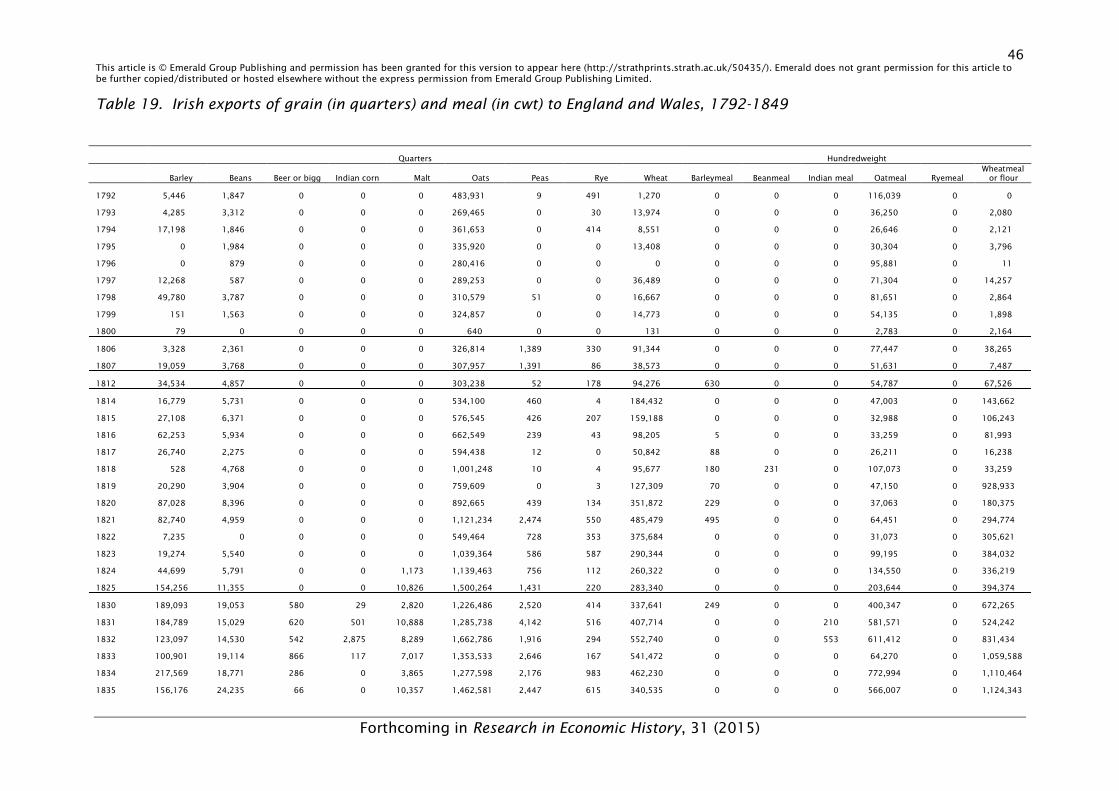
46 This article is © Emerald Group Publishing and permission has been granted for this version to appear here (http://strathprints.strath.ac.uk/50435/). Emerald does not grant permission for this article to be further copied/distributed or hosted elsewhere without the express permission from Emerald Group Publishing Limited.
Forthcoming in Research in Economic History, 31 (2015)
Table 19. Irish exports of grain (in quarters) and meal (in cwt) to England and Wales, 1792-1849
Quarters Hundredweight
Barley Beans Beer or bigg Indian corn Malt Oats Peas Rye Wheat Barleymeal Beanmeal Indian meal Oatmeal Ryemeal Wheatmeal
or flour
1792 5,446 1,847 0 0 0 483,931 9 491 1,270 0 0 0 116,039 0 0
1793 4,285 3,312 0 0 0 269,465 0 30 13,974 0 0 0 36,250 0 2,080
1794 17,198 1,846 0 0 0 361,653 0 414 8,551 0 0 0 26,646 0 2,121
1795 0 1,984 0 0 0 335,920 0 0 13,408 0 0 0 30,304 0 3,796
1796 0 879 0 0 0 280,416 0 0 0 0 0 0 95,881 0 11
1797 12,268 587 0 0 0 289,253 0 0 36,489 0 0 0 71,304 0 14,257
1798 49,780 3,787 0 0 0 310,579 51 0 16,667 0 0 0 81,651 0 2,864
1799 151 1,563 0 0 0 324,857 0 0 14,773 0 0 0 54,135 0 1,898
1800 79 0 0 0 0 640 0 0 131 0 0 0 2,783 0 2,164
1806 3,328 2,361 0 0 0 326,814 1,389 330 91,344 0 0 0 77,447 0 38,265
1807 19,059 3,768 0 0 0 307,957 1,391 86 38,573 0 0 0 51,631 0 7,487
1812 34,534 4,857 0 0 0 303,238 52 178 94,276 630 0 0 54,787 0 67,526
1814 16,779 5,731 0 0 0 534,100 460 4 184,432 0 0 0 47,003 0 143,662
1815 27,108 6,371 0 0 0 576,545 426 207 159,188 0 0 0 32,988 0 106,243
1816 62,253 5,934 0 0 0 662,549 239 43 98,205 5 0 0 33,259 0 81,993
1817 26,740 2,275 0 0 0 594,438 12 0 50,842 88 0 0 26,211 0 16,238
1818 528 4,768 0 0 0 1,001,248 10 4 95,677 180 231 0 107,073 0 33,259
1819 20,290 3,904 0 0 0 759,609 0 3 127,309 70 0 0 47,150 0 928,933
1820 87,028 8,396 0 0 0 892,665 439 134 351,872 229 0 0 37,063 0 180,375
1821 82,740 4,959 0 0 0 1,121,234 2,474 550 485,479 495 0 0 64,451 0 294,774
1822 7,235 0 0 0 0 549,464 728 353 375,684 0 0 0 31,073 0 305,621
1823 19,274 5,540 0 0 0 1,039,364 586 587 290,344 0 0 0 99,195 0 384,032
1824 44,699 5,791 0 0 1,173 1,139,463 756 112 260,322 0 0 0 134,550 0 336,219
1825 154,256 11,355 0 0 10,826 1,500,264 1,431 220 283,340 0 0 0 203,644 0 394,374
1830 189,093 19,053 580 29 2,820 1,226,486 2,520 414 337,641 249 0 0 400,347 0 672,265
1831 184,789 15,029 620 501 10,888 1,285,738 4,142 516 407,714 0 0 210 581,571 0 524,242
1832 123,097 14,530 542 2,875 8,289 1,662,786 1,916 294 552,740 0 0 553 611,412 0 831,434
1833 100,901 19,114 866 117 7,017 1,353,533 2,646 167 541,472 0 0 0 64,270 0 1,059,588
1834 217,569 18,771 286 0 3,865 1,277,598 2,176 983 462,230 0 0 0 772,994 0 1,110,464
1835 156,176 24,235 66 0 10,357 1,462,581 2,447 615 340,535 0 0 0 566,007 0 1,124,343
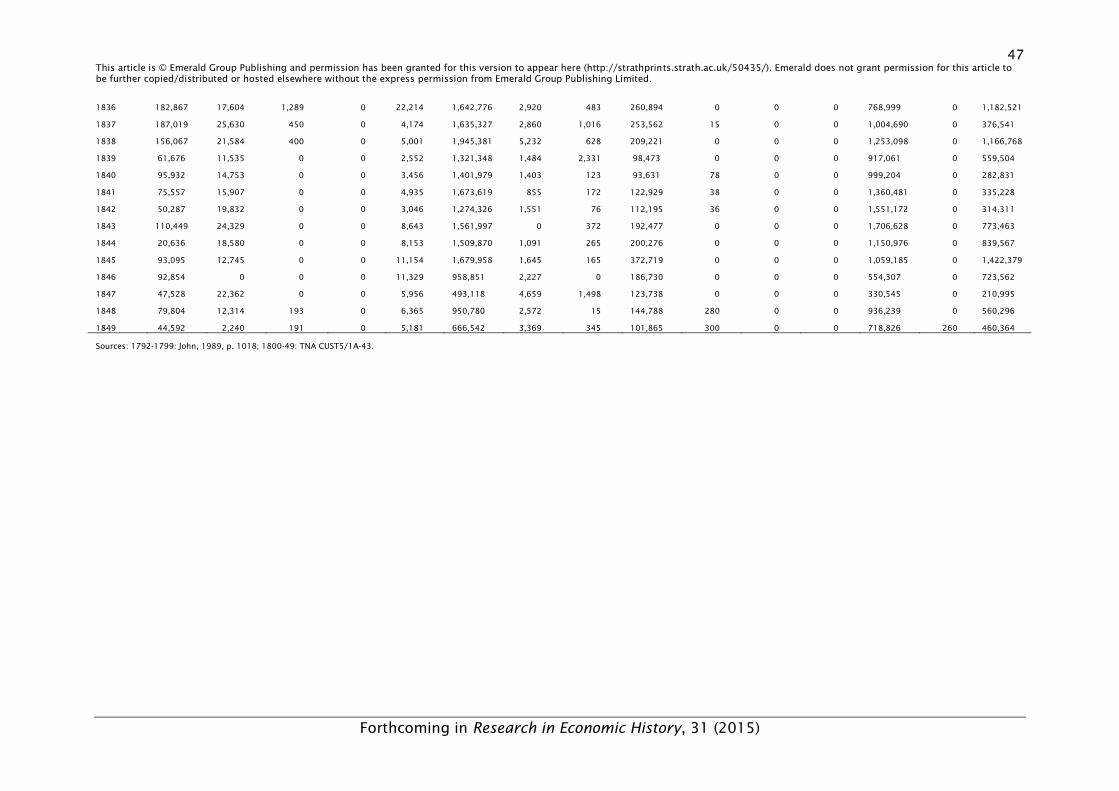
47 This article is © Emerald Group Publishing and permission has been granted for this version to appear here (http://strathprints.strath.ac.uk/50435/). Emerald does not grant permission for this article to be further copied/distributed or hosted elsewhere without the express permission from Emerald Group Publishing Limited.
Forthcoming in Research in Economic History, 31 (2015)
1836 182,867 17,604 1,289 0 22,214 1,642,776 2,920 483 260,894 0 0 0 768,999 0 1,182,521
1837 187,019 25,630 450 0 4,174 1,635,327 2,860 1,016 253,562 15 0 0 1,004,690 0 376,541
1838 156,067 21,584 400 0 5,001 1,945,381 5,232 628 209,221 0 0 0 1,253,098 0 1,166,768
1839 61,676 11,535 0 0 2,552 1,321,348 1,484 2,331 98,473 0 0 0 917,061 0 559,504
1840 95,932 14,753 0 0 3,456 1,401,979 1,403 123 93,631 78 0 0 999,204 0 282,831
1841 75,557 15,907 0 0 4,935 1,673,619 855 172 122,929 38 0 0 1,360,481 0 335,228
1842 50,287 19,832 0 0 3,046 1,274,326 1,551 76 112,195 36 0 0 1,551,172 0 314,311
1843 110,449 24,329 0 0 8,643 1,561,997 0 372 192,477 0 0 0 1,706,628 0 773,463
1844 20,636 18,580 0 0 8,153 1,509,870 1,091 265 200,276 0 0 0 1,150,976 0 839,567
1845 93,095 12,745 0 0 11,154 1,679,958 1,645 165 372,719 0 0 0 1,059,185 0 1,422,379
1846 92,854 0 0 0 11,329 958,851 2,227 0 186,730 0 0 0 554,307 0 723,562
1847 47,528 22,362 0 0 5,956 493,118 4,659 1,498 123,738 0 0 0 330,545 0 210,995
1848 79,804 12,314 193 0 6,365 950,780 2,572 15 144,788 280 0 0 936,239 0 560,296
1849 44,592 2,240 191 0 5,181 666,542 3,369 345 101,865 300 0 0 718,826 260 460,364
Sources: 1792-1799: John, 1989, p. 1018; 1800-49: TNA CUST5/1A-43.
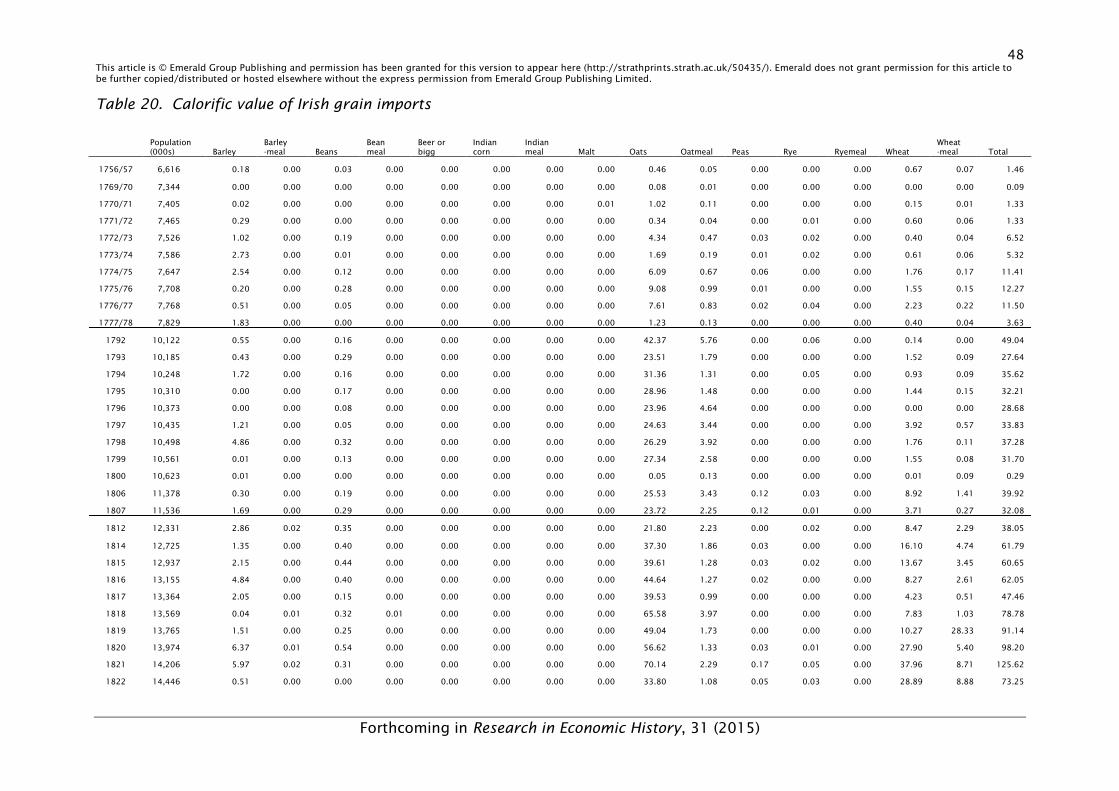
48 This article is © Emerald Group Publishing and permission has been granted for this version to appear here (http://strathprints.strath.ac.uk/50435/). Emerald does not grant permission for this article to be further copied/distributed or hosted elsewhere without the express permission from Emerald Group Publishing Limited.
Forthcoming in Research in Economic History, 31 (2015)
Table 20. Calorific value of Irish grain imports
Population (000s) Barley
Barley -meal Beans
Bean meal
Beer or bigg
Indian corn
Indian meal Malt Oats Oatmeal Peas Rye Ryemeal Wheat
Wheat -meal Total
1756/57 6,616 0.18 0.00 0.03 0.00 0.00 0.00 0.00 0.00 0.46 0.05 0.00 0.00 0.00 0.67 0.07 1.46
1769/70 7,344 0.00 0.00 0.00 0.00 0.00 0.00 0.00 0.00 0.08 0.01 0.00 0.00 0.00 0.00 0.00 0.09
1770/71 7,405 0.02 0.00 0.00 0.00 0.00 0.00 0.00 0.01 1.02 0.11 0.00 0.00 0.00 0.15 0.01 1.33
1771/72 7,465 0.29 0.00 0.00 0.00 0.00 0.00 0.00 0.00 0.34 0.04 0.00 0.01 0.00 0.60 0.06 1.33
1772/73 7,526 1.02 0.00 0.19 0.00 0.00 0.00 0.00 0.00 4.34 0.47 0.03 0.02 0.00 0.40 0.04 6.52
1773/74 7,586 2.73 0.00 0.01 0.00 0.00 0.00 0.00 0.00 1.69 0.19 0.01 0.02 0.00 0.61 0.06 5.32
1774/75 7,647 2.54 0.00 0.12 0.00 0.00 0.00 0.00 0.00 6.09 0.67 0.06 0.00 0.00 1.76 0.17 11.41
1775/76 7,708 0.20 0.00 0.28 0.00 0.00 0.00 0.00 0.00 9.08 0.99 0.01 0.00 0.00 1.55 0.15 12.27
1776/77 7,768 0.51 0.00 0.05 0.00 0.00 0.00 0.00 0.00 7.61 0.83 0.02 0.04 0.00 2.23 0.22 11.50
1777/78 7,829 1.83 0.00 0.00 0.00 0.00 0.00 0.00 0.00 1.23 0.13 0.00 0.00 0.00 0.40 0.04 3.63
1792 10,122 0.55 0.00 0.16 0.00 0.00 0.00 0.00 0.00 42.37 5.76 0.00 0.06 0.00 0.14 0.00 49.04
1793 10,185 0.43 0.00 0.29 0.00 0.00 0.00 0.00 0.00 23.51 1.79 0.00 0.00 0.00 1.52 0.09 27.64
1794 10,248 1.72 0.00 0.16 0.00 0.00 0.00 0.00 0.00 31.36 1.31 0.00 0.05 0.00 0.93 0.09 35.62
1795 10,310 0.00 0.00 0.17 0.00 0.00 0.00 0.00 0.00 28.96 1.48 0.00 0.00 0.00 1.44 0.15 32.21
1796 10,373 0.00 0.00 0.08 0.00 0.00 0.00 0.00 0.00 23.96 4.64 0.00 0.00 0.00 0.00 0.00 28.68
1797 10,435 1.21 0.00 0.05 0.00 0.00 0.00 0.00 0.00 24.63 3.44 0.00 0.00 0.00 3.92 0.57 33.83
1798 10,498 4.86 0.00 0.32 0.00 0.00 0.00 0.00 0.00 26.29 3.92 0.00 0.00 0.00 1.76 0.11 37.28
1799 10,561 0.01 0.00 0.13 0.00 0.00 0.00 0.00 0.00 27.34 2.58 0.00 0.00 0.00 1.55 0.08 31.70
1800 10,623 0.01 0.00 0.00 0.00 0.00 0.00 0.00 0.00 0.05 0.13 0.00 0.00 0.00 0.01 0.09 0.29
1806 11,378 0.30 0.00 0.19 0.00 0.00 0.00 0.00 0.00 25.53 3.43 0.12 0.03 0.00 8.92 1.41 39.92
1807 11,536 1.69 0.00 0.29 0.00 0.00 0.00 0.00 0.00 23.72 2.25 0.12 0.01 0.00 3.71 0.27 32.08
1812 12,331 2.86 0.02 0.35 0.00 0.00 0.00 0.00 0.00 21.80 2.23 0.00 0.02 0.00 8.47 2.29 38.05
1814 12,725 1.35 0.00 0.40 0.00 0.00 0.00 0.00 0.00 37.30 1.86 0.03 0.00 0.00 16.10 4.74 61.79
1815 12,937 2.15 0.00 0.44 0.00 0.00 0.00 0.00 0.00 39.61 1.28 0.03 0.02 0.00 13.67 3.45 60.65
1816 13,155 4.84 0.00 0.40 0.00 0.00 0.00 0.00 0.00 44.64 1.27 0.02 0.00 0.00 8.27 2.61 62.05
1817 13,364 2.05 0.00 0.15 0.00 0.00 0.00 0.00 0.00 39.53 0.99 0.00 0.00 0.00 4.23 0.51 47.46
1818 13,569 0.04 0.01 0.32 0.01 0.00 0.00 0.00 0.00 65.58 3.97 0.00 0.00 0.00 7.83 1.03 78.78
1819 13,765 1.51 0.00 0.25 0.00 0.00 0.00 0.00 0.00 49.04 1.73 0.00 0.00 0.00 10.27 28.33 91.14
1820 13,974 6.37 0.01 0.54 0.00 0.00 0.00 0.00 0.00 56.62 1.33 0.03 0.01 0.00 27.90 5.40 98.20
1821 14,206 5.97 0.02 0.31 0.00 0.00 0.00 0.00 0.00 70.14 2.29 0.17 0.05 0.00 37.96 8.71 125.62
1822 14,446 0.51 0.00 0.00 0.00 0.00 0.00 0.00 0.00 33.80 1.08 0.05 0.03 0.00 28.89 8.88 73.25
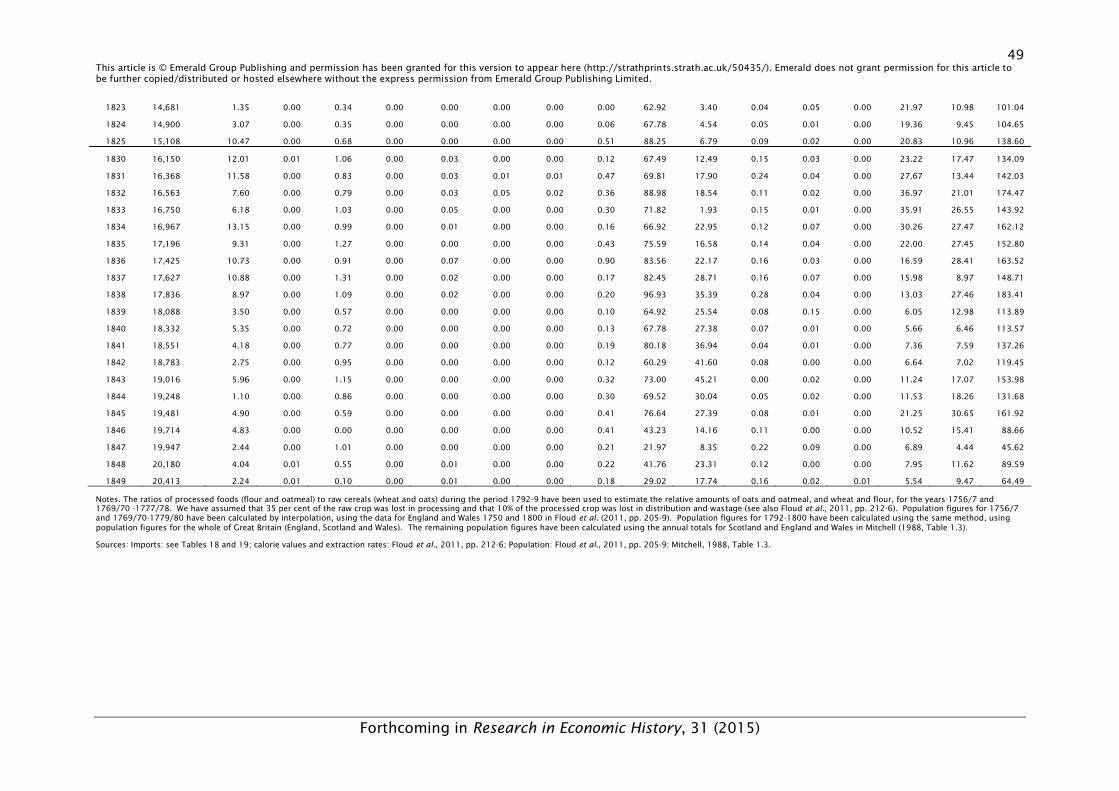
49 This article is © Emerald Group Publishing and permission has been granted for this version to appear here (http://strathprints.strath.ac.uk/50435/). Emerald does not grant permission for this article to be further copied/distributed or hosted elsewhere without the express permission from Emerald Group Publishing Limited.
Forthcoming in Research in Economic History, 31 (2015)
1823 14,681 1.35 0.00 0.34 0.00 0.00 0.00 0.00 0.00 62.92 3.40 0.04 0.05 0.00 21.97 10.98 101.04
1824 14,900 3.07 0.00 0.35 0.00 0.00 0.00 0.00 0.06 67.78 4.54 0.05 0.01 0.00 19.36 9.45 104.65
1825 15,108 10.47 0.00 0.68 0.00 0.00 0.00 0.00 0.51 88.25 6.79 0.09 0.02 0.00 20.83 10.96 138.60
1830 16,150 12.01 0.01 1.06 0.00 0.03 0.00 0.00 0.12 67.49 12.49 0.15 0.03 0.00 23.22 17.47 134.09
1831 16,368 11.58 0.00 0.83 0.00 0.03 0.01 0.01 0.47 69.81 17.90 0.24 0.04 0.00 27.67 13.44 142.03
1832 16,563 7.60 0.00 0.79 0.00 0.03 0.05 0.02 0.36 88.98 18.54 0.11 0.02 0.00 36.97 21.01 174.47
1833 16,750 6.18 0.00 1.03 0.00 0.05 0.00 0.00 0.30 71.82 1.93 0.15 0.01 0.00 35.91 26.55 143.92
1834 16,967 13.15 0.00 0.99 0.00 0.01 0.00 0.00 0.16 66.92 22.95 0.12 0.07 0.00 30.26 27.47 162.12
1835 17,196 9.31 0.00 1.27 0.00 0.00 0.00 0.00 0.43 75.59 16.58 0.14 0.04 0.00 22.00 27.45 152.80
1836 17,425 10.73 0.00 0.91 0.00 0.07 0.00 0.00 0.90 83.56 22.17 0.16 0.03 0.00 16.59 28.41 163.52
1837 17,627 10.88 0.00 1.31 0.00 0.02 0.00 0.00 0.17 82.45 28.71 0.16 0.07 0.00 15.98 8.97 148.71
1838 17,836 8.97 0.00 1.09 0.00 0.02 0.00 0.00 0.20 96.93 35.39 0.28 0.04 0.00 13.03 27.46 183.41
1839 18,088 3.50 0.00 0.57 0.00 0.00 0.00 0.00 0.10 64.92 25.54 0.08 0.15 0.00 6.05 12.98 113.89
1840 18,332 5.35 0.00 0.72 0.00 0.00 0.00 0.00 0.13 67.78 27.38 0.07 0.01 0.00 5.66 6.46 113.57
1841 18,551 4.18 0.00 0.77 0.00 0.00 0.00 0.00 0.19 80.18 36.94 0.04 0.01 0.00 7.36 7.59 137.26
1842 18,783 2.75 0.00 0.95 0.00 0.00 0.00 0.00 0.12 60.29 41.60 0.08 0.00 0.00 6.64 7.02 119.45
1843 19,016 5.96 0.00 1.15 0.00 0.00 0.00 0.00 0.32 73.00 45.21 0.00 0.02 0.00 11.24 17.07 153.98
1844 19,248 1.10 0.00 0.86 0.00 0.00 0.00 0.00 0.30 69.52 30.04 0.05 0.02 0.00 11.53 18.26 131.68
1845 19,481 4.90 0.00 0.59 0.00 0.00 0.00 0.00 0.41 76.64 27.39 0.08 0.01 0.00 21.25 30.65 161.92
1846 19,714 4.83 0.00 0.00 0.00 0.00 0.00 0.00 0.41 43.23 14.16 0.11 0.00 0.00 10.52 15.41 88.66
1847 19,947 2.44 0.00 1.01 0.00 0.00 0.00 0.00 0.21 21.97 8.35 0.22 0.09 0.00 6.89 4.44 45.62
1848 20,180 4.04 0.01 0.55 0.00 0.01 0.00 0.00 0.22 41.76 23.31 0.12 0.00 0.00 7.95 11.62 89.59
1849 20,413 2.24 0.01 0.10 0.00 0.01 0.00 0.00 0.18 29.02 17.74 0.16 0.02 0.01 5.54 9.47 64.49
Notes. The ratios of processed foods (flour and oatmeal) to raw cereals (wheat and oats) during the period 1792-9 have been used to estimate the relative amounts of oats and oatmeal, and wheat and flour, for the years 1756/7 and 1769/70 -1777/78. We have assumed that 35 per cent of the raw crop was lost in processing and that 10% of the processed crop was lost in distribution and wastage (see also Floud et al., 2011, pp. 212-6). Population figures for 1756/7 and 1769/70-1779/80 have been calculated by interpolation, using the data for England and Wales 1750 and 1800 in Floud et al. (2011, pp. 205-9). Population figures for 1792-1800 have been calculated using the same method, using population figures for the whole of Great Britain (England, Scotland and Wales). The remaining population figures have been calculated using the annual totals for Scotland and England and Wales in Mitchell (1988, Table 1.3).
Sources: Imports: see Tables 18 and 19; calorie values and extraction rates: Floud et al., 2011, pp. 212-6; Population: Floud et al., 2011, pp. 205-9; Mitchell, 1988, Table 1.3.
50 This article is © Emerald Group Publishing and permission has been granted for this version to appear here (http://strathprints.strath.ac.uk/50435/). Emerald does not grant permission for this article to be further copied/distributed or hosted elsewhere without the express permission from Emerald Group Publishing Limited.
Forthcoming in Research in Economic History, 31 (2015)
3.2. Irish meat and dairy exports
As we have already seen, there was a substantial increase in the value of Irish meat
and dairy imports during the second half of the eighteenth century. Davis’ figures
suggest that the value of Irish butter imports more than doubled between 1784/86
and 1824/26, whilst the value of imported beef and pork increased by a factor of
more than five. How significant was the contribution made by these changes to the
average British diet?
In 1968, Leslie Cullen published data on the volume of food imported into
Great Britain in the form of barrels of beef and pork and hundredweights of butter.
His figures suggested that the quantity of imported beef increased by a factor of
five between 1760 and 1800, whilst the amount of butter increased by a factor six
and that of pork by more than seven (Table 21). John Macgregor (1850, p. 158)
published data for the combined totals of beef and pork, together with butter, for
the periods 1787-9, 1797-9, 1807-9, 1817-19 and 1823-5. Although there are
some differences in the figures showing exports to the rest of the world, the figures
for exports to Great Britain are fairly similar where the periods overlap, which
suggests that we can use Macgregor’s data to extend Cullen’s series. However, this
does not necessarily mean that the figures are comparable across the period as a
whole. Cullen argued that the data which were gathered before 1780 may not be
entirely comparable with the post-1780 data because of changes in reporting
procedures and, more importantly, he also argued that almost all of the imported
beef (and, perhaps, much of the imported pork) was either diverted to the navy or
re-exported to the West Indies (Cullen, 1968, p. 73).
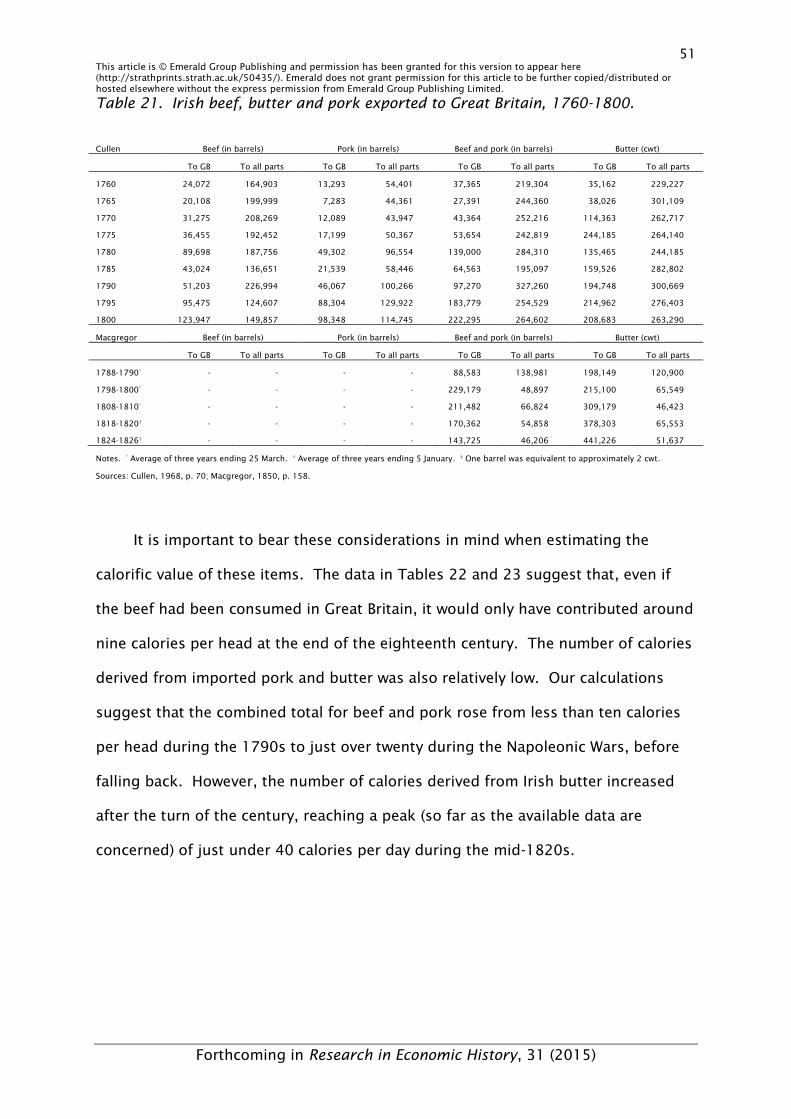
51 This article is © Emerald Group Publishing and permission has been granted for this version to appear here (http://strathprints.strath.ac.uk/50435/). Emerald does not grant permission for this article to be further copied/distributed or hosted elsewhere without the express permission from Emerald Group Publishing Limited.
Forthcoming in Research in Economic History, 31 (2015)
Table 21. Irish beef, butter and pork exported to Great Britain, 1760-1800.
Cullen Beef (in barrels) Pork (in barrels) Beef and pork (in barrels) Butter (cwt)
To GB To all parts To GB To all parts To GB To all parts To GB To all parts
1760 24,072 164,903 13,293 54,401 37,365 219,304 35,162 229,227
1765 20,108 199,999 7,283 44,361 27,391 244,360 38,026 301,109
1770 31,275 208,269 12,089 43,947 43,364 252,216 114,363 262,717
1775 36,455 192,452 17,199 50,367 53,654 242,819 244,185 264,140
1780 89,698 187,756 49,302 96,554 139,000 284,310 135,465 244,185
1785 43,024 136,651 21,539 58,446 64,563 195,097 159,526 282,802
1790 51,203 226,994 46,067 100,266 97,270 327,260 194,748 300,669
1795 95,475 124,607 88,304 129,922 183,779 254,529 214,962 276,403
1800 123,947 149,857 98,348 114,745 222,295 264,602 208,683 263,290
Macgregor Beef (in barrels) Pork (in barrels) Beef and pork (in barrels) Butter (cwt)
To GB To all parts To GB To all parts To GB To all parts To GB To all parts
1788-1790* - - - - 88,583 138,981 198,149 120,900
1798-1800* - - - - 229,179 48,897 215,100 65,549
1808-1810* - - - - 211,482 66,824 309,179 46,423
1818-1820† - - - - 170,362 54,858 378,303 65,553
1824-1826† - - - - 143,725 46,206 441,226 51,637
Notes. * Average of three years ending 25 March. † Average of three years ending 5 January. ‡ One barrel was equivalent to approximately 2 cwt.
Sources: Cullen, 1968, p. 70; Macgregor, 1850, p. 158.
It is important to bear these considerations in mind when estimating the
calorific value of these items. The data in Tables 22 and 23 suggest that, even if
the beef had been consumed in Great Britain, it would only have contributed around
nine calories per head at the end of the eighteenth century. The number of calories
derived from imported pork and butter was also relatively low. Our calculations
suggest that the combined total for beef and pork rose from less than ten calories
per head during the 1790s to just over twenty during the Napoleonic Wars, before
falling back. However, the number of calories derived from Irish butter increased
after the turn of the century, reaching a peak (so far as the available data are
concerned) of just under 40 calories per day during the mid-1820s.
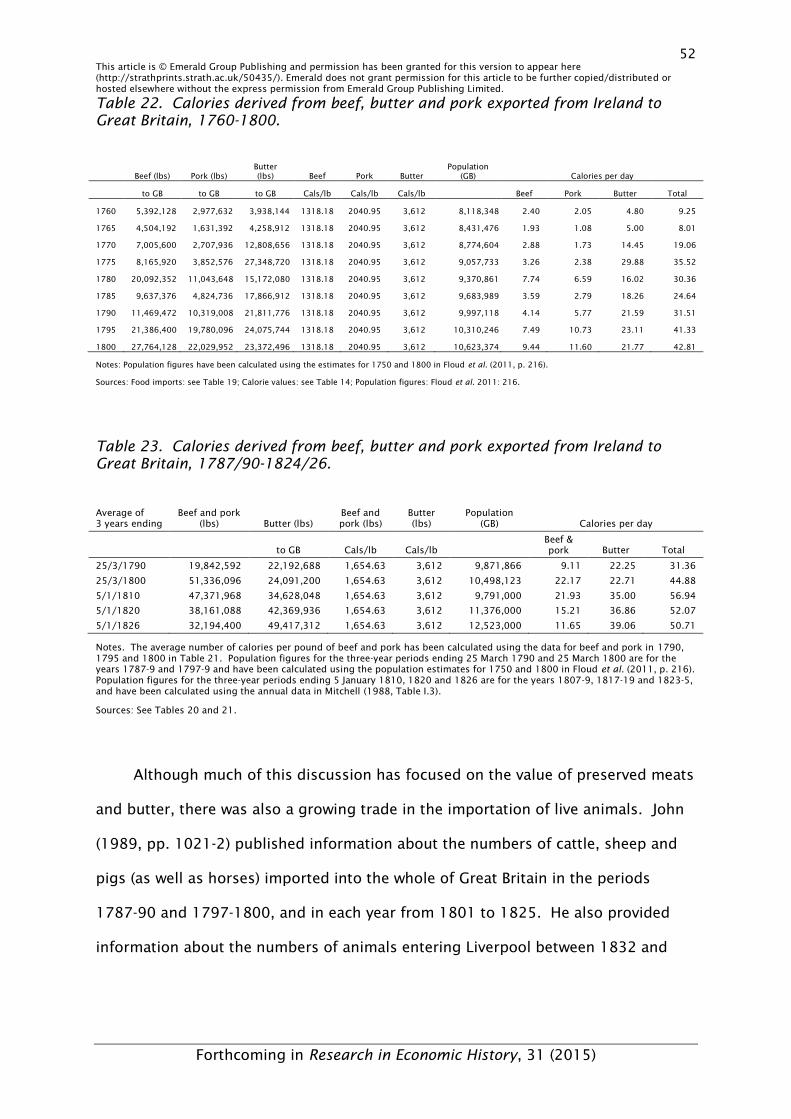
52 This article is © Emerald Group Publishing and permission has been granted for this version to appear here (http://strathprints.strath.ac.uk/50435/). Emerald does not grant permission for this article to be further copied/distributed or hosted elsewhere without the express permission from Emerald Group Publishing Limited.
Forthcoming in Research in Economic History, 31 (2015)
Table 22. Calories derived from beef, butter and pork exported from Ireland to Great Britain, 1760-1800.
Beef (lbs) Pork (lbs) Butter (lbs) Beef Pork Butter
Population (GB) Calories per day
to GB to GB to GB Cals/lb Cals/lb Cals/lb Beef Pork Butter Total
1760 5,392,128 2,977,632 3,938,144 1318.18 2040.95 3,612 8,118,348 2.40 2.05 4.80 9.25
1765 4,504,192 1,631,392 4,258,912 1318.18 2040.95 3,612 8,431,476 1.93 1.08 5.00 8.01
1770 7,005,600 2,707,936 12,808,656 1318.18 2040.95 3,612 8,774,604 2.88 1.73 14.45 19.06
1775 8,165,920 3,852,576 27,348,720 1318.18 2040.95 3,612 9,057,733 3.26 2.38 29.88 35.52
1780 20,092,352 11,043,648 15,172,080 1318.18 2040.95 3,612 9,370,861 7.74 6.59 16.02 30.36
1785 9,637,376 4,824,736 17,866,912 1318.18 2040.95 3,612 9,683,989 3.59 2.79 18.26 24.64
1790 11,469,472 10,319,008 21,811,776 1318.18 2040.95 3,612 9,997,118 4.14 5.77 21.59 31.51
1795 21,386,400 19,780,096 24,075,744 1318.18 2040.95 3,612 10,310,246 7.49 10.73 23.11 41.33
1800 27,764,128 22,029,952 23,372,496 1318.18 2040.95 3,612 10,623,374 9.44 11.60 21.77 42.81
Notes: Population figures have been calculated using the estimates for 1750 and 1800 in Floud et al. (2011, p. 216).
Sources: Food imports: see Table 19; Calorie values: see Table 14; Population figures: Floud et al. 2011: 216.
Table 23. Calories derived from beef, butter and pork exported from Ireland to Great Britain, 1787/90-1824/26.
Average of 3 years ending
Beef and pork (lbs) Butter (lbs)
Beef and pork (lbs)
Butter (lbs)
Population (GB) Calories per day
to GB Cals/lb Cals/lb Beef & pork Butter Total
25/3/1790 19,842,592 22,192,688 1,654.63 3,612 9,871,866 9.11 22.25 31.36
25/3/1800 51,336,096 24,091,200 1,654.63 3,612 10,498,123 22.17 22.71 44.88
5/1/1810 47,371,968 34,628,048 1,654.63 3,612 9,791,000 21.93 35.00 56.94
5/1/1820 38,161,088 42,369,936 1,654.63 3,612 11,376,000 15.21 36.86 52.07
5/1/1826 32,194,400 49,417,312 1,654.63 3,612 12,523,000 11.65 39.06 50.71
Notes. The average number of calories per pound of beef and pork has been calculated using the data for beef and pork in 1790, 1795 and 1800 in Table 21. Population figures for the three-year periods ending 25 March 1790 and 25 March 1800 are for the years 1787-9 and 1797-9 and have been calculated using the population estimates for 1750 and 1800 in Floud et al. (2011, p. 216). Population figures for the three-year periods ending 5 January 1810, 1820 and 1826 are for the years 1807-9, 1817-19 and 1823-5, and have been calculated using the annual data in Mitchell (1988, Table I.3).
Sources: See Tables 20 and 21.
Although much of this discussion has focused on the value of preserved meats
and butter, there was also a growing trade in the importation of live animals. John
(1989, pp. 1021-2) published information about the numbers of cattle, sheep and
pigs (as well as horses) imported into the whole of Great Britain in the periods
1787-90 and 1797-1800, and in each year from 1801 to 1825. He also provided
information about the numbers of animals entering Liverpool between 1832 and
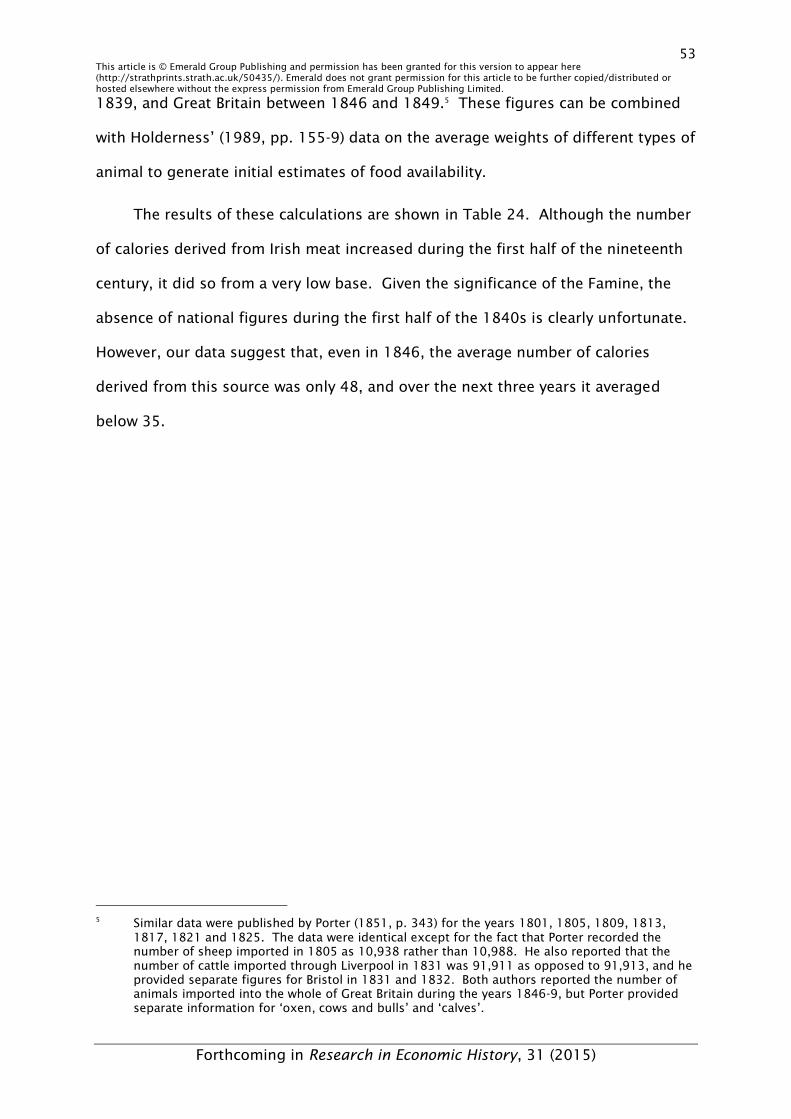
53 This article is © Emerald Group Publishing and permission has been granted for this version to appear here (http://strathprints.strath.ac.uk/50435/). Emerald does not grant permission for this article to be further copied/distributed or hosted elsewhere without the express permission from Emerald Group Publishing Limited.
Forthcoming in Research in Economic History, 31 (2015)
1839, and Great Britain between 1846 and 1849.5 These figures can be combined
with Holderness’ (1989, pp. 155-9) data on the average weights of different types of
animal to generate initial estimates of food availability.
The results of these calculations are shown in Table 24. Although the number
of calories derived from Irish meat increased during the first half of the nineteenth
century, it did so from a very low base. Given the significance of the Famine, the
absence of national figures during the first half of the 1840s is clearly unfortunate.
However, our data suggest that, even in 1846, the average number of calories
derived from this source was only 48, and over the next three years it averaged
below 35.
5 Similar data were published by Porter (1851, p. 343) for the years 1801, 1805, 1809, 1813,
1817, 1821 and 1825. The data were identical except for the fact that Porter recorded the number of sheep imported in 1805 as 10,938 rather than 10,988. He also reported that the number of cattle imported through Liverpool in 1831 was 91,911 as opposed to 91,913, and he provided separate figures for Bristol in 1831 and 1832. Both authors reported the number of animals imported into the whole of Great Britain during the years 1846-9, but Porter provided separate information for ‘oxen, cows and bulls’ and ‘calves’.
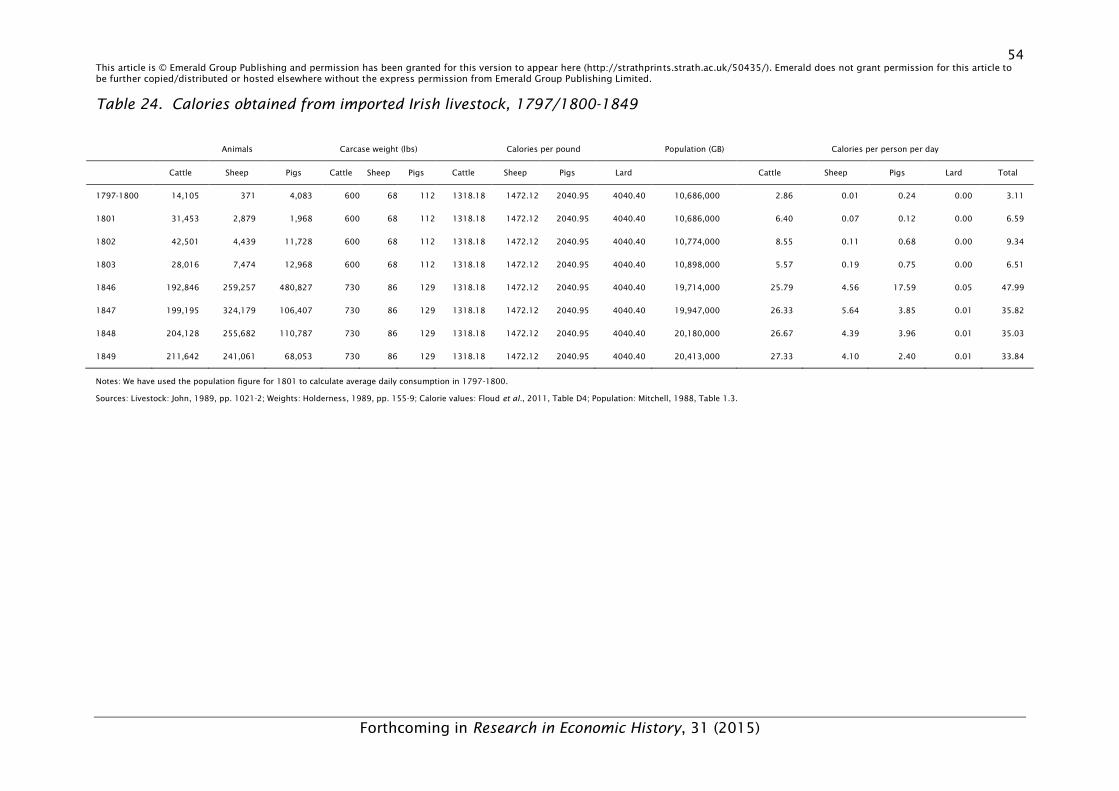
54 This article is © Emerald Group Publishing and permission has been granted for this version to appear here (http://strathprints.strath.ac.uk/50435/). Emerald does not grant permission for this article to be further copied/distributed or hosted elsewhere without the express permission from Emerald Group Publishing Limited.
Forthcoming in Research in Economic History, 31 (2015)
Table 24. Calories obtained from imported Irish livestock, 1797/1800-1849
Animals Carcase weight (lbs) Calories per pound Population (GB) Calories per person per day
Cattle Sheep Pigs Cattle Sheep Pigs Cattle Sheep Pigs Lard Cattle Sheep Pigs Lard Total
1797-1800 14,105 371 4,083 600 68 112 1318.18 1472.12 2040.95 4040.40 10,686,000 2.86 0.01 0.24 0.00 3.11
1801 31,453 2,879 1,968 600 68 112 1318.18 1472.12 2040.95 4040.40 10,686,000 6.40 0.07 0.12 0.00 6.59
1802 42,501 4,439 11,728 600 68 112 1318.18 1472.12 2040.95 4040.40 10,774,000 8.55 0.11 0.68 0.00 9.34
1803 28,016 7,474 12,968 600 68 112 1318.18 1472.12 2040.95 4040.40 10,898,000 5.57 0.19 0.75 0.00 6.51
1846 192,846 259,257 480,827 730 86 129 1318.18 1472.12 2040.95 4040.40 19,714,000 25.79 4.56 17.59 0.05 47.99
1847 199,195 324,179 106,407 730 86 129 1318.18 1472.12 2040.95 4040.40 19,947,000 26.33 5.64 3.85 0.01 35.82
1848 204,128 255,682 110,787 730 86 129 1318.18 1472.12 2040.95 4040.40 20,180,000 26.67 4.39 3.96 0.01 35.03
1849 211,642 241,061 68,053 730 86 129 1318.18 1472.12 2040.95 4040.40 20,413,000 27.33 4.10 2.40 0.01 33.84
Notes: We have used the population figure for 1801 to calculate average daily consumption in 1797-1800.
Sources: Livestock: John, 1989, pp. 1021-2; Weights: Holderness, 1989, pp. 155-9; Calorie values: Floud et al., 2011, Table D4; Population: Mitchell, 1988, Table 1.3.
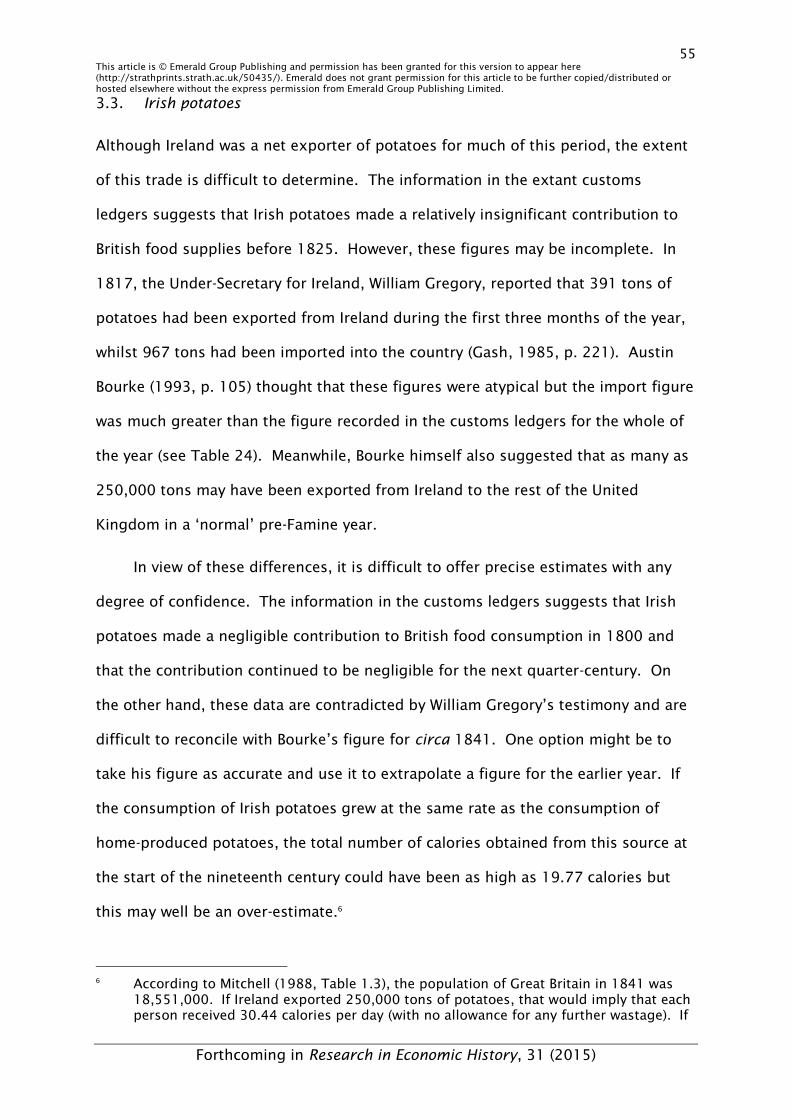
55 This article is © Emerald Group Publishing and permission has been granted for this version to appear here (http://strathprints.strath.ac.uk/50435/). Emerald does not grant permission for this article to be further copied/distributed or hosted elsewhere without the express permission from Emerald Group Publishing Limited.
Forthcoming in Research in Economic History, 31 (2015)
3.3. Irish potatoes
Although Ireland was a net exporter of potatoes for much of this period, the extent
of this trade is difficult to determine. The information in the extant customs
ledgers suggests that Irish potatoes made a relatively insignificant contribution to
British food supplies before 1825. However, these figures may be incomplete. In
1817, the Under-Secretary for Ireland, William Gregory, reported that 391 tons of
potatoes had been exported from Ireland during the first three months of the year,
whilst 967 tons had been imported into the country (Gash, 1985, p. 221). Austin
Bourke (1993, p. 105) thought that these figures were atypical but the import figure
was much greater than the figure recorded in the customs ledgers for the whole of
the year (see Table 24). Meanwhile, Bourke himself also suggested that as many as
250,000 tons may have been exported from Ireland to the rest of the United
Kingdom in a ‘normal’ pre-Famine year.
In view of these differences, it is difficult to offer precise estimates with any
degree of confidence. The information in the customs ledgers suggests that Irish
potatoes made a negligible contribution to British food consumption in 1800 and
that the contribution continued to be negligible for the next quarter-century. On
the other hand, these data are contradicted by William Gregory’s testimony and are
difficult to reconcile with Bourke’s figure for circa 1841. One option might be to
take his figure as accurate and use it to extrapolate a figure for the earlier year. If
the consumption of Irish potatoes grew at the same rate as the consumption of
home-produced potatoes, the total number of calories obtained from this source at
the start of the nineteenth century could have been as high as 19.77 calories but
this may well be an over-estimate.6
6 According to Mitchell (1988, Table 1.3), the population of Great Britain in 1841 was
18,551,000. If Ireland exported 250,000 tons of potatoes, that would imply that each person received 30.44 calories per day (with no allowance for any further wastage). If
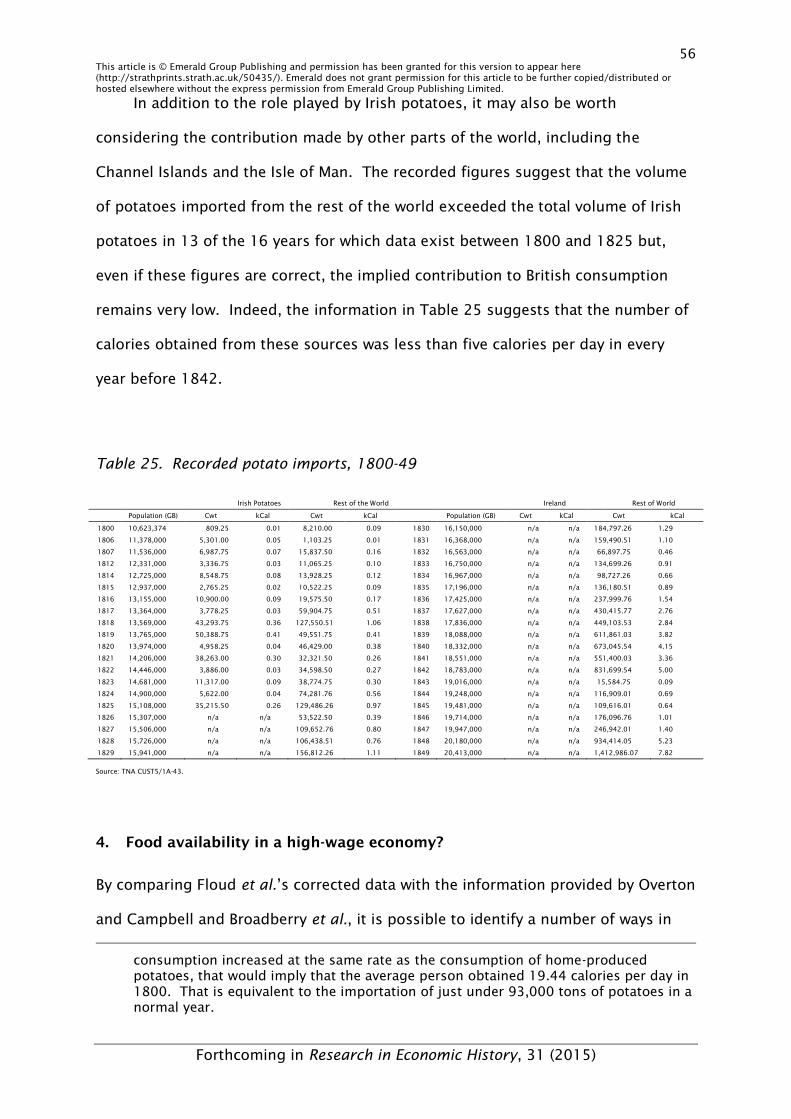
56 This article is © Emerald Group Publishing and permission has been granted for this version to appear here (http://strathprints.strath.ac.uk/50435/). Emerald does not grant permission for this article to be further copied/distributed or hosted elsewhere without the express permission from Emerald Group Publishing Limited.
Forthcoming in Research in Economic History, 31 (2015)
In addition to the role played by Irish potatoes, it may also be worth
considering the contribution made by other parts of the world, including the
Channel Islands and the Isle of Man. The recorded figures suggest that the volume
of potatoes imported from the rest of the world exceeded the total volume of Irish
potatoes in 13 of the 16 years for which data exist between 1800 and 1825 but,
even if these figures are correct, the implied contribution to British consumption
remains very low. Indeed, the information in Table 25 suggests that the number of
calories obtained from these sources was less than five calories per day in every
year before 1842.
Table 25. Recorded potato imports, 1800-49
Irish Potatoes Rest of the World Ireland Rest of World
Population (GB) Cwt kCal Cwt kCal Population (GB) Cwt kCal Cwt kCal
1800 10,623,374 809.25 0.01 8,210.00 0.09 1830 16,150,000 n/a n/a 184,797.26 1.29
1806 11,378,000 5,301.00 0.05 1,103.25 0.01 1831 16,368,000 n/a n/a 159,490.51 1.10
1807 11,536,000 6,987.75 0.07 15,837.50 0.16 1832 16,563,000 n/a n/a 66,897.75 0.46
1812 12,331,000 3,336.75 0.03 11,065.25 0.10 1833 16,750,000 n/a n/a 134,699.26 0.91
1814 12,725,000 8,548.75 0.08 13,928.25 0.12 1834 16,967,000 n/a n/a 98,727.26 0.66
1815 12,937,000 2,765.25 0.02 10,522.25 0.09 1835 17,196,000 n/a n/a 136,180.51 0.89
1816 13,155,000 10,900.00 0.09 19,575.50 0.17 1836 17,425,000 n/a n/a 237,999.76 1.54
1817 13,364,000 3,778.25 0.03 59,904.75 0.51 1837 17,627,000 n/a n/a 430,415.77 2.76
1818 13,569,000 43,293.75 0.36 127,550.51 1.06 1838 17,836,000 n/a n/a 449,103.53 2.84
1819 13,765,000 50,388.75 0.41 49,551.75 0.41 1839 18,088,000 n/a n/a 611,861.03 3.82
1820 13,974,000 4,958.25 0.04 46,429.00 0.38 1840 18,332,000 n/a n/a 673,045.54 4.15
1821 14,206,000 38,263.00 0.30 32,321.50 0.26 1841 18,551,000 n/a n/a 551,400.03 3.36
1822 14,446,000 3,886.00 0.03 34,598.50 0.27 1842 18,783,000 n/a n/a 831,699.54 5.00
1823 14,681,000 11,317.00 0.09 38,774.75 0.30 1843 19,016,000 n/a n/a 15,584.75 0.09
1824 14,900,000 5,622.00 0.04 74,281.76 0.56 1844 19,248,000 n/a n/a 116,909.01 0.69
1825 15,108,000 35,215.50 0.26 129,486.26 0.97 1845 19,481,000 n/a n/a 109,616.01 0.64
1826 15,307,000 n/a n/a 53,522.50 0.39 1846 19,714,000 n/a n/a 176,096.76 1.01
1827 15,506,000 n/a n/a 109,652.76 0.80 1847 19,947,000 n/a n/a 246,942.01 1.40
1828 15,726,000 n/a n/a 106,438.51 0.76 1848 20,180,000 n/a n/a 934,414.05 5.23
1829 15,941,000 n/a n/a 156,812.26 1.11 1849 20,413,000 n/a n/a 1,412,986.07 7.82
Source: TNA CUST5/1A-43.
4. Food availability in a high-wage economy?
By comparing Floud et al.’s corrected data with the information provided by Overton
and Campbell and Broadberry et al., it is possible to identify a number of ways in
consumption increased at the same rate as the consumption of home-produced potatoes, that would imply that the average person obtained 19.44 calories per day in 1800. That is equivalent to the importation of just under 93,000 tons of potatoes in a normal year.
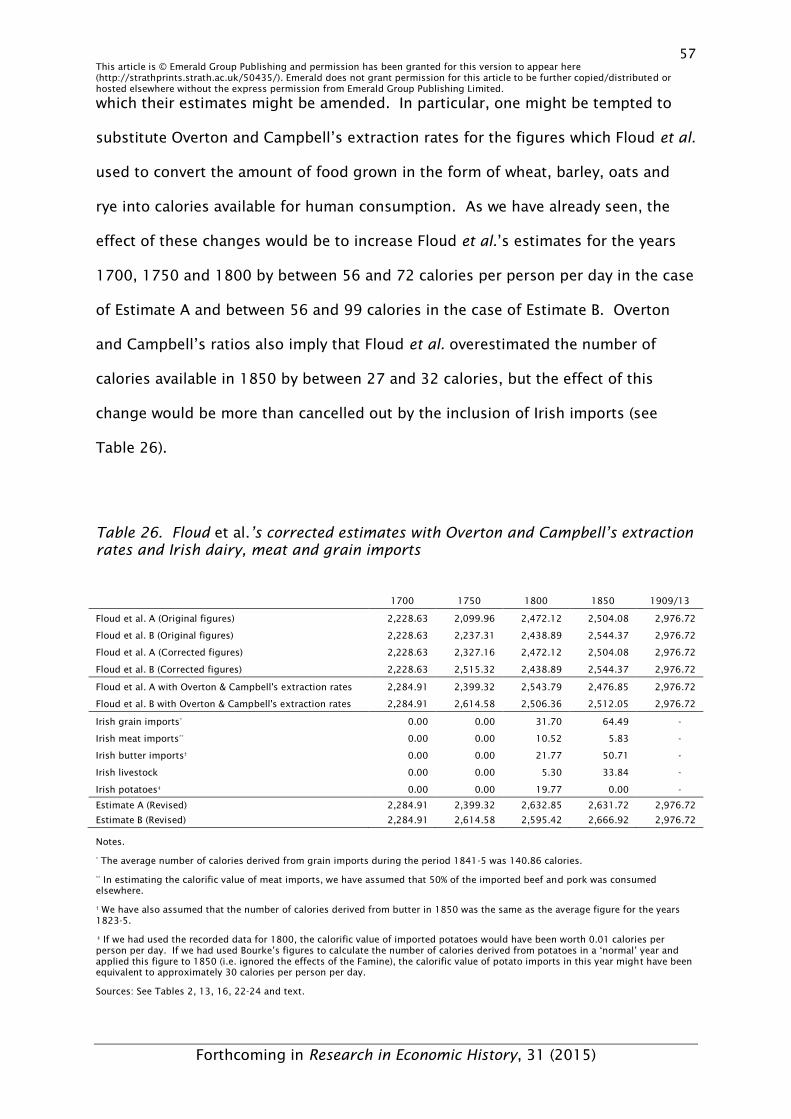
57 This article is © Emerald Group Publishing and permission has been granted for this version to appear here (http://strathprints.strath.ac.uk/50435/). Emerald does not grant permission for this article to be further copied/distributed or hosted elsewhere without the express permission from Emerald Group Publishing Limited.
Forthcoming in Research in Economic History, 31 (2015)
which their estimates might be amended. In particular, one might be tempted to
substitute Overton and Campbell’s extraction rates for the figures which Floud et al.
used to convert the amount of food grown in the form of wheat, barley, oats and
rye into calories available for human consumption. As we have already seen, the
effect of these changes would be to increase Floud et al.’s estimates for the years
1700, 1750 and 1800 by between 56 and 72 calories per person per day in the case
of Estimate A and between 56 and 99 calories in the case of Estimate B. Overton
and Campbell’s ratios also imply that Floud et al. overestimated the number of
calories available in 1850 by between 27 and 32 calories, but the effect of this
change would be more than cancelled out by the inclusion of Irish imports (see
Table 26).
Table 26. Floud et al.’s corrected estimates with Overton and Campbell’s extraction rates and Irish dairy, meat and grain imports
1700 1750 1800 1850 1909/13
Floud et al. A (Original figures) 2,228.63 2,099.96 2,472.12 2,504.08 2,976.72
Floud et al. B (Original figures) 2,228.63 2,237.31 2,438.89 2,544.37 2,976.72
Floud et al. A (Corrected figures) 2,228.63 2,327.16 2,472.12 2,504.08 2,976.72
Floud et al. B (Corrected figures) 2,228.63 2,515.32 2,438.89 2,544.37 2,976.72
Floud et al. A with Overton & Campbell's extraction rates 2,284.91 2,399.32 2,543.79 2,476.85 2,976.72
Floud et al. B with Overton & Campbell's extraction rates 2,284.91 2,614.58 2,506.36 2,512.05 2,976.72
Irish grain imports* 0.00 0.00 31.70 64.49 -
Irish meat imports** 0.00 0.00 10.52 5.83 -
Irish butter imports† 0.00 0.00 21.77 50.71 -
Irish livestock 0.00 0.00 5.30 33.84 -
Irish potatoes‡ 0.00 0.00 19.77 0.00 -
Estimate A (Revised) 2,284.91 2,399.32 2,632.85 2,631.72 2,976.72
Estimate B (Revised) 2,284.91 2,614.58 2,595.42 2,666.92 2,976.72
Notes.
* The average number of calories derived from grain imports during the period 1841-5 was 140.86 calories.
** In estimating the calorific value of meat imports, we have assumed that 50% of the imported beef and pork was consumed elsewhere.
† We have also assumed that the number of calories derived from butter in 1850 was the same as the average figure for the years 1823-5.
‡ If we had used the recorded data for 1800, the calorific value of imported potatoes would have been worth 0.01 calories per person per day. If we had used Bourke’s figures to calculate the number of calories derived from potatoes in a ‘normal’ year and applied this figure to 1850 (i.e. ignored the effects of the Famine), the calorific value of potato imports in this year might have been equivalent to approximately 30 calories per person per day.
Sources: See Tables 2, 13, 16, 22-24 and text.
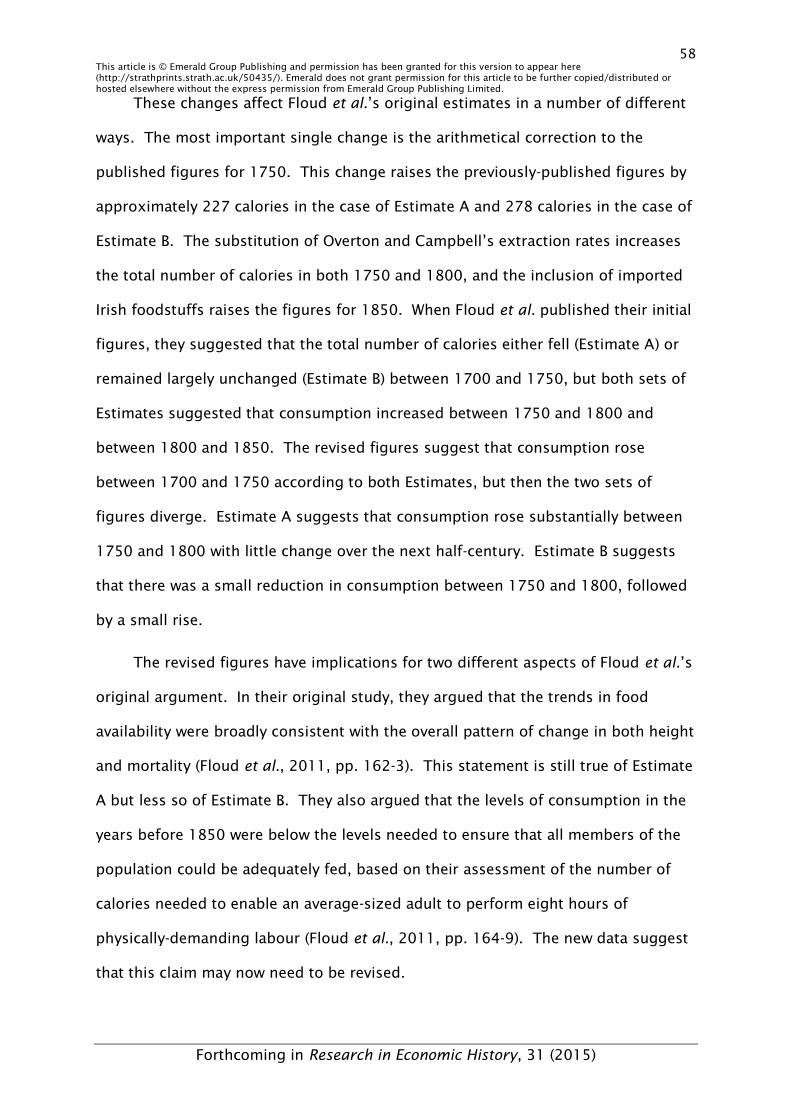
58 This article is © Emerald Group Publishing and permission has been granted for this version to appear here (http://strathprints.strath.ac.uk/50435/). Emerald does not grant permission for this article to be further copied/distributed or hosted elsewhere without the express permission from Emerald Group Publishing Limited.
Forthcoming in Research in Economic History, 31 (2015)
These changes affect Floud et al.’s original estimates in a number of different
ways. The most important single change is the arithmetical correction to the
published figures for 1750. This change raises the previously-published figures by
approximately 227 calories in the case of Estimate A and 278 calories in the case of
Estimate B. The substitution of Overton and Campbell’s extraction rates increases
the total number of calories in both 1750 and 1800, and the inclusion of imported
Irish foodstuffs raises the figures for 1850. When Floud et al. published their initial
figures, they suggested that the total number of calories either fell (Estimate A) or
remained largely unchanged (Estimate B) between 1700 and 1750, but both sets of
Estimates suggested that consumption increased between 1750 and 1800 and
between 1800 and 1850. The revised figures suggest that consumption rose
between 1700 and 1750 according to both Estimates, but then the two sets of
figures diverge. Estimate A suggests that consumption rose substantially between
1750 and 1800 with little change over the next half-century. Estimate B suggests
that there was a small reduction in consumption between 1750 and 1800, followed
by a small rise.
The revised figures have implications for two different aspects of Floud et al.’s
original argument. In their original study, they argued that the trends in food
availability were broadly consistent with the overall pattern of change in both height
and mortality (Floud et al., 2011, pp. 162-3). This statement is still true of Estimate
A but less so of Estimate B. They also argued that the levels of consumption in the
years before 1850 were below the levels needed to ensure that all members of the
population could be adequately fed, based on their assessment of the number of
calories needed to enable an average-sized adult to perform eight hours of
physically-demanding labour (Floud et al., 2011, pp. 164-9). The new data suggest
that this claim may now need to be revised.
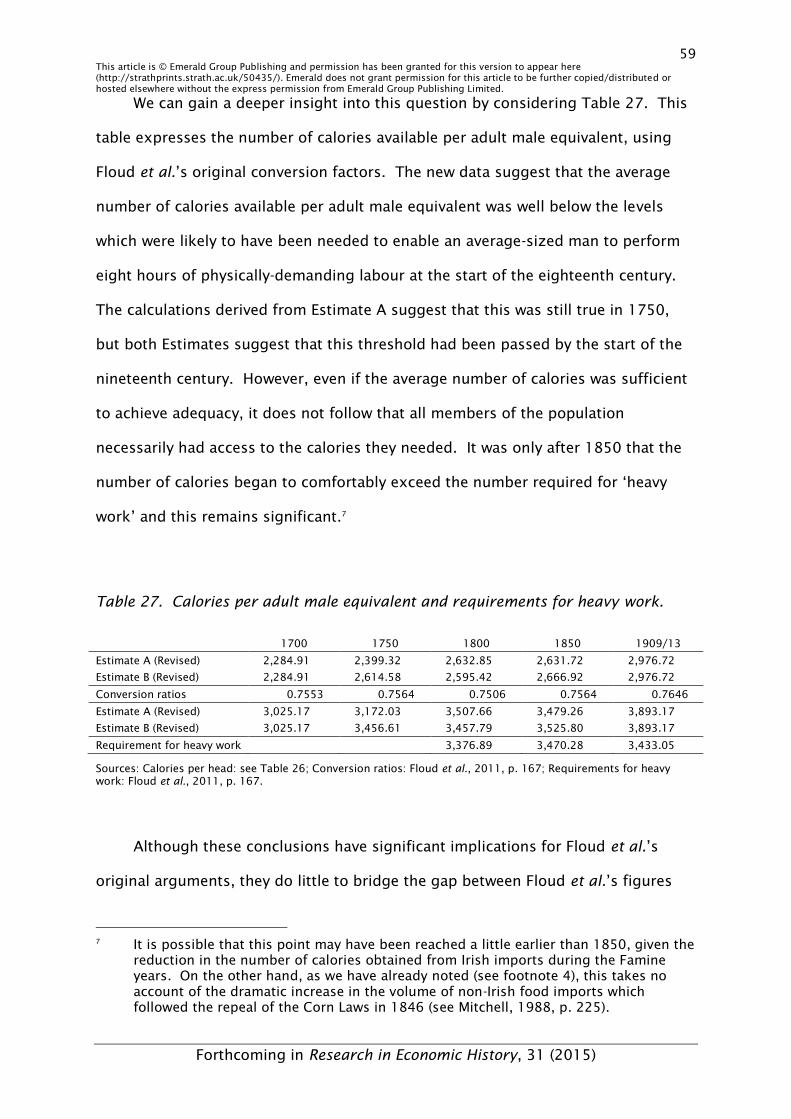
59 This article is © Emerald Group Publishing and permission has been granted for this version to appear here (http://strathprints.strath.ac.uk/50435/). Emerald does not grant permission for this article to be further copied/distributed or hosted elsewhere without the express permission from Emerald Group Publishing Limited.
Forthcoming in Research in Economic History, 31 (2015)
We can gain a deeper insight into this question by considering Table 27. This
table expresses the number of calories available per adult male equivalent, using
Floud et al.’s original conversion factors. The new data suggest that the average
number of calories available per adult male equivalent was well below the levels
which were likely to have been needed to enable an average-sized man to perform
eight hours of physically-demanding labour at the start of the eighteenth century.
The calculations derived from Estimate A suggest that this was still true in 1750,
but both Estimates suggest that this threshold had been passed by the start of the
nineteenth century. However, even if the average number of calories was sufficient
to achieve adequacy, it does not follow that all members of the population
necessarily had access to the calories they needed. It was only after 1850 that the
number of calories began to comfortably exceed the number required for ‘heavy
work’ and this remains significant.7
Table 27. Calories per adult male equivalent and requirements for heavy work.
1700 1750 1800 1850 1909/13
Estimate A (Revised) 2,284.91 2,399.32 2,632.85 2,631.72 2,976.72
Estimate B (Revised) 2,284.91 2,614.58 2,595.42 2,666.92 2,976.72
Conversion ratios 0.7553 0.7564 0.7506 0.7564 0.7646
Estimate A (Revised) 3,025.17 3,172.03 3,507.66 3,479.26 3,893.17
Estimate B (Revised) 3,025.17 3,456.61 3,457.79 3,525.80 3,893.17
Requirement for heavy work 3,376.89 3,470.28 3,433.05
Sources: Calories per head: see Table 26; Conversion ratios: Floud et al., 2011, p. 167; Requirements for heavy work: Floud et al., 2011, p. 167.
Although these conclusions have significant implications for Floud et al.’s
original arguments, they do little to bridge the gap between Floud et al.’s figures
7 It is possible that this point may have been reached a little earlier than 1850, given the
reduction in the number of calories obtained from Irish imports during the Famine years. On the other hand, as we have already noted (see footnote 4), this takes no account of the dramatic increase in the volume of non-Irish food imports which followed the repeal of the Corn Laws in 1846 (see Mitchell, 1988, p. 225).
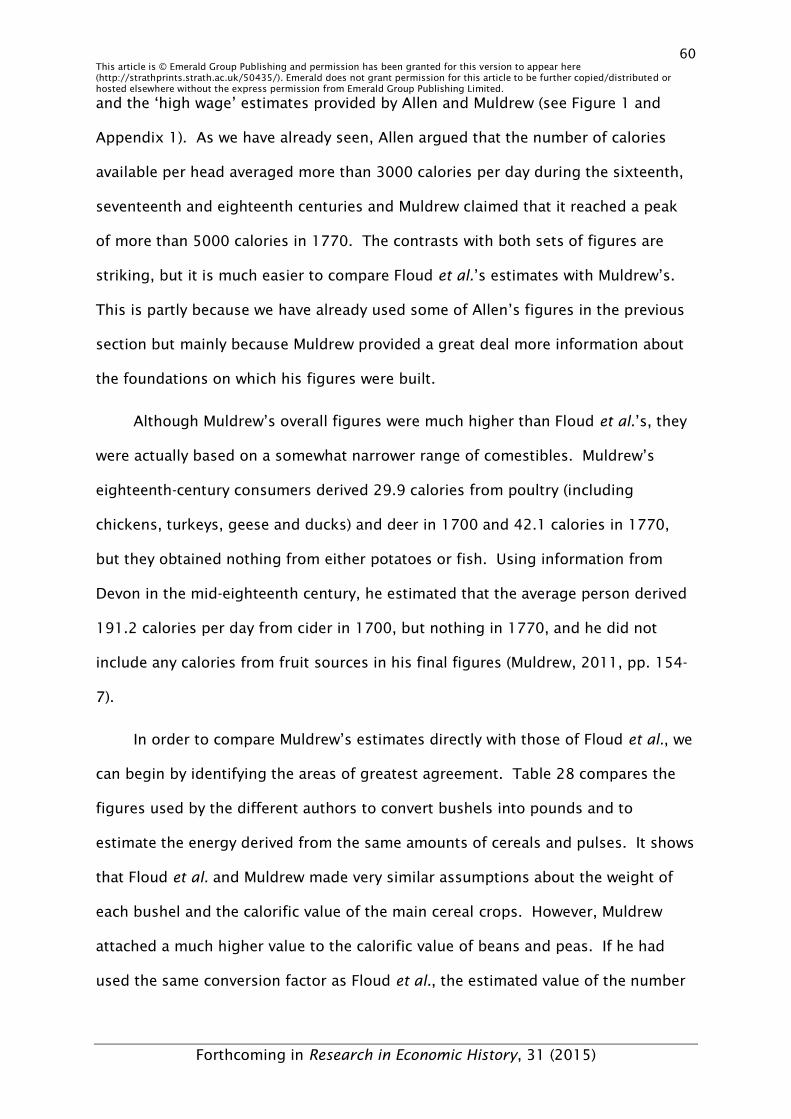
60 This article is © Emerald Group Publishing and permission has been granted for this version to appear here (http://strathprints.strath.ac.uk/50435/). Emerald does not grant permission for this article to be further copied/distributed or hosted elsewhere without the express permission from Emerald Group Publishing Limited.
Forthcoming in Research in Economic History, 31 (2015)
and the ‘high wage’ estimates provided by Allen and Muldrew (see Figure 1 and
Appendix 1). As we have already seen, Allen argued that the number of calories
available per head averaged more than 3000 calories per day during the sixteenth,
seventeenth and eighteenth centuries and Muldrew claimed that it reached a peak
of more than 5000 calories in 1770. The contrasts with both sets of figures are
striking, but it is much easier to compare Floud et al.’s estimates with Muldrew’s.
This is partly because we have already used some of Allen’s figures in the previous
section but mainly because Muldrew provided a great deal more information about
the foundations on which his figures were built.
Although Muldrew’s overall figures were much higher than Floud et al.’s, they
were actually based on a somewhat narrower range of comestibles. Muldrew’s
eighteenth-century consumers derived 29.9 calories from poultry (including
chickens, turkeys, geese and ducks) and deer in 1700 and 42.1 calories in 1770,
but they obtained nothing from either potatoes or fish. Using information from
Devon in the mid-eighteenth century, he estimated that the average person derived
191.2 calories per day from cider in 1700, but nothing in 1770, and he did not
include any calories from fruit sources in his final figures (Muldrew, 2011, pp. 154-
7).
In order to compare Muldrew’s estimates directly with those of Floud et al., we
can begin by identifying the areas of greatest agreement. Table 28 compares the
figures used by the different authors to convert bushels into pounds and to
estimate the energy derived from the same amounts of cereals and pulses. It shows
that Floud et al. and Muldrew made very similar assumptions about the weight of
each bushel and the calorific value of the main cereal crops. However, Muldrew
attached a much higher value to the calorific value of beans and peas. If he had
used the same conversion factor as Floud et al., the estimated value of the number
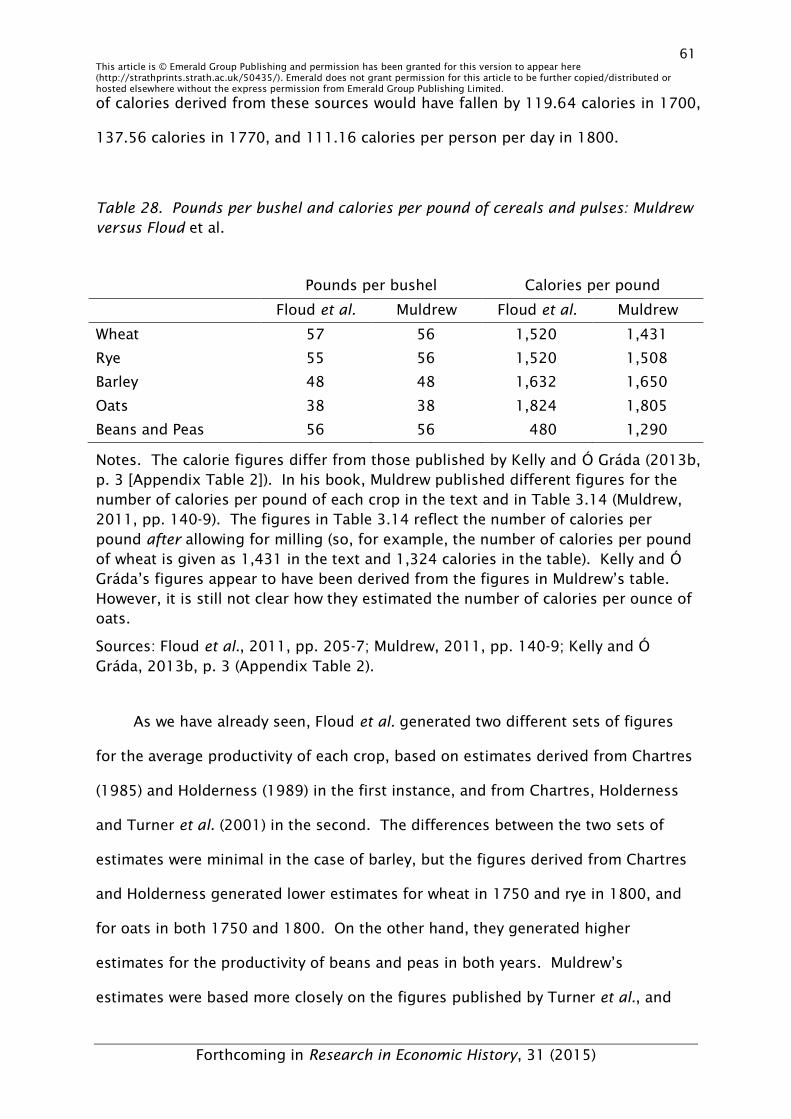
61 This article is © Emerald Group Publishing and permission has been granted for this version to appear here (http://strathprints.strath.ac.uk/50435/). Emerald does not grant permission for this article to be further copied/distributed or hosted elsewhere without the express permission from Emerald Group Publishing Limited.
Forthcoming in Research in Economic History, 31 (2015)
of calories derived from these sources would have fallen by 119.64 calories in 1700,
137.56 calories in 1770, and 111.16 calories per person per day in 1800.
Table 28. Pounds per bushel and calories per pound of cereals and pulses: Muldrew
versus Floud et al.
Pounds per bushel Calories per pound
Floud et al. Muldrew Floud et al. Muldrew
Wheat 57 56 1,520 1,431
Rye 55 56 1,520 1,508
Barley 48 48 1,632 1,650
Oats 38 38 1,824 1,805
Beans and Peas 56 56 480 1,290
Notes. The calorie figures differ from those published by Kelly and Ó Gráda (2013b, p. 3 [Appendix Table 2]). In his book, Muldrew published different figures for the number of calories per pound of each crop in the text and in Table 3.14 (Muldrew, 2011, pp. 140-9). The figures in Table 3.14 reflect the number of calories per pound after allowing for milling (so, for example, the number of calories per pound of wheat is given as 1,431 in the text and 1,324 calories in the table). Kelly and Ó Gráda’s figures appear to have been derived from the figures in Muldrew’s table. However, it is still not clear how they estimated the number of calories per ounce of oats.
Sources: Floud et al., 2011, pp. 205-7; Muldrew, 2011, pp. 140-9; Kelly and Ó Gráda, 2013b, p. 3 (Appendix Table 2).
As we have already seen, Floud et al. generated two different sets of figures
for the average productivity of each crop, based on estimates derived from Chartres
(1985) and Holderness (1989) in the first instance, and from Chartres, Holderness
and Turner et al. (2001) in the second. The differences between the two sets of
estimates were minimal in the case of barley, but the figures derived from Chartres
and Holderness generated lower estimates for wheat in 1750 and rye in 1800, and
for oats in both 1750 and 1800. On the other hand, they generated higher
estimates for the productivity of beans and peas in both years. Muldrew’s
estimates were based more closely on the figures published by Turner et al., and
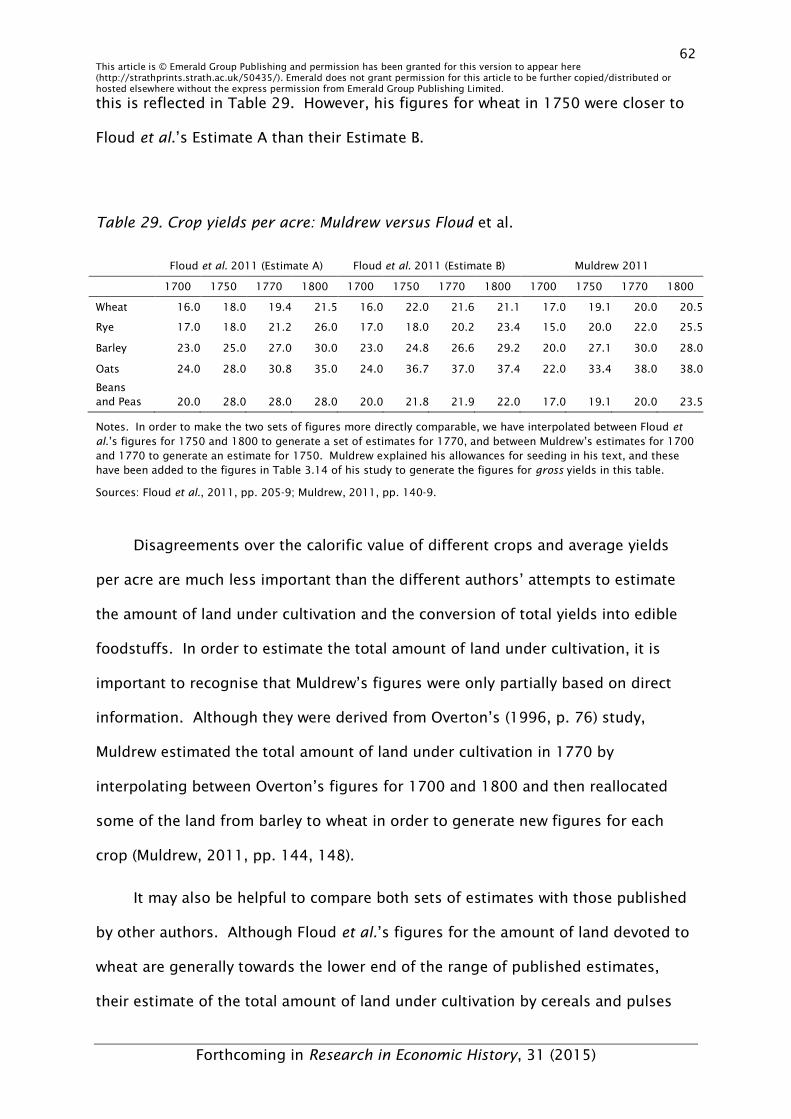
62 This article is © Emerald Group Publishing and permission has been granted for this version to appear here (http://strathprints.strath.ac.uk/50435/). Emerald does not grant permission for this article to be further copied/distributed or hosted elsewhere without the express permission from Emerald Group Publishing Limited.
Forthcoming in Research in Economic History, 31 (2015)
this is reflected in Table 29. However, his figures for wheat in 1750 were closer to
Floud et al.’s Estimate A than their Estimate B.
Table 29. Crop yields per acre: Muldrew versus Floud et al.
Floud et al. 2011 (Estimate A) Floud et al. 2011 (Estimate B) Muldrew 2011
1700 1750 1770 1800 1700 1750 1770 1800 1700 1750 1770 1800
Wheat 16.0 18.0 19.4 21.5 16.0 22.0 21.6 21.1 17.0 19.1 20.0 20.5
Rye 17.0 18.0 21.2 26.0 17.0 18.0 20.2 23.4 15.0 20.0 22.0 25.5
Barley 23.0 25.0 27.0 30.0 23.0 24.8 26.6 29.2 20.0 27.1 30.0 28.0
Oats 24.0 28.0 30.8 35.0 24.0 36.7 37.0 37.4 22.0 33.4 38.0 38.0
Beans and Peas 20.0 28.0 28.0 28.0 20.0 21.8 21.9 22.0 17.0 19.1 20.0 23.5
Notes. In order to make the two sets of figures more directly comparable, we have interpolated between Floud et
al.’s figures for 1750 and 1800 to generate a set of estimates for 1770, and between Muldrew’s estimates for 1700 and 1770 to generate an estimate for 1750. Muldrew explained his allowances for seeding in his text, and these have been added to the figures in Table 3.14 of his study to generate the figures for gross yields in this table.
Sources: Floud et al., 2011, pp. 205-9; Muldrew, 2011, pp. 140-9.
Disagreements over the calorific value of different crops and average yields
per acre are much less important than the different authors’ attempts to estimate
the amount of land under cultivation and the conversion of total yields into edible
foodstuffs. In order to estimate the total amount of land under cultivation, it is
important to recognise that Muldrew’s figures were only partially based on direct
information. Although they were derived from Overton’s (1996, p. 76) study,
Muldrew estimated the total amount of land under cultivation in 1770 by
interpolating between Overton’s figures for 1700 and 1800 and then reallocated
some of the land from barley to wheat in order to generate new figures for each
crop (Muldrew, 2011, pp. 144, 148).
It may also be helpful to compare both sets of estimates with those published
by other authors. Although Floud et al.’s figures for the amount of land devoted to
wheat are generally towards the lower end of the range of published estimates,
their estimate of the total amount of land under cultivation by cereals and pulses
63 This article is © Emerald Group Publishing and permission has been granted for this version to appear here (http://strathprints.strath.ac.uk/50435/). Emerald does not grant permission for this article to be further copied/distributed or hosted elsewhere without the express permission from Emerald Group Publishing Limited.
Forthcoming in Research in Economic History, 31 (2015)
was closer to the centre (see Table 30). By contrast, Muldrew’s figures suggest that
the amount of land devoted to wheat in 1770 was 860,000 acres greater than the
highest estimate for 1750, and his figure for 1800 was 130,000 acres greater than
the next highest figure for the same year. Overall, he suggested that the amount of
land devoted to all cereals and pulses in 1770 was 980,000 acres greater than the
highest figure for 1750, and also greater than any of the other published estimates
for 1800. His own figure for 1800 was nearly 1.2 million acres higher than the next
published figure.
Muldrew’s figures also raise three further questions. As we have already seen,
Muldrew derived his figures for the total amount of land under cultivation from
Overton’s 1996 study. However, although Overton (1996, p. 76) argued that these
figures applied to the whole of England and Wales, Muldrew (2011, pp. 142-3)
appears to have divided the total amount of food produced from this land among
the population of England alone. The second problem is that Overton himself
argued that these figures had been superseded by the work he published with Bruce
Campbell in the same year (Overton and Campbell, 1996, pp. 282; 2006, p. 29).
The third problem is that Muldrew also assumed that the total amount of land
under cultivation grew at a consistent rate between 1700 and 1800, but this
assumption is called into question by the figures which Overton published with
Broadberry, Campbell, Klein and van Leeuwen (Broadberry et al., 2011, p. 36). As
we can see from Table 30, these figures imply that the total amount of land devoted
to the cultivation of cereals and pulses fell from 6.36 million acres in 1700 to 6.31
million acres in 1750. The amount of land associated with the cultivation of wheat
fell, according to their calculations, from 1.99 million acres to 1.95, whereas
Muldrew’s calculations imply that it increased from 1.6 million acres to 2.57 million
acres over the same period (see Table 31).
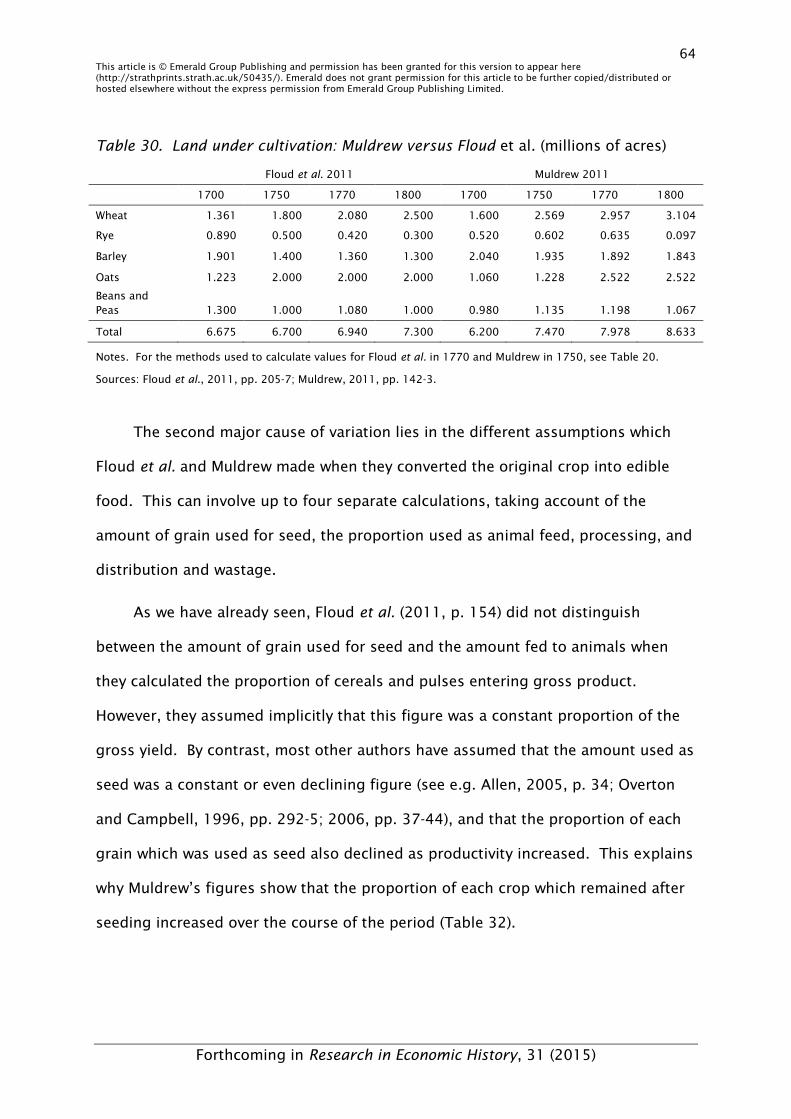
64 This article is © Emerald Group Publishing and permission has been granted for this version to appear here (http://strathprints.strath.ac.uk/50435/). Emerald does not grant permission for this article to be further copied/distributed or hosted elsewhere without the express permission from Emerald Group Publishing Limited.
Forthcoming in Research in Economic History, 31 (2015)
Table 30. Land under cultivation: Muldrew versus Floud et al. (millions of acres)
Floud et al. 2011 Muldrew 2011
1700 1750 1770 1800 1700 1750 1770 1800
Wheat 1.361 1.800 2.080 2.500 1.600 2.569 2.957 3.104
Rye 0.890 0.500 0.420 0.300 0.520 0.602 0.635 0.097
Barley 1.901 1.400 1.360 1.300 2.040 1.935 1.892 1.843
Oats 1.223 2.000 2.000 2.000 1.060 1.228 2.522 2.522
Beans and Peas 1.300 1.000 1.080 1.000 0.980 1.135 1.198 1.067
Total 6.675 6.700 6.940 7.300 6.200 7.470 7.978 8.633
Notes. For the methods used to calculate values for Floud et al. in 1770 and Muldrew in 1750, see Table 20.
Sources: Floud et al., 2011, pp. 205-7; Muldrew, 2011, pp. 142-3.
The second major cause of variation lies in the different assumptions which
Floud et al. and Muldrew made when they converted the original crop into edible
food. This can involve up to four separate calculations, taking account of the
amount of grain used for seed, the proportion used as animal feed, processing, and
distribution and wastage.
As we have already seen, Floud et al. (2011, p. 154) did not distinguish
between the amount of grain used for seed and the amount fed to animals when
they calculated the proportion of cereals and pulses entering gross product.
However, they assumed implicitly that this figure was a constant proportion of the
gross yield. By contrast, most other authors have assumed that the amount used as
seed was a constant or even declining figure (see e.g. Allen, 2005, p. 34; Overton
and Campbell, 1996, pp. 292-5; 2006, pp. 37-44), and that the proportion of each
grain which was used as seed also declined as productivity increased. This explains
why Muldrew’s figures show that the proportion of each crop which remained after
seeding increased over the course of the period (Table 32).
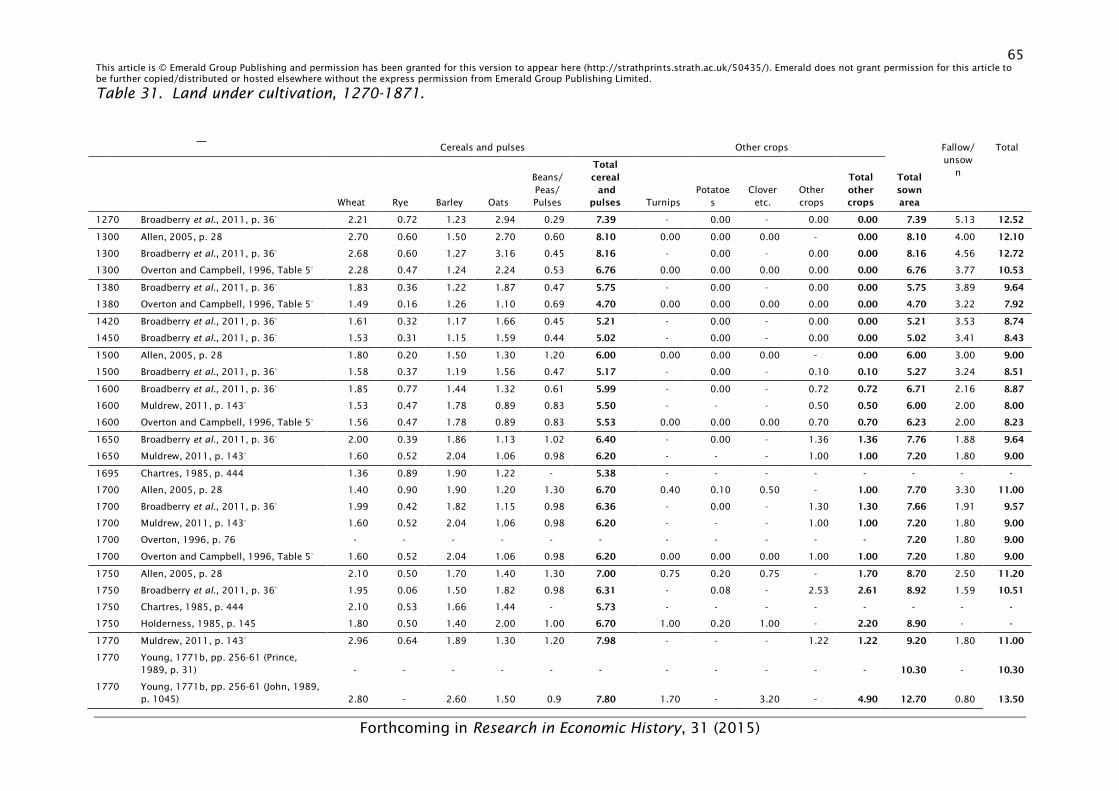
65 This article is © Emerald Group Publishing and permission has been granted for this version to appear here (http://strathprints.strath.ac.uk/50435/). Emerald does not grant permission for this article to be further copied/distributed or hosted elsewhere without the express permission from Emerald Group Publishing Limited.
Forthcoming in Research in Economic History, 31 (2015)
Table 31. Land under cultivation, 1270-1871.
Cereals and pulses Other crops
Total
sown
area
Fallow/ unsow
n
Total
Wheat Rye Barley Oats
Beans/ Peas/ Pulses
Total
cereal
and
pulses Turnips Potatoe
s Clover
etc. Other crops
Total
other
crops
1270 Broadberry et al., 2011, p. 36* 2.21 0.72 1.23 2.94 0.29 7.39 - 0.00 - 0.00 0.00 7.39 5.13 12.52
1300 Allen, 2005, p. 28 2.70 0.60 1.50 2.70 0.60 8.10 0.00 0.00 0.00 - 0.00 8.10 4.00 12.10
1300 Broadberry et al., 2011, p. 36* 2.68 0.60 1.27 3.16 0.45 8.16 - 0.00 - 0.00 0.00 8.16 4.56 12.72
1300 Overton and Campbell, 1996, Table 5* 2.28 0.47 1.24 2.24 0.53 6.76 0.00 0.00 0.00 0.00 0.00 6.76 3.77 10.53
1380 Broadberry et al., 2011, p. 36* 1.83 0.36 1.22 1.87 0.47 5.75 - 0.00 - 0.00 0.00 5.75 3.89 9.64
1380 Overton and Campbell, 1996, Table 5* 1.49 0.16 1.26 1.10 0.69 4.70 0.00 0.00 0.00 0.00 0.00 4.70 3.22 7.92
1420 Broadberry et al., 2011, p. 36* 1.61 0.32 1.17 1.66 0.45 5.21 - 0.00 - 0.00 0.00 5.21 3.53 8.74
1450 Broadberry et al., 2011, p. 36* 1.53 0.31 1.15 1.59 0.44 5.02 - 0.00 - 0.00 0.00 5.02 3.41 8.43
1500 Allen, 2005, p. 28 1.80 0.20 1.50 1.30 1.20 6.00 0.00 0.00 0.00 - 0.00 6.00 3.00 9.00
1500 Broadberry et al., 2011, p. 36* 1.58 0.37 1.19 1.56 0.47 5.17 - 0.00 - 0.10 0.10 5.27 3.24 8.51
1600 Broadberry et al., 2011, p. 36* 1.85 0.77 1.44 1.32 0.61 5.99 - 0.00 - 0.72 0.72 6.71 2.16 8.87
1600 Muldrew, 2011, p. 143* 1.53 0.47 1.78 0.89 0.83 5.50 - - - 0.50 0.50 6.00 2.00 8.00
1600 Overton and Campbell, 1996, Table 5* 1.56 0.47 1.78 0.89 0.83 5.53 0.00 0.00 0.00 0.70 0.70 6.23 2.00 8.23
1650 Broadberry et al., 2011, p. 36* 2.00 0.39 1.86 1.13 1.02 6.40 - 0.00 - 1.36 1.36 7.76 1.88 9.64
1650 Muldrew, 2011, p. 143* 1.60 0.52 2.04 1.06 0.98 6.20 - - - 1.00 1.00 7.20 1.80 9.00
1695 Chartres, 1985, p. 444 1.36 0.89 1.90 1.22 - 5.38 - - - - - - - -
1700 Allen, 2005, p. 28 1.40 0.90 1.90 1.20 1.30 6.70 0.40 0.10 0.50 - 1.00 7.70 3.30 11.00
1700 Broadberry et al., 2011, p. 36* 1.99 0.42 1.82 1.15 0.98 6.36 - 0.00 - 1.30 1.30 7.66 1.91 9.57
1700 Muldrew, 2011, p. 143* 1.60 0.52 2.04 1.06 0.98 6.20 - - - 1.00 1.00 7.20 1.80 9.00
1700 Overton, 1996, p. 76 - - - - - - - - - - - 7.20 1.80 9.00
1700 Overton and Campbell, 1996, Table 5* 1.60 0.52 2.04 1.06 0.98 6.20 0.00 0.00 0.00 1.00 1.00 7.20 1.80 9.00
1750 Allen, 2005, p. 28 2.10 0.50 1.70 1.40 1.30 7.00 0.75 0.20 0.75 - 1.70 8.70 2.50 11.20
1750 Broadberry et al., 2011, p. 36* 1.95 0.06 1.50 1.82 0.98 6.31 - 0.08 - 2.53 2.61 8.92 1.59 10.51
1750 Chartres, 1985, p. 444 2.10 0.53 1.66 1.44 - 5.73 - - - - - - - -
1750 Holderness, 1985, p. 145 1.80 0.50 1.40 2.00 1.00 6.70 1.00 0.20 1.00 - 2.20 8.90 - -
1770 Muldrew, 2011, p. 143* 2.96 0.64 1.89 1.30 1.20 7.98 - - - 1.22 1.22 9.20 1.80 11.00
1770 Young, 1771b, pp. 256-61 (Prince, 1989, p. 31) - - - - - - - - - - - 10.30 - 10.30
1770 Young, 1771b, pp. 256-61 (John, 1989, p. 1045) 2.80 - 2.60 1.50 0.9 7.80 1.70 - 3.20 - 4.90 12.70 0.80 13.50
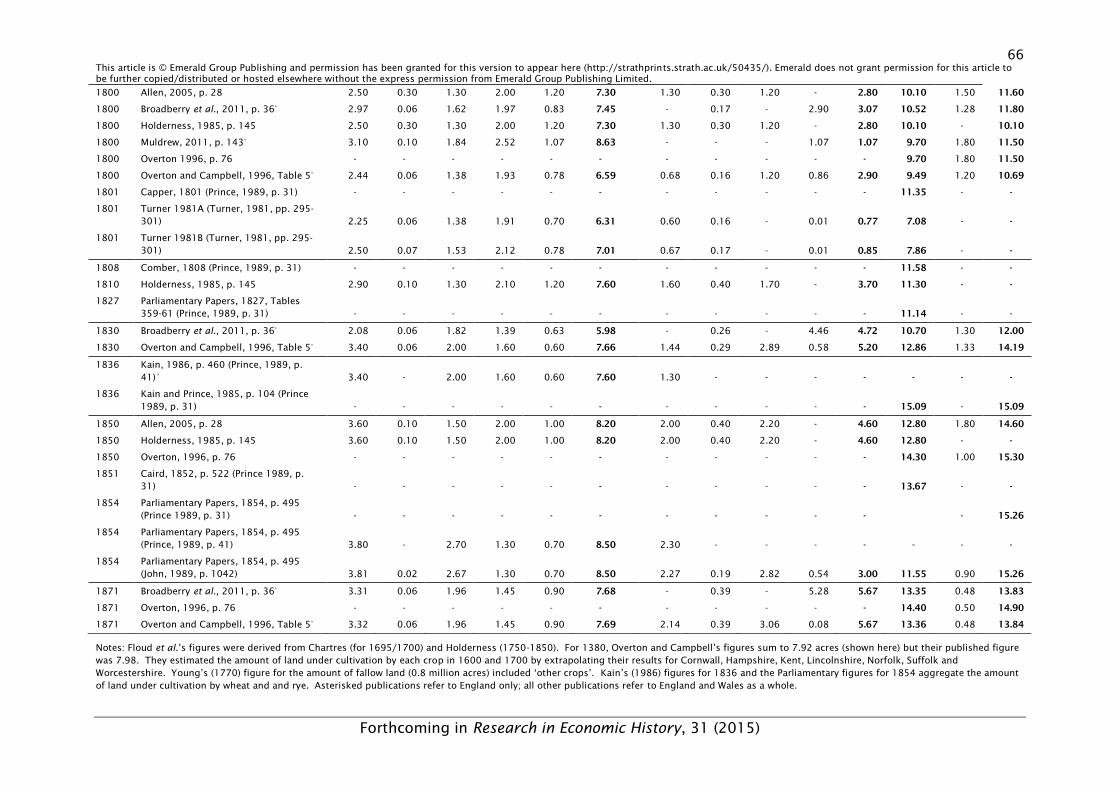
66 This article is © Emerald Group Publishing and permission has been granted for this version to appear here (http://strathprints.strath.ac.uk/50435/). Emerald does not grant permission for this article to be further copied/distributed or hosted elsewhere without the express permission from Emerald Group Publishing Limited.
Forthcoming in Research in Economic History, 31 (2015)
1800 Allen, 2005, p. 28 2.50 0.30 1.30 2.00 1.20 7.30 1.30 0.30 1.20 - 2.80 10.10 1.50 11.60
1800 Broadberry et al., 2011, p. 36* 2.97 0.06 1.62 1.97 0.83 7.45 - 0.17 - 2.90 3.07 10.52 1.28 11.80
1800 Holderness, 1985, p. 145 2.50 0.30 1.30 2.00 1.20 7.30 1.30 0.30 1.20 - 2.80 10.10 - 10.10
1800 Muldrew, 2011, p. 143* 3.10 0.10 1.84 2.52 1.07 8.63 - - - 1.07 1.07 9.70 1.80 11.50
1800 Overton 1996, p. 76 - - - - - - - - - - - 9.70 1.80 11.50
1800 Overton and Campbell, 1996, Table 5* 2.44 0.06 1.38 1.93 0.78 6.59 0.68 0.16 1.20 0.86 2.90 9.49 1.20 10.69
1801 Capper, 1801 (Prince, 1989, p. 31) - - - - - - - - - - - 11.35 - -
1801 Turner 1981A (Turner, 1981, pp. 295-301) 2.25 0.06 1.38 1.91 0.70 6.31 0.60 0.16 - 0.01 0.77 7.08 - -
1801 Turner 1981B (Turner, 1981, pp. 295-301) 2.50 0.07 1.53 2.12 0.78 7.01 0.67 0.17 - 0.01 0.85 7.86 - -
1808 Comber, 1808 (Prince, 1989, p. 31) - - - - - - - - - - - 11.58 - -
1810 Holderness, 1985, p. 145 2.90 0.10 1.30 2.10 1.20 7.60 1.60 0.40 1.70 - 3.70 11.30 - -
1827 Parliamentary Papers, 1827, Tables 359-61 (Prince, 1989, p. 31) - - - - - - - - - - - 11.14 - -
1830 Broadberry et al., 2011, p. 36* 2.08 0.06 1.82 1.39 0.63 5.98 - 0.26 - 4.46 4.72 10.70 1.30 12.00
1830 Overton and Campbell, 1996, Table 5* 3.40 0.06 2.00 1.60 0.60 7.66 1.44 0.29 2.89 0.58 5.20 12.86 1.33 14.19
1836 Kain, 1986, p. 460 (Prince, 1989, p. 41) * 3.40 - 2.00 1.60 0.60 7.60 1.30 - - - - - - -
1836 Kain and Prince, 1985, p. 104 (Prince 1989, p. 31) - - - - - - - - - - - 15.09 - 15.09
1850 Allen, 2005, p. 28 3.60 0.10 1.50 2.00 1.00 8.20 2.00 0.40 2.20 - 4.60 12.80 1.80 14.60
1850 Holderness, 1985, p. 145 3.60 0.10 1.50 2.00 1.00 8.20 2.00 0.40 2.20 - 4.60 12.80 - -
1850 Overton, 1996, p. 76 - - - - - - - - - - - 14.30 1.00 15.30
1851 Caird, 1852, p. 522 (Prince 1989, p. 31) - - - - - - - - - - - 13.67 - -
1854 Parliamentary Papers, 1854, p. 495 (Prince 1989, p. 31) - - - - - - - - - - - - 15.26
1854 Parliamentary Papers, 1854, p. 495 (Prince, 1989, p. 41) 3.80 - 2.70 1.30 0.70 8.50 2.30 - - - - - - -
1854 Parliamentary Papers, 1854, p. 495 (John, 1989, p. 1042) 3.81 0.02 2.67 1.30 0.70 8.50 2.27 0.19 2.82 0.54 3.00 11.55 0.90 15.26
1871 Broadberry et al., 2011, p. 36* 3.31 0.06 1.96 1.45 0.90 7.68 - 0.39 - 5.28 5.67 13.35 0.48 13.83
1871 Overton, 1996, p. 76 - - - - - - - - - - - 14.40 0.50 14.90
1871 Overton and Campbell, 1996, Table 5* 3.32 0.06 1.96 1.45 0.90 7.69 2.14 0.39 3.06 0.08 5.67 13.36 0.48 13.84
Notes: Floud et al.’s figures were derived from Chartres (for 1695/1700) and Holderness (1750-1850). For 1380, Overton and Campbell’s figures sum to 7.92 acres (shown here) but their published figure was 7.98. They estimated the amount of land under cultivation by each crop in 1600 and 1700 by extrapolating their results for Cornwall, Hampshire, Kent, Lincolnshire, Norfolk, Suffolk and Worcestershire. Young’s (1770) figure for the amount of fallow land (0.8 million acres) included ‘other crops’. Kain’s (1986) figures for 1836 and the Parliamentary figures for 1854 aggregate the amount of land under cultivation by wheat and and rye. Asterisked publications refer to England only; all other publications refer to England and Wales as a whole.
67 This article is © Emerald Group Publishing and permission has been granted for this version to appear here (http://strathprints.strath.ac.uk/50435/). Emerald does not grant permission for this article to be further copied/distributed or hosted elsewhere without the express permission from Emerald Group Publishing Limited.
Forthcoming in Research in Economic History, 31 (2015)
Sources: See Table.
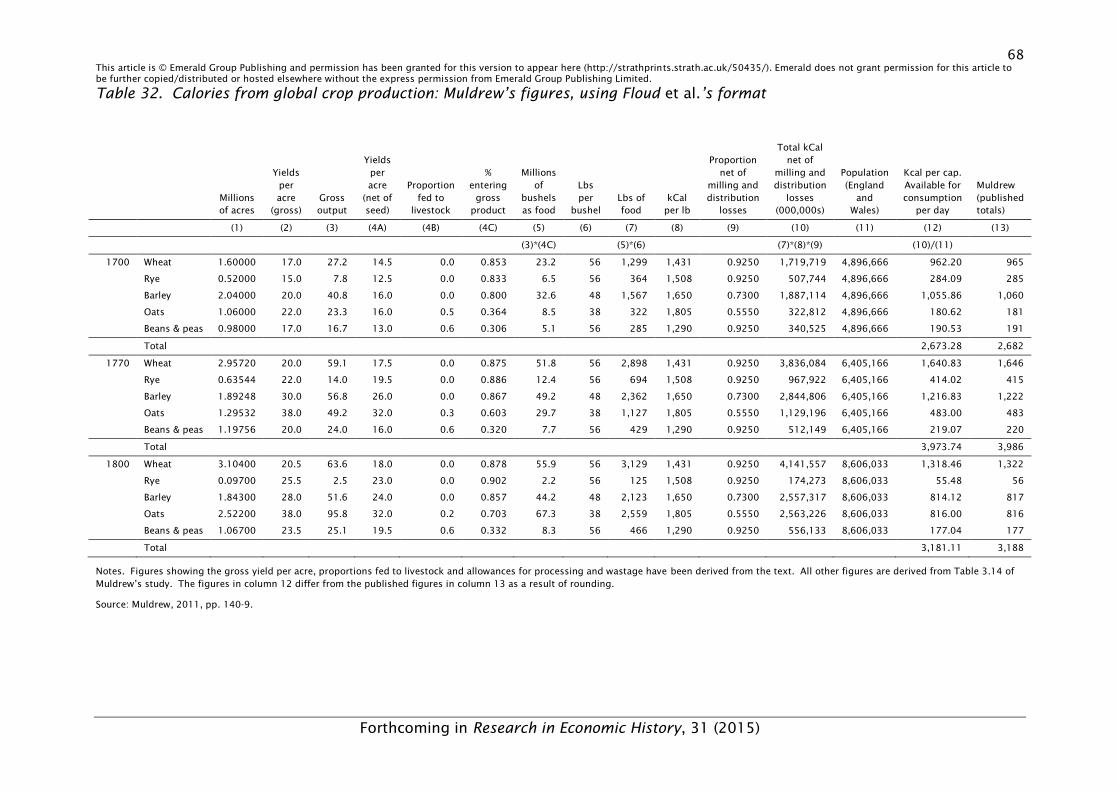
68 This article is © Emerald Group Publishing and permission has been granted for this version to appear here (http://strathprints.strath.ac.uk/50435/). Emerald does not grant permission for this article to be further copied/distributed or hosted elsewhere without the express permission from Emerald Group Publishing Limited.
Forthcoming in Research in Economic History, 31 (2015)
Table 32. Calories from global crop production: Muldrew’s figures, using Floud et al.’s format
Millions of acres
Yields per acre
(gross) Gross output
Yields per acre
(net of seed)
Proportion fed to
livestock
% entering
gross product
Millions of
bushels as food
Lbs per
bushel Lbs of food
kCal per lb
Proportion net of
milling and distribution
losses
Total kCal net of
milling and distribution
losses (000,000s)
Population (England
and Wales)
Kcal per cap. Available for consumption
per day
Muldrew (published totals)
(1) (2) (3) (4A) (4B) (4C) (5) (6) (7) (8) (9) (10) (11) (12) (13)
(3)*(4C) (5)*(6) (7)*(8)*(9) (10)/(11)
1700 Wheat 1.60000 17.0 27.2 14.5 0.0 0.853 23.2 56 1,299 1,431 0.9250 1,719,719 4,896,666 962.20 965
Rye 0.52000 15.0 7.8 12.5 0.0 0.833 6.5 56 364 1,508 0.9250 507,744 4,896,666 284.09 285
Barley 2.04000 20.0 40.8 16.0 0.0 0.800 32.6 48 1,567 1,650 0.7300 1,887,114 4,896,666 1,055.86 1,060
Oats 1.06000 22.0 23.3 16.0 0.5 0.364 8.5 38 322 1,805 0.5550 322,812 4,896,666 180.62 181
Beans & peas 0.98000 17.0 16.7 13.0 0.6 0.306 5.1 56 285 1,290 0.9250 340,525 4,896,666 190.53 191
Total 2,673.28 2,682
1770 Wheat 2.95720 20.0 59.1 17.5 0.0 0.875 51.8 56 2,898 1,431 0.9250 3,836,084 6,405,166 1,640.83 1,646
Rye 0.63544 22.0 14.0 19.5 0.0 0.886 12.4 56 694 1,508 0.9250 967,922 6,405,166 414.02 415
Barley 1.89248 30.0 56.8 26.0 0.0 0.867 49.2 48 2,362 1,650 0.7300 2,844,806 6,405,166 1,216.83 1,222
Oats 1.29532 38.0 49.2 32.0 0.3 0.603 29.7 38 1,127 1,805 0.5550 1,129,196 6,405,166 483.00 483
Beans & peas 1.19756 20.0 24.0 16.0 0.6 0.320 7.7 56 429 1,290 0.9250 512,149 6,405,166 219.07 220
Total 3,973.74 3,986
1800 Wheat 3.10400 20.5 63.6 18.0 0.0 0.878 55.9 56 3,129 1,431 0.9250 4,141,557 8,606,033 1,318.46 1,322
Rye 0.09700 25.5 2.5 23.0 0.0 0.902 2.2 56 125 1,508 0.9250 174,273 8,606,033 55.48 56
Barley 1.84300 28.0 51.6 24.0 0.0 0.857 44.2 48 2,123 1,650 0.7300 2,557,317 8,606,033 814.12 817
Oats 2.52200 38.0 95.8 32.0 0.2 0.703 67.3 38 2,559 1,805 0.5550 2,563,226 8,606,033 816.00 816
Beans & peas 1.06700 23.5 25.1 19.5 0.6 0.332 8.3 56 466 1,290 0.9250 556,133 8,606,033 177.04 177
Total 3,181.11 3,188
Notes. Figures showing the gross yield per acre, proportions fed to livestock and allowances for processing and wastage have been derived from the text. All other figures are derived from Table 3.14 of Muldrew’s study. The figures in column 12 differ from the published figures in column 13 as a result of rounding.
Source: Muldrew, 2011, pp. 140-9.
69 This article is © Emerald Group Publishing and permission has been granted for this version to appear here (http://strathprints.strath.ac.uk/50435/). Emerald does not grant permission for this article to be further copied/distributed or hosted elsewhere without the express permission from Emerald Group Publishing Limited.
Forthcoming in Research in Economic History, 31 (2015)
Table 32 also enables us to see the amount of grain which Muldrew allocated
to animals. He assumed that the only crops fed to animals were oats, beans and
peas. However, in contrast to Overton and Campbell (1996, pp. 292-5; 2006, pp.
37-44), he also assumed that the proportion of the oat crop which was fed to
animals declined over the course of the century, with the result that a much higher
proportion of the original crop remained available for human consumption. On the
other hand, he also assumed that animals consumed a higher proportion of beans
and peas.
One of the most important areas of disagreement concerns the amount of
crop lost as a result of processing and wastage. Muldrew (2011, pp. 146-7)
assumed that none of the wheat, rye or beans and peas was lost as a result of
processing and that, after making allowances for seeding, only 7.5 per cent of the
remaining crop was lost as a result of wastage (primarily, as a result of mice and
mould). He argued that a similar proportion of the barley and oat crop was also
wasted, but that these losses were augmented by the effects of processing. He
assumed that forty per cent of the raw oat crop was lost in the process of
converting it to oatmeal, which brought his final figure much closer to Floud et al.’s,
but that only twenty per cent of barley was lost in this way. In contrast to Overton
and Campbell (1996, pp. 292-5; 2006, pp. 37-44), he also assumed that the
proportion of barley brewed as beer remained constant over the course of the
century, whereas they assumed that it increased.
Muldrew also reached different conclusions about the number of calories
derived from meat and, especially, dairy products. Although he estimated that the
calorific value of the meat derived from cattle, sheep and pigs was generally lower
than Floud et al., he also assumed that the number of animals was much larger.
However, in comparison with the estimated value of the food consumed from other
70 This article is © Emerald Group Publishing and permission has been granted for this version to appear here (http://strathprints.strath.ac.uk/50435/). Emerald does not grant permission for this article to be further copied/distributed or hosted elsewhere without the express permission from Emerald Group Publishing Limited.
Forthcoming in Research in Economic History, 31 (2015)
sources, the differences were not very large. If we bear in mind that our figures for
Muldrew in 1750 and for Floud et al. in 1770 have been interpolated from other
data, then the information in Table 32 implies that Muldrew’s consumers derived
substantially more calories from meat in 1700 and 1770, but similar amounts in
1750 and 1800.
These differences are less marked, and less systematic, than the differences in
the numbers of calories derived from dairy products. Floud et al. derived their
estimates of the number of calories obtained from milk, butter and cheese in 1750,
1800 and 1850 from Holderness (1989, p. 170) and estimated the number of dairy
calories in 1700 from the ratio of meat products to dairy products in 1750.
Muldrew estimated the total number of milk cows in 1700 using information from
Gregory King (1696) and then assumed that the number did not change for the rest
of the century. However, he did assume that the average yield per cow increased by
25 per cent between 1700 and 1770. He did not attempt to distinguish between
calories consumed as milk and calories consumed as cheese or butter, but he did
assume that 20 per cent of all calories were ‘lost’ in the form of animal feed.
It is difficult to compare the two sets of figures directly because Floud et al.
only offered detailed breakdowns of their figures for 1750, 1800 and 1850, and
Muldrew only provided detailed figures for 1700 and 1770, although we can infer
the nature of his calculations for 1800 from this. However, Table 34 suggests that
the two sets of figures differ mainly because of assumptions about the number of
animals producing dairy products. Although King (1696, p. 54) estimated the
overall number of ‘beeves, sterks and calves’ as 4.5 million, he did not attempt to
break the figures down further, and Muldrew’s suggestion of 1.1 million milk cows
must therefore be regarded as conjecture. Both King’s figures and Muldrew’s can
also be contrasted with the figures suggested by Arthur Young in 1771 and by the
71 This article is © Emerald Group Publishing and permission has been granted for this version to appear here (http://strathprints.strath.ac.uk/50435/). Emerald does not grant permission for this article to be further copied/distributed or hosted elsewhere without the express permission from Emerald Group Publishing Limited.
Forthcoming in Research in Economic History, 31 (2015)
Poor Law Inspectors in 1854. Young (1771b, pp. 256-61) estimated that there were
741,532 milk cows in the whole of England and Wales in 1770, and A.H. John’s
(1989, p. 1044) calculations suggest that this figure had only risen to 1.38 million
more than eighty years later.
5. The search for compromise
The number and variety of the estimates offered by different authors has
encouraged others to enter the field. Kelly and Ó Gráda have contrasted Broadberry
et al.’s estimates with Muldrew’s and suggested alternatives to both. However,
some of their revisions are fairly approximate and they still leave a large gap
between the two series (Kelly and Ó Gráda 2013b. p. 3 [Appendix Table 3]; see also
Appendix 1 below). Meredith and Oxley’s (2014) project was more ambitious. They
contrasted Muldrew’s estimates with those of Floud et al. and also examined the
effect of applying the different authors’ assumptions to each other’s data. This
enabled them to recalculate Muldrew’s figures by using Floud et al.’s assumptions
about seeding, animal consumption, processing and wastage, and adding the
resulting estimates to Muldrew’s own figures for the number of calories obtained
from meat and dairy products. They then combined these figures with Floud et al.’s
data for imports and exports in 1700 and 1800 to produce a new series of total
calories available per person per day net of trade, and used Floud et al.’s data for
1850 and 1909/13 to extend this series to the start of the First World War.
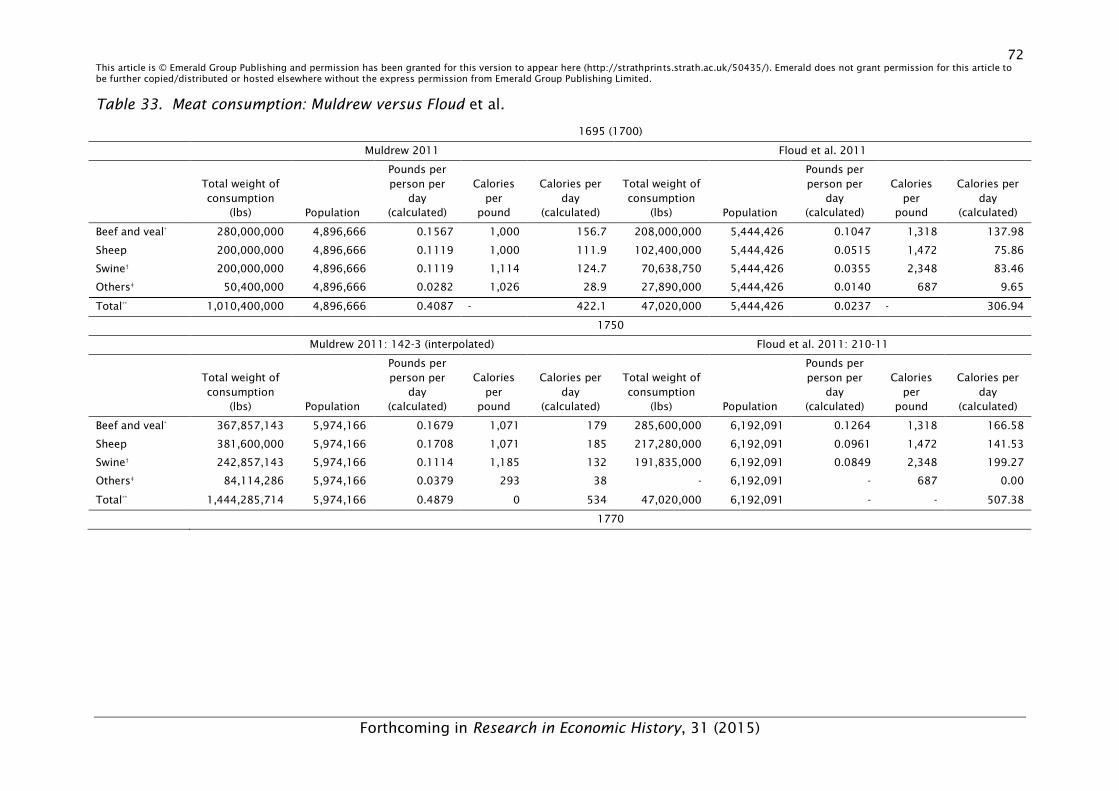
72 This article is © Emerald Group Publishing and permission has been granted for this version to appear here (http://strathprints.strath.ac.uk/50435/). Emerald does not grant permission for this article to be further copied/distributed or hosted elsewhere without the express permission from Emerald Group Publishing Limited.
Forthcoming in Research in Economic History, 31 (2015)
Table 33. Meat consumption: Muldrew versus Floud et al.
1695 (1700)
Muldrew 2011 Floud et al. 2011
Total weight of consumption
(lbs) Population
Pounds per person per
day (calculated)
Calories per
pound
Calories per day
(calculated)
Total weight of consumption
(lbs) Population
Pounds per person per
day (calculated)
Calories per
pound
Calories per day
(calculated)
Beef and veal* 280,000,000 4,896,666 0.1567 1,000 156.7 208,000,000 5,444,426 0.1047 1,318 137.98
Sheep 200,000,000 4,896,666 0.1119 1,000 111.9 102,400,000 5,444,426 0.0515 1,472 75.86
Swine† 200,000,000 4,896,666 0.1119 1,114 124.7 70,638,750 5,444,426 0.0355 2,348 83.46
Others‡ 50,400,000 4,896,666 0.0282 1,026 28.9 27,890,000 5,444,426 0.0140 687 9.65
Total** 1,010,400,000 4,896,666 0.4087 - 422.1 47,020,000 5,444,426 0.0237 - 306.94
1750
Muldrew 2011: 142-3 (interpolated) Floud et al. 2011: 210-11
Total weight of consumption
(lbs) Population
Pounds per person per
day (calculated)
Calories per
pound
Calories per day
(calculated)
Total weight of consumption
(lbs) Population
Pounds per person per
day (calculated)
Calories per
pound
Calories per day
(calculated)
Beef and veal* 367,857,143 5,974,166 0.1679 1,071 179 285,600,000 6,192,091 0.1264 1,318 166.58
Sheep 381,600,000 5,974,166 0.1708 1,071 185 217,280,000 6,192,091 0.0961 1,472 141.53
Swine† 242,857,143 5,974,166 0.1114 1,185 132 191,835,000 6,192,091 0.0849 2,348 199.27
Others‡ 84,114,286 5,974,166 0.0379 293 38 - 6,192,091 - 687 0.00
Total** 1,444,285,714 5,974,166 0.4879 0 534 47,020,000 6,192,091 - - 507.38
1770
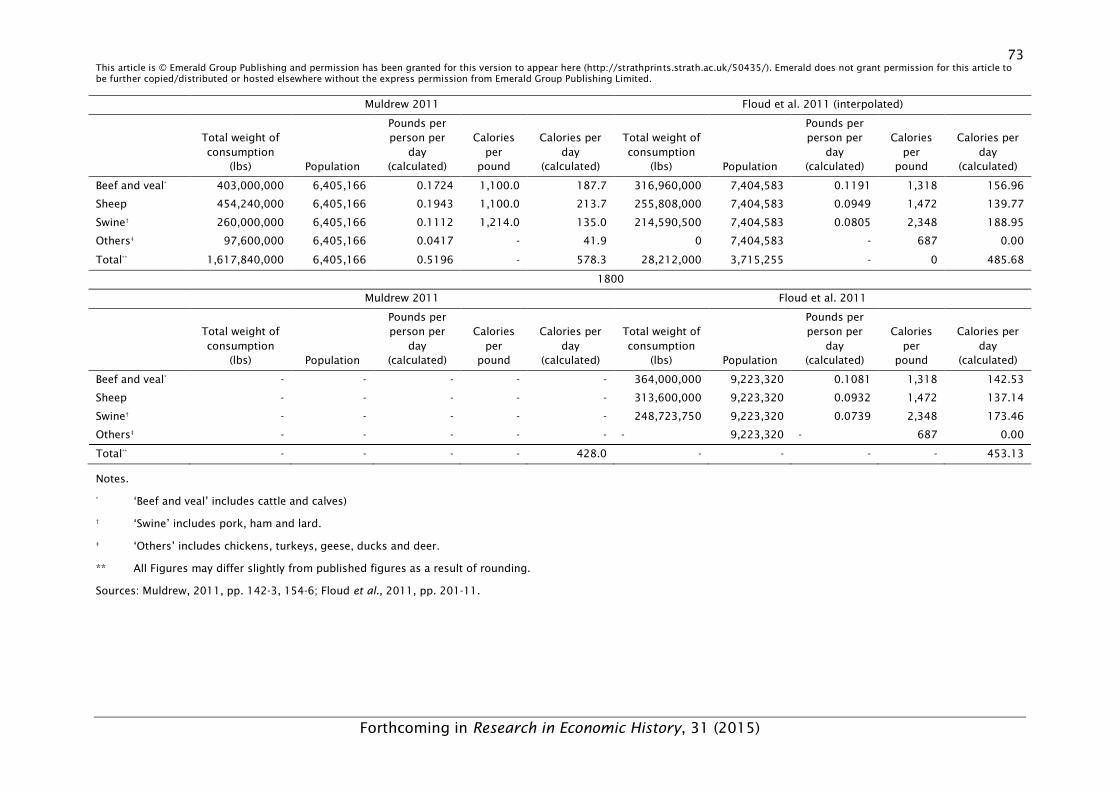
73 This article is © Emerald Group Publishing and permission has been granted for this version to appear here (http://strathprints.strath.ac.uk/50435/). Emerald does not grant permission for this article to be further copied/distributed or hosted elsewhere without the express permission from Emerald Group Publishing Limited.
Forthcoming in Research in Economic History, 31 (2015)
Muldrew 2011 Floud et al. 2011 (interpolated)
Total weight of consumption
(lbs) Population
Pounds per person per
day (calculated)
Calories per
pound
Calories per day
(calculated)
Total weight of consumption
(lbs) Population
Pounds per person per
day (calculated)
Calories per
pound
Calories per day
(calculated)
Beef and veal* 403,000,000 6,405,166 0.1724 1,100.0 187.7 316,960,000 7,404,583 0.1191 1,318 156.96
Sheep 454,240,000 6,405,166 0.1943 1,100.0 213.7 255,808,000 7,404,583 0.0949 1,472 139.77
Swine† 260,000,000 6,405,166 0.1112 1,214.0 135.0 214,590,500 7,404,583 0.0805 2,348 188.95
Others‡ 97,600,000 6,405,166 0.0417 - 41.9 0 7,404,583 - 687 0.00
Total** 1,617,840,000 6,405,166 0.5196 - 578.3 28,212,000 3,715,255 - 0 485.68
1800
Muldrew 2011 Floud et al. 2011
Total weight of consumption
(lbs) Population
Pounds per person per
day (calculated)
Calories per
pound
Calories per day
(calculated)
Total weight of consumption
(lbs) Population
Pounds per person per
day (calculated)
Calories per
pound
Calories per day
(calculated)
Beef and veal* - - - - - 364,000,000 9,223,320 0.1081 1,318 142.53
Sheep - - - - - 313,600,000 9,223,320 0.0932 1,472 137.14
Swine† - - - - - 248,723,750 9,223,320 0.0739 2,348 173.46
Others‡ - - - - - - 9,223,320 - 687 0.00
Total** - - - - 428.0 - - - - 453.13
Notes.
* ‘Beef and veal’ includes cattle and calves)
† ‘Swine’ includes pork, ham and lard.
‡ ‘Others’ includes chickens, turkeys, geese, ducks and deer.
** All Figures may differ slightly from published figures as a result of rounding.
Sources: Muldrew, 2011, pp. 142-3, 154-6; Floud et al., 2011, pp. 201-11.
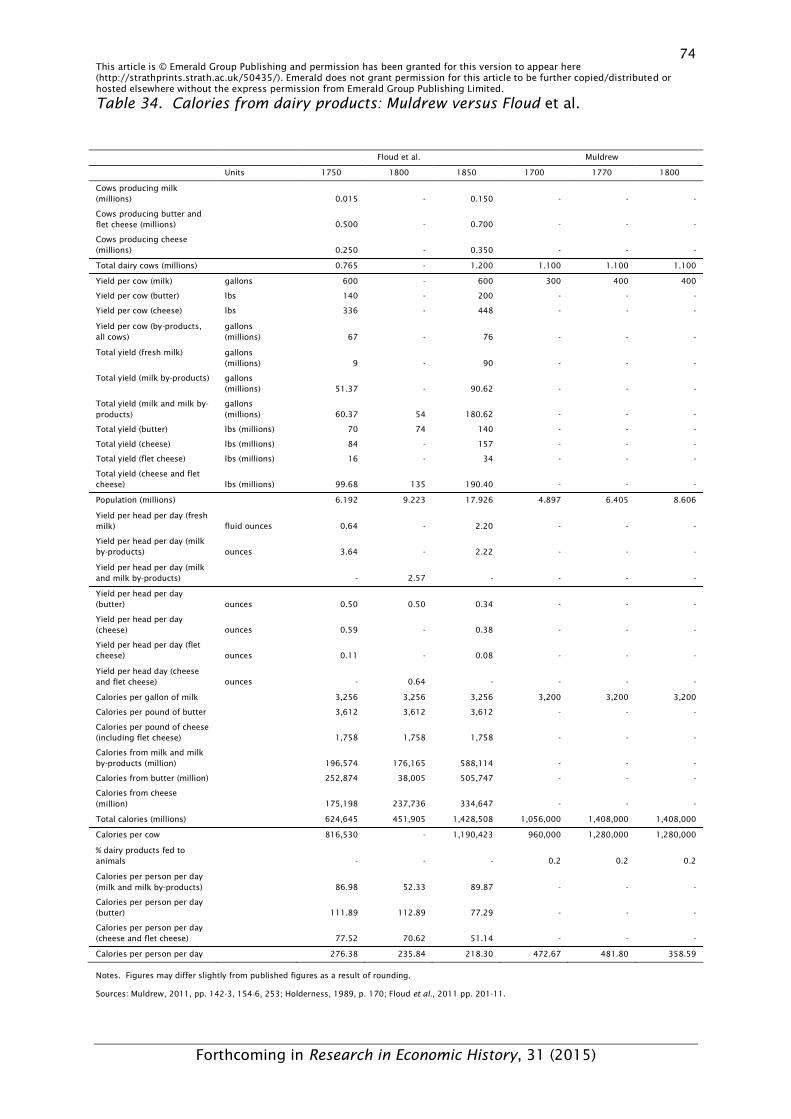
74 This article is © Emerald Group Publishing and permission has been granted for this version to appear here (http://strathprints.strath.ac.uk/50435/). Emerald does not grant permission for this article to be further copied/distributed or hosted elsewhere without the express permission from Emerald Group Publishing Limited.
Forthcoming in Research in Economic History, 31 (2015)
Table 34. Calories from dairy products: Muldrew versus Floud et al.
Floud et al. Muldrew
Units 1750 1800 1850 1700 1770 1800
Cows producing milk (millions) 0.015 - 0.150 - - -
Cows producing butter and flet cheese (millions) 0.500 - 0.700 - - -
Cows producing cheese (millions) 0.250 - 0.350 - - -
Total dairy cows (millions) 0.765 - 1.200 1.100 1.100 1.100
Yield per cow (milk) gallons 600 - 600 300 400 400
Yield per cow (butter) lbs 140 - 200 - - -
Yield per cow (cheese) lbs 336 - 448 - - -
Yield per cow (by-products, all cows)
gallons (millions) 67 - 76 - - -
Total yield (fresh milk) gallons (millions) 9 - 90 - - -
Total yield (milk by-products) gallons (millions) 51.37 - 90.62 - - -
Total yield (milk and milk by-products)
gallons (millions) 60.37 54 180.62 - - -
Total yield (butter) lbs (millions) 70 74 140 - - -
Total yield (cheese) lbs (millions) 84 - 157 - - -
Total yield (flet cheese) lbs (millions) 16 - 34 - - -
Total yield (cheese and flet cheese) lbs (millions) 99.68 135 190.40 - - -
Population (millions) 6.192 9.223 17.926 4.897 6.405 8.606
Yield per head per day (fresh milk) fluid ounces 0.64 - 2.20 - - -
Yield per head per day (milk by-products) ounces 3.64 - 2.22 - - -
Yield per head per day (milk and milk by-products) - 2.57 - - - -
Yield per head per day (butter) ounces 0.50 0.50 0.34 - - -
Yield per head per day (cheese) ounces 0.59 - 0.38 - - -
Yield per head per day (flet cheese) ounces 0.11 - 0.08 - - -
Yield per head day (cheese and flet cheese) ounces - 0.64 - - - -
Calories per gallon of milk 3,256 3,256 3,256 3,200 3,200 3,200
Calories per pound of butter 3,612 3,612 3,612 - - -
Calories per pound of cheese (including flet cheese) 1,758 1,758 1,758 - - -
Calories from milk and milk by-products (million) 196,574 176,165 588,114 - - -
Calories from butter (million) 252,874 38,005 505,747 - - -
Calories from cheese (million) 175,198 237,736 334,647 - - -
Total calories (millions) 624,645 451,905 1,428,508 1,056,000 1,408,000 1,408,000
Calories per cow 816,530 - 1,190,423 960,000 1,280,000 1,280,000
% dairy products fed to animals - - - 0.2 0.2 0.2
Calories per person per day (milk and milk by-products) 86.98 52.33 89.87 - - -
Calories per person per day (butter) 111.89 112.89 77.29 - - -
Calories per person per day (cheese and flet cheese) 77.52 70.62 51.14 - - -
Calories per person per day 276.38 235.84 218.30 472.67 481.80 358.59
Notes. Figures may differ slightly from published figures as a result of rounding.
Sources: Muldrew, 2011, pp. 142-3, 154-6, 253; Holderness, 1989, p. 170; Floud et al., 2011 pp. 201-11.
75 This article is © Emerald Group Publishing and permission has been granted for this version to appear here (http://strathprints.strath.ac.uk/50435/). Emerald does not grant permission for this article to be further copied/distributed or hosted elsewhere without the express permission from Emerald Group Publishing Limited.
Forthcoming in Research in Economic History, 31 (2015)
Although this strategy helps to modify some of Muldrew’s original claims, it
also raises new questions of its own. As we have already seen, there are some
minor differences between the figures which Muldrew and Floud et al. used to
convert bushels into pounds and to estimate the calorific value of different cereals,
and a more serious difference between the figures they used to calculate the
calorific value of beans and peas. They also used different values to calculate the
number of calories obtained from meat and dairy products. Although these
differences are not particularly dramatic, they do create inconsistencies when
seeking to create a single series which uses Muldrew’s values to estimate the
number of calories derived from domestic food products between 1700 and 1800,
and Floud et al.’s values to calculate the calorific value of domestically-produced
food between 1850 and 1909/13, and the calorific value of imported foods over the
period as a whole.
Meredith and Oxley’s paper also raises some important questions about the
overall trajectory of domestic agriculture during the eighteenth and nineteenth
centuries. As we have already seen, Muldrew did not attempt to extend his series
beyond 1800, and this meant that he was able to avoid a direct contrast between
his estimates and those of nineteenth-century observers. However, by combining
his figures on the amount of land under cultivation and the number of cattle in the
eighteenth century with Floud et al.’s figures for the nineteenth century, Meredith
and Oxley are forced into the position of not only accepting his eighteenth-century
figures, but also accepting that the pace of change during the first half of the
nineteenth century was much lower than other accounts might suggest. It then
becomes necessary to explain, not only why increases in domestic agricultural
76 This article is © Emerald Group Publishing and permission has been granted for this version to appear here (http://strathprints.strath.ac.uk/50435/). Emerald does not grant permission for this article to be further copied/distributed or hosted elsewhere without the express permission from Emerald Group Publishing Limited.
Forthcoming in Research in Economic History, 31 (2015)
production were so marked before 1800, but also why the pace of change was so
much slower in the fifty years which followed.
Meredith and Oxley have also sought to reinforce their revised food estimates
by comparing them with information on prices and stature. They argue that ‘when
nutrition was improving over the eighteenth century, prices were low. When per
capita output dropped, food prices escalated, exacerbated by war expenditure.
When war ended, prices stabilised, but at a higher level than earlier, squeezing
family incomes at a time when families had more mouths than ever before’
(Meredith and Oxley, 2014, p. 184). However, while this may be true, it is also
important to take account of changing wage levels. When wages and prices are
combined, the case for nutritional pessimism becomes less convincing.
We can explore this question in more detail by comparing three sets of price
and wage estimates. Figure 2 is derived from Gregory Clark’s (2007, Table 4)
calculations, showing changes in farm workers’ wages and the cost of living
between 1700 and 1849. It shows that prices did indeed rise sharply from the
1780s onwards, but so did wages, and the increase in wages appears to have
outstripped prices from the early-1800s. Figure 3 compares Phelps Brown and
Hopkins’ classic account of real wages in the country as a whole with the more
recent series published by Charles Feinstein (1998) and Robert Allen (2007). In
contrast to the earlier work, both Feinstein and Allen found evidence of a slow
improvement in purchasing power between 1770 and 1800, followed by a period of
more rapid improvement beginning in either the 1820s or 1830s.
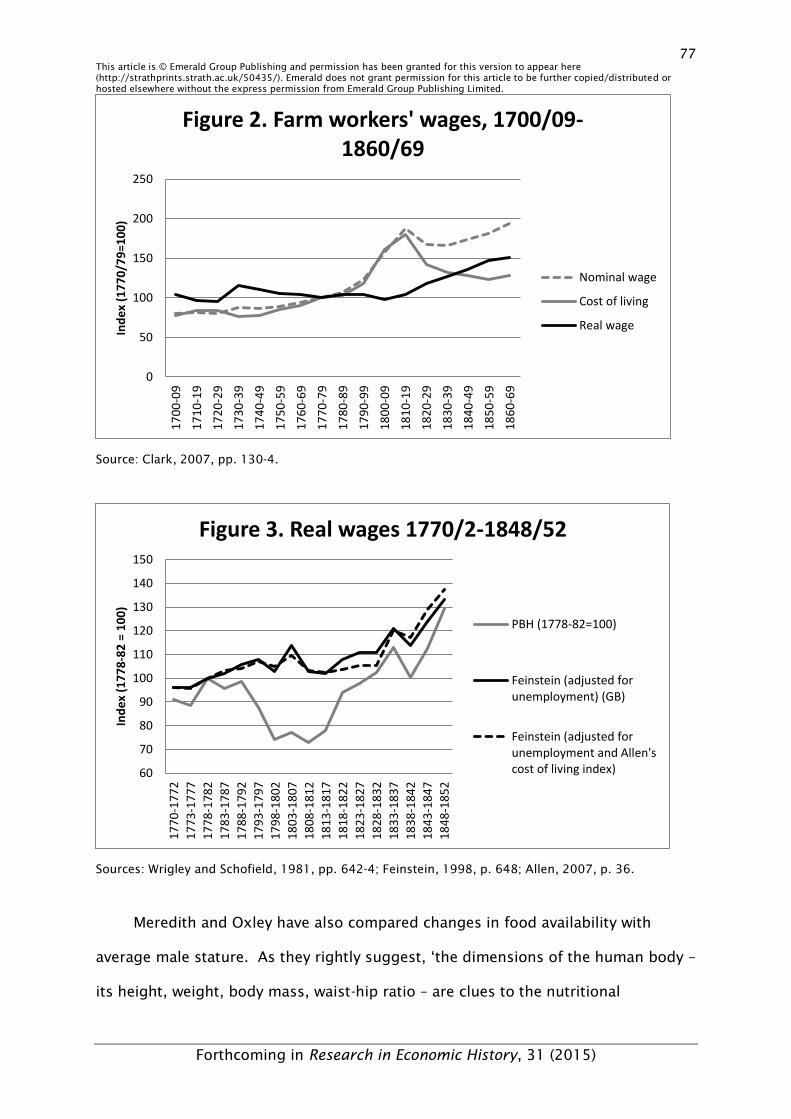
77 This article is © Emerald Group Publishing and permission has been granted for this version to appear here (http://strathprints.strath.ac.uk/50435/). Emerald does not grant permission for this article to be further copied/distributed or hosted elsewhere without the express permission from Emerald Group Publishing Limited.
Forthcoming in Research in Economic History, 31 (2015)
Source: Clark, 2007, pp. 130-4.
Sources: Wrigley and Schofield, 1981, pp. 642-4; Feinstein, 1998, p. 648; Allen, 2007, p. 36.
Meredith and Oxley have also compared changes in food availability with
average male stature. As they rightly suggest, ‘the dimensions of the human body –
its height, weight, body mass, waist-hip ratio – are clues to the nutritional
0
50
100
150
200
2501
70
0-0
9
17
10
-19
17
20
-29
17
30
-39
17
40
-49
17
50
-59
17
60
-69
17
70
-79
17
80
-89
17
90
-99
18
00
-09
18
10
-19
18
20
-29
18
30
-39
18
40
-49
18
50
-59
18
60
-69
Ind
ex
(1
77
0/7
9=
10
0)
Figure 2. Farm workers' wages, 1700/09-
1860/69
Nominal wage
Cost of living
Real wage
60
70
80
90
100
110
120
130
140
150
17
70
-17
72
17
73
-17
77
17
78
-17
82
17
83
-17
87
17
88
-17
92
17
93
-17
97
17
98
-18
02
18
03
-18
07
18
08
-18
12
18
13
-18
17
18
18
-18
22
18
23
-18
27
18
28
-18
32
18
33
-18
37
18
38
-18
42
18
43
-18
47
18
48
-18
52
Ind
ex
(1
77
8-8
2 =
10
0)
Figure 3. Real wages 1770/2-1848/52
PBH (1778-82=100)
Feinstein (adjusted for
unemployment) (GB)
Feinstein (adjusted for
unemployment and Allen's
cost of living index)
78 This article is © Emerald Group Publishing and permission has been granted for this version to appear here (http://strathprints.strath.ac.uk/50435/). Emerald does not grant permission for this article to be further copied/distributed or hosted elsewhere without the express permission from Emerald Group Publishing Limited.
Forthcoming in Research in Economic History, 31 (2015)
experience of individuals’ (Meredith and Oxley, 2014, p. 184), although it is
important to emphasise that height itself measures the net impact of diet on human
growth after taking account of the demands imposed by physical activity and the
disease environment. Their argument that changes in average stature reflect
increases in nutritional hardship is based on four anthropometric series. Three of
these were drawn from the measurements of convicts and prisoners, and the fourth
from military data.
Meredith and Oxley obtained data on the heights of men who were imprisoned
in Bedford and Wandsworth (London), and compared these with the heights of
convicts who were transported from Britain to New South Wales and Van Diemen’s
Land. The oldest men in the Wandsworth dataset were only born during the second
decade of the nineteenth century and therefore provide limited information about
trends in height before that period, and neither the Bedford prisoners nor the
Australian convicts provide unequivocal evidence of declines in stature before the
1820s (see Meredith and Oxley, 2014, pp. 188-91). However, Meredith and Oxley
also revisited Floud et al.’s (1990) military data. Their reworking of these statistics
provided much sharper evidence of a decline in stature from the birth cohorts of the
1770s onwards.
The estimation of the height of eighteenth-century military recruits has long
been the subject of controversy. A number of authors, including John Komlos
(Komlos, 1993a, 1993b; Komlos and Küchenhoff, 2012) and Francesco Cinnirella
(2008), have argued that the data provide evidence of declines in stature of up to
five inches (12.7 cm) between the birth cohorts of the 1740s and the 1850s. By
contrast, Floud et al. (1990, pp. 134-49) argued that there was a slow and irregular
improvement in the average height of successive cohorts of British males born
between the 1740s and the 1820s.
79 This article is © Emerald Group Publishing and permission has been granted for this version to appear here (http://strathprints.strath.ac.uk/50435/). Emerald does not grant permission for this article to be further copied/distributed or hosted elsewhere without the express permission from Emerald Group Publishing Limited.
Forthcoming in Research in Economic History, 31 (2015)
One of the main areas of contention has been the question of whether, and at
what point, it might be appropriate to pool the results obtained from the analysis of
the Army and the Marines. Komlos (1993a, p. 132) and Cinnirella (2008, p. 328)
argued that the two services recruited men from different sections of the population
and should therefore be treated separately. Floud et al. (1990, pp. 139-50; 1993,
pp. 147-8) argued that recruits to both the Army and the Marines were drawn from
the same section of the population (the male working class) and that the allocation
of recruits to different services was simply a matter of military convenience.
Meredith and Oxley agreed with Floud, Wachter and Gregory on this point.
However, they also noted that the Army and the Marines had different height
profiles, and they argued that Floud and his coauthors misrepresented the overall
trend by overweighting the proportion of Marines in the overall sample. They then
recalculated Floud, Wachter and Gregory’s results after reweighting the data to take
account of the actual proportions of Army and Marine recruits and excluding
recruits from outside England and Wales, and this formed the basis of their revised
estimates (Meredith and Oxley, 2014, p. 188; see also Floud et al., 1993, pp. 147-8).
Meredith and Oxley’s estimates represent an important contribution to
anthropometric history, but their decision to reweight the data according to the
proportions of Army and Marine recruits is surely open to question. They argued
that pooling the data without reweighting would be analogous to ‘mix[ing] up
disproportionate shares of males and females and consider[ing] the outcome
representative’ (Meredith and Oxley, 2014, pp. 187-8). However, the reason why it
would be inappropriate to mix up disproportionate (and varying) shares of males
and females is because the distributions of heights in the underlying populations
are different. If one accepts the view that both the Army recruits and the Marine
recruits were drawn from the same population, then it is appropriate to combine
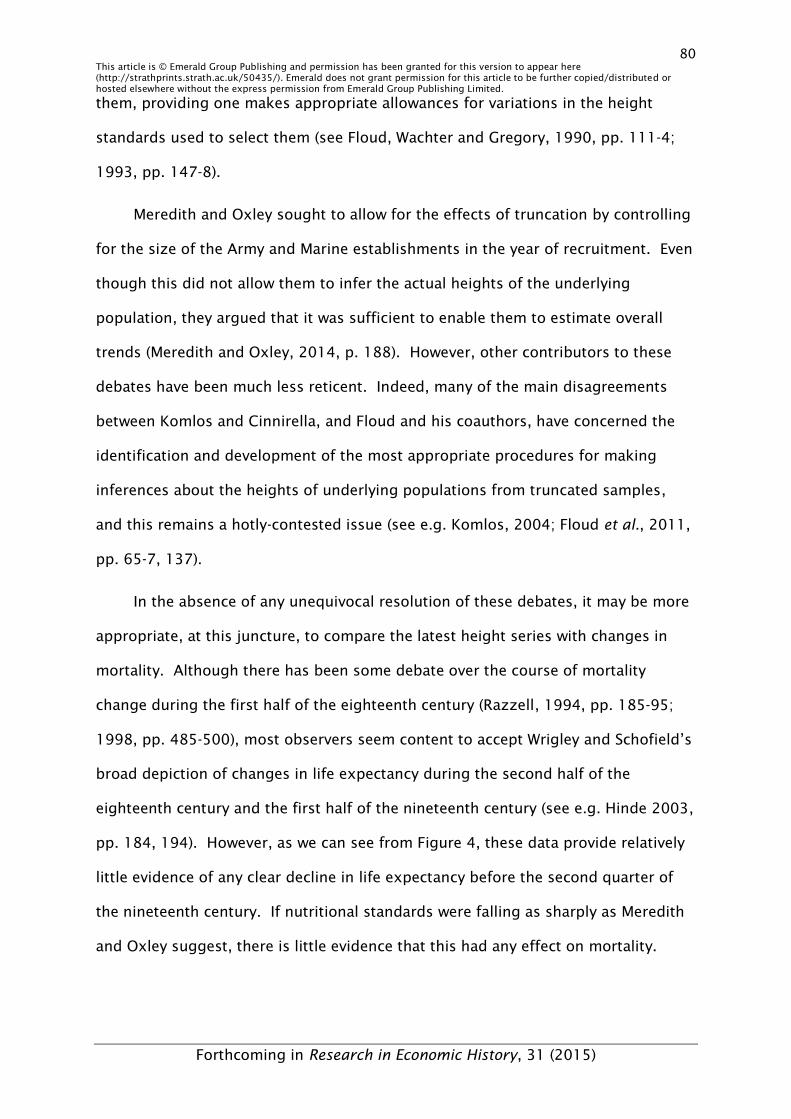
80 This article is © Emerald Group Publishing and permission has been granted for this version to appear here (http://strathprints.strath.ac.uk/50435/). Emerald does not grant permission for this article to be further copied/distributed or hosted elsewhere without the express permission from Emerald Group Publishing Limited.
Forthcoming in Research in Economic History, 31 (2015)
them, providing one makes appropriate allowances for variations in the height
standards used to select them (see Floud, Wachter and Gregory, 1990, pp. 111-4;
1993, pp. 147-8).
Meredith and Oxley sought to allow for the effects of truncation by controlling
for the size of the Army and Marine establishments in the year of recruitment. Even
though this did not allow them to infer the actual heights of the underlying
population, they argued that it was sufficient to enable them to estimate overall
trends (Meredith and Oxley, 2014, p. 188). However, other contributors to these
debates have been much less reticent. Indeed, many of the main disagreements
between Komlos and Cinnirella, and Floud and his coauthors, have concerned the
identification and development of the most appropriate procedures for making
inferences about the heights of underlying populations from truncated samples,
and this remains a hotly-contested issue (see e.g. Komlos, 2004; Floud et al., 2011,
pp. 65-7, 137).
In the absence of any unequivocal resolution of these debates, it may be more
appropriate, at this juncture, to compare the latest height series with changes in
mortality. Although there has been some debate over the course of mortality
change during the first half of the eighteenth century (Razzell, 1994, pp. 185-95;
1998, pp. 485-500), most observers seem content to accept Wrigley and Schofield’s
broad depiction of changes in life expectancy during the second half of the
eighteenth century and the first half of the nineteenth century (see e.g. Hinde 2003,
pp. 184, 194). However, as we can see from Figure 4, these data provide relatively
little evidence of any clear decline in life expectancy before the second quarter of
the nineteenth century. If nutritional standards were falling as sharply as Meredith
and Oxley suggest, there is little evidence that this had any effect on mortality.
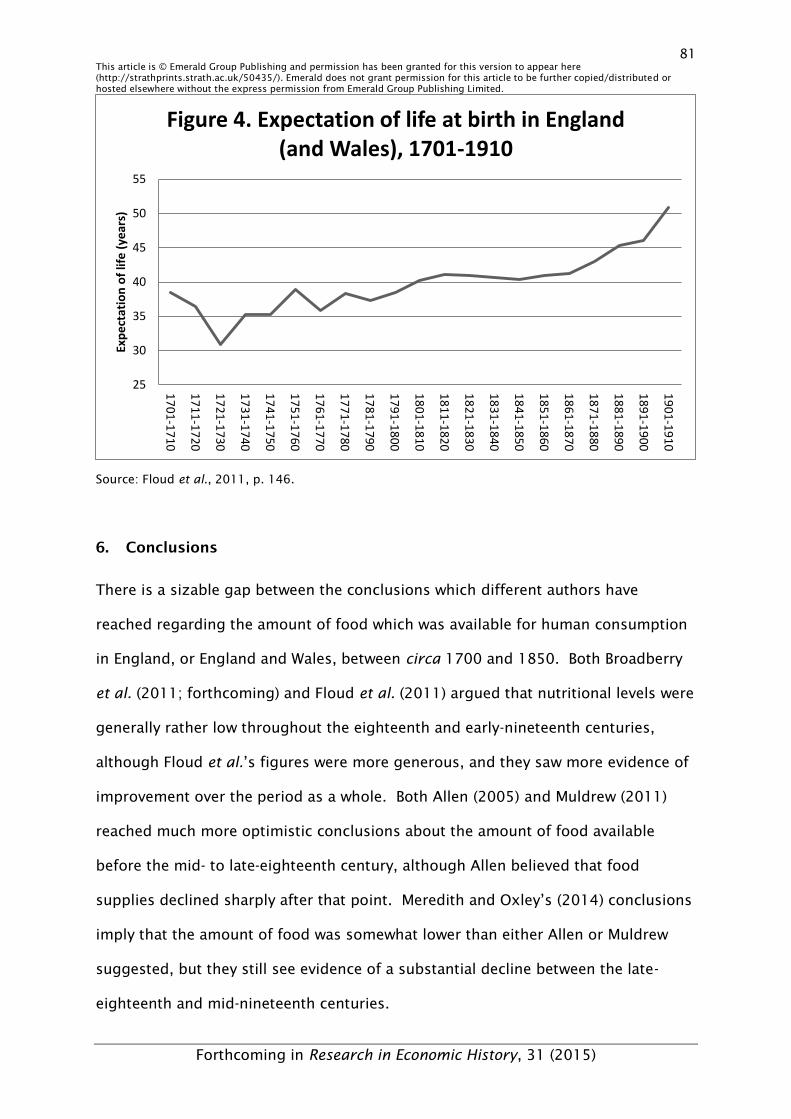
81 This article is © Emerald Group Publishing and permission has been granted for this version to appear here (http://strathprints.strath.ac.uk/50435/). Emerald does not grant permission for this article to be further copied/distributed or hosted elsewhere without the express permission from Emerald Group Publishing Limited.
Forthcoming in Research in Economic History, 31 (2015)
Source: Floud et al., 2011, p. 146.
6. Conclusions
There is a sizable gap between the conclusions which different authors have
reached regarding the amount of food which was available for human consumption
in England, or England and Wales, between circa 1700 and 1850. Both Broadberry
et al. (2011; forthcoming) and Floud et al. (2011) argued that nutritional levels were
generally rather low throughout the eighteenth and early-nineteenth centuries,
although Floud et al.’s figures were more generous, and they saw more evidence of
improvement over the period as a whole. Both Allen (2005) and Muldrew (2011)
reached much more optimistic conclusions about the amount of food available
before the mid- to late-eighteenth century, although Allen believed that food
supplies declined sharply after that point. Meredith and Oxley’s (2014) conclusions
imply that the amount of food was somewhat lower than either Allen or Muldrew
suggested, but they still see evidence of a substantial decline between the late-
eighteenth and mid-nineteenth centuries.
25
30
35
40
45
50
55
17
01
-17
10
17
11
-17
20
17
21
-17
30
17
31
-17
40
17
41
-17
50
17
51
-17
60
17
61
-17
70
17
71
-17
80
17
81
-17
90
17
91
-18
00
18
01
-18
10
18
11
-18
20
18
21
-18
30
18
31
-18
40
18
41
-18
50
18
51
-18
60
18
61
-18
70
18
71
-18
80
18
81
-18
90
18
91
-19
00
19
01
-19
10
Ex
pe
cta
tio
n o
f li
fe (
ye
ars
) Figure 4. Expectation of life at birth in England
(and Wales), 1701-1910
82 This article is © Emerald Group Publishing and permission has been granted for this version to appear here (http://strathprints.strath.ac.uk/50435/). Emerald does not grant permission for this article to be further copied/distributed or hosted elsewhere without the express permission from Emerald Group Publishing Limited.
Forthcoming in Research in Economic History, 31 (2015)
These disparities reflect differences in both assumptions and methods. As
Meredith and Oxley (2014, p. 173) have pointed out, Muldrew and Floud et al. used
similar methods but reached very divergent conclusions. Broadberry et al.
approached the subject in a rather different way to Floud and his coauthors and
there are disagreements, but their results are broadly similar (at least in terms of
levels, if not trajectory). The main reasons for the disparity between Muldrew’s
series and those of other authors lie in the assumptions he makes about the
amount of land under cultivation, especially towards the end of the eighteenth
century; the number of animals producing food for human consumption; and the
amount of food lost during the production process. Many of these assumptions
seem highly optimistic when compared with the conclusions reached by other
authors, and this suggests that the truth is likely to lie somewhat closer to Floud et
al. and Broadberry et al., even if further revision of their estimates may still be
necessary.
Although there is a broad similarity between Floud et al.’s results and those of
Broadberry et al., there are also differences. As we have seen, Floud et al. have
already presented two different sets of estimates, reflecting different assumptions
about arable productivity. The corrected and updated version of Estimate A
suggests that food availability increased over the course of the eighteenth century,
followed by a period of stagnation between 1800 and 1850. In contrast, the
corrected and updated version of Estimate B suggests that food availability declined
between 1750 and 1800 and only improved after this date. Broadberry et al.’s
figures are more consistent with the latter view but this conclusion can also be
questioned. If we were to apply Floud et al.’s assessment of the number of calories
supplied by imported foods to Broadberry et al.’s domestic figures, the overall
83 This article is © Emerald Group Publishing and permission has been granted for this version to appear here (http://strathprints.strath.ac.uk/50435/). Emerald does not grant permission for this article to be further copied/distributed or hosted elsewhere without the express permission from Emerald Group Publishing Limited.
Forthcoming in Research in Economic History, 31 (2015)
pattern would be much closer to the corrected version of Estimate A (see Appendix
1).8
In the meantime, it is also important to consider what these figures might say
about the overall level of nutritional adequacy. As Floud et al. (2011, pp. 41, 77-8,
129-30, 162) pointed out, the nutritional adequacy of a diet depends not only on its
size but also its composition (and the environment in which it is consumed). Eric
Schneider (2013) has taken this argument further by applying modern theories
about the ‘digestibility’ of different foods to Floud et al.’s corrected data. Although
his findings do little to alter the overall trajectory of nutritional change, they
provide further grounds for thinking that the nutritional lot of many eighteenth and
nineteenth century consumers left much to be desired.
8 This point would of course be even more true if we were to include Irish imports.
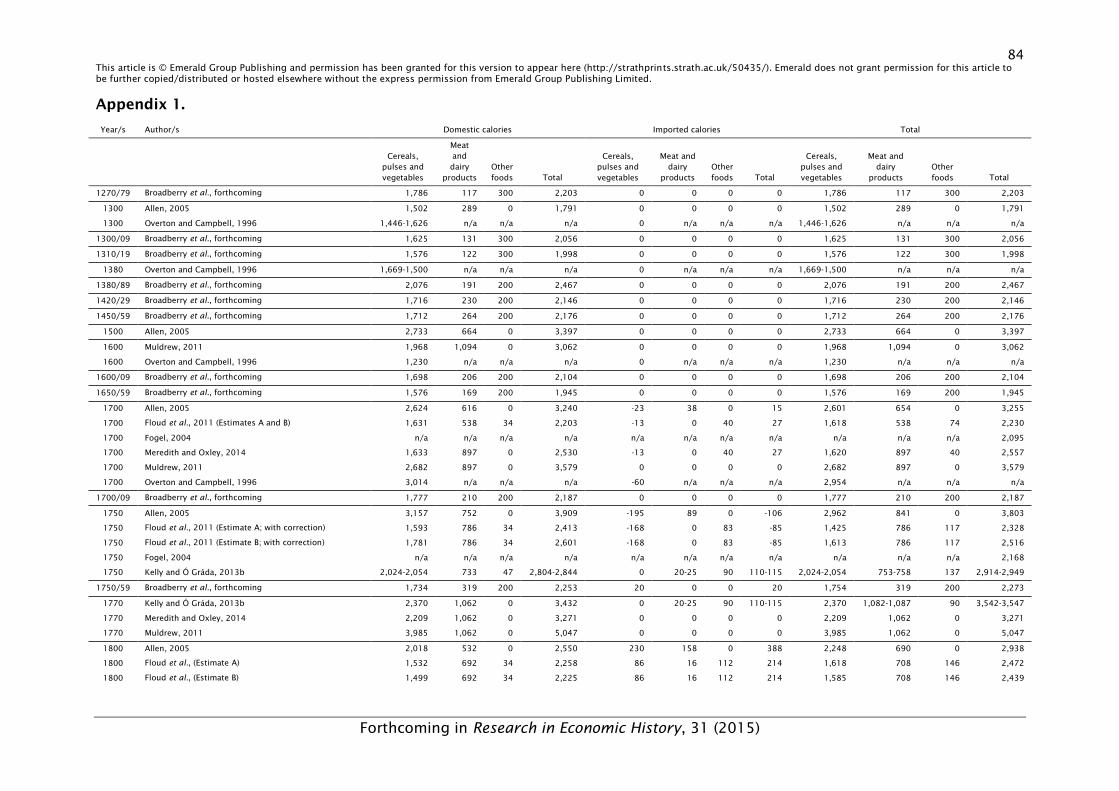
84 This article is © Emerald Group Publishing and permission has been granted for this version to appear here (http://strathprints.strath.ac.uk/50435/). Emerald does not grant permission for this article to be further copied/distributed or hosted elsewhere without the express permission from Emerald Group Publishing Limited.
Forthcoming in Research in Economic History, 31 (2015)
Appendix 1.
Year/s Author/s Domestic calories Imported calories Total
Cereals, pulses and vegetables
Meat and dairy
products Other foods Total
Cereals, pulses and vegetables
Meat and dairy
products Other foods Total
Cereals, pulses and vegetables
Meat and dairy
products Other foods Total
1270/79 Broadberry et al., forthcoming 1,786 117 300 2,203 0 0 0 0 1,786 117 300 2,203
1300 Allen, 2005 1,502 289 0 1,791 0 0 0 0 1,502 289 0 1,791
1300 Overton and Campbell, 1996 1,446-1,626 n/a n/a n/a 0 n/a n/a n/a 1,446-1,626 n/a n/a n/a
1300/09 Broadberry et al., forthcoming 1,625 131 300 2,056 0 0 0 0 1,625 131 300 2,056
1310/19 Broadberry et al., forthcoming 1,576 122 300 1,998 0 0 0 0 1,576 122 300 1,998
1380 Overton and Campbell, 1996 1,669-1,500 n/a n/a n/a 0 n/a n/a n/a 1,669-1,500 n/a n/a n/a
1380/89 Broadberry et al., forthcoming 2,076 191 200 2,467 0 0 0 0 2,076 191 200 2,467
1420/29 Broadberry et al., forthcoming 1,716 230 200 2,146 0 0 0 0 1,716 230 200 2,146
1450/59 Broadberry et al., forthcoming 1,712 264 200 2,176 0 0 0 0 1,712 264 200 2,176
1500 Allen, 2005 2,733 664 0 3,397 0 0 0 0 2,733 664 0 3,397
1600 Muldrew, 2011 1,968 1,094 0 3,062 0 0 0 0 1,968 1,094 0 3,062
1600 Overton and Campbell, 1996 1,230 n/a n/a n/a 0 n/a n/a n/a 1,230 n/a n/a n/a
1600/09 Broadberry et al., forthcoming 1,698 206 200 2,104 0 0 0 0 1,698 206 200 2,104
1650/59 Broadberry et al., forthcoming 1,576 169 200 1,945 0 0 0 0 1,576 169 200 1,945
1700 Allen, 2005 2,624 616 0 3,240 -23 38 0 15 2,601 654 0 3,255
1700 Floud et al., 2011 (Estimates A and B) 1,631 538 34 2,203 -13 0 40 27 1,618 538 74 2,230
1700 Fogel, 2004 n/a n/a n/a n/a n/a n/a n/a n/a n/a n/a n/a 2,095
1700 Meredith and Oxley, 2014 1,633 897 0 2,530 -13 0 40 27 1,620 897 40 2,557
1700 Muldrew, 2011 2,682 897 0 3,579 0 0 0 0 2,682 897 0 3,579
1700 Overton and Campbell, 1996 3,014 n/a n/a n/a -60 n/a n/a n/a 2,954 n/a n/a n/a
1700/09 Broadberry et al., forthcoming 1,777 210 200 2,187 0 0 0 0 1,777 210 200 2,187
1750 Allen, 2005 3,157 752 0 3,909 -195 89 0 -106 2,962 841 0 3,803
1750 Floud et al., 2011 (Estimate A; with correction) 1,593 786 34 2,413 -168 0 83 -85 1,425 786 117 2,328
1750 Floud et al., 2011 (Estimate B; with correction) 1,781 786 34 2,601 -168 0 83 -85 1,613 786 117 2,516
1750 Fogel, 2004 n/a n/a n/a n/a n/a n/a n/a n/a n/a n/a n/a 2,168
1750 Kelly and Ó Gráda, 2013b 2,024-2,054 733 47 2,804-2,844 0 20-25 90 110-115 2,024-2,054 753-758 137 2,914-2,949
1750/59 Broadberry et al., forthcoming 1,734 319 200 2,253 20 0 0 20 1,754 319 200 2,273
1770 Kelly and Ó Gráda, 2013b 2,370 1,062 0 3,432 0 20-25 90 110-115 2,370 1,082-1,087 90 3,542-3,547
1770 Meredith and Oxley, 2014 2,209 1,062 0 3,271 0 0 0 0 2,209 1,062 0 3,271
1770 Muldrew, 2011 3,985 1,062 0 5,047 0 0 0 0 3,985 1,062 0 5,047
1800 Allen, 2005 2,018 532 0 2,550 230 158 0 388 2,248 690 0 2,938
1800 Floud et al., (Estimate A) 1,532 692 34 2,258 86 16 112 214 1,618 708 146 2,472
1800 Floud et al., (Estimate B) 1,499 692 34 2,225 86 16 112 214 1,585 708 146 2,439
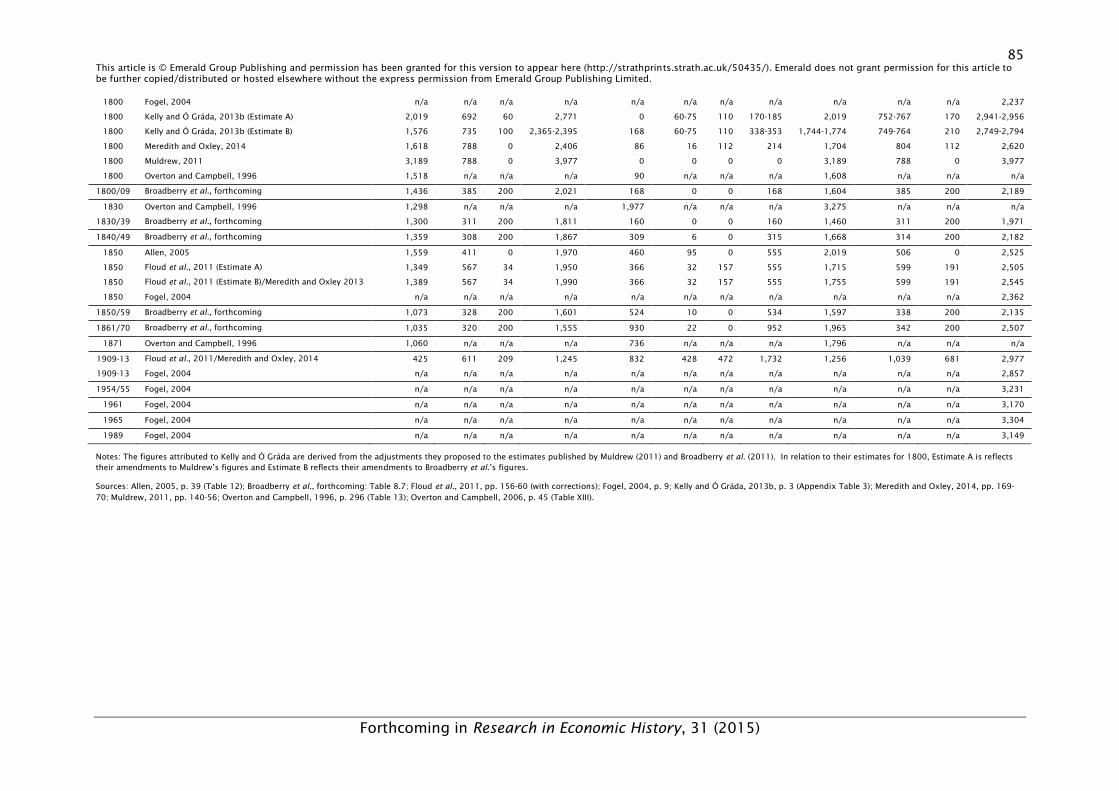
85 This article is © Emerald Group Publishing and permission has been granted for this version to appear here (http://strathprints.strath.ac.uk/50435/). Emerald does not grant permission for this article to be further copied/distributed or hosted elsewhere without the express permission from Emerald Group Publishing Limited.
Forthcoming in Research in Economic History, 31 (2015)
1800 Fogel, 2004 n/a n/a n/a n/a n/a n/a n/a n/a n/a n/a n/a 2,237
1800 Kelly and Ó Gráda, 2013b (Estimate A) 2,019 692 60 2,771 0 60-75 110 170-185 2,019 752-767 170 2,941-2,956
1800 Kelly and Ó Gráda, 2013b (Estimate B) 1,576 735 100 2,365-2,395 168 60-75 110 338-353 1,744-1,774 749-764 210 2,749-2,794
1800 Meredith and Oxley, 2014 1,618 788 0 2,406 86 16 112 214 1,704 804 112 2,620
1800 Muldrew, 2011 3,189 788 0 3,977 0 0 0 0 3,189 788 0 3,977
1800 Overton and Campbell, 1996 1,518 n/a n/a n/a 90 n/a n/a n/a 1,608 n/a n/a n/a
1800/09 Broadberry et al., forthcoming 1,436 385 200 2,021 168 0 0 168 1,604 385 200 2,189
1830 Overton and Campbell, 1996 1,298 n/a n/a n/a 1,977 n/a n/a n/a 3,275 n/a n/a n/a
1830/39 Broadberry et al., forthcoming 1,300 311 200 1,811 160 0 0 160 1,460 311 200 1,971
1840/49 Broadberry et al., forthcoming 1,359 308 200 1,867 309 6 0 315 1,668 314 200 2,182
1850 Allen, 2005 1,559 411 0 1,970 460 95 0 555 2,019 506 0 2,525
1850 Floud et al., 2011 (Estimate A) 1,349 567 34 1,950 366 32 157 555 1,715 599 191 2,505
1850 Floud et al., 2011 (Estimate B)/Meredith and Oxley 2013 1,389 567 34 1,990 366 32 157 555 1,755 599 191 2,545
1850 Fogel, 2004 n/a n/a n/a n/a n/a n/a n/a n/a n/a n/a n/a 2,362
1850/59 Broadberry et al., forthcoming 1,073 328 200 1,601 524 10 0 534 1,597 338 200 2,135
1861/70 Broadberry et al., forthcoming 1,035 320 200 1,555 930 22 0 952 1,965 342 200 2,507
1871 Overton and Campbell, 1996 1,060 n/a n/a n/a 736 n/a n/a n/a 1,796 n/a n/a n/a
1909-13 Floud et al., 2011/Meredith and Oxley, 2014 425 611 209 1,245 832 428 472 1,732 1,256 1,039 681 2,977
1909-13 Fogel, 2004 n/a n/a n/a n/a n/a n/a n/a n/a n/a n/a n/a 2,857
1954/55 Fogel, 2004 n/a n/a n/a n/a n/a n/a n/a n/a n/a n/a n/a 3,231
1961 Fogel, 2004 n/a n/a n/a n/a n/a n/a n/a n/a n/a n/a n/a 3,170
1965 Fogel, 2004 n/a n/a n/a n/a n/a n/a n/a n/a n/a n/a n/a 3,304
1989 Fogel, 2004 n/a n/a n/a n/a n/a n/a n/a n/a n/a n/a n/a 3,149
Notes: The figures attributed to Kelly and Ó Gráda are derived from the adjustments they proposed to the estimates published by Muldrew (2011) and Broadberry et al. (2011). In relation to their estimates for 1800, Estimate A is reflects their amendments to Muldrew’s figures and Estimate B reflects their amendments to Broadberry et al.’s figures.
Sources: Allen, 2005, p. 39 (Table 12); Broadberry et al., forthcoming: Table 8.7; Floud et al., 2011, pp. 156-60 (with corrections); Fogel, 2004, p. 9; Kelly and Ó Gráda, 2013b, p. 3 (Appendix Table 3); Meredith and Oxley, 2014, pp. 169-70; Muldrew, 2011, pp. 140-56; Overton and Campbell, 1996, p. 296 (Table 13); Overton and Campbell, 2006, p. 45 (Table XIII).
86 This article is © Emerald Group Publishing and permission has been granted for this version to appear here (http://strathprints.strath.ac.uk/50435/). Emerald does not grant permission for this article to be further copied/distributed or hosted elsewhere without the express permission from Emerald Group Publishing Limited.
Forthcoming in Research in Economic History, 31 (2015)
Bibliography
Allen, R. (1994). Agriculture during the industrial revolution. In R. Floud and D. McCloskey (Eds.), The economic history of Britain since 1700. Vol. 1. 1700-1860 (pp. 96-122). Cambridge: Cambridge University Press.
Allen, R. (2005). English and Welsh agriculture, 1300-1850: outputs, inputs and income’. Retrieved from http://economics.ouls.ox.ac.uk/13622/1/Allen%20-%20English%20and%20Welsh%20agriculture.pdf
Allen, R. (2007). Pessimism preserved: real wages in the British industrial revolution. Oxford University Department of Economics Working Paper 314.
Bennett, M.K. and Pierce, R.H. (1961). Change in the American national diet, 1879-1959. Food Research Institute Studies, 2(2), 95-119.
Bourke, A. (1993). The visitation of God’? The potato and the great Irish famine, Dublin: Lilliput Press.
Blackman, J. (1975). The cattle trade and agrarian change on the eve of the Railway Age. Agricultural History Review, 23(1), 48-62.
Broadberry, S., Campbell, B., Klein, A., Overton, M. and Van Leeuwen, B. (2011). British economic growth, 1270-1870’. Retrieved from http://www.lse.ac.uk/economicHistory/seminars/ModernAndComparative/papers2011-12/Papers/Broadberry.pdf.
Broadberry, S., Campbell, B., Klein, A., Overton, M. and Van Leeuwen, B. (forthcoming), British economic growth, 1270-1870, Cambridge: Cambridge University Press.
Burnett, J. (1979), Plenty and want: a social history of diet in England from 1815 to
the present day, London: Methuen.
Burnette, J. (2014). Agriculture, 1700-1870. In R. Floud, J. Humphries and P. Johnson (Eds.), The Cambridge economic history of modern Britain. Vol. 1. 1700-
1870 (pp. 89-117). Cambridge: Cambridge University Press.
Caird, J. (1852), English agriculture in 1850-51, London: Longman.
Capper, B.P. (1801), A statistical account of the population and cultivation, produce
and consumption of England and Wales, London: T. Geoghegan.
Chartres, J.A. (1985). The marketing of agricultural produce. In J. Thirsk (Ed.), The
agrarian history of England and Wales. Vol. V: 1640-1750; II: Agrarian change (pp. 406-502). Cambridge: Cambridge University Press.
Cinnirella, F. (2008). Optimists or pessimists? A reconsideration of nutritional status in Britain, 1740-1865. European Review of Economic History, 12(3), 325-54. doi: 10.1017/S136149160800227X
Clark, G. (1991). Labour productivity in English agriculture, 1300-1860. In B. Campbell and M. Overton (Eds.), Agricultural productivity in the European past (pp. 211-35). Manchester: Manchester University Press.
87 This article is © Emerald Group Publishing and permission has been granted for this version to appear here (http://strathprints.strath.ac.uk/50435/). Emerald does not grant permission for this article to be further copied/distributed or hosted elsewhere without the express permission from Emerald Group Publishing Limited.
Forthcoming in Research in Economic History, 31 (2015)
Clark, G. (2007). The long march of history: farm labourers’ wages in England, 1209-1869. Economic History Review, 60(1), 97-136. doi: 10.1111/j.1468-0289.2006.00358.x
Collins, E.J.T. (1975). Dietary change and cereal consumption in Britain in the nineteenth century. Agricultural History Review, 23(2), 97-115.
Comber, W.T. (1808), An inquiry into the state of national subsistence, London: T. Cadell and W. Davies.
Cullen, L.M. (1968), Anglo-Irish trade, 1660-1800, Manchester: Manchester University Press.
Davies, D. (1795), The case of the labourers in husbandry stated and considered, Dublin: P. Byrne.
Donnelly, J. (1975), The land and the people of nineteenth-century Cork: the rural
economy and the land question, London: Routledge and Kegan Paul.
Eden, F.M. (1797), The state of the poor, London: B & J. White et al..
Feinstein, C.H. (1998). Pessimism perpetuated: real wages and the standard of living in Britain during and after the industrial revolution. Journal of Economic
History, 58(3), 625-58.
Floud, R., Fogel, R., Harris, B. and Hong, S.C. (2011), The changing body: health,
nutrition and human development in the western world since 1700, Cambridge: Cambridge University Press.
Floud, R., Fogel, R., Harris, B. and Hong, S.C. (forthcoming), The changing body:
health, nutrition and human development in the western world since 1700, Cambridge: Cambridge University Press, new impression.
Floud, R., Wachter, K. and Gregory, A. (1990), Height, health and history: nutritional
status in the United Kingdom 1750-1980, Cambridge: Cambridge University Press.
Floud, R., Wachter, K. and Gregory, A. (1993). Measuring historical heights: short cuts or the long way round? A reply to Komlos. Economic History Review, 46(1), 145-54.
Fogel, R. (2004), The escape from hunger and premature death, 1700-2100: Europe,
America and the Third World, Cambridge: Cambridge University Press.
Galpin, W.F. (1925), The grain supply of England during the Napoleonic period, New York: Macmillan.
Gash, N. (1985), Mr Secretary Peel: the life of Sir Robert Peel to 1830, London: Longman.
Gazeley, I. and Newell, A. (2014). Urban working-class food consumption and nutrition in Britain in 1904. Economic History Review. Retrieved from http://onlinelibrary.wiley.com/doi/10.1111/ehr.12065/pdf.
Grant, A. (1766), The practical farmer’s pocket companion, Aberdeen: F. Douglas.
88 This article is © Emerald Group Publishing and permission has been granted for this version to appear here (http://strathprints.strath.ac.uk/50435/). Emerald does not grant permission for this article to be further copied/distributed or hosted elsewhere without the express permission from Emerald Group Publishing Limited.
Forthcoming in Research in Economic History, 31 (2015)
Harris, B. (2004). Public health, nutrition and the decline of mortality: the McKeown thesis revisited. Social History of Medicine, 17(3), 379-407. doi: 10.1093/shm/17.3.379
Hinde, A. (2003), England’s population: a history since the Domesday survey, London: Edward Arnold.
Holderness, B.A. (1989). Prices, productivity and output. In G.E. Mingay (Ed.), The
agrarian history of England and Wales. Vol. VI: 1750-1850 (pp. 84-189), Cambridge: Cambridge University Press, 1989.
John, A.H. (1989). Statistical appendix. In G.E. Mingay (Ed.), The agrarian history of
England and Wales. Vol. VI. 1750-1850 (pp. 973-1131), Cambridge: Cambridge University Press.
Kain, R.J.P. (1986), An atlas and index of the tithe files of mid-nineteenth century
England and Wales, Cambridge: Cambridge University Press.
Kain, R.J.P. and Prince, H.C. (1985), The tithe surveys of England and Wales, Cambridge: Cambridge University Press.
Kelly, M. and Ó Gráda, C. (2013a). Numerare est errare: agricultural output and food supply in England before and during the industrial revolution. Journal of Economic
History, 73(4), 1132-1163. doi: 10.1017/S0022050713000909
Kelly, M. and Ó Gráda, C. (2013b). Numerare est errare: agricultural output and food supply in England before and during the industrial revolution. Appendix: the components of agricultural output. Journal of Economic History, 73(4). Retrieved from http://journals.cambridge.org/downloadsup.php?file=/S0022050713000909sup002.pdf&code=9ffe31e82e20d62a5367dab8427fc72d&mime=application/pdf.
King, G. (1696), Natural and political observations and conclusions upon the state
and condition of England, 1696. Reprinted in P. Laslett (Ed.), The earliest classics, Farnsborough: Gregg, 1973.
Komlos, J. (1993a). The secular trend in the biological standard of living in the United Kingdom, 1730-1860. Economic History Review, 46(1), 115-44.
Komlos, J. (1993b). Further thoughts on the nutritional status of the British population. Economic History Review, 46(2), 363-6.
Komlos, J. (2004). How to (and how not to) analyze deficient height samples: an introduction. Historical Methods, 37(4), 160-73. doi:10.3200/HMTS.37.4.160-173
Komlos, J. and Küchenhoff, H. (2012). The diminution of the physical stature of the English male population in the eighteenth century. Cliometrica, 6(1), 45-62. doi: 10.1007/s11698-011-0070-7
Macgregor, J. (1850), Commercial statistics, London: Whitaker and Co., Vol. 5, Supplement 2.
McCance, R. and Widdowson, E. (1960), The composition of foods, London: HMSO, 3rd edition.
89 This article is © Emerald Group Publishing and permission has been granted for this version to appear here (http://strathprints.strath.ac.uk/50435/). Emerald does not grant permission for this article to be further copied/distributed or hosted elsewhere without the express permission from Emerald Group Publishing Limited.
Forthcoming in Research in Economic History, 31 (2015)
Meredith, D. and Oxley, D. (2014). Food and fodder: feeding England, 1700-1900. Past and Present, 222, 163-214.
Mitchell, B.R. (1988), British historical statistics, Cambridge: Cambridge University Press.
Muldrew, C. (2011), Food, energy and the creation of industriousness: work and
material culture in agrarian England, 1550-1780, Cambridge: Cambridge University Press.
Neild, W. (1842). Comparative statement of the income and expenditure of certain families of the working classes in Manchester and Dukinfield, in the years 1836 and 1841. Journal of the Statistical Society of London, 4 (4), 320-34.
Oddy, D. (1990). Food, drink and nutrition. in F.M.L. Thompson, ed., The Cambridge
social history of Britain, 1750-1950. Volume 2. People and their environment (pp. 251-78), Cambridge: Cambridge University Press.
Overton, M. (1996), Agricultural revolution in England: the transformation of the
agrarian economy, 1500-1850, Cambridge: Cambridge University Press.
Overton, M. and Campbell, B. (1996). Production et productivité dans l’agriculture anglaise, 1086-1871 . Histoire et Mésure, XI-3/4, 255-97.
Overton, M. and Campbell, B. (2006). Production and productivity in English agriculture, 1086-1871’. Retrieved from http://www.helsinki.fi/iehc2006/papers3/Overton.pdf.
Parliamentary Papers (1827), PP 1826-27 (550) v, 223, Third Report from the House
of Commons Select Committee on Emigration to the United Kingdom.
Parliamentary Papers (1843), PP 1843 (177) liii, 69. Corn. Returns relating to the
importation and exportation of corn, foreign and colonial. Statement of the
quantities of each kind of grain and of malt imported into Great Britain from
Ireland, in each year from 1800 to 1842.
Parliamentary Papers (1852), PP 1852 (538) li, 487. An account of all corn, grain,
maize, meal and flour … imported into the United Kingdom … and a similar return … of the imports from Ireland into Great Britain.
Parliamentary Papers (1854), PP 1854-55 (1928) liii, 491, Agricultural Statistics
(England), 1854. General Summary of Returns.
Parliamentary Papers (1863), PP 1863 (161) xxv, 1, Fifth Report of the Medical
Officer of the Privy Council, with Appendix.
Parliamentary Papers (1864), PP 1864 (3416) xxviii, 1, Sixth Report of the Medical
Officer of the Privy Council, with Appendix, 1863.
Parliamentary Papers (1871), PP 1871 C. 460 lxix, 271, Agricultural Returns of
Great Britain, with Abstract Returns for the United Kingdom, British Possessions and
Foreign Countries.
Porter, G.R. (1851), The progress of the nation, in its various social and economical
relations, from 1800 to the present time, London: Charles Knight and Co.
90 This article is © Emerald Group Publishing and permission has been granted for this version to appear here (http://strathprints.strath.ac.uk/50435/). Emerald does not grant permission for this article to be further copied/distributed or hosted elsewhere without the express permission from Emerald Group Publishing Limited.
Forthcoming in Research in Economic History, 31 (2015)
Prince, H.C. (1989). The changing rural landscape, 1750-1850. In G.E. Mingay (Ed.), The agrarian history of England and Wales. Vol. VI: 1750-1850 (pp. 7-83), Cambridge: Cambridge University Press, 1989.
Razzell, P. (1994). The growth of population in eighteenth-century England: a critical reappraisal. In P. Razzell, Essays in English population history (pp. 173-206), London: Caliban.
Razzell, P. (1998). The conundrum of eighteenth-century English population growth. Social History of Medicine, 11(3), 469-500. doi: 10.1093/shm/11.3.469
Salaman, R.N. (1949), The history and social influence of the potato, Cambridge: Cambridge University Press.
Schneider, E. (2013). Inescapable hunger? Energy cost accounting and the costs of digestion, pregnancy and lactation. European Review of Economic History, 17(3), 340-63. doi: 10.1093/ereh/het011
Sinclair, J. (1814), General report of the agricultural state and political
circumstances of Scotland, Edinburgh: A. Constable & Co., vol. 3.
Smith, J.H. (1955). The cattle trade of Aberdeenshire in the nineteenth century. Agricultural History Review, 3(2), 114-18.
Thirsk, J. (2002). Review of M.E. Turner, J.V. Beckett and B. Afton, Farm production
in England 1700-1914. Economic History Review, 55(2), 355-6.
Thomas, B. (1982). Feeding England during the industrial revolution: a view from the Celtic fringe. Agricultural History, 56(1), 328-42.
Thomas, B. (1985a). Escaping from constraints: the industrial revolution in a Malthusian context. Journal of Interdisciplinary History, 15(4), 729-53.
Thomas, B. (1985b). Food supply in the United Kingdom during the industrial revolution. In J. Mokyr (Ed.), The economics of the industrial revolution (pp. 137-50), London: George Allen & Unwin.
Thomas, B. (1993). Britain’s food supply, 1760-1846: the Irish contribution. In B Thomas, The industrial revolution and the Atlantic economy: selected essays (pp. 81-99), London: Routledge.
Turner, M. (1981). Arable in England and Wales: estimates from the 1801 Crop Return. Journal of Historical Geography, 7(3), 291-302.
Turner, M.E., Beckett, J.V. and Afton, B. (2001), Farm production in England 1700-
1914, Oxford: Oxford University Press.
Wrigley, E.A. and Schofield, R.S. (1981), The population history of England 1541-
1871: a reconstruction, Cambridge: Cambridge University Press.
Young, A. (1771a), The farmer’s tour through the east of England, Vol. ii, London: W. Strachan et al..
Young, A. (1771b), The farmer’s tour through the east of England, Vol. iv, London: W. Strachan et al..