Embed Size (px)
Citation preview
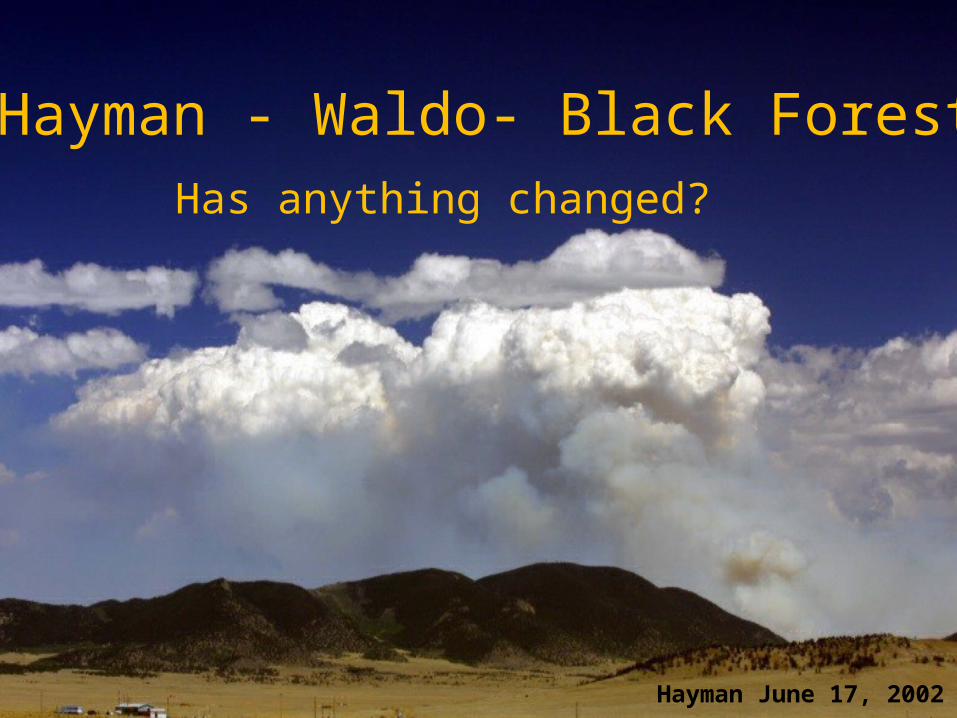
Hayman - Waldo- Black ForestHas anything changed?
Hayman June 17, 2002
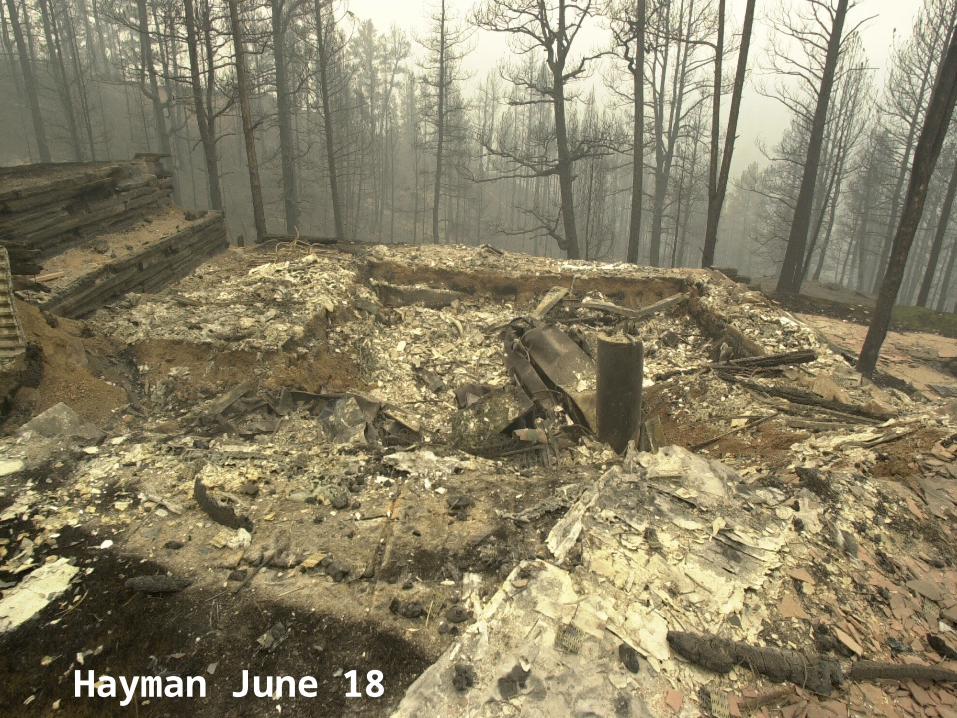
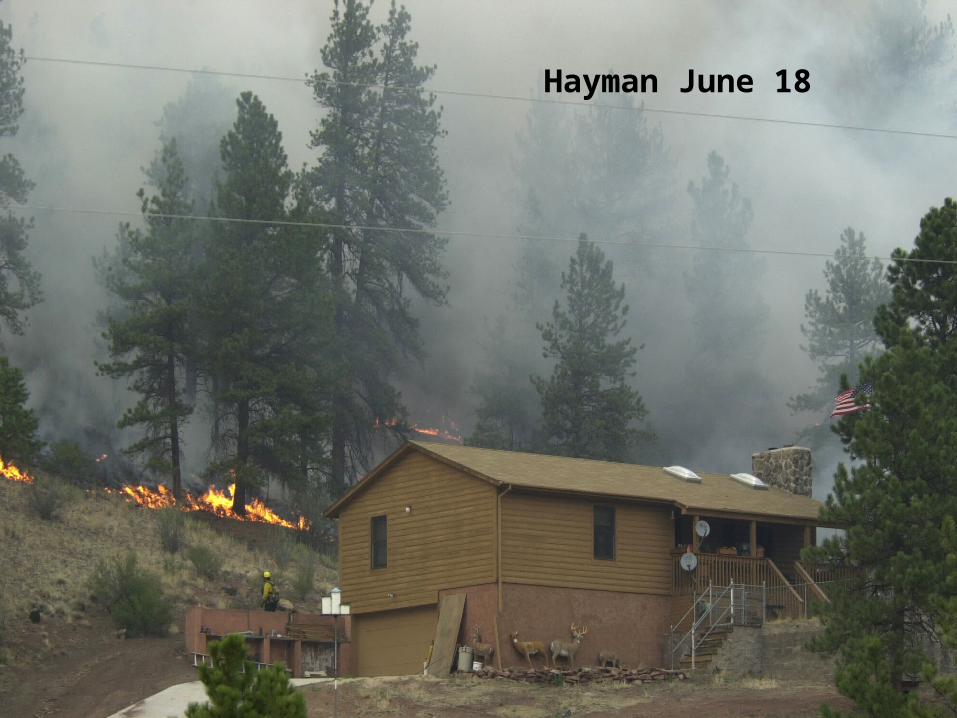
Hayman June 18
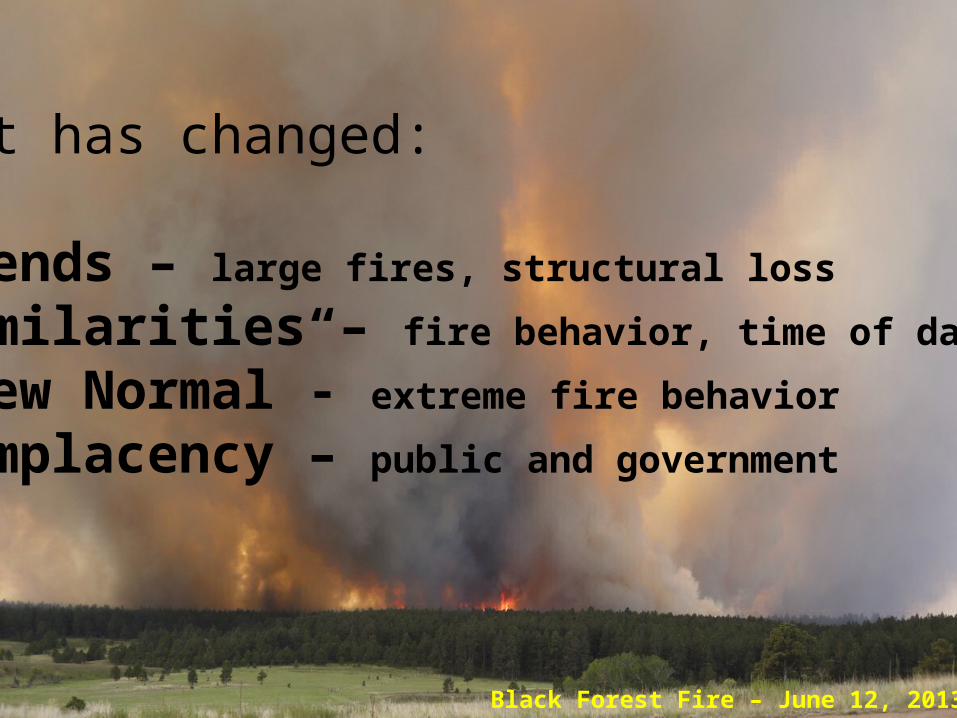
Black Forest Fire – June 12, 2013
What has changed:
• Trends – large fires, structural loss
• Similarities – fire behavior, time of day
• “New Normal”- extreme fire behavior
• Complacency – public and government
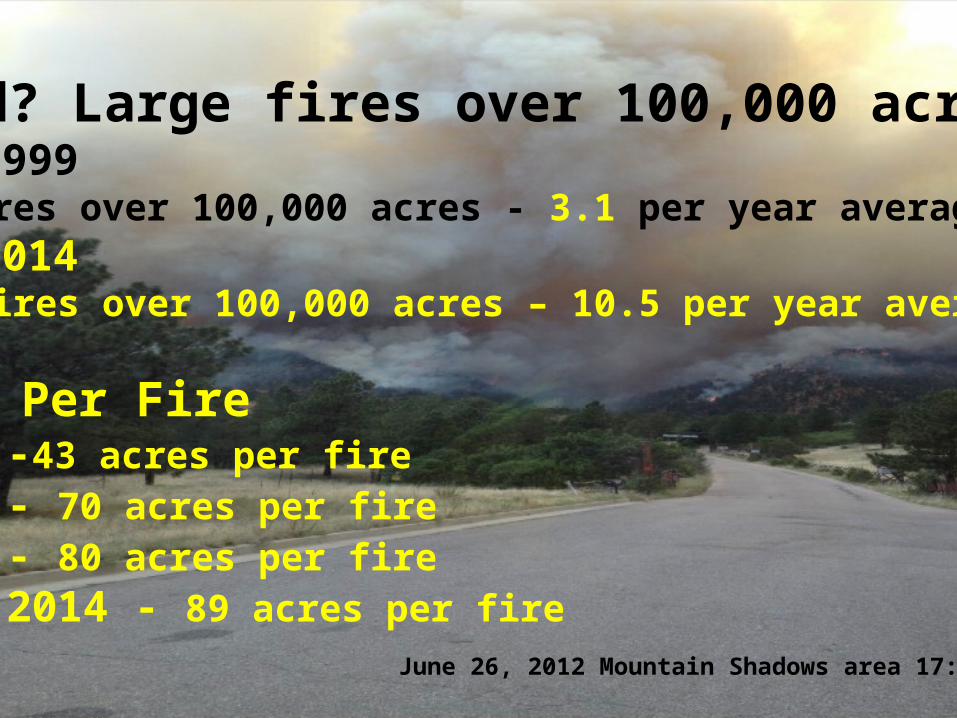
June 26, 2012 Mountain Shadows area 17:00
Trend? Large fires over 100,000 acres1990-1999 • 31 fires over 100,000 acres - 3.1 per year average2000-2014• 146 fires over 100,000 acres – 10.5 per year average
Acres Per Fire• 1960 -43 acres per fire• 1980 - 70 acres per fire• 1990 - 80 acres per fire• 2000-2014 - 89 acres per fire
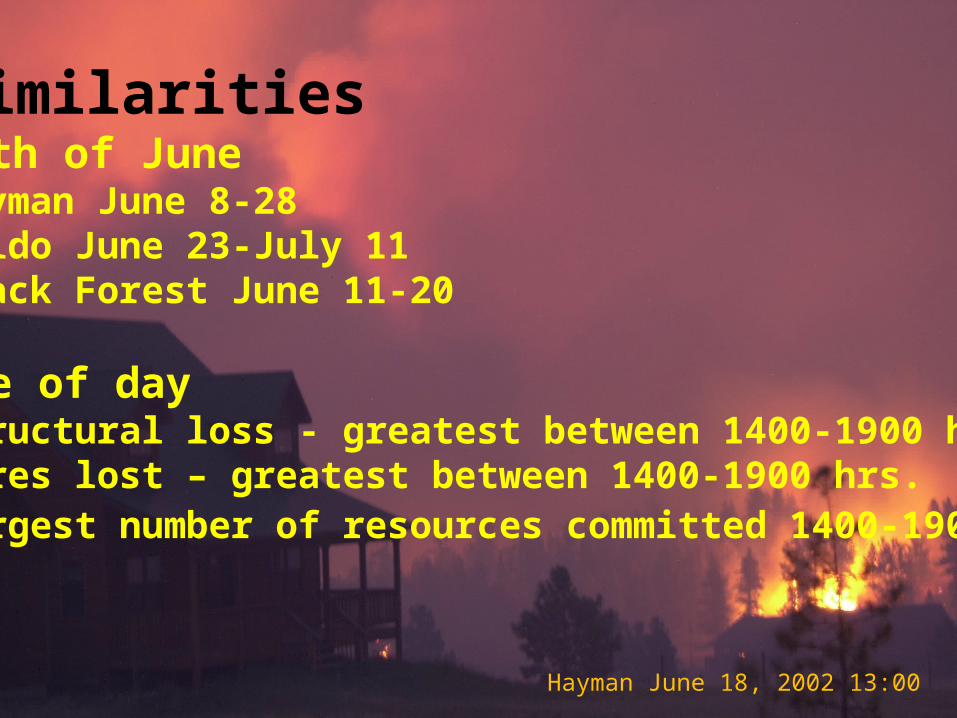
Hayman June 18, 2002 13:00
• SimilaritiesMonth of June• Hayman June 8-28• Waldo June 23-July 11• Black Forest June 11-20
Time of day• Structural loss - greatest between 1400-1900 hrs.• Acres lost – greatest between 1400-1900 hrs.• Largest number of resources committed 1400-1900 hrs.
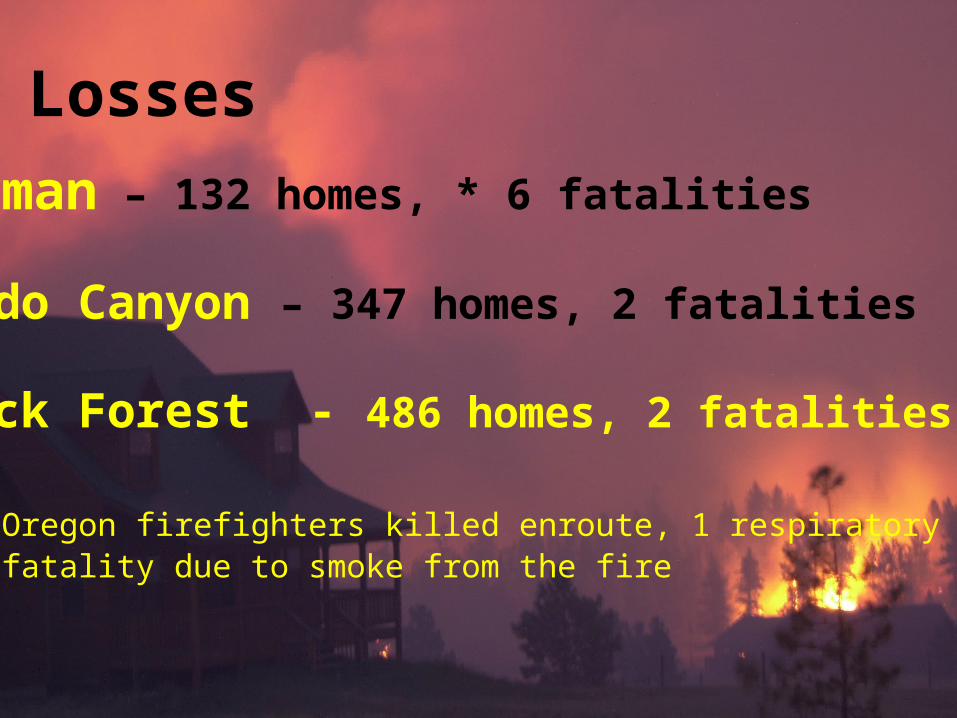
LossesHayman – 132 homes, * 6 fatalities
Waldo Canyon – 347 homes, 2 fatalities
Black Forest - 486 homes, 2 fatalities
* 5 Oregon firefighters killed enroute, 1 respiratory fatality due to smoke from the fire
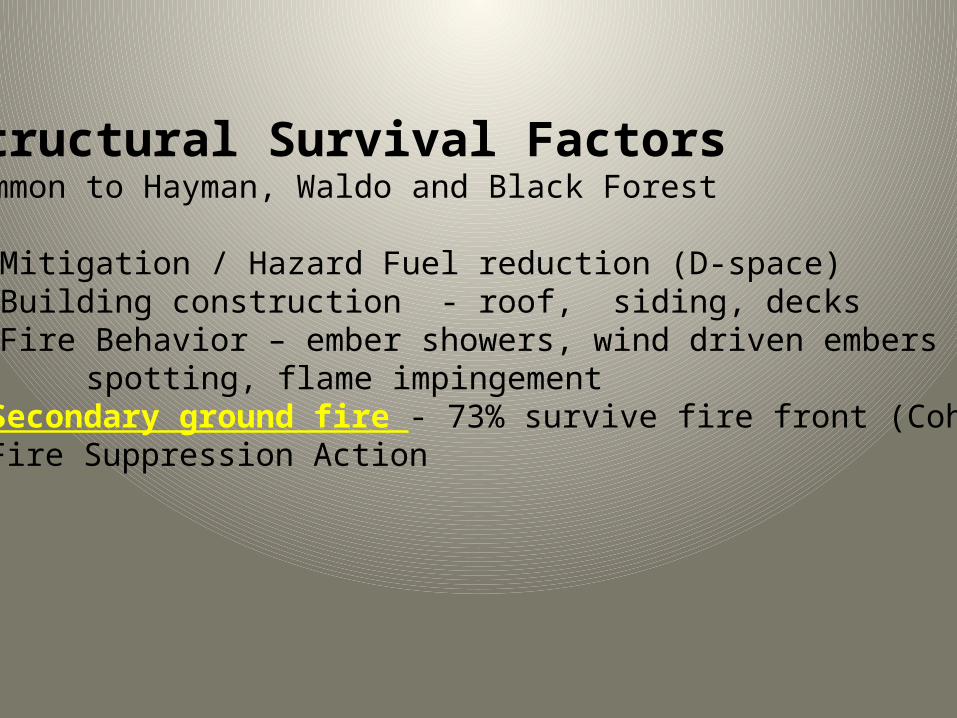
Structural Survival Factors Common to Hayman, Waldo and Black Forest
• Mitigation / Hazard Fuel reduction (D-space)• Building construction - roof, siding, decks • Fire Behavior – ember showers, wind driven embers spotting, flame impingement• Secondary ground fire - 73% survive fire front (Cohen)• Fire Suppression Action
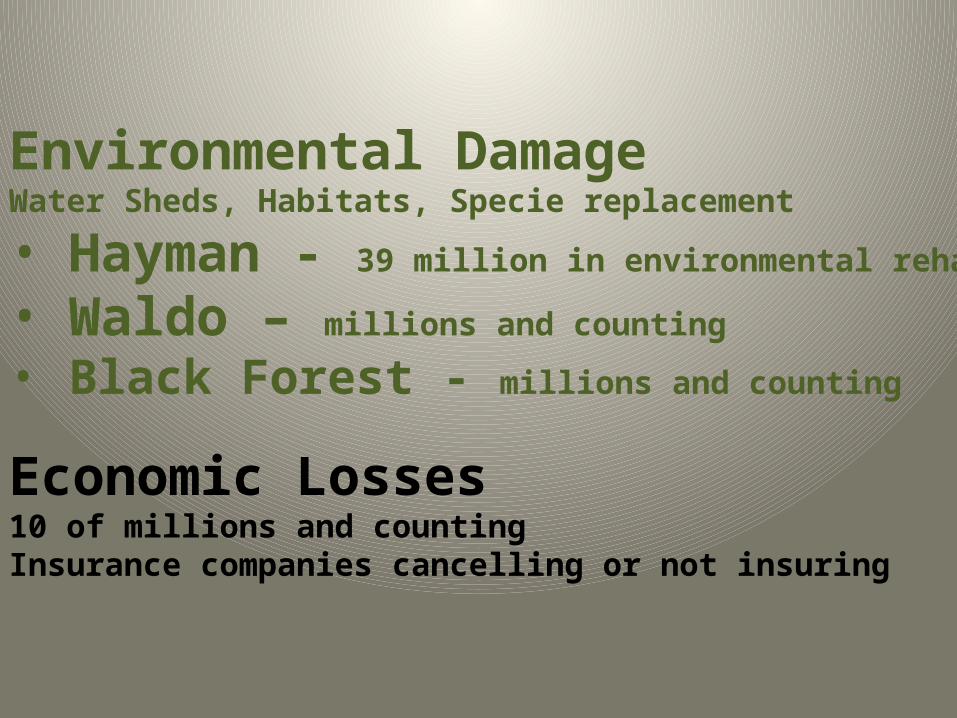
Environmental DamageWater Sheds, Habitats, Specie replacement
• Hayman - 39 million in environmental rehab
• Waldo – millions and counting
• Black Forest - millions and counting
Economic Losses10 of millions and countingInsurance companies cancelling or not insuring
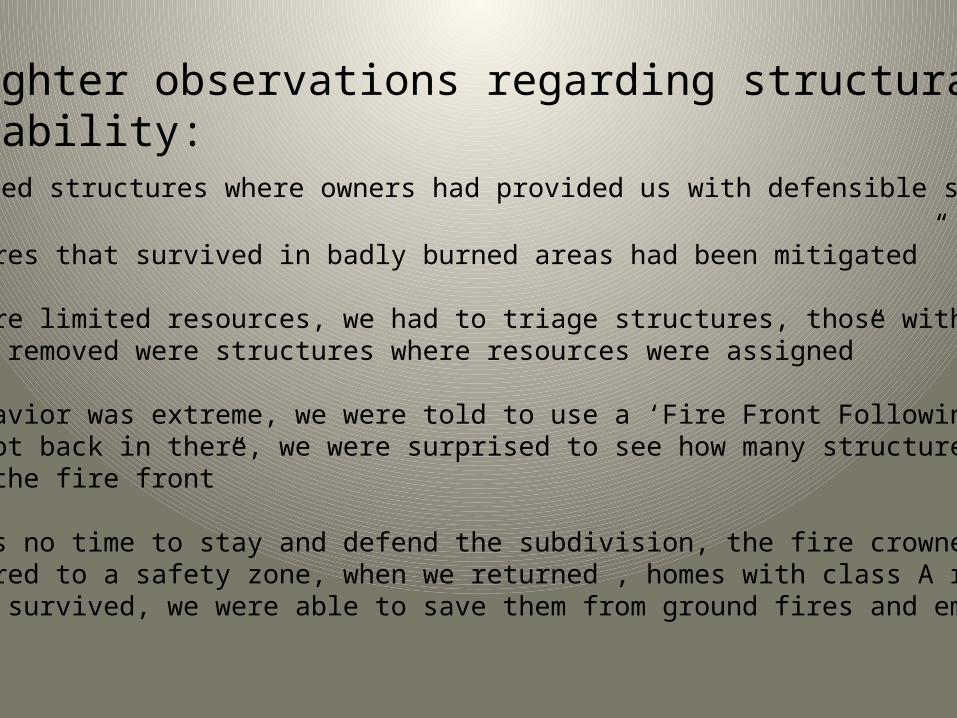
Firefighter observations regarding structural Survivability:“We engaged structures where owners had provided us with defensible space”
“ Structures that survived in badly burned areas had been mitigated”
“There were limited resources, we had to triage structures, those with D-space orhad fuels removed were structures where resources were assigned”
“Fire behavior was extreme, we were told to use a ‘Fire Front Following’ tactic,when we got back in there, we were surprised to see how many structures survived the fire front”
“There was no time to stay and defend the subdivision, the fire crowned and wewere ordered to a safety zone, when we returned , homes with class A roofs and clearance survived, we were able to save them from ground fires and embers”
Hayman June 18
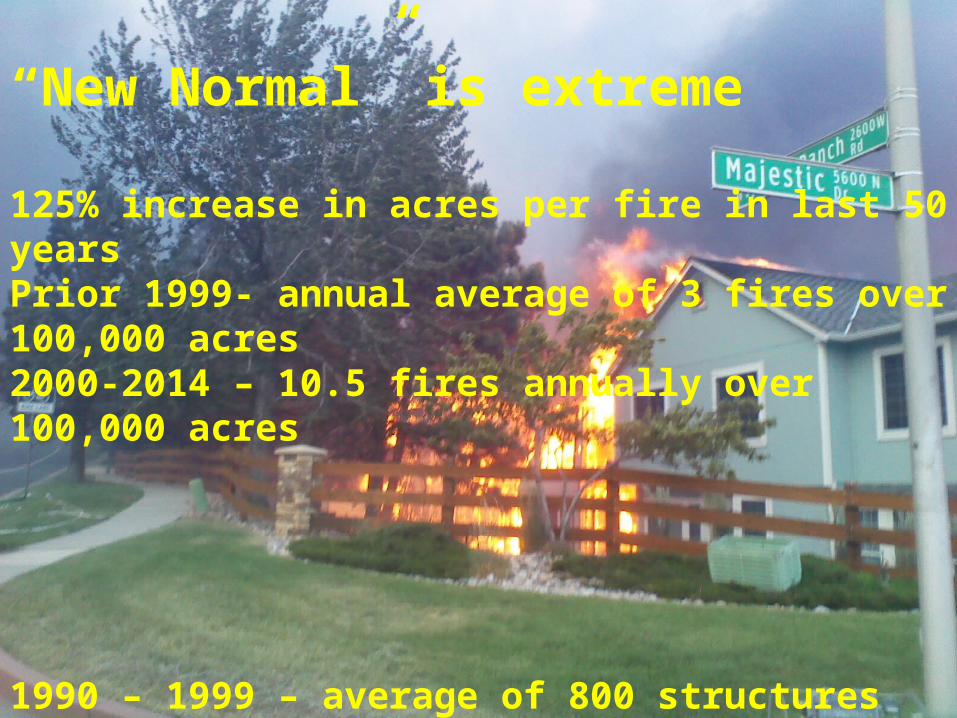
“New Normal” is extreme
125% increase in acres per fire in last 50 yearsPrior 1999- annual average of 3 fires over 100,000 acres2000-2014 – 10.5 fires annually over 100,000 acres
1990 – 1999 – average of 800 structures lost annually2000 – 2014 – average of 2670 annually7 of last 10 years wildland fire largest property loss in U.S.
Waldo June 26
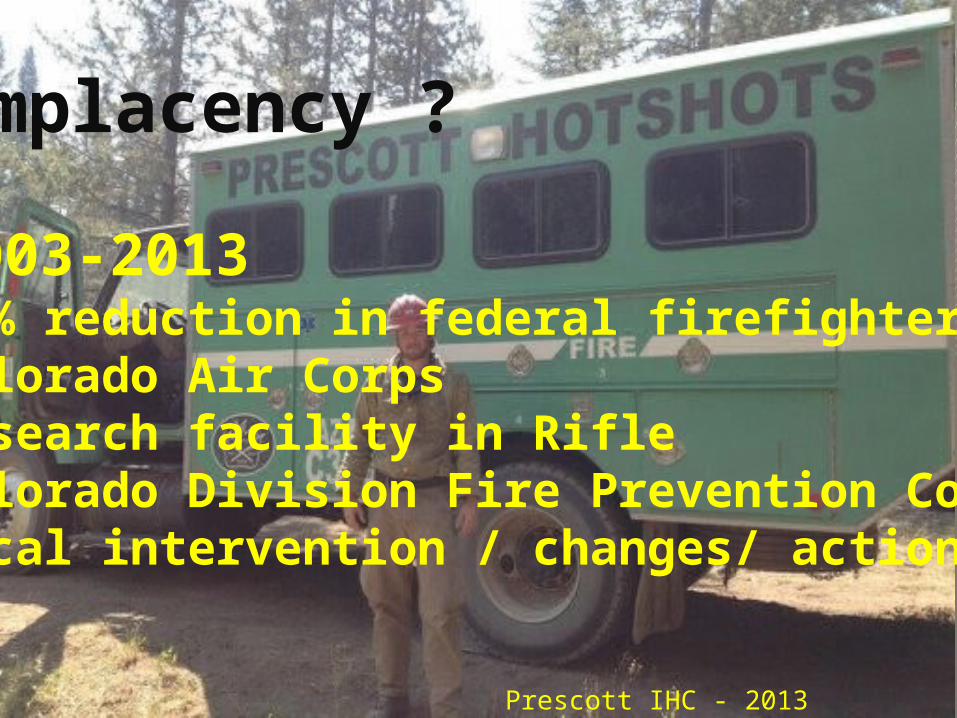
Complacency ?
• 2003-2013• 25% reduction in federal firefighters• Colorado Air Corps• Research facility in Rifle• Colorado Division Fire Prevention Control• Local intervention / changes/ action
Prescott IHC - 2013
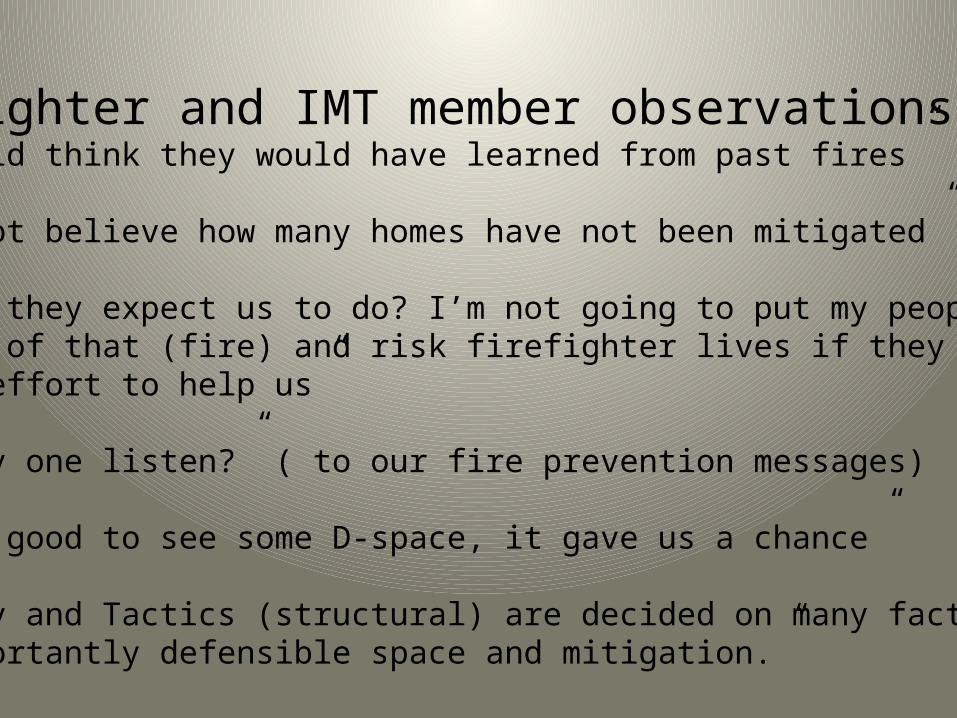
Firefighter and IMT member observations:“You would think they would have learned from past fires”
“I can not believe how many homes have not been mitigated”
“What do they expect us to do? I’m not going to put my peoplein front of that (fire) and risk firefighter lives if they can’t evenmake an effort to help us”
“Does any one listen?” ( to our fire prevention messages)
“ It was good to see some D-space, it gave us a chance”
“Strategy and Tactics (structural) are decided on many factors, most importantly defensible space and mitigation.”
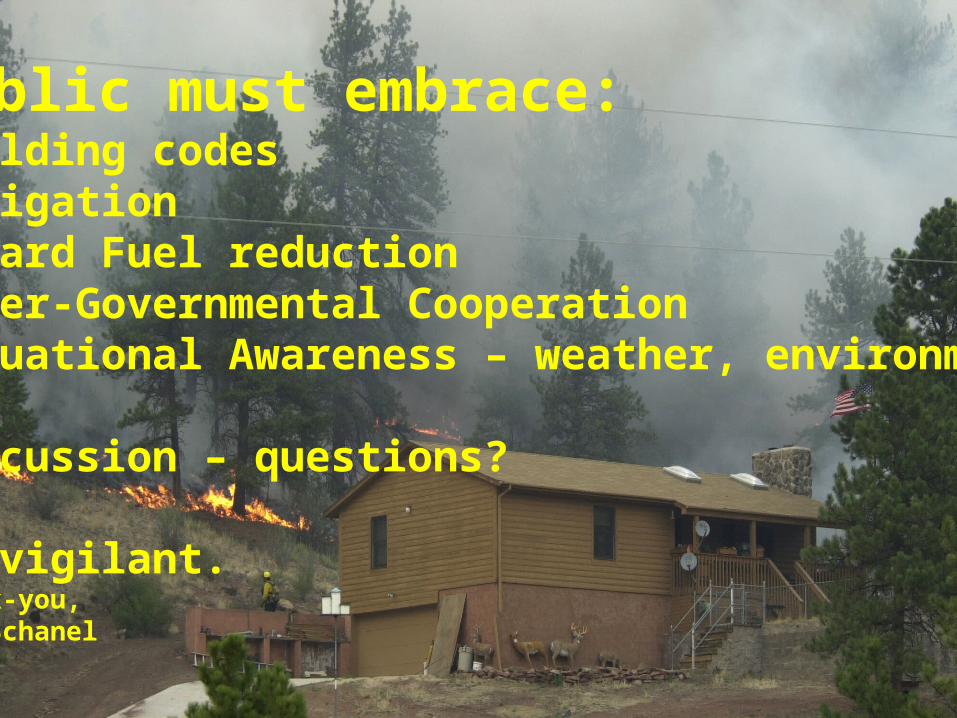
Public must embrace:Building codesMitigationHazard Fuel reductionInter-Governmental CooperationSituational Awareness – weather, environment
Discussion – questions?
Be vigilant.Thank-you,Jim Schanel