Embed Size (px)
Citation preview
HCV treatment challenges: Cirrhotic patients/CUPIC study
2nd Latin American Meeting on Treatment of Viral Hepatitis
Sao Paulo – 25th May 2013
Stefan ZeuzemUniversity Hospital,Frankfurt, Germany
0 1 2 3 4 5 6 7 8 9 100
10
20
30
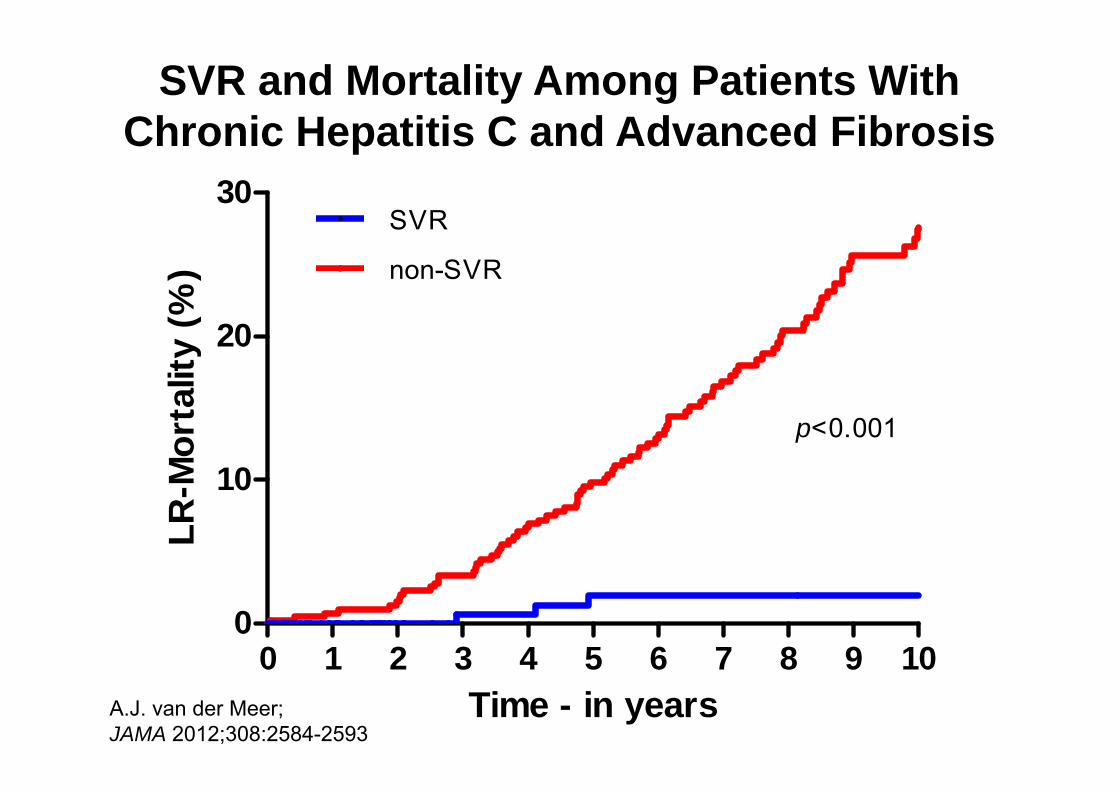
p<0.001
SVR
non-SVR
Time - in years
LR-M
orta
lity
(%)
SVR and Mortality Among Patients With Chronic Hepatitis C and Advanced Fibrosis
A.J. van der Meer; JAMA 2012;308:2584-2593
Lens S, et al. EASL 2013, Amsterdam, #210
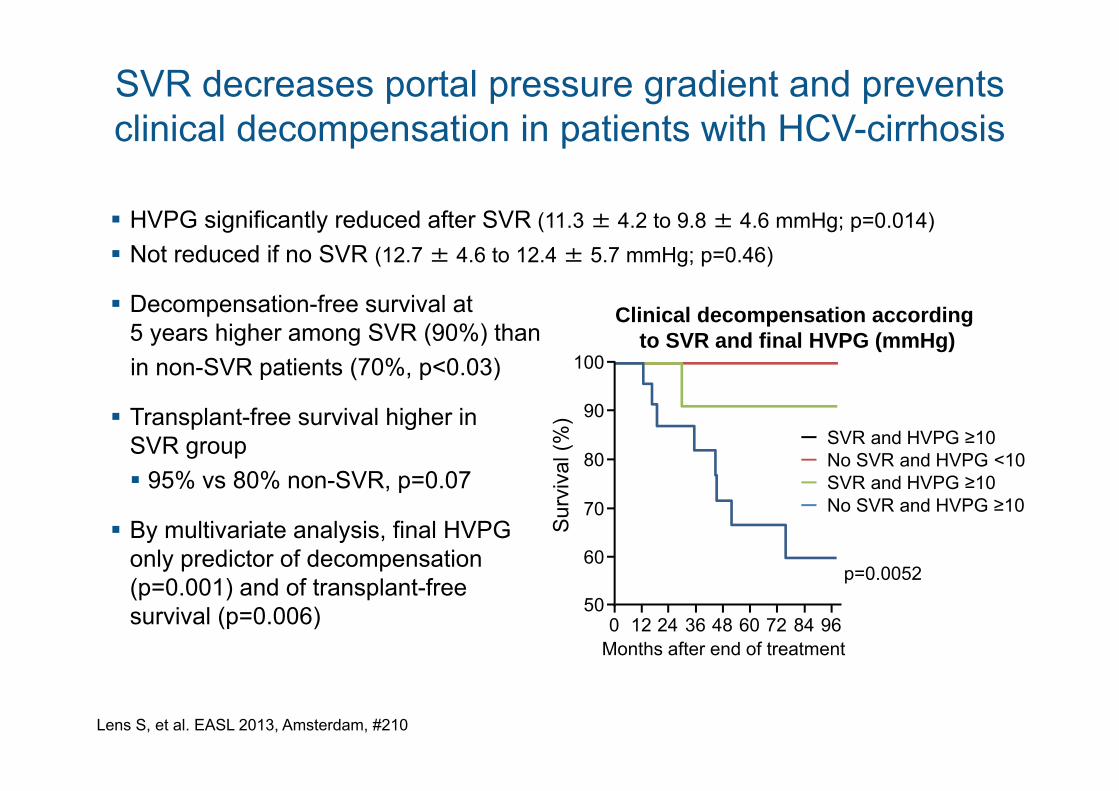
SVR decreases portal pressure gradient and prevents clinical decompensation in patients with HCV-cirrhosis
HVPG significantly reduced after SVR (11.3 ± 4.2 to 9.8 ± 4.6 mmHg; p=0.014) Not reduced if no SVR (12.7 ± 4.6 to 12.4 ± 5.7 mmHg; p=0.46)
Decompensation-free survival at 5 years higher among SVR (90%) than in non-SVR patients (70%, p<0.03)
Transplant-free survival higher in SVR group 95% vs 80% non-SVR, p=0.07
By multivariate analysis, final HVPG only predictor of decompensation (p=0.001) and of transplant-free survival (p=0.006)
Clinical decompensation according to SVR and final HVPG (mmHg)
50
60
70
80
90
100
Sur
viva
l (%
)
Months after end of treatment0 12 24 36 48 60 72 84 96
p=0.0052
SVR and HVPG ≥10No SVR and HVPG <10SVR and HVPG ≥10No SVR and HVPG ≥10
van der Meer AJP, et al. EASL 2013, Amsterdam, #504
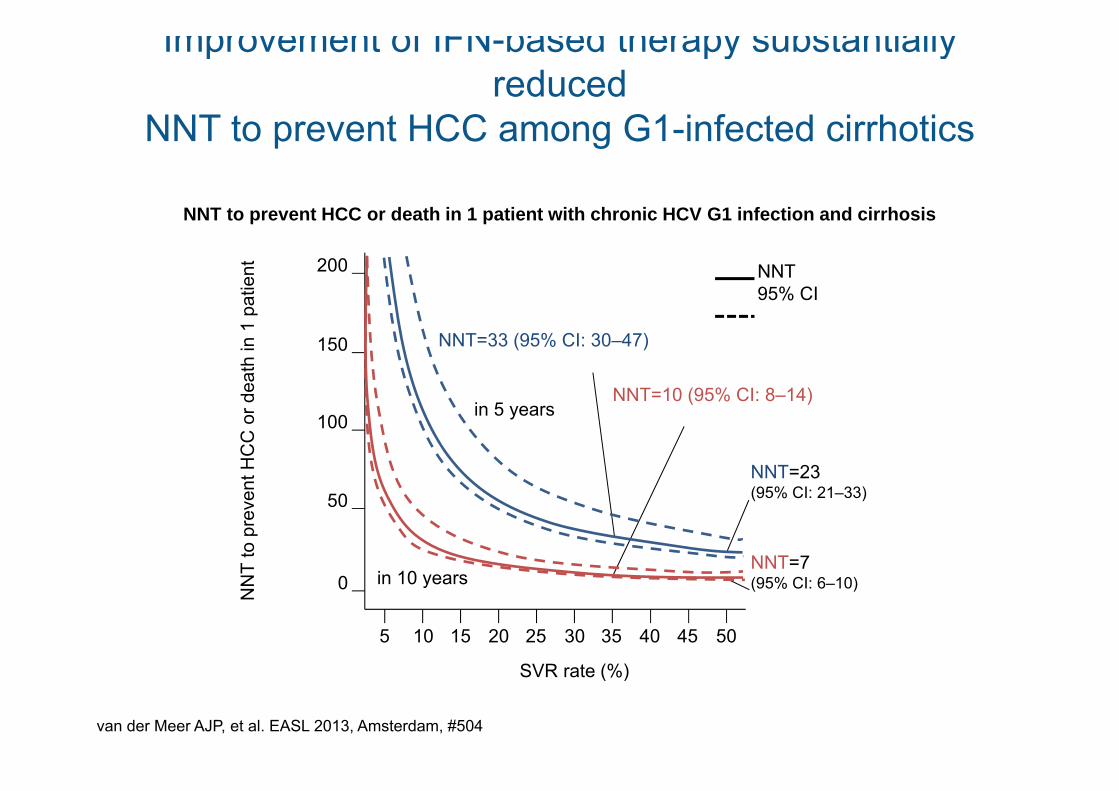
Improvement of IFN-based therapy substantially reduced
NNT to prevent HCC among G1-infected cirrhotics
NNT to prevent HCC or death in 1 patient with chronic HCV G1 infection and cirrhosis
0
50
100
150
200N
NT
to p
reve
nt H
CC
or d
eath
in 1
pat
ient
5 10 15 20 25 30 35 40 45 50
SVR rate (%)
NNT95% CI
in 5 years
NNT=23(95% CI: 21–33)
in 10 years
NNT=33 (95% CI: 30–47)
NNT=10 (95% CI: 8–14)
NNT=7(95% CI: 6–10)
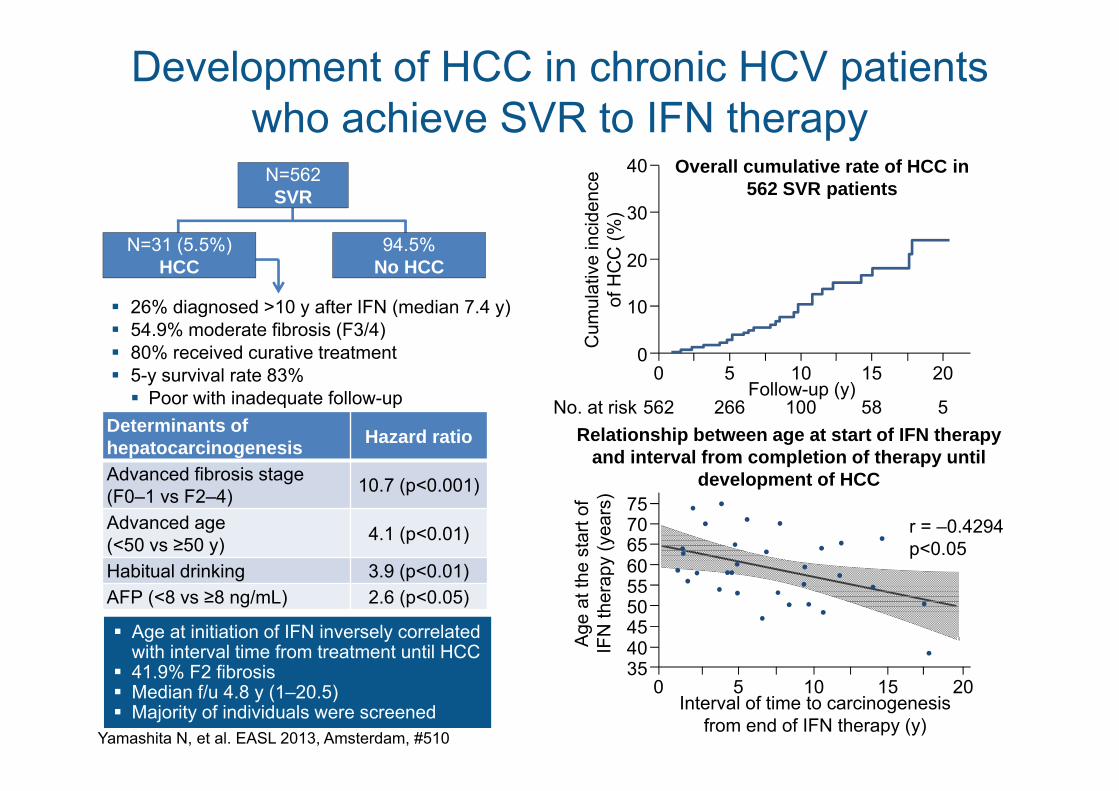
26% diagnosed >10 y after IFN (median 7.4 y) 54.9% moderate fibrosis (F3/4) 80% received curative treatment 5-y survival rate 83% Poor with inadequate follow-up
Development of HCC in chronic HCV patients who achieve SVR to IFN therapy
Yamashita N, et al. EASL 2013, Amsterdam, #510
Determinants of hepatocarcinogenesis Hazard ratio
Advanced fibrosis stage(F0–1 vs F2–4) 10.7 (p<0.001)
Advanced age(<50 vs ≥50 y) 4.1 (p<0.01)
Habitual drinking 3.9 (p<0.01)AFP (<8 vs ≥8 ng/mL) 2.6 (p<0.05)
Age at initiation of IFN inversely correlated with interval time from treatment until HCC
41.9% F2 fibrosis Median f/u 4.8 y (1–20.5) Majority of individuals were screened
N=562SVR
N=31 (5.5%) HCC
94.5%No HCC
Overall cumulative rate of HCC in 562 SVR patients
0
10
20
30
40
Cum
ulat
ive
inci
denc
e of
HC
C (%
)
5 10 15 20Follow-up (y)
0
266 100 58 5562No. at riskRelationship between age at start of IFN therapy
and interval from completion of therapy until development of HCC
35
45
6065
75
Age
at t
he s
tart
of
IFN
ther
apy
(yea
rs)
5 10 15 20Interval of time to carcinogenesis
from end of IFN therapy (y)
0
5550
40
70 r = –0.4294p<0.05
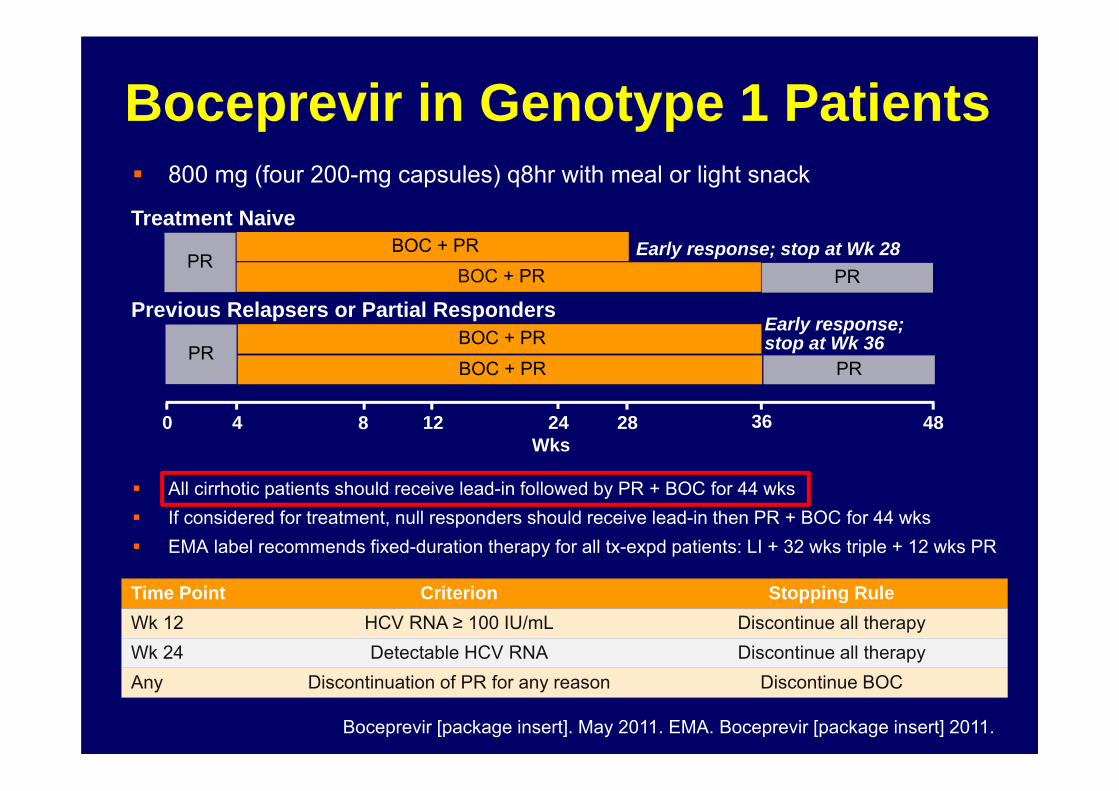
Boceprevir in Genotype 1 Patients 800 mg (four 200-mg capsules) q8hr with meal or light snack
All cirrhotic patients should receive lead-in followed by PR + BOC for 44 wks If considered for treatment, null responders should receive lead-in then PR + BOC for 44 wks EMA label recommends fixed-duration therapy for all tx-expd patients: LI + 32 wks triple + 12 wks PR
BOC + PR
PRPR
BOC + PR
Boceprevir [package insert]. May 2011. EMA. Boceprevir [package insert] 2011.
Treatment Naive
Previous Relapsers or Partial RespondersBOC + PR
Wks480 28124
PRPR
8 36
BOC + PR
24
Time Point Criterion Stopping RuleWk 12 HCV RNA ≥ 100 IU/mL Discontinue all therapyWk 24 Detectable HCV RNA Discontinue all therapyAny Discontinuation of PR for any reason Discontinue BOC
Early response; stop at Wk 28
Early response; stop at Wk 36
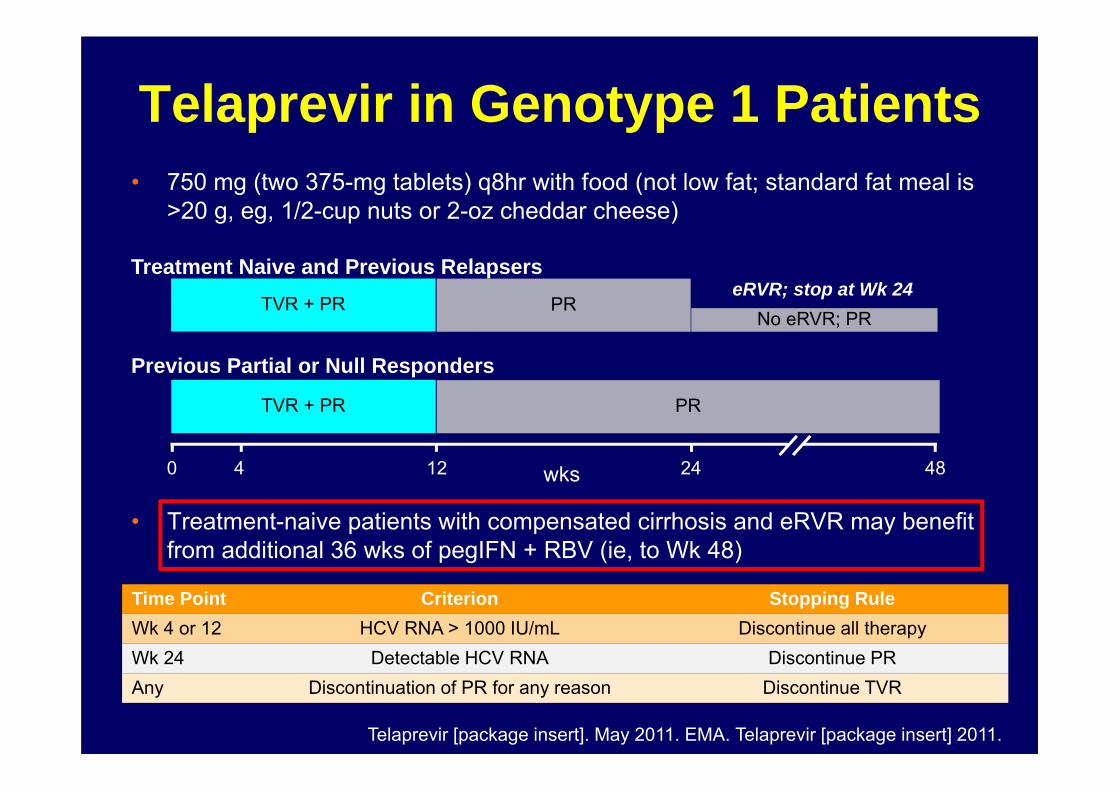
• 750 mg (two 375-mg tablets) q8hr with food (not low fat; standard fat meal is >20 g, eg, 1/2-cup nuts or 2-oz cheddar cheese)
• Treatment-naive patients with compensated cirrhosis and eRVR may benefit from additional 36 wks of pegIFN + RBV (ie, to Wk 48)
No eRVR; PR
Telaprevir in Genotype 1 Patients
TVR + PReRVR; stop at Wk 24
PR
Telaprevir [package insert]. May 2011. EMA. Telaprevir [package insert] 2011.
Time Point Criterion Stopping RuleWk 4 or 12 HCV RNA > 1000 IU/mL Discontinue all therapyWk 24 Detectable HCV RNA Discontinue PRAny Discontinuation of PR for any reason Discontinue TVR
Treatment Naive and Previous Relapsers
Previous Partial or Null Responders
TVR + PR
480 24124
PR
wks

SVR ADVANCE (TVR) SPRINT-2 (BOC)PR + TVR PR PR + BOC PR
Lead-in < 1 log - - 28-38% 4%Lead-in ≥ 1 log - - 79-81% 51%eRVR1 achieved 83-89% 97% 96% 93%eRVR1 not achieved 50-54% 39% 72-75% 66%Caucasian, non-black 70-75% 46% 67-68% 40%African Amer., black 58-62% 25% 42-53% 23%Stage F0-2 73-78% 47% 67% 38%Stage F3-4 53-62% 33% 41-52% 38%IL28B CC 84-90% 64% 80-82% 78%IL28B CT/TT 57-73% 23-25% 55-71% 27-28%
SVR rates in treatment naive patients(no head-to-head data)
1 Different definitions of eEVR in ADVANCE and SPRINT-2Jacobson et al., AASLD 2010; EASL 2011Reddy et al., APASL 2011Poordad et al., NEJM 2011; EASL 2011
BOCEPREVIR inTX-experienced Patients
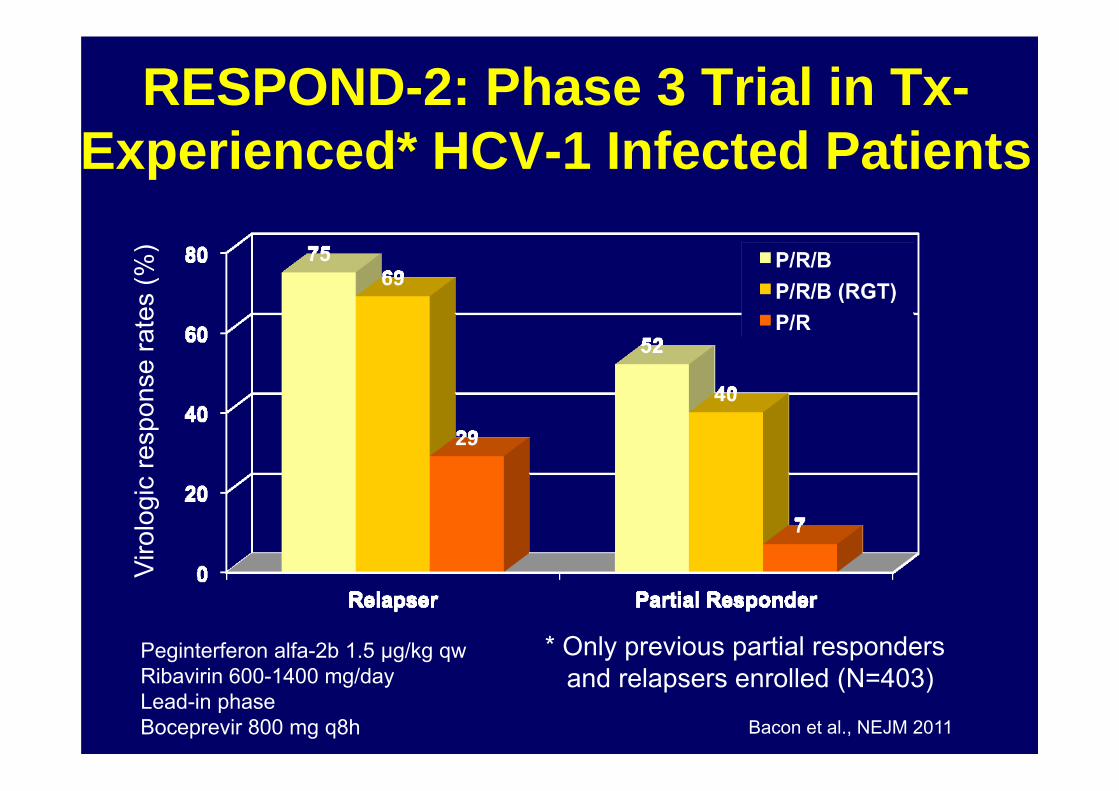
RESPOND-2: Phase 3 Trial in Tx-Experienced* HCV-1 Infected Patients
Bacon et al., NEJM 2011
Viro
logi
c re
spon
se ra
tes
(%)
Peginterferon alfa-2b 1.5 µg/kg qwRibavirin 600-1400 mg/dayLead-in phaseBoceprevir 800 mg q8h
* Only previous partial respondersand relapsers enrolled (N=403)
11
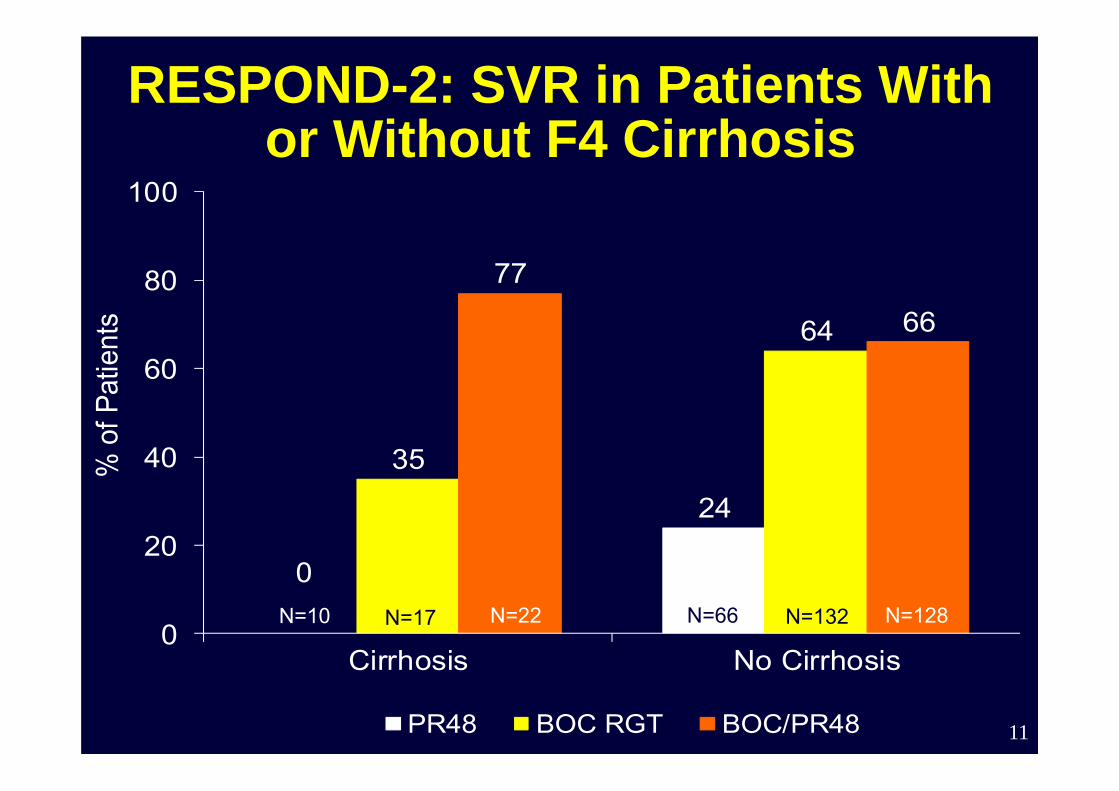
RESPOND-2: SVR in Patients With or Without F4 Cirrhosis
0
24
35
64
77
66
0
20
40
60
80
100
Cirrhosis No Cirrhosis
% o
f Pat
ient
s
PR48 BOC RGT BOC/PR48
N=10 N=17 N=22 N=66 N=132 N=128
12
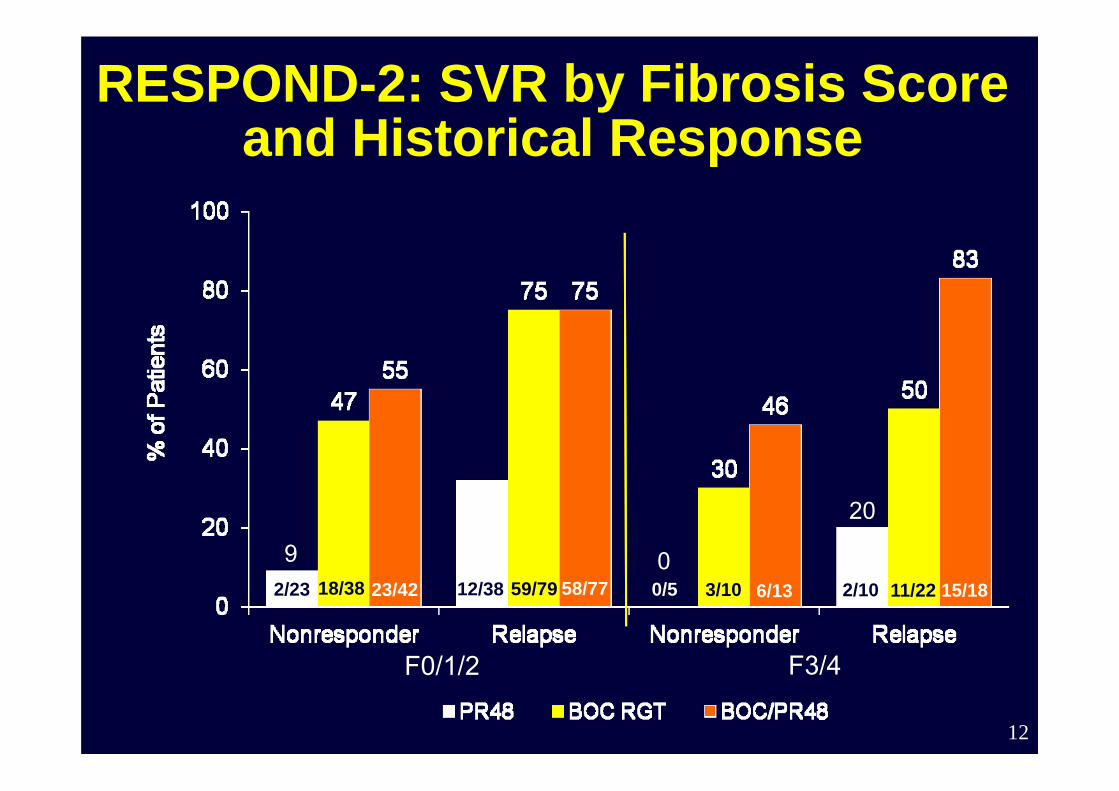
RESPOND-2: SVR by Fibrosis Score and Historical Response
N=61
23/42
F0/1/2 F3/4
15/1811/222/106/133/100/558/7759/7912/3818/382/23
9 0
20
13
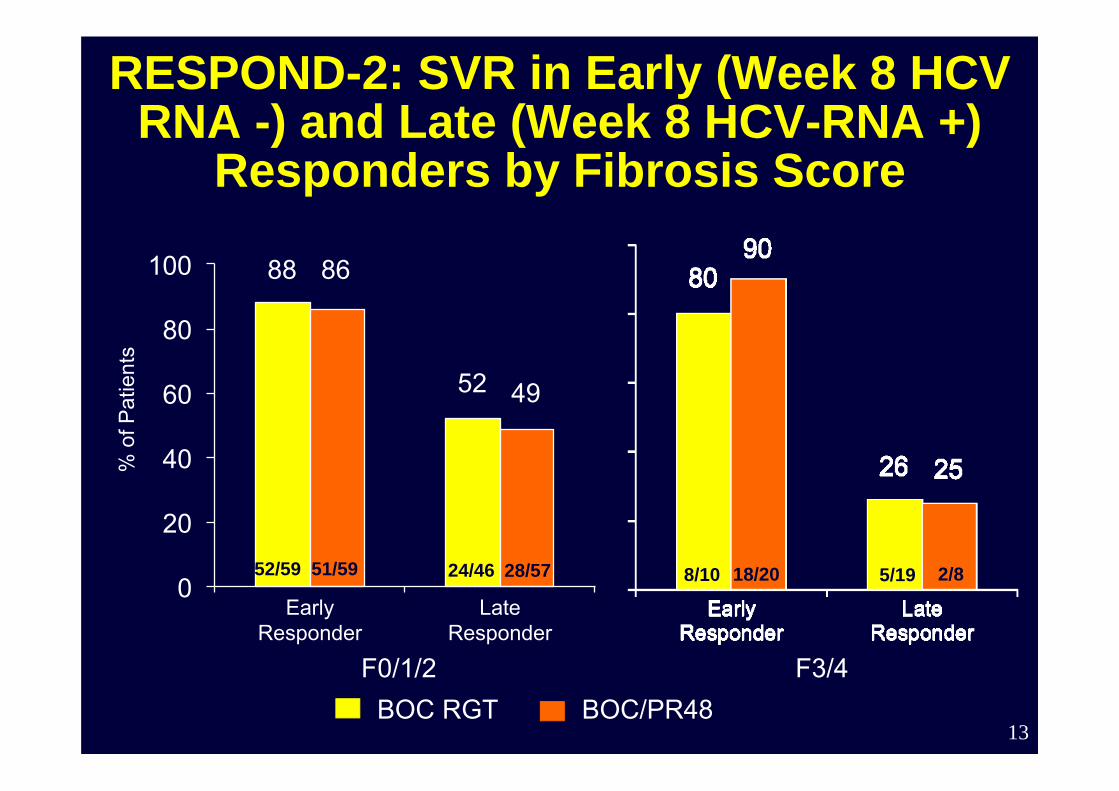
RESPOND-2: SVR in Early (Week 8 HCV RNA -) and Late (Week 8 HCV-RNA +)
Responders by Fibrosis Score
88
52
86
49
0
20
40
60
80
100
Early Responder
Late Responder
% o
f Pat
ient
s
F0/1/2 F3/4BOC RGT BOC/PR48
52/59 51/59 24/46 28/57 8/10 18/20 5/19 2/8
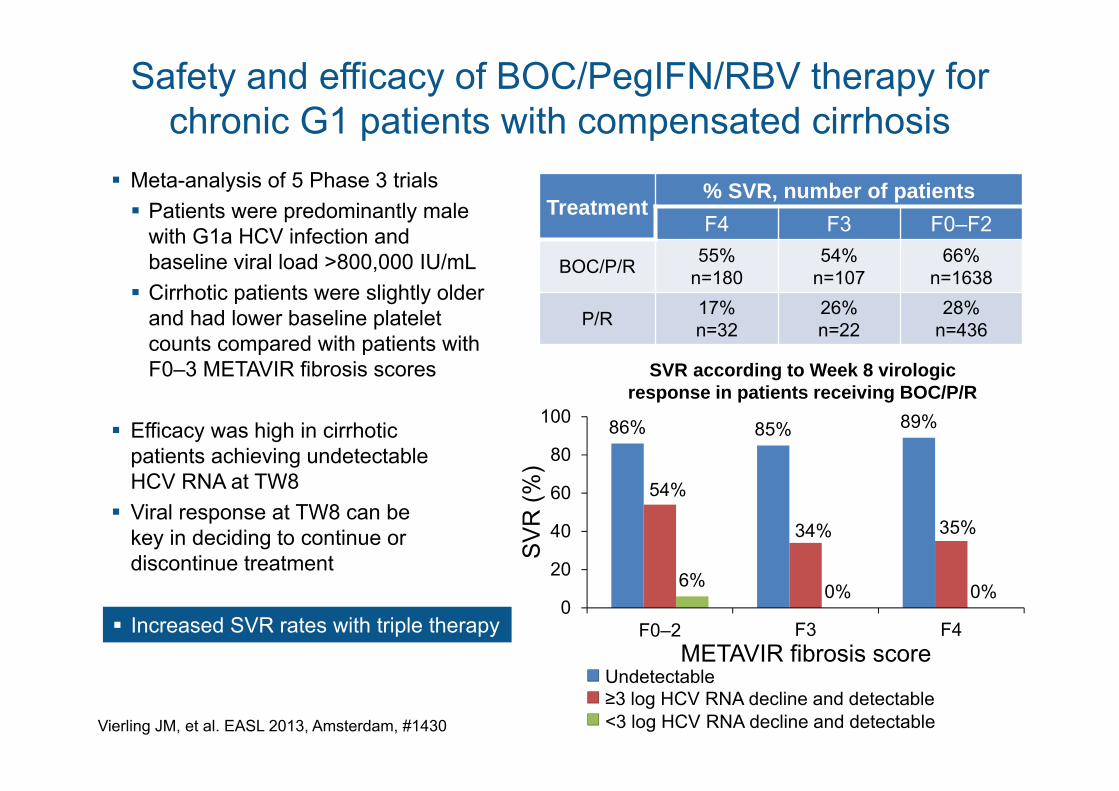
Safety and efficacy of BOC/PegIFN/RBV therapy for chronic G1 patients with compensated cirrhosis
Vierling JM, et al. EASL 2013, Amsterdam, #1430
Meta-analysis of 5 Phase 3 trials Patients were predominantly male
with G1a HCV infection andbaseline viral load >800,000 IU/mL Cirrhotic patients were slightly older
and had lower baseline plateletcounts compared with patients withF0–3 METAVIR fibrosis scores
Efficacy was high in cirrhotic patients achieving undetectable HCV RNA at TW8
Viral response at TW8 can be key in deciding to continue or discontinue treatment
Treatment% SVR, number of patientsF4 F3 F0–F2
BOC/P/R 55%n=180
54%n=107
66%n=1638
P/R 17%n=32
26%n=22
28%n=436
86% 85% 89%
54%
34% 35%
6% 0% 0%0
20
40
60
80
100
F0–2 F3 F4
Undetectable≥3 log HCV RNA decline and detectable<3 log HCV RNA decline and detectable
METAVIR fibrosis score
SV
R (%
)
SVR according to Week 8 virologicresponse in patients receiving BOC/P/R
Increased SVR rates with triple therapy
15
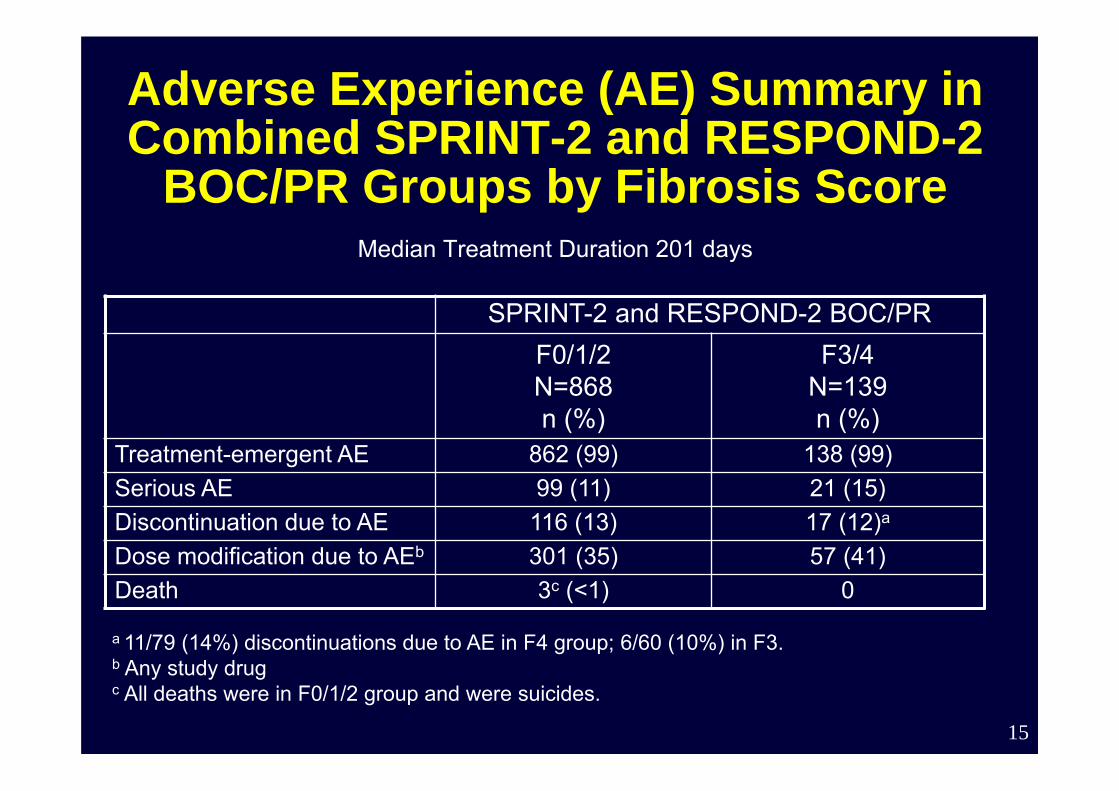
Adverse Experience (AE) Summary in Combined SPRINT-2 and RESPOND-2
BOC/PR Groups by Fibrosis ScoreMedian Treatment Duration 201 days
SPRINT-2 and RESPOND-2 BOC/PRF0/1/2N=868n (%)
F3/4N=139n (%)
Treatment-emergent AE 862 (99) 138 (99)Serious AE 99 (11) 21 (15)Discontinuation due to AE 116 (13) 17 (12)a
Dose modification due to AEb 301 (35) 57 (41)Death 3c (<1) 0
a 11/79 (14%) discontinuations due to AE in F4 group; 6/60 (10%) in F3.b Any study drugc All deaths were in F0/1/2 group and were suicides.

TELAPREVIR inTX-experienced Patients
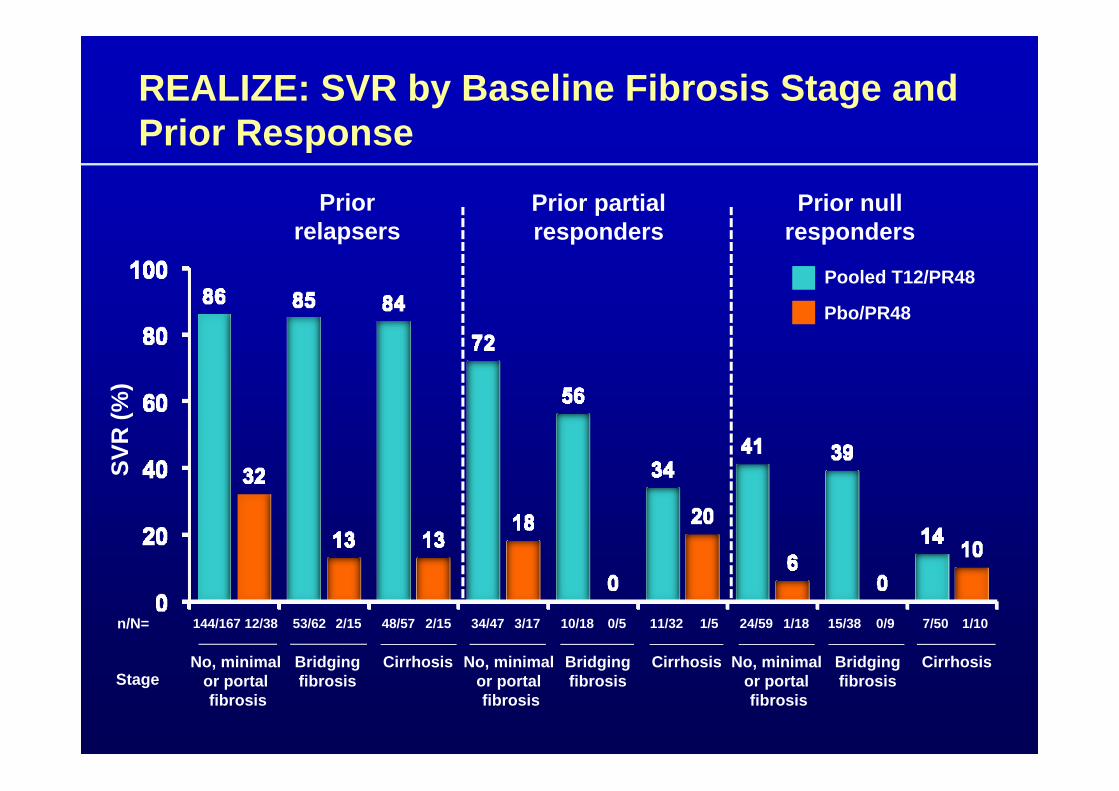
REALIZE: SVR by Baseline Fibrosis Stage and Prior Response
Prior relapsers
Prior partial responders
Prior null responders
2/15n/N= 53/62144/167 12/38 0/510/1834/47 3/17 0/915/3811/32 1/5
No, minimal or portal fibrosis
CirrhosisStage
Pooled T12/PR48
Pbo/PR48
SVR
(%)
2/1548/57 24/59 1/18 7/50 1/10
Bridgingfibrosis
No, minimal or portal fibrosis
CirrhosisBridgingfibrosis
No, minimal or portal fibrosis
CirrhosisBridgingfibrosis
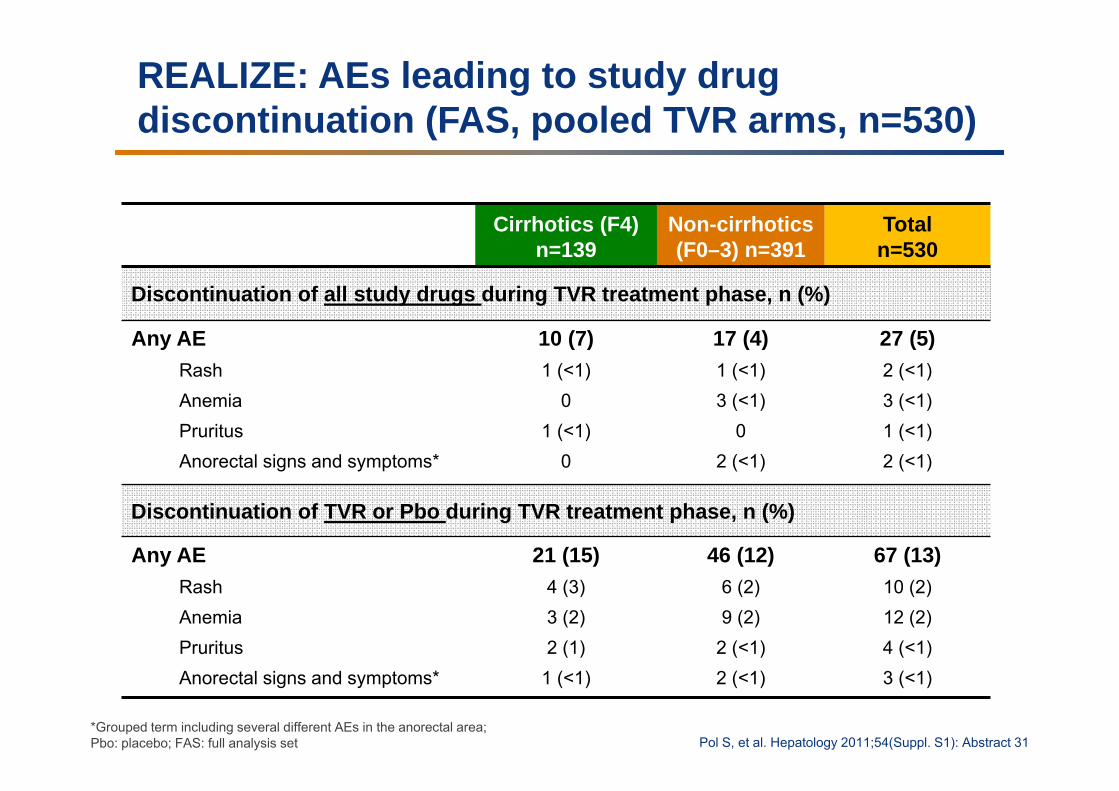
REALIZE: AEs leading to study drug discontinuation (FAS, pooled TVR arms, n=530)
Cirrhotics (F4) n=139
Non-cirrhotics(F0–3) n=391
Totaln=530
Discontinuation of all study drugs during TVR treatment phase, n (%)
Any AERashAnemiaPruritusAnorectal signs and symptoms*
10 (7)1 (<1)
01 (<1)
0
17 (4)1 (<1)3 (<1)
02 (<1)
27 (5)2 (<1)3 (<1)1 (<1)2 (<1)
Discontinuation of TVR or Pbo during TVR treatment phase, n (%)
Any AERashAnemiaPruritusAnorectal signs and symptoms*
21 (15)4 (3)3 (2)2 (1)
1 (<1)
46 (12)6 (2)9 (2)
2 (<1)2 (<1)
67 (13)10 (2)12 (2)4 (<1)3 (<1)
*Grouped term including several different AEs in the anorectal area; Pbo: placebo; FAS: full analysis set Pol S, et al. Hepatology 2011;54(Suppl. S1): Abstract 31
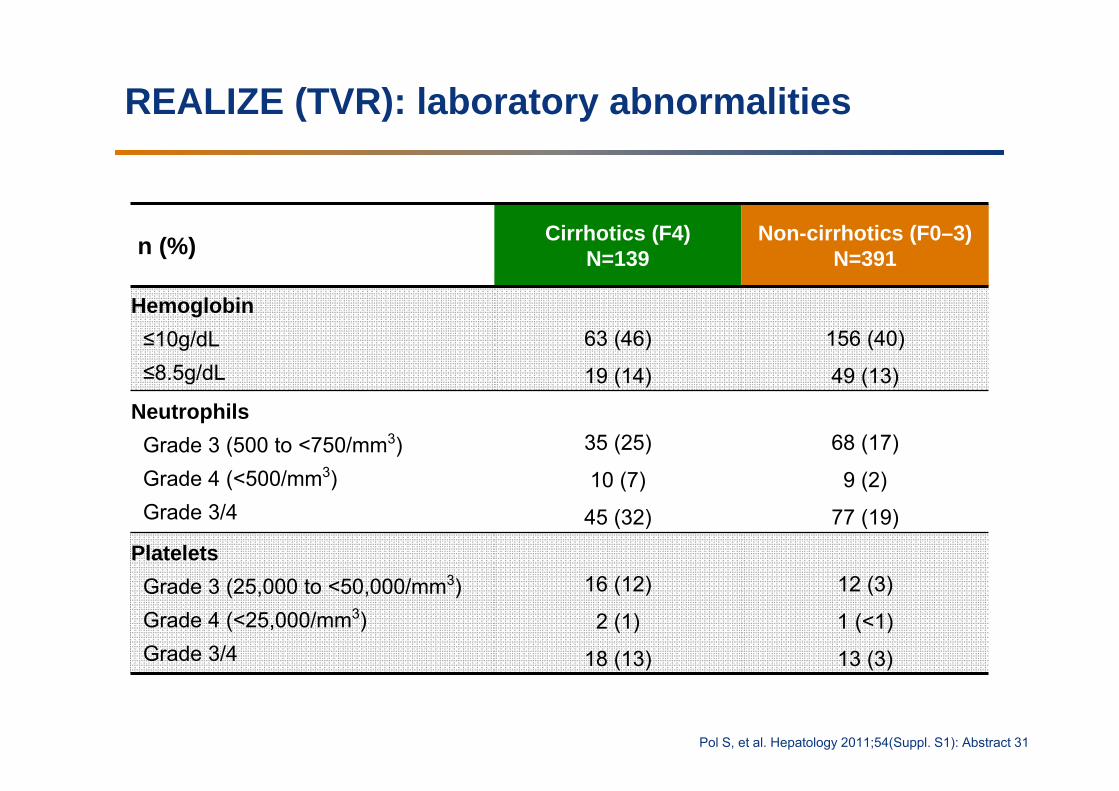
REALIZE (TVR): laboratory abnormalities
Pol S, et al. Hepatology 2011;54(Suppl. S1): Abstract 31
n (%) Cirrhotics (F4) N=139
Non-cirrhotics (F0–3) N=391
Hemoglobin≤10g/dL≤8.5g/dL
63 (46)
19 (14)
156 (40)
49 (13)
NeutrophilsGrade 3 (500 to <750/mm3)Grade 4 (<500/mm3)Grade 3/4
35 (25)
10 (7)
45 (32)
68 (17)
9 (2)
77 (19)
PlateletsGrade 3 (25,000 to <50,000/mm3)Grade 4 (<25,000/mm3)Grade 3/4
16 (12)
2 (1)
18 (13)
12 (3)
1 (<1)
13 (3)
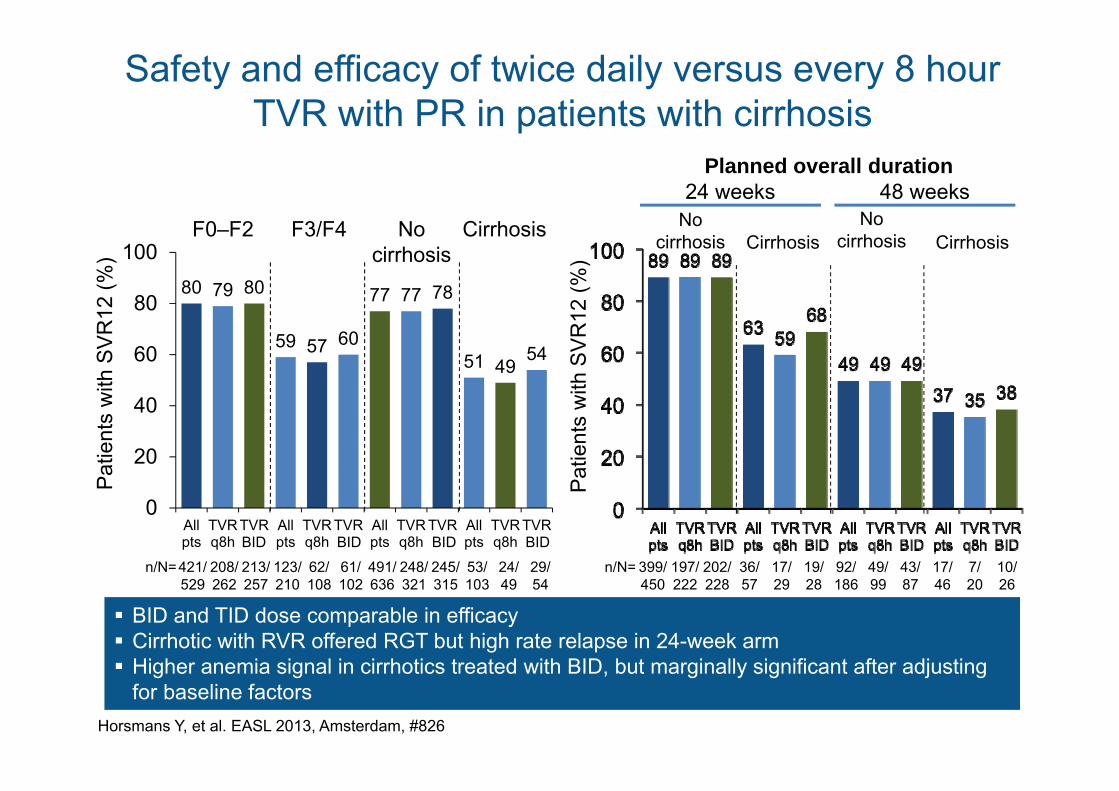
Safety and efficacy of twice daily versus every 8 hour TVR with PR in patients with cirrhosis
Horsmans Y, et al. EASL 2013, Amsterdam, #826
BID and TID dose comparable in efficacy Cirrhotic with RVR offered RGT but high rate relapse in 24-week arm Higher anemia signal in cirrhotics treated with BID, but marginally significant after adjusting
for baseline factors
80 79 80
59 57 60
77 77 78
51 4954
0
20
40
60
80
100
Allpts
TVRq8h
TVRbid
Allpts
TVRq8h
TVRbid
Allpts
TVRq8h
TVRbid
Allpts
TVRq8h
TVRbid
F0–F2 F3/F4 No cirrhosis
Cirrhosis
n/N=421/529
208/262
213/257
123/210
62/108
61/102
491/636
248/321
245/315
53/103
24/49
29/54
n/N= 399/450
197/222
202/228
36/57
17/29
19/28
92/186
49/99
43/87
17/46
7/20
10/26
Nocirrhosis Cirrhosis
Nocirrhosis Cirrhosis
24 weeks 48 weeksPlanned overall duration
Pat
ient
s w
ith S
VR
12 (%
)
Pat
ient
s w
ith S
VR
12 (%
)
BID BID BID BID
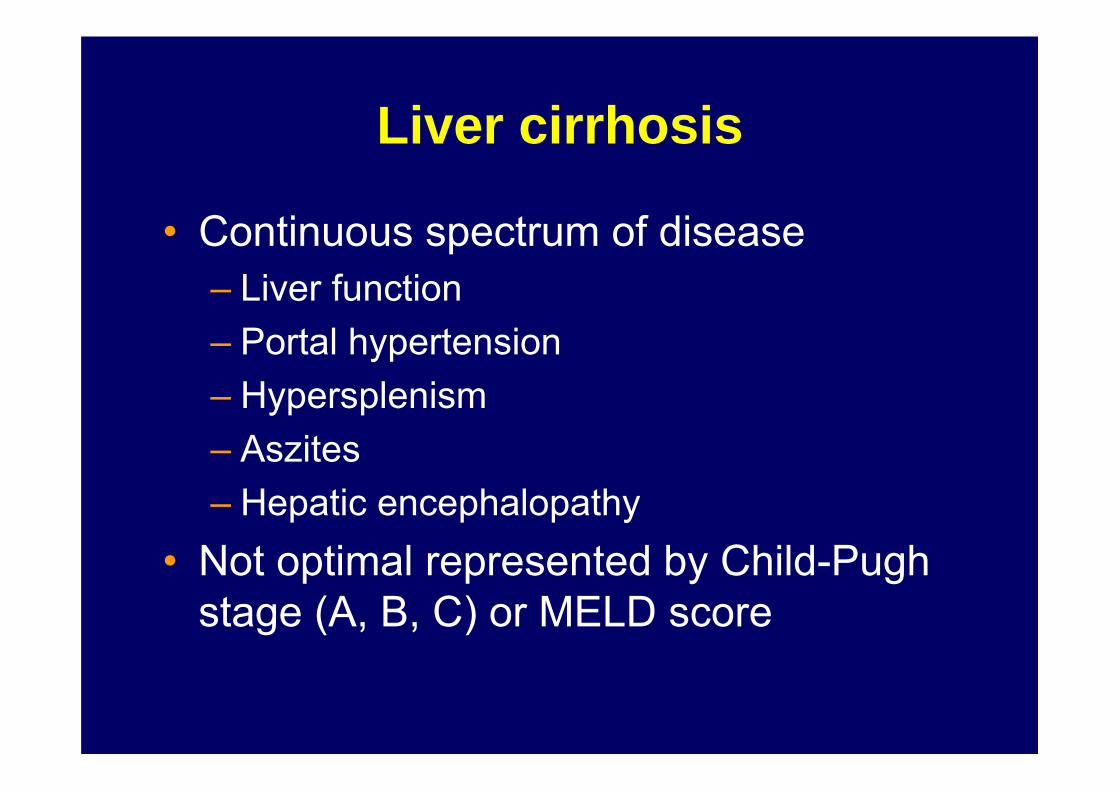
Liver cirrhosis
• Continuous spectrum of disease– Liver function– Portal hypertension– Hypersplenism– Aszites– Hepatic encephalopathy
• Not optimal represented by Child-Pughstage (A, B, C) or MELD score
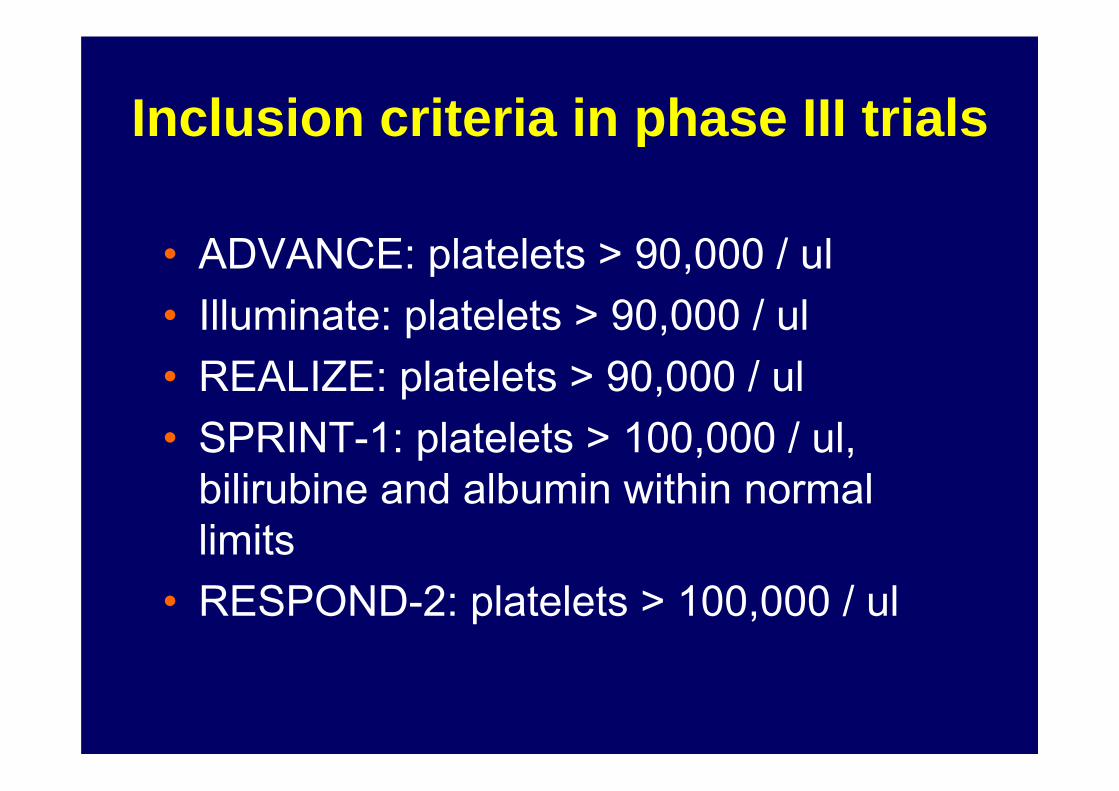
Inclusion criteria in phase III trials
• ADVANCE: platelets > 90,000 / ul• Illuminate: platelets > 90,000 / ul• REALIZE: platelets > 90,000 / ul• SPRINT-1: platelets > 100,000 / ul,
bilirubine and albumin within normal limits
• RESPOND-2: platelets > 100,000 / ul
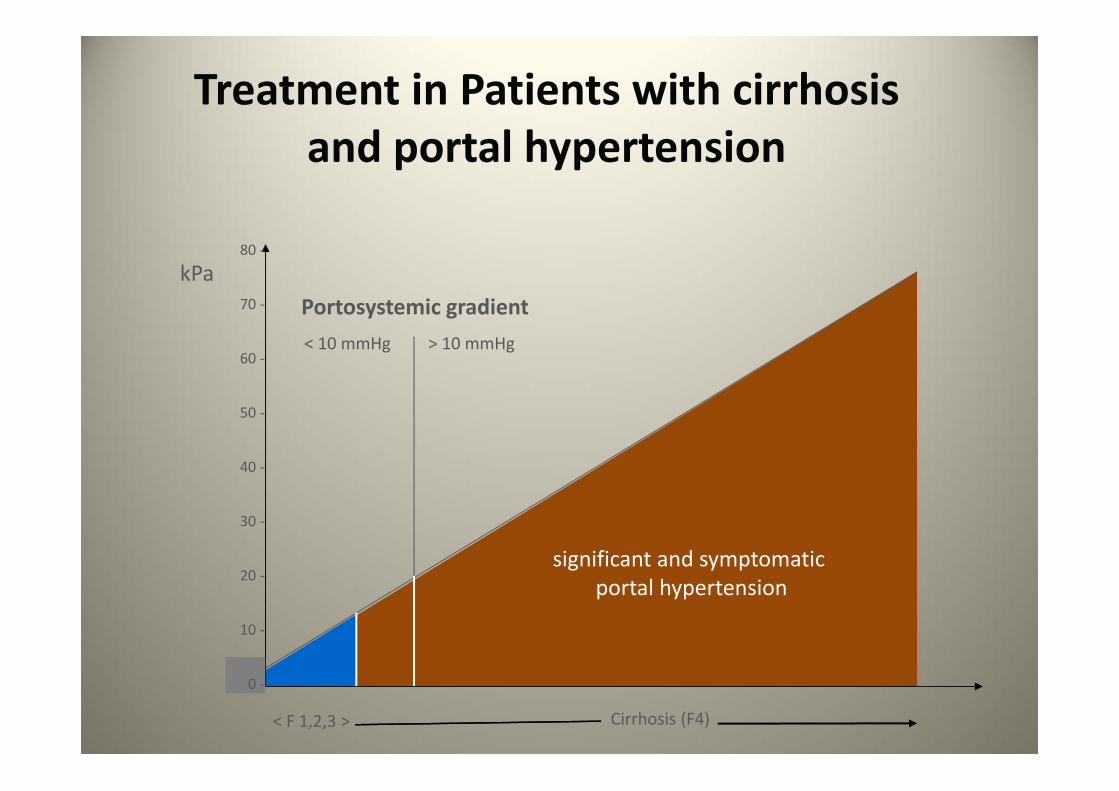
Treatment in Patients with cirrhosis and portal hypertension
kPa
< F 1,2,3 > Cirrhosis (F4)
< 10 mmHg > 10 mmHg
significant and symptomaticportal hypertension
Portosystemic gradient
80 ‐
70 ‐
60 ‐
50 ‐
40 ‐
30 ‐
20 ‐
10 ‐
0 ‐
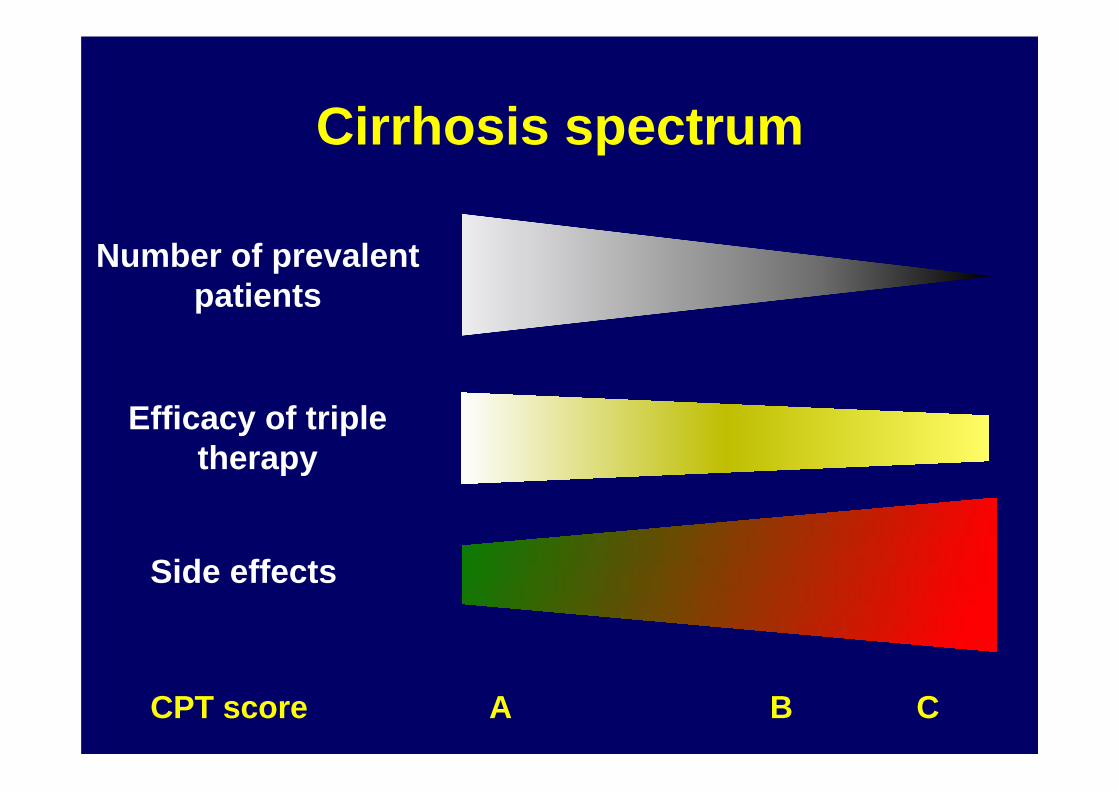
Cirrhosis spectrum
Number of prevalentpatients
Efficacy of tripletherapy
Side effects
CPT score A B C
22%
59%
83%
0
25
50
75
100
<10 10 - 13 >13Dec
ompe
nsat
ion
(%)
MELD score (BL)
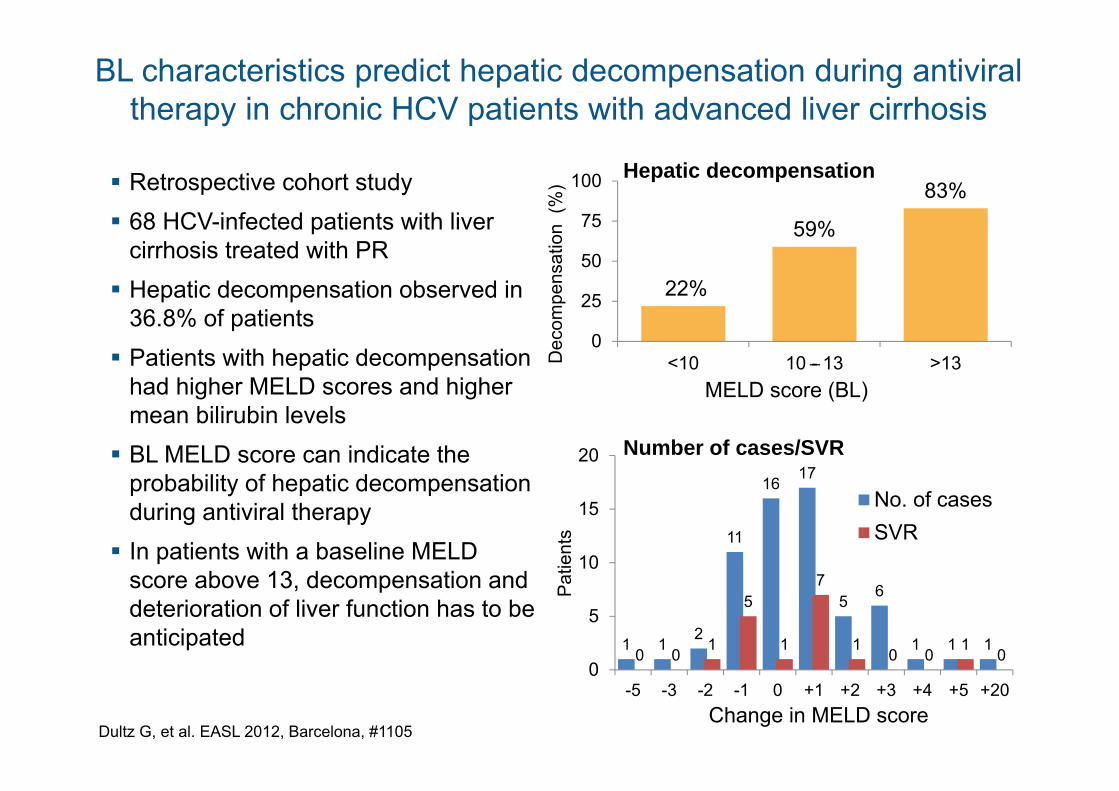
Retrospective cohort study 68 HCV-infected patients with liver
cirrhosis treated with PR Hepatic decompensation observed in
36.8% of patients Patients with hepatic decompensation
had higher MELD scores and higher mean bilirubin levels BL MELD score can indicate the
probability of hepatic decompensation during antiviral therapy In patients with a baseline MELD
score above 13, decompensation and deterioration of liver function has to be anticipated
Dultz G, et al. EASL 2012, Barcelona, #1105
1 12
11
1617
56
1 1 10 0
1
5
1
7
10 0
10
0
5
10
15
20
-5 -3 -2 -1 0 +1 +2 +3 +4 +5 +20
No. of casesSVR
Change in MELD score
Hepatic decompensation
Pat
ient
s
Number of cases/SVR
–
BL characteristics predict hepatic decompensation during antiviral therapy in chronic HCV patients with advanced liver cirrhosis
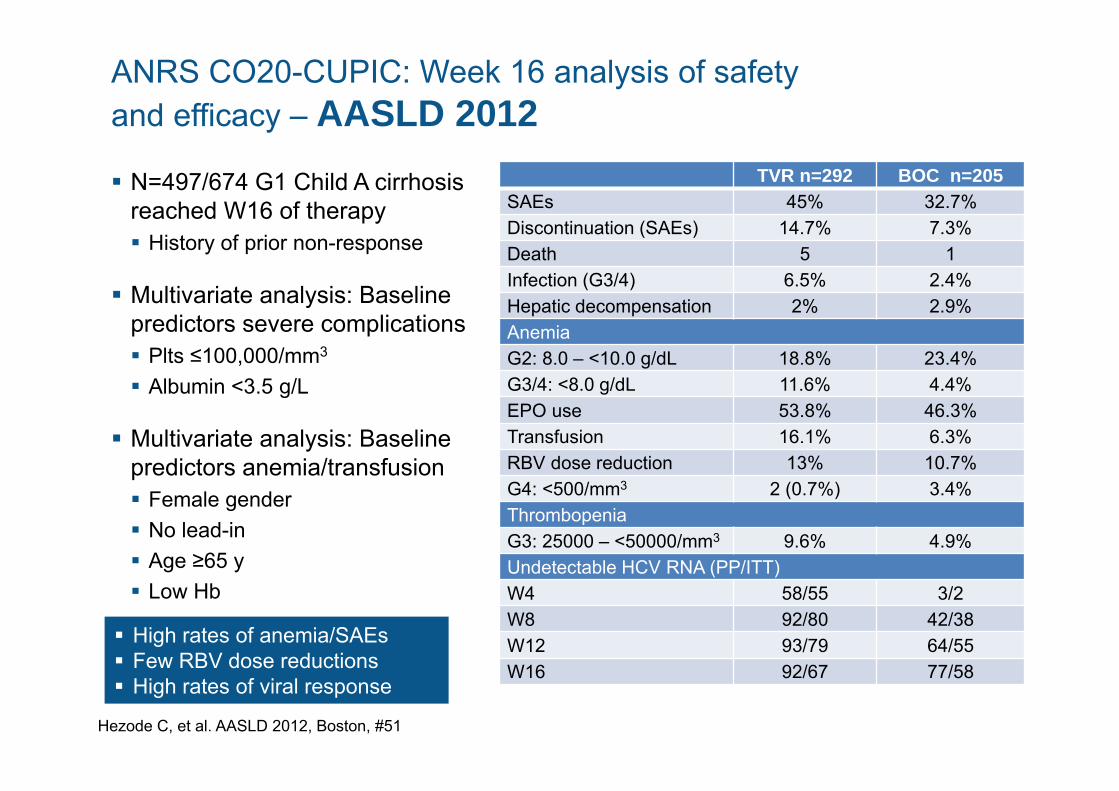
ANRS CO20-CUPIC: Week 16 analysis of safety and efficacy – AASLD 2012 N=497/674 G1 Child A cirrhosis
reached W16 of therapy History of prior non-response
Multivariate analysis: Baseline predictors severe complications Plts ≤100,000/mm3
Albumin <3.5 g/L
Multivariate analysis: Baseline predictors anemia/transfusion Female gender No lead-in Age ≥65 y Low Hb
Hezode C, et al. AASLD 2012, Boston, #51
TVR n=292 BOC n=205SAEs 45% 32.7%Discontinuation (SAEs) 14.7% 7.3%Death 5 1Infection (G3/4) 6.5% 2.4%Hepatic decompensation 2% 2.9%Anemia G2: 8.0 – <10.0 g/dL 18.8% 23.4%G3/4: <8.0 g/dL 11.6% 4.4%EPO use 53.8% 46.3%Transfusion 16.1% 6.3%RBV dose reduction 13% 10.7%G4: <500/mm3 2 (0.7%) 3.4%Thrombopenia G3: 25000 – <50000/mm3 9.6% 4.9%Undetectable HCV RNA (PP/ITT) W4 58/55 3/2W8 92/80 42/38W12 93/79 64/55W16 92/67 77/58
High rates of anemia/SAEs Few RBV dose reductions High rates of viral response
Viro
logi
cfa
ilure
(%)
*22 without failure
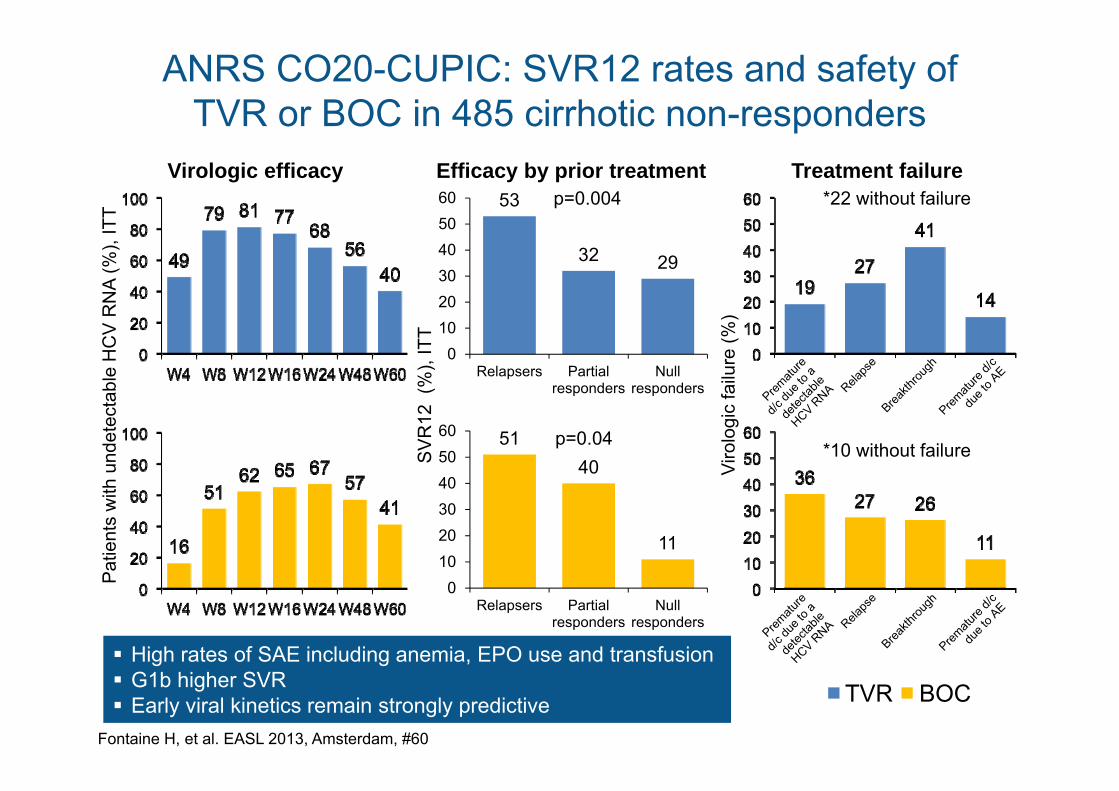
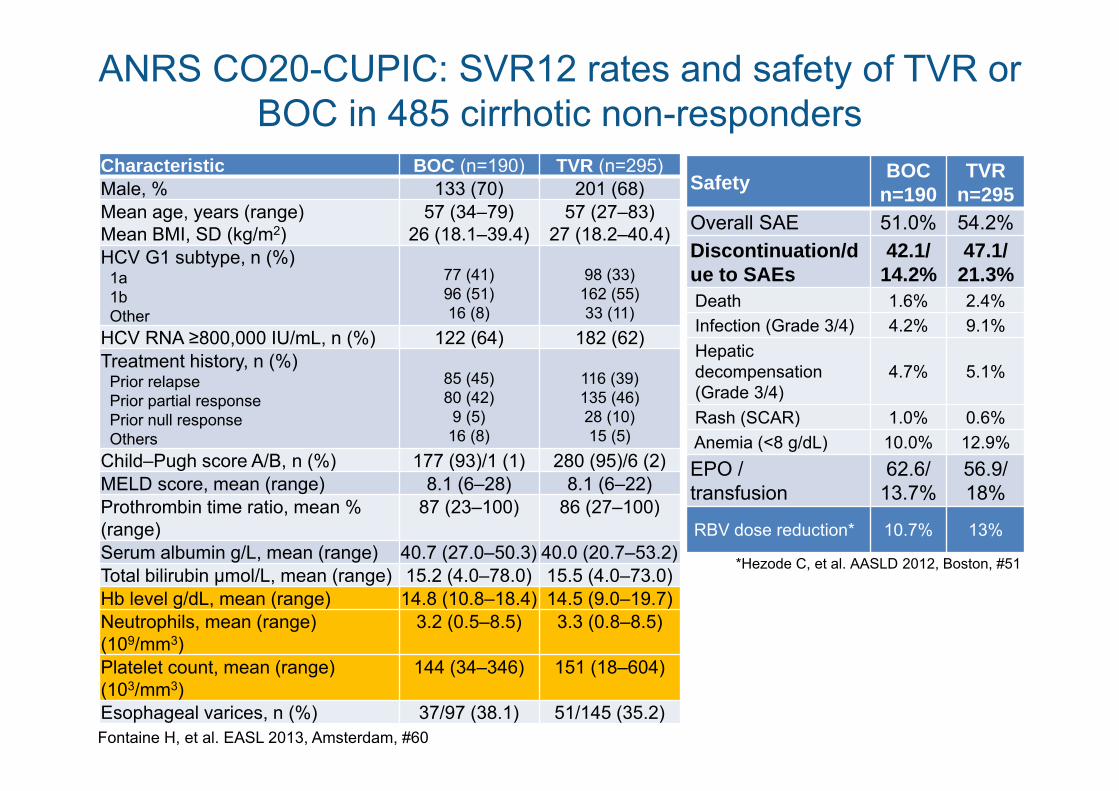
ANRS CO20-CUPIC: SVR12 rates and safety of TVR or BOC in 485 cirrhotic non-responders
Fontaine H, et al. EASL 2013, Amsterdam, #60
Virologic efficacy
High rates of SAE including anemia, EPO use and transfusion G1b higher SVR Early viral kinetics remain strongly predictive
Efficacy by prior treatment Treatment failure53
32 29
0102030405060
Relapsers Partialresponders
Nullresponders
p=0.004
5140
11
0102030405060
Relapsers Partialresponders
Nullresponders
p=0.04
TVR BOC
*10 without failure
Pat
ient
s w
ith u
ndet
ecta
ble
HC
V R
NA
(%),
ITT
SV
R12
(%
), IT
T
ANRS CO20-CUPIC: SVR12 rates and safety of TVR or BOC in 485 cirrhotic non-responders
Fontaine H, et al. EASL 2013, Amsterdam, #60
Safety BOCn=190
TVRn=295
Overall SAE 51.0% 54.2%Discontinuation/due to SAEs
42.1/14.2%
47.1/21.3%
Death 1.6% 2.4%Infection (Grade 3/4) 4.2% 9.1%Hepaticdecompensation(Grade 3/4)
4.7% 5.1%
Rash (SCAR) 1.0% 0.6%Anemia (<8 g/dL) 10.0% 12.9%EPO /transfusion
62.6/13.7%
56.9/18%
RBV dose reduction* 10.7% 13%
*Hezode C, et al. AASLD 2012, Boston, #51
Characteristic BOC (n=190) TVR (n=295)Male, % 133 (70) 201 (68)Mean age, years (range)Mean BMI, SD (kg/m2)
57 (34–79)26 (18.1–39.4)
57 (27–83)27 (18.2–40.4)
HCV G1 subtype, n (%)1a1bOther
77 (41)96 (51)16 (8)
98 (33)162 (55)33 (11)
HCV RNA ≥800,000 IU/mL, n (%) 122 (64) 182 (62)Treatment history, n (%)
Prior relapsePrior partial responsePrior null responseOthers
85 (45)80 (42)9 (5)16 (8)
116 (39)135 (46)28 (10)15 (5)
Child–Pugh score A/B, n (%) 177 (93)/1 (1) 280 (95)/6 (2)MELD score, mean (range) 8.1 (6–28) 8.1 (6–22)Prothrombin time ratio, mean % (range)
87 (23–100) 86 (27–100)
Serum albumin g/L, mean (range) 40.7 (27.0–50.3) 40.0 (20.7–53.2)Total bilirubin µmol/L, mean (range) 15.2 (4.0–78.0) 15.5 (4.0–73.0)Hb level g/dL, mean (range) 14.8 (10.8–18.4) 14.5 (9.0–19.7)Neutrophils, mean (range) (109/mm3)
3.2 (0.5–8.5) 3.3 (0.8–8.5)
Platelet count, mean (range) (103/mm3)
144 (34–346) 151 (18–604)
Esophageal varices, n (%) 37/97 (38.1) 51/145 (35.2)
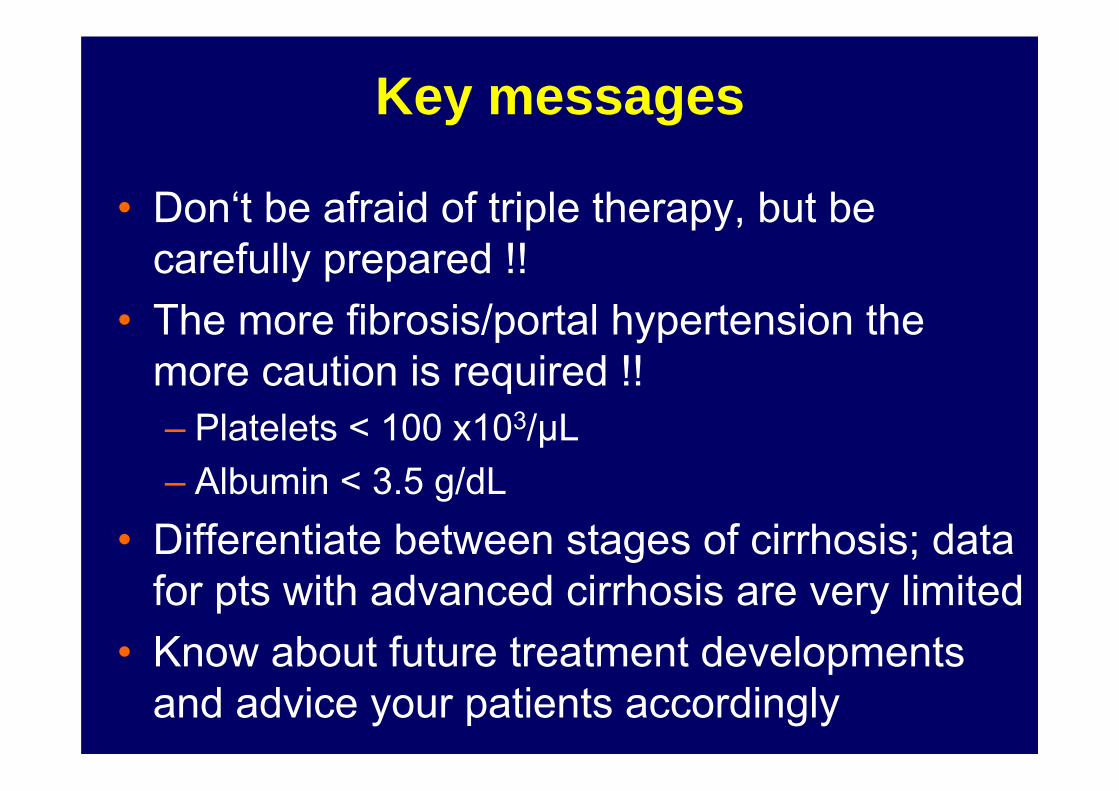
Key messages
• Don‘t be afraid of triple therapy, but be carefully prepared !!
• The more fibrosis/portal hypertension the more caution is required !!– Platelets < 100 x103/μL– Albumin < 3.5 g/dL
• Differentiate between stages of cirrhosis; data for pts with advanced cirrhosis are very limited
• Know about future treatment developments and advice your patients accordingly