Embed Size (px)
Citation preview
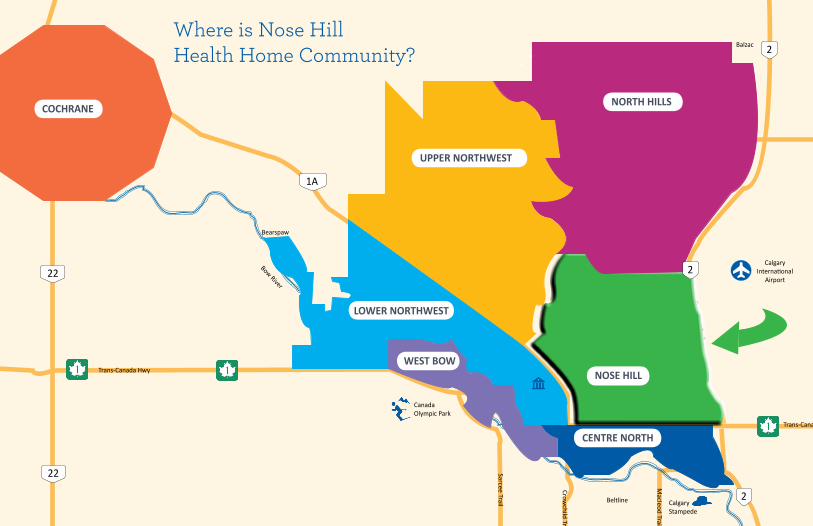
Nose Hill Health Home Community
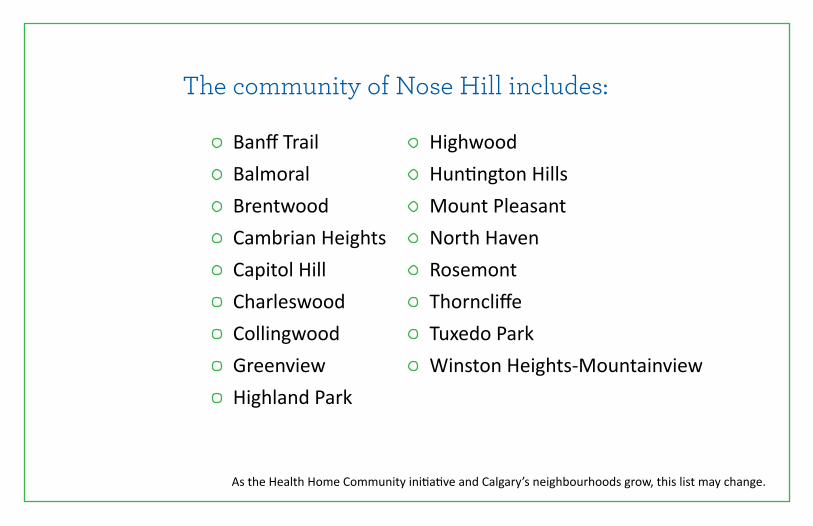
The community of Nose Hill includes:
Banff TrailBalmoral BrentwoodCambrian HeightsCapitol HillCharleswoodCollingwoodGreenviewHighland Park
HighwoodHuntington HillsMount PleasantNorth HavenRosemontThorncliffeTuxedo ParkWinston Heights-Mountainview
As the Health Home Community initiative and Calgary’s neighbourhoods grow, this list may change.
Calgary Zoo
University of Calgary
201
2
2
201
201
1A
1A
22
22
Trans-Canada Hwy
Trans-Canada Hwy
Ston
y Tr
ail
Ston
y Tr
ail
Sarcee Trail
Crowchild Trail
Macleod Trail
Deerfoot Trail
Nose Hill Park
Shag
anap
pi
Trail
Sto
ny Trail
Stony Trail
Crowchild Trail
Bow River
Calgary Internati onal
Airport
Beltline
Bearspaw
Balzac
Tuscany
Rocky Ridge
Edgemont
Varsity
Bowness
Hunti ngton Hills
Thorncliff e
Panorama Hills
Coventry Hills
EvanstonSage Hill
Symons Valley
Arbour Lake
CrescentHeights
NOSE HILL
CENTRE NORTH
LOWER NORTHWEST
WEST BOW
COCHRANE
Canada Olympic Park
Calgary Stampede
2
UPPER NORTHWEST
NORTH HILLS
Where is Nose Hill Health Home Community?
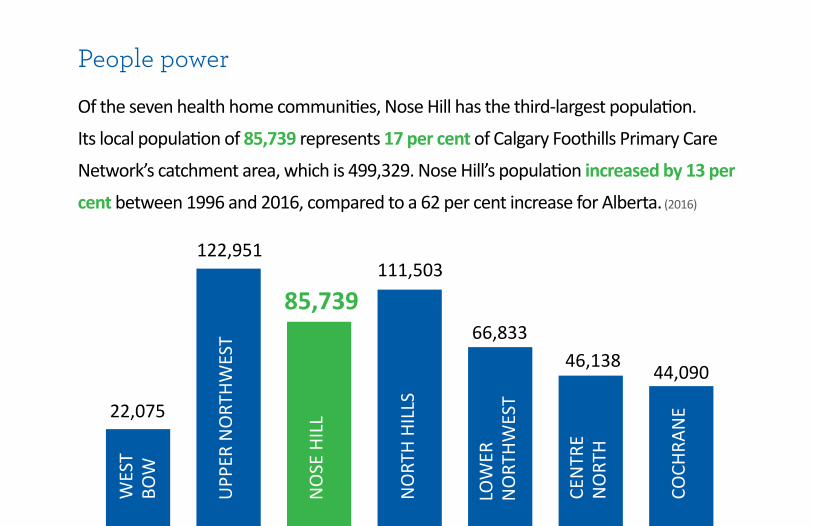
People power
Of the seven health home communities, Nose Hill has the third-largest population.
Its local population of 85,739 represents 17 per cent of Calgary Foothills Primary Care
Network’s catchment area, which is 499,329. Nose Hill’s population increased by 13 per
cent between 1996 and 2016, compared to a 62 per cent increase for Alberta. (2016)
111,503122,951
85,739
22,075
66,83346,138 44,090
NO
RTH
HILL
S
WES
T BO
W
UPP
ER N
ORT
HWES
T
NO
SE H
ILL
LOW
ER
NO
RTHW
EST
CEN
TRE
NO
RTH
COCH
RAN
E
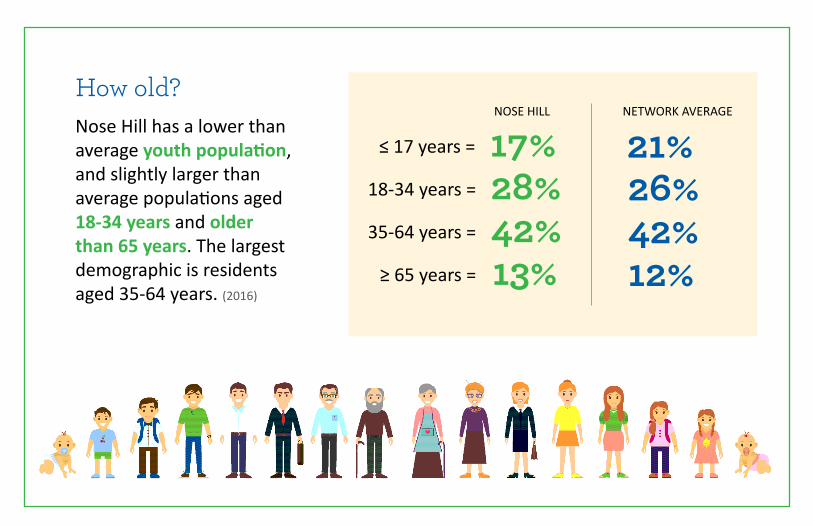
How old?Nose Hill has a lower than average youth population, and slightly larger than average populations aged 18-34 years and older than 65 years. The largest demographic is residents aged 35-64 years. (2016)
≤ 17 years = 17%18-34 years = 28%35-64 years = 42%
≥ 65 years = 13%
NOSE HILL NETWORK AVERAGE
21%26%42%12%
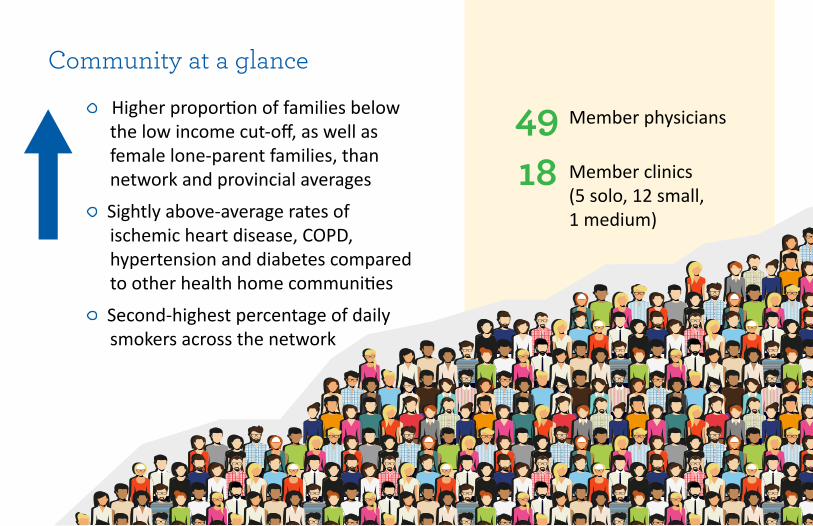
Member clinics (5 solo, 12 small,1 medium)
18
Community at a glance
Higher proportion of families below the low income cut-off, as well as female lone-parent families, than network and provincial averages
Sightly above-average rates of ischemic heart disease, COPD, hypertension and diabetes compared to other health home communities
Second-highest percentage of daily smokers across the network
Member physicians49
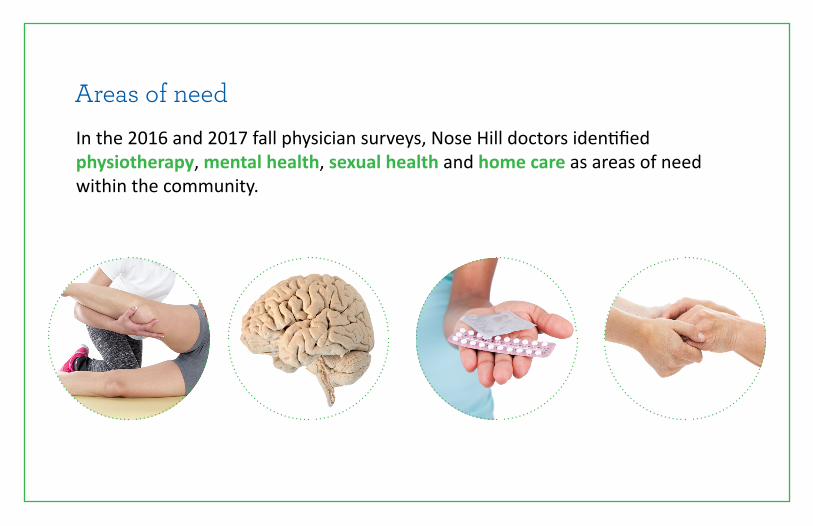
Areas of needIn the 2016 and 2017 fall physician surveys, Nose Hill doctors identified physiotherapy, mental health, sexual health and home care as areas of need within the community.
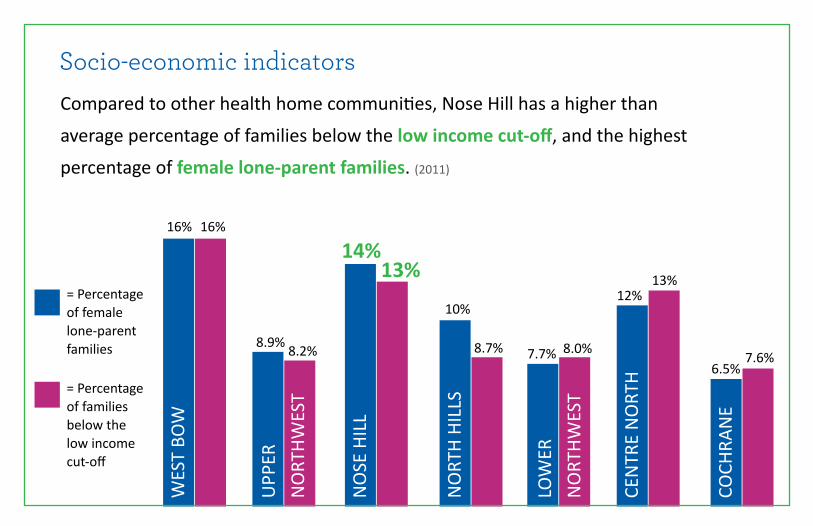
Socio-economic indicatorsCompared to other health home communities, Nose Hill has a higher than
average percentage of families below the low income cut-off, and the highest
percentage of female lone-parent families. (2011)
16%
WES
T BO
W
16%
UPP
ER
NO
RTHW
EST
8.9% 8.2%
14%
NO
SE H
ILL
13%
10%
NO
RTH
HILL
S
8.7%
UPP
ER N
ORT
HWES
TLO
WER
N
ORT
HWES
T
8.0%7.7%
12%
CEN
TRE
NO
RTH
13%
COCH
RAN
E
6.5%7.6%
= Percentage of female lone-parent families
= Percentage of families below the low income cut-off
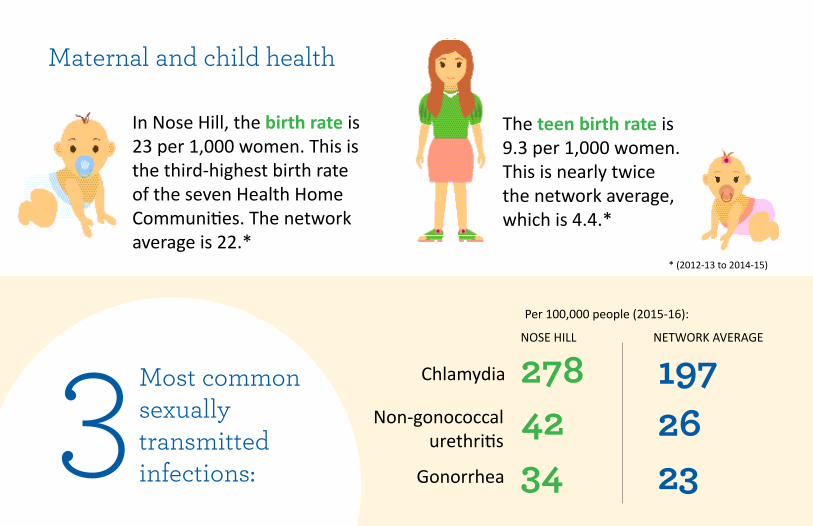
In Nose Hill, the birth rate is 23 per 1,000 women. This is the third-highest birth rate of the seven Health Home Communities. The network average is 22.*
The teen birth rate is 9.3 per 1,000 women. This is nearly twice the network average, which is 4.4.*
Chlamydia 278NOSE HILL NETWORK AVERAGE
197
34Gonorrhea 23
Non-gonococcal urethritis 42 26
Most common sexually transmitted infections:3
Maternal and child health
Per 100,000 people (2015-16):
* (2012-13 to 2014-15)
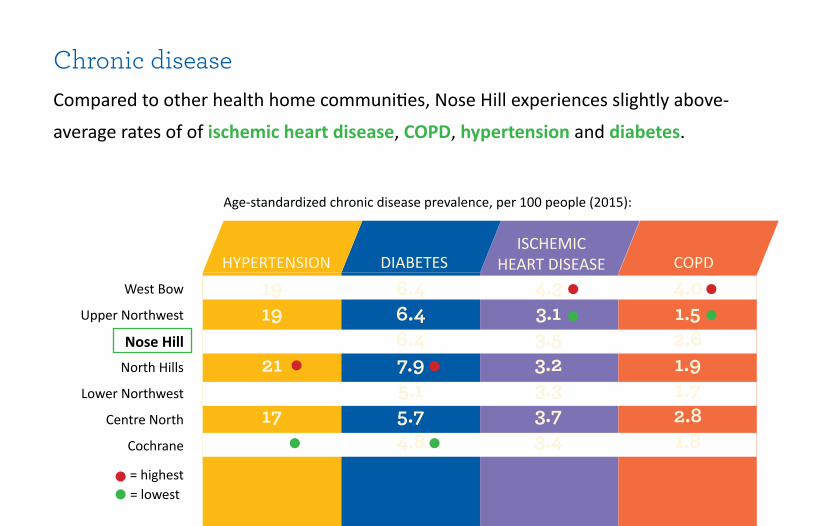
Chronic disease
Age-standardized chronic disease prevalence, per 100 people (2015):
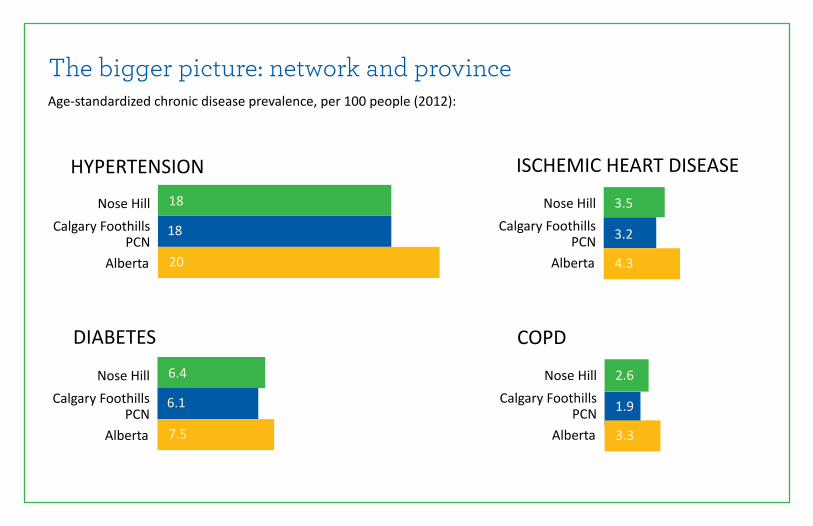
Compared to other health home communities, Nose Hill experiences slightly above-
average rates of of ischemic heart disease, COPD, hypertension and diabetes.
DIABETES COPDHYPERTENSIONISCHEMIC
HEART DISEASEWest Bow
Upper Northwest
Nose HillNorth Hills
Lower Northwest
Centre North
Cochrane
19191821171716
6.46.46.47.95.15.74.8
4.33.13.53.23.33.73.4
4.01.52.61.91.72.81.8
= highest= lowest
18
20
HYPERTENSION18
Calgary Foothills PCN 3.2
4.3
ISCHEMIC HEART DISEASE
Nose Hill
Alberta
3.5Calgary Foothills
PCN
Nose Hill
Alberta
Calgary Foothills PCN 1.9
3.3
COPD
Nose Hill
Alberta
2.6
DIABETES
6.1
7.5
6.4
Calgary Foothills PCN
Nose Hill
Alberta
The bigger picture: network and provinceAge-standardized chronic disease prevalence, per 100 people (2012):

Population heath indicatorsNose Hill has the second-highest percentage of daily smokers of all the health home communities. Sixty-two per cent of residents are active or moderately active, which is higher than the provincial average.
DAILY SMOKERS PHYSICAL ACTIVITY
West Bow 21%
Centre NorthNose Hill 13%
11%
Per cent of population (2014)
CochraneLower Northwest
North HillsUpper Northwest
8% 8% 8% 6%
Calgary Foothills PCNCalgary zone
Alberta
9%12%15%
Cochrane 73%
Lower NorthwestCentre North 67%
66%
Proportion of population active or moderately active (2014)
Nose HillWest Bow
North HillsUpper Northwest
62% 62% 61% 60%
Calgary Foothills PCNCalgary zone
Alberta 58%61%63%
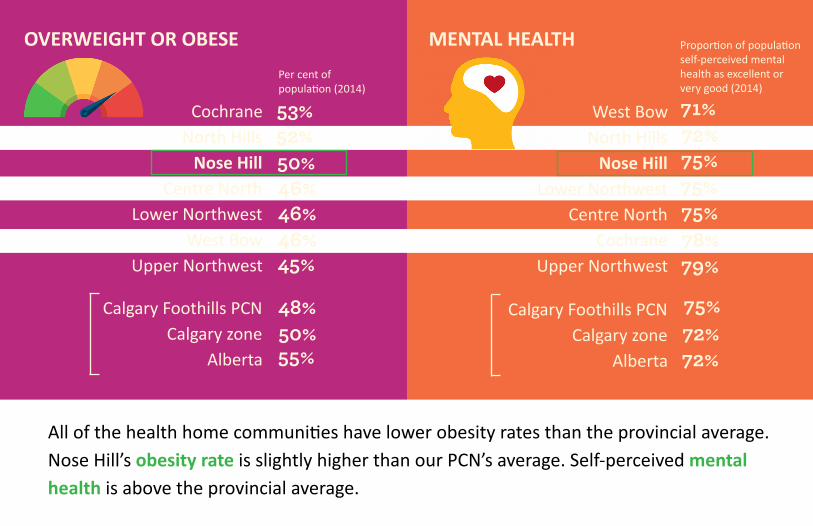
MENTAL HEALTH Proportion of population self-perceived mental health as excellent or very good (2014)
Calgary Foothills PCNCalgary zone
Alberta 72%
OVERWEIGHT OR OBESE
Cochrane 53%
Nose HillNorth Hills 52%
50%
Per cent of population (2014)
Centre NorthLower Northwest
West BowUpper Northwest
46% 46% 46% 45%
Calgary Foothills PCNCalgary zone
Alberta
48%50%55%
All of the health home communities have lower obesity rates than the provincial average. Nose Hill’s obesity rate is slightly higher than our PCN’s average. Self-perceived mental health is above the provincial average.
North Hills
Upper Northwest
75%
West Bow
Nose Hill
Centre NorthLower Northwest
Cochrane
71%72%75%75%
78% 79%
72%75%
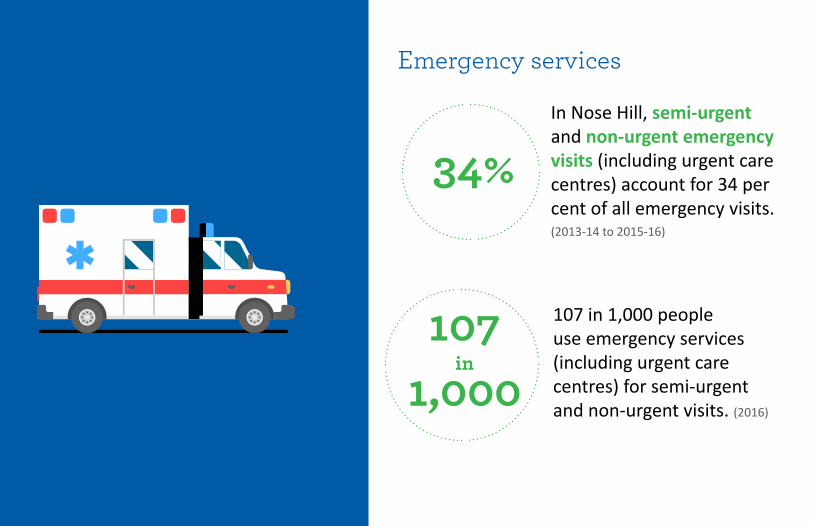
In Nose Hill, semi-urgent and non-urgent emergency visits (including urgent care centres) account for 34 per cent of all emergency visits. (2013-14 to 2015-16)
34%
107 in 1,000 people use emergency services (including urgent care centres) for semi-urgent and non-urgent visits. (2016)
107 in
1,000
Emergency services
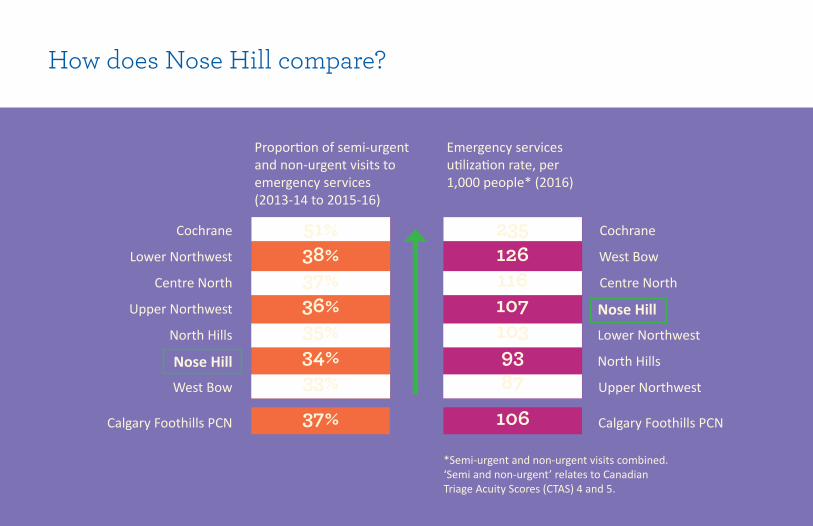
How does Nose Hill compare?
Proportion of semi-urgent and non-urgent visits to emergency services (2013-14 to 2015-16)
Cochrane
Lower Northwest
Centre North
Upper Northwest
North Hills
Nose HillWest Bow
Emergency services utilization rate, per 1,000 people* (2016)
Calgary Foothills PCN 10637%
*Semi-urgent and non-urgent visits combined. ‘Semi and non-urgent’ relates to Canadian Triage Acuity Scores (CTAS) 4 and 5.
Cochrane
West Bow
Centre North
Nose HillLower Northwest
North Hills
Upper Northwest
Calgary Foothills PCN
2351261161071039387
51%38%37%36%35%34%33%
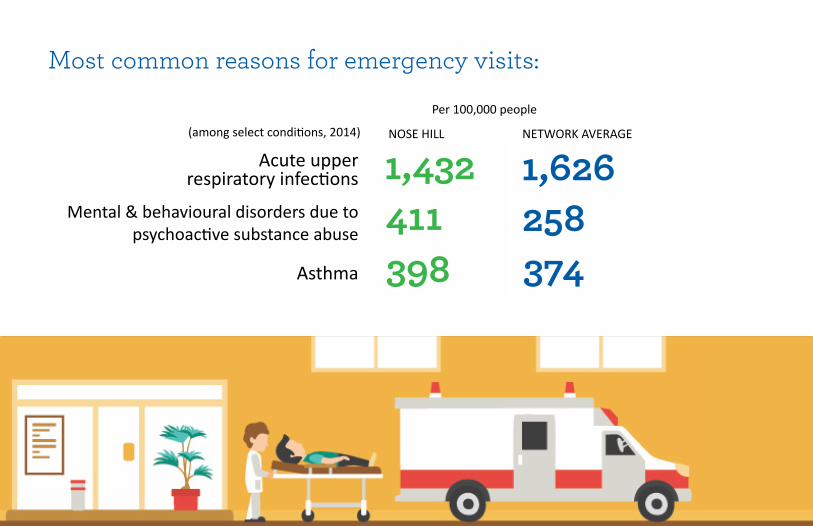
Most common reasons for emergency visits:
Acute upper respiratory infections 1,432
Asthma
411Mental & behavioural disorders due to psychoactive substance abuse
398
NOSE HILL NETWORK AVERAGE
1,626258374
Per 100,000 people:
(among select conditions, 2014)

Within the Calgary Foothills PCN catchment area, the rate at which patients access emergency services for reasons related to diabetes is less than half the provincial average. (2014)Did you
know? 250 in 100,000ALBERTA CALGARY FOOTHILLS PCN
112 in 100,000
162 156
123
88
179
94N
ORT
H HI
LLS
WES
T BO
W
UPP
ER
NW NO
SE H
ILL
LOW
ER
NW CEN
TRE
NO
RTH
COCH
RAN
E 87
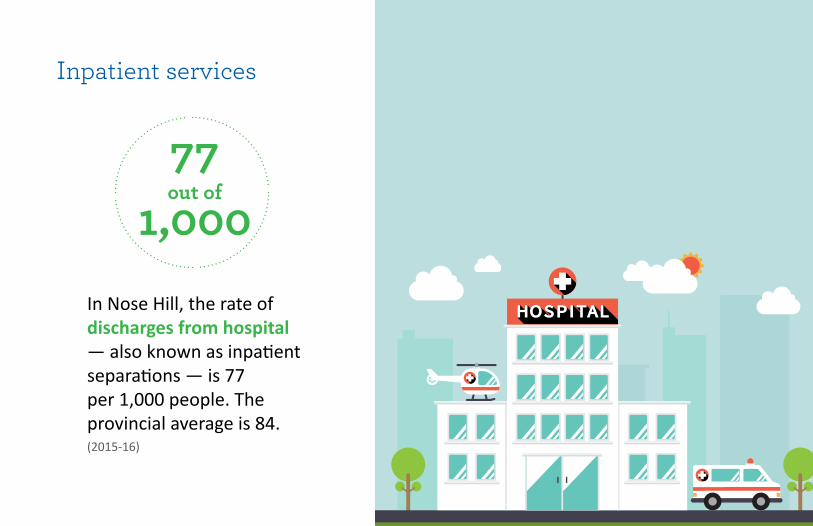
Inpatient services
In Nose Hill, the rate of discharges from hospital — also known as inpatient separations — is 77 per 1,000 people. The provincial average is 84. (2015-16)
77 out of
1,000

Within the Calgary Foothills PCN catchment area, the discharge rate from hospital for reasons related to diabetes is less than half the provincial average. (2015-16)Did you
know? 96 in 100,000ALBERTA CALGARY FOOTHILLS PCN
46 in 100,000
84
70
50
31
78
32N
ORT
H HI
LLS
WES
T BO
W
UPP
ER
NW
NO
SE H
ILL
LOW
ER
NW CEN
TRE
NO
RTH
COCH
RAN
E
34

The community statistics in this report were compiled from the following sources:
Data sources
Alberta Health, Primary Care Division (2017). Community Profiles, Health Data and Summary. Government of AlbertaGovernment of Alberta Interactive Health Data ApplicationCalgary Foothills PCN Physician Survey (Fall 2016 & 2017)
Would you like to get involved in your health home community?
Talk to your liaison or email [email protected]