Embed Size (px)
Citation preview
Department of Health and Human Services Office of the Assistant Secretary for Planning and Evaluation
http://aspe.hhs.gov
ASPE ISSUE BRIEF
Health Insurance Coverage for Americans with
Pre-Existing Conditions:
The Impact of the Affordable Care Act
January 5, 2017
The Affordable Care Act (ACA) put in place a range of nationwide protections for Americans
with pre-existing health conditions. Under the ACA, insurance companies cannot deny coverage
or charge higher premiums based on a person’s medical history or health status. In addition,
policies cannot exclude coverage for treating a pre-existing condition, must include limits on out-
of-pocket spending, cannot include limits on annual or lifetime coverage, and, in the case of most
individual and small group market policies, must cover essential health benefits.
In 2011, prior to the implementation of the ACA’s major health insurance reforms in 2014,
ASPE examined the impact of the ACA’s pre-existing conditions protections.1 The 2011 analysis
found that between 50 and 129 million non-elderly Americans had pre-existing health conditions
and would gain new protections under the ACA reforms.2
This analysis updates that earlier study. It confirms that a large fraction of non-elderly
Americans have pre-existing health conditions: at least 23 percent of Americans (61 million
people) using a narrow definition based on eligibility criteria for pre-ACA state high-risk pools,
or as many as 51 percent (133 million people) using a broader definition closer to the
underwriting criteria used by insurers prior to the ACA. Any of these 133 million Americans
could have been denied coverage, or offered coverage only at an exorbitant price, had they
needed individual market health insurance before 2014. This analysis also offers a first look at
how health insurance coverage for people with pre-existing conditions actually changed when
the ACA’s major insurance market reforms took effect in 2014. It finds that, between 2010 and
2014, the share of Americans with pre-existing conditions who went without health insurance all
year fell by 22 percent, a drop of 3.6 million people. The ACA’s individual market reforms
appear to have played a key role in these gains.
1 Department of Health and Human Services, Office of the Assistant Secretary for Planning and Evaluation, At Risk:
Pre-Existing Conditions Could Affect 1 in 2 Americans. January 2011, available at
https://aspe.hhs.gov/sites/default/files/pdf/76376/index.pdf. 2 Non-elderly are defined as individuals age 0 to 64 who did not have Medicare coverage in any month.
ASPE Issue Brief Page 2
ASPE Office of Health Policy January 5, 2017
After dropping by about a quarter between 2010 and 2014, the uninsured rate for all non-elderly
Americans has fallen an additional 22 percent through the first half of 2016.3 While data for
Americans with pre-existing conditions are available only through 2014, it is likely that this
group has also seen continued gains in access to coverage and care over the past two years.
How the ACA Reformed Coverage for People with Pre-Existing Conditions
A pre-existing condition is a health condition that predates a person applying for or enrolling in a
new health insurance policy. Before the ACA, insurers generally defined what types of
conditions could constitute a pre-existing condition. Their definitions frequently encompassed
both serious conditions, such as cancer or heart disease, and less severe and more common
conditions, such as asthma, depression, or high blood pressure.
Before the ACA, individual insurers in the vast majority of states could collect information on
demographic characteristics and medical history, and then deny coverage, charge higher
premiums, and/or limit benefits to individuals based on pre-existing conditions. An industry
survey found that 34 percent of individual market applicants were charged higher-than-standard
rates based on demographic characteristics or medical history.4 Similarly, a 2009 survey found
3 Emily P. Zammitti, Robin A. Cohen, and Michael E. Martinez, Health Insurance Coverage: Early Release of
Estimates from the National Health Insurance Survey, January-June 2016, p. A1. National Center for Health
Statistics, November 2016, available at https://www.cdc.gov/nchs/data/nhis/earlyrelease/insur201611.pdf. 4 AHIP Center for Policy Research (AHIP), Individual Health Insurance 2009: A Comprehensive Survey of
Premiums, Availability, and Benefits, October 2009.
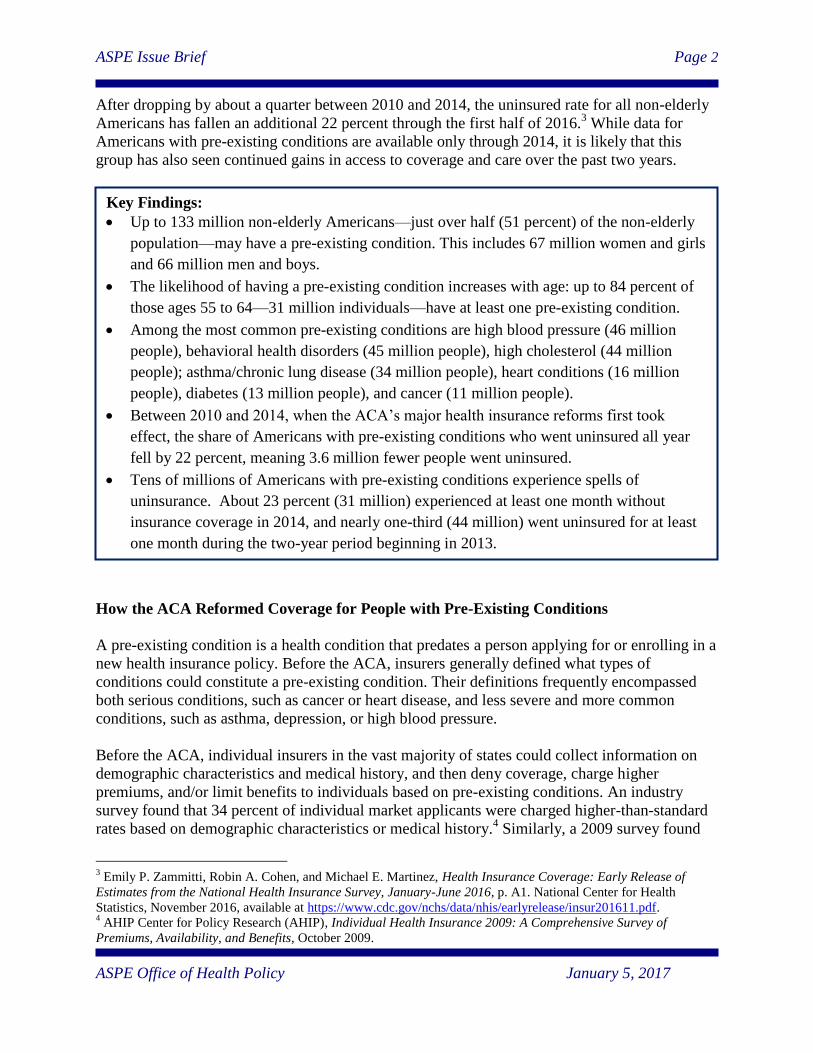
Key Findings:
Up to 133 million non-elderly Americans—just over half (51 percent) of the non-elderly
population—may have a pre-existing condition. This includes 67 million women and girls
and 66 million men and boys.
The likelihood of having a pre-existing condition increases with age: up to 84 percent of
those ages 55 to 64—31 million individuals—have at least one pre-existing condition.
Among the most common pre-existing conditions are high blood pressure (46 million
people), behavioral health disorders (45 million people), high cholesterol (44 million
people); asthma/chronic lung disease (34 million people), heart conditions (16 million
people), diabetes (13 million people), and cancer (11 million people).
Between 2010 and 2014, when the ACA’s major health insurance reforms first took
effect, the share of Americans with pre-existing conditions who went uninsured all year
fell by 22 percent, meaning 3.6 million fewer people went uninsured.
Tens of millions of Americans with pre-existing conditions experience spells of
uninsurance. About 23 percent (31 million) experienced at least one month without
insurance coverage in 2014, and nearly one-third (44 million) went uninsured for at least
one month during the two-year period beginning in 2013.
ASPE Issue Brief Page 3
ASPE Office of Health Policy January 5, 2017
that, among adults who had individual market coverage or shopped for it in the previous three
years, 36 percent were denied coverage, charged more, or had exclusions placed on their policy
due to pre-existing conditions.5 A report by the Government Accountability Office estimated
that, as of early 2010, the denial rate among individual market applications was 19 percent, and
the most common reason for denial was health status.6
While some states attempted to offer some protection to people with pre-existing conditions,
these efforts were generally not effective at ensuring access to affordable coverage.7 For
example:
Some states required that coverage be offered to people with pre-existing conditions, but
imposed no restrictions on how much insurers could increase premiums based on health
status.
Some states required that coverage be offered to people with pre-existing conditions, but
allowed insurers to exclude treatment for the pre-existing condition. Thus, a cancer
survivor could have obtained coverage, but that coverage would not have paid for
treatment if the cancer re-emerged.
Some states required that coverage be offered to people with pre-existing conditions, but
only to those who met continuity of coverage requirements. In practice, a high fraction of
people with pre-existing conditions go uninsured for at least short spells due to job
changes, other life transitions, or periods of financial difficulty. About 23 percent of
percent of Americans with pre-existing conditions (31 million people) experienced at
least one month without insurance coverage in 2014. In the two-year period beginning in
2013, nearly one-third (44 million) of individuals with pre-existing conditions went
uninsured for at least one month. About 93 percent of those who were ever uninsured
went without coverage for a spell of two months or more, and about 87 percent went
without coverage for a spell of three months or more.8
5 Michelle M. Doty, Sara R. Collins, Jennifer L. Nicholson, and Sheila D. Rustgi, Failure to Protect: Why the
Individual Insurance Market is not a Viable Option for Most US Families, The Commonwealth Fund, July 2009,
available at
http://www.commonwealthfund.org/~/media/Files/Publications/Issue%20Brief/2009/Jul/Failure%20to%20Protect/1
300_Doty_failure_to_protect_individual_ins_market_ib_v2.pdf. 6 U.S. Government Accountability Office, Private Health Insurance: Data on Applications and Coverage Denials,
Report to the Secretary of Health and Human Services and the Secretary of Labor, March 16, 2011, available at
http://www.gao.gov/assets/320/316699.pdf. 7 For a comparison of states’ pre-ACA rules, see National Conference of State Legislatures, “Individual Health
Insurance and States: Chronologies of Care,” Updated August 2015, http://www.ncsl.org/research/health/individual-
health-insurance-in-the-states.aspx. 8 HHS analysis of 2013 and 2014 MEPS.
ASPE Issue Brief Page 4
ASPE Office of Health Policy January 5, 2017
A few states sought to require that people with pre-existing conditions be offered
coverage at the same price as other Americans. But without accompanying measures to
ensure that healthy residents also continued to buy insurance, these states saw escalating
premiums that made health insurance unaffordable for sick and healthy residents alike.9
In contrast, the ACA implemented a nationwide set of reforms in the individual health insurance
market. The law requires individual market insurers to offer comprehensive coverage to all
enrollees, on common terms, regardless of medical history. Meanwhile, the ACA also includes
measures to ensure a balanced risk pool that keeps coverage affordable. To directly improve
affordability while encouraging individuals to buy coverage, the ACA offers financial assistance
for eligible taxpayers with household incomes up to 400 percent of the federal poverty level to
reduce their monthly premium payments.10
The law also includes an individual shared
responsibility provision that requires people who can afford coverage to make a payment if they
instead elect to go without it.11
Prevalence of Pre-Existing Conditions
Estimating the Number of Americans with Pre-Existing Conditions
This analysis updates earlier ASPE estimates of the number of non-elderly Americans potentially
benefitting from the ACA’s pre-existing conditions protections. As in the earlier study, we
consider two definitions of pre-existing conditions. The narrower measure includes only
conditions identified using eligibility guidelines from state-run high-risk pools that pre-dated the
ACA. These programs were generally intended to cover individuals who would be outright
rejected for coverage by private insurers. The broader measure includes additional common
health conditions (for example, arthritis, asthma, high cholesterol, hypertension, and obesity) and
behavioral health disorders (including alcohol and substance use disorders, depression, and
Alzheimer’s) that could have resulted in denial of coverage, exclusion of the condition, or higher
premiums for individuals seeking individual market coverage before the ACA protections
applied.12
9 Former insurance commissioners in Rhode Island and Washington described the problems created by partial
reforms in their states. See, for example, Christopher Koller, “Why Republican Health Insurance Reform Ideas Are
Likely to Fail,” Politico, December 7, 2016, http://www.politico.com/agenda/story/2016/12/republican-health-
reform-ideas-obamacare-unlikely-work-000252, and Harris Meyer, “What It Will Take to Stop Insurers From
Fleeing After ACA Repeal,” Modern Health Care, December 5, 2016,
http://www.modernhealthcare.com/article/20161205/NEWS/161209962. The exception was Massachusetts, which
enacted its own version of the ACA’s insurance market reforms, subsidies, and individual responsibility provision in
2006. 10
Office of the Assistant Secretary for Planning and Evaluation, Health Plan Choice and Premiums
in the 2017 Health Insurance Marketplace, October 24, 2016, available at
https://aspe.hhs.gov/sites/default/files/pdf/212721/2017MarketplaceLandscapeBrief.pdf. 11
For an extended discussion of the ACA’s insurance market reforms, see
https://www.whitehouse.gov/sites/default/files/page/files/20161213_cea_record_healh_care_reform.pdf. 12
These conditions were selected based on underwriting guidelines identified using internet searches in the pre-
ACA period.
ASPE Issue Brief Page 5
ASPE Office of Health Policy January 5, 2017
We focus primarily on the broader measure, because individuals with any of these conditions
were at risk of higher premiums and/or coverage carve-outs, if not outright coverage denials if
they sought individual market health insurance before the ACA protections applied. The
narrower measure is similar to that used in a recent Kaiser Family Foundation (KFF) analysis,
which finds that 52 million non-elderly adults would have been “uninsurable” in the individual
market in most states before the ACA. The KFF study notes that its analysis does not attempt to
include “people with other health conditions that wouldn’t necessarily cause a denial, but could
lead to higher insurance costs based on underwriting.”13
Both our narrow and broad estimates are based on the 2014 Medical Expenditure Panel Survey
(MEPS), the most recent data available that provide both coverage and detailed health status
information. The appendix provides a more detailed description of our methodology and
supplemental tables.14
The Prevalence of Pre-Existing Conditions in 2014
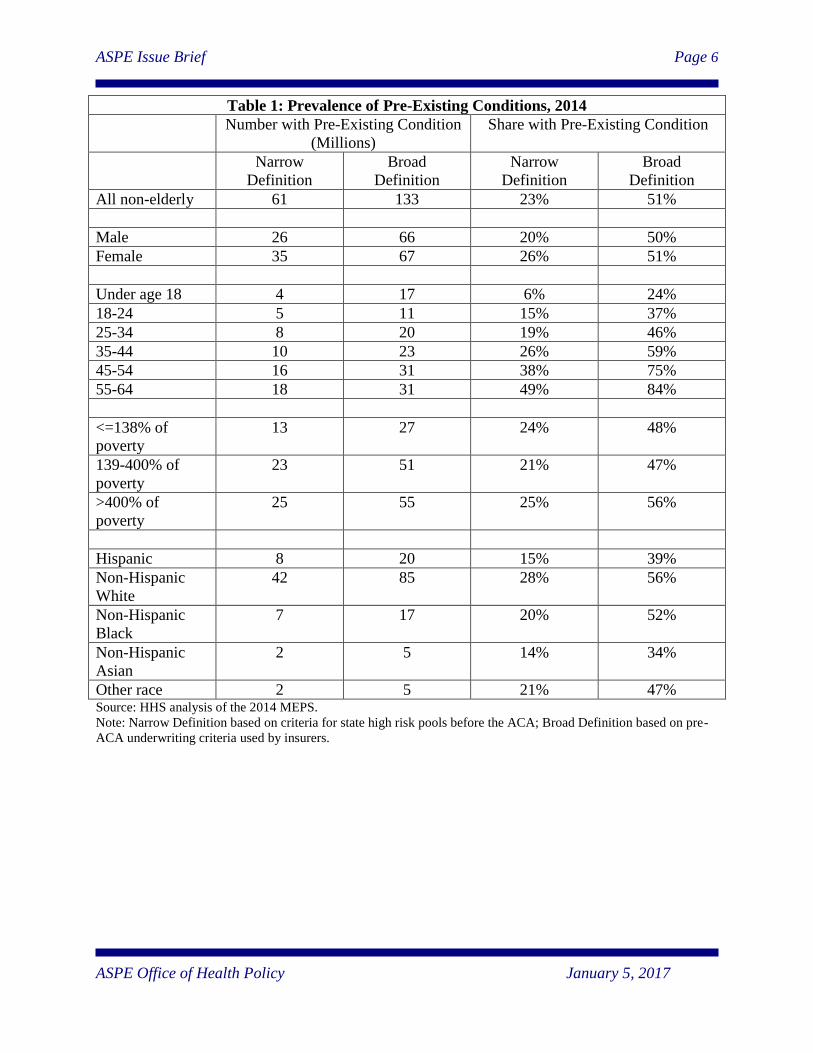
As shown in Table 1, we find that the ACA is protecting between 23 and 51 percent of non-
elderly Americans--61 to 133 million people--with some type of pre-existing health condition
from being denied coverage, charged significantly higher premiums, subjected to an extended
waiting period, or having their health insurance benefits curtailed should they need individual
market health insurance coverage.
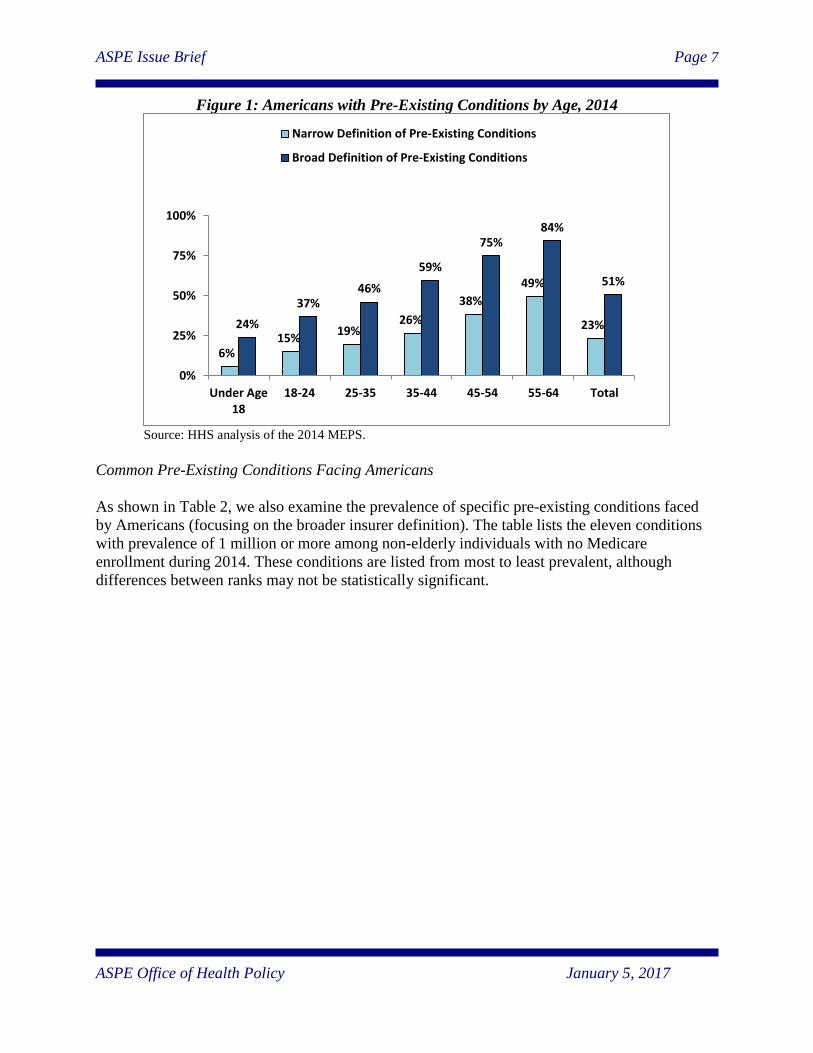
Certain groups are more likely than others to have pre-existing conditions. In particular, as
people age, their likelihood of having—or ever having had—a pre-existing health condition
increases steadily. Americans between ages 55 and 64 are particularly at risk: 49 to 84 percent of
people in this age range—up to 31 million people—have some type of pre-existing condition. By
comparison, 6 to 24 percent of Americans under the age of 18 have some type of pre-existing
condition (see Figure 1). Approximately 56 percent of Non-Hispanic whites and individuals with
family incomes above 400 percent of the federal poverty level have some type of pre-existing
condition.
13
The authors also note that their analysis excludes certain conditions that likely would have led to coverage denials,
including such as Hepatitis C and HIV/AIDS. See Gary Claxton, Cynthia Cox, Anthony Damico, Larry Levitt, and
Karen Pollitz, Pre-Existing Conditions and Medical Underwriting in the Individual Market Prior to the ACA, Kaiser
Family Foundation, December 2016 (available at http://files.kff.org/attachment/Issue-Brief-Pre-existing-Conditions-
and-Medical-Underwriting-in-the-Individual-Insurance-Market-Prior-to-the-ACA). 14
All estimates cover individuals age 0 to 64 who did not have Medicare coverage in any month. In addition to
describing our methodology, the Appendix explains technical changes that account for the substantial revision to our
lower-bound estimate from the 2011 brief.
ASPE Issue Brief Page 6
ASPE Office of Health Policy January 5, 2017
Table 1: Prevalence of Pre-Existing Conditions, 2014
Number with Pre-Existing Condition
(Millions)
Share with Pre-Existing Condition
Narrow
Definition
Broad
Definition
Narrow
Definition
Broad
Definition
All non-elderly 61 133 23% 51%
Male 26 66 20% 50%
Female 35 67 26% 51%
Under age 18 4 17 6% 24%
18-24 5 11 15% 37%
25-34 8 20 19% 46%
35-44 10 23 26% 59%
45-54 16 31 38% 75%
55-64 18 31 49% 84%
<=138% of
poverty
13 27 24% 48%
139-400% of
poverty
23 51 21% 47%
>400% of
poverty
25 55 25% 56%
Hispanic 8 20 15% 39%
Non-Hispanic
White
42 85 28% 56%
Non-Hispanic
Black
7 17 20% 52%
Non-Hispanic
Asian
2 5 14% 34%
Other race 2 5 21% 47% Source: HHS analysis of the 2014 MEPS.
Note: Narrow Definition based on criteria for state high risk pools before the ACA; Broad Definition based on pre-
ACA underwriting criteria used by insurers.
ASPE Issue Brief Page 7
ASPE Office of Health Policy January 5, 2017
Figure 1: Americans with Pre-Existing Conditions by Age, 2014
Source: HHS analysis of the 2014 MEPS.
Common Pre-Existing Conditions Facing Americans
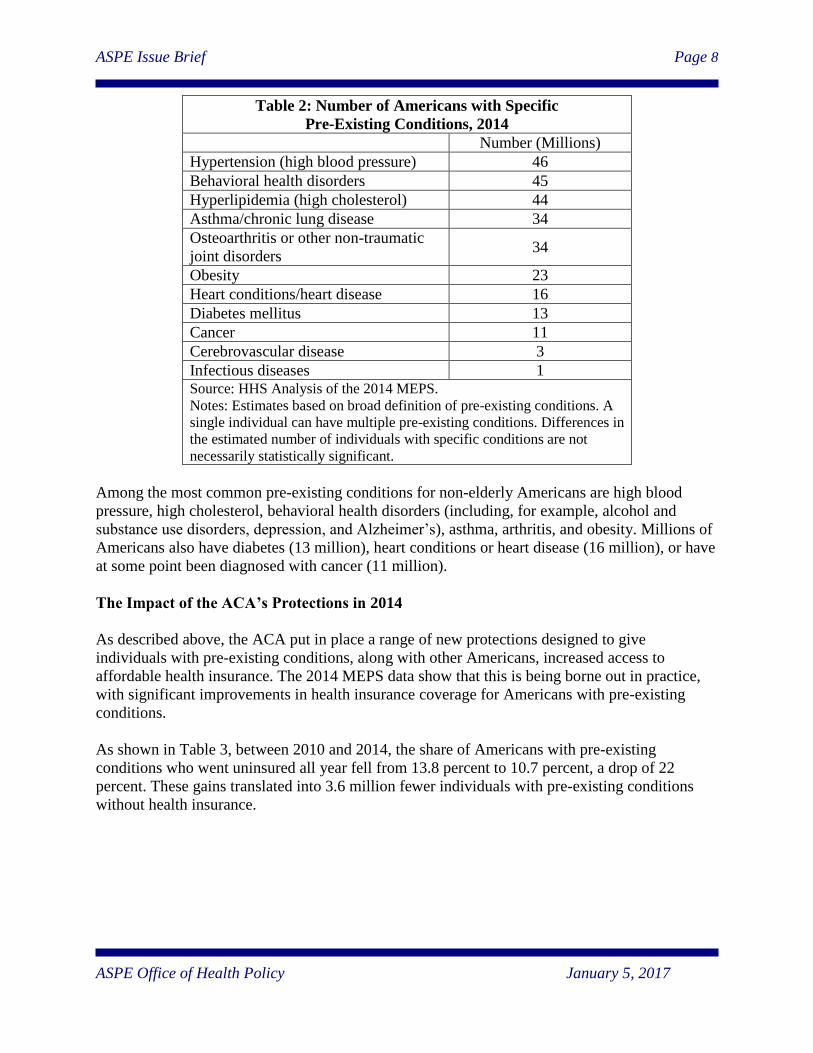
As shown in Table 2, we also examine the prevalence of specific pre-existing conditions faced
by Americans (focusing on the broader insurer definition). The table lists the eleven conditions
with prevalence of 1 million or more among non-elderly individuals with no Medicare
enrollment during 2014. These conditions are listed from most to least prevalent, although
differences between ranks may not be statistically significant.
6% 15%
19% 26%
38%
49%
23% 24%
37% 46%
59%
75% 84%
51%
0%
25%
50%
75%
100%
Under Age18
18-24 25-35 35-44 45-54 55-64 Total
Narrow Definition of Pre-Existing Conditions
Broad Definition of Pre-Existing Conditions
ASPE Issue Brief Page 8
ASPE Office of Health Policy January 5, 2017
Table 2: Number of Americans with Specific
Pre-Existing Conditions, 2014
Number (Millions)
Hypertension (high blood pressure) 46
Behavioral health disorders 45
Hyperlipidemia (high cholesterol) 44
Asthma/chronic lung disease 34
Osteoarthritis or other non-traumatic
joint disorders 34
Obesity 23
Heart conditions/heart disease 16
Diabetes mellitus 13
Cancer 11
Cerebrovascular disease 3
Infectious diseases 1 Source: HHS Analysis of the 2014 MEPS.
Notes: Estimates based on broad definition of pre-existing conditions. A
single individual can have multiple pre-existing conditions. Differences in
the estimated number of individuals with specific conditions are not
necessarily statistically significant.
Among the most common pre-existing conditions for non-elderly Americans are high blood
pressure, high cholesterol, behavioral health disorders (including, for example, alcohol and
substance use disorders, depression, and Alzheimer’s), asthma, arthritis, and obesity. Millions of
Americans also have diabetes (13 million), heart conditions or heart disease (16 million), or have
at some point been diagnosed with cancer (11 million).
The Impact of the ACA’s Protections in 2014
As described above, the ACA put in place a range of new protections designed to give
individuals with pre-existing conditions, along with other Americans, increased access to
affordable health insurance. The 2014 MEPS data show that this is being borne out in practice,
with significant improvements in health insurance coverage for Americans with pre-existing
conditions.
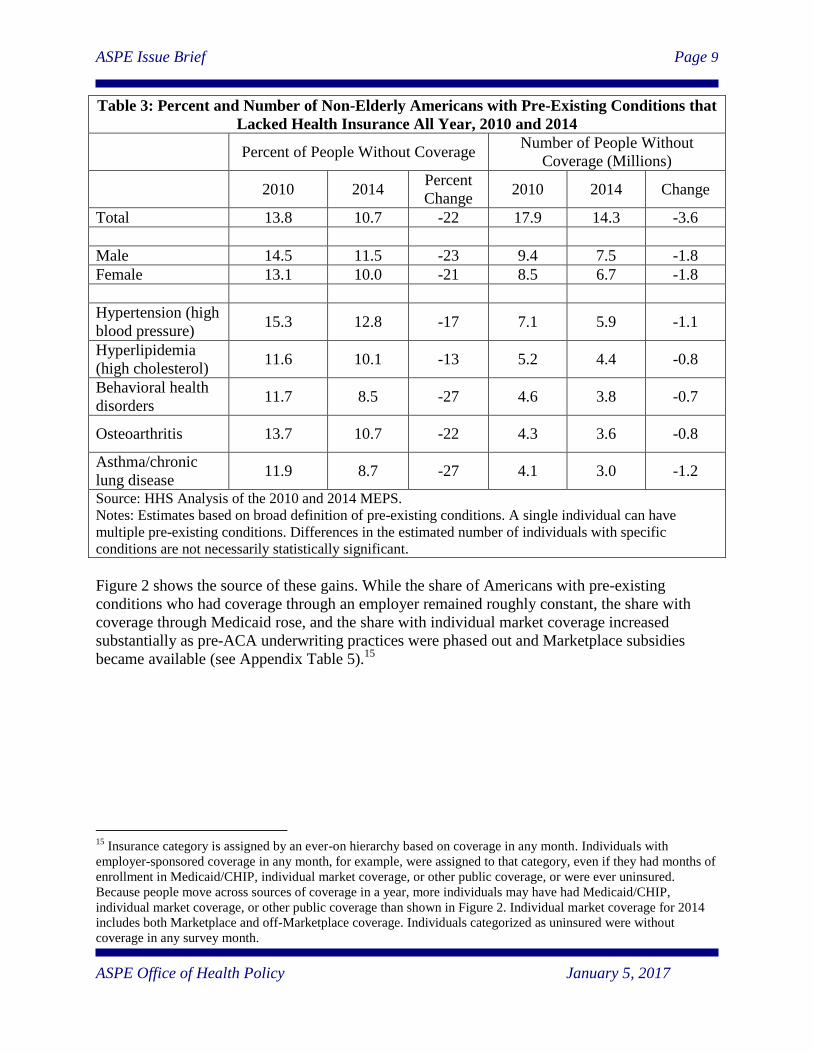
As shown in Table 3, between 2010 and 2014, the share of Americans with pre-existing
conditions who went uninsured all year fell from 13.8 percent to 10.7 percent, a drop of 22
percent. These gains translated into 3.6 million fewer individuals with pre-existing conditions
without health insurance.
ASPE Issue Brief Page 9
ASPE Office of Health Policy January 5, 2017
Table 3: Percent and Number of Non-Elderly Americans with Pre-Existing Conditions that
Lacked Health Insurance All Year, 2010 and 2014
Percent of People Without Coverage
Number of People Without
Coverage (Millions)
2010 2014 Percent
Change 2010 2014 Change
Total 13.8 10.7 -22 17.9 14.3 -3.6
Male 14.5 11.5 -23 9.4 7.5 -1.8
Female 13.1 10.0 -21 8.5 6.7 -1.8
Hypertension (high
blood pressure) 15.3 12.8 -17 7.1 5.9 -1.1
Hyperlipidemia
(high cholesterol) 11.6 10.1 -13 5.2 4.4 -0.8
Behavioral health
disorders 11.7 8.5 -27 4.6 3.8 -0.7
Osteoarthritis 13.7 10.7 -22 4.3 3.6 -0.8
Asthma/chronic
lung disease 11.9 8.7 -27 4.1 3.0 -1.2
Source: HHS Analysis of the 2010 and 2014 MEPS.
Notes: Estimates based on broad definition of pre-existing conditions. A single individual can have
multiple pre-existing conditions. Differences in the estimated number of individuals with specific
conditions are not necessarily statistically significant.
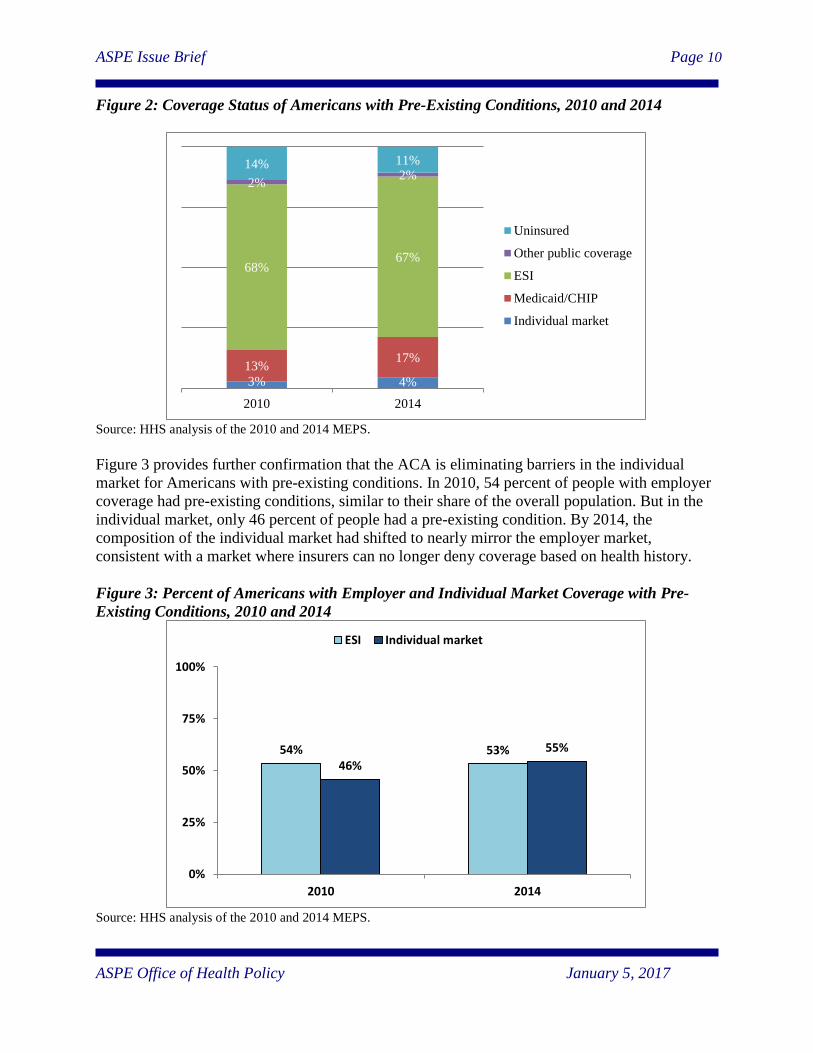
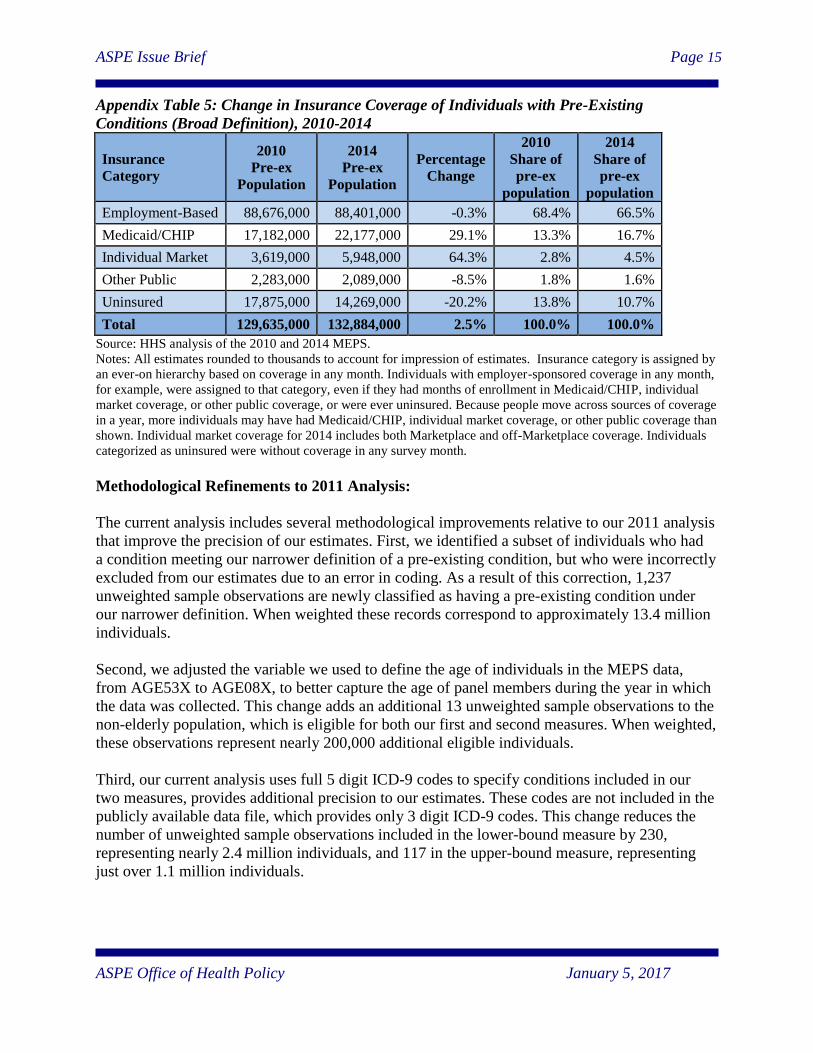
Figure 2 shows the source of these gains. While the share of Americans with pre-existing
conditions who had coverage through an employer remained roughly constant, the share with
coverage through Medicaid rose, and the share with individual market coverage increased
substantially as pre-ACA underwriting practices were phased out and Marketplace subsidies
became available (see Appendix Table 5).15
15
Insurance category is assigned by an ever-on hierarchy based on coverage in any month. Individuals with
employer-sponsored coverage in any month, for example, were assigned to that category, even if they had months of
enrollment in Medicaid/CHIP, individual market coverage, or other public coverage, or were ever uninsured.
Because people move across sources of coverage in a year, more individuals may have had Medicaid/CHIP,
individual market coverage, or other public coverage than shown in Figure 2. Individual market coverage for 2014
includes both Marketplace and off-Marketplace coverage. Individuals categorized as uninsured were without
coverage in any survey month.
ASPE Issue Brief Page 10
ASPE Office of Health Policy January 5, 2017
Figure 2: Coverage Status of Americans with Pre-Existing Conditions, 2010 and 2014
Source: HHS analysis of the 2010 and 2014 MEPS.
Figure 3 provides further confirmation that the ACA is eliminating barriers in the individual
market for Americans with pre-existing conditions. In 2010, 54 percent of people with employer
coverage had pre-existing conditions, similar to their share of the overall population. But in the
individual market, only 46 percent of people had a pre-existing condition. By 2014, the
composition of the individual market had shifted to nearly mirror the employer market,
consistent with a market where insurers can no longer deny coverage based on health history.
Figure 3: Percent of Americans with Employer and Individual Market Coverage with Pre-
Existing Conditions, 2010 and 2014
Source: HHS analysis of the 2010 and 2014 MEPS.
3% 4%
13% 17%
68% 67%
2% 2%
14% 11%
2010 2014
Uninsured
Other public coverage
ESI
Medicaid/CHIP
Individual market
54% 53% 46%
55%
0%
25%
50%
75%
100%
2010 2014
ESI Individual market
ASPE Issue Brief Page 11
ASPE Office of Health Policy January 5, 2017
Conclusion
With data available only through 2014, this analysis provides a preliminary picture of how the
ACA is helping individuals with pre-existing conditions. The uninsured rate for all Americans,
which fell by 27 percent between 2010 and 2014, fell another 22 percent between 2014 and
2016, and people with pre-existing conditions have likely seen similar additional progress.
Nonetheless, this initial snapshot confirms that the ACA’s insurance market reforms are
providing important protections to the up to half of Americans whose medical history previously
put them at risk of being denied access to affordable health care.
ASPE Issue Brief Page 12
ASPE Office of Health Policy January 5, 2017
APPENDIX: METHODOLOGY
We used the 2014 Medical Expenditure Panel Survey (MEPS) to identify individuals who would
likely been denied coverage due to a pre-existing condition if they were to apply for coverage in
the individual market without the protections provided by the Affordable Care Act. A multi-
pronged approach was used to identify conditions that would certainly or likely exclude
individuals from being offered coverage. A list of pre-existing conditions was generated from
two sources: eligibility guidelines from 19 pre-Affordable Care Act high-risk pools and
underwriting guidelines from seven major insurance carriers.16
The MEPS was used to identify
whether individuals had a medical visit for any of these conditions, experienced any disability
days (for the 2008 and 2010 data, as this information is no longer available in the 2014 data) as a
result of any of these conditions, or reported that they were bothered by any of these conditions
in the past year. Additional questions regarding whether individuals had ever been diagnosed
with a smaller set of conditions from these lists were used to further refine our measure.
Two estimates of the share of non-elderly individuals with pre-existing conditions are presented.
The first includes only conditions that were identified using eligibility guidelines from high-risk
pools; the second includes five additional common conditions (arthritis, asthma, high cholesterol,
hypertension, and obesity) and a number of common behavioral health conditions that would
have resulted in an automatic decline, exclusion of the condition, or higher premiums according
to the seven pre-Affordable Care Act insurer guidelines examined. The first estimate includes
conditions that would have been very likely to cause an applicant to be denied coverage, and
should be considered a lower bound estimate. The second estimate includes conditions that might
result in a denial of coverage, but also might have resulted in a rate-up (that is, a higher
premium) or a coverage rider (that is, a policy that excludes coverage for a pre-existing
condition).
Analyses of the prevalence of particular conditions employ the categories used in the Clinical
Classification Software (CCS) developed for the Healthcare Cost and Utilization Project
(HCUP). A crosswalk between ICD-9 and CCS categories is available at
https://meps.ahrq.gov/data_stats/download_data/pufs/h170/h170app3.html.
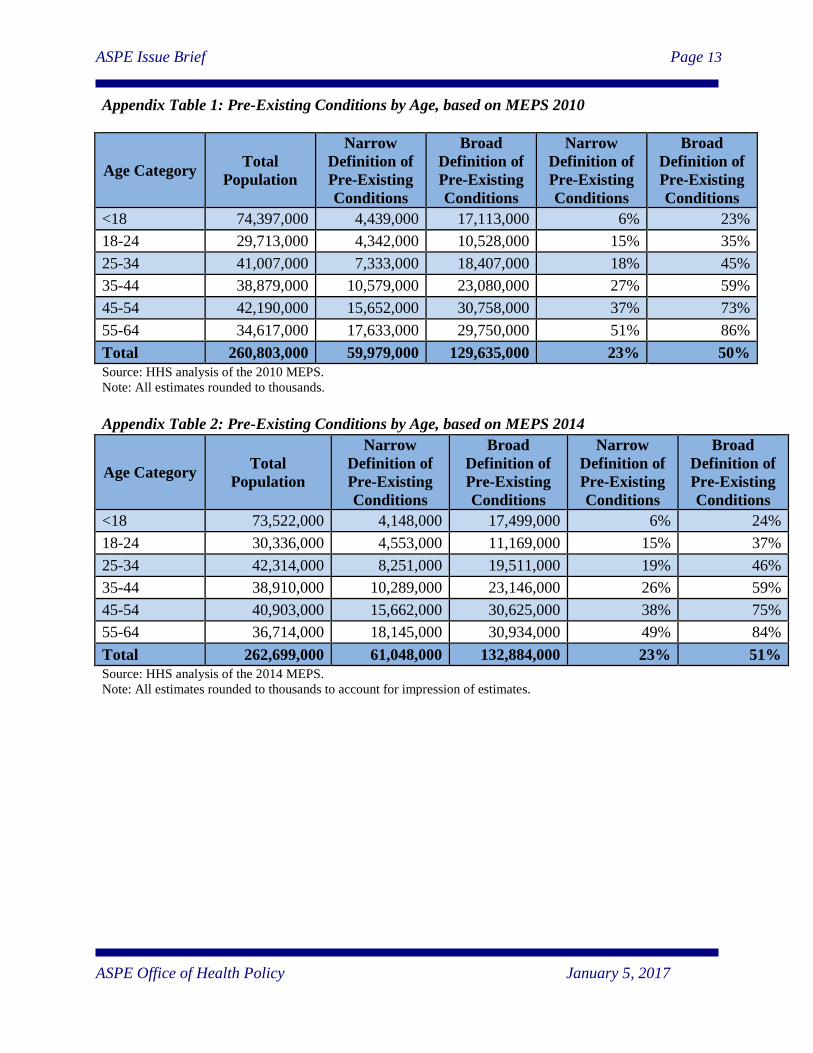
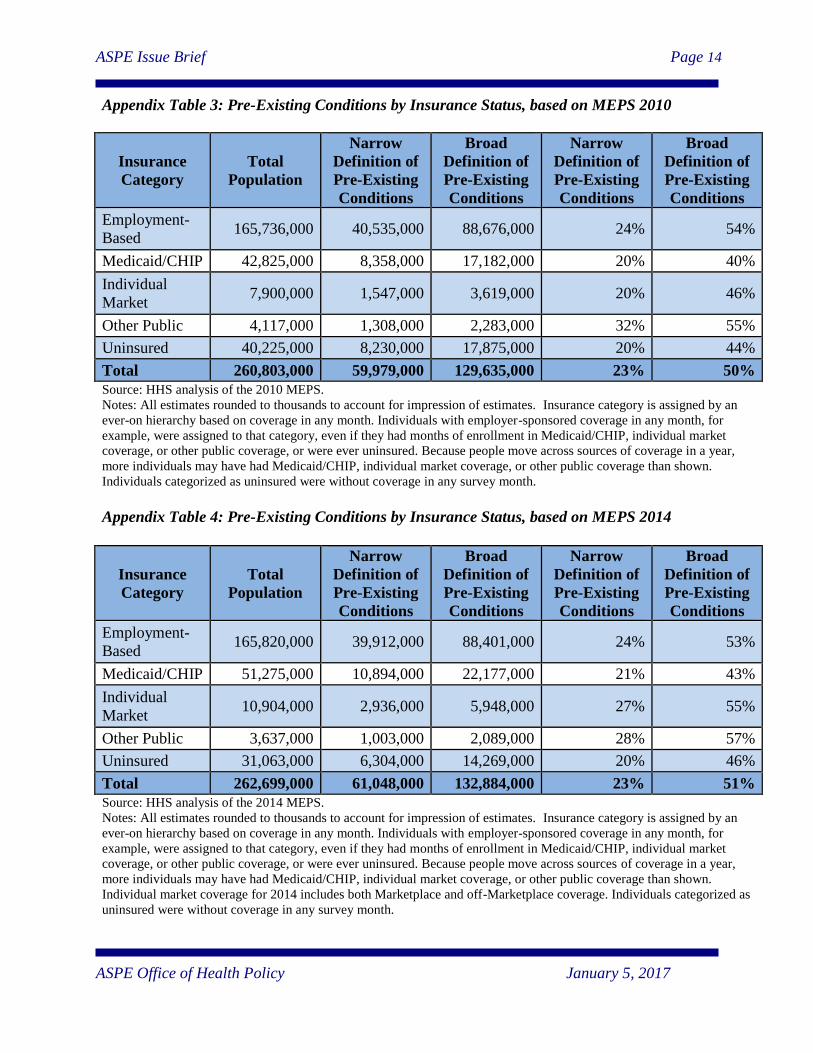
Appendix Tables 1-4 present the full set of estimates by age and insurance status for 2010 and
2014, using both pre-existing conditions measures. Appendix Table 5 shows the change between
2010 and 2014 in the distribution of insurance coverage among individuals with pre-existing
conditions (broad definition only).
16
For a list of the included conditions and more detailed explanation of methods, please see the Methodology
section of: “At Risk: Pre-Existing Conditions Could Affect 1 in 2 Americans”; US Department of Health & Human
Services, January 2011. Available online at: https://aspe.hhs.gov/sites/default/files/pdf/76376/index.pdf.
ASPE Issue Brief Page 13
ASPE Office of Health Policy January 5, 2017
Appendix Table 1: Pre-Existing Conditions by Age, based on MEPS 2010
Age Category Total
Population
Narrow
Definition of
Pre-Existing
Conditions
Broad
Definition of
Pre-Existing
Conditions
Narrow
Definition of
Pre-Existing
Conditions
Broad
Definition of
Pre-Existing
Conditions
<18 74,397,000 4,439,000 17,113,000 6% 23%
18-24 29,713,000 4,342,000 10,528,000 15% 35%
25-34 41,007,000 7,333,000 18,407,000 18% 45%
35-44 38,879,000 10,579,000 23,080,000 27% 59%
45-54 42,190,000 15,652,000 30,758,000 37% 73%
55-64 34,617,000 17,633,000 29,750,000 51% 86%
Total 260,803,000 59,979,000 129,635,000 23% 50%
Source: HHS analysis of the 2010 MEPS.
Note: All estimates rounded to thousands.
Appendix Table 2: Pre-Existing Conditions by Age, based on MEPS 2014
Age Category Total
Population
Narrow
Definition of
Pre-Existing
Conditions
Broad
Definition of
Pre-Existing
Conditions
Narrow
Definition of
Pre-Existing
Conditions
Broad
Definition of
Pre-Existing
Conditions
<18 73,522,000 4,148,000 17,499,000 6% 24%
18-24 30,336,000 4,553,000 11,169,000 15% 37%
25-34 42,314,000 8,251,000 19,511,000 19% 46%
35-44 38,910,000 10,289,000 23,146,000 26% 59%
45-54 40,903,000 15,662,000 30,625,000 38% 75%
55-64 36,714,000 18,145,000 30,934,000 49% 84%
Total 262,699,000 61,048,000 132,884,000 23% 51%
Source: HHS analysis of the 2014 MEPS.
Note: All estimates rounded to thousands to account for impression of estimates.
ASPE Issue Brief Page 14
ASPE Office of Health Policy January 5, 2017
Appendix Table 3: Pre-Existing Conditions by Insurance Status, based on MEPS 2010
Insurance
Category
Total
Population
Narrow
Definition of
Pre-Existing
Conditions
Broad
Definition of
Pre-Existing
Conditions
Narrow
Definition of
Pre-Existing
Conditions
Broad
Definition of
Pre-Existing
Conditions
Employment-
Based 165,736,000 40,535,000 88,676,000 24% 54%
Medicaid/CHIP 42,825,000 8,358,000 17,182,000 20% 40%
Individual
Market 7,900,000 1,547,000 3,619,000 20% 46%
Other Public 4,117,000 1,308,000 2,283,000 32% 55%
Uninsured 40,225,000 8,230,000 17,875,000 20% 44%
Total 260,803,000 59,979,000 129,635,000 23% 50%
Source: HHS analysis of the 2010 MEPS.
Notes: All estimates rounded to thousands to account for impression of estimates. Insurance category is assigned by an
ever-on hierarchy based on coverage in any month. Individuals with employer-sponsored coverage in any month, for
example, were assigned to that category, even if they had months of enrollment in Medicaid/CHIP, individual market
coverage, or other public coverage, or were ever uninsured. Because people move across sources of coverage in a year,
more individuals may have had Medicaid/CHIP, individual market coverage, or other public coverage than shown.
Individuals categorized as uninsured were without coverage in any survey month.
Appendix Table 4: Pre-Existing Conditions by Insurance Status, based on MEPS 2014
Insurance
Category
Total
Population
Narrow
Definition of
Pre-Existing
Conditions
Broad
Definition of
Pre-Existing
Conditions
Narrow
Definition of
Pre-Existing
Conditions
Broad
Definition of
Pre-Existing
Conditions
Employment-
Based 165,820,000 39,912,000 88,401,000 24% 53%
Medicaid/CHIP 51,275,000 10,894,000 22,177,000 21% 43%
Individual
Market 10,904,000 2,936,000 5,948,000 27% 55%
Other Public 3,637,000 1,003,000 2,089,000 28% 57%
Uninsured 31,063,000 6,304,000 14,269,000 20% 46%
Total 262,699,000 61,048,000 132,884,000 23% 51%
Source: HHS analysis of the 2014 MEPS.
Notes: All estimates rounded to thousands to account for impression of estimates. Insurance category is assigned by an
ever-on hierarchy based on coverage in any month. Individuals with employer-sponsored coverage in any month, for
example, were assigned to that category, even if they had months of enrollment in Medicaid/CHIP, individual market
coverage, or other public coverage, or were ever uninsured. Because people move across sources of coverage in a year,
more individuals may have had Medicaid/CHIP, individual market coverage, or other public coverage than shown.
Individual market coverage for 2014 includes both Marketplace and off-Marketplace coverage. Individuals categorized as
uninsured were without coverage in any survey month.
ASPE Issue Brief Page 15
ASPE Office of Health Policy January 5, 2017
Appendix Table 5: Change in Insurance Coverage of Individuals with Pre-Existing
Conditions (Broad Definition), 2010-2014
Insurance
Category
2010
Pre-ex
Population
2014
Pre-ex
Population
Percentage
Change
2010
Share of
pre-ex
population
2014
Share of
pre-ex
population
Employment-Based 88,676,000 88,401,000 -0.3% 68.4% 66.5%
Medicaid/CHIP 17,182,000 22,177,000 29.1% 13.3% 16.7%
Individual Market 3,619,000 5,948,000 64.3% 2.8% 4.5%
Other Public 2,283,000 2,089,000 -8.5% 1.8% 1.6%
Uninsured 17,875,000 14,269,000 -20.2% 13.8% 10.7%
Total 129,635,000 132,884,000 2.5% 100.0% 100.0%
Source: HHS analysis of the 2010 and 2014 MEPS.
Notes: All estimates rounded to thousands to account for impression of estimates. Insurance category is assigned by
an ever-on hierarchy based on coverage in any month. Individuals with employer-sponsored coverage in any month,
for example, were assigned to that category, even if they had months of enrollment in Medicaid/CHIP, individual
market coverage, or other public coverage, or were ever uninsured. Because people move across sources of coverage
in a year, more individuals may have had Medicaid/CHIP, individual market coverage, or other public coverage than
shown. Individual market coverage for 2014 includes both Marketplace and off-Marketplace coverage. Individuals
categorized as uninsured were without coverage in any survey month.
Methodological Refinements to 2011 Analysis:
The current analysis includes several methodological improvements relative to our 2011 analysis
that improve the precision of our estimates. First, we identified a subset of individuals who had
a condition meeting our narrower definition of a pre-existing condition, but who were incorrectly
excluded from our estimates due to an error in coding. As a result of this correction, 1,237
unweighted sample observations are newly classified as having a pre-existing condition under
our narrower definition. When weighted these records correspond to approximately 13.4 million
individuals.
Second, we adjusted the variable we used to define the age of individuals in the MEPS data,
from AGE53X to AGE08X, to better capture the age of panel members during the year in which
the data was collected. This change adds an additional 13 unweighted sample observations to the
non-elderly population, which is eligible for both our first and second measures. When weighted,
these observations represent nearly 200,000 additional eligible individuals.
Third, our current analysis uses full 5 digit ICD-9 codes to specify conditions included in our
two measures, provides additional precision to our estimates. These codes are not included in the
publicly available data file, which provides only 3 digit ICD-9 codes. This change reduces the
number of unweighted sample observations included in the lower-bound measure by 230,
representing nearly 2.4 million individuals, and 117 in the upper-bound measure, representing
just over 1.1 million individuals.
ASPE Issue Brief Page 16
ASPE Office of Health Policy January 5, 2017
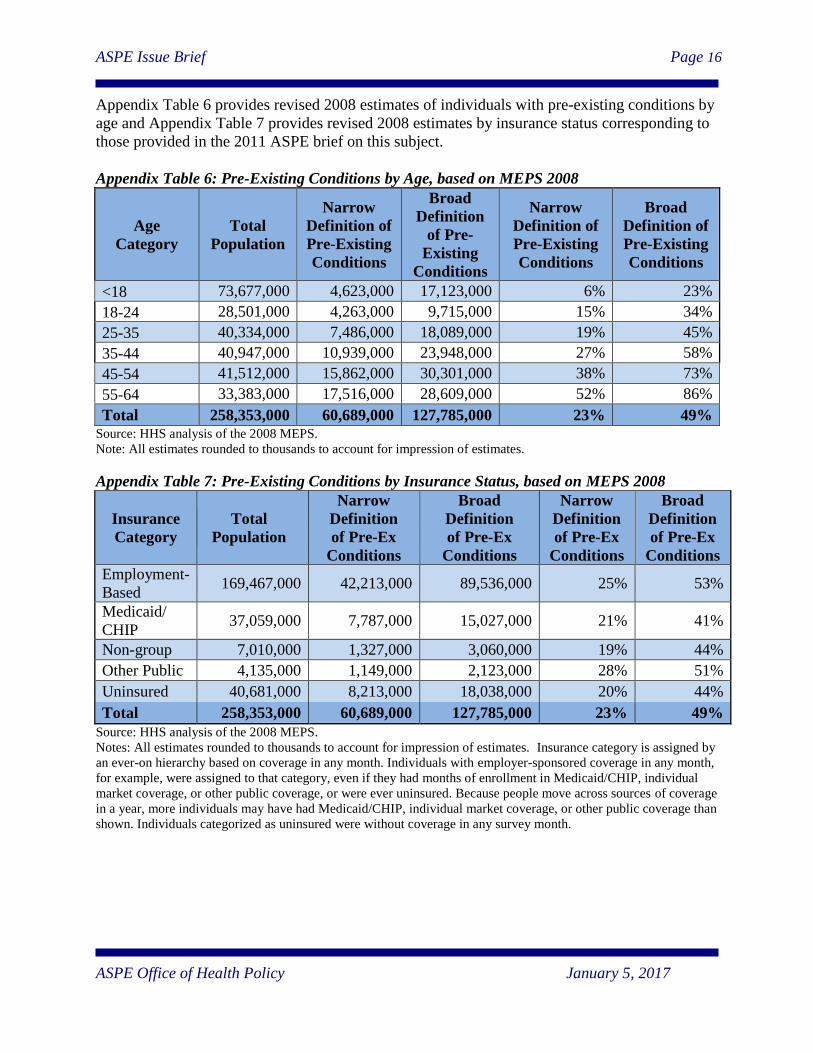
Appendix Table 6 provides revised 2008 estimates of individuals with pre-existing conditions by
age and Appendix Table 7 provides revised 2008 estimates by insurance status corresponding to
those provided in the 2011 ASPE brief on this subject.
Appendix Table 6: Pre-Existing Conditions by Age, based on MEPS 2008
Age
Category
Total
Population
Narrow
Definition of
Pre-Existing
Conditions
Broad
Definition
of Pre-
Existing
Conditions
Narrow
Definition of
Pre-Existing
Conditions
Broad
Definition of
Pre-Existing
Conditions
<18 73,677,000 4,623,000 17,123,000 6% 23%
18-24 28,501,000 4,263,000 9,715,000 15% 34%
25-35 40,334,000 7,486,000 18,089,000 19% 45%
35-44 40,947,000 10,939,000 23,948,000 27% 58%
45-54 41,512,000 15,862,000 30,301,000 38% 73%
55-64 33,383,000 17,516,000 28,609,000 52% 86%
Total 258,353,000 60,689,000 127,785,000 23% 49% Source: HHS analysis of the 2008 MEPS.
Note: All estimates rounded to thousands to account for impression of estimates.
Appendix Table 7: Pre-Existing Conditions by Insurance Status, based on MEPS 2008
Insurance
Category
Total
Population
Narrow
Definition
of Pre-Ex
Conditions
Broad
Definition
of Pre-Ex
Conditions
Narrow
Definition
of Pre-Ex
Conditions
Broad
Definition
of Pre-Ex
Conditions
Employment-
Based 169,467,000 42,213,000 89,536,000 25% 53%
Medicaid/
CHIP 37,059,000 7,787,000 15,027,000 21% 41%
Non-group 7,010,000 1,327,000 3,060,000 19% 44%
Other Public 4,135,000 1,149,000 2,123,000 28% 51%
Uninsured 40,681,000 8,213,000 18,038,000 20% 44%
Total 258,353,000 60,689,000 127,785,000 23% 49%
Source: HHS analysis of the 2008 MEPS.
Notes: All estimates rounded to thousands to account for impression of estimates. Insurance category is assigned by
an ever-on hierarchy based on coverage in any month. Individuals with employer-sponsored coverage in any month,
for example, were assigned to that category, even if they had months of enrollment in Medicaid/CHIP, individual
market coverage, or other public coverage, or were ever uninsured. Because people move across sources of coverage
in a year, more individuals may have had Medicaid/CHIP, individual market coverage, or other public coverage than
shown. Individuals categorized as uninsured were without coverage in any survey month.