Embed Size (px)
Citation preview
Health Risk Management

Today’s Presentation• Define Health Risk Management (HRM)• Our vision• The bottom line impact of poor Health Risk Management• The scope of a proactive HRM study
• Elements• Program• Partnerships
• Long term study strategy• Our enrollment progress to date
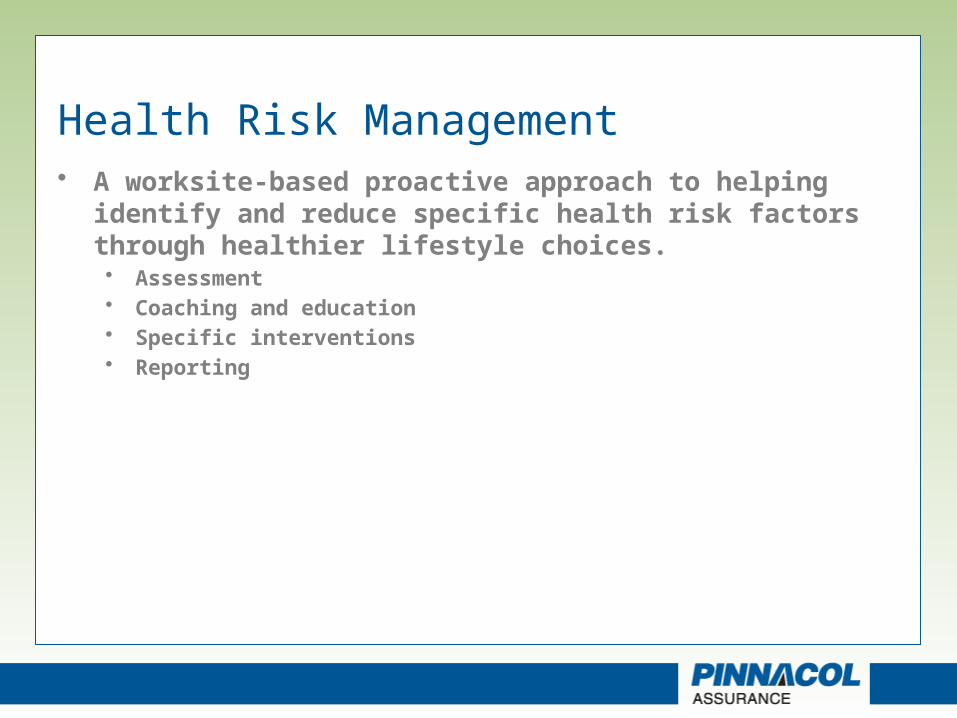
Health Risk Management• A worksite-based proactive approach to helping identify and
reduce specific health risk factors through healthier lifestyle choices.• Assessment• Coaching and education• Specific interventions• Reporting

Our Vision
To reduce workers’ compensation costs and provide measurable benefits to policyholders by improving employee health and productivity.
Core areas of opportunity– Workers’ compensation cost and trend improvements– Increased productivity for employers– Improved health and wellness status of employees– Be a leader in the application of health risk management
in workers’ compensation

Why Health Risk Management Now?
Workplace Safety
MedicalManagement
OrganizationalCulture/Structure
Health RiskManagement
1970s 1980s 1990s 2010
Employer Behavior Employee BehaviorOperational Behavior

The Bottom Line Impact of Poor Health Risk Management
• Workers’ Compensation Costs• Productivity• Health Insurance Claims
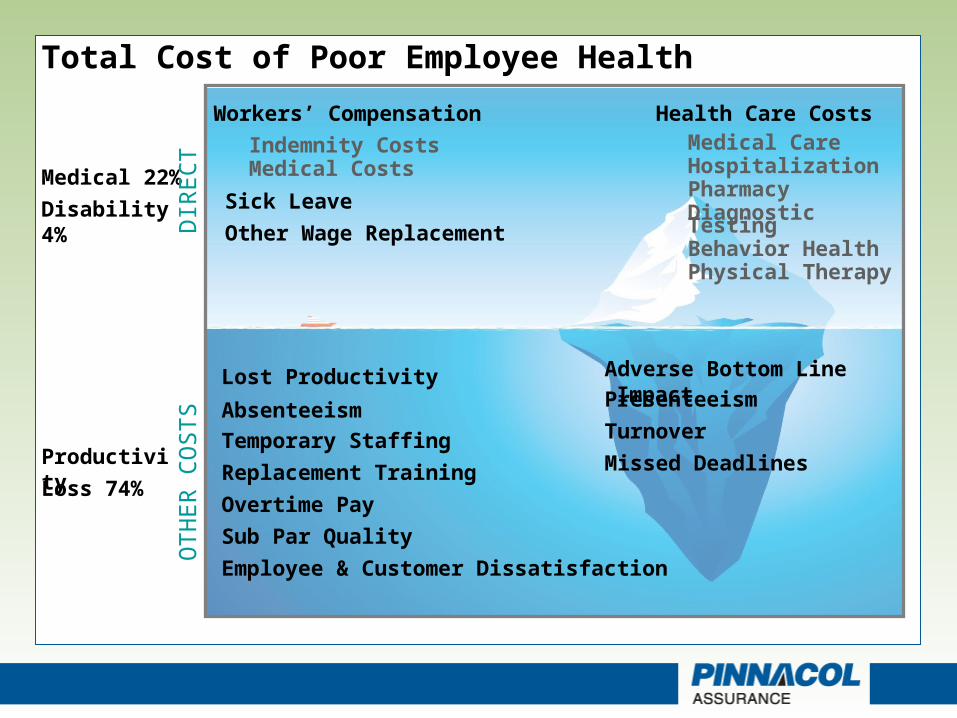
Medical 22%
Disability 4%
Productivity
Loss 74%
DIR
EC
TO
TH
ER
CO
ST
S
Health Care CostsMedical CareHospitalizationPharmacyDiagnostic TestingBehavior HealthPhysical Therapy
Workers’ Compensation
Lost Productivity
Absenteeism
Employee & Customer Dissatisfaction
Turnover
Replacement Training Missed Deadlines
Overtime Pay
Sub Par Quality
Temporary Staffing
Presenteeism
Adverse Bottom Line Impact
Total Cost of Poor Employee Health
Sick Leave
Other Wage Replacement
Indemnity CostsMedical Costs

Workers’ Compensation: Direct Cost• A greater than 8-fold difference in w.c. costs between
recommended weight and obese workers. Duke University
• A 7-fold difference in w.c. costs between high and low risk workers. University of Michigan
• A 23% decline over 2 years in w.c. claims costs and 18% decline in w.c. claims volume among companies engaging in HRM. Wellsource Health Solutions
• Health risks have a compounding impact on w.c. costs
• Obese claims are 2.8 times more expensive than non-obese claims at the 12-month maturity. The cost difference climbs to a factor of 4.5 at the three year maturity and to 5.3 at the five year maturity. National Council on Compensation Insurance (NCCI), 2009

Duke Study200
180
160
140
120
100
80
60
40
20
0
14
12
10
8
6
4
2
0
BMI<18.5 (Underweight)
18.5 – 24.9 (Healthy Weight)
25 – 29.9 (Overweight)
30 - 34.9 (Obese Class I)
35 – 39.9 (Obese Class II)
40+ (Obese Class III)
40.97
14.19
60.17
75.21
117.61
183.63
Cla
ims
pe
r 10
0 F
TE
s
5.535.80
7.05
8.81
10.8011.65
The most obese have 13 times more lost workdays than healthy weight workers
Lost Workdays Claims
Lo
st
Wo
rkd
ay
s p
er
10
0 F
TE
s
Source: Ostbye, T., et al, “Obesity and Workers Compensation,”
Archives of Internal Medicine, April 23, 2007.
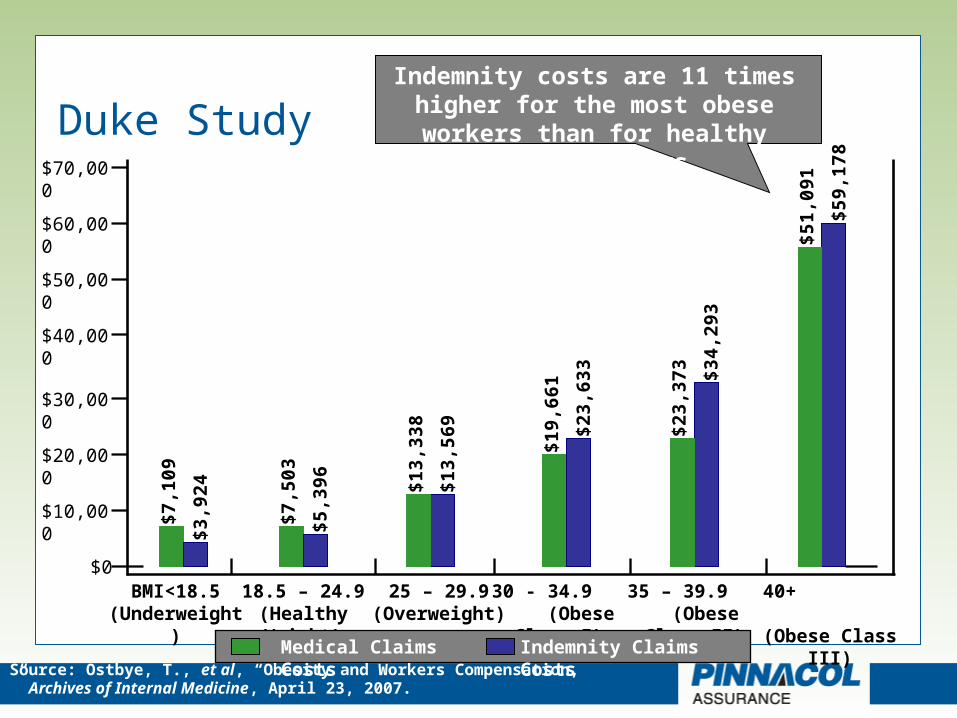
Duke Study
$10,000
$0BMI<18.5
(Underweight)18.5 – 24.9
(Healthy Weight)25 – 29.9
(Overweight)30 - 34.9
(Obese Class I)35 – 39.9
(Obese Class II)40+ (Obese Class III)
$7,1
09
Indemnity costs are 11 times higher for the most obese workers than for healthy weight workers.
Medical Claims Costs Indemnity Claims Costs
$70,000
$60,000
$50,000
$40,000
$30,000
$20,000
$3,9
24
$7,5
03
$5,3
96 $13,
338
$13,
569
$19,
661
$23,
633
$23,
373 $3
4,29
3
$51,
091
$59
,17
8
Source: Ostbye, T., et al, “Obesity and Workers Compensation,” Archives of Internal Medicine, April 23, 2007.
Productivity
• Employers, on average, have $3 of health-related productivity costs for every $1 of medical or pharmacy claims costs. (Journal of Occupational & Environmental Medicine July 2007)
• Lost productivity represents 7.9% of total corporate earnings and 5.3% of human capital costs. (Health and Human Capital Foundation)
• The most costly conditions related to productivity are often not the same as the most costly conditions related to medical treatment costs. Taking an integrated approach to health and productivity results in more cost-effective interventions. (Journal of Occupational & Environmental Medicine July 2007)

Look Beyond Health Insurance Costs
Anxiety
$0
Medical Presenteeism
Other
Sleeping Problem
High Cholesterol
Arthritis
Hypertension
Obesity
Drug Absenteeism
Fatigue
Depression
Back/Neck Pain
$100,000 $200,000 $300,000 $400,000 $500,000 $600,000
JOEM July 2007
Chronic Pain

Impact of Health Insurance
• The vast majority of Pinnacol policyholders have fewer than 25 employees
• We assume the rate of uninsured status, from a health care perspective, mirrors the state as a whole
• Approximately 50% of our participants are likely to have no health insurance
• Placing HRM in a worksite environment rather than a health insurance environment is a key differentiator
We Believe
In the future, Health Risk Management will be as fundamental to managing risk as safety is now.

Pinnacol HRM Components• 3-5 year timeframe • Partnering with key agencies• Free HRM services to policyholders• 3,000 participating policyholders representative of Colorado’s
workforce (Small and medium sizes of employers are a critical component)
• 30,000 enrolled members
Pinnacol’s HRM Program• Health Risk Assessment for employees• Health education and coaching• Specific interventions and programs• Reporting on participation and outcomes
• Policyholders• Agents• Pinnacol• Colorado/national

Pinnacol’s HRM Partnerships
Service Delivery - InterventionsWellsource Health Solutions (WHS)
ReportingWHS: Health risk profileIntegrated Benefits Institute: HPQ-Select Productivity Survey
(Harvard-WHO tool)
Data/EvaluationIBI, Thomson Reuters/Emory University/local universities

HRM Study Strategy• Use outside independent evaluators to conduct a peer review
quality assessment of the long term impact of HRM on:• Health risk profile of our policyholders and their employees (based on trended
HRA results)• Monetized changes in productivity (based on trended results of HPQ-Select)• Changes in Workers’ Compensation (based on participant pool versus Pinnacol
control group)• Changes measured over 3 – 5 years
• Work with local universities and researchers to identify other relevant issues and make data available for non-Pinnacol initiatives

Progress Toward our Study Goals
Data as of 8/27/2010
Enrolled Policyholders 105 of 3,000 9,148 of 30,000
Enrolled Employees