Embed Size (px)
Citation preview

THE EFFECTS OF BOAT DISTURBANCE ON SEAIBRDS OFF SOUTHWESTERN VANCOUVER ISLAND, BRITISH COLUMBIA
by
NATHAN HENTZE
A THESIS SUBMITTED IN PARTIAL FULFILMENT OF THE REQUIREMENTS FOR THE DEGREE OF
BACHELOR OF SCIENCE (HONS.)
in the Department of
BIOLOGY,
UNIVERSITY OF VICTORIA
We accept this thesis as conforming to the required standard
_________________________________ Supervisor
Dr. Alan E. Burger
_________________________________ Honours Advisor
Dr. Geraldine Allen
_________________________________ Examiner
Dr. Doug Bertram
2006

ii
Supervisor: Adjunct Professor Alan E. Burger
Human disturbance can have direct and indirect impacts on birds. Many studies
have investigated the effects of boat disturbance on waterbirds, but have focused on non-
diving waterbirds or breeding colonies. This study focused on boat disturbance effects on
diving waterbirds in marine waters off southwestern Vancouver Island, British Columbia,
Canada. Observations of Marbled Murrelets (Brachyramphus marmoratus), Common
Murres (Uria aalge), Rhinoceros Auklets (Cerorhinca monocerata) and Pelagic
Cormorants (Phalacrocorax pelagicus) were collected in response to boat disturbances.
Bird responses were categorized as No Reaction, Dive, or Flush. Variables of date, sea
state, hour, group size, boat speed, approach distance, approach angle, average bird
density, location, and average prey density were included in predictive models using
multiple logistic regression. An information-theoretic approach (Akaike information
criterion) was used in model selection. Three model-sets were developed for each
species testing which variables best predicted if a bird would react (Dive or Flush), if a
reacting bird would flush, and if a bird would remain within a site (No Reaction or Dive)
or flush. General trends occurred among species, but models were species-specific.
Marbled Murrelet, Common Murre, and Pelagic Cormorant appear to react based on a
large number of parameters tested. Distance and speed best predicted reaction responses
for Rhinoceros Auklets. Flushing response in birds that react (Dive or Flush) was best
predicted by all parameters except average bird density in murrelets, by distance and
speed in murres, by distance in auklets, and by time of day in cormorants. Bird density,
sea state, and group size were all important predictors in determining if a murrelet would
leave a site or remain. Prey density was the main parameter in predicting if murres
abandoned sites, group size and prey density for auklets, and sea state, prey density, and
group size for cormorants. Murrelets, murres and cormorants reacted at similar distances,
with Common Murre being the most tolerant to boat approaches. Pelagic Cormorants
reacted at greater distances than the other species. Increased sea state and decreased
group size were the most significant parameters in determining reaction response.
Observations and predictive logistic regression equations suggest that buffer zones of 150
m would eliminate most boat disturbance effects to Marbled Murrelets, Common Murres,

iii
and Rhinoceros Auklets. Buffer zones of 200 m or more are required to reduce the
effects of disturbance to Pelagic Cormorants. Restrictions on boat speed or time of day
or year would not reduce disturbance effects. An exclusion zone parallel to shore out to 1
km would eliminate most boat disturbance effects to all these species, affording
protection to foraging birds and some nesting colonies.

iv
Table of Contents Page Abstract……………………………………………………………………… ii-iii List of Tables………………………………………………………………… v List of Figures……………………………………………………………….. vi Acknowledgement…………………………………………………………… vii 1. Introduction……………………………………………………………….. 1-3 2. Methods…………………………………………………………………… 3-10
2.1 Study Area……………………………………………………….. 3-4 2.2 Data Collection……………………………………………………4-7 2.2.1 At-sea Survey…………………………………………... 4-6 2.2.2 On-shore Scans………………………………………… 6-7 2.3 Data Analysis…………………………………………………... 7-10 2.3.1 Echosounder Analysis…………………………………. 7 2.3.2 Location Designation………………………………… 7 2.3.3 Theodolite Points……………………………………. 7-8 2.3.4 Statistical Analysis…………………………………… 8-10 2.3.4a Parameter and Model Building……………………….. 8-9 2.3.4b Model Selection…………………………………….. 9 2.3.5 Means and Predictive Equations……………………... 9-10 3. Results…………………………………………………………………… 10-19 3.1 Disturbance Results…………………………………………….. 10-12 3.1.1 Marbled Murrelet…………………………………….. 12-13 3.1.2 Common Murre………………………………………. 13-15 3.1.3 Rhinoceros Auklet……………………………………. 15-16 3.1.4 Pelagic Cormorant……………………………………. 16-17 3.2 Theodolite Surveys…………………………………………….. 18-19 4. Discussion……………………………………………………………….. 19-30 4.1 Parameter Effects………………………………………………. 22-26 4.2 Species-specific Responses…………………………………….. 26-28 4.2.1 Marbled Murrelet…………………………………….. 26 4.2.2 Common Murre………………………………………. 26-27 4.2.3 Rhinoceros Auklet……………………………………. 27 4.2.4 Pelagic Cormorant…………………………………….. 27-28 4.3 Conservation Implications……….……………………………. 28-30 5. Conclusion………………………………………………………………. 30 References Cited…………………………………………………………… 31-37 Appendix A………………………………………………………………… 38-39 Appendix B………………………………………………………………… 40-42 Appendix C………………………………………………………………… 43-45

v
List of Tables Page Table 1: Mean distances, group sizes, and angles, ± standard error
for Marbled Murrelet, Common Murre, Rhinoceros Auklet, and Pelagic Cormorant for each response type (No Reaction, Dive, and Flush)……………………………………….…………… 12
Table 2 (in Appendix B): Top 5 candidate logistic regression models for predicting reaction behaviour (Reaction-No Reaction Model) in Marbled Murrelets, Common Murres, Rhinoceros Auklets, and Pelagic Cormorants.………………………………………………… 40 Table 3 (in Appendix C): Univariate paramater estimates of the Reaction No Reaction model for Marbled Murrelet (n = 3063), Common Murre (n = 652), Rhinoceros Auklet (n = 268), and Pelagic Cormorant (n = 670) ……………………………………………………………… 43 Table 4 (in Appendix B): Top 5 candidate logistic regression models for predicting flushing behaviour from reacting birds (Dive-Flush model) in Marbled Murrelets, Common Murres, Rhinoceros Auklets, and Pelagic Cormorants.……………………………………………… 41 Table 5 (in Appendix C): Univariate paramater estimates of the Dive-Flush model for Marbled Murrelet (n = 1206), Common Murre (n = 105), Rhinoceros Auklet (n = 75), and Pelagic Cormorant (n = 514) ……………………………………………………………… 44 Table 6 (in Appendix B): Top 5 candidate logistic regression models for predicting site abandonment behaviour (Flush-Stay model) in Marbled Murrelets, Common Murres, Rhinoceros Auklets, and Pelagic Cormorants.………………………………………………… 42 Table 5 (in Appendix C): Univariate paramater estimates of the Flush-Stay model for Marbled Murrelet (n = 1690), Common Murre (n = 372), Rhinoceros Auklet (n = 152), and Pelagic Cormorant (n = 335) ……………………………………………………………… 45

vi
List of Figures Page Figure 1: Study area.……………………………………….…………… 4 Figure 2: Total percentage of responses (No Reaction, Dive, and Flush) for each species studied, Marbled Murrelet (MAMU), Common Murre (COMU), Rhinoceros Auklet (RHAU), and Pelagic Cormorant (PECO) ………………………………………..…… 10 Figure 3: Proportions of responses (No Reaction, Dive, and Flush) for each species studied, Marbled Murrelet (MAMU), Common Murre (COMU), Rhinoceros Auklet (RHAU), and Pelagic Cormorant (PECO) at approach distances from 5 to 120 m…… 11 Figure 4 (in Appendix A): Reaction (dive/flush) probability as a function of sea state based on a predictive logistic regression equation (see methods) for the four focal species: Marbled Murrelet (MAMU), Common Murre (COMU), Rhinoceros Auklet (RHAU), and Pelagic Cormorant (PECO).…………………….…………… 38 Figure 5 (in Appendix A): Reaction (dive/flush) probability as a function of group size based on a predictive logistic regression equation (see methods) for the four focal species: Marbled Murrelet (MAMU), Common Murre (COMU), Rhinoceros Auklet (RHAU), and Pelagic Cormorant (PECO).…………………….…………… 39 Figure 6 (in Appendix A): Reaction (dive/flush) probability as a function of approach distance based on a predictive logistic regression equation (see methods) for the four focal species: Marbled Murrelet (MAMU), Common Murre (COMU), Rhinoceros Auklet (RHAU), and Pelagic Cormorant (PECO).…………………….…………… 39 Figure 7: Box-and-whisker plot showing median (thick line), 25 and 75% quartiles (grey box) and extreme values (whiskers) of flight distance in metres for Pelagic Cormorants (PECO) and Marbled Murrelets (MAMU) based on the theodolite observations from Carmanah Bay .……………………………………….…………… 18 Figure 8: Box-and-whisker plot showing median (thick line), 25 and 75% quartiles (grey box) and extreme values (whiskers) of flight times and time to resume foraging after landing from a flushing event for Pelagic Cormorants (PECO) and Marbled Murrelets (MAMU) based on the theodolite observations from Carmanah Bay ..…………… 19

vii
Acknowledgements I would like to thank Alan Burger, Rob Ronconi and Sarah Wong for help and support
both in the field and lab. The following helped with financial support: Parks Canada,
B.C. Forest Science Program, and the Endangered Species Recovery Fund (World
Wildlife Fund and Canadian Wildlife Service). Danielle Bellefleur and Parks Canada
staff, the Canadian Coast Guard and lightkeepers (especially Jerry and Janet Etzkorn,
Scott Bell), Carl Edgar and Roy Jack were essential in providing help with field logistics.

1
1. Introduction Human activity can have a broad range of impacts on birds (reviews in Gill et al. 1996,
2001, Hill et al. 1997, Carney and Sydeman 1999, Gill and Sutherland 2000, Nisbet 2000, Frid
and Dill 2002). These impacts can have direct or indirect consequences ranging from reduced
foraging rates (e.g. Galicia and Baldassarre 1997; Rees et al. 2005) and displacement from
foraging areas (e.g. Pfister et al. 1992; Gill et al. 1996) to reduced nesting success (e.g. Anderson
and Keith 1980; Schulz and Stock 1991) and even colony abandonment (Cairns et al. 1998;
Skagen et al. 2001). Human-caused disturbance can also lead to direct mortality (e.g. stepped
on, vehicle collisions) (see Ruhlen et al. 2003) and indirect mortality (i.e. greater predation rates)
(Keller 1991; Mikola et al. 1994) of individuals. Some studies have even found disturbance
effects to have an analogous, if potentially reversible, impact as habitat loss or degradation (Gill
and Sutherland 2000; West et al. 2002).
From a strictly conservation point-of-view, human disturbance of wildlife only becomes
an issue if it causes populations to decline (Gill et al. 1996, 2001), or abandon large regions of
their range. As such, there have been efforts made to quantify the effects of human disturbance
on wildlife populations (reviews by Hockin et al. 1992; Gill et al. 1996). Traditionally, studies
focused on the degree of behavioural response as an indicator of a species susceptibility to
disturbance events (review in Carney and Sydeman 1999). A common indicator of the threshold
between staying and fleeing has been the flight distance (Ydenberg and Dill 1986), often termed
the flight initiation distance. This flight initiation distance has been used in management
recommendations to create buffer zones and set-back distances between human approaches and
species (Erwin 1989; Rodgers and Smith 1995, 1997; Rodgers and Schwikert 2002; Carney and
Sydeman 1999; Blumstein et al. 2002). Some studies have suggested that alert distance (the
distance at which an individual alters its behaviour in response to the disturbance but does not
flee) is a better proximate measure of disturbance (Rodgers and Smith 1995, 1997; Fernández-
Juricic et al. 2001). Physiological changes (e.g. increased heart rate) may be triggered before
behavioural responses are elicited (Nimon et al. 1995; Wilson and Culik 1995; Fowler 1999;
Ackerman et al. 2004).
Frid and Dill (1996) defined the risk-disturbance hypothesis, which equates non-lethal
human-caused disturbance with natural predation threat, to provide a predictive framework
governing animal responses. This hypothesis is driven by the tradeoffs between the costs and

2
benefits of leaving an area when faced with a predation risk (Ydenberg and Dill 1986; Lima and
Dill 1990; Lima 1998). Boat disturbance is not an exact analogy of predation, but threatening
stimuli of any kind can induce anti-predator behaviour (Frid and Dill 2002). Birds that do not
react to a boat still face a risk (that of collision), and in this sense boat disturbance and predation-
risk can be considered analogous. Many factors may contribute to an individual’s decision of
staying or fleeing, for example: speed of approach (e.g. Burger 1998), angle of approach (e.g.
Burger and Gochfeld 1990, 1991b; Bulova 1994), noise level (e.g. Burger 1983; Brown 1990;
Delaney et al. 1999), amount of available suitable alternate habitat (e.g. Gill et al. 2001),
distance of approach (e.g. Burger 1981; Belanger and Bedard 1989; Burger and Gochfeld 1991a,
1991b; Grubb and King 1991; Klein 1993; Roberts and Evans 1993; Fernández-Juricic and
Telleria 2000).
Some recent work refutes the flight initiation distance as an appropriate index of
disturbance susceptibility (Gill et al. 2001; Beale and Monaghan 2004). In situations where
alternate habitat is lacking, individuals that display a greater behavioural tolerance to disturbance
may also experience the greatest fitness costs (Gill et al. 2001). Alternatively, individuals in
superior physical condition may show greater responsiveness to human-induced disturbance
(Beale and Monaghan 2004).
Diving waterbirds are unique in that three disturbance response option exists to them. An
individual may choose to remain on the surface of a patch despite the predation threat, flush from
the patch to reduce the risk of predation, or dive underneath the patch surface to reduce the cost
of leaving the area while simultaneously reducing the predation threat. A diving waterbird may
perceive predation risk from above-surface predators (e.g. raptors) differently than below-surface
predators (e.g. sea lions). If this is the case, waterbirds should view the human-caused
disturbance stimuli from boats as an above-surface predation threat, and react accordingly.
Despite the diving option, no studies have measured diving as a response to disturbance. A dive
initiation distance can be considered analogous to flight initiation distance in principle, but may
represent a compromise between remaining alert to a predation threat and abandoning a site
altogether.
Many studies have focused on waterbirds (see Carney and Sydeman 1999) and boat
disturbance (Rogers and Smith 1995, 1997; Burger 1998; Rogers and Schwickert 2002; Ronconi
and St. Clair 2002), but research has been biased towards non-diving waterbirds (e.g. Rodgers

3
and Smith 1997) and nesting colonies (Carney and Sydeman 1999). Few studies have
investigated boat disturbance on waterbirds that forage on open-water environments, or that
forage by diving for prey (e.g. Ronconi and St. Clair 2002).
Members of the families Alcidae and Phalacrocoracidae are widespread and often
ubiquitous off the coast of western North America. In near-shore waters off southwestern
Vancouver Island, British Columbia, Canada, Marbled Murrelets (Brachyramphus marmoratus),
Common Murres (Uria aalge), Rhinoceros Auklets (Cerorhinca monocerata) (these three
species collectively referred to as the alcids) and Pelagic Cormorants (Phalacrocorax pelagicus)
are frequently observed. These species are all members of a fish-feeding diving-guild. The
spatial range of these species places them at potential risk to disturbance from recreational and
commercial boat activity. Few published studies have investigated boat disturbance on at-sea
alcids or cormorants. Speckman et al. (2004) documented Marbled Murrelets, upon approach of
a boat, swallowing prey that was being held for later delivery to nestlings. Human-caused
disturbances can also affect the spatial distribution of seabirds at sea (Kuletz 1996).
In this study I investigated the responses of Marbled Murrelet, Common Murre,
Rhinoceros Auklet, and Pelagic Cormorant to boat disturbances. Dive and flight initiation
distances were recorded as measures of disturbance, and interpreted based on a variety of
predictive variables.
2. Materials and Methods 2.1 Study Area
This study was conducted between 27 May and 5 August 2005 off southwest Vancouver
Island. Observations were collected between Port San Juan, near the town of Port Renfrew,
(48°33� N, 124°23� W) and Trevor Channel, near Bamfield (48°49� N, 125°08� W). This stretch
of coastline follows the West Coast Trail (WCT) Unit of Pacific Rim National Park Reserve
(PRNPR), and covers a linear distance of approximately 80 km (Fig. 1). The ocean depth within
the study area was usually ≤ 40 m, within the diving depth potential for all focal species.
Most boat traffic in near-shore marine waters of the WCT was from sport fishermen in
small (<9 m) motor vessels, and Parks Canada and Quu’as Trail Guardians staff in inflatable
boats. Other marine traffic (e.g. charter passenger water-taxi, commercial fishing vessels) was
infrequent. Boat activity was heaviest near areas of high salmon and crab harvesting potential,

4
such as Port San Juan, Camper Bay, Nitinat Narrows, and Barkley Sound. Boats generally
operated at low speeds (< 15 km/hr) while trolling and faster (> 25 km/hr) while cruising.
During the study period boat traffic was heaviest during the months of July and August,
corresponding to peak runs of Chinook salmon (Oncorhynchus tshawytscha).
Two Canadian Coast Guard lightstations, a private residence, and a few Quu’as cabins
were the only developments apparent from shore along the WCT coast. Marine activity
originating from these sites was minimal.
Fig. 1: Study area. Map of the West Coast Trail Unit of Pacific Rim National Park Reserve, Vancouver Island. Letter codes along coastline are location sector codes. 2.2 Data Collection
2.2.1 At-sea Surveys Observations were collected from a grey-coloured 5 m long rigid-hull inflatable
boat with a 50 hp. four-stroke Yamaha outboard motor. Data were collected between 0600 hrs
and 2000 hrs. The observers’ eye-level was approximately 1.5 m above the sea surface. Birds
could easily be observed up to 200 m; beyond this distance detection of surface birds was
reduced. Visibility was greatly reduced in rougher seas and in foggy conditions, and no
observations that occurred during sea states greater than 3 on the Beaufort Scale (large wavelets,
crests begin to break, scattered whitecaps) or during fog were included in analyses. Typically

5
two observers and one boat operator were present on the boat. Each observer recorded all bird
detections from dead ahead to directly off the port or starboard beam (from 0° to 90°). With two
observers, a 180° visual hemisphere in front and to each side of the boat was monitored.
Observers were in constant communication to prevent double-counting of birds directly in front
of the boat (0°). Observers alternated between sides of the boat at non-fixed intervals, as well as
alternated between observing and driving the boat, so that any potential observer bias was spread
evenly across observations.
Survey transects followed one of three types. Fine-scale transects occurred at 8 sites
between Carmanah Bay and Pachena Point, and each followed 3-4 transect lines, running
perpendicular to shore from the 5 m depth-contour out to the 30 m depth-contour (approximately
1.5 km offshore) with 500 m spacing between transect-lines. Fine-scale transects were
characterized by a constant speed of about 10 km/hr, set to allow the echosounder to function.
Coarse-scale transects were also limited to a 10 km/hr speed to accommodate the
echosounder. These transects followed a zig-zag pattern along the coast between Port San Juan
and Trevor Channel between the 5 m and 30 m depth-contours.
High-speed transects occurred at all locations between Port San Juan and Trevor
Channel, especially while travelling between fine-scale sites. These transects alternated speeds
of around 25 km/hr and 35 km/hr between subsequent fine-scale sites, or after approximately 10
minutes of travel. High-speed transects ran parallel to the shore following the 10-m depth-
contour. The depth-contour occurred far enough from shore (about 500-1000 m) to avoid
frequent obstacles (e.g. rocks and kelp beds), but within a range of broad spatial overlap among
species.
Observations, covering all birds of the four focal species, were recorded into hand-held
micro-cassette recorders and later transcribed onto data sheets. The data recorded for each
individual observation were: species, group size (if associating with one or more hetero- or
conspecific individuals), distance from the boat at the time of reaction or closest distance (m),
angle from the boat at time of reaction or closest distance, response (categorized as No Reaction,
Dive, or Flush), date, time, location (from GPS), boat speed (km/hr), and environmental
conditions of Beaufort sea state, swell (m), wind speed (km/h), wind direction, cloud cover (%),
precipitation (presence/absence), and visibility (km). A bird was considered to have reacted at
the moment of diving or flushing.

6
Group size was defined by the number of conspecific or heterospecific individuals
associating spatially or behaviourally, and with spacing between individuals of not more than 2
m. Individuals within a group were considered behaviourally dependent of each other, and
treated as a single data point within the data set. Individuals that were in groups, but which
displayed mixed reactions (e.g. one bird dove, another flushed) were not considered as separate
independent observations, and were excluded from analyses (n = 74).
Distance from the boat to individual bird(s) was estimated in metres. Observers were
trained in distance estimation at the start of the season using floating weights attached to rope
and dragged behind the boat at pre-calibrated distances of 25 m, 50 m, and 100 m. Distance was
noted at the instant of reaction (dive or flush), or at the point of closest contact for individuals
with no reaction. Angle was also recorded from the boat to the individual bird(s) at the point of
reaction. Angles were estimated at 22.5° increments, such that observations were assigned as 0°
(dead ahead), 22°, 45°, 67° or 90° (off the port or starboard beam). All non-reacting individuals
were assigned to a default angle of 90°.
Observers’ watches and the echosounder were synchronized with the Global Positioning
System (GPS). The paper-trace of the echosounder was marked at 2-min intervals during the
surveys. The synchronization of sounder time-lines with GPS and watch-time, allowed average
prey densities to be calculated and matched to individual bird observations. The vertical depth
output of the sounder was manually changed from 20 m to 40 m as depths dropped below 20 m,
or from 40 m to 20 m as the depth became shallower.
2.2.2 On-shore scans A Nikon NPL-332 digital theodolite with 26x magnification was used from shore at the
Carmanah lightstation to track individual birds reacting to a boat disturbance event. The
theodolite was mounted onto a surveyor’s tripod, levelled, and calibrated to a visible landmark of
known horizontal angle, at the start of each tracking session. Both the research crew’s boat and
occasional Parks Canada inflatable boats were monitored as they drove in or near Carmanah
Bay. Theodolite scanning tracked just in front of the boat’s path to locate the origin point of any
individuals that flushed. Upon flushing an individual was followed in the theodolite’s field-of-
view, with points digitally entered along the flight path. The landing point, or last known
location of the bird was the last point recorded. Each point entered was automatically designated

7
a unique number code. The codes and corresponding function (e.g. point 4 = flight path) were
written down immediately after tracking of an individual was terminated.
2.3 Data Analysis 2.3.1 Echosounder Interpretation Sounder output was automatically recorded onto a paper-trace. Transparencies, marked
with 5 m depth intervals, were placed over top of the paper output. For each 1 min minute
interval and for every 5 m of depth (up to 40 m) the average prey density was visually scored on
a scale of 0 (no prey) to 9 (near saturation) based on the amount and intensity of output (Piatt
1990; Burger et al. 2004). Output due to surface slicks, debris, and kelp was identifiable, based
on the signal pattern and surface observations, and excluded from the density scores. Salmon
and other large (i.e. non-prey) fish were identifiable as single distinct traces on the output and
excluded. Remaining traces were assumed to be small schooling fish or euphausiids as found by
Burger et al. (2004) in the same region. Actual prey density does not increase linearly with the
intensity of the sounder output. Prey scores were squared to account for this discrepancy (Forbes
and Nakken 1972). I calculated the mean of the squared prey density at all depths within each 1
min interval, and these means were then averaged within transects. As seabird-prey associations
within this region may best be mapped at a 1 to 10 km scale (Burger et al. 2004), the transect-
sized scale (~ 1.5 km) seemed appropriate for analysis.
2.3.2 Location Designation
Location was automatically updated via GPS track as UTM (NAD83) coordinates.
Locations were matched to observations by synchronized time stamps, and later converted into
21 sectors (coded A to X) as designated by Parks Canada seabird surveys along the West Coast
Trail (Fig. 1). For inclusion in analyses sector codes were re-assigned a numeric value, with
code X (southernmost sector) re-assigned a value of 1, and code A (northernmost sector) as 21.
2.3.3 Theodolite Points Theodolite points were automatically recorded as a series of horizontal and vertical
angles. The elevation of the theodolite above sea level (adjusted for tide height) was determined.
Basic trigonometric functions were used to determine a pseudo-Northing and Easting based on
an origin of (0,0) for each recorded point. These false Northings and Eastings were added to the
actual UTM location of the digital theodolite to determine the precise UTM location for every

8
observation (Ronconi and St. Clair 2002). UTM locations could then be directly compared to
determine the distance that the flushed birds travelled.
2.3.4 Statistical Analyses
2.3.4a Parameters and Model Building Variables of group size, distance, angle, response, time, location, boat speed (km/hr), Beaufort
Sea State, swell (m), wind speed (km/h), wind direction, cloud cover (%), precipitation
(presence/absence), and visibility (km) were recorded. Swell, wind speed, wind direction, cloud
cover, precipitation and visibility were subsequently dropped from analyses due to a large
number of missing entries. Date was converted into Julian Date (e.g. 01 Jan = 001, 07 June =
157) and Time to hour of observation. Because the angle of all No Reaction responses was set at
90°, the resulting lack of variation in this value eliminated angle as a variable in any tests
comparing No Reaction response to Dive or Flush responses.
Average prey density was included as an independent variable. These data could only be
recorded at speeds of 10 km/hr due to echosounder constraints. The average bird density
(birds/km2) for Marbled Murrelet, Common Murre, and Rhinoceros Auklet was calculated using
data from the Parks Canada seabird database from the years 1994-2004 for Marbled Murrelet and
1993-1996 for Common Murre and Rhinoceros Auklet. High bird density should reflect areas of
high value to birds (i.e. good foraging areas). Bird density data for Common Murre and
Rhinoceros Auklet did not include sectors A, B, W and X, consequently observations of these
species were excluded for those sections.
Location was retained as a variable to test for spatial effects independent of bird density.
This was especially relevant to Common Murre and Rhinoceros Auklet, as areas of high bird
density may have shifted since the 1993-1996 period. No bird density was available for Pelagic
Cormorant.
As not all variables (e.g. angle, prey density, speed) could be included in one model,
three separate model sets were developed for each species. These model sets tested which
variables or combination of variables best predicted: (1) which parameters elicited any reaction
(Dive or Flush) (the Reaction-No Reaction model); (2) which parameters triggered a reacting
bird to flush rather than dive (the Dive-Flush model); and (3) which parameters triggered a bird
to leave (flush from) an area rather than dive or not react (the Flush-Stay model).

9
All models were run using logistic regression in SPSS 12.0. I defined three sets of a
priori candidate models including univariate models and a global model containing all
parameters and biologically meaningful interactions. All models included parameters of date,
sea state, hour, group size, distance, bird density, location, and interaction of group size by
distance. Boat speed and interactions of distance by speed, and speed by group size were
included in the Reaction-No Reaction and Dive-Flush models. The Dive-Flush model also
included angle, and the Flush-Stay model included prey density and interaction of prey density
by distance. Bird density was not a variable in any of these models involving Pelagic
Cormorants.
2.3.4b Model Selection
An information-theoretic approach facilitated model selection (Burnham and Anderson 2002).
Akaike’s Information Criterion (AIC) was used to assess the relative strength of support for each
model. The second-order Akaike Information Criterion (AICc) was computed for each model as
AICc scores better reflect the strength of each model where n / K < ~ 40 (where K was the
number of parameters). At high sample sizes the AICc values approximate the AIC scores, and
the same result was derived (Burnham and Anderson 2002). AICc was defined as:
AICc = -2(log-likelihood) + 2K + )1()1(2
−−+
KnKK
Before AIC analysis, any observations with missing cases were excluded to ensure all parameters
had an equal sample size. Delta AIC (�i)�and Akaike weights (wi) were calculated as measures
of model strength based on the candidate set of models. Delta AIC values within two score
points of the highest ranked model were considered to have very strong support (Burnham and
Anderson 2002). The Akaike weight provides a probability of a given model being the best
among the candidate set. Evidence ratios were calculated in some cases to compare models. The
evidence ratio is the ratio of the Akaike weight of the model of interest (wj) to the top model (wi).
Parameter estimates are also presented. Parameter estimates include the estimated
coefficient ± standard error (β ± SE) and odds ratio with 95% confidence interval.
2.3.5. Means and Predictive Equations
Mean values are presented ± standard error (SE) unless otherwise stated.
10
Logistic regression equations were used to graph the reaction probability based on
distance, group size, and sea state. The logistic regression equation follows the formula
logit(P) = b0 + b1x1 +… bnxn
Solving for the probability (P), the formula is re-arranged as
P(x) = )(1
1))(( 110 xbbe •+−+
where b is the estimated log-odds ratio (slope), and x is a given value (e.g. 10 m for the distance
equation, 3 individuals for the group size equation).
3. Results 3.1 Disturbance Results
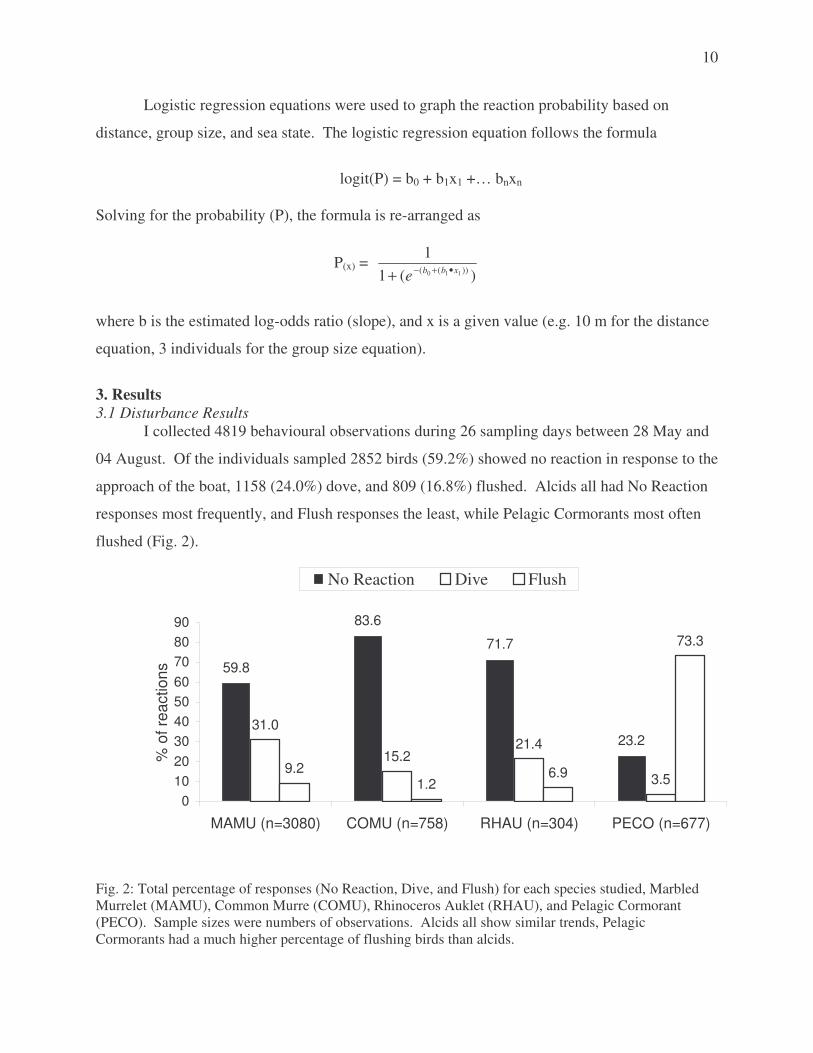
I collected 4819 behavioural observations during 26 sampling days between 28 May and
04 August. Of the individuals sampled 2852 birds (59.2%) showed no reaction in response to the
approach of the boat, 1158 (24.0%) dove, and 809 (16.8%) flushed. Alcids all had No Reaction
responses most frequently, and Flush responses the least, while Pelagic Cormorants most often
flushed (Fig. 2).
31.0
15.221.4
3.59.2
1.26.9
73.3
59.8
23.2
71.7
83.6
0102030405060708090
MAMU (n=3080) COMU (n=758) RHAU (n=304) PECO (n=677)
% o
f rea
ctio
ns
No Reaction Dive Flush
Fig. 2: Total percentage of responses (No Reaction, Dive, and Flush) for each species studied, Marbled Murrelet (MAMU), Common Murre (COMU), Rhinoceros Auklet (RHAU), and Pelagic Cormorant (PECO). Sample sizes were numbers of observations. Alcids all show similar trends, Pelagic Cormorants had a much higher percentage of flushing birds than alcids.

11
Alcids also all had decreasing reactions up to about a 100 m distance from the boat, while
cormorants continued to react strongly at distances greater than 100 m (Fig. 3). Each species
was best considered discretely, both for management purposes and as disturbance predictors may
be unique to the species (and even individual).
0.0
0.1
0.2
0.3
0.4
0.5
0.6
0.7
0.8
0.9
1.0
5 10 20 30 40 50 60 70 80 90 100
110
120 5 10 20 30 40 50 60 70 80 90 100
110
120 5 10 20 30 40 50 60 70 80 90 100
110
120 5 10 20 30 40 50 60 70 80 90 100
110
120
MAMU COMU RHAU PECO
Distance (m)
Res
pons
e P
ropo
rtio
n
Dive Flush No Reaction
Fig. 3: Proportions of responses (No Reaction, Dive, and Flush) for each species studied, Marbled Murrelet (MAMU), Common Murre (COMU), Rhinoceros Auklet (RHAU), and Pelagic Cormorant
(PECO) at approach distances from 5 to 120 metres. Alcids show similar trends, Pelagic Cormorants had a much higher percentage of flushing birds than alcids.
Distances of reaction were similar for all alcids, and the No Reaction and Flush (flight
initiation distance) distances were nearly equal within each bird species studied. The dive
initiation distance for all species was about half that of the flush initiation distance. The angle of
reaction was lower for flushing birds than diving birds (except for Rhinoceros Auklet where it
was equal). Group size was also lower for reacting birds than non-reacting birds. The mean
values for approach distances, group size and approach angles are shown in Table 1.

12
Table 1: Mean distances, group sizes, and angles, ± standard error (SE) for Marbled Murrelet, Common Murre, Rhinoceros Auklet and Pelagic Cormorant for each response type (No Reaction, Dive, and Flush). Non-reacting Birds Diving Birds Flushing Birds A) Marbled Murrelet Distance to Boat (± SE) (m) 42.1 ± 0.5 20.9 ± 0.4 36.3 ± 1.1 Distance to Boat Range (m) 5 - 140 0 – 80 5 – 100 Group Size (± SE) 1.8 ± 0.03 1.5 ± 0.03 1.4 ± 0.04 Angle to Boat (± SE) 90º 44.3 ± 1.0º 40.0 ± 1.8º B) Common Murre Distance to Boat (± SE) (m) 37.4 ± 1.0 26.0 ± 1.9 41.9 ± 11.7 Distance to Boat Range (m) 2 – 150 1 – 100 2 – 90 Group Size (± SE) 1.5 ± 0.09 1.0 ± 0.03 1.2 ± 0.15 Angle to Boat (± SE) 90º 49.5 ± 3.1º 34.8 ± 11.3º C) Rhinoceros Auklet Distance to Boat (± SE) (m) 43.0 ± 1.7 21.8 ± 1.9 38.6 ± 4.0 Distance to Boat Range (m) 5 – 140 2 – 90 10 – 90 Group Size (± SE) 1.7 ± 0.11 1.4 ± 0.15 1.4 ± 0.13 Angle to Boat (± SE) 90º 44.1 ± 3.9º 43.7 ± 5.5º D) Pelagic Cormorant Distance to Boat (± SE) (m) 73.9 ± 2.8 37.9 ± 4.5 72.7 ± 1.4 Distance to Boat Range (m) 10 – 200 10 – 100 10 – 200 Group Size (± SE) 1.2 ± 0.04 1.0 ± 0.00 1.1 ± 0.02 Angle to Boat (± SE) 90º 45.8 ± 7.0º 32.5 ± 1.0º
Results for each focal species are presented below.
3.1.1 Marbled Murrelet A total of 3080 observations of Marbled Murrelets were recorded. Of these, 59.8%
showed no behavioural responses to boat approaches, 31% dove, and 9.2% flushed (Fig. 2). The
mean approach distance is greatest for non-reacting birds, and least for diving birds (Table 1).
Group size and approach angle are highest for non-reacting birds, intermediate for diving birds,
and lowest for flushing birds (Table 1). Increased sea state (Appendix A, Fig. 4) and decreased
group size (Appendix A, Fig. 5) increased Dive and/or Flush responses in all cases. Murrelets
seemed to stop diving at approach distances of 90 m or greater, and stopped flushing at 100 m
(Fig. 3). The modelled reaction equation for distance (Appendix A, Fig. 6) showed that while
50% of birds react at 25 m, this probability dropped to 10% at 70 m, and 0% a 120 m.
Reaction-No Reaction Model According to AICc ranking, the global model and a model excluding location, were the
only ones found to be highly predictive of reaction (Appendix B, Table 2). The Akaike weight
indicated that the global model had a 70.8% chance of being the best among all candidate models
tested. Parameter estimates indicate that the probability of reaction (Dive or Flush) increases

13
with sea state, hour, bird density and location. Increases in date, group size, distance, and
(surprisingly) speed decrease probability of reaction . Of those variables, sea state and group
size had the most significant effect on reaction. For every one incremental increase in sea state,
an individual was 27.4% (odds-ratio = 1.274) more likely to react, and was 23.2% (odds-ratio =
0.768) less likely to react with every increase in group size (Appendix C, Table 3).
Dive-Flush Model The best approximating model for predicting whether a reacting bird would flush
included the variables date, sea state, hour, group size, distance, speed, location and interactions
of distance by speed, group by distance and speed by group (Appendix B, Table 4). It had an
Akaike weight of 0.73, and included neither bird density nor angle of reaction. There was a
positive relationship between flush response and sea state and distance, and a negative
relationship between the variables date, group size, speed and location (Appendix C, Table 5).
In this model the odds-ratio predicting flushing was 1.434 for sea state and 0.824 for group size.
Flush-Stay Model There was substantial evidence for four models within this set (�AICc < 2) (Appendix B,
Table 6). All four models included bird density, sea state, and group size as important predictive
parameters. One model included only these parameters, another included hour, the third added
only fish density, and the fourth included an interaction term between group and distance. The
top-ranked model had an Akaike weight of 0.32, and was the simplest model of that reduced set
(K = 3). The second-ranked model had 12% lower probability of being the best model,
according to the evidence ratio. As the top model also had the highest Akaike weight, included
the fewest parameters, and contained the core parameters present in all models with substantial
evidence, it was assumed to be the best choice. Bird density, sea state and group size were the
best predictors in determining if a murrelet will flush from an area. Marbled Murrelets have a
63.2% greater chance of leaving an area with increases in sea state, and 32.8% lower chance of
leaving an area with increases in group size (Appendix C, Table 7).
3.1.2 Common Murre
A total of 758 observations of Common Murre were recorded from at-sea surveys. Of these,
83.6% showed no behavioural responses to boat approaches, 15.2% dove, and 1.2% flushed (Fig.
2). Mean approach distance was lowest for diving birds (Table 1). Mean approach angle was

14
lowest for flushing birds, and group size lower for reacting birds than non-reacting birds. As
very few Common Murres flushed, variance among parameters concerning flushing was quite
large, and caution was needed in interpreting these results. Sea state increases did not greatly
increase the probability of reaction in murres (Appendix A, Fig. 4). Reaction responses
generally stopped at approach distances greater than 100 m, and the probability equation showed
that while only 30% of birds reacted at immediate distances, this was further reduced to 10% at
70 m (same as for murrelets) (Appendix A, Fig. 6).
Reaction-No Reaction Model According to AICc ranking, three models were worth consideration as the best model.
The highest-ranked model included sea state, group size, distance, speed, hour, date, and bird
density (Appendix B, Table 2). It had a model weight of 0.40 and was 2.3 times more likely than
the second best model. The second-best model was identical but included location as a variable.
The third highest-ranked model had variables sea state, distance, group size, speed, date, hour,
location, and interactions of distance by speed, group by distance, and speed by group. Given
that the highest-ranked model has a greater weighted value, and included the fewest parameters,
it can be assumed that it was the best model out of the candidate set. Group size was the most
predictive univariate parameter as probability of reaction decreased with increased group size by
70.2% (odds ratio = 0.298) (Appendix C, Table 3).
Dive-Flush Model There was a general lack of concordance between models in the dive-flush set for
Common Murre. There was evidence (�AICc < 2) supporting eight of the candidate models.
These eight models had a likelihood of best model ranging from 3.9% to 9.8% (Appendix B,
Table 4). The highest-ranked model used variables distance and group. The next two highest-
ranked models were tied in AICc score and included parameters of distance, group and speed for
one model, and speed, group and distance by group for the other. The highest-ranked model was
only 1.15 times and 1.68 times more likely respectively than the simpler models of distance and
angle, and distance alone. Confidence intervals for all odds-ratio estimates showed that only
distance did not include the value 1 within the interval (95% C.I. = 1.003, 1.062) (Appendix C,
Table 5). The univariate model ‘distance’, though weak, was considered the best approximating
15
model for predicting whether a reacting bird would flush, despite the lower AICc scores of some
models.
Flush-Stay Model There was substantial evidence for five models within this set (�AICc < 2). All five
models included fish density as an important predictive parameter. The highest-ranked model
was univariate. The next four models were bivariate and in order of rank included sea state,
distance, location, and group size (Appendix B, Table 6). The top model was 2.45 times more
likely than the second best model. All confidence intervals for the odds-ratio bound one, but
average prey density appears to be the most significant parameter (Appendix C, Table 7)
predicting if a bird will flush from an area. Increased prey density reduced the likelihood of a
bird fleeing the site.
3.1.3 Rhinoceros Auklet A total of 304 observations of Rhinoceros Auklet were recorded from at-sea surveys. Of
these, 71.7% showed no behavioural responses to boat approaches, 21.4% dove, and 6.9%
flushed (Fig. 2). Rhinoceros Auklets followed the same trends as Marbled Murrelet and
Common Murre, with mean distance being lowest for diving birds, group size being highest for
non-reacting birds, and approach angle being lowest for flushing birds (Table 1). As with the
other alcids, Rhinoceros Auklets had a 10% probability of reaction at 70 m from boats
(Appendix A, Fig 6), and approached 0% reaction probability at 120 m. Similarly, all reaction
responses seemed to cease at distances of more than 100 m based on the raw data (Fig. 3).
Increased reaction probability occurred with smaller group sizes (Appendix A, Fig. 5) and more
severe sea states (Appendix A, Fig. 4).
Reaction-No Reaction Model One model within this set was within two AICc scores of the highest-ranked model, but
another was close enough (AICc = 2.08) to warrant further investigation (Appendix B, Table 2).
The highest-ranked model included sea state, distance, group size, speed and date. The second
highest model included only distance and speed, while the third highest included group size. The
weights of the two highest ranked models were similar (wi = 0.276 and 0.269) and higher than
the third model (wi = 0.098). Distance was included in all three candidate-models. The odds-
ratio confidence interval for distance did not contain 1 (95% confidence interval = 0.947, 0.975).
16
All other parameters bound 1 in their confidence intervals (Appendix C, Table 3). An evidence
ratio between the top and second-best models was only 1.03. ‘Distance and speed’ was
considered the most parsimonious model. Birds were less likely to react with increased distance
and increased speed.
Dive-Flush Model The dive-flush model candidate set contained nine models supported by AICc score.
Distance and speed was the highest-ranked with a 14.2% chance of being the correct model out
of the candidate set. The model ‘speed + group + distance by group + group by speed + distance
by speed’ was the second highest-ranked model, followed by a univariate distance model. With
little additional variation being explained by the inclusion of more parameters, either the distance
or ‘distance + speed’ models were considered best. Distance was the only parameter with a
confidence interval that did not bound 1 (95% C.I. = 1.017, 1.085). The evidence ratio between
the top-model and the distance model was low (1.17). Distance was chosen as the best model for
predicting if reacting birds would flush.
Flush-Stay Model There was substantial evidence for four models within this set (Appendix B, Table 6).
The highest model included variables sea state, distance, group, prey density, date, and a group
by distance interaction. The second highest model contained only the parameters group size and
prey density. All supported models included prey density and group size. The top model had an
Akaike weight of 0.16 versus 0.11 for the second best model. The odds-ratio confidence interval
for hour did not bound 1 (Appendix C, Table 7), but this parameter was not selected in any
models. Prey density and group size were likely the greatest individual predictors, but the model
‘distance + group size + prey density + date + group by distance’ was chosen as the prime model
in the Flush-Stay model set.
3.1.4 Pelagic Cormorant A total of 677 observations of Pelagic Cormorant were recorded from at-sea surveys. Of
these, 23.2% showed no behavioural responses to boat approaches, 3.5% dove, and 73.3%
flushed (Fig. 2). Pelagic Cormorants followed the same pattern in mean distances, group sizes,
and approach angles as the alcids, but cormorants reacted at greater distances, and over a greater
range of distance (Table 1). Diving rates for Pelagic Cormorants were lower at approach

17
distances greater than 50 m, but flushing remained greater than 70% even at distances more than
100 m (Fig. 3). Increased sea state increased probability of reaction (Appendix A, Fig. 4), and
increased group size reduced reaction probability (Appendix A, Fig. 5). The group size affect
was stronger for Pelagic Cormorants than for the alcids.
Reaction-No Reaction Model The global model was the highest-ranked model predicting reaction. It included the
variables sea state, distance, group size, speed, date, hour, location, and the interactions distance
by speed, group by distance, and speed by group. Akaike weight for this model was 0.32.
There was a positive relationship between reaction and sea state (β = 0.27), and a negative
relationship between reaction and hour, group size, and location (β = -0.079 to -0.763)
(Appendix C, Table 3). There was no relationship between date and reaction (β = 0.01).
Changes in group size affected reaction probability greatest, with individuals being 54.4% less
likely to react per unit increase in group size.
Dive-Flush Model The dive-flush model candidate set contained three models with high AICc support
(Appendix B, Table 4). The top model had a model weight of 0.210. It included hour, location,
and distance by group. The third top model differed by including distance. The evidence ratio
between the top and third-highest models was 2.24. The second top model did not include hour
which was a good predictor based on the parameter estimates (expβ = 0.850) (Appendix C, Table
5). The model ‘hour + location + distance by group’ was the best model out of this candidate set.
Flush-Stay Model The two competing models within this set differed by a single parameter. The second
highest-ranking model included distance, group size, prey density, date and group by distance
interaction. The top model also included sea state. The weight of the top model was 0.31
(Appendix B, Table 6). There was substantial evidence to accept the top-model in this case.
Parameter estimates indicate that group size may be the most significant single variable in
predicting cormorants’ decisions to leave an area (expβ = 0.59) (Appendix C, Table 7). Pelagic
Cormorants were 41.4% less likely to leave an area with increases in group size.

18
3.2 Theodolite Surveys Theodolite observation of disturbance events occurred on 12 days between 27 May and
05 August. Flights in response to an approaching boat were tracked from origin to termination
for six Marbled Murrelets and 31 Pelagic Cormorants. For murrelets, the mean flight distance
was 115.84 ± 21.6 m (range 51.0 – 203.7 m) with an average flight time of 40.2 ± 19.7 s (range 8
– 130 s). The time to resume foraging after landing was 65.2 ± 35.4 s (n = 4, range 23.7 – 171.0
s) (Figs. 7 & 8). For cormorants, the mean flight distance was 667.0 ± 120.4 m (range 39.5 –
2922.3 m) with an average flight time of 88.1 ± 15.7 s (n = 28, range 5 – 362 s). Time to resume
foraging after landing was 279.9 s ± 79.8 s (n = 7, range 79.0 – 720.0 s) (Figs. 7 & 8). On eight
occasions (25.8%) Pelagic Cormorants terminated their flights by landing on rocks.
631N =MAMUPECO
Flig
ht D
ista
nce
(m)
1000
500
0
Fig. 7: Box-and-whisker plot showing median (thick line), 25 and 75% quartiles (grey box) and extreme values (whiskers) of flight distance in metres for Pelagic Cormorants (PECO) and Marbled Murrelets (MAMU) based on the theodolite observations from Carmanah Bay. Sample sizes shown are the number of observations.

19
47628N =
Resume Forage (MAMU)
Resume Forage (PECO)
Flight Time (MAMU)
Flight Time (PECO)
Tim
e (s
ec)
400
200
0
Fig. 8: Box-and-whisker plot showing median (thick line), 25 and 75% quartiles (grey box) and extreme values (whiskers) of flight times and time to resume foraging after landing from a flushing event, for Pelagic Cormorants (PECO) and Marbled Murrelets (MAMU) based on the theodolite observations from Carmanah Bay. Sample sizes shown are the number of observations. 4. Discussion
The state of an animal represents the combination of its internal and external
environments as well as its perceived view of these conditions (McNamara and Houston 1996).
Birds in this study were exposed to a single threat (approaching boat) that varied in its risk (e.g.
angle of approach, speed) as perceived by each individual. Thus, results suggested a
combination of species-specific responses and individual state was important in the decisions of
birds to react to boat disturbance.
Alert distance could not be quantified in this study. In some cases, especially for Pelagic
Cormorants, the alert distance of the individual may have been greater than our moment of first
detection. Alert behaviours (e.g. outstretched neck) were observed in many cases indicating that
risk was being assessed before a response was observed. No reaction as categorized in this study
may still be considered a reaction if it alters behaviour from disturbance free conditions (i.e. lost
foraging time). As a No Reaction response in this study cannot be separated from a ‘no reaction’
state, in which the individual was unaffected behaviourally and physiologically, this response

20
was assumed to have no or minimal costs to an individual. Birds that displayed a No Reaction
response were still making a decision based on risk, and this risk assessment likely originated
before the time of response. The dive initiation distance and flight initiation distance may
represent thresholds of risk assessment in which the costs of remaining on the surface outweigh
the costs of fleeing.
Habituation is a potentially confounding factor. At least in some areas murrelets seem to
habituate to boat traffic (McAllister unpubl. data cited by Strachan et al. 1995). Within our
study area habituation could not be tested, as the focal species are all highly mobile, and no data
exist as to foraging site fidelity. Other studies have shown that in some species habituation to
disturbance is minimal (Burger and Gochfeld 1990, Bleich et al. 1994), or that repeated
disturbances may even increase disturbance effects (Dill et al. 1974). Habituation is assumed
negligible in this study, though further investigation into this subject is required.
As all focal species were diving birds that compete for similar resources and share spatial
boundaries, I would expect responses to be similar among species. This trend held for the three
alcids as the majority of responses were categorized as No Reaction. Fewer birds dove, and the
least flushed. Pelagic Cormorants did not display this pattern. Boat disturbance caused the
majority of cormorants to flush with fewer cases of no reactions, and less diving responses being
elicited. Larger species generally react sooner to disturbance events (Rodgers and Schwickert
2002; Fernández-Juricic et al. 2001; Cooke 1980; Humphrey et al. 1987; Holmes et al. 1993;
Skagen et al. 1991). Smaller species may incur heavier costs to fleeing based on greater surface
area to mass ratios (Holmes et al. 1993). Alternatively, or in conjunction, larger species may
have greater perceptual ranges that allow them to detect approaching predators sooner (Kiltie
2000). Cormorants are long-necked species, indicating that detection range may play a role in
reacting to boat approaches. Greater perceptual range provides a mechanism for understanding
how cormorants react sooner, but not why. Availability of suitable alternate habitat plays a key
role in bird reactions to human disturbance (Gill et al. 2001). Pelagic Cormorants may seek
shelter on nearby rocks, an option not available to the other seabirds studied. Greater flushing
distance in cormorants may reflect lower costs of flight, and more option in alternative sites.
Common Murres had the lowest flushing frequency, despite being the largest alcid studied.
Other variables are likely more important in risk assessment for murres (e.g. alternate foraging
sites), and deviations from the size to reaction-distance relationship have been reported by others

21
(Gutzwiller et al. 1998; Fernández-Juricic et al. 2002). Thus, size per se is not a main factor in
responses of these species to boat disturbance, but differences in reactions among species and
between alcids and cormorants were evident.
Within each species the mean distance for No Reaction individuals was about the same as
the flight initiation distance. In all cases dive initiation distance was the lowest. This may
indicate that some flushing threshold was reached, based on a combination of internal and
external conditions at which point a bird decided to flush. In other words, the mean No Reaction
distance represented the distance of flushing tolerance, after which any condition(s) that may
have operated to reduce that distance (e.g. angle of approach) triggered a flush response in some
birds. Diving distances were about half the flushing distances, and generally occurred at larger
approach angles. This may be due to the more direct approach towards birds that eventually
flushed. Birds that dove may not have perceived the boat as an immediate threat, and thus a
flush response would not be warranted. As the boat distance decreased towards birds not directly
in front, the approach angle increased. If the distance was below some distance-threshold level,
a bird would be more likely to dive, but not flush. Although this geometric correlation between
angle and distance seems the most likely explanation for the lower reaction angles of flushing
birds, birds are likely constantly assessing and re-assessing risk. In some cases a bird may base
its reaction decision on two thresholds. The flushing threshold in which a bird chooses to remain
in or leave a site, and a diving threshold in which the bird has a commitment to the location, but
assessed the cost of diving as less than the costs of remaining on the surface. For example, a bird
engorged with food may incur greater energy costs associated with flushing and so the flushing
threshold is not triggered, but the same bird will dive once the boat approach distance crosses the
diving distance-threshold. This may help explain the situation in Rhinoceros Auklets where
approach angles were equal between diving and flushing birds. I refer to this interpretation as
the double-threshold hypothesis.
Comparisons between model sets are confounded by different sample sizes and parameter
combinations, but models predicting whether birds will abandon a site (flush) versus remain in
that patch (dive or not react) were different from parameters predicting whether a reacting bird
will choose to flush or dive. This suggests that a bird was constantly assessing predation risk and
re-evaluating the cost-benefit dynamic.

22
4.1 Parameter Effects Date
On its own date had no significance. As a variable date was supported only in the more
complex models, and likely relates to temporal changes in other factors. These factors may have
included chick-rearing periods or prey movement cycles. Coefficients and odds ratio confidence
interval values indicated a neutral relationship with date for all models.
Sea state Sea state when significant in a model, was often a strong predicting variable. The
relationship between sea state and probability of reaction or flushing was positive, i.e., increases
in sea state increased reaction and flushing responses. Since sea state and wind speed are
positively correlated, increases in sea state correspond to increases in wind speed. Birds on the
water may gain lift quicker and incur less energetic costs in windier conditions. Additionally,
monitoring of an approaching boat may be more difficult for birds in rougher sea conditions,
increasing the perceived risk to the birds.
Time of Day Hour had both positive and negative predictive relationships depending on the model it
was present in. When hour was positively related to disturbance or flushing events, birds might
have been reacting under a heightened awareness state due to diurnal predators (e.g. Bald Eagle
(Haliaeetus leucocephalus, Peregrine Falcon Falco peregrinus), or because they had acquired
enough prey resource earlier in the day that reacting was not as energetically stressing. Birds
that reacted less later in the day may have done so due to energetic demands. A bird that had lost
foraging opportunities earlier in the day, had not located adequate resources, or was trying to
locate fish before returning to a nest site may have appeared more tolerant to boat disturbance as
the day progressed.
Group Size In all models that included group size, it was a significant predictor of a reaction or Flush
response. In those cases reaction or flushing response decreases with increasing group size.
Decreased vigilance per individual with increasing group size has been well documented for
many social animals (reviews by Elgar 1989; Lima and Dill 1990; Quenette 1990; Roberts
1996). Pulliam (1973) suggested that predator detection likelihood increases with increased

23
flock size, and this has been demonstrated in field experiments (Elgar 1989). Roberts (1996)
reviewed cases in which individual risk was less in larger groups (in part through greater
predator detection), such as through dilution effects. Group size may be associated with prey
concentrations in Marbled Murrelets (Strachan et al. 1995) and other seabirds off Vancouver
Island (Porter and Sealy 1981, 1982). Although larger groups of seabirds may congregate in
areas of higher prey abundance, decreased vigilance rates do not necessarily confer greater
successful foraging rates (Cresswell 1994; Roberts 1996). Groups of birds may flush less if the
individuals in the group wish to remain together (e.g. mated pairs). Individuals in groups could
flush simultaneously, but the separation of birds after flight was sometimes observed (potentially
a predator avoidance strategy). Increased predator detection rate and decreased predation risk to
the individual may explain the reduced reaction rates of groups of birds. As flushed birds could
fly together, high patch quality may be the cause of reduced flushing rates for groups of birds in
this study.
Distance The effects of distance between the birds and the approaching boat showed contradicting
results. Intuitively a closer distance should cause a bird to react more strongly (either a reaction
in the Reaction-No reaction models, or a flush in the Dive-Flush or Flush-Stay models), as
predation risk would be greater. This was supported in all of the Reaction-No reaction models,
and by previous studies (e.g. Pierce et al. 1993; Ronconi and St. Clair 2002). Increases in
distance conversely increase flushing probability in all of the dive-flush models. This can be
interpreted based on greater distances having lower approach angles. Alternatively, the double-
threshold hypothesis may be considered, where a bird that was stimulated by the first distance-
threshold (which occurs at greater distances) would be more likely to have flushed than a bird
that decided to remain. Birds that remained might have had greater investment in the site,
decreasing the probability of fleeing, even as approach distances decreased.
Some birds reacted to an approaching boat by moving away from the boat without diving
or flushing. They may have been moving to a distance considered safe. Distance is not
necessarily independent of reaction, but rather the distance from the boat may cause the response
chosen by the bird.

24
Speed The influence of boat speed as a predicting variable was weak at best. This may be due
to the heavy bias towards sampling at 10 km/hr. Previous work has shown that disturbance
effects of boats increase with increasing speed (Burger 1998). There was a very weak negative
relationship between speed and reaction probability, but interpreting this result in terms of
predicting bird reaction would likely be erroneous. The interactions between speed and approach
distance were found to be significant, even when boat speed alone was not a significant
predictor. This result suggests that speed increased reaction probability, but this increase was
greatest at closer approach distances. This mirrors the result found for Black Guillemots
(Cepphus grille) by Ronconi and St. Clair (2002). Lafferty (2001) found that faster approach
speeds (i.e. joggers) were less disturbing to Snowy Plovers than slower approach speeds (i.e.
walkers). Slower speeds may indicate active prey searching or pursuit (i.e. stalking) by the
predator to some species (Frid and Dill 2002).
Bird Density High bird density among the 21 coastal sectors in our study area should reflect areas of
higher foraging or resting suitability. Although weak, higher bird density increased the
probability of both reactions and flush response. This may have been due to density-dependent
factors, such as competition between individuals, which reduces the quality of the site.
Alternatively birds in high density areas may have been in better condition, and thus could afford
to flee the site more readily (Gill et al. 2001; Beale and Monaghan 2004), or may have been
reacting based on other birds being disturbed in the same area. Bird densities for Marbled
Murrelet, Common Murre, and Rhinoceros Auklet were calculated based on averages of previous
years’ surveys. Lack of predictive power may either reflect truly on bird density effect, or a
difference in density or distributions of birds between the study period and previous survey
years.
Location Location as a variable tested for coarse spatial differences in reactions along the survey
routes. Location was entered based on sector codes, though sectors differed in length. A
positive relationship suggests that reaction or flushing response increases as one moves from
south to north along the study area. Northern regions often had rougher sea conditions, and may
be correlated with parameters previously described. Spatial effects varied among species and

25
models, though location was only significant on its own in three cases. Marbled Murrelets were
more likely to react, but less likely to flush, and Pelagic Cormorants were less likely to react, in
the northern locations.
Average Prey Density Average prey density could only be incorporated into the Flush-Stay model as
echosounder use was limited to a constant low speed of travel. Prey density was an index of
patch quality. Negative relationships between flushing from a site and prey density may reflect
the benefit to an individual of remaining in a patch of high quality. This may be especially
apparent for species that feed on highly mobile or concentrated prey (Gill et al. 2001), as was the
case for these waterbirds. Positive relationships may reflect the greater physical condition of
individuals within high quality patches allowing an escape response without detriment to the
fitness of that individual. Because seabird-prey associations are sensitive to scale (Burger et al.
1994), analyses on different scales may have yielded different results. Prey density was not
significant on its own for any species, and had a negative relationship only with Common Murre.
The inclusion of this term in many of the top candidate models for all species indicates that in
combination with other factors, prey density is an important variable, though its effects are
difficult to interpret.
Angle Angle of approach can influence reaction and more direct approaches should purvey
greater predation risk, and therefore trigger greater flight initiation distances (Burger and
Gochfeld 1990; Burger and Gochfeld 1981; Walther 1969). Angles of 0° necessarily caused a
reaction (failure to react would have led to collision), while all no reactions were default to 90°
angles of approach. Without variation in angle for non-reacting birds, it could only be included
in the dive-flush model. Shallower angles were expected to elicit more energetically costly
responses due to assumed increase in predation risk. Angle was not found in any top model. Its
occurrence in models within 2 AICc scores of top-models indicates that it does have some
influence. As approach angle increased, individuals were less likely to flush. Its use in the
models was confounded by the geometric correlation with approach distance (i.e. angle increases
as approach distance decreases) (Bulova 1994; Frid and Dill 2002). An individual may assess

26
angle during an initial response decision, and angle could be significant in that decision, despite
its lack of importance in these results and geometrical correlation with distance.
4.2 Species-Specific Responses
4.2.1 Marbled Murrelets Marbled Murrelets appear to base their decision to react on a combination of all
parameters and interactions tested. Of birds that reacted to an approaching boat, all parameters
and interactions except murrelet density applied. In deciding to leave or stay at a site, bird
density, sea state and group size are important predictors.
Sea state and group size were the strongest univariate predictors in all three model-sets.
In all cases Dive and/or Flush responses increased with increasing sea state and decreasing group
size. The few flushing events that were tracked in Carmanah Bay with the theodolite suggested
that Marbled Murrelets were not flying far, and generally resumed foraging fairly quickly.
Although the sample size for those results was small, it may indicate that flushed birds still had a
commitment to the site they were at.
Our results of reaction proportions were similar to those reported by others (C. Strong,
unpubl. data cited by Strachan et al. 1995). Strong found 23.4% of birds dove and 15.4%
flushed, versus 31% and 9.2% in our study, respectively.
A recent study has suggested that single foraging Marbled Murrelets may represent
breeding individuals during the incubation phase (Mack et al. 2004). If the hypothesis of group
size as an index of productivity was true, then boat disturbance could have disproportionate
fitness costs affecting reproductive individuals, especially as our study found that single birds
were more likely to react to boat disturbance.
Carter and Sealy (1990) reported that foraging groups of three or more birds did not dive
together in any coordinated pattern. The observations in this study of synchronous diving by
groups of Marbled Murrelet supports the assumption that birds were diving in response to the
boat disturbance as opposed to regular foraging dives.
4.2.2 Common Murre
According to the models, Common Murres seem to react based on many of the
parameters tested, but specific variables in determining their flush response (distance and speed
in the Dive-Flush model). Reacting birds were more likely to flush at greater distances than
dive. Average prey density best predicted site abandonment with higher prey density reducing
27
flushing probability. Caution should be used in interpreting these results. Only 1.2% (or 9
individuals) of Common Murres flushed. Average prey density may partially explain why
Common Murre flush, but further research on this question would be needed.
Group size and distance are the most significant univariate parameters predicting
reaction, though single murres have a much lower reaction probability than single birds of the
other species. Reaction responses generally stopped at distances greater than 100 m.
4.2.3 Rhinoceros Auklet
Distance and speed were the best predictors in auklet reaction behaviour according to the
models. There was an increase in reaction probability as distance decreases. Among reacting
birds increased distance predicted increased flushing probability. Again, either the geometric
correlation between angle and distance, or the double-threshold hypothesis could be invoked to
explain this. Approach angles were equal between diving and flushing birds, supporting the
double-threshold explanation in this case. Rhinoceros Auklets appear to have based site
abandonment decisions on a greater number of variables, including group size and average prey
density than the other species considered in our study. Although little confidence exists for those
two parameters individually, auklets appear to abandon sites more often when in smaller groups,
or where there is greater prey density
As with the other alcids, Rhinoceros Auklets reaction probability declined to 10% at 70
m from our boat. Similarly, all reaction responses seem to stop at distances of more than 100 m.
4.2.4 Pelagic Cormorants As with murrelets and murres, Pelagic Cormorants appear to be influenced by a large
number of parameters in reacting to an approaching boat. Most Pelagic Cormorants reacted to an
approaching boat (76.8%). The high proportion of reactions might indicate that the threshold
level at which these parameters elicit a response was much lower than in alcids. However, dive
distance was still about half that of flush distance, as was true for alcids. The angle-distance
relationship is the most parsimonious explanation for this trend for this species, especially as
only 3.5% of cormorants dove.
As time of day increased, the probability of flushing decreased. Time of day did not
predict if a cormorant would abandon a site in comparison with remaining (diving or not
reacting). Sea State, prey density and group size were among the factors that did. Of these,

28
group size was the greatest predictor. Prey density increases may increase probability of patch
abandonment. Again this may be a function of individual condition.
Unlike the alcids, reaction probability remained high even at large distances. Diving
rates became negligible at distances greater than 50 m, but flushing rate remained greater than
70% even at distances greater than 100 m.
As well as flushing more and reacting at greater distances, cormorants tracked in
Carmanah Bay flew much further distances (667 m) than Marbled Murrelets, and took longer to
resume foraging (longer than 4 mins). Some cormorants landed on rocks after flushing.
Disturbance effects are greater for Pelagic Cormorants than any of the alcid species studied.
4.3 Conservation Implications Traditionally buffer zones and set-back distances have been applied to some areas where
boat disturbance occurs (Erwin 1989; Rodgers and Smith 1995, 1997; Rodgers and Schwikert
2002; Carney and Sydeman 1999; Blumstein et al. 2002). These buffers are calculated based on
the tolerance to disturbance as measured by flight initiation distance. Improved buffer zones
incorporate alert distance as a more conservative measure of disturbance, further reducing any
potential fitness (and population-level) consequences of disturbance (Rodgers and Smith 1995,
1997; Fernández-Juricic et al. 2001). The expanding literature suggests that traditional methods
of quantifying disturbance may not accurately reflect disturbance impacts (Gill et al. 2001; Beale
and Monaghan 2004). Thorough investigation into individual energy costs and population-level
responses is encouraged for a complete understanding of disturbance impacts on these species.
Such data do not yet exist for Pacific alcids or Pelagic Cormorants, or indeed most waterbirds at
sea. Recreational boat-disturbance impacts are not even acknowledged in most literature
describing potential conservation concerns for this group of birds. This remains an important
data gap as human populations increase along the coast, along with increased recreational boat
use.
The large difference in predictive parameters among and within species depending on
reaction of the birds was indicative that individuals assess risk based not only on the perceived
threat, but also on environmental conditions, site characteristics, and probably also individual
state. These conditions will vary spatially and temporally. A number of recommendations can
be made based on the data from this study.

29
All alcids have a 10% probability of reaction at 70 m from our boat, and appear to stop
reacting at about 100 m. The predictive equation predicts reaction probability approaches 0% at
120 m. Buffers of a minimum distance of 100 m would be effective in reducing the boat
disturbance effects to birds. In rougher sea conditions (Beaufort scale 3 or higher) an increased
buffer distance of 150 m may be necessary. In cases, such as for Pelagic Cormorants, birds may
react before visual detection by a boat-based human observer is possible. At 150 m over 60% of
cormorants were still predicted to react. For this species keeping a maximum distance
(minimum 200 m) from cormorants would be the best buffer distance. For all species, and
especially when a buffer distance is not met, direct approaches should be avoided, specifically
approach angles less than 45º.
As there was little evidence that speed on its own had an impact, limits to this parameter
would not be necessary. The interaction of speed by distance was significant in most cases. If
buffer zones were met, speed again would not be a strong disturbance factor, but birds may react
more to faster boats at close distances. Date, hour and location, though included in some models,
are also weak predictors of disturbance. Time of day, time of year, or location restrictions would
also not be necessary based on these data. However, time of year should still be considered in
management recommendations, to reduce impacts during the breeding phase.
Although groups of birds react less to boat disturbance, the buffer zone should be the
same as for individual birds. This reduces the boat disturbance effects in areas of high patch
quality, eliminates the need for multiple buffer zones which may be difficult for the public to
remember, and is a protective measure for these birds if the bird disturbance effects do not
adequately reflect the disturbance impacts (Gill et al. 2001).
The consistency of pattern between all species indicates that a constant management plan
can be invoked for all species studied, and that this recommendation should be based on the most
sensitive species. A general buffer of 200 m would eliminate most boat disturbance effects on
alcids, and reduce the effects on cormorants. Without thorough knowledge of the impacts of
disturbance at the population-level, these guidelines would reduce effects to individuals, which
would likely have population-level benefits.
A more conservative approach would be to implement exclusion zones for recreational
boat traffic. As areas of high patch quality may vary temporally and spatially (e.g. shift due to
sea surface temperature changes), defining one or few set areas would be difficult. An exclusion

30
zone running along the length of the shoreline of the West Coast Trail out to 1 km offshore
would be adequate. Outside this zone individual buffer zones could still be set in place. Beyond
1 km from shore Common Murre was the most commonly encountered species studied, and is
also the most tolerant to boat disturbance. This exclusion zone could be seasonal, occurring
during periods of greater stress to the birds (i.e. breeding season), and/or during seasons of high
boat traffic, as occurs off southwestern Vancouver Island during the summer months.
Most boat traffic off the West Coast Trail is due to recreational fishers. Three Rockfish
Conservation Areas already exist along the West Coast Trail (Fisheries and Oceans Canada
2006) that exclude most recreational fishing (though not boating). Some of these conservation
areas extend greater than 1 km offshore. Thus, a further closure should not greatly disrupt
recreational fishing. As this study took place within and near the boundaries of a national park,
exclusion zones could be implemented in accordance with the Parks Canada Agency Act to
“manage visitor use and tourism to ensure…the maintenance of ecological integrity…” (Parks
Canada Agency Act 1998). Furthermore, Marbled Murrelets are protected under the Canada
Species at Risk Act (SARA), and nest in watersheds adjacent to the Pacific Rim National Park
Reserve. Buffer or exclusion zones thus can be established for the conservation of species, and
in meeting of Department of Fisheries and Oceans, Parks Canada, and endangered species
legislations in waters off the West Coast Trail unit of Pacific Rim National Park Reserve.
5. Conclusion
This study provides the first in-depth examination of boat disturbance effects of Pacific
alcids and at-sea Pelagic Cormorants. The dive initiation distance was proposed as a
complementary measure to flight initiation distance for diving birds. Results of this study are a
good benchmark for future, more explanatory studies, into boat disturbance impacts. Species
appear to react to boat disturbances based on different combinations of parameters. Response
trends still hold among species, with alcids reacting similarly, and cormorants reacting at much
greater distances. Responses seem to increase in rougher sea conditions and in lower group
sizes. A buffer distance of 150 m would reduce most disturbance effects to alcids, especially in
rougher seas or to lone birds. Minimum distances of 200 m are necessary for cormorants.
Approach angles less than 45º should also be avoided. As cormorants may react to boats before
detection by human observers, exclusion zones may more adequately reduce disturbances to
cormorants and other species.

31
References Cited Ackerman, J.T., J.Y. Takekawa, K.L. Kruse, D.L. Orthmeyer, J.L. Yee, C.R. Ely,
D.H. Ward, K.S. Bollinger, and D.M. Mulcahy. 2004. Using radiotelemetry to monitor cardiac response of free-living Tule Greater White-fronted Geese (Anser albifrons elgasi) to human disturbance. Wilson Bulletin 116:146-151.
Anderson, D.W. and J.O. Keith. 1980. The human influence on seabird nesting success: conservation implications. Biological Conservation 18:65-80. Beale, C.M., and P. Monaghan. 2004. Behavioural responses to human disturbance: a matter of choice? Animal Behaviour 68:1065-1069. Bélanger, L. and J. Bédard. 1989. Responses of staging greater snow geese to human Disturbance. Journal of Wildlife Management 53:713-719. Bleich, V.C., R.T. Bowyer, A.M. Pauli, M.C. Nicholson, and R.W. Anthenes. 1994. Mountain sheep (Ovis canadensis) and helicopter surveys: ramifications for the conservation of large mammals. Biological Conservation 70:1-7. Blumstein, D.T., L.L. Anthony, R. Harcourt, and G. Ross. 2003. Testing a key assumption of wildlife buffer zones: is flight initiation distance a species- specific trait? Biological Conservation 110:97-100. Brown, A.L. 1990. Measuring the effect of aircraft noise on sea birds. Environmental International 16:587-592. Bulova, S.J. 1994. Ecological correlates of population and individual variation in
antipredator behavior of two species of desert lizards. Copeia 1994:980-992. Burger, J. 1981. The effect of human activity on birds at a coastal bay. Biological Conservation 21:231-241. Burger, J. 1983. Jet aircraft noise and bird strikes: why more birds are being hit. Environmental Pollution 30:143-152. Burger, J. 1998. Effects of motorboats and personal watercraft on flight behavior
over a colony of common terns. Condor 100:528-534. Burger, J., and M. Gochfeld. 1990. Risk discrimination of direct versus tangential approach by basking black iguanas (Ctenosaura similis): varation as a function of human exposure. Journal of Comparative Physiology 104:388
-394.
Burger, J., and M. Gochfeld. 1991a. Human activity influence and diurnal and nocturnal foraging of Sanderlings (Calidris alba). Condor 93:259-265.

32
Burger, J., and M. Gochfeld. 1991b. Human distance and birds: tolerance and
response distances of resident and migrant species in India. Environmental Conservation 18:158-165.
Burger, A.E., C.L. Hitchcock, and G.K. Davoren. 2004. Spatial aggregations of seabirds and their prey on the continental shelf off SW Vancouver Island. Marine Ecology Progress Series 283:279-292. Burnham, K.P., and D.R. Anderson. 2002. Model selection and inference: a practical information-theoretic approach. Springer-Verlag, New York. Cairns, D.K., R.L. Dibblee, and P.-Y. Daoust. 1998. Displacement of a large double- crested cormorant colony, Phalacrocorax auritus, colony following human disturbance. Canadian Field-Naturalist 112:520-522. Carney, K.M. and W.J. Sydeman. 1999. A review of human disturbance effects on nesting colonial waterbirds. Waterbirds 22:68-79. Carter, H.R., and S.G. Sealy. 1990. Daily foraging behavior of marbled murrelets. In Spencer, S.G., ed. Auks at sea. Studies in Avian Biology 14:93-102. Cooke, A.S. 1980. Observations on how close certain passerine species will tolerate an approaching human in rural and suburban areas. Biological Conservation 18:85-88. Cresswell, W. 1994. Flocking is an effective anti-predation strategy in redshanks, Tringa totanus. Animal Behaviour 47:433-442. Delaney, D.K., T.G. Grubb, P. Beier, L.L. Pater, and H. Reiser. 1999. Effects of helicopter noise on Mexican Spotted Owls. Journal of Wildlife Management 63:60-76. Dill, L.M. 1974. The escape response of the zebra danio (Brachydanio rerio). II. The effect of experience. Animal Behaviour 22:723-730. Elgar, M.A. 1989. Predator vigilance and group size in mammals and birds: a
critical review of the empirical evidence. Biol. Rev. 64:13-33. Erwin, R.M. 1989. Responses to human intruders by birds nesting in colonies: experimental results and management guidelines. Colonial Waterbirds 12: 104-108. Fernández-Juricic, E., and J.L. Telleria. 2000. Effects of human disturbance on blackbird (Turdus merula) spatial and temporal feeding patterns in urban parks of Madrid (Spain). Bird Study 47:13-21.

33
Fernández-Juricic, E., M.D. Jimenez, and E. Lucas. 2001. Alert distance as an alternative measure of bird tolerance to human disturbance: implications for park design. Environmental Conservation 28:263-269. Fernández-Juricic, E., M.D. Jimenez, and E. Lucas. 2002. Factors affecting intra- and inter-specific variations in the difference between alert distances and flight distances for birds in forested habitats. Canadian Journal of Zoology 80:1212-1220 Fisheries and Oceans Canada. 2006. Rockfish Conservation Areas [ONLINE] http://www-comm.pac.dfo-mpo.gc.ca (14 April 2006). Frid, A., and L.M. Dill. [ONLINE]. 2002. Human-caused disturbance stimuli as a
form of predation risk. Conservation Ecology 6:11. http://www.consecol.org/vol6/iss1/art11 (10 May 2005).
Forbes, S.T., and O. Nakken. eds. 1972. Manual of methods for fisheries resource survey and appraisal. Part 2. The use of acoustic instruments for fish detection and abundance estimation. FAO Manuals Fisheries Sci. No. 5. United Nations, Rome. Fowler, G.S. 1999. Behavioural and hormonal responses of Magellanic penguins (Spheniscus magellanicus) to tourism and nest site visitation. Biological Conservation 90:143-149. Galicia, E., and G.A. Baldassarre. 1997. Effects of motoroized tourboats on the behavior of non-breeding American flamingos in Yucatan, Mexico. Conservation Biology 11:1159-1165. Gill, J.A., and W.J. Sutherland. 2000. Predicting the consequences of human disturbance from behavioural decisions. Pages 51-64 in L. M. Gosling and W. J. Sutherland, eds. Behaviour and Conservation. Cambridge University Press, Cambridge, UK. Gill, J.A., W.J. Sutherland, and A.R. Watkinson. 1996. A method to quantify the
effects of human disturbance on animal populations. Journal of Applied Ecology 33:786-792.
Gill, J.A., K. Norris, and W.J. Sutherland. 2001. Why behavioural responses may not
reflect the population consequences of human disturbance. Biological Conservation 97:265-268.
Grubb, T.G., and R.K. King. 1991. Assessing human disturbance of breeding Bald Eagles with classification tree models. Journal of Wildlife Management 55: 500-511.

34
Gutzwiller, K.J., H.A. Marcum, H.B. Harvey, J. Roth, and S.H. Anderson. 1998. Bird
tolerance to human intrusion in Wyoming Montane Forests. Condor 100:519-527. Hill, D., D. Hockin, D. Price, G. Tucker, R. Morris, and J. Treweek. 1997. Bird disturbance: improving the quality and utility of disturbance research. Journal of Applied Ecology 34:275-288. Hockin, D., M. Ounsted, M. Gorman, D. Hill, V. Keller, and M. Barker. 1992. Examination of the effects of disturbance on birds with reference to the role of
environmental impact assessments. Journal of Environmental Management 36:253-286. Holmes, T.L., R.L. Knight, L. Stegall, and G.R. Craig. 1993. Responses of wintering grassland raptors to human disturbance. Wildlife Society Bulletin 21:461-468. Humphrey, P.S., B.C. Livezey, and D. Siegel-Causey. 1987. Tameness of birds of the Falkland Islands: an index of preliminary results. Bird Behaviour 7:67-72. Keller, V. 1991. The effect of disturbance from roads on the distribution of feeding sites on geese wintering in northeast Scotland. Ardea 79:229-231. Klein, M.L. 1993. Waterbird behavioral responses to human disturbances. Wildlife Society Bulletin 21:31-39. Kiltie, R.A. 2000. Scaling of visual acuity with body size in mammals and birds. Functional Ecology 14:226-234. Kuletz, K.J. 1996. Marbled murrelet abundance and breeding activity at Naked Island, Prince William Sound, and Kachemak Bay, Alaska, before and after the Exxon Valdez oil spill. American Fisheries Society Symposium 18:770-784.
Lafferty, K. 2001. Disturbance to wintering western snowy plovers. Biological Conservation 101:315-325. Lima, S. L. 1998. Stress and decision making under the risk of predation: recent
developments from behavioural, reproductive, and ecological perspectives. Advances in the Study of Behavior 27:215-290.
Lima, S.L. and L.M. Dill. 1990. Behavioural decisions made under the risk of predation. Canadian Journal of Zoology 68:619-640. Mack, D.E., M.G. Raphael, F. Cooke, and C. Thiessen. 2004. Marbled murrelet group size at sea as an index to productivity. Northwestern Naturalist 85:1-10. McNamara, J.M., and A.I. Houston. 1996. State-dependent life histories. Nature 380: 215-221.

35
Mikola, J., M. Miettinen, E. Lehikoinen, and K. Lehtila. 1994. The effects of disturbance caused by boating on survival and behaviour of velvet scoter Melanitta fusca ducklings. Biological Conservation 67:119-124. Nimon, A.J., R.C. Schroter, and B. Stonehouse. 1995. Heart rate of disturbed
penguins. Nature 374:145. Nisbet, I.C.T. 2000. Disturbance, habituation and management of waterbird colonies – commentary. Waterbirds 23:312-332. Parks Canada Agency Act. 1998, c. 31. Consolidated statutes and regulations. [ONLINE] http://lois.justice.gc.ca. (17 March 2006). Pfister, C., B.A. Harrington, and M. Lavine. 1992, The impact of human disturbance
on shorebirds at a migration staging area. Biological Conservation 60:115-126. Piatt, J.F. 1990. The aggregative response of common murres and Atlantic puffins to schools of capelin. Studies in Avian Biology 14:36-51. Pierce, G.J., C.J. Spray, and E. Stuart. 1993. The effect of fishing on the distribution and behaviour of waterbirds in the Kukut area of Lake Songkla, Southern Thailand. Biological Conservation 66:23-34. Porter, J.M. and S.G. Sealy. 1981. Dynamics of seabird multi-species feeding flocks: chronology
of flocking in Barkley Sound, British Columbia in 1979. Colonial Waterbirds 4: 104-113. Porter, J.M. and S.G. Sealy. 1982. Dynamics of seabird multispecies feeding flocks: age-related
feeding behaviour. Behaviour 81:91-109. Pulliam, H.R. 1973. On the advantages of flocking. Journal of Theoretical Biology 38:419-422. Quenette, P.-Y. 1990. Functions of vigilance in mammals: a review. Acta
Oecoligia 11:801-818.
Rees, E.C., J.H. Bruce, and G.T. White. 2005. Factors affecting the behavioural responses of whooper swans (Cygnus c. cygnus) to various human activities. Biological Conservation 121:369-382. Roberts, G. 1996. Why individual vigilance declines as group size increases. Animal Behaviour 51:1077-1086. Roberts, G., and P.E. Evans. 1993. Responses of foraging Sanderlings to human approaches. Behaviour 126:29-43.
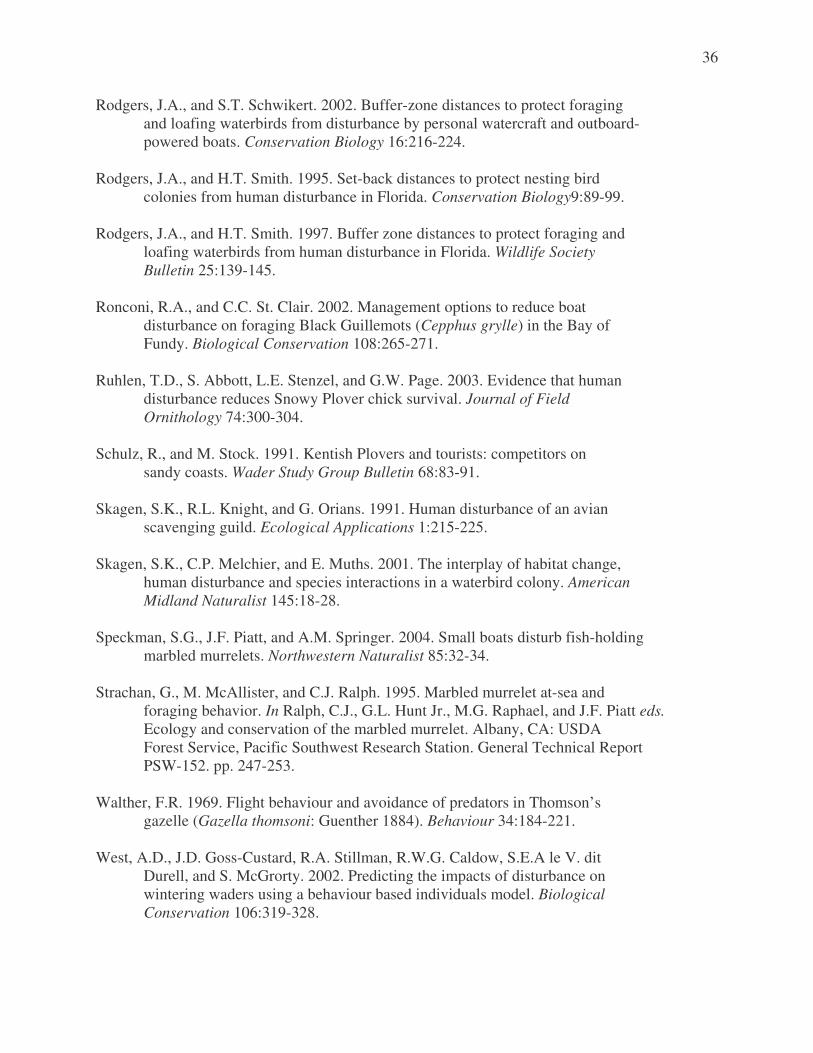
36
Rodgers, J.A., and S.T. Schwikert. 2002. Buffer-zone distances to protect foraging and loafing waterbirds from disturbance by personal watercraft and outboard- powered boats. Conservation Biology 16:216-224. Rodgers, J.A., and H.T. Smith. 1995. Set-back distances to protect nesting bird colonies from human disturbance in Florida. Conservation Biology9:89-99. Rodgers, J.A., and H.T. Smith. 1997. Buffer zone distances to protect foraging and loafing waterbirds from human disturbance in Florida. Wildlife Society Bulletin 25:139-145. Ronconi, R.A., and C.C. St. Clair. 2002. Management options to reduce boat
disturbance on foraging Black Guillemots (Cepphus grylle) in the Bay of Fundy. Biological Conservation 108:265-271.
Ruhlen, T.D., S. Abbott, L.E. Stenzel, and G.W. Page. 2003. Evidence that human disturbance reduces Snowy Plover chick survival. Journal of Field Ornithology 74:300-304. Schulz, R., and M. Stock. 1991. Kentish Plovers and tourists: competitors on sandy coasts. Wader Study Group Bulletin 68:83-91. Skagen, S.K., R.L. Knight, and G. Orians. 1991. Human disturbance of an avian scavenging guild. Ecological Applications 1:215-225. Skagen, S.K., C.P. Melchier, and E. Muths. 2001. The interplay of habitat change, human disturbance and species interactions in a waterbird colony. American Midland Naturalist 145:18-28. Speckman, S.G., J.F. Piatt, and A.M. Springer. 2004. Small boats disturb fish-holding marbled murrelets. Northwestern Naturalist 85:32-34. Strachan, G., M. McAllister, and C.J. Ralph. 1995. Marbled murrelet at-sea and
foraging behavior. In Ralph, C.J., G.L. Hunt Jr., M.G. Raphael, and J.F. Piatt eds. Ecology and conservation of the marbled murrelet. Albany, CA: USDA Forest Service, Pacific Southwest Research Station. General Technical Report PSW-152. pp. 247-253.
Walther, F.R. 1969. Flight behaviour and avoidance of predators in Thomson’s gazelle (Gazella thomsoni: Guenther 1884). Behaviour 34:184-221. West, A.D., J.D. Goss-Custard, R.A. Stillman, R.W.G. Caldow, S.E.A le V. dit
Durell, and S. McGrorty. 2002. Predicting the impacts of disturbance on wintering waders using a behaviour based individuals model. Biological Conservation 106:319-328.

37
Wilson, R.P., and B. Culik. 1995. Penguins disturbed by tourists. Nature 376: 301-302.
Ydenberg, R.C., and L.M. Dill. 1986. The economics of fleeing from predators. Advances in the Study of Behavior 16:229-249.

38
Appendix A: Predictive Equation Graphs
0
0.1
0.2
0.3
0.4
0.5
0.6
0.7
0.8
0.9
0 0.5 1 1.5 2 2.5 3Beaufort Sea State
Rea
ctio
n P
roba
bilit
y
MAMU COMU RHAU PECO
Fig. 4: Reaction (dive/flush) probability as a function of approach distance based on a predictive logistic regression equation (see methods) for the four focal species: Marbled Murrelet (MAMU), Common Murre (COMU), Rhinoceros Auklet (RHAU) and Pelagic Cormorant (PECO). Increased sea state increased reaction probability for all species, except Common Murre, which remained constant.

39
0
0.1
0.2
0.3
0.4
0.5
0.6
0.7
0.8
0.9
1 3 5 7 9 11 13 15 17 19
Group Size
Rea
ctio
n P
roba
bilit
y
MAMU COMURHAU PECO
Fig. 5: Reaction (dive/flush) probability as a function of group size based on a predictive logistic regression equation (see methods) for the four focal species: Marbled Murrelet (MAMU), Common Murre (COMU), Rhinoceros Auklet (RHAU) and Pelagic Cormorant (PECO). Cormorants have a greater rate of decline in reaction probability with increased group size than do the alcids.
0
0.1
0.2
0.3
0.4
0.5
0.6
0.7
0.8
0.9
0 20 40 60 80 100 120 140 160
Distance (m)
Rea
ctio
n P
roba
bilit
y
MAMU COMURHAU PECO
Fig. 6: Reaction (dive/flush) probability as a function of approach distance based on a predictive logistic regression equation (see methods) for the four focal species: Marbled Murrelet (MAMU), Common Murre (COMU), Rhinoceros Auklet (RHAU) and Pelagic Cormorant (PECO). Alcids all follow a similar trend and reach 10% reaction probability at 70 m. Cormorants retain high reaction probabilities at long distances.

40
Appendix B: Top 5 Candidate Models for the Three Model-Sets for Each Species Table 2: Top 5 candidate logistic regression models for predicting reaction behaviour (Reaction-No Reaction model) in Marbled Murrelets, Common Murres, Rhinoceros Auklets, and Pelagic Cormorants.
Model Parametersa -2 Log likelihood
�b wi
c �AICc
A) Marbled Murrelet SS + Dist + Grp + Spd + Date + Hr + Bird + Loc + Dist x Spd + Grp x Dist + Spd x Grp*
3429.53 11 0.71 0
SS + Dist + Grp + Spd + Date + Hr + Bird + Dist x Spd + Grp x Dist + Spd x Grp
3433.38 10 0.28 1.84
SS + Dist + Grp + Spd + Date + Dist x Spd + Grp x Dist + Spd x Grp
3445.28 8 0.0077 9.71
Dist + Grp + Spd + Date + Dist x Spd + Grp x Dist 3463.12 6 0.0031 11.53 SS + Dist + Grp + Spd + Date + Hr + Loc + Dist x Spd + Grp x Dist + Spd x Grp
3443.26 10 0.0028 11.71
B) Common Murre SS + Grp + Dist + Spd + Hr + Date + Bird 539.04 7 0.40 0 SS + Grp + Dist + Spd + Hr + Date + Loc + Bird 533.77 8 0.17 1.67 SS + Grp + Dist + Spd + Date + Hr + Loc + Dist x Spd + Grp x Dist + Spd x Grp
529.83 10 0.16 1.85
SS + Grp + Dist + Spd + Date + Hr + Loc + Bird + Dist x Spd + Grp x Dist + Spd x Grp*
529.39 11 0.07 3.48
SS + Grp + Dist + Spd + Date 542.50 5 0.05 4.27 C) Rhinoceros Auklet SS + Dist + Grp + Spd + Date 271.01 5 0.28 0 Dist + Spd 277.24 2 0.27 0.05 Dist + Grp + Spd 277.22 3 0.10 2.08 Dist + Grp + Spd + Date + Grp x Dist + Dist x Spd
271.24 6 0.09 2.33
SS + Dist 281.02 2 0.04 3.83 D) Pelagic Cormorant SS + Dist + Grp + Spd + Date + Hr + Loc + Dist x Spd + Grp x Dist + Spd x Grp*
674.63 10 0.32 0
SS + Grp + Hr + Loc + Grp x Dist + Spd x Grp 681.23 7 0.26 0.44 SS + Dist + Grp + Spd + Date + Hr + Dist x Spd + Grp x Dist + Spd x Grp
677.30 9 0.24 0.61
SS + Dist + Grp + Spd + Date + Dist x Spd + Grp x Dist + Spd x Grp
681.00 8 0.10 2.25
Dist + Grp + Spd + Date + Grp x Dist + Dist x Spd
686.66 6 0.05 3.82
a Model Parameters: SS = sea state, Dist = distance at moment of reaction, Grp = group size, Spd = boat speed, Date = Julian date, Hr = hour of day, Bird = average bird density per sector, Loc = location, Dist x Spd, Grp x Dist, and Spd x Grp were interaction terms of those variables.
b Number of parameters in model. c Akaike model weight.
* Global Model.

41
Table 4: Top 5 candidate logistic regression models for predicting flushing behaviour from reacting birds (Dive-Flush model) in Marbled Murrelets, Common Murres, Rhinoceros Auklets, and Pelagic Cormorants.
Model Parametersa -2 Log likelihood
�b wi
c �AICc
A) Marbled Murrelet SS + Dist + Grp + Spd + Date + Hr + Loc + + Dist x Spd + Grp x Dist + Spd x Grp
1025.738 10 0.73 0
SS + Dist + Grp + Spd + Ang + Date + Hr + Loc + Bird + Dist x Spd + Grp x Dist + Spd x Grp*
1024.883 12 0.15 3.22
SS + Dist + Grp + Spd + Date + Dist x Spd + Grp x Dist + Spd x Grp
1035.61
8 0.04 5.81
SS + Dist + Grp + Spd + Date + Hr + Bird + Dist x Spd + Grp x Dist + Spd x Grp
1031.87 10 0.03 6.13
SS + Bird + Grp + Ang + Dist x Spd + Grp x Dist + Grp x Spd
1039.335 7 0.02 7.51
B) Common Murre Dist + Spd 53.82 2 0.098 0 Dist + Grp + Spd 51.84 3 0.091 0.15 Spd + Grp + Dist x Grp 51.84 3 0.091 0.15 Dist + Ang 54.10 2 0.085 0.28 Dist 56.93 1 0.058 1.04 C) Rhinoceros Auklet Dist + Spd 73.51 2 0.142 0 Spd + Grp + Dist x Grp + Grp x Spd + Dist x Spd
66.85 5 0.139 0.03
Dist 75.94 1 0.12 0.32 Dist + Ang 74.98 2 0.07 1.47 SS + Grp + Spd x Dist 72.83 3 0.07 1.49 D) Pelagic Cormorant Hr + Loc + Dist x Grp 147.67 3 0.21 0 SS + Grp + Spd + Ang x Dist + Dist x Grp 144.61 5 0.13 1.01 Dist + Loc + Hr + Dist x Grp 147.25 4 0.09 1.62 Dist + Grp 151.84 2 0.07 2.15 SS + Grp + Dist + Spd + Hr 147.57 5 0.03 3.97
a Model Parameters: SS = sea state, Dist = distance at moment of reaction, Grp = group size, Spd = boat speed, Date = Julian date, Hr = hour of day, Bird = average bird density per sector, Loc = location, Ang = approach angle at moment of reaction, Dist x Spd, Grp x Dist, and Spd x Grp were interaction terms of those variables.
b Number of parameters in model. c Akaike model weight.
* Global Model.
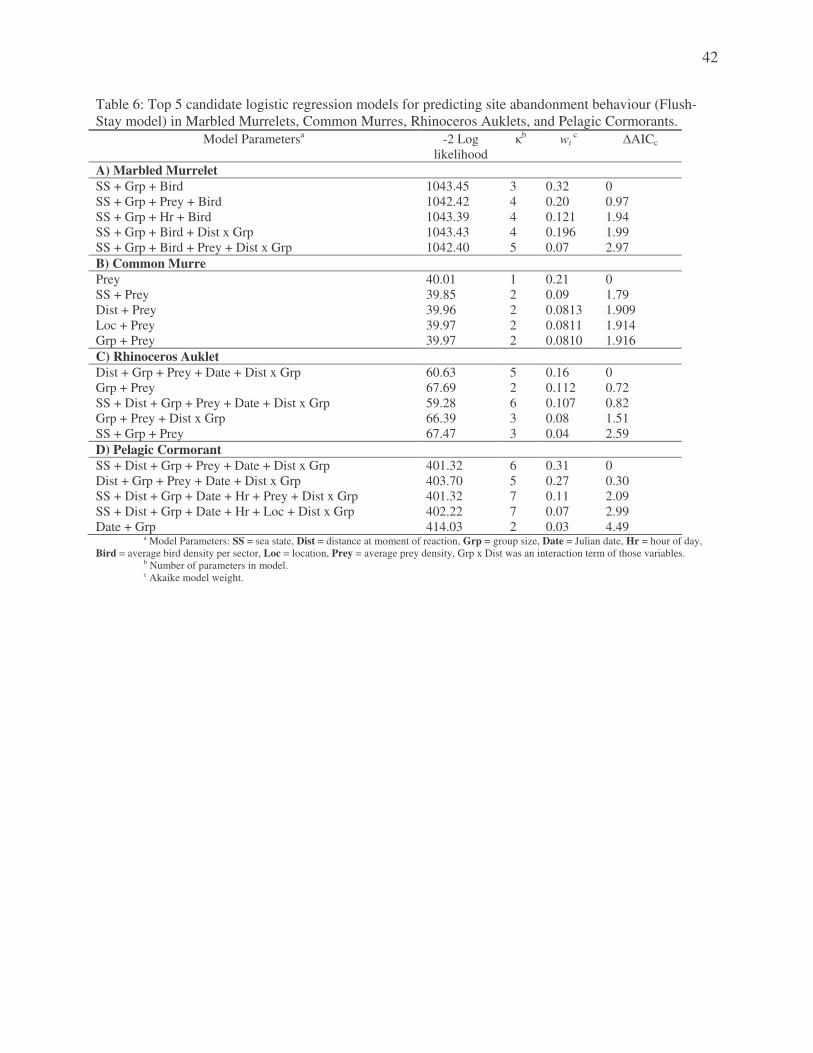
42
Table 6: Top 5 candidate logistic regression models for predicting site abandonment behaviour (Flush-Stay model) in Marbled Murrelets, Common Murres, Rhinoceros Auklets, and Pelagic Cormorants.
Model Parametersa -2 Log likelihood
�b wi
c �AICc
A) Marbled Murrelet SS + Grp + Bird 1043.45 3 0.32 0 SS + Grp + Prey + Bird 1042.42 4 0.20 0.97 SS + Grp + Hr + Bird 1043.39 4 0.121 1.94 SS + Grp + Bird + Dist x Grp 1043.43 4 0.196 1.99 SS + Grp + Bird + Prey + Dist x Grp 1042.40 5 0.07 2.97 B) Common Murre Prey 40.01 1 0.21 0 SS + Prey 39.85 2 0.09 1.79 Dist + Prey 39.96 2 0.0813 1.909 Loc + Prey 39.97 2 0.0811 1.914 Grp + Prey 39.97 2 0.0810 1.916 C) Rhinoceros Auklet Dist + Grp + Prey + Date + Dist x Grp 60.63 5 0.16 0 Grp + Prey 67.69 2 0.112 0.72 SS + Dist + Grp + Prey + Date + Dist x Grp 59.28 6 0.107 0.82 Grp + Prey + Dist x Grp 66.39 3 0.08 1.51 SS + Grp + Prey 67.47 3 0.04 2.59 D) Pelagic Cormorant SS + Dist + Grp + Prey + Date + Dist x Grp 401.32 6 0.31 0 Dist + Grp + Prey + Date + Dist x Grp 403.70 5 0.27 0.30 SS + Dist + Grp + Date + Hr + Prey + Dist x Grp 401.32 7 0.11 2.09 SS + Dist + Grp + Date + Hr + Loc + Dist x Grp 402.22 7 0.07 2.99 Date + Grp 414.03 2 0.03 4.49
a Model Parameters: SS = sea state, Dist = distance at moment of reaction, Grp = group size, Date = Julian date, Hr = hour of day, Bird = average bird density per sector, Loc = location, Prey = average prey density, Grp x Dist was an interaction term of those variables.
b Number of parameters in model. c Akaike model weight.

43
Appendix C: Univariate Parameter Estimates for the Three Model-Sets for Each Species Table 3. Univariate parameter estimates of the Reaction-No Reaction model for Marbled Murrelet (n = 3063), Common Murre (n = 652). Rhinoceros Auklet (n = 268), and Pelagic Cormorant (n = 670).
Expβ 95% C.I. Parameter
β
SE
P
Expβ (odds ratio) Lower Bound Upper Bound
A) Marbled Murrelet Julian Date -0.007 0.002 <0.001 0.993 0.989 0.997 Sea State 0.243 0.048 <0.001 1.274 1.161 1.490
Hour 0.027 0.013 0.035 1.028 1.002 1.054 Group Size -0.264 0.043 <0.001 0.768 0.706 0.835
Distance -0.051 0.002 <0.001 0.950 0.946 0.955 Speed -0.012 0.005 0.007 0.988 0.979 0.997
Bird Density 0.007 0.002 0.004 1.007 1.002 1.012 Location 0.018 0.008 0.019 1.018 1.003 1.034
B) Common Murre Julian Date -0.012 0.005 0.012 0.988 0.978 0.997 Sea State 0.051 0.114 0.654 1.052 0.802 1.308
Hour 0.061 0.030 0.041 1.063 1.005 1.145 Group Size -1.210 0.339 <0.001 0.298 0.172 0.648
Distance -0.018 0.005 <0.001 0.982 0.974 0.993 Speed -0.009 0.012 0.452 0.991 0.973 1.023
Bird Density -0.013 0.011 0.256 0.987 0.966 1.009 Location 0.013 0.015 0.401 1.013 0.950 1.026
C) Rhinoceros Auklet Julian Date -0.013 0.007 0.061 0.987 0.974 1.001 Sea State 0.307 0.159 0.054 1.359 0.994 1.858 Hour 0.023 0.042 0.579 1.024 0.843 1.112 Group Size -0.174 0.125 0.162 0.840 0.658 1.072 Distance -0.042 0.008 <0.001 0.959 0.947 0.975 Speed -0.03 0.017 0.081 0.970 0.938 1.004 Bird Density -0.023 0.031 0.463 0.977 0.919 1.039 Location 0.008 0.022 0.721 1.008 0.966 1.051 D) Pelagic Cormorant Julian Date 0.010 0.004 0.022 1.010 1.002 1.020 Sea State 0.272 0.110 0.013 1.313 1.058 1.627 Hour -0.079 0.034 0.019 0.924 0.865 0.987 Group Size -0.763 0.214 <0.001 0.466 0.306 0.710 Distance -0.003 0.003 0.247 0.997 0.992 1.002 Speed 0.017 0.010 0.087 1.017 0.998 1.038 Location -0.045 0.017 0.009 0.956 0.924 0.989

44
Table 5. Univarite parameter estimates of the Dive-Flush model for Marbled Murrelet (n = 1206), Common Murre (n = 105), Rhinoceros Auklet (n = 75), and Pelagic Cormorant (n = 514).
Expβ 95% C.I. Parameter
β
SE
P
Expβ (odds ratio)
Lower Bound Upper Bound
A) Marbled Murrelet Julian Date -0.009 0.004 0.012 0.991 0.984 0.998 Sea State 0.360 0.084 <0.001 1.434 1.217 1.690
Hour -0.022 0.025 0.386 0.979 0.932 1.028 Group Size -0.193 0.095 0.043 0.824 0.684 0.994
Distance 0.066 0.005 <0.001 1.068 1.057 1.079 Speed -0.021 0.009 0.025 0.979 0.961 0.997
Bird Density 0.006 0.005 0.224 1.006 0.997 1.015 Angle -0.004 0.002 0.051 0.996 0.991 1.000
Location -0.047 0.015 0.002 0.954 0.926 0.983 B) Common Murre Julian Date 0.007 0.016 0.646 1.007 0.977 1.039 Sea State -0.335 0.438 0.444 0.715 0.303 1.688 Hour -0.111 0.117 0.344 0.895 0.711 1.127 Group Size 0.936 0.696 0.167 2.62 0.669 10.251 Distance 0.032 0.015 0.031 1.032 1.003 1.062 Speed 0.042 0.037 0.253 1.043 0.970 1.122 Bird Density -0.007 0.040 0.855 0.993 0.917 1.075 Angle -0.014 0.011 0.193 0.986 0.965 1.007 Location 0.097 0.081 0.233 1.102 0.940 1.292 C) Rhinoceros Auklet Julian Date -0.007 0.013 0.583 0.993 0.968 1.108 Sea State -0.315 0.290 0.277 0.730 0.414 1.287 Hour -0.005 0.077 0.951 0.995 0.855 1.158 Group Size -0.045 0.246 0.856 0.956 0.590 1.549 Distance 0.049 0.016 0.003 1.050 1.017 1.085 Speed 0.048 0.034 0.155 1.050 0.982 1.122 Bird Density 0.093 0.062 0.132 1.098 0.972 1.239 Angle -0.001 0.009 0.875 0.999 0.982 1.016 Location -0.036 0.043 0.408 0.965 0.886 1.050 D) Pelagic Cormorant Julian Date 0.011 0.010 0.279 1.011 0.991 1.03 Sea State -0.100 0.239 0.675 0.905 0.567 1.445 Hour -0.163 0.079 0.039 0.850 0.728 0.992 Group Size 17.513 5803.84 0.998 4x10⁷ 0 v. large Distance 0.061 0.012 <0.001 1.062 1.038 1.087 Speed -0.014 0.022 0.505 0.986 0.945 1.028 Angle -0.021 0.008 0.009 0.979 0.963 0.995 Location 0.003 0.040 0.939 1.003 0.928 1.084
45
Table 7. Univarite parameter estimates of the Flush-Stay model for Marbled Murrelet (n = 1690), Common Murre (n = 372), Rhinoceros Auklet (n = 152), and Pelagic Cormorant (n = 335).
Expβ 95% C.I. Parameter
β
SE
P
Expβ (odds ratio)
Lower Bound Upper Bound
A) Marbled Murrelet Julian Date -0.010 0.005 0.029 0.990 0.981 0.999 Sea State 0.490 0.103 <0.001 1.632 1.333 1.998
Hour 0.028 0.029 0.347 1.028 0.971 1.089 Group Size -0.398 0.119 0.001 0.672 0.532 0.848
Distance -0.003 0.004 0.398 0.997 0.990 1.004 Bird Density 0.018 0.006 0.001 1.018 1.007 1.030 Prey Density 0.023 0.031 0.448 1.024 0.964 1.087
Location -0.017 0.017 0.311 0.983 0.950 1.016 B) Common Murre
Julian Date -0.014 0.024 0.542 0.986 0.941 1.032 Sea State -0.249 0.616 0.686 0.780 0.233 2.610
Hour -0.053 0.161 0.741 0.948 0.691 1.300 Group Size 0.004 0.172 0.981 1.004 0.717 1.407
Distance 0.009 0.017 0.614 1.009 0.976 1.043 Bird Density 0.004 0.051 0.941 1.004 0.908 1.109 Prey Density -2.992 2.316 0.196 0.050 0.001 4.700
Location 0.038 0.095 0.689 1.039 0.862 1.251 C) Rhinoceros Auklet
Julian Date -0.025 0.018 0.176 0.975 0.941 1.011 Sea State 0.020 0.344 0.953 1.021 0.520 2.004
Hour 0.240 0.107 0.026 1.271 1.030 1.569 Group Size -0.405 0.474 0.393 0.667 0.264 1.689
Distance 0.002 0.012 0.855 1.002 0.979 1.026 Bird Density -0.031 0.081 0.703 0.970 0.827 1.136 Prey Density 0.690 0.377 0.068 1.993 0.951 4.176
Location 0.007 0.052 0.899 1.007 0.909 1.115 D) Pelagic Cormorant
Julian Date 0.011 0.006 0.051 1.011 1.000 1.023 Sea State 0.043 0.150 0.776 1.044 0.777 1.402
Hour -0.017 0.043 0.693 0.983 0.903 1.070 Group Size -0.534 0.245 0.029 0.586 0.363 0.947
Distance -0.004 0.003 0.296 0.996 0.990 1.003 Prey Density 0.068 0.059 0.249 1.070 0.954 1.201
Location -0.001 0.020 0.967 0.999 0.960 1.040