Embed Size (px)
Citation preview

ECCC 2014 (European Continuous Casting Conference, Graz, Austria, June 23-26, 2014) 1
LANCE C. HIBBELER,1 BRIAN G. THOMAS,1 RONALD C. SCHIMMEL,2 and HENK H. VISSER2
SIMULATION AND ONLINE MEASUREMENT OF NARROW FACE MOLD DISTORTION IN THIN-SLAB CASTING
Abstract
The thermal distortion of the narrow face mold plates in a funnel-mold caster is explored with numerical simulation and online measurements. A three-dimensional finite-element model of the mold and waterbox with full geometric detail is used to explore the evolution of temperature and distortion of the mold during startup. The thermal boundary conditions are calculated with the continuous-casting heat transfer model CON1D, which was calibrated with plant measurements. The model predictions agree with measurements from inclinometers installed on the top and bottom of a mold plate to within about 1 arc-minute (better than 5%). Before a width change, the clamping forces and friction between the narrow and wide face mold plates resist the tendency for the narrow face to move and bend. After unclamping for a width change, the narrow face distorts into a parabolic shape according to the stiffness of the restraining bolts and waterbox. The applied taper in the plant must account for these two different narrow face shapes to match the shrinkage of the solidifying steel shell and to ensure good product quality. For the mold under consideration, the distortion of the narrow face increases the effective taper and leads to increased mold wear.
Keywords
Mold distortion, narrow-face taper, online measurement, thermo-mechanical model
1. Introduction
Many problems in continuous casting, such as breakouts and cracks, are caused by improper mold taper. The mold shape should match the shrinkage of the solidifying steel strand; in slab casting, this claim is especially true with the narrow faces, where ferrrostatic pressure is insufficient to overcome any mismatch. The thermal distortion of a mold is important to quantify because of its influence on mold taper [3,5,11,13].
The thermo-mechanical behavior for steady casting conditions of billet molds [3,11], thick-slab molds [6,13], and thin-slab molds [5,7,10] has been explored with numerical modeling. These studies have shown the importance of the waterbox [13] and mold bolts [5] on the mechanical behavior of the mold and taper. The transient behavior of the mold during startup has received little attention. Experimental measurements of the mechanical behavior of molds during casting are rare; a few studies measured the wide face waterbox shape with linear displacement transducers [1,8,9].
Previous numerical models have oversimplified treatments of bolts, interfacial contact, material behavior, and mold geometry. The current work extends a previous numerical
1 The University of Illinois at Urbana—Champaign, Urbana, Illinois, USA 2 Tata Steel, IJmuiden, The Netherlands

ECCC 2014 (European Continuous Casting Conference, Graz, Austria, June 23-26, 2014) 2
study [5] of a funnel mold that includes realistic heat transfer, full geometric detail of the mold and waterbox, and validation with plant measurements. This computational model is applied together with plant measurements of mold thermocouples and two inclinometers mounted on the top and bottom of a narrow face (NF) waterbox to investigate mold temperature and distortion during startup and steady operation.
2. Description of Numerical Model
The distortion of a funnel mold and waterbox is analyzed in this work with thermal and mechanical numerical models. The governing equations presented in this section are solved with the finite-element method, using the commercial software ABAQUS [2]. The NF mold and waterbox geometry are shown in Fig. 1. The NF mold plate is 72 mm thick and the waterbox is 110 mm thick with a 50 mm bore for the water flow.
Fig. 1. Narrow-face mold and waterbox geometry explored in this work
The temperature field ( ),T tx within the mold is governed by the conservation of energy,
2p t
Tc k Tρ ∂ = ∇
∂, (1)
where ρ , k , and pc are the constant mass density, isotropic thermal conductivity, and specific heat capacity of the mold copper. The hot face of the mold is supplied a heat flux,
hotk T q− ∇ ⋅ =n , (2)
where ( )hot ,q tx is the heat flux from the solidifying strand and n is the unit normal vector of the surface. The surfaces of the mold water channels are supplied a convection condition,
( )water waterk T h T T− ∇ ⋅ = −n , (3)
where ( )water ,h tx and ( )water ,T tx are the heat transfer coefficient and bulk temperature of the cooling water. All other faces of the mold are insulated, 0k T− ∇ ⋅ =n , because of symmetry or by assuming that all heat input to the mold from the steel is removed by the cooling water. This assumption on the heat removal allows the waterbox to be taken as isothermal at ambient temperature, and so the waterbox is not included in the thermal analysis.

ECCC 2014 (European Continuous Casting Conference, Graz, Austria, June 23-26, 2014) 3
The stress, strain, and displacement fields ( ), tσ x , ( ), tε x , and ( ), tu x within the mold and waterbox are governed by the quasi-static conservation of momentum,
= ∇⋅0 σ , (4)
with the effect of gravity neglected because the mold weight is negligible relative to the bolt pre-stresses [5,13]. Using linearized kinematics, the stress is related to the strain as
( )th:= −Cσ ε ε , (5)
where the fourth-rank isotropic elastic stiffness tensor C is
( ) ( ) ( )( )C
2 1 1 1 2ijk ik j i kj ij k
E Eνδ δ δ δ δ δν ν ν
= + ++ + − , (6)
where ijδ is the Kronecker delta (1 if i j= and 0 otherwise), the total strain tensor is
( )( )T12= ∇ + ∇ε u u , (7)
and the thermal strain tensor ( )th , tε x is
( )threfT Tα= −ε I , (8)
where α is the constant isotropic coefficient of thermal expansion based on the reference temperature refT , and I is the second-rank identity tensor. Symmetry planes on the mold and waterbox have no normal displacement and no tangential traction,
0⋅ =u n and (9a)
( )− ⊗ ⋅ =I n n t 0 . (9b)
where = ⋅t n σ is the traction vector on the surface. Contacting surfaces between the mold and waterbox move together or form gaps according to the nonlinear boundary conditions
=t 0 if gap 0d > , or (10)
rel 0⋅ =v n and (11a)
( ) ( ) rel
rel
μ− ⊗ ⋅ = − ⋅ vI n n t t nv
if gap 0d = , (11b)
where gap reld = ⋅x n is the normal component of the distance between surfaces relx , relv is the relative velocity of the surfaces, and μ is the coefficient of friction. The mold hot face is supplied a traction to include the ferrostatic pressure,
fp= −t n , (12)
where the applied pressure ( )f ,p tx increases with distance below the top of the liquid steel.
The hot face heat flux ( )hot ,q tx and ferrostatic pressure ( )f ,p tx vary with space and time according to the evolving locations of the mold level and the dummy bar. In lieu of simulating the fluid flow [14] and solidification during the startup, the heat flux history experienced by each point on the strand surface is assumed to be that of steady-state conditions ( )SS
hot 0q t t− , where the time interval 0t t− is the local solidification time of that point. The global time t is relative to the start of mold filling. The initial solidification time 0t of the steel currently at distance below the top of the mold z is determined by first describing mathematically the evolution of the liquid steel during startup.

ECCC 2014 (European Continuous Casting Conference, Graz, Austria, June 23-26, 2014) 4
Following Figs. 2 and 3, the liquid steel inside the mold cavity is approximated as a trapezoidal prism with base lengths ( )barw z and ( )menw z , height bar menz z− , and thickness strandd . Fluid-flow simulations of mold filling [14] show a mostly-uniform meniscus level, so this approximation is reasonable. The volume of the trapezoidal prism is
( ) ( )( )( )1men bar bar men strand2V w z w z z z d= + − . (13)
Equation (13) neglects: the volume occupied by the scrap charge, the solidified steel, and the submerged entry nozzle (SEN), the volume change due to mold distortion, and the volume of the funnel [4]. The mold cavity width at any position z , using the geometry shown in Fig. 3, is
( ) ( )bot top bot1z
w z W W WL
= + − −
, (14)
where topW and botW are the width of the mold cavity at the top and bottom of the mold, and
( )22mold top botL W W= − − (15)
is the height of the inclined NF mold plate of length mold . The positions of the dummy bar barz and mold level menz evolve as the dummy bar is withdrawn and liquid steel flows into the mold with volumetric flow rate Q ; a time derivative of Eq. (13) gives the evolution of the liquid level as
( )( ) ( )
bar
men barmen men strand
w z Qz z
w z w z d
∗
= − , (16)
where ( )bar barmin ,z L z∗ = . The dummy bar moves at the casting speed, i.e., bar castz v= . The SEN flow rate Q is controlled by the movement of a stopper rod, but the relationship between flow rate and stopper rod position is not precisely known. The flow rate was determined by iteration, constrained to follow the movement of the stopper rod, so that the thermocouple temperatures start to increase when the liquid level reaches their locations.
Figures 4 and 5 show the measured casting speed from the plant trial and the calibrated SEN flow rate for the first 30 s of mold filling and casting startup. Using these measurements and the conditions listed in Table 1, Fig. 6 shows the computed positions of the mold level and dummy bar, as well as the mold level measured with a radiation-source detector.
Fig. 2. Geometry of liquid steel levels
Fig. 3. Geometry of mold cavity
Table 1. Startup mold geometry
Quantity Value UnitMold length, mold 1100.0 mm
Strand thickness, strandd 90.0 mm
Top strand width, topW 1555.3 mm
Bottom strand width, botW 1535.4 mm
Init. dummy bar pos., bar0z 900.0 mm
Fig. 4. Casting speed during startup

ECCC 2014 (European Continuous Casting Conference, Graz, Austria, June 23-26, 2014) 5
The time of initial solidification 0t of the point of the strand surface currently in contact with the mold hot face at position z and time t is found by tracing the motion pathline in a distance-time plot, shown in Fig. 7, backward in time until it intersects the mold level curve, i.e., find the 0t that satisfies
( ) ( )0
men 0 cast dt
tz t z v τ τ= − . (17)
If no such 0t exists, then the strand has not yet come into contact with the mold at position z . During transients, Eqs. (16) and (17) are solved numerically and their solutions interpolated to find their intersection; if these lines intersect, it occurs when the difference men pathlinez z− changes sign. At steady state, Eq. (17) becomes an algebraic equation and the local initial solidification time of any point z below the meniscus is
( ) ( )0 men castt z t z z v= − − . (18)
The calculated motion pathlines for the plant trial are shown in Fig. 7. As an example of calculating an initial solidification time, consider the point at z = 861 mm below the top of the mold at t = 40 s after the start of mold filling. The intersection of the motion pathline with the mold level line in Fig. 7 shows that the surface of the steel strand starts to solidify at 0t = 18.4 s.
The steady-state heat flux SShotq , water channel
heat transfer coefficient SSwaterh , and water bulk
temperature SSwaterT shown in Fig. 8 are calculated
with the one-dimensional continuous casting heat transfer model CON1D, which was calibrated [12] with measured values of mold thermocouple temperatures and cooling water temperature change. The hot face heat flux during startup is
( ) ( )SShot hot 0,q z t q t t= − (19)
if 0t exists and is zero otherwise. For the example coordinate mentioned above, the applied heat flux from Eq. (19) is ( )SS
hot 21.6 sq . Calculated heat flux profiles are shown in Fig. 9 at a few times during the startup. The water channel heat transfer coefficient and bulk water temperature are applied in the model with a transformation to Eq. (19), using the value at the steady-state meniscus for all points above menz .
Fig. 5. Nozzle flow rate during startup
Fig. 6. Mold level and dummy bar positions during startup
Fig. 7. Initial solidification time 0t for the steel at position z at time t is found at the intersection of the rigid-motion pathlines and menz

ECCC 2014 (European Continuous Casting Conference, Graz, Austria, June 23-26, 2014) 6
Fig. 8. Steady-state hot face heat flux, water heat transfer coefficient, and water temperature, calibrated from plant measurements using the continuous casing model CON1D
Fig. 9. Spatially- and temporally-varying hot face heat flux during startup
The applied pressure on the hot face to model the effect of ferrostatic pressure is
( ) ( )men
f steel men men bar
bar
0 if
, if
0 if
z z
p z t g z z z z z
z z
ρ ∗
∗
<= − ≤ ≤ ≤
, (20)
where ( )menz t and ( )barz t∗ are the mold level and dummy bar positions calculated as described above, steelρ is the mass density of the liquid steel, and g is the acceleration due to gravity.
The analysis is performed with ABAQUS [2] in two, one-way coupled steps, which solve a non-deforming thermal problem and then an adiabatic deformation problem. The mold and waterbox are discretized into 317200 nodes and 735170 tetrahedral, wedge, and hexahedral elements: DC3D6 and DC3D8 for the thermal problem and C3D4, C3D6, and C3D8 for the mechanical problem. The non-contact boundary conditions are applied with user subroutines: DFLUX for the hot-face heat flux, FILM for the water-channel convection, and DLOAD for the ferrostatic pressure. The mold bolts and tie-rods are treated as pre-stressed T3D2 truss elements, with the applied torque converted to an axial load as described elsewhere [5,13]. Conditions and material properties are summarized in Table 2. On a 64-core compute cluster, the 234 thousand degree-of-freedom heat transfer model requires about 11 s per iteration, and

ECCC 2014 (European Continuous Casting Conference, Graz, Austria, June 23-26, 2014) 7
advances through time at about 1.0 simulation seconds per wall-clock hour. An 8-core workstation requires 19 s per iteration and marches at 0.4 simulation seconds per wall-clock hour. The 1.04 million degree-of-freedom mechanical model requires about 130 s per iteration, and advances through time at about 2.5 simulation seconds per wall-clock hour. Although the mechanical problem is more challenging computationally per iteration, the thermal problem is slower overall, because many small time steps are needed to model accurately the transient thermal behavior.
Table 2. Material properties and other conditions for mold distortion simulations
Quantity Symbol Value Unit Mold – CuCrZr alloy
Thermal conductivity moldk 350.000 W/m·K Mass density moldρ 8900.000 kg/m³ Specific heat capacity ,moldpc 385.000 J/(kg·K) Young’s modulus moldE 117.000 GPa Poisson’s ratio moldν 0.181 -- Coefficient of thermal expansion moldα 18.000 (µm/m)/K
Waterbox – AISI 316Ti Young’s modulus waterboxE 200.000 GPa Poisson’s ratio waterboxν 0.299 --
Mold-waterbox coefficient of friction μ 0.500 -- Liquid steel mass density steelρ 7400.000 kg/m³ Acceleration due to gravity g 9.807 m/s²
3. Online Measurement of Mold Distortion and Taper
In this work, the instantaneous NF tapers were measured in real time during a casting startup. Each NF waterbox was instrumented with two inclinometers, one centered at 94 mm below the top of the mold plate, and the other centered at 31 mm above the bottom of the mold plate, as shown in Figure 10. The inclinometers give a nominal ±5 V signal for ±3° angle from vertical, which is scaled to a ±10 V signal for ±6° angle based on the calibration certificates. The signal from the inclinometers is filtered with a first-order low-pass filter to remove the noise created by mold oscillation.
Fig. 10. Back/side view of narrow-face mold and waterbox instrumented with inclinometers
ECCC 2014 (European Continuous Casting Conference, Graz, Austria, June 23-26, 2014) 8
4. Thermo-Mechanical Behavior of the Narrow Face Mold
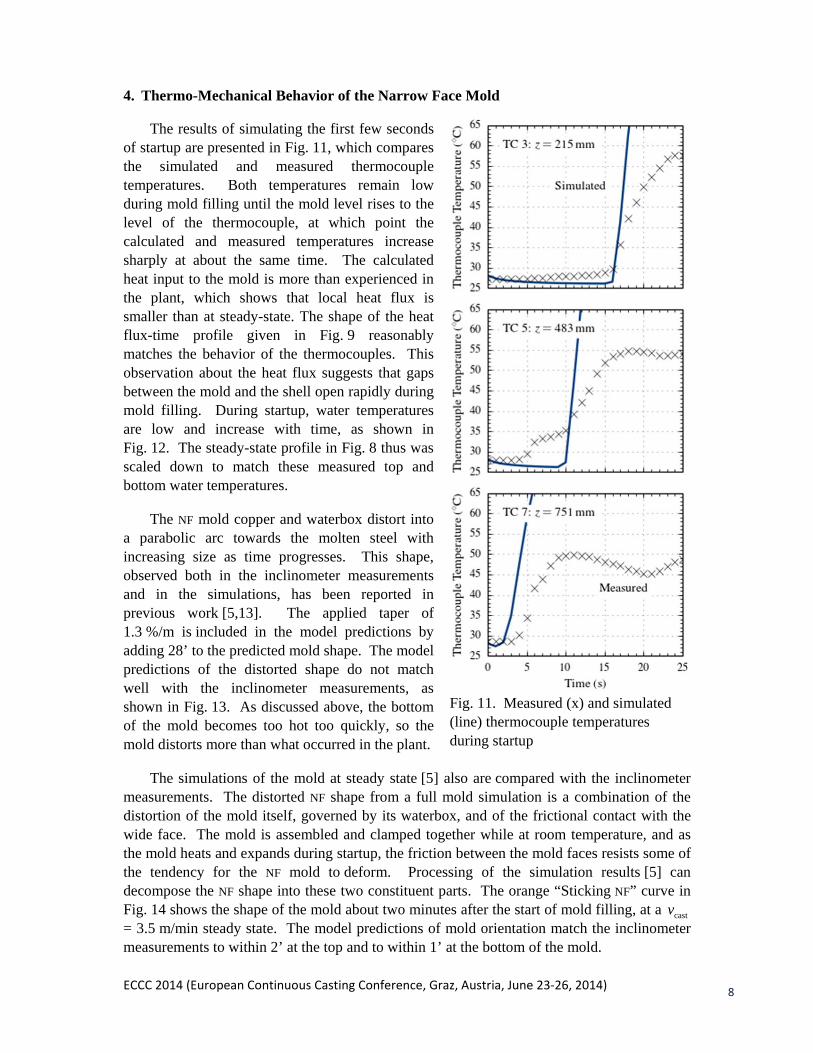
The results of simulating the first few seconds of startup are presented in Fig. 11, which compares the simulated and measured thermocouple temperatures. Both temperatures remain low during mold filling until the mold level rises to the level of the thermocouple, at which point the calculated and measured temperatures increase sharply at about the same time. The calculated heat input to the mold is more than experienced in the plant, which shows that local heat flux is smaller than at steady-state. The shape of the heat flux-time profile given in Fig. 9 reasonably matches the behavior of the thermocouples. This observation about the heat flux suggests that gaps between the mold and the shell open rapidly during mold filling. During startup, water temperatures are low and increase with time, as shown in Fig. 12. The steady-state profile in Fig. 8 thus was scaled down to match these measured top and bottom water temperatures.
The NF mold copper and waterbox distort into a parabolic arc towards the molten steel with increasing size as time progresses. This shape, observed both in the inclinometer measurements and in the simulations, has been reported in previous work [5,13]. The applied taper of 1.3 %/m is included in the model predictions by adding 28’ to the predicted mold shape. The model predictions of the distorted shape do not match well with the inclinometer measurements, as shown in Fig. 13. As discussed above, the bottom of the mold becomes too hot too quickly, so the mold distorts more than what occurred in the plant.
The simulations of the mold at steady state [5] also are compared with the inclinometer measurements. The distorted NF shape from a full mold simulation is a combination of the distortion of the mold itself, governed by its waterbox, and of the frictional contact with the wide face. The mold is assembled and clamped together while at room temperature, and as the mold heats and expands during startup, the friction between the mold faces resists some of the tendency for the NF mold to deform. Processing of the simulation results [5] can decompose the NF shape into these two constituent parts. The orange “Sticking NF” curve in Fig. 14 shows the shape of the mold about two minutes after the start of mold filling, at a castv = 3.5 m/min steady state. The model predictions of mold orientation match the inclinometer measurements to within 2’ at the top and to within 1’ at the bottom of the mold.
Fig. 11. Measured (x) and simulated (line) thermocouple temperatures during startup

ECCC 2014 (European Continuous Casting Conference, Graz, Austria, June 23-26, 2014) 9
Fig. 12. Measured water temperature at top and bottom of mold during casting
Fig. 13. Measured (x) and simulated (line) top and bottom mold orientation
When the clamping forces are released for a strand-width change during casting, the
frictional forces disappear, and the NF mold takes on a different shape, shown by the blue “Sliding NF” curves in Fig. 14. The model predictions of mold orientation match the inclinometer measurements to less than 1’ for both the top and bottom of the mold. The simulations show that the slope of the distorted NF mold in the middle of the mold is in good agreement with the applied taper. The taper near the top and bottom of the mold is substantially different than this nominal value, due to the important effect of mold thermal distortion.
Fig. 14. Simulated narrow face mold shape and inclinometer measurements (black lines) after a startup and after a width change, calculated by steady-state thermal distortion model
5. Conclusions
The thermo-mechanical behavior of a narrow-face mold plate during startup and steady casting has been investigated using both computational modeling and plant measurements. The transient, three-dimensional finite-element thermal model of a startup indicates correct timing of thermocouple temperature increases during mold filling, but requires further development to track accurately the behavior of the mold through the transient stages. The thermo-mechanical model predictions agree with the measured angular position from

ECCC 2014 (European Continuous Casting Conference, Graz, Austria, June 23-26, 2014) 10
inclinometers mounted on the top and bottom of the waterbox. Due to thermal distortion, the top and bottom of the narrow face mold plate experience a different taper locally than the nominal applied taper of the mold piece. This thermal distortion must be taken into account when designing taper practices to avoid problems such as breakouts or excessive mold wear.
Acknowledgments
The financial support of the member companies of the Continuous Casting Consortium at the University of Illinois at Urbana—Champaign is acknowledged gratefully. Some computational resources were provided by the National Center for Supercomputing Applications (NCSA) at the University of Illinois. The support of Tata Steel’s Direct Sheet Plant (DSP in IJmuiden, The Netherlands) personnel, and of Tata Steel’s team involved in the inclinometer measurements, is acknowledged gratefully.
References
[1] G. Carlsson, B. Brolund, and R. Nystrom, Measurement of Mould Distortion and Mould Heat Flux in Industrial Casters, Journ. Sider. ATS (1989), v. 10.
[2] Dassault Simulia, Inc., ABAQUS 6.13 User Manuals (2013). [3] Y. Hebi, Y. Man, Z. Huiying, and F. Dacheng, 3D stress model with friction in and of
mould for round billet continuous casting, ISIJ Int. (2006), v. 46, p. 546. [4] L. C. Hibbeler, Thermo-mechanical behavior during steel continuous casting in funnel
molds, Master’s Thesis (2009), The University of Illinois at Urbana—Champaign. [5] L. C. Hibbeler, B. G. Thomas, R. C. Schimmel, and G. Abbel, The thermal distortion of a
funnel mold, Metall. Mater. Trans. B (2012), v. 43, p. 1156. [6] X. Liu and M. Zhu, Finite element analysis of thermal and mechanical behavior in a slab
continuous casting mold, ISIJ Int. (2006), v. 46, p. 1652. [7] T. G. O’Connor and J. A. Dantzig, Modeling the thin-slab continuous-casting mold,
Metall. Mater. Trans. B (1994), v. 25, p. 443. [8] M. R. Ozgu, Mold and Strand Guide Instrumentation for Continuous Slab Casters, Proc.
13th Process Technol. Div. Conf. (1995). [9] M. R. Ozgu, Continuous Caster Instrumentation: State-of-the-Art Review, Can. Metall.
Quart. (1996), v. 35, p. 199. [10] J. K. Park, B. G. Thomas, I. V. Samarasekera, and U. S. Yoon, Thermal and mechanical
behavior of copper moulds during thin slab casting (I): Plant trial and Mathematical modeling, Metall. Mater. Trans. B (2002), v. 33, p. 425.
[11] I. V. Samarasekera, D. L. Anderson, and J. K. Brimacombe, The thermal distortion of continuous-casting billet molds, Metall. Mater. Trans. B (1982), v. 13, p. 91.
[12] B. Santillana, L. C. Hibbeler, B. G. Thomas, A. Hamoen, A. Kamperman, and W. van der Knoop, Heat transfer in Funnel-mould casting: Effect of Plate Thickness, ISIJ Int. (2008), v. 48, p. 1380.
[13] B. G. Thomas, G. Li, A. Moitra, and D. Habing, Analysis of thermal and mechanical behavior of copper molds during continuous casting of steel slabs, Iron Steelmaker (1998), v. 25, p. 125.
[14] Y. Wang and L. Zhang, Transient Fluid Flow Phenomena during Continuous Casting: Part I—Cast Start, ISIJ Int. (2010), v. 50, p. 1777.