Embed Size (px)
Citation preview

12/9/2010
HEINZ COLLEGE: FALL 2010 SYSTEMS PROJECT
HIGH POINT FEASIBILITY STUDY
Rendering Courtesy of Edward Dumont

High Point Feasibility Study
Heinz College: Fall 2010 Systems Project
2
Letter to the Reader
The following study was produced by twelve students at the H. John Heinz III College of Public Policy at Carnegie Mellon University. During the second year of the Public Policy and Management program at Heinz, each student is required
-long undertaking in which groups of students work together to complete a project for a real-world client. This venture is meant to be a capstone for students and give them first-hand experience with the types of challenges that professionals in the workforce experience every day.
The clients for this study were VisitPittsburgh, an organization dedicated to tourism and promotion for the Pittsburgh area, and Pittsburgh Parks Conservancy, an organization dedicated to the Pittsburgh park system and its maintenance. In addition, every Systems Project has an advisory board made up of industry experts and professors in various disciplines. The clients and advisory board members provided invaluable feedback throughout the course of the project, and the project team sincerely thanks them for their time and contribution.
The intended audience for this study is primarily individuals in the economic development and community development fields, although it was written to be accessible for anyone with an interest in High Point.
This study presented many challenges to the project team, requiring us to stretch our experience, imagination, and capabilities beyond what we knew them to be before the project. To that end, this systems project was an unquestioned success; every team member learned a great deal and developed a tremendous amount of respect for the professionals who do this type of work day in and day out.
The idea of High Point is a unique and innovative one, and the project team feels honored to have been given the opportunity to work on it. Special thanks are due to David Bear who has been working on High Point for several years and who opened up his idea for a group of students to analyze. Without him, there would be no project.
While this study set out to assess the feasibility of High Point, ultimately feasibility will be determined by the dedication of the individuals who continue to work on the idea following this project. The project team wishes them the best of luck and is looking forward to hearing of their progress in the years to come.
Sincerely,
The High Point Feasibility Study Team
High Point Feasibility Study
Heinz College: Fall 2010 Systems Project
3
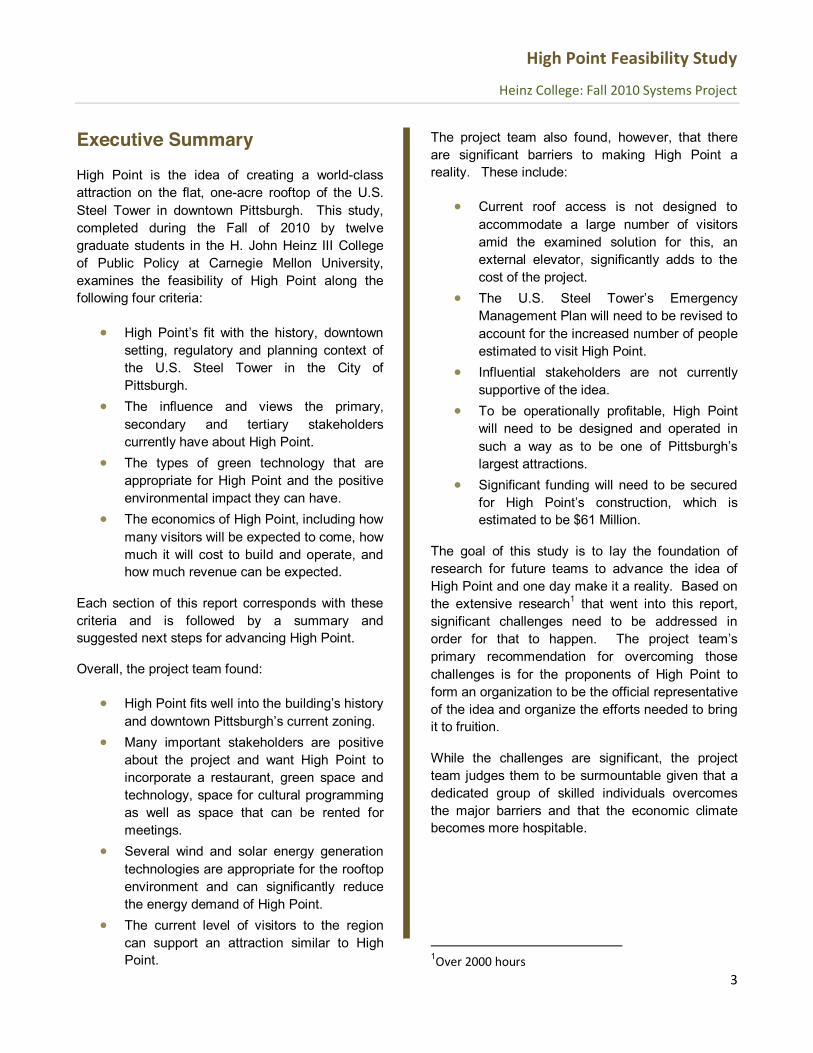
Executive Summary
High Point is the idea of creating a world-class attraction on the flat, one-acre rooftop of the U.S. Steel Tower in downtown Pittsburgh. This study, completed during the Fall of 2010 by twelve graduate students in the H. John Heinz III College of Public Policy at Carnegie Mellon University, examines the feasibility of High Point along the following four criteria:
downtown setting, regulatory and planning context of the U.S. Steel Tower in the City of Pittsburgh.
The influence and views the primary, secondary and tertiary stakeholders currently have about High Point.
The types of green technology that are appropriate for High Point and the positive environmental impact they can have.
The economics of High Point, including how many visitors will be expected to come, how much it will cost to build and operate, and how much revenue can be expected.
Each section of this report corresponds with these criteria and is followed by a summary and suggested next steps for advancing High Point.
Overall, the project team found:
High Point fits well into the and d
Many important stakeholders are positive about the project and want High Point to incorporate a restaurant, green space and technology, space for cultural programming as well as space that can be rented for meetings.
Several wind and solar energy generation technologies are appropriate for the rooftop environment and can significantly reduce the energy demand of High Point.
The current level of visitors to the region can support an attraction similar to High Point.
The project team also found, however, that there are significant barriers to making High Point a reality. These include:
Current roof access is not designed to accommodate a large number of visitors amid the examined solution for this, an external elevator, significantly adds to the cost of the project.
The U.S. Management Plan will need to be revised to account for the increased number of people estimated to visit High Point.
Influential stakeholders are not currently supportive of the idea.
To be operationally profitable, High Point will need to be designed and operated in such a way as to be one of Pittsburghlargest attractions.
Significant funding will need to be secured for construction, which is estimated to be $61 Million.
The goal of this study is to lay the foundation of research for future teams to advance the idea of High Point and one day make it a reality. Based on the extensive research1 that went into this report, significant challenges need to be addressed in
primary recommendation for overcoming those challenges is for the proponents of High Point to form an organization to be the official representative of the idea and organize the efforts needed to bring it to fruition.
While the challenges are significant, the project team judges them to be surmountable given that a dedicated group of skilled individuals overcomes the major barriers and that the economic climate becomes more hospitable.
1Over 2000 hours

High Point Feasibility Study
Heinz College: Fall 2010 Systems Project
4
Introduction
Background Methodology Report Overview Limitations
High Point Feasibility Study
Heinz College: Fall 2010 Systems Project
5
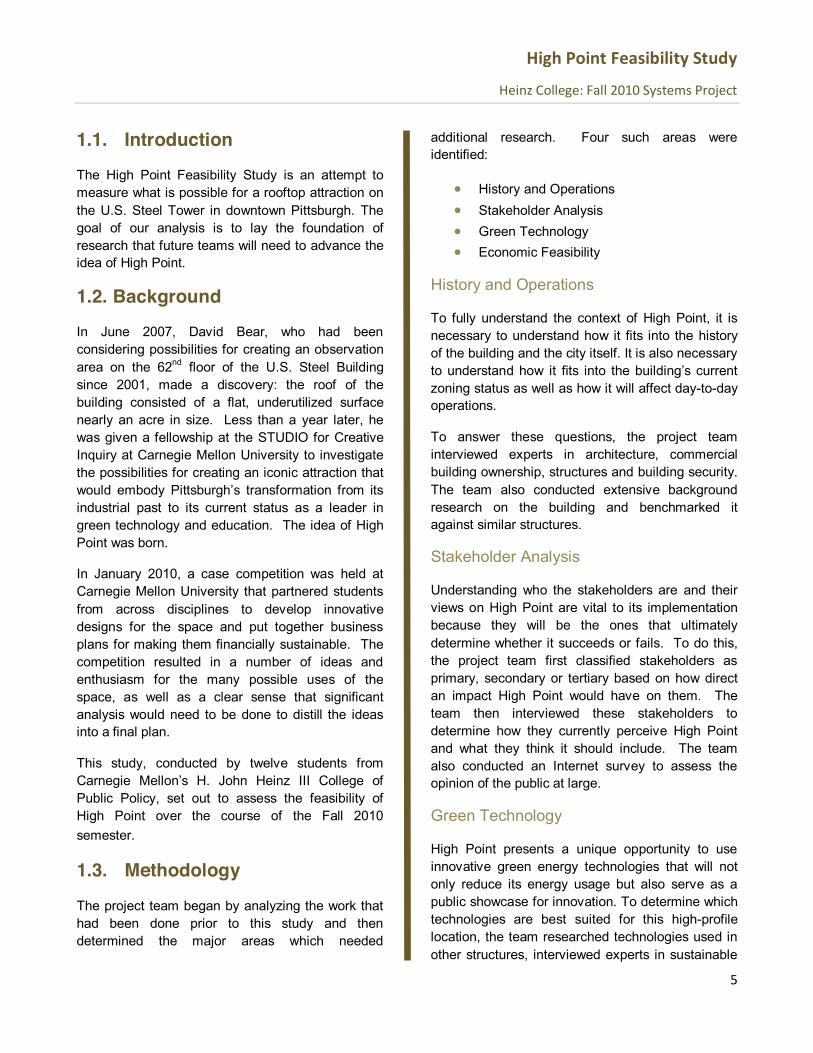
1.1. Introduction
The High Point Feasibility Study is an attempt to measure what is possible for a rooftop attraction on the U.S. Steel Tower in downtown Pittsburgh. The goal of our analysis is to lay the foundation of research that future teams will need to advance the idea of High Point.
1.2. Background
In June 2007, David Bear, who had been considering possibilities for creating an observation area on the 62nd floor of the U.S. Steel Building since 2001, made a discovery: the roof of the building consisted of a flat, underutilized surface nearly an acre in size. Less than a year later, he was given a fellowship at the STUDIO for Creative Inquiry at Carnegie Mellon University to investigate the possibilities for creating an iconic attraction that
industrial past to its current status as a leader in green technology and education. The idea of High Point was born.
In January 2010, a case competition was held at Carnegie Mellon University that partnered students from across disciplines to develop innovative designs for the space and put together business plans for making them financially sustainable. The competition resulted in a number of ideas and enthusiasm for the many possible uses of the space, as well as a clear sense that significant analysis would need to be done to distill the ideas into a final plan.
This study, conducted by twelve students from
Public Policy, set out to assess the feasibility of High Point over the course of the Fall 2010 semester.
1.3. Methodology
The project team began by analyzing the work that had been done prior to this study and then determined the major areas which needed
additional research. Four such areas were identified:
History and Operations Stakeholder Analysis Green Technology Economic Feasibility
History and Operations
To fully understand the context of High Point, it is necessary to understand how it fits into the history of the building and the city itself. It is also necessary to understand how it fits into the building s current zoning status as well as how it will affect day-to-day operations.
To answer these questions, the project team interviewed experts in architecture, commercial building ownership, structures and building security. The team also conducted extensive background research on the building and benchmarked it against similar structures.
Stakeholder Analysis
Understanding who the stakeholders are and their views on High Point are vital to its implementation because they will be the ones that ultimately determine whether it succeeds or fails. To do this, the project team first classified stakeholders as primary, secondary or tertiary based on how direct an impact High Point would have on them. The team then interviewed these stakeholders to determine how they currently perceive High Point and what they think it should include. The team also conducted an Internet survey to assess the opinion of the public at large.
Green Technology
High Point presents a unique opportunity to use innovative green energy technologies that will not only reduce its energy usage but also serve as a public showcase for innovation. To determine which technologies are best suited for this high-profile location, the team researched technologies used in other structures, interviewed experts in sustainable

High Point Feasibility Study
Heinz College: Fall 2010 Systems Project
6
building and design and analyzed information from several databases pertaining to the rooftop environment.
Economic Feasibility
To assess the economic feasibility of High Point, the team first determined that it was necessary to approach the space from the viewpoint of a developer. From this, the team then determined the baseline construction, operating and financing costs by interviewing experts in commercial development, finance, high-end construction and individuals with first-hand knowledge of inherent difficulties with working on the roof of the U.S. Steel Tower.
To estimate the number of annual visitors an attraction like High Point could expect, the team first researched how many visitors the region receives annually and determined the demographic profile of those visitors. The team also researched the admission price and attendance of other Pittsburgh attractions as well as similar attractions like the Empire State Building, Willis Tower and Space Needle.
1.4. Report Overview
The High Point Feasibility Study comprises six chapters with additional material located in the appendices.
Chapter 1 provides background about the High Point Park investigation and its relationship to the High Point Systems project, along with an overview of methodology and limitations for the project.
Chapter 2 and architectural significance, zoning and regulation
constraints on daily operations.
Chapter 3 considers the stakeholder dynamics involved with the proposed project, capturing interviews and opinions of the primary, secondary, and tertiary stakeholders.
Chapter 4 details green technology integration for High Point with an emphasis given to alternative energy generation and green roof components.
Chapter 5 incorporates market analysis findings from the region with preliminary calculations for construction and operational costs.
Chapter 6 summarizes the findings from each section proposes next steps for development.
1.5. Limitations
While the project team set out to be as thorough as possible, there are some areas that were beyond the scope and/or resources of the project team to research. One factor that affected all research areas is that the project team was not granted official access to the roof or to any of the building
The following are other limitations broken out by research area:
History and Operations
Several important documents were unavailable due to confidentiality and security concerns, including the emergency management plan and detailed schematics of the roof. The project team was also unable to meet with building engineers to tour the site or to obtain specific information about fire safety protocol or roof access capacity.
Stakeholder Analysis
Several stakeholders, including the building owners, were not available for interviews. In addition, the survey conducted, while not scientific, will need to be more comprehensive in the future with more specific details about the features High Point when they are finalized.
Green Technology
To conduct a formal analysis of the rooftop environment, specialized equipment is necessary that needs to be in place for a span of several months. This was beyond the scope of the project

High Point Feasibility Study
Heinz College: Fall 2010 Systems Project
7
team, so data from several databases was used to approximate roof conditions.
Economic Feasibility
The data available for tourism numbers in the Pittsburgh region are from 2007, and a study by the State of Pennsylvania will become available shortly following the conclusion of this study with more recent information. To fully assess the interest level and pricing possibilities for High Point, a more detailed market analysis with a more extensive and detailed supply and demand analysis will need to be conducted once a design and features are finalized. Furthermore, the economic feasibility of this project does not provide analysis on the economic contributions and possible impact of High Point on the region.

High Point Feasibility Study
Heinz College: Fall 2010 Systems Project
8
Historic Setting
Milestones Policy and Regulatory Framework Current Building Operations Necessary Changes to Operations

High Point Feasibility Study
Heinz College: Fall 2010 Systems Project
9
2.1. Historic Setting
It is imperative while planning for High Point to give considerations to the historical context of the building. The U.S. Steel Tower has meant many things to many people over the course of its existence.
The U.S. Steel Tower commands immediate attention from the Pittsburgh skyline. The triangular structure is a famed example of post-WW II
-entrant angles at the corners, the width of each flank being
2 The structure is also uniquely symbolic o as a world-headquarters of the steel industry.
Operations Figure 1: U.S. Steel Tower
During initial discussions, it was decided that an innovations committee should be convened for preliminary designs. The architecture firm chosen to design such a key landmark was Harrison & Abromovitz & Abbe, which had recently completed the Alcoa Building, located two blocks from the current location of the U.S. Steel Tower. The principal structural engineers, Skilling, Helle, Christianson, and Robertson would later work on New Reserve Branch in Minneapolis, Minnesota.
2 (Lam)
Operations Table 1: Project Firms
Architects Harrison & Abromovitz & Abbe
Structural Engineers Skilling, Helle, Christianson, and
Robertson Structural Engineers Edwards & Hjorth Mechanical Engineers
Jaros, Baum & Bolles
Electrical Engineers Ebner-Schmidt Associates
General Contractor Turner Construction Company
The 2.7-acre building site included parts of six earlier city blocks. Additionally, there was an active railroad tunnel underneath the site location; a Pennsylvania Railroad tunnel under the building
site was relocated and rebuilt in order to excavate
system now runs through the tunnel and the Steel Plaza Subwconcourse level 3
The project broke ground on March 15, 1967. The first tenants moved their offices into the building in September of 1970.
Weighing less than 30 lbs. per square foot, the cost was reportedly $35 per square foot.4 Located at the
-acre plaza, bounded by Grant Street, Bigelow Boulevard and Sixth and Seventh avenues, creates a park-like setting for Pittsburgh showcase of
5
3 (USX Tower Fact Sheet) 4 (Big Steel Spike: The U.S. Steel Building is a symbol of both an industry and city, 1971) 5 (The Steel Triangle in the Goldern Triangle)
Operations Figure 2: Site Plan

High Point Feasibility Study
Heinz College: Fall 2010 Systems Project
10
Operations Figure 3: Top of the Triangle Restaurant, 1970
Unique Structural Elements Distinct architectural features of the structure include:
Cor-ten Steel Exterior Columns and Walls U.S. Steel Cor-ten is high-strength, atmospheric corrosion-resistant steel that changes to a dark russet color as it ages.
Exterior Steel Primary Framing Interlocking curtain wall system for the exterior walls using Cor-ten steel with stainless steel window frames. Water
Filled Columns Eighteen exterior columns contain 400,000 gallons of
water solution for fire protection. Should a fire impinge on these columns, the water solution will dissipate its heat by convection and maintain the structural integrity of the columns.
Space Frame Hat
In very tall buildings, the most important function of ovide sufficient lateral
strength and stiffness and to resist the driving force 6
To secure the height of the structure, a braced shell
tied to external columns by a space frame hat. This hat develops the tension and compression capabilities of the external columns and mobilizes the loads at the top of the building resulting from thermal movements in the external columns. Utilizing all these added capabilities made it possible to project the triangular structure shell far higher (which functions as a cantilever vertically)
6 (Under the Hat, Water Legs, 1967)
than would have been possible using conventional 7
Upon opening, U.S. Steel made sure its new headquarters would feature first-class amenities. One such amenity was a restaurant on the 62nd floor;
the tower is the virtually
8.
The restaurant, opened and operated by Stouffers®Pittsburghers and visitors alike. Seating 230 guests in a rich, English hunt club atmosphere, the elegant room offers a breathtaking, 50-mile panoramic view
9
Of significant interest is the rooftop and heliport, located above the restaurant. The rooftop heliport is, structural hat, to take the thrust of a vertical takeoff
10
While the heliport has not been used in several decades, the structural integrity of the space remains intact.
Despite the inherent strength of the unique construction experts with first-hand knowledge of the roof construction suggest that any addition to the roof be primarily supported by the
7 (Lam) 8 (The Steel Triangle in the Golden Triangle) 9 (The Steel Triangle in the Goldern Triangle) 10 (Big Steel Spike: The U.S. Steel Building is a symbol of both an industry and city, 1971)
Operations Figure 4: Interlocking Curtain Wall System

High Point Feasibility Study
Heinz College: Fall 2010 Systems Project
11
Further details on this are presented in Chapter 5.11
2Milestones
Since the collapse of the steel industry, Pittsburgh has seen a rebirth. Views from High Point would
transition from an industrial based economy to a center for education, technology, and medical innovation has been a success. Additionally, a project that incorporates green technology, infrastructure and practices may find support within the Pittsburgh community, where Pittsburgh is known as a leading developer of green buildings in the nation.
Pittsburgh, a medium-sized city with 330,000
her development strategy to morph from its former industrial base into a rich, innovative and vital new city 12
st has not been easy to shake with regards to its national reputation. But,
Pittsburgh has been shaking off demographic decline and slowly morphing into an updated version of its former self -- if not as a manufacturing colossus, at least in terms of having thriving street-life, dense, small-scale development supported throughout its neighborhoods, and a sense of economic vibrancy 13 This impressive transition has come about through both the serious effort and the vision of decision-makers long before the smoke
skies. Pittsburgh began addressing and improving its quality of life in the late 1940s, when it began strategizing a change, particularly with regard to environmental quality.
have played a large role in the transformation. Over the course of 50 years,
three distinct periods brought about concentrated change:
11 (Humes & Moller, 2010) 12 (Yang, 2010) 13 (Schulman, 2010)
Renaissance I: Shortly after World War II,
poor air quality. Financed by Richard KDepartment of Health instituted an air quality
Environmental Protection Agency and 14
Renaissance II: Throughout the 1970s, Mayor Richard Caliguiri focused on improving
thereafter, the steel industry began to wane in Pittsburgh and unemployment sharply increased.
Renaissance III: During the 1980s and 1990s
the sharp economic decline in the early 1980s. Pittsburgh fostered new economic strengths through the attention given to the high-tech and higher education sectors. Mayor Tom Murphy
PNC Park and the David L. Lawrence 15
At the time of writing this feasibility study, Western Pennsylvania boasts over 221 green buildings. President Obama, when visiting Pittsburgh in September, 2009 to host the G20, told newspaper
rmed itself, after
16 Pittsburgh can continue to grow and advance in the field of green technology. As such, High Point can showcase advancements in green technology, illustrating the talent and drive that exists in the city for renewable energies and innovative, interactive attractions.
To best capture the momentum of Pittsburghtowards sustainability, Appendix A features critical moments and achievements, specifically with regard to a more sustainably built environment.
14 (Heinrichs, 2009) 15 (Yang, 2010) 16 (Drogin, 2009)

High Point Feasibility Study
Heinz College: Fall 2010 Systems Project
12
Sustainable Milestones: 1993 to present
In 1993, the Green Building Alliance (GBA),
a Pittsburgh not-for-profit organization with the goal of driving market demand for green buildings and green building products, was created. The U.S. Green Building Council (USGBC) began the same year.
In 1998, the creation of the Sports & Exhibition Authority of Pittsburgh and Allegheny County (SEA) later supported the construction of PNC Park, Heinz Field, and the expansion of the LEED-certified David L. Lawrence convention center.
In 2000, PNC, one of the largest financial services companies in the country, debuted
PNC Firstside Center. PNC now claims more green buildings than any other company in the world, with 55 LEED certified structures. The Heinz Endowments, an important and influential philanthropic organization in the region,
construction projects to incorporate green
series of innovative retrofits, among them Pittsburgh Glass Center, the John Heinz History Center, and the Carnegie Museum of Natural 17
In the following years, Pittsburgh saw the opening of the David L. Lawrence Convention Center and the Phipps Conservatory Welcome Center and Tropical Forest Conservatory. The Convention Center is the first and largest convention
Rating for Leadership in Energy and Environmental Design (LEED) certification.
prides itself on maintaining green 17 (O'Toole, 2010)
operational practices throughout day-to-day business.
Phipps Conservatory, located in the Oakland neighborhood, opened its doors in 1893. It was not until 1993, when Phipps Conservatory Inc. signed a 25-year lease with the City of Pittsburgh to take over the management, that Phipps began its own sustainable transformation. Phipps Conservatory and its significance will be discussed more in-depth in the following pages.
In 2007, Pittsburgh City Council passed two important pieces of legislation pertaining to green infrastructure in the city. The legislation accomplished the following:
o Allowed LEED-certified buildings to rise 20% higher and include 20% more floor area than other buildings in their zoning district.
o Passed legislation requiring city-owned buildings with total costs equaling more than $2 million and more than 10,000 square feet that using tax incremental financing (TIF), to be built to the USGBC Silver LEED rating standards.
There are other Pittsburgh structures that transformed themselves through green renovations:
LEED Silver expansion project that installed photovoltaic sources to generate energy.
Union Trust Building
Expects to gain LEED certification for $10 million in energy-saving renovations.18
Bakery Square
Opened in 2010, the former home of a Nabisco plant features about 380,000 square feet of mixed-use retail and office
18 (O'Toole, 2010)

High Point Feasibility Study
Heinz College: Fall 2010 Systems Project
13
space with an array of solar panels on the roof.
As High Point evolves and more stakeholders are engaged, it is important to be aware of successful examples in the Pittsburgh area that may provide insight on the processes and pace of such a detailed, expensive endeavor.
Benchmarking Green Successes PHIPPS CONSERVATORY:
Phipps Conservatory began as botanical gardens and was opened to the public at the end of the 19th century. Phipps has now attracted over 50 million visitors.19 The next phase in the Phipps strategic plan is to create a living building, to be named the Center for Sustainable Landscapes (CSL). A living
produces all of its own energy from renewable resources on site and treats all of it 20 The significance of the CSL is not just for Phipps, but engineering talent of Pittsburgh and other Pennsylvanian firms, the Center will further secure
ation and advancements in the green building movement
21
DAVID L. LAWRENCE CONVENTION CENTER:
The David L. Lawrence Convention Center warrants special attention in our consideration of Pittsustainable milestones as it provides an exemplary case of how large projects can be completed using public-private partnerships (in this case government, corporate and not-for-profit organization
In 1990, officials requested $150 million from the Commonwealth of Pennsylvania for necessary expansion competitiveness as a convention destination. Eight
19 Phipps Conservatory. A Historical Perspective. 20 (Phipps Conservatory) 21 (Phipps Conservatory)
years later, Mayor Tom Murphy and Allegheny an
that would use hotel and sales taxes for the convention center project. Pitching the convention center as the flagship for a greater Pittsburgh, Governor Ridge moved in support of the plan and released $150 million in state funding. The Southwestern Pennsylvania Convention Center Design Commission initiated a $750,000 design competition, funded by the entire Pittsburgh foundation community. The design competition ensured the highest quality design proposals that ultimately gave way to a world-class convention center. The convention center has since become
riverfront, in the heart of the downtown business district.
2.3. Regulatory and Planning Framework
The U.S. Steel Tower is located in the Golden Triangle District. The Golden Triangle District is intended to maintain and enhance the Golden Triangle as the economic and symbolic core of the region while supporting and developing commercial, office and cultural uses. Furthermore the District aims to develop an attractive, pedestrian-oriented physical environment that will enhance its regional significance.22
The U.S. Steel Tower is located in Subdistrict B. Each subdistrict contains slight variations, but with the same overarching goal defined by the Golden Triangle District, Subdistrict B develops office-type business activity to be readily accessible to the retail core area and promotes high-density, high-rise office buildings with related facilities. Also, a site located in Subdistrict B must provide urban open space. On lots of 20,000 square feet or more, at least 10% will be devoted to urban open space at ground level.
22 (City of Pittsburgh, 2009)

High Point Feasibility Study
Heinz College: Fall 2010 Systems Project
14
By highlighting the benefits of the project and showing direct benefit to the city of Pittsburgh, High Point can navigate the zoning process efficiently and effectively.
With current zoning in place, development of an attraction at the top of the U.S. Steel Tower does not contradict any zoning ordinances for the Golden Triangle District or Subdistrict B. No variance or adjustment from the zoning board is needed. However, the process to develop an attraction would have to comply with all permitting and procedures of the City Planning Department and zoning approval must be verified before construction can begin. Zoning can quickly become a political device, and can either stall or propel a project of this size. It is vital to develop and maintain the support of city officals who can help promote High Point. By highlighting the benefits of the project and showing direct benefit to the city of Pittsburgh, High Point can navigate the zoning process efficiently and effectively.
From a process standpoint, there are several hurdles the project needs to overcome in order to gain city consent and community support, The owner of the the U.S. Steel Tower or an agent acting on behalf of the owner needs to compile and submit an application with the city for zoning approval. The application must include technical reports certifying engineering feasibility and environmental concerns that need to be stamped by the necessary professionals and submitted for preliminary review by the Bureau of Building
23 Zoning code restrictions, community concerns, design review and any outstanding environmental concerns need to be addressed in one or more meetings prior to submitting an application.
Finally, the application is submitted for review along with a development review fee. Department of City Planning will review all compiled information and if it passes all necessary requirements the department will schedule a Planning Commission hearing for the proposed project.
23 (Layman, 2010)
In addition to the standard building and occupancy permits that will be required by the city, if a price is
charged for entrance into the space of the U.S. Steel Tower, the owners or operators must obtain an amusement permit from the city. The fee for an amusement permit changes yearly and depends on the attendance figures.
While obtaining all current zoning and permit requirements will take time, there are established procedures,
fees and offices with the Department of City Planning that High Point can work with and coordinate with developers in order to ensure timely completion. Building a large scale attraction at the U.S. Steel Tower would be a large endeavor for an entity taking on the project and will also change the downtown landscape of Pittsburgh. The planning stage of the project and obtaining support from the City of Pittsburgh is crucial for the zoning process, and should be completed in an inclusive manner, where concerns from the City Government, downtown residents, nearby offices and business are addressed.
2.4. Current Building Operations
Location
On average 7,000 tenants and visitors enter the U.S. Steel Tower daily.24 Situated on 2.7 acres of land, 60% of the sitelarge plaza for pedestrian traffic and outdoor seating area.25 While in the heart of downtown Pittsburgh, the U.S. Steel Tower is easily accessible by both public buses and light rail transit service. The building also includes a three-level parking garage. The downtown location is within close proximity to numerous Pittsburgh historic sites, hotels and the Point will be the pinnacle of any Pittsburgh attractions, tourists and business visitors will also be able to visit nearby historic attractions
24 (Chief Engineer Report) 25 (Chief Engineers of Chicagoland Association, 2010)

High Point Feasibility Study
Heinz College: Fall 2010 Systems Project
15
throughout the Central Business District, and the bustling Strip District nearby.
Operations Table 2: Inside the Building26
Space 2.9 million sq. ft. Elevators 56
6 elevator banks Escalators 9 Tenant Space per floor
41,000 sq. ft.
Windows 11,000 Maintenance Crew 24 members
Lobby Café
Retail Shops Bank
Restaurants Security
As a high profile building in the city center of a post-September 11th world, building access and emergency management are top priorities for the owners, management team and the city of Pittsburgh. High Point must address additional security and emergency planning.
Currently, tenants have 24-hour access to the building if they present a valid security identification pass to the security desk. Visitors must be registered with a tenant and are given a temporary card that shows who they are with and floors they may access.
2.5. Necessary Changes to Operations
Based on the volume of visitors expected to High Point (see Chapter 5 for visitor estimates), significant changes will need to be made to the building s operations to accommodate them, especially in regards to access and security.
Roof Access & Security Issues
Currently, accessing the roof requires taking an elevator to the 60th floor, transferring to a small, private elevator that travels to the 64th floor, and 26 (Chief Engineers of Chicagoland Association, 2010)
then taking a small escalator to the roof. While a formal analysis of the fire code and capacity restrictions for this access path was beyond the scope of the study, several project team members had the opportunity to visit the roof of the building using the described method and determined that it is insufficient for accommodating a large volume of visitors.
Four freight elevators travel to the 64th floor which could be adapted for use by High Point, but according to experts who have used this access method, it would still require modification. Reducing the number of elevators available to building management and tenants would also negatively impact current operations.27
An increase in the number of daily visitors would also impact the current security practices of the building. High Point visitors will need quick and direct access to the roof, and currently any non-tenants must register with security before proceeding to the elevators. Tenant and visitor security would therefore need to be separated, and managing that separation would be a challenge for building management and security personnel.
Possible Solution: External Elevator
One of the proposed solutions for solving access and security issues proposed prior to this study was to build an external elevator that would be solely dedicated to transporting visitors to and from High Point. To assess the feasibility of this solution, the project team interviewed several experts. Based on their opinion, such an elevator would be possible, and the unique exoskeleton of the U.S. Steel Tower may actually provide convenient means to anchor the elevator to the building.28 A great deal of in-depth structural and architectural analysis is required to confirm this.
This solution is costly. To install two 4500 lb. traction elevators that could hold up to 25 passengers each, which is similar to the configuration of elevators currently installed in 27 (Humes & Moller, 2010) 28 (Humes & Moller, 2010)

High Point Feasibility Study
Heinz College: Fall 2010 Systems Project
16
It is law to submit an All
Emergency Management
safer, more prepared City.
residents
it is estimated to cost over $6 Million.29 Such an elevator could also serve as a unique attraction in itself, further adding to the draw of High Point.
Next Steps
City ordinance requires the building to submit a hazard plan that outlines security procedures and technology, hazardous materials on the premises, utility information, floor plans, blueprints and an evacuation protocol for approval.30 The city requires a new plan to be submitted if any addition is made to the current structure. Regardless of how High Point addresses access and security, they must coordinate and city officials.
While creating a popular tourist destination on the top of a structure might complicate security risks to the building and surrounding area, it does not prohibit the creation of High Point. Providing access while maintaining high security standards has been done for many tourist destinations across the country after September 11th. The Willis Tower Skydeck in Chicago was briefly closed down after September 11th and upgraded their security equipment and changed operating procedures in order to meet stricter federal standards. While security is a crucial and complex component of High Point, it has precedent and has been successfully accomplished by many top destinations across the country.
29 (Humes & Moller, 2010) 30 (City of Pittsburgh, 2003)

High Point Feasibility Study
Heinz College: Fall 2010 Systems Project
17
Stakeholder Dynamics
Methodology Stakeholders Conclusions
High Point Feasibility Study
Heinz College: Fall 2010 Systems Project
18
When starting our analysis for this project,
would be affected by the development and construction of High
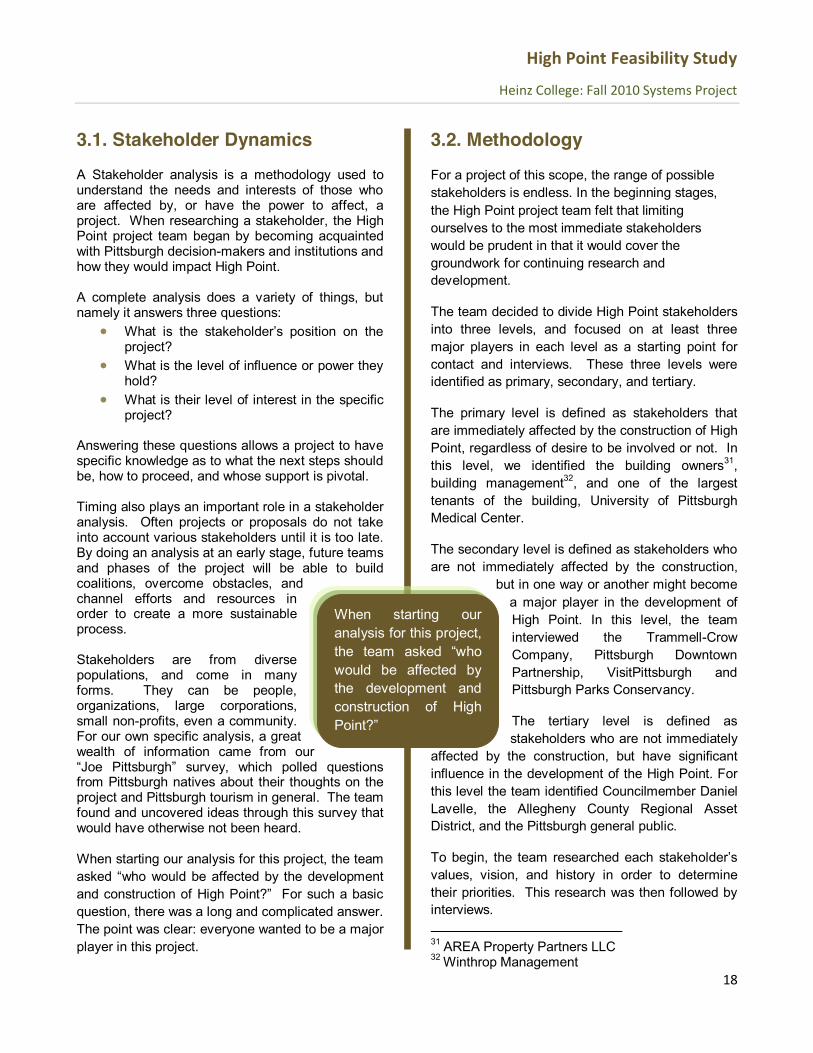
3.1. Stakeholder Dynamics
A Stakeholder analysis is a methodology used to understand the needs and interests of those who are affected by, or have the power to affect, a project. When researching a stakeholder, the High Point project team began by becoming acquainted with Pittsburgh decision-makers and institutions and how they would impact High Point. A complete analysis does a variety of things, but namely it answers three questions:
project?
What is the level of influence or power they hold?
What is their level of interest in the specific project?
Answering these questions allows a project to have specific knowledge as to what the next steps should be, how to proceed, and whose support is pivotal. Timing also plays an important role in a stakeholder analysis. Often projects or proposals do not take into account various stakeholders until it is too late. By doing an analysis at an early stage, future teams and phases of the project will be able to build coalitions, overcome obstacles, and channel efforts and resources in order to create a more sustainable process. Stakeholders are from diverse populations, and come in many forms. They can be people, organizations, large corporations, small non-profits, even a community. For our own specific analysis, a great wealth of information came from our
from Pittsburgh natives about their thoughts on the project and Pittsburgh tourism in general. The team found and uncovered ideas through this survey that would have otherwise not been heard. When starting our analysis for this project, the team
question, there was a long and complicated answer. The point was clear: everyone wanted to be a major player in this project.
3.2. Methodology
For a project of this scope, the range of possible stakeholders is endless. In the beginning stages, the High Point project team felt that limiting ourselves to the most immediate stakeholders would be prudent in that it would cover the groundwork for continuing research and development.
The team decided to divide High Point stakeholders into three levels, and focused on at least three major players in each level as a starting point for contact and interviews. These three levels were identified as primary, secondary, and tertiary.
The primary level is defined as stakeholders that are immediately affected by the construction of High Point, regardless of desire to be involved or not. In this level, we identified the building owners31, building management32, and one of the largest tenants of the building, University of Pittsburgh Medical Center.
The secondary level is defined as stakeholders who are not immediately affected by the construction,
but in one way or another might become a major player in the development of High Point. In this level, the team interviewed the Trammell-Crow Company, Pittsburgh Downtown Partnership, VisitPittsburgh and Pittsburgh Parks Conservancy.
The tertiary level is defined as stakeholders who are not immediately
affected by the construction, but have significant influence in the development of the High Point. For this level the team identified Councilmember Daniel Lavelle, the Allegheny County Regional Asset District, and the Pittsburgh general public.
To begin, the team values, vision, and history in order to determine their priorities. This research was then followed by interviews. 31 AREA Property Partners LLC 32 Winthrop Management

High Point Feasibility Study
Heinz College: Fall 2010 Systems Project
19
High Point would add value, increase recognition, and potentially be a profitable addition.
Based on this preliminary research, coupled with available personal interviews from stakeholder organizations, the team created a stakeholder map showing next steps for the project as well as a power and influence matrix, which is a very simple tool to help a project categorize the power and influence different stakeholders have.
of the project, a less direct approach was taken. The team created an online survey primarily distributed by Pittsburgh blogs and social media. This survey had nine questions that focused on Pittsburgh tourist recommendations (e.g. What attraction do you recommend to friends visiting Pittsburgh?) and made specific inquiries about ideas for what could be built on top of the U.S. Steel Tower. While the survey was not distributed using random sampling and is limited in its population, the data represents important considerations for the project.
3.3. Stakeholders
Below are the descriptions of the three levels of stakeholders.
3.3a Primary Stakeholders Stakeholders Table 1: Primary Stakeholders and Priorities
Stakeholder Organization Policies and Priorities
PNC Green Space AREA Partners Value of Property Winthrop
Management AREA Partners policies
Building Ownership Area Property Partners (formerly known as Apollo Real Estate Advisors) owns the majority of the U.S. Steel Tower and has for the past several decades.33 They were recently in the news in the fall of 2010 33 (Elliot, 2005)
when they were looking for ways to refinance their debt on the U.S. Steel Tower, and they have attempted to sell their ownership in the building for the past five years.34
APP was founded by Apollo Global Management, LCC as Apollo Real Estate Advisors in 1993. Headquartered in New York City and with offices around the world, APP has nearly 175 investors globally, with nearly $11 billion dollars of equity
invested properties around the world.35
Interviewing APP was a challenge in this stakeholder analysis, and one that was ultimately not met.
It has been speculated that primary concern is the sale of the majority portion of the building. That
being said, High Point might be a desirable venture for APP profile recognition, and, as detailed in chapters 4 and 5, potentially add value to the building. It is important to note that APP has not openly responded to the project negatively, or stated that they would not support its development. If and when
the U.S. Steel Tower is settled, APP should be contacted again to gauge their ongoing interest.
Building Management- Winthrop Management Winthrop is the main management company that APP uses for most of its properties in the United States.36 They also manage for Winthrop Reality Partners, which was established in 1975 and now manages more than 35 commercial properties across the country. Winthrop Management is based in of Boston, Massachusetts.37 Since Winthrop Management is tied to the directive of APP, it is assumed that any policy APP takes toward High Point will be the same for Winthrop Management.
34 (TribLive Article, Oct.8th 2010) 35 (Area Property Partners Website) 36 (Withrop Management Website) 37 (Withrop Management Website)

High Point Feasibility Study
Heinz College: Fall 2010 Systems Project
20
Building Tenants- PNC The Pittsburgh National Corporation found its beginnings in 1852 at the corner of Fifth Avenue and Wood Street, where it has been since. In 1982 Pittsburgh National merged with Provident National to become PNC Financial Corporation, and has been merging with other banks to become one of the largest financial corporations in the country.38 PNC is one of the top 3 leaseholders (the others are US Steel Corp and UPMC) in the U.S. Steel Tower, holding the rights to nearly 10 floors, and is expected to renew when its lease is due to expire in 2013. As one of the top leaseholders, it has a unique opportunity to continue one of its corporate initiatives: green design. PNC holds madesign by a bank. Quoted by the Green Building
39 By Buildings
generations to better understand how the built environment can complement the natural environment. 40 It won the Urban Land Institutes Award for Excellence, and has been recognized by the Harvard Business Review as a national leader in Green Building. It comes as no surprise then when interviewing a high level manager at PNC in Pittsburgh, they
the top of the building, and would (if there was green space) have an even stronger opinion of the
41 (With the caveat that PNC is not looking for more space to rent in the building). While our conversation was brief and to the point, the representative said that PNC has been generally satisfied with management and ownership, and while it has no immediate plans to expand, it does have a commitment to green design. 3.3b Secondary Stakeholders 38 (PNC Corperate History Webpage) 39 (Alliance) 40 (Magazine) 41 (Representative P. , 2010)
Stakeholder Table 2: Secondary Stakeholders and Priorities
Real-Estate Developer- Trammell-Crow Company Based in Dallas, Texas, Trammell-Crow is an independent subsidiary of CB Richard Ellis, the main leasing agent for the U.S. Steel Tower. Founded in 1948, it has developed or acquired over 500 million square feet which is valued in excess of $50 billion.42
Trammell-Crow is located in 15 major cities across North America, serving all types of land-use. Besides development, it also serves investors in a variety of ventures, funds, and consulting projects.
Our interview with a Senior Vice President of Trammell-Crow in Pittsburgh was informative and descriptive. The Senior VP not only spoke from a stakeholder s perspective but gave insight into what the process of developing a project like High Point would look like.
When asked what the main challenges would be for a project such as High Point, his answer was twofold:
Permits and Approvals Financial Considerations
The City (and all municipalities) has fairly stringent building codes that require a lengthy review and
42 (Trammell-‐Crow main page)
Stakeholder Organization Policies and Priorities
Trammell-‐Crow Being premier real estate developer/operator
Pittsburgh Downtown Partnership
Responsible/sustainable development
Visit Pittsburgh Increase in
tourism/convention events
Pittsburgh Parks Conservancy
Green space and its maintenance

High Point Feasibility Study
Heinz College: Fall 2010 Systems Project
21
approval of a completely detailed set of construction drawings before a building permit will be granted. This will require a substantial investment in architectural and engineering expertise and I would say that the nature of your project (especially if it includes the new external elevator) would be a challenging review for the public side. New construction will require that all current codes are complied with, meaning you may be responsible for modifying existing building systems that interface with your project (i.e. the stairwell that leads from the roof to the 62nd floor may have been sized for a helipad occupancy of 20 people tops now you may be required to show that your max occupancy can exit properly, and if not appeal for a variance or come up with the money to make the necessary changes to accommodate your population. That is one of dozens of things like it that will come up). 43
The second obstacle of financials was outlined by explaining:
Raising money just for the design, which will be needed before you can get all your approvals, is not insubstantial. A good rule of thumb is 25% of the
the remaining 75% for hard costs (which would include acquisition which you may not have here just an operating cost in the form of rent). Raising this money will require that you have all the political entities on board, and that they are more than passively supportive they need to help rally the troops and go out and support the project publicly. That means that your team will need to have the next topic conquered as well. 44
As with all stakeholders, the team asked the question of green design and what role it should play in the construction. The representative stated that while sustainability was important, design was just as significant. The project has to utilize sustainable principles in
its design and construction to the degree they are viable and make sense financiallyas a lab or anything educational in that regard we have plenty of people working in that area in this 43 (Representative T.-‐C. , 2010) 44 (Representative T.-‐C. , 2010)
city right now it DOES have to be architecturally significant, if for no other reason, because it will be affiliated with an architecturally significant building. I would keep sustainability as a core principal, but focus on what the project will mean to the city as a means of moving our image forward, and marketing
it will get all the free marketing we need from the very fact that we have this (and other) amazing developments. 45 Community Development Organization- Pittsburgh Downtown Partnership (PDP)
downtown area of Pittsburgh the top destination in the region to live, work, and enjoy. Through partnerships with local organizations and property owners, they advocate for clean and safe streets to attract residents from all around. They achieve this by marketing, cleaning, safety initiatives, and providing housing/transportation programs.46
While our interview was brief, a representative of the PDP board was clear in what they felt was the main idea at stake with such a project as High
they did not think (and that PDP generally felt) downtown Pittsburgh should look like Times Square. The representative felt that PDP as an organization had a unique view of what the downtown area of Pittsburgh can offer, and thought tinstallation on top of the building would be redundant: this attraction should reflect the look
47
Pittsburgh Parks Conservancy (PPC) PPC is a not-for-profit organization dedicated to the Pittsburgh park system and its maintenance. It was founded in 1996, and has a constituent base of over 8,000 members.
45 (Representative T.-‐C. , 2010) 46 (Pittsburgh Downtown Partnership Website) 47 (Representative P. , 2010)

High Point Feasibility Study
Heinz College: Fall 2010 Systems Project
22
new stories are always preferable, there always has to be a unique
s parks by raising money for their conservation and improvement, and has been an advocate for green spaces all over Pittsburgh in mainly four city parks: Frick, Schenley, Highland, and Riverview.
lity of life for the people of Pittsburgh by restoring the park system to
48
sustainable park system whose landscapes, facilities and programming set world standards of
49
When asked , Susan Rademacher, saw the relationship between PPC and High Point developing in the future, her response was the following:
PPC could either work as a partner in the development project or as a consthat PPC would provide consulting services during the planning, design, and construction phases as a member
team. 50
When asked why an attraction on top of the U.S. Steel Tower would be beneficial for the community,
Glover t will provide a unique experience
provides the city with a stunning moment of discovery. 51
Finally, our last question involved how success might be defined for this study, and her response was a guiding principal in the formation of this
The project investigation will be a success
48 (Pittsburgh Parks Conservancy) 49 (Pittsburgh Parks Conservancy) 50 (Rademacher, 2010) 51 (Rademacher, 2010)
if it tests, rejects, and advances increasingly realistic concepts and strategies for High Point. 52
VisitPittsburgh (VP) Established in 1935, VisitPittsburgh is an organization dedicated to tourism and promotion for the Allegheny County area.
VP was extremely helpful in our market research due to their analysis of Pittsburgh tourists and demographics. Visit Pittsburgh is a voice of support for High Point and its investigation, and its Associate Director of Marketing and Communications Lynne Glover and Executive Director of Marketing and Communications Beverly Morrow-Jones made that perfectly clear when we met with them:
-open in terms of what will go on top. Our view is that High Point will be
the Steelers, Mt. Washington, and the 53
new and innovative things that will not only draw tourists to Pittsburgh, but convert them
angles and new stories are always preferable, there always has to be a unique twist to a project. The media will always give attention to something that is new and innovative, i.e. the biggest, largest, tallest,
54
When asked about possible green technology, she
growing interest in green technology, and there would be no point environmentally groovy. The U.S. Steel Tower could be a model for green roofs everywhere, being
55
Finally, when asked about possible attractions that could be built on top, her answer was similar with
52 (Rademacher, 2010) 53 (Glover, 2010) 54 (Glover, 2010) 55 (Glover, 2010)

High Point Feasibility Study
Heinz College: Fall 2010 Systems Project
23
what most said, in that she would like to see a restaurant without a doubt, and a possible convention space that would be able to accommodate a few hundred people.
3.3b Tertiary Stakeholders Table 3: Tertiary Stakeholders and Priorities
Stakeholder Organization Policies and Priorities
Councilman Daniel Lavelle
Augment downtown environment
Allegheny County Regional Assets Support civic facilities
Pittsburgh General Public -‐ Survey
Making sure project is well planned
Daniel Lavelle, City Councilmember Daniel Lavelle was elected as the 6th Councilmember in November of 2009, taking office in January of this year, so his experience with development projects downtown is limited. However, he is the most immediate elected official for the Golden Triangle and is therefore pivotal in the formulation of the High Point.
After repeated attempts of contact, Mr. Lavelle was unable to respond to our questions by the writing of this report. Regardless, we can assume a few facts based on good development and political practice:
Any development that attracts more business and capital into his district is worthy of support.
An attraction that can incorporate community would be favorable.
An attraction constructed with the least amount of public dollars invested is favored.
Political support will be a cornerstone of the construction of any attraction on top of the U.S. Steel Tower. Truthfully, this project will need many champions and one of them will need to represent the political interests of the region and location. Without that support, the likelihood of success is nominal if not impossible. City, County, and even
State support will be necessary not only for funding, but as the representative of Trammell Crow stated,
Allegheny Regional Assets Districts (RAD) When researching possible funding, RAD immediately stood out as a likely partner. Fifteen years old, RAD uses a 1% County Sales tax to support and finance regional assets in the area such as libraries, parks, cultural centers, sports and civic facilities, among many other types of
Executive Director David Donohoe for an extensive interview.
Throughout our project the incorporation of the word sed alarm with multiple
former government employees, but Mr. Donohoe
organization proposed calling it a park, it would not be eligible. Parks need to be 200 acres to be eligible for park funding, and the only exception is if
56
When asked about the possibility of RAD funding for High Point, Mr. Donohoe was clear that while the six board members of RAD must agree when funding a project, High Point fell into the type of prbe eligible, as long as it was operated by a 501 c3. If that was the case, High Point would be free to apply for capital funding as well as operating
56 (Donohoe, 2010)

High Point Feasibility Study
Heinz College: Fall 2010 Systems Project
24
3.3d Survey Table 4: Pittsburgh General Public Survey
Pittsburgh General Public- The Survey For High Point, public support is essential. A project of this scope is meant to capture the
without the input of Pittsburgh. The team set out to take the pulse of the city by creating a survey online, achieving a sizable first response and giving us a snapshot .
The people that responded were generally between the ages of 25-39 or 50-65, accounting for more than 80% of the response. Predominately female (70%), only 57% were native to Pittsburgh.
When asked, something in Pittsburgh to a tourist, what would you recommend,Incline and Mt. Washington. These answers show that a staple of Pittsburgh is incredible views of the city, something High Point would capitalize upon in its unique location.
ructed on a rooftop downtown, what would you want it to
space or a garden space.
visit an attraction that incorporated green technology than one that did no(66.7%) said that they would be more likely to visit.
0.0% 20.0% 40.0%
MuseumsSporting Restaura
ParksOther
1: What attractions in the Pittsburgh area do you take the most pride in?
Response Percent
0% 20% 40% 60%
Other
Parks
Cultural Events
Museums
Sporting
2. What attractions in Pittsburgh do you or your family visit on a regular basis?
Response Percent
0% 20% 40% 60%
$0
$1-‐$10
$11-‐$20
$21-‐$30
$31-‐40
$41-‐50
$51-‐$60
5. How much would you be willing to pay for an attraction?
Response Percent
Survey Results
o Museums o Parks o Neighborhoods(Strip, Squirrel Hill)
Popular attractions for HP:
o Art and Music Space o Bar/Restaurant o Park/Green Space o Observation Deck o Amusement Park
Willingness to Pay for HP Attraction:
o $0 - $60: 75% below $20
Number of Responses: 50

High Point Feasibility Study
Heinz College: Fall 2010 Systems Project
25
Power/Influence of Stakeholders
3.4. Conclusions Stakeholder Table 5: Stakeholder Map
Need to Change
Area Partners Winthrop
Management
Key
Councilman Daniel Lavelle
Regional Assets District
Pittsburgh Downtown Partnership
Trammell-Crow
No Immediate Action
VisitPittsburgh
Pittsburgh Parks Conservancy
PNC
Show Consideration
Above is the Stakeholder map, showing our analysis of where High Point needs to pursue further action with each stakeholder. The guide below, further explains each action.
There are steps that need to be taken in regards to the ownership and management. Without their support, success is not within immediate reach of High Point. Only with the key support of either City Council or a funder like RAD will High Point begin to jump the hurdle of dream to reality.
Finally, the team synthesized all of the stakeholder information to create a Stakeholder power and influence matrix, shown on the next page.
Interest of Stakeholders
Guide to Stakeholder Map
Need to Change
engage & consult try to increase level of interest aim to move into right hand box
Key
focus efforts on this group involve in governance/decision making bodies engage and consult regularly
Show Consideration
make use of interest through involvement in low risk areas
keep informed & consult on interest area potential supporter/goodwill ambassador
No Immediate Action
minimum effort keep informed aim to move into right hand box

High Point Feasibility Study
Heinz College: Fall 2010 Systems Project
26
Stakeholder Table 6: Power and Influence Matrix
Stakeholder Power Influence Attitude Sphere Comments AREA Partners/
Winthrop Management
3 3 0 Need to Change
The building owners have little to no interest in seeing the project completed, however they have not been completely closed to conversations about development. They may not have the rights to the rooftop.
PNC 1 2 1 Show Consideration
The Green Design Initiative might be a large asset to HP
Visit Pittsburgh 0 1 3 Show Consideration
Visit Pittsburgh provides major support for the project, and will benefit from increased tourism exposure. They can speak publicly on
Pittsburgh Parks Conservancy
0 1 2 Show Consideration
HP will mostly likely
se, which changes the relationship
Pittsburgh Downtown Partnership
1 1 1 No Immediate
Action
Trammell-Crow 2 3 2 No Immediate
Action
Trammel-Crow could be a likely supporter and give a wealth of development knowledge
Regional Assets District
3 3 0 Key The decision to participate ultimately lies with the Board, who we did not speak with, however specific elements included in HP make funding more likely.
City Council 3 3 Key
Scale: Positive 1-3, Negative 1-3

High Point Feasibility Study
Heinz College: Fall 2010 Systems Project
27
Strong ground support for High Point is necessary for High point to move forward as well. Like the representative of Trammel-to move a project of this scope is to mobilize the
VisitPittsburgh, or even community development organizations like PDP, High Point will have a difficult time gaining the momentum to catch the attention of key players like RAD and elected officials. In terms of stakeholders, it is a step by step process for the path to approval for High Point.
There were no surprises when putting the matrix together, as the influence and power were inherent in the analysis done during the interviews and research portion of our report. To reiterate, the project must first rally support from the ground up to attain approval by elected officials and funders. With that support, they will then be able to lobby the ownership and management for approval to begin development of the High Point project.

High Point Feasibility Study
Heinz College: Fall 2010 Systems Project
28
Green Technology Integration Methodology
Findings Analyzing Benefits and Costs Potential Funding Sources

High Point Feasibility Study
Heinz College: Fall 2010 Systems Project
29
4.1. Green Technology Integration
With a growing trend towards more sustainable energy practices, the spotlight has turned to buildings, which have been shown to be among the largest consumers of electricity in the United States.57 According to the Energy Information Administration, commercial buildings are responsible for over 70% of electricity consumption and nearly 40% of greenhouse gas emissions.58
Green buildings can provide significant benefits to owners, tenants, and customers. According to a report published by Turner Construction in their 2008 Green Building Market Barometer, 72% of executives surveyed responded that green buildings have higher building values, 65% said that asking rents are higher, 52% responded that there is a greater return-on-investment (ROI) and 49% said that the green buildings resulted in higher occupancy rates.59 In addition to bottom-line financial figures, executives also said that green buildings result in higher quality of life for workers (76%) and greater worker productivity (46%).60 Building owners also get a boost from the recognition and acclaim that green buildings produce among the public and in the media. Owners can tout the benefits of such a space at the pinnacle of the U.S. Steel Tower to attract tenants who are environmentally conscious and want to do business in a place that is consistent with their values.
Western Pennsylvania, and Pittsburgh in particular, has demonstrated a commitment to green building practices and techniques. As detailed in Chapter 2, the David L. Lawrence Convention Center in downtown was the first LEED certified convention center in the world. Its energy saving techniques, such as natural ventilation and the use of sunlight, saves the equivalent of the combined annual energy usage of 1,900 households.61 The
57 (Green Building Alliance, 2010) 58 (Green Building Alliance, 2010) 59 (Turner Construction, 2008) 60 (Turner Construction, 2008) 61 (Green Building Alliance, 2010)
ble energy from solar photovoltaic panels on site and supplements it with energy purchased from wind and hydroelectric sources.62 PNC has the largest number of newly constructed green buildings of any corporation in the world, and is the first U.S. bank to apply sustainable building techniques to all new buildings.63
High Point is another chance for Pittsburgh to build on its environmental credentials to create a world-class attraction that draws tourists to the region while also educating the public about the importance of alternative energy. During the course of the project, the team considered various other technologies, some in different stages of development, including fuel cells, aeroelastic flutter, traditional photovoltaic cells and various types of rooftop gardens.
In subsequent sections, alternative energy techniques are discussed in greater detail, laying out the estimated economic costs, benefits, drawbacks, and other details about each technology. The methodology, potential funding sources that should be researched, and recommendations for further study are also included.
4.2. Methodology
The primary goal of this analysis was to strike a balance between practical technologies that can currently be utilized on the roof, while anticipating future technological innovations that are not yet developed. Four areas of green technology were investigated:
1) Solar 2) Wind 3) Fuel Cell 4) Green Roof
These three were initially chosen due to their greatest promise relative to feasibility and cost. Through expert interviews, literature reviews and
62 (Green Building Alliance, 2010) 63 (Green Building Alliance, 2010)

High Point Feasibility Study
Heinz College: Fall 2010 Systems Project
30
database research, each technology was evaluated based on its power generation potential relative to
other benefits or drawbacks.
4.3. Findings
The following sections provide details on each technology researched by the project team.
4.3a Alternative Energy Technologies A major obstacle to the inclusion of energy generation technologies is determining how elements of the surrounding environment, such as buildings or trees, can obstruct wind and the sun. The height of the U.S. Steel Tower provides an opportunity for renewable technologies because there are no obstructions blocking these resources.
Solar Solar Photovoltaic (PV) panels convert sunlight into DC electricity using a semiconductor material such as monocrystalline silicon, polycrystalline silicon, cadmium, or other material. Solar photovoltaic technology is the fastest growing power generation technology in the world, and is currently used in over 100 countries.64 It has existed since the 1950s and has been used to power everything from satellites to calculators.65
Solar photovoltaic technology creates electricity by first absorbing sunlight, then freeing the electrons in the semiconducting materials, which produces electricity. One of its key benefits is that after installation, there is little cost of maintenance or upkeep. One of the biggest drawbacks, however, is the relative inefficiency of solar panels. Monocrystalline panels are between 15-20% efficient, and polycrystalline panels are even less so, with 10-12% efficiency.66 This inefficiency means that large swathes of area must be 64 (Renewable Energy Policy Network for the 21st Century, 2010) 65 (Green Building Alliance, 2010) 66 (Lee, 2010)
dedicated to solar panels in order to generate meaningful amounts of electricity. In addition, if there is insufficient sunlight, solar panels cannot produce electricity at peak efficiency.
In Pittsburgh, the yearly average solar insolation on a horizontal surface is 3.55 kWh per square meter per day or approximately 1500 kWh per square meter per year.67 Solar insolation is the measure of solar radiation received at a given surface area over a given time frame. In other words, the Pittsburgh region receives on average of 1500 peak sun-hours per year.
Traditional photovoltaic panels must be mounted to the roof structure, which is an expensive and time-consuming process and, especially given the difficult location they will need to be installed on for High Point. However, a relatively new technology called thin-film solar photovoltaic, does not need to be mounted and therefore is less costly to install.
Thin-film solar PV is made by imprinting a thin layer of semiconducting material on glass, metal, or plastic. Though thin-film photovoltaic is relatively inefficient compared to traditional PV, groundbreaking advances in solar technology are pushing efficiencies higher.
Currently, First Solar, the largest manufacturer of thin-film solar modules in the U.S., produces a 12% efficient photovoltaic cell68, which is as of now the most efficient thin-film on the market.69 While less efficient, thin-film costs significantly less to produce than traditional photovoltaic panels (about $0.85 per watt vs. about $2.50-$3.00 per watt).70
The application of thin-film is growing. Wal-Mart Stores, Inc. recently announced that it would install
67 (Mantha, 2008) 68 Like all solar power, inverters are needed to convert from DC to AC; this conversion process, along with shading, mismatch, soiling, and line losses contribute to the derate factor. The derate factor is the percentage of power that can is actually converted into usable AC electricity. 69 (Zervos, 2010) 70 (Zervos, 2010)

High Point Feasibility Study
Heinz College: Fall 2010 Systems Project
31
thin-film at 30 of its locations in California and Arizona, which is expected to supply between 20%-30% of the overall energy demand for each store.71
Based on our calculations presented later in this chapter, thin-film solar has the potential to generate over 13,000 kWh annually for High Point.
Wind Turbines
Wind turbines have become increasingly popular in an effort to increase building energy efficiency. Businesses in the Commonwealth of Pennsylvania that have implemented wind technologies include restaurant, which installed a Windspire® locations in Pittsburgh, PA.72 Also, the Philadelphia Eagles announced in November of 2010 that the NFL team would install eighty twenty-foot high wind turbines on the roof of its stadium.73
According to the National Renewable Energy Lab (NREL), the Pittsburgh region has an average wind speed of 11 mph at 80 meters above ground level.74 Based on this data, it was determined that the wind speed at the top of the U.S. Steel Tower would be on average approximately 22 mph. (See Appendix B). The high wind speeds present a tremendous opportunity to take
71 (Gupta, 2010) 72 (Panizzi, 2010) 73 (Belson, 2010) 74 (U.S. Department of Energy, 2010)
advantage of this renewable energy source for the High Point project.
Both vertical axis wind turbines (VAWT) and horizontal axis wind turbines (HAWT) were considered in this analysis. To be appropriate for High Point, wind turbines were required to meet the following criteria:
Ability to withstand wind speeds at or above 100 mph to ensure safe operation in various weather conditions.
Capability to generate energy at variable wind speeds.
Require a minimal amount of infrastructure space on the rooftop structure.
Turbine life of at least 20 years.
One factor in determining whether a VAWT or HAWT is a better fit for the High Point is to identify which operates better in turbulent winds. High-speed wind gusts are common in urban environments due to building structures forcing winds to collide and change direction, and some have found that VAWT would theoretically operate more efficiently in turbulent wind environments.
generally have a smaller physical Green Figure 2: Wind Map
Green Figure 1: Renderings of Lincoln Financial Field

High Point Feasibility Study
Heinz College: Fall 2010 Systems Project
32
feasibly be installed in the limited space available on High Point.75 However, it is important to consider that there will be advancements in technologies and additional research will need to be conducted to determine which models will be best suited for unique High Point environment.
Of the three VAWT that were analyzed, the 1.2 kW Windspire® is the most appropriate model based on the lower purchase cost, minimal square footage required for installation, and annual energy production. With wind speeds of 22 mph, the Windspire® is expected to generate 3,660 kWh of energy each year. Given the average commercial rate of electricity in Pennsylvania at $0.10 per kWh, annual energy savings would amount to $366 per turbine (See Appendix C). With installation costs included, the payback period for the unit would be approximately 14 years. This is a shorter amount of time compared to the payback period of other turbines, which can be up to 40 years. Most importantly, from the end of the payback period until the end of the life of the unit, the turbine would generate revenues of $2,196 each.
Future Considerations for Wind
Before turbines can be installed on the roof of the U.S. Steel Tower the Federal Aviation Administration (FAA) must approve the project. According to the Code of Federal Regulations Title 14 Part 77, any construction of a wind turbine 200 feet above ground level requires an aeronautical study by the FAA.76 Wind turbines are known for causing electromagnetic interference (EMI) and can prevent the FAA from accurately tracking aircraft.77 In addition to FAA approval, the Pittsburgh Department of City Planning will need to review the project proposal. Once the permitting procedures are fulfilled it will be necessary for a formal sight inspection by a wind turbine specialist. The
75 (Eriksson, Bernhoff, & Leijon, 2006) 76 (Armed Services Committee, Subcommittee on Readiness on the Impact of Wind Farms on Military Readiness, 2010) 77 (Federal Aviation Administration, 2010)
inspection will determine if the U.S. Steel Tower and High Point design are approved by structural engineers to support the turbines and identify where turbines should be mounted on the building.
New wind energy technologies are currently being developed. For example the Aeroelastic-Flutter Wind Belt System, which creates energy as wind passes over thin bands of material, in recent tests was able to generate .064 watts in 13 mph winds, enough to power a LED light. Although promising, and possibly applicable to High Point, there is still uncertainty as to whether this technology can be used as a large-scale renewable energy source. During lab tests it was shown that variations in wind speed had a detrimental effect on the performance of the Wind Belt System.78
It is also important to note that the assessment of wind conditions on top of the U.S. Steel Tower that appear in this study are based on current NREL
measurements from the roof. In the future it will be necessary for an anemometer to be installed on the roof of the tower to clearly identify wind speeds throughout the year. Once an accurate account of wind data is collected then High Point can more accurately project energy generation from wind technologies and the resulting energy savings.
Fuel Cell
Solid Oxide Fuel Cells (SOFCs) are a means of direct energy generation turning chemical energy into electrical energy. Some of the advantages to SOFCs are the minimal byproduct generation, high efficiency (typically well over 50%), quietness of operation, and lack of moving parts.79 The following diagram demonstrates how a fuel cell works:
78 79 (Ginestra, 2010)

High Point Feasibility Study
Heinz College: Fall 2010 Systems Project
33
Green Figure 3: Solid Oxide Fuel Cell
This has led to the potential of fuel cell power plants as well as utilization of fuel cells in vehicles.80 The real potential for immediate impact of fuel cells is through direct generation of electricity. For the purposes of our research, we focused on SOFCs based on initial recommendations from a researcher in the field familiar with the development trajectory of the technology.
SOFCs posses an immense efficiency advantage when compared with solar and wind generation technologies. The typical range of efficiency given for SOFCs is between 45% and 60% with the potential of 85% when utilizing co-generation.81 SOFCs can be fueled by natural gas and exhibit few of the drawbacks faced by other fossil fuel burning technologies due to the cleaner burning nature of natural gas as well as the efficiency of the SOFC. With the natural gas industry expanding rapidly in Western Pennsylvania, the potential for the utilization of local resources is immense.
One of the leading corporations in the SOFC industry is Siemens Westinghouse, which is located in the Pittsburgh region. They have recently established a new business division aimed at 80 (Ginestra, 2010) 81The production of electricity using waste heat (as in steam) from an industrial process or the use of steam from electric power generation as a source of heat
offering stationary fuel cells and hope to roll out their first commercial product by 201282. This is an extremely promising development because the current technology is relatively cost prohibitive when compared to the other generation options considered in this project. The following table demonstrates the costs associated with the three technologies we considered:
Green Table 1: Cost
Technology Cost/kW
Wind $1.25 + install Solar $4-‐$5/Watt + install
Fuel Cell $800-‐$4k, target $400 + install
While the right-sized fuel cell could make the facility 100% sustainable, the costs to purchase and install the equipment are currently extremely high. Additionally, the physical plant requirements are unique for fuel cells, due to the considerable amount of heat generated. Their operating temperatures tend to fall in the range of 800 to 1000 degrees Celsius.
Future Considerations for Fuel Cell
The U.S. Department of Energy is currently working with firms such as Siemens to develop commercially viable SOFCs and various facilities around the country have been selected to give trial runs for SOFC use. One of these is Phipps Conservatory in Pittsburgh whose 5kW SOFC has reduced their dependency upon the electrical grid.
4.3b Green Roof Components
Green roofs are defined as roofs that have a vegetative surface, a growing medium and a lining to prevent moisture from seeping into the structure. They have become a key component of sustainable building over the past decade, and since 2001, nine green roof projects have been completed in
82 (Siemens Fuel Cell Introduction)

High Point Feasibility Study
Heinz College: Fall 2010 Systems Project
34
Green Table 2: General Costs of Intensive and Extensive Green Roofs
Pittsburgh ranging in size from 64 square feet to 12,000 square feet.83
Green roofs provide many benefits, including improved insulation, improved air quality, reduced storm water runoff and reduced urban heat island effect. While there is a great degree of variability between green roofs, there are two distinct types: extensive and intensive.84
Extensive Green Roof
By far the most common type, extensive green roofs are typically between one and eight inches deep and can support plants with shallow roots such as grasses or mosses. They are not designed to be walked on and thus are purely functional and not accessible other than for maintenance. Since the additional weight of the plants and growing medium is typically not great enough to require additional support, they are often the most cost-effective option for obtaining the environmental benefits green roofs can provide.
Intensive Green Roof
Intensive green roofs range anywhere from eight to 80 inches in depth and can support many different types of plants, including small trees. They can be walked on and, depending on depth and landscaping, can provide a park-like atmosphere. Compared to extensive green roofs, they also provide a greater amount of insulation and storm water retention.
Intensive green roofs, however, are significantly more costly than extensive green roofs. Depending 83 (Velazquez) 84 (Oberndorfer, et al., 2007)
on the depth of the growing medium, they can add substantial weight to the roof and may require additional support. They are also labor intensive to install and often require maintenance and landscaping costs. See Table 2 for a detailed breakdown of costs for extensive and intensive green roofs.
4.4. Analyzing Benefits and Cost
Using a conservative estimate of wind speeds at the top of the 841 feet tall U.S. Steel Tower as 12 miles per hour, and assuming 18 vertical-axis wind turbines (VAWT) placed around the perimeter of the structure, our team estimated that each VAWT could produce 2,000 kWh per year. Each VAWT producing 2,000 kWh would yield approximately 36,000 kWh per year in electricity, and total savings of $3,600 per year for wind energy.
Thin film solar cells cost about $2.40 per watt, with an inclusive price of approximately $4-$5, including
Intensive Green Roof:
Low Cost Estimate (per ft2)
Intensive Green Roof:
High Cost Estimate (per ft2)
Extensive Green Roof:
Low Cost Estimate (per ft2)
Extensive Green Roof:
High Cost Estimate (per ft2)
Design and Specifications 5% 10% 5% 10%
Project Admin & Site Review 2.50% 5% 2.50% 5%
Re-Roofing w/root repelling membrane
$10 $15 $10 $15
Green Roof System $15 $30 $5 $10
Plants $5 $200 $1 $3 Irrigation System $2 $4 0 4
Installation/Labor (not customized for U.S. Steel Tower roof)
$8 $18 $3 $8
TOTAL $43 $307 $20 $46

High Point Feasibility Study
Heinz College: Fall 2010 Systems Project
35
Green Table 3: Energy Production Estimates
installation.85 The roof surface that could be covered with thin-film is approximately 20,000 square feet, or ¼ of the anticipated area of the roof structure.86 Using an estimate of 6 watts per square foot of solar for electrical output, the approximate size of the system is estimated to be 120 kW, assuming that 1 kW will produce about 1 kWh per year.87
Assuming 1,500 peak sun hours per year and a 30 degree pitch of the roof, High Point is capable of producing up to 133,266 kWh per year from solar energy alone. To put this in perspective, the 85 (Loomis, 2010) 86 (Humes & Moller, 2010) 87 (Loomis, 2010)
average utility costumer used 11,040 kWh per year in 2008. Installation costs, which are estimated to be about $5 per watt, would be approximately $600,000 for a 120 kW system. Using a price of $0.10 for the commercial rate of a kWh of electricity, 133,266 kWh generated would save about $13,326 per year in energy expenses, not taking into account the initial set-up costs of the equipment. With the aforementioned yearly savings, the payback period is approximately 45 years. However, this number can be dramatically decreased to as low as 5 years with a combination of federal, state, and local grants, rebates, and other incentives. A summary of calculations for solar PV is summarized in the table below.
4.5. Potential Funding Sources
Outside funding sources will be critical to realizing the potential green energy production targets outlined by this feasibility study. Recent programs offered by both the federal government as well as the Commonwealth of Pennsylvania have significantly defrayed the initial costs of green energy investments as shown on the table on the following page.
Solar energy production is notoriously lengthy in its payback period. This is due to the high initial cost of investment and the relatively lower production efficiency when compared to other energy generating technologies. Wind technology is similarly expensive but generally has a shorter payback period. Fuel cell technology is extremely dependent upon outside partnerships and financial incentives. These funding sources serve to lower the financial barriers to establishing green energy generating technologies as a part of mainstream energy generation. For many projects, they have injected the necessary funds through initial investment, tax benefits, and bridge financing to help sustain capital flows to projects that otherwise would have been impossible.
The good news is, green energy generation and the financial aid necessary to aid in its development is currently available and is also a priority especially at
High Point Alternative Energy Production Estimates
1.2 kW Vertical Axis Wind Turbine (VAWT)
Aggressive
Conservative
Number of turbines 20 10 Cost per turbine $4,995 kWh per turbine 3,660 2,000 kWh per year 73,200 20,000 Commercial price of one kWh of electricity
$0.10
Savings per year $7,320.00
$2,000
Solar Photovoltaic (PV) Estimated Square Footage of PV
20,000
Cost per watt $5.00 Generation/square foot 6 watts Tilt 30
degrees
Estimated Electricity from Solar PV (kWh/yr)
133,266
Commercial price of one kWh of electricity
$0.10
Savings per year $13,327
Total Yearly Estimated Savings of $15,327-‐$20,646 per year

High Point Feasibility Study
Heinz College: Fall 2010 Systems Project
36
the federal level. The U.S. government has the following means of financial assistance:
Green Table 4: Government Assistance
Type Benefit Corporate Depreciation
Depreciation deductions for certain investments
Corporate Exemption Energy conservation subsidy tax exclusion
Corporate Tax Credit Tax credits for business investment in green energy
Federal Grant Program Direct grants for projects Federal Loan Program Direct loans for projects Industry Recruitment/Support
Tax credits to incent green energy manufacturing sector
88
This study can in no way predict the future of the availability of funding sources. Government sponsored incentives for green energy generation are not endless, and given the increased focus on spending at the federal level as well as the effects of the current recession, the availability of various forms of grants and loans cannot be guaranteed.
Another avenue that should be investigated is direct partnerships with industry members. High Point, as a world-class destination, would be a very marketable space for any company looking to showcase its product offerings. This could afford High Point the opportunity to receive deep markdowns on many different aspects of the facility. Additionally, if High Point is incorporated as a not-for-profit, any donation of equipment for the facility could be recognized as a gift in kind which would result in further tax deductions for the company presenting the gift.
4.6. Conclusion
High Point has the potential to be a showcase for cutting edge alternative energy technologies that will not only educate and inform the public, but also
88 (North Carolina State University, 2010)
generate a substantial amount of energy that can provide power to the rooftop.
The team calculated a total energy demand of approximately 294,600 kWh per year for High Point. Based on the average commercial energy price of $0.10 per kWh, this would cost $29,460 per year in energy usage. Using wind and solar energy, we estimate that High Point can generate from 50%-70% of the energy needs for high point, if our basic assumptions hold true.
Fuel cell technology, while not applicable at this time due to space constraints on the roof and cost, may have a role to play in the future, and can take advantage of the vast natural gas resources in the Western Pennsylvania region.
While a green roof can provide significant benefits to High Point, the project team determined that it was not a feasible technology to implement on a large scale. The primary reason for this is the
support any structure that would be built on the roof, and therefore the structure would need to extend to the edges of the roof and the amount of outdoor space available for a green roof would be minimal. Additionally, the two floors immediately underneath the roof are mechanical floors which provide ample insulation for the building, completely mitigating one of the primary benefits of a green roof.
In summary, green energy options are a real possibility for High Point, especially thin-film solar PV and VAWTs. The amount of sun that Pittsburgh receives daily and the height of the U.S. Steel Tower mean that shading will not be an issue, and Pittsburgh receives ample solar insolation. Wind speeds, which can range from 10-22 miles per hour at the top of the tower, also make High Point an ideal place to harvest the power of the wind. It is important to recognize that new technological breakthroughs mean that relatively unknown ways of producing electricity today could become commercially viable in a few years. Therefore, new technologies must be monitored and evaluated vigilantly every few years to determine if they are feasible for High Point.

High Point Feasibility Study
Heinz College: Fall 2010 Systems Project
37
Economic ConsiderationsIntroduction Methodology Findings Summary of Economic Considerations
High Point Feasibility Study
Heinz College: Fall 2010 Systems Project
38
5.1. Introduction
In assessing the economic feasibility of developing High Point, the project team considered two aspects:
1. The market for a tourist destination in Pittsburgh
2. The financial parameters involved in constructing and operating the destination
These two approaches are interrelated because the financial feasibility of the project is to a great extent dependent upon the market feasibility. Without the necessary data to predict demand, there is no way to estimate expected revenue.89 These two aspects were evaluated via a market analysis to determine potential market feasibility, an investigation of construction costs for building a baseline structure, and the development of an operations pro forma to examine possible revenue streams, operating expenses, and a basic financing structure.
Market Analysis
This market analysis attempts to answer the question of whether a business has the potential to succeed in the present market. The market research for a typical start-up consists of an in-depth analysis of business opportunities, market segmentation, market size and trends, competition, customer profile, and business environment. However, a modified market analysis should be used when developing a tourist attraction. One of the key goals would be to first identify the demand of the existing and intended visitor market as part of a market feasibility analysis. During this preliminary stage, the project team chose to tailor the market analysis to provide an overview of the regional economy and identify potential customers and their spending patterns.
The market analysis for High Point determined if the Pittsburgh region90 could provide the destination
89 (Warnell, 1986) 90 Southwestern Pennsylvania comprises 11 counties: Allegheny, Armstrong, Beaver, Butler, Fayette, Indiana,
with a viable revenue stream given the present economic conditions and population trends. The analysis includes research on the demographic characteristics of tourists visiting Pittsburgh, and local residents within the city and its surrounding counties. Additionally, the market analysis includes data on the changes in the current market as it relates to tourism and its supporting industries. Key ideas from the study written by Daniel J. Stynes
were utilized throughout the Economic Feasibility Chapter of our study.91
This preliminary analysis did not include:
An assessment of the possible impacts of opening a tourist attraction in downtown Pittsburgh
The competitive status of High Point and its ability to respond to changes in the travel market
A supply analysis which examines the destination itself including its attractions, accommodations, and facilities
Financial Feasibility
Ultimately, determining if High Point is financially feasible will be decided by the primary stakeholders who will be making the financial decisions for the project; what is feasible for some might not be feasible for others. With this in mind, the aim of the financial feasibility analysis was to provide basic financial information for the construction and operations of a baseline rooftop structure.92 The information includes a breakdown of possible revenues, expenses, and a basic financing structure. However, until actual designs are drawn and decisions are made, only estimates can be provided.
The project team chose to not consider additional financing options that were outside of a construction
Lawrence, Somerset, Washington and Westmoreland Counties in Pennsylvania and Greene County, Ohio 91 (Stynes) 92 (United Nations Environmental Programme)

High Point Feasibility Study
Heinz College: Fall 2010 Systems Project
39
loan, a permanent loan, and capital with no fees (i.e. fundraised dollars) with the assumption that a more detailed analysis of financial options would be conducted after the feasibility study.93 In addition, a detailed business plan for developing a new tourist attraction on top of the U.S. Steel Tower should be outlined by the next team of researchers. The business plan should test the financial assumptions and estimations made in this report with the inclusion of an ownership structure.94
5.2. Methodology
The market and financial analysis consists of data collected from primary and secondary sources.
Primary data collection comprised of interviews with experts in the field of economic development and financial accounting. In addition, interviews with professionals and stakeholders familiar with the Pittsburgh area and its market were conducted. The interviews also provided the project team with strategies and best practices for conducting market analysis and formulating an operation pro forma.
Secondary data was collected from various resources. The market analysis includes data collected from the US Census and American Community Survey, the Bureau of Labor Statistics,
PittsburghTODAY. The data was analyzed to create a profile of the potential market for High Point, including regional economic indicators, industry profiles and demographics. The key sources of information contributing to the financial analysis were:
Survey data from developers and investors compiled on RealtyRates.com and
Limitations 93 (Warnell, 1986) 94 (Page, 2009)
The data in this report are preliminary findings regarding the current market and its revenue potential of the Pittsburgh region for an attraction. As previously mentioned, the market data and financial feasibility analysis were obtained from various sources. While we believe these sources to be reliable, some inaccuracies or estimates may exist in the data. In the case of the market analysis, updated tourism data was not readily available. The tourism data utilized in the analysis is dated from 2007 and does not represent more recent trends. The calculation of potential visitor attendance for High Point is based on a percentage of 2007 annual overnight leisure visitors and are also estimations based on expert research strategies.
In the formulation of the financial feasibility analysis, several assumptions were made because the building owners were not available to provide information. One of the assumptions is the approval of the ground lease arrangements by the building owners. If the building owners do not approve the lease arrangement, the financial model will need to be changed. A second assumption is the number of attendees or tickets sold throughout the ten-year period. The maximum number of attendees was obtained from the market analysis which was estimation and the gradual increase in tickets sold is a conservative estimation of sales for a new tourist attraction.
5.3. Findings
Increase in aging population and decrease in total population
According to the US Census, there has been population decline in the City of Pittsburgh for the past 50 years and as the total population has decreased, the share of the total population that is elderly has increased.95 Despite the estimated outcomes of each growth scenario, a significant level of change to infrastructure, policy, and economic condition would need to take place for growth by 2030 to be possible. 95 1960 and present.

High Point Feasibility Study
Heinz College: Fall 2010 Systems Project
40
Baby Boomers within the Region
The percentage of lower income households in the Pittsburgh Metropolitan Statistical Area (MSA) has decreased. Households with an annual income of $50,000 or greater, on average, have increased to 78% over the last decade. In 2009, heads of household between the ages of 45-65 and earning an income from $50,000 to $74,999 comprised the largest sub-section of the population for both age and income groups. The relative size is expected to grow for another 20 years. Assuming these trends will continue, this income group could provide High Point with a potential revenue base, if marketed to effectively.
Economic Decline and Spending Patterns by Residents and Tourist/Visitors
Despite challenges in the economy, the Pittsburgh MSA spends about $3 billion on entertainment and recreation. These two industries have shown an increase from 2001 to 2009.
Special Construction Requirements
Labor for a high-rise building External elevator construction
Simple Lease Agreement
A triple-net ground lease96 will provide the simplest arrangement between the building owners and the High Point organization.
Major factor for determining success
The number of attendees (ticket sales) will be a primary factor in determining when the project will carry a positive accumulated cash flow.
96 For this lease, the owners of the structure on top would be responsible for operations and maintenance, but individual lesser are responsible for their space
5.3a Market Analysis The Pittsburgh region has experienced population decline for the past 50 years with an average rate of change for the seven-county MSA
of about -3.05% every ten years. Only Butler, Washington and Westmoreland Counties saw any growth in the past decade, but these gains are offset by losses in Allegheny, Armstrong and Beaver Counties. Fayette County had a smaller decrease (-1.0%) than the other shrinking counties.97
Possible growth scenarios are shown in Table 2. The current ten year rate of decline means the Pittsburgh MSA will lose 0.26% annually or more than 126,000 people by 2030.
As seen below in Table 2, the average change from 1990-2000 and 2000-2010 is -2.0%. The decline is expected to slow, however, by 2020, with a rate of change of only -0.83%. Averaging the rates from 1990 to 2020, yields -1.63%. Applying that rate of change to the projection for 2020, results in a further expected population loss of 38,278 from 2020 to 2030.
97 (Pennsylvania State Data Center)
Year Population 2000 2,431,087 2010 2,368,989 -2.55% 2020 2,349,413 -0.83% 2030 2,311,135 -1.63%
Economic Table 1: % Change according forecasts

High Point Feasibility Study
Heinz College: Fall 2010 Systems Project
41
2,000
2,100
2,200
2,300
2,400
2,500
2,600
2,700
1990 2000 2010 2020 2030
Thou
sand
s
Population Growth Scenarios
High (0.50%) Moderate (0.0%)Low (-.10%) Current (-.26%)
Forecast Growth Scenarios: Low: -0.10% Moderate: 0.00% High: 0.50 Current Policy: -0.26%
Growth Scenarios
Figure 1 displays possible growth scenarios for the Pittsburgh MSA based on historic trends and forecasts for the region. Trends were taken from US Census historic data. Growth scenarios are derived from the Pennsylvania State Data Center (PASDC), which produces county projections. These were aggregated to obtain data for the MSA. The
forecasts presented here, though based on projections, do not represent a true projection for the MSA. The forecasts from PASDC examine fertility, mortality and migration trends from 1980 2000 in determining projections for 2010 through 2030. The growth scenarios have been applied to the Pittsburgh MSA, which is different
from the larger, eleven county region
considered later for tourism market share purposes. The team chose to analyze data for the MSA due to the availability of data and for comparison purposes. Of the counties that are considered part of Southwestern Pennsylvania, only Washington, Butler and Westmoreland Counties have shown any growth in the past 10 years. Therefore, the scenarios presented here are applicable to the larger tourism
Population Trends and Forecasts
Pittsburgh MSA Population Population 2030 Growth Rate Scenarios
Population 1990 2,468,289 High-Growth Scenario 0.50%
Population 2000 2,431,087 Moderate-Growth Scenario 0.00%
Population 2010 2,368,989 Low-Growth Scenario -0.10%
Historic Growth Rates Current Policy Scenario (2000-2010) -0.26%
Cumulative Annual Growth Rate: 1990-2000 -1.5%
Cumulative Annual Growth Rate: 2000-2010 -2.6% Population 2030
Forecast High-Growth Scenario (.50%) 2,617,495 Cumulative Change 2000-2030 -4.9% Moderate-Growth Scenario (0.0%) 2,368,989 Annual Change -0.2% Low-Growth Scenario (-.10%) 2,322,066 Current Policy Scenario (-.26%) 2,248,807
Population Growth 2010 2030
High-Growth Scenario (.50%) 248,506 Moderate-Growth Scenario (0.0%) - Low-Growth Scenario (-.10%) (46,923)
Current Policy Scenario (-.26%) (120,182)
Economic Table 2: Population Growth Scenarios
Economic Figure1: Pittsburgh Population Growth Scenarios

High Point Feasibility Study
Heinz College: Fall 2010 Systems Project
42
$0
$10,000
$20,000
$30,000
$40,000
$50,000
$60,000
Income Profile, Pittsburgh and Its Countryside
Median household Income Per Capita Income
market surrounding the city of Pittsburgh.
Positive-Growth Scenario
The Positive-Growth Scenario assumes a 0.50% annual increase in population for the next 20 years. Under this scenario, the Pittsburgh MSA population would reach 2,617,495 by 2030, an increase of almost 250,000 people. This scenario depicts a reversal of the current negative population growth.
No-Growth Scenario
The No-Growth Scenario assumes no growth (0.00%). Even to achieve flat growth, the current population trends would need to be reversed, but this scenario assumes that the current population would be maintained. In 2030, under this scenario, the Pittsburgh MSA population would
2,368,989.
Negative-Growth Scenario
The Negative-Growth Scenario assumes that growth in Butler, Washington and Westmoreland Counties overtakes the decline in other counties or that one or more counties experience a reversal of its negative growth trend, enough to drive positive growth for the entire region.
Current-Policy Scenario
The Current Policy Scenario assumes that the -0.26% annual decline for the past 10 years will be maintained for the next two decades. By 2030, the MSA population would be 2,248,807.
In characterizing the market for a new attraction in Pittsburgh, a region larger than the seven-county MSA was taken into account. For the purposes of this report, Southwestern Pennsylvania comprises 11 counties: Allegheny, Armstrong, Beaver, Butler, Fayette, Greene, Lawrence, Indiana, Somerset,
Washington and Westmoreland Counties. This
Secondary Tourism Markets by the 2007 Annual Travel Profile for Pennsylvania. According to the report for 2009, Median household income for the entire region was $45,317, whereas the median household income for all of Pennsylvania was $49,520 and $50,221 for the U.S.162
Similarly in terms of per capita income, Southwestern Pennsylvania trailed both the state and the nation with a median per capita income of $23,771, shown in Table 3.
Income
162 (DK Shifflet, 2007)
Income Comparison Median Income*
Per Capita Income*
United States $ 50,221 $ 26,409 Pennsylvania $ 49,520 $ 26,739 Southwestern Pennsylvania $ 45,317 $ 23,771 * Income in Past 12 Months, 2009 Inflation-Adjusted Dollars
Economic Figure 2: Income Profile
Economic Table 3: Income Comparison

High Point Feasibility Study
Heinz College: Fall 2010 Systems Project
43
0%10%20%30%40%50%60%70%80%90%
100%
Household Income by County, Pittsburgh & Its Countryside
$200,000 or more
$150,000 to $199,999
$100,000 to $149,999
$75,000 to $99,999
$50,000 to $74,999
$35,000 to $49,999
$25,000 to $34,999
$15,000 to $24,999
Less than $15,000
Economic Figure 3: Regional Household Income
In Table 4, the income brackets showing significant growth since 2000 are the $50,000 to $74,999 bracket and greater. More households in the region have higher incomes than they did in 2000, generally a good sign for recreation spending. These numbers, however, are not adjusted for inflation and do not reflect changes in disposable income over time.
In the Southwestern Pennsylvania region, Allegheny County has the largest share (48% or over $35.3 billion) of aggregate household income
is more than twice that of Westmoreland County,
which has the second-largest share at just 13% ($9.2 bihousehold income each represent 7% or less of the
As seen in Figure 4 below, the income bracket representing the largest percentage of residents (~19%) of Southwestern Pennsylvania is $50,000 - $74,999, the same as for the MSA.
Age Profile
The age profile of the 11-county Southwestern Pennsylvania region tells much
regions of the country. The population as a whole is aging, with 45-59 currently representing the largest proportion of residents. As these cohorts (45-50, 50-54 and 55-59) age, the dependency ratio will continue to increase. This means that more retirees will be relying on
14%
13%
11%
15%19%
12%
10%3% 3%
Household Income, Pittsburgh and Its Countryside Less than $15,000
$15,000 to $24,999
$25,000 to $34,999
$35,000 to $49,999
$50,000 to $74,999
$75,000 to $99,999
$100,000 to $149,999
Pittsburgh MSA Households by Income*
2000 2010
<$15,000 182,058 120,286
$15,000 - $24,999 151,571 119,987
$25,000 - $34,999 134,458 111,617
$35,000 - $49,999 165,944 145,392
$50,000 - $74,999 184,625 204,267
$75,000 - $99,999 87,167 155,923
$100,000 - $149,999 57,747 82,809
$150,000 - $199,999 14,712 22,706
$200,000+ 17,694 22,990
* Not adjusted for inflation
Economic Table 4: Number of Households per Income Bracket
Economic Figure 4: Household Income by County

High Point Feasibility Study
Heinz College: Fall 2010 Systems Project
44
the productivity of those still in the labor force. Since the younger cohorts following the large Baby Boomer population are smaller, this will have significant implications for economic development, the regional job market and productivity for the region.
The population pyramid for Southwestern Pennsylvania (Figure 5) not only shows the Baby
-olds representing the largest percentages of the total population, but there is also another, smaller bulge in the 15 to 29 year-old age cohorts, the children of the Baby Boomers.
As seen in Table 5, households with an income of $50,000 to $74,999 in which the head of household is 45-64 years old represent the largest number of any income bracket or age group. This, combined with the fact that the number of people in this age
bracket is expected to grow for the next 20 years, determines a target market for High Point.
Households
is defined by the US Census as a group of two or more people (one of whom is the householder) related by birth, marriage, or adoption and residing together, including any unrelated people who may be residing there, equal 78% of the population.
Of the more than 727,000 families living in the region in 2009, 76% are married-couple families and 36% of these have children under 18 living with them. That would be almost 200,000 families in the region that would be possible customers of High Point as a family-friendly destination. Of the families with children under 18, 21% have children under 6 years old, 18% have children in both the under-6 and 6-17 categories, and 60% have children older than 6 but younger than 18.
6.00 4.00 2.00 0.00 2.00 4.00 6.00
Under 5 years
10 to 14 years
20 to 24 years
30 to 34 years
40 to 44 years
50 to 54 years
60 to 64 years
70 to 74 years
80 to 84 years
Age Cohorts, Percent of Total Population, Pittsburgh & Its Countryside, 2009
Female Male
Age of Householder
Household Income <25 25-44 45-64 65+ Less than $15,000 18,958 41,505 48,178 59,307 $15,000 to $24,999 10,777 29,292 42,168 66,179 $25,000 to $34,999 6,807 34,485 42,103 48,291 $35,000 to $49,999 7,729 53,669 64,867 49,967 $50,000 to $74,999 4,923 77,151 94,084 40,283 $75,000 to $99,999 2,284 49,854 66,391 16,800 $100,000 to $149,999
916 40,131 64,048 12,305
$150,000 to $199,999
0 10,770 21,218 4,289
$200,000 or more 113 7,580 20,688 3,641
Economics Figure 5: Population Pyramid, Pittsburgh & Its Countryside
Economics Table 5: Income by Age

High Point Feasibility Study
Heinz College: Fall 2010 Systems Project
45
Spending Patterns According to forecasts for 2010 derived from 2006 and 2007 Consumer Expenditure Survey data by the Bureau of Labor Statistics, the average resident in the Pittsburgh MSA spends over 12% of their income on travel, entertainment and food away from the home (see Table 6 and 7). This amounts to almost $7 billion annually, the largest portion of which is spent on entertainment and recreation, which is equal to about $3 billion. Following this, the region spent nearly an additional $2.8 billion eating at locations other than home. This implies that a restaurant could feasibly be incorporated into the design of High Point as a considerable amount of money is spent on food away from the home.163
163 (ESRI)
Economics Figure 6: Average spending on Food Away from Home, Travel and Entertainment
$2,870.45
$1,652.47
$2,939.92
$0
$500
$1,000
$1,500
$2,000
$2,500
$3,000
$3,500Average Spending
Food Away from Home
Travel
Entertainment and Recreation
Household Budget Expenditures by MSA Average Spending Aggregate % of Total
Total Expenditures $59,319.86 $58,488,017,275 100.00%
Food $6,921.85 $6,824,780,975 11.70%
Food at Home $4,051.39 $3,994,581,730 6.80%
Food Away from Home $2,870.45 $2,830,199,245 4.80%
Alcoholic Beverages $511.05 $503,884,410 0.90%
Housing $17,860.03 $17,609,583,386 30.10%
Shelter $13,601.95 $13,411,208,512 22.90%
Utilities, Fuel and Public Services $4,258.09 $4,198,374,874 7.20%
Household Operations $1,372.09 $1,352,846,761 2.30%
Housekeeping Supplies $643.96 $634,928,366 1.10%
Household Furnishings and Equipment $1,600.07 $1,577,632,763 2.70%
Apparel and Services $1,475.70 $1,455,004,212 2.50%
Transportation $9,064.04 $8,936,935,112 15.30%
Travel $1,652.47 $1,629,296,245 2.80%
Health Care $3,615.48 $3,564,776,968 6.10%
Entertainment and Recreation $2,939.92 $2,898,697,678 5.00%
Personal Care Products & Services $626.48 $617,696,112 1.10%
Education $1,110.07 $1,094,500,667 1.90%
Smoking Products $417.91 $412,053,208 0.70%
Miscellaneous (1) $1,045.95 $1,031,285,006 1.80%
Support Payments/Cash Contributions/Gifts in Kind $2,241.05 $2,209,624,466 3.80%
Life/Other Insurance $402.00 $396,360,798 0.70%
Pensions and Social Security $5,819.74 $5,738,130,141 9.80%
Economics Table 6: Household Budget Expenditures

High Point Feasibility Study
Heinz College: Fall 2010 Systems Project
46
Industry Employment Trends
To understand the health of the industries that are related to the tourism market, such as arts and restaurants, 2007 data from the Bureau of Labor
MSA was used to evaluate employment trends.
Arts and Entertainment
As illustrated in Figure 7, there has been a steady increase in the number of employees in the arts and entertainment industry from 2001-2009.164 This consistent growth shows the overall health of this area.
Economics Figure 7: Arts and Entertainment Establishments, number of employees
Restaurants
Growth can also be seen in the increasing number of employees in the different sub-categories under the restaurant industry. Significant growth can be seen in the snack bar category (Figure 8). Perhaps due to the current economic climate, residents are behaving more conservatively when it comes to dining out, but maintain the luxury of having a meal outside of the home. The lower-priced food outlets, such as snack bars, have consequently shown an increase in demand since 2007. However, full service restaurants have not benefited from the growth that other areas of the food service industry have experienced, as illustrated with the sporadic
164 (Local Area Unemployment Statistics, Pittsburgh, PA Metropolitan Statistical Area)
increases and decreases from 2001-2009 (Figure 9). One possible explanation is that volatility is to be expected for full service restaurants, as the restaurant business is risky and competitive. The food service and drinking places (Figure 10) have remained relatively stable sharing a slight increase in 2009.
Economics Figure 8: Snack Bars and Non-‐Alcoholic Beverage Retailers, number of employees
Economics Figure 9: Full-‐Service Restaurants, number of employees
Economics Figure 10: Food-‐Service & Drinking Places, number of employees
1516161717181819
Thou
sand
s
Arts & Entertainment Establishments
05
101520253035
Hun
dred
s
Snack Bars & Non-Alcoholic Beverages
37383940414243
Thou
sand
s
Full-Service Restaurants
0
50
100
150
200
Thou
sand
s
Food Service & Drinking Places
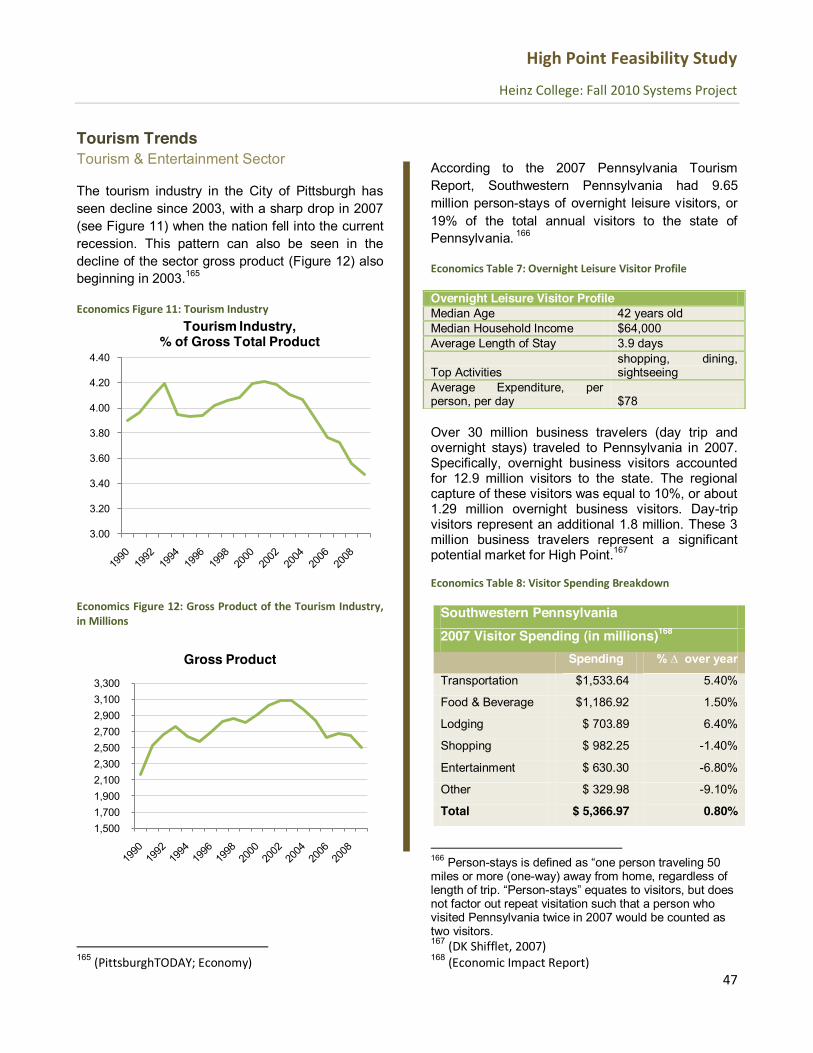
High Point Feasibility Study
Heinz College: Fall 2010 Systems Project
47
Tourism Trends Tourism & Entertainment Sector
The tourism industry in the City of Pittsburgh has seen decline since 2003, with a sharp drop in 2007 (see Figure 11) when the nation fell into the current recession. This pattern can also be seen in the decline of the sector gross product (Figure 12) also beginning in 2003.165
Economics Figure 11: Tourism Industry
Economics Figure 12: Gross Product of the Tourism Industry, in Millions
165 (PittsburghTODAY; Economy)
According to the 2007 Pennsylvania Tourism Report, Southwestern Pennsylvania had 9.65 million person-stays of overnight leisure visitors, or 19% of the total annual visitors to the state of Pennsylvania. 166
Economics Table 7: Overnight Leisure Visitor Profile
Over 30 million business travelers (day trip and overnight stays) traveled to Pennsylvania in 2007. Specifically, overnight business visitors accounted for 12.9 million visitors to the state. The regional capture of these visitors was equal to 10%, or about 1.29 million overnight business visitors. Day-trip visitors represent an additional 1.8 million. These 3 million business travelers represent a significant potential market for High Point.167
Economics Table 8: Visitor Spending Breakdown
166 Person-miles or more (one-way) away from home, regardless of
rson-not factor out repeat visitation such that a person who visited Pennsylvania twice in 2007 would be counted as two visitors. 167 (DK Shifflet, 2007) 168 (Economic Impact Report)
3.00
3.20
3.40
3.60
3.80
4.00
4.20
4.40
Tourism Industry, % of Gross Total Product
1,500 1,700 1,900 2,100 2,300 2,500 2,700 2,900 3,100 3,300
Gross Product
Overnight Leisure Visitor Profile Median Age 42 years old Median Household Income $64,000 Average Length of Stay 3.9 days
Top Activities shopping, dining, sightseeing
Average Expenditure, per person, per day $78
Southwestern Pennsylvania 2007 Visitor Spending (in millions)168
Spending Transportation $1,533.64 5.40%
Food & Beverage $1,186.92 1.50%
Lodging $ 703.89 6.40%
Shopping $ 982.25 -1.40%
Entertainment $ 630.30 -6.80%
Other $ 329.98 -9.10%
Total $ 5,366.97 0.80%

High Point Feasibility Study
Heinz College: Fall 2010 Systems Project
48
Total tourism spending in 2007 for the state of Pennsylvania was $27.8 billion. The Pittsburgh area captured over $ 5.3 billion, which is 19% of total state tourism spending (see Table 8 above).
Benchmarking
The team studied local attractions and their paid attendance volume, such as cultural exhibits, art installations and educational programming. Specifically, the following were used in the
attraction:
Carnegie Science Museum Carnegie Museum of Art & Natural History Heinz Regional History Center Child Fallingwater The Frick Art and Historical Center Phipps Conservatory
Sporting events were deliberately excluded as their ticket volume is based on weekly repeated visitors, unlike museums. The average attendance rate for individual attractions ranges from 135,431 to 663,209.169
Economics Table 10: Average Attendance of Similar Attractions
169 (Allegheny Conference)
Assuming that High Point is eventually able to
attractions see, the annual attendance would be 265,000.
Potential High Point Visitor Volume
To extrapolate the number of possible visitors that High Point would be able to capture, 7% was applied to the 2007 annual overnight leisure visitor statistic of 9.65 million, resulting in the prediction that High Point has the potential to attract 675,500 visitors annually. This number is assuming that High Point becomes an iconic, world-class destination. A market capture of 7% is on par with other iconic structures, such as the Empire State Building, which captures 7.5% s.170 The Seattle Space Needle attracts 11% of the total visitors to the Seattle area.171
Expected Attendance
Our initial estimates of the number of visitors that
attractions, detailed in the previous section. Assuming that the potential pool of visitors is as
170 (NYC Statistics) 171 (The Greater Seattle Datasheet)
Economics Table 9: Similar Attractions Attendance by Year
Similar Attractions Attendance
Institution 2003 2004 2005 2006 2009 Carnegie Science Center
671,671 726,876 618,800 587,000 711,700
Carnegie Museums
480,222 372,757 246,400 180,618 386,300
Heinz Regional History Center
106,911 108,000 292,559 120,500 130,000
Children's Museum
94,000 93,324 104,672 86,087 232,098
Fallingwater 126,001 126,138 140,015 140,000 145,000
Frick 152,531 167,932 180,792 167,305 140,524
Phipps 401,065
Average Attendance of Similar Attractions
2003 2004 2005 2006 2009 Avg
Average, all venues 433,847 461,975 455,703 467,611 495,040 462,835 Average, "Similar" 271,889 265,838 263,873 213,585 290,937 261,224
0
100
200
300
400
500
600
700
Thou
sand
s
Average of "Similar" Venues
Economics Figure 13: High Point in relation to similar Pittsburgh attractions

High Point Feasibility Study
Heinz College: Fall 2010 Systems Project
49
many as 675,500, or 7% of the annual visitors to Southwestern Pennsylvania, the team wanted to determine the share of those visitors that would likely be local. Households in the Pittsburgh MSA spend 5% of their annual household budget on Entertainment and Recreation (Table 11 and Appendix G).
Assuming that spending patterns in the 11-county region do not differ greatly from that of the MSA, Entertainment and Recreation spending in Southwestern Pennsylvania is $3,585,357,375 annually. Table 11 shows the distribution of spending per income bracket, according to the relative number of households. For example, the 75,143 households with a household income between $10,000 and $14,999 make up 6% of the number of households in the 11-county region. Six
Entertainment and Recreation comes to $231,903,832.43. The team expects that households in this income bracket will spend 0.10% of their annual Entertainment and Recreation spending on High Point, equaling $231,903.83. (Appendix F shows regional household income data disaggregated by county.)
Holding the number of visitors constant at 675,500, and using the total local spending amount shown in Table 11, we determined how many are expected be local and how many are expected to be out-of-town visitors (Tables 11 and 12).
The total local spending on High Point based on household spending data is about $7.6 million. At a $14 ticket price, it is possible that 539,861 of the 675,500 potential visitors would be local to the area.
Economics Table 11: Local Spending Capture
Capture of Entertainment and Recreation Spending Universe of Households: 1,161,751 Total Spending: $3,585,357,375
Income Brackets
Households (Aggregated by bracket)
% of Household Universe
Total Entertainment & Recreation Spending per Bracket
Expected High Point Capture per bracket
Spending on High Point
Less than $15,000 167,948 14% $ 518,315,543.02 0.10% $ 518,315.54
Less than $10,000 92,805 8% $ 286,411,710.59 0.10% $ 286,411.71
$10,000 to $14,999 75,143 6% $ 231,903,832.43 0.10% $ 231,903.83
$15,000 to $19,999 73,478 6% $ 226,765,364.70 0.10% $ 226,765.36
$20,000 to $24,999 74,938 6% $ 231,271,168.23 0.10% $ 231,271.17
$25,000 to $29,999 67,186 6% $ 207,347,203.14 0.20% $ 414,694.41
$30,000 to $34,999 64,500 6% $ 199,057,759.10 0.20% $ 398,115.52
$35,000 to $39,999 60,319 5% $ 186,154,495.67 0.20% $ 372,308.99
$40,000 to $44,999 59,457 5% $ 183,494,219.88 0.20% $ 366,988.44
$45,000 to $49,999 56,456 5% $ 174,232,633.29 0.20% $ 348,465.27
$50,000 to $59,999 98,226 8% $ 303,141,820.85 0.20% $ 606,283.64
$60,000 to $74,999 118,215 10% $ 364,831,209.17 0.25% $ 912,078.02
$75,000 to $99,999 135,329 12% $ 417,647,867.92 0.25% $ 1,044,119.67
$100,000 to $124,999 77,096 7% $ 237,931,116.21 0.25% $ 594,827.79
$125,000 to $149,999 40,304 3% $ 124,384,867.02 0.30% $ 373,154.60
$150,000 to $199,999 36,277 3% $ 111,956,873.28 0.30% $ 335,870.62
$200,000 or more 32,022 3% $ 98,825,233.52 0.30% $ 296,475.70
Total Local Spending on High Point $ 7,558,050.29

High Point Feasibility Study
Heinz College: Fall 2010 Systems Project
50
Economics Table 13: Construction Cost Estimates
As the ticket prices increase, market capture would decrease and more of the visitors are expected to be out-of-town visitors. Although these numbers appear high, these scenarios are based on the possible market capture and are assuming that High Point is an iconic, world-class destination capturing a percentage of market similar to what the Empire State Building
5.3b Financial Feasibility
Construction Phase
In order to estimate construction costs it was necessary to identify the types and amounts of material that would comprise the structure. The materials and costs presented below are the most basic materials that meet all of the constraints identified for the space and are presented to serve as a baseline cost of construction. When a final design is created in the future, these costs will need
to be recalculated to match the design requirements.
To evaluate construction costs, the project team conducted interviews with two experts experienced with high-end construction and with direct knowledge of the current U.S. Steel Tower roof.172 According to these experts, any structure built on top of the building will need to use the external exoskeleton for support, and given that the primary feature of High Point is the view of the surrounding region, they suggested basing the construction costs on building a glass-enclosed space frame structure that would cover the entirety of the roof top space. This type of structure also mitigates safety concerns, provides ample space for incorporating various types and amounts of energy generation technologies and provides an open and flexible interior space that can be easily adapted to accommodate many uses.
172 (Moller & Humes, 2010)
Economics Table 12: Visitors Ticket Price Levels
Local Visitors Out-of-Town Visitors
$14 539,861 135,639 $20 377,903 297,597 $30 251,936 423,565 $40 188,952 486,549 $100 75,581 599,919
Square Footage/Number of Floors
Cost per Square Foot/Floor Total
Space Frame 65,000 $300 $19,500,000 Laminated Curtain Wall with Aluminum Extrusions 65,000 $240 $15,600,000
2 Glass Elevators 64 $50,000 $6,400,000 Interior 30,000 $250 $7,500,000 Design Costs - - $800,000 Demolition - - $500,000 Contingency (20%) - - $10,060,000 TOTAL $60,360,000
Economics Figure14: Rendering of Baseline Construction, courtesy of Edward Dumont

High Point Feasibility Study
Heinz College: Fall 2010 Systems Project
51
Total estimated construction
cost:
$60,360,000
Primary Revenue Contributors:
Rent from vendors / tenants
Ticket sales
However, according to the experts, the primary cost driver of construction will be labor. The options for bringing material up to the roof for the construction range
freight elevator to transporting materials via helicopter, but all options are expensive will likely increase costs tenfold.
The other major factor in the construction costs are the external elevators for transporting visitors up to the space. Based on the height of the building, speed of the elevator and capacity requirements, experts recommended using glass-enclosed 4,500 lb. traction elevators that travel between 800 and 1000 ft per minute.
Table 12 summarizes all of this information as well as costs for design, demolishing the current roof components and a 20% contingency cost. The total estimated cost of the glass-enclosed space frame and elevator comes to $60,360,000.
Operations Phase
Lease Arrangement A preliminary step in determining the financial feasibility of High Point was to decide on the lease arrangements between the building owner and the organization that would develop and, eventually, operate the rooftop facility. Since the project team did not have access to the building owners, it was determined that a simplified arrangement one in which the building owners were less involved in decision making would be required. Thus, the project team determined that a customized, triple-net ground lease agreement would best serve this purpose.
A triple-net ground lease agreement gives the occupant almost all responsibility for the space being leased and for the operation of any facilities located in that space. This means that the High
Point organization would take responsibility for the construction and maintenance of the
rooftop structure as well as the roof itself. The lease would need to be customized since other parts of the building will need to be utilized to gain access to the roof. Thus, the owner would require a contribution toward its use.
In turn, the High Point organization would provide full-service lease agreements to vendors operating on the rooftop. A full-service lease would consolidate certain operational responsibilities with
the uniqueness of the space, it was assumed that the fewer operations-related contractors servicing the rooftop, the better. The cost for these expenses would be covered, at least in part, by rent collected from the vendors.
Revenues
The two primary contributors to revenue would be rent from subleasing to vendors/tenants and income from ticket sales to access the roof.
Rent
The rent was determined, primarily, by referring to the low and high rents charged for current occupants of the U.S. Steel Tower. The rent ranges from $24-$30 per square foot.173 The high end of
this range was used given the expenses of operating the space and the premium associated with renting the top floors. An inflation rate of 3% (rounded up from the 2009 average rate) was applied for each additional rental year.174
From the preliminary design of the rooftop building, as outlined in a previous section, it appears that the construction could be a total of 30,000
square feet. Without the benefit of additional design work, the actual amount of rentable square
173 (BizJournals.com, 2010) 174 (ForecastChart.com, 2010)

High Point Feasibility Study
Heinz College: Fall 2010 Systems Project
52
Primary Expense Contributors:
Ground lease payments
Operation related expenses
feet is unknown. Hence, the total square footage was simply divided by two, equaling 15,000 square feet in order to calculate total rent revenues that would be available.
It is notable that if all expenses, excluding debt service, were to be covered by rental of the space, the charge per square foot would need to be $43.
Ticket Sales
Two components of ticket sales were the number of attendees (or tickets sold) and the price per ticket. As was described in previous sections, the predicted number of attendees could reach over 600,000 people per year. However, this estimate was deemed as optimistic by various stakeholders. Thus, a more conservative number of 200,000 attendees in the first year was used for revenue calculations. It was also estimated that the number of attendees would increase by 10% each year.
The estimated price for each ticket in the first year of operation, $14, was taken from the low end of average ticket prices for attractions in Pittsburgh (refer to Chapter 5:
Again, the intent was to use the more conservative information available. It was anticipated that the price per ticket would increase by 10% in the 4th, 7th, and 10th year of operation.
Expenses
The two primary contributors to expenses would be the ground lease payments to the building owners and operations-related expenses.
Ground Lease Payments
As previously mentioned, the building owners were not available to provide an estimation of how much a triple-net ground lease would cost. Thus, two
factors were taken into consideration to calculate the lease payments. These factors were
1) Approximately how much would it cost to operate a floor of the building normally and
2) Approximately how much are the administrative costs that would need to remain the responsibility of the building owners
To estimate the cost of operating a floor of the building, a base rate per rentable square foot, per year, was calculated using data from the Building Owners and Managers Association (BOMA). The variables included in the rate were cleaning, maintenance and repairs, utilities, ground maintenance, security, administration, and direct
and amortized leasing expenses. None of these variables were adjusted as the intent was to approximate costs under normal conditions. The base operating expenses totaled $13.01 per square foot.
The administrative costs were derived from BOMA data as well. These variables included real estate and other taxes and building insurance. The building insurance was adjusted to reflect twice the normal cost since operating on the rooftop poses risks
unique to the space. The total fixed expenses totaled $4.12 per square foot.
For both factors, the upper quartile of the data (versus the low end or median) was used, generally, to allow for extra costs associated with operating in a unique environment such as the rooftop. In total, the cost per square foot was $17.13. Since the data was based on rentable square footage of a building, the $17 per square foot was then multiplied by 15,000 square feet to provide a monthly ground lease payment.
High Point Feasibility Study
Heinz College: Fall 2010 Systems Project
53
A good rule of thumb is 25% of the total budget should be reserved for
remaining 75% for hard costs
Operations Related Expenses
The cost to operate the rooftop structure was estimated in the same way the cost to operate a floor of the building was calculated. The same variables were used based on data from BOMA. However, some variables were adjusted since the rooftop will be used differently than other floors (i.e. more public access).
First, the utility cost was reduced to account for energy savings resulting from the use of solar and wind technology. Second, security costs were increased to assist in keeping the space, staff, and visitors safe. Finally, the administration/payroll costs were increased to accommodate the additional staff and management needed to keep the space operating.
Again, the high end of the mid range of the BOMA data was used. This resulted in the total operating expenses of the rooftop to be $26 per square foot. This amount was multiplied by 15,000 square feet to calculate the total operating expenses less reserves for unforeseen expenses.
For each additional year of operations, both the ground lease payments and the operation expenses were adjusted by a rate of 3% for inflation.
Financing
The development, construction, and operation of the rooftop will require separate financing for each phase. For the purposes of this project, only the construction and operation phases were considered. It was determined that the financing for the development phase would be determined more accurately once the High Point organization was formed and the design phase has commenced.
Construction Loan
The purpose of this loan would finance the construction of the rooftop structure.
Given that the project team did not create a final design of the new building, it was necessary to estimate how long the construction phase would take to complete. The estimate used was 18 months.175 Therefore, the loan period was estimated to be 18 months.
As with typical construction loans, it was assumed that an interest-only structure would be used. In other words, only the interest from the loan would be due throughout the duration of the loan until the end of the loan period or when construction has
been completed, whichever comes first. At that time, a balloon payment would be made to pay off the loan or the loan would be refinanced. In the case for High Point, it was assumed that the loan would be refinanced.
In addition, the construction loan would be provided for draw down as required
by the project. Thus, the entire loan amount would not be accruing interest for the entire loan period. Since it would not be possible to calculate the actual amount of money that would be borrowed for the actual amount of time, the construction costs were discounted by 30% to better estimate the loan amount required.176
Interest Rate: For the 3rd quarter of 2010, the survey results indicated that the maximum interest
category to High Point) construction financing was 11.35%.177 Since comparable alternative rates were not easily found, the maximum interest rate was used for the loan calculations.
Fees: After surveying several construction loan providers and referencing the survey results from
175 (Poole, 2010) 176 (Construction Loan Center, 2010) 177 (Watts, 2010)

High Point Feasibility Study
Heinz College: Fall 2010 Systems Project
54
construction financing, it was estimated that the rate for the loan fees was 3%.178
Permanent Loan
Purpose: This loan would replace the construction loan when the first loan is refinanced. Of the total value of the project, it was estimated that 65% would be financed by the permanent loan, otherwise stated as a 65% loan-to-value ratio. This represented an average ratio compared to other
RealtyRates survey and experts in the field.179 180
Terms: It was estimated that the loan period for the permanent loan would be 20 years, which is
181 However, while the loan would be amortized for this length of time, it was recommended to refinance after 10 years.182
Interest Rate: For the 3rd quarter of 2010, the RealtyRates survey results indicated that the
construction financing was 7.91%.183 This rate was confirmed by industry advisors as a good proxy for estimation purposes, thus the average rate was used for the loan calculations. 184
Fees: After researching several construction loan providers, it was determined that the generally accepted rate for the loan fees was 3%.
Fundraising
Purpose: While 65% of the construction costs would need to be financed via a loan, the remaining 35% would need to be financed via grants or other non-loan sources. This capital would be raised by the
178 (Watts, 2010) 179 (Watts, Permanent Financing , 2010) 180 (Poole, 2010) 181 (Watts, Permanent Financing , 2010) 182 (Poole, 2010) 183 (Watts, National Sell-‐Out Property Interim Mortgage Matrix , 2010) 184 (Smith Jr, 2010)
organization that is overseeing the development of the rooftop.
Cost of Capital: To estimate the cost to raise the funds, there was no one particular method or ratio to use. However, we found that a commonly referred to benchmark was the national average for
was $0.20 or 20% of each dollar raised.185
Scenario Analysis While many of the variables in the financial feasibility analysis were estimated within a range, the number of possible attendees each year had one of the broadest ranges. The project team was inclined to use a conservative number for its initial calculations, beginning with 200,000 attendees in Year One. This represented about one-third of the 675,500 estimated number of attendees based on average attendance of other Pittsburgh destinations
% increase in attendance per year was anticipated, High Point would not reach the average number of attendees in a 10 year period.
However, if High Point was able to attract the average number of visitors by Year Nine, the calculations would differ as follows
185 (Greenfield, 1999)

High Point Feasibility Study
Heinz College: Fall 2010 Systems Project
55
Economics Table 14: Scenario Analysis
Conclusion
Overall, the project team found that while population in the region has been declining for the past five decades, the percentage of lower income households in the Pittsburgh Metropolitan Statistical Area (MSA) has decreased. Households with an annual income of $50,000 or greater have increased from 78% over the last decade. In 2009, heads of household between the ages of 45-65 earning an income from $50,000 to $74,999 comprised the largest sub-section of the population for both age and income groups, and the relative size of this group is expected to grow for another 20 years. Assuming these trends continue, this income group could provide High Point with a potential revenue base, if marketed effectively.
Ultimately, the number of visitors is the primary revenue driver, while the initial construction cost and related debt financing are the most significant costs. Given increasing attendance rates, it is possible for High Point to become operationally profitable within 10 years.
186 (National Development Council, 2004)
Scenario I: 200,000 attendees in Year 1 Total Revenues $3,227,500 Total Expenses $927,300 Net Operating Income $2,300,200
Available Cash Flow ($2,818,128) In Year 7,would turn positive with $286,933
Accumulated Cash Flow ($2,818,128) In Year 6, would peak at - $11,105,603
Would remain negative for at least the first 10 years of operation
Debt Coverage Ratio (best between 1.15 and 1.35)186 0.45
In Year 8, would reach 1.17
Scenario 2: 325,000 attendees in Year 1 Total Revenues $4,977,500 Total Expenses $927,300 Net Operating Income $4,050,200
Available Cash Flow ($1,068,128) In Year 4, would turn positive with $997,182.
Accumulated Cash Flow ($1,068,128) In Year 3, would peak at - $1,839,317
In Year 5, would turn positive with $804,827
Debt Coverage Ratio (best between 1.15 and 1.35) 0.79
In Year 4, would reach 1.19

High Point Feasibility Study
Heinz College: Fall 2010 Systems Project
56
Summary of Key Findings
Recommendations and Next Steps

High Point Feasibility Study
Heinz College: Fall 2010 Systems Project
57
6.1 Summary of Key Findings
Below is a summary of the key findings from each section of this report.
History, Regulatory Framework and Operations
High Point can serve as a symbol of
economic success story. High Point fits into the current zoning
guidelines for Golden Triangle Subdistrict B.
While additional security measures will need to be implemented, many similar structures have made adjustments following September 11th to ensure the safety of patrons and staff.
Given the construction of the U.S. Steel Tower, any significant structure added to the roof would need to be primarily
A large number of additional visitors will
require significant changes to current building operations.
Stakeholder Analysis
Although not able to meet with the building owners or management, the team speculates that their primary interest is to increase the value of the building.
Secondary and tertiary stakeholders, as well as survey respondents, indicated many possible programming options for High Point. The most common included: a restaurant, green space, cultural space and meeting/convention space.
According to the survey, over 40% of respondents would pay between $11 and $20 for admission to an attraction like High Point.
High Point is the type of project that the Allegheny Regional Asset District (RAD) would fund.
Green Technology
Thin-film solar is a low cost and innovative technology that can potentially generate 13,000 kWh annually for High Point.
The Windspire® vertical axis wind turbine is a low-cost technology that requires a small physical footprint and is appropriate for the wind speeds present at High Point. The team estimates that each Windspire® can produce 3,660 kWh per year annually and that up to 20 turbines can be installed on High Point.
While solid oxide fuel cells hold significant promise for providing 100% renewable energy, the technology is currently too expensive for implementation on High Point.
Green roofs provide significant benefits, but given that any structure built on the roof of the U.S. Steel Tower would need to use the exoskeleton of the building for support, the amount of outdoor space available for the technology would be limited.
Economic Considerations
Pittsburgh and the surrounding 11 counties receive almost 10 million leisure visitors per year.
Comparable Pittsburgh attractions receive an average of 268,000 visitors per year.
If High Point reaches the iconic status of other rooftop attractions like the Empire State Building, it has the potential to attract 675,500 visitors per year.
A triple-net ground lease with the building owner is a likely arrangement for operating High Point.

High Point Feasibility Study
Heinz College: Fall 2010 Systems Project
58
Construction is a significant cost for High Point and is estimated to be about $61 Million.
Debt service is the largest operating expense for High Point, which is estimated to be $426,527 per month.
Given increasing attendance rates, it is possible for High Point to become operationally profitable within 10 years.
6.2 Recommendations and Next Steps
High Point began as an idea, and the purpose for conducting this feasibility study was to give an unbiased prognosis for the possibility of constructing such an attraction on the top of the most iconic building in Pittsburgh. Over the course of this study, significant challenges were uncovered that will need to be addressed in order for that to happen.
Based on our research, it is clear that overcoming these challenges will require extraordinary effort by many dedicated individuals. Therefore, our primary recommendation is for a not-for-profit organization to be established to organize these efforts and serve as the official voice for High Point. In order to be effective, this organization will need to include individuals with expertise in many fields and with close connections to Pittsburgh businesses, not-for-profit and foundations.
Once such an organization is established, the project team recommends that the organization undertake a number of short and long term actions.
Short Term
Continue to engage primary stakeholders, especially the building owners and large tenants, in order to have an open dialogue and understand their priorities and interests.
Continue analyzing the market for attractions in Pittsburgh using new data as it becomes available.
Identify the core programming features for High Point (restaurant, meeting space, etc) and conduct a formal business plan to better understand their revenue generation potential.
Finalize the name for High Point. Engage architects to begin an actual
design of the rooftop structure.
stakeholders to create a local tourism plan that would include High Point as a driver in the continued revitalization of downtown Pittsburgh/ or the Central Business District.
Cultivate relationships with alternative energy equipment producers and suppliers like Westinghouse and First Solar.
Hire fundraising and marketing professionals to promote the idea of High Point.
Identify funding sources, including public and private partnerships, at the local, state, and federal level that may facilitate the construction of High Point.
Long Term
Once extensive access to the roof of the building has been secured:
o Commission a third-party site assessment completed by a team of structural engineers.
o Convene a team of mechanical and structural engineers to serve on a preliminary advisory board for design and site specifications.
o Conduct a comprehensive study of floor logistics and crowd management to determine how the new structure will affect parking lots, public transit, and sidewalk traffic.

High Point Feasibility Study
Heinz College: Fall 2010 Systems Project
59
o Conduct a site assessment for wind and solar, and other renewable energies to determine the most appropriate angle and placement of solar panels and wind turbines and to determine a precise amount of power generation.
o Measure wind speeds at the top of the U.S. Steel Tower using an anemometer for a minimum of eight months to accurately determine air speed.
Engage the Federal Aviation Administration (FAA) to conduct an aeronautical study to determine the potential of electromagnetic interference from wind turbines installed on High Point.
File a permit application with the Pittsburgh City Planning Department.
All Hazard Plan and submit it for approval.
Continue to monitor developments in green technology that may prove applicable to High Point.
In the end, feasibility will be determined by the dedicated group of individuals that continue to work on making High Point a reality. It will be that group that finds innovative solutions to the challenges identified in this report and the countless others that were not foreseen. This project team sincerely hopes join future teams and champion of High Point for a toast at the grand opening of High Point.

High Point Feasibility Study
Heinz College: Fall 2010 Systems Project
60
Appendices
Appendix A

High Point Feasibility Study
Heinz College: Fall 2010 Systems Project
61
Appendix B
Wind Energy: Side by Side comparison of Vertical Axis Wind Turbines
Unit 1: 1.2 kW Windspire (data below reflects per unit)purchase cost $4,995 commercial rate of electricity in PAinstallation cost $1,000 $0.10Maintenance cost $0federal tax incentives rate 0.3 1.2 kW Unit kWh per year with average of 12 mph wind speeds (conservative)Tax incentive value $1,499 2,000Cost after tax incentive $4,497
1.2kW Unit: kWh per year with average of 22 mph wind speeds (aggressive)Life of turbine (years) 20 3,660
annual energy savings with 12 mph winds Savings over life of turbine with 12 mph winds$200 $4,000
annual energy savings with 22 mph winds Savings over life of turbine with 22 mph winds$366 $7,320
Unit: 2.4 kW Skystream 3.7 purchase cost $12,000 commercial rate of electricity in PAinstallation cost $0 $0.10Maintenance cost NAfederal tax incentives rate 0.3 2.4 kW Unit kWh per year with average of 12 mph wind speeds (conservative)Tax incentive value $3,600 3,300Cost after tax incentive $8,400
2.4 kW Unit: kWh per year with average of 22 mph wind speeds (aggressive)Life of turbine (years) 20 6,039
Savings over life of turbine with 12 mph windsannual energy savings with 12 mph winds $6,600
$330 Savings over life of turbine with 22 mph windsannual energy savings with 22 mph winds $12,078
$604
Unit: 1 kW Urban Energy Eddy GTpurchase cost $7,000 commercial rate of electricity in PAinstallation cost NA $0.10Maintenance cost NAfederal tax incentives rate 0.3 1 kW Unit kWh per year with average of 12 mph wind speeds (conservative)Tax incentive value $2,100 1,250Cost after tax incentive $4,900
1 kW Unit: kWh per year with average of 22 mph wind speeds (aggressive)Life of turbine (years) 20 2,288
Savings over life of turbine with 12 mph windsannual energy savings with 12 mph winds $2,500
$125 Savings over life of turbine with 22 mph windsannual energy savings with 22 mph winds $4,575
$229
Main criteria to determine elegibility of VAWTCut-‐in speed at or below 8.5 mphSound output <20dBASurvival wind speed above 100 mphTurbine Life >= 20 yrs

High Point Feasibility Study
Heinz College: Fall 2010 Systems Project
62
Appendix C
Electricity calcualtions based on sector and square footage
kWh demand by economic sector
Type kWh/sq ft Sq Ft source NotesRetail/Gift Shop 14 2,000 http://www.mge.com/business/saving/BEA/_escrc_0013000000DP22YAAT-‐2_BEA1_CEA_CEA-‐05.htmlRetail stores like Home Depot are 21 kWh/sq ftRestaurant 49 5,000 http://www.eia.doe.gov/emeu/cbecs/cbecs2003/detailed_tables_2003/2003set10/2003pdf/c14.pdfAverage US restaurant kW demandCafé 6 3,000 Starbucks Sustainability report (Please see Google Docs) This is based on Starbucks kWh demandVacant 2.4 1,500 http://www.eia.doe.gov/emeu/cbecs/cbecs2003/detailed_tables_2003/2003set10/2003pdf/c14.pdfmiscellaneous space: used for art exhibit, etc.
kWh demand by sector kWh CostRetail/Gift Shop 28,000 $2,800 $0.10 commercial rate price per kWhRestaurant 245,000 $24,500Café 18,000 $1,800Vacant 3,600 $360
Annual kWh demand for High Point 294,600Annual electrcity cost for High Point $29,460.00
Wind Energy Aggressive Conservative Solar Energy Total combined kWh from wind and solar 73,200number of VAWT 20 10 Sq. Ft of SolarkWh per VAWT 3,660 2,000 kWh per sq. ft Total combined savings from wind and solar $7,320kWh per year 73,200 20,000 kWh per year 0Savings per year $7,320.00 $2,000 Savings per year $0 Total Net Cost from wind and solar $22,140
Percent of Savings from wind and solar 24.85%
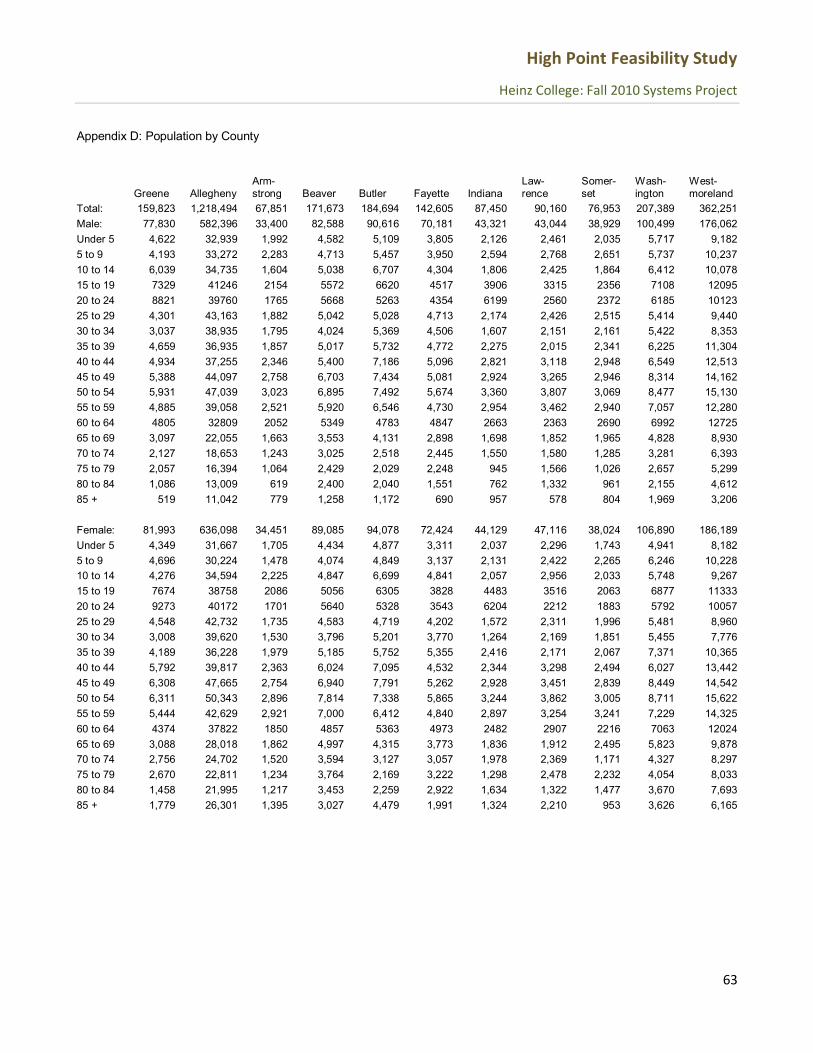
High Point Feasibility Study
Heinz College: Fall 2010 Systems Project
63
Appendix D: Population by County
Greene Allegheny
Arm-strong Beaver Butler Fayette Indiana
Law-rence
Somer-set
Wash-ington
West-moreland
Total: 159,823 1,218,494 67,851 171,673 184,694 142,605 87,450 90,160 76,953 207,389 362,251 Male: 77,830 582,396 33,400 82,588 90,616 70,181 43,321 43,044 38,929 100,499 176,062 Under 5 4,622 32,939 1,992 4,582 5,109 3,805 2,126 2,461 2,035 5,717 9,182 5 to 9 4,193 33,272 2,283 4,713 5,457 3,950 2,594 2,768 2,651 5,737 10,237 10 to 14 6,039 34,735 1,604 5,038 6,707 4,304 1,806 2,425 1,864 6,412 10,078 15 to 19 7329 41246 2154 5572 6620 4517 3906 3315 2356 7108 12095 20 to 24 8821 39760 1765 5668 5263 4354 6199 2560 2372 6185 10123 25 to 29 4,301 43,163 1,882 5,042 5,028 4,713 2,174 2,426 2,515 5,414 9,440 30 to 34 3,037 38,935 1,795 4,024 5,369 4,506 1,607 2,151 2,161 5,422 8,353 35 to 39 4,659 36,935 1,857 5,017 5,732 4,772 2,275 2,015 2,341 6,225 11,304 40 to 44 4,934 37,255 2,346 5,400 7,186 5,096 2,821 3,118 2,948 6,549 12,513 45 to 49 5,388 44,097 2,758 6,703 7,434 5,081 2,924 3,265 2,946 8,314 14,162 50 to 54 5,931 47,039 3,023 6,895 7,492 5,674 3,360 3,807 3,069 8,477 15,130 55 to 59 4,885 39,058 2,521 5,920 6,546 4,730 2,954 3,462 2,940 7,057 12,280 60 to 64 4805 32809 2052 5349 4783 4847 2663 2363 2690 6992 12725 65 to 69 3,097 22,055 1,663 3,553 4,131 2,898 1,698 1,852 1,965 4,828 8,930 70 to 74 2,127 18,653 1,243 3,025 2,518 2,445 1,550 1,580 1,285 3,281 6,393 75 to 79 2,057 16,394 1,064 2,429 2,029 2,248 945 1,566 1,026 2,657 5,299 80 to 84 1,086 13,009 619 2,400 2,040 1,551 762 1,332 961 2,155 4,612 85 + 519 11,042 779 1,258 1,172 690 957 578 804 1,969 3,206
Female: 81,993 636,098 34,451 89,085 94,078 72,424 44,129 47,116 38,024 106,890 186,189 Under 5 4,349 31,667 1,705 4,434 4,877 3,311 2,037 2,296 1,743 4,941 8,182 5 to 9 4,696 30,224 1,478 4,074 4,849 3,137 2,131 2,422 2,265 6,246 10,228 10 to 14 4,276 34,594 2,225 4,847 6,699 4,841 2,057 2,956 2,033 5,748 9,267 15 to 19 7674 38758 2086 5056 6305 3828 4483 3516 2063 6877 11333 20 to 24 9273 40172 1701 5640 5328 3543 6204 2212 1883 5792 10057 25 to 29 4,548 42,732 1,735 4,583 4,719 4,202 1,572 2,311 1,996 5,481 8,960 30 to 34 3,008 39,620 1,530 3,796 5,201 3,770 1,264 2,169 1,851 5,455 7,776 35 to 39 4,189 36,228 1,979 5,185 5,752 5,355 2,416 2,171 2,067 7,371 10,365 40 to 44 5,792 39,817 2,363 6,024 7,095 4,532 2,344 3,298 2,494 6,027 13,442 45 to 49 6,308 47,665 2,754 6,940 7,791 5,262 2,928 3,451 2,839 8,449 14,542 50 to 54 6,311 50,343 2,896 7,814 7,338 5,865 3,244 3,862 3,005 8,711 15,622 55 to 59 5,444 42,629 2,921 7,000 6,412 4,840 2,897 3,254 3,241 7,229 14,325 60 to 64 4374 37822 1850 4857 5363 4973 2482 2907 2216 7063 12024 65 to 69 3,088 28,018 1,862 4,997 4,315 3,773 1,836 1,912 2,495 5,823 9,878 70 to 74 2,756 24,702 1,520 3,594 3,127 3,057 1,978 2,369 1,171 4,327 8,297 75 to 79 2,670 22,811 1,234 3,764 2,169 3,222 1,298 2,478 2,232 4,054 8,033 80 to 84 1,458 21,995 1,217 3,453 2,259 2,922 1,634 1,322 1,477 3,670 7,693 85 + 1,779 26,301 1,395 3,027 4,479 1,991 1,324 2,210 953 3,626 6,165

High Point Feasibility Study
Heinz College: Fall 2010 Systems Project
64
Appendix E: Attendance per Institution
Attendance Institution 2003 2004 2005 2006 2009
Pittsburgh Pirates 1,784,991 1,636,751 1,583,031 1,817,245 1,750,000 Kennywood 1,400,000 1,400,000 1,400,000 1,300,000 1,300,000 Gateway Clipper Fleet 800,000 800,000 800,000 800,000 800,000 Pittsburgh Zoo 801,700 670,122 740,000 800,000 1,010,238 Carnegie Science Center 671,671 726,876 618,800 587,000 711,700 Pittsburgh Steelers 615,219 601,400 477,584 619,746 632,374 Pittsburgh Penguins 636,199 739,582 486,961 653,700 888,653 Idlewild and Soak Zone 500,000 500,000 500,000 600,000 600,000 Carnegie Museums of Art and Natural History 480,222 372,757 246,400 180,618 386,300 Sandcastle Waterpark 350,000 350,000 350,000 350,000 350,000 Pittsburgh Panthers (Football) 323,512 293,762 355,183 241,630 296,113 Pittsburgh Panthers Basketball 196,776 202,177 180,618 197,447 National Aviary 113,000 120,800 110,212 110,212 123,400 Heinz Regional History Center 106,911 108,000 292,559 120,500 130,000 Children's Museum 94,000 93,324 104,672 86,087 232,098 Andy Warhol Museum 79,681 Mattress Factory 27,500 Fallingwater 126,001 126,138 140,015 140,000 145,000 Frick Art & Historical Center 152,531 167,932 180,792 167,305 140,524 Fort Necessity National Battlefield 95,817 89,407 93,649 105,366 140,000 Pittsburgh Symphony 397,000 273,746 325,855 325,000 Civic Light Opera 190,000 Pittsburgh Opera 52,937 Pittsburgh Public Theater Washington Wild Things 142,752 132,901 156,276 164,334 177,495 The Meadows 177,950 Phipps Conservatory 401,065 Soldiers and Sailors National Military Museum and Memorial
151,460

High Point Feasibility Study
Heinz College: Fall 2010 Systems Project
65
Appendix F: Number of Household Per Income Bracket
Greene Co., OH
Allegheny Co., PA
Armstrong Co., PA
Beaver Co., PA
Butler Co., PA
Fayette Co., PA
Indiana Co., PA
Lawrence Co., PA
Somerset Co., PA
Washington Co., PA
Westmoreland Co., PA
Total: 62,923 528,663 28,085 71,782 72,922 58,857 34,485 36,615 29,960 85,089 152,370 Less than $15,000 8,170 80,439 4,350 9,212 7,212 10,768 6,165 5,434 4,896 11,711 19,591 $15,000 to $19,999 2,326 32,972 2,222 4,277 3,358 5,303 2,568 2,302 2,128 5,141 10,881 $20,000 to $24,999 4,125 32,233 1,560 5,158 3,945 4,564 2,371 3,461 2,369 5,145 10,007 $25,000 to $29,999 3,232 30,580 1,755 5,079 3,695 4,352 1,916 1,748 2,357 5,164 7,308 $30,000 to $34,999 2,543 29,275 1,551 4,883 3,712 3,804 1,857 2,332 1,583 5,275 7,685 $35,000 to $39,999 2,898 26,886 1,583 3,338 3,371 3,889 2,605 1,821 1,825 3,954 8,149 $40,000 to $44,999 2,866 26,496 1,253 4,293 4,058 3,271 1,606 1,892 1,349 3,496 8,877 $45,000 to $49,999 2,832 24,175 1,791 3,502 3,360 2,656 1,782 2,471 1,704 4,370 7,813 $50,000 to $59,999 4,814 41,746 3,198 6,537 6,640 5,558 3,511 3,028 2,893 7,140 13,161 $60,000 to $74,999 7,347 49,642 3,178 7,798 8,224 4,328 3,274 3,544 3,556 10,426 16,898 $75,000 to $99,999 8,220 59,164 2,964 8,717 9,289 5,325 4,172 4,737 2,477 10,801 19,463
$100,000 to $124,999 5,830 35,913 1,461 4,356 6,253 2,317 1,305 2,466 1,379 6,098 9,718 $125,000 to $149,999 2,730 19,703 691 1,669 4,311 1,163 598 864 428 2,593 5,554 $150,000 to $199,999 3,721 18,235 395 1,957 3,493 980 508 288 501 1,954 4,245
$200,000 or more 1,269 21,204 133 1,006 2,001 579 247 227 515 1,821 3,020

High Point Feasibility Study
Heinz College: Fall 2010 Systems Project
66
Appendix G
Aggregate household income in the past 12 months (in 2009 inflation-adjusted dollars)
Greene Co., OH $ 4,418,461,100 Allegheny Co., PA $ 34,573,409,500 Armstrong Co., PA $ 1,433,932,300 Beaver Co., PA $ 4,050,938,900 Butler Co., PA $ 5,136,161,700 Fayette Co., PA $ 2,747,756,900 Indiana Co., PA $ 1,674,323,600 Lawrence Co., PA $ 1,881,497,900 Somerset Co., PA $ 1,543,044,600 Washington Co., PA $ 5,076,609,600 Westmoreland Co., PA $ 9,171,011,400 Total
$ 71,707,147,500
5% on Entertainment & Recreation $ 3,585,357,375

High Point Feasibility Study
Heinz College: Fall 2010 Systems Project
67
Works Cited
Alliance, G. B. (n.d.). http://www.pncsites.com/pnccommunityinvolvement/environment.htm. Retrieved from PNC Green Branch.
Area Property Partners Website. (n.d.). Retrieved from http://www.areapropertypartners.com/home.php.
Armed Services Committee, Subcommittee on Readiness on the Impact of Wind Farms on Military Readiness. (2010, June 29). Testimony of Nancy Kalinowski. Retrieved October 2010, from Federal Avaition Administration: http://www.faa.gov/news/testimony/news_story.cfm?newsId=11562
Chief Engineers of Chicagoland Association. (2010, September 16). Retrieved September 21, 2010, from The Chief Engineer: http://www.chiefengineer.org/content/content_display.cfm/seqnumber_content/1386.htm
City of Pittsburgh. (2009, December 11). Code of Ordinances. Title Nine of Pittsburgh Zoning Code .
City of Pittsburgh. (2003). Pittsburgh All Hazard Plan.
Construction Loan Center. (2010). Construction Loan Center. Retrieved 2010, from http://www.constructionloancenter.com/interest-‐only-‐calculator.htm
DK Shifflet. (2007). PA Annual Tourism Report. Harrisburg: Department of Community and Economic Development.
Donohoe, D. (2010). Executive Director, Allegheny Regional Assets Districts. (L. Andrews, Interviewer)
Economic Impact Report.
Elliot, S. (2005, April 11). U.S. Steel Tower owners seek investors. Retrieved October 2010, from Bizjournals: http://www.bizjournals.com/pittsburgh/stories/2005/04/11/story4.html
Eriksson, S., Bernhoff, H., & Leijon, M. (2006). Evaluation of different turbine concepts for wind power. Uppsala, Sweden: Swedish Centre for Renewable Electric Energy Conversion, Division for Electricity and Lightning Research.
ESRI. (n.d.).
Federal Aviation Administration. (2010, July 21). Notice Criteria Tool. Retrieved November 26, 2010, from Federal Aviation Adminstration: http://edocket.access.gpo.gov/cfr_2004/janqtr/pdf/14cfr77.5.pdf
Power Generation from Aeroelastic Flutter at Low Reynolds Number, Design, Fabrication and Analysis of a Wind Belt System. Univerisity of Pennsylvania, School of Engineering and Applied Science.

High Point Feasibility Study
Heinz College: Fall 2010 Systems Project
68
Ginestra, C. (2010, 9 16). Ph. D. Student Department of Materials Science and Engineering, Stanford University. (L. Scott, Interviewer)
Ginestra, C. a. (n.d.). Nanoscale Electrolytes for Solid Oxide Fuel Cells.
Glover, L. (2010). Associate Director. (L. Andrews, Interviewer)
Green Building Alliance. (2010). Shades of Green: Green Building Projects, Servcies, and Products in Western Pennsylvania. Pittsburgh.
Green Building Alliance. (2010). Solar Power. Retrieved November 1, 2010, from Green Building Alliance: http://www.gbapgh.org
Gupta, P. (2010, September 20). Wal-‐Mart To Try Thin-‐Film Solar Technology. Reuters , p. 1.
HPP Sytems Survey. (n.d.).
Humes, C., & Moller, R. (2010, November 5). (B. Wiewiora, Interviewer)
Lam, K. P. (n.d.). United States Steel Coportation Headquarters, Pittsburgh. 262-‐268.
Layman, C. (2010, September 23). Senior Planner, Department of City Planning. (S. Fink, Interviewer)
Lee, S. (2010, October 15). Professor of Architecture. (B. Bucher, Interviewer)
Local Area Unemployment Statistics, Pittsburgh, PA Metropolitan Statistical Area. (n.d.). Retrieved November 23, 2010, from United States Department of Labor, Bureau of Labor Statistics: http://data.bls.gov
Loomis, J. (2010, November 13). (B. Bucher, Interviewer)
Magazine, B. (n.d.). http://www.pncsites.com/pnccommunityinvolvement/environment.htm. Retrieved from PNC Green Branch.
Mantha, P. (2008). GIS As A Tool To Evaluate The Solar Potential of Fifty Largest Buildings and All Public Parking Lots in Pittsburgh. Pittsburgh.
Moller, R. E., & Humes, C. (2010, November 5). High Point Construction Costs Interview. (B. Wiewiora, Interviewer)
Moody's Analytics, Inc. (n.d.). Pittsburgh Economic Outlook. Retrieved November 23, 2010, from economy.com: http://www.economy.com/home/products/snapshot/us/metro.aspx?g=MPIT&src=medc-‐ppmetro
National Development Council. (2004). Real Estate Finance. Edgewood: National Development Council.

High Point Feasibility Study
Heinz College: Fall 2010 Systems Project
69
North Carolina State University. (2010). Federal Incentives/Policies for Solar. Retrieved 2010, from Dsire Solar: http://www.dsireusa.org/solar/incentives/index.cfm?state=us&re=1&EE=1&spv=1&st=1
NYC Statistics. (n.d.). Retrieved November 26, 2010, from NYC: The official guide.
Oberndorfer, E., Lundholm, J., Bass, B., Coffman, R. R., Doshi, H., Dunnett, N., et al. (2007). Green Roofs as Urban Ecosystems: Ecological Structures, Functions, and Services. BioScience , 823-‐833.
O'Toole, C. (2010, September 24). Pittsburgh Green. Retrieved October 19, 2010, from Keystone Edge: http://www.keystoneedge.com/features/pittsburghgreen0924.aspx
Pennsylvania State Data Center. (n.d.).
Pittsburgh Downtown Partnership Website. (n.d.). Retrieved from http://www.downtownpittsburgh.com/.
Pittsburgh Parks Conservancy. (n.d.). Retrieved from http://www.trammellcrow.com/default.aspx?TabId=85
PittsburghTODAY; Economy. (n.d.). Retrieved November 23, 2010, from PittsburghTODAY: www.pittsburghtoday.org
PNC Corperate History Webpage. (n.d.). Retrieved from https://www.pnc.com/webapp/unsec/NCProductsAndService.do?siteArea=/pnccorp/PNC/Home/About+PNC/Our+Organization/Corporate+History.
Rademacher, S. (2010, October). Park Curator. (D. Benitez, Interviewer)
Renewable Energy Policy Network for the 21st Century. (2010). Renewables 2010: Global Status Report. Retrieved 2010, from Renewable Energy Policy Network for the 21st Century: http://www.ren21.net/Portals/97/documents/GSR/REN21_GSR_2010_full_revised%20Sept2010.pdf
Representative, P. (2010). Board Member, PDP. (L. Andrews, Interviewer)
Representative, P. (2010, October 4). Senior Manager. (D. Benitez, Interviewer)
Representative, T.-‐C. (2010, 10). Senior Vice President. (D. Benitez, Interviewer)
Schulman, B. (2010, August). Pittsburgh and the magic of failure. Retrieved November 22, 2010, from Gapersblock: http://gapersblock.com/mechanics/2010/08/24/pittsburgh-‐and-‐the-‐magic-‐of-‐failure/
Siemens Fuel Cell Introduction. (n.d.). Retrieved 8 2010, from Siemens: http://www.energy.siemens.com/hq/en/power-‐generation/fuel-‐cells/introduction.htm
The Greater Seattle Datasheet. (n.d.). Retrieved November 26, 2010, from Seattle.gov: http://www.seattle.gov/oir/datasheet/tourism.htm
Trammell-‐Crow main page. (n.d.). Retrieved from http://www.trammellcrow.com/default.aspx?TabId=85.

High Point Feasibility Study
Heinz College: Fall 2010 Systems Project
70
TribLive Article, Oct.8th 2010. (n.d.). Retrieved from http://www.pittsburghlive.com/x/pittsburghtrib/business/s_703303.html.
Turner Construction. (2008). Green Building Market Barometer.
U.S. Department of Energy. (2010, October 6). Pennsylvania Wind Map and Resource Potential. Retrieved November 26, 2010, from Wind Powering America: http://www.windpoweringamerica.gov/wind_resource_maps.asp?stateab=pa
Velazquez, A. (n.d.). The Greenroofs Project Database. Retrieved November 26, 2010, from Greenroofs.com: http://www.greenroofs.com/projects/
Withrop Management Website. (n.d.). Retrieved from http://www.winthropmanagement.com/.
Zervos, D. H. (2010, November 23). (B. Bucher, Interviewer)