Embed Size (px)
Citation preview
Updated: November 2015
High School Dropout Rates
High School Dropout Rates
November 2015
2
The proportion of youth and young adults who are high school dropouts has been on the
decline since 1967, but disparities persist across race/ethnicity and foreign-born status.
Importance
The proportion of high school dropouts among 16- to 24-year-olds has declined by more than half since
1967, from 17 to seven percent in 2014,a but wide disparities by race, Hispanic origin, and foreign-born
status persist. (Appendix 1)
A range of factors have been shown to increase a student’s risk of dropping out, including high rates of
absenteeism, low levels of school engagement, low parental education, work or family responsibilities,
problematic or deviant behavior, moving to a new school in the ninth grade, and attending a school with
lower achievement scores.1,2,3,4
Dropping out from high school is associated with negative employment and life outcomes. Young people
who drop out of high school are unlikely to have the minimum skills and credentials necessary to function in
today’s increasingly complex society and technology-dependent workplace. The completion of high school is
usually required for accessing post-secondary education, and is a minimum requirement for most jobs.5 A
high school diploma is associated with higher incomes and occupational status,6,7,8,9 and young adults with
low education and skill levels are more likely to live in poverty and to receive government assistance.10,11,12
High school dropouts are also more likely to become involved in crime.13,14 Further, dropout status has been
linked with poor health, including poor mental health.15,16 Such negative outcomes, along with diminished
labor force participation, exact a high economic toll on society. If the dropouts from the nation’s class of
2011 had graduated, the U.S. economy would benefit by about $154 billion dollars over their lifetimes.17
Many youth who drop out of high school do eventually earn a diploma or a GED,18 although the benefit of a
GED without a college education, especially for minorities, is disputed.19 One study found that 63 percent of
students who dropped out had earned a diploma or GED within eight years of the year they normally should
have graduated.20
a Note that this measure—sometimes referred to as the “status” dropout rate—represents only one of several ways for
calculating high school dropout. The “event” dropout rate reports the percentage of young people ages 15 through 24
who dropped out of grades 10 through 12 in the past year. The “cohort” dropout rate measures the percentage of an
entering ninth-grade class that drops out before the end of the twelfth-grade year. The “status” dropout rate is the only
measure for which there are reliable national data over a number of years. National data on cohort graduation rates show
that 81 percent of the public high school class of 2012-13 graduated four years after entering ninth grade.
High School Dropout Rates
November 2015
3
Trends
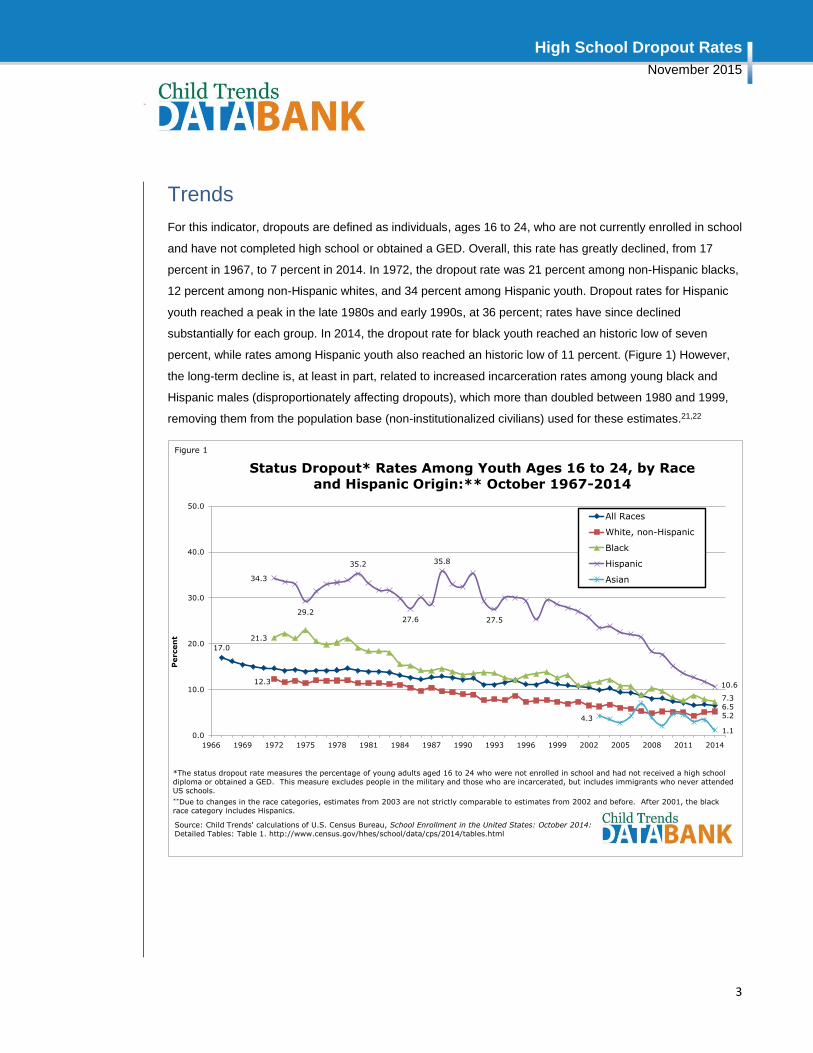
For this indicator, dropouts are defined as individuals, ages 16 to 24, who are not currently enrolled in school
and have not completed high school or obtained a GED. Overall, this rate has greatly declined, from 17
percent in 1967, to 7 percent in 2014. In 1972, the dropout rate was 21 percent among non-Hispanic blacks,
12 percent among non-Hispanic whites, and 34 percent among Hispanic youth. Dropout rates for Hispanic
youth reached a peak in the late 1980s and early 1990s, at 36 percent; rates have since declined
substantially for each group. In 2014, the dropout rate for black youth reached an historic low of seven
percent, while rates among Hispanic youth also reached an historic low of 11 percent. (Figure 1) However,
the long-term decline is, at least in part, related to increased incarceration rates among young black and
Hispanic males (disproportionately affecting dropouts), which more than doubled between 1980 and 1999,
removing them from the population base (non-institutionalized civilians) used for these estimates.21,22
17.0
6.5
12.3
5.2
21.3
7.3
34.3
29.2
35.2
27.6
35.8
27.5
10.6
4.3
1.10.0
10.0
20.0
30.0
40.0
50.0
1966 1969 1972 1975 1978 1981 1984 1987 1990 1993 1996 1999 2002 2005 2008 2011 2014
Percen
t
Status Dropout* Rates Among Youth Ages 16 to 24, by Race and Hispanic Origin:** October 1967-2014
All Races
White, non-Hispanic
Black
Hispanic
Asian
*The status dropout rate measures the percentage of young adults aged 16 to 24 who were not enrolled in school and had not received a high school
diploma or obtained a GED. This measure excludes people in the military and those who are incarcerated, but includes immigrants who never attended
US schools.
**Due to changes in the race categories, estimates from 2003 are not strictly comparable to estimates from 2002 and before. After 2001, the black
race category includes Hispanics.
Source: Child Trends' calculations of U.S. Census Bureau, School Enrollment in the United States: October 2014:
Detailed Tables: Table 1. http://www.census.gov/hhes/school/data/cps/2014/tables.html
Figure 1
High School Dropout Rates
November 2015
4
Differences by Race and Hispanic Origin23
Black and Hispanic youth are more likely than whites or Asians to have dropped out of high school. In 2014,
five percent of whites ages 16 to 24 were not enrolled in school and had not completed high school,
compared with seven percent of blacks, and eleven percent of Hispanics. (Figure 1) The high rate for
Hispanics is partly the result of the high proportion of immigrants in this age group who never attended
school in the U.S.24 Asian youth had the lowest rate of all the racial and ethnic groups tabulated here, at one
percent in 2014. (Figure 1)
Differences by Gender
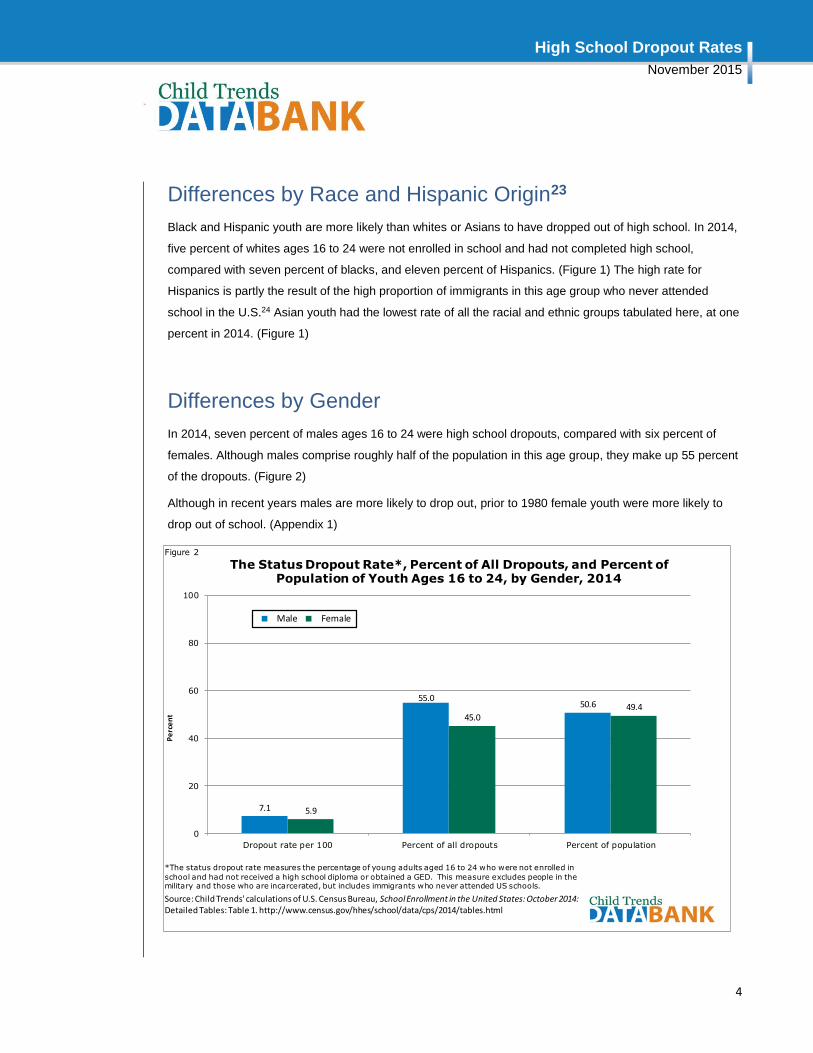
In 2014, seven percent of males ages 16 to 24 were high school dropouts, compared with six percent of
females. Although males comprise roughly half of the population in this age group, they make up 55 percent
of the dropouts. (Figure 2)
Although in recent years males are more likely to drop out, prior to 1980 female youth were more likely to
drop out of school. (Appendix 1)
7.1
55.050.6
5.9
45.049.4
0
20
40
60
80
100
Dropout rate per 100 Percent of all dropouts Percent of population
Pe
rce
nt
The Status Dropout Rate*, Percent of All Dropouts, and Percent of Population of Youth Ages 16 to 24, by Gender, 2014
Male Female
Figure 2
*The status dropout rate measures the percentage of young adults aged 16 to 24 who were not enrolled in
school and had not received a high school diploma or obtained a GED. This measure excludes people in the military and those who are incarcerated, but includes immigrants who never attended US schools.
Source: Child Trends' calculations of U.S. Census Bureau, School Enrollment in the United States: October 2014:Detailed Tables: Table 1. http://www.census.gov/hhes/school/data/cps/2014/tables.html
High School Dropout Rates
November 2015
5
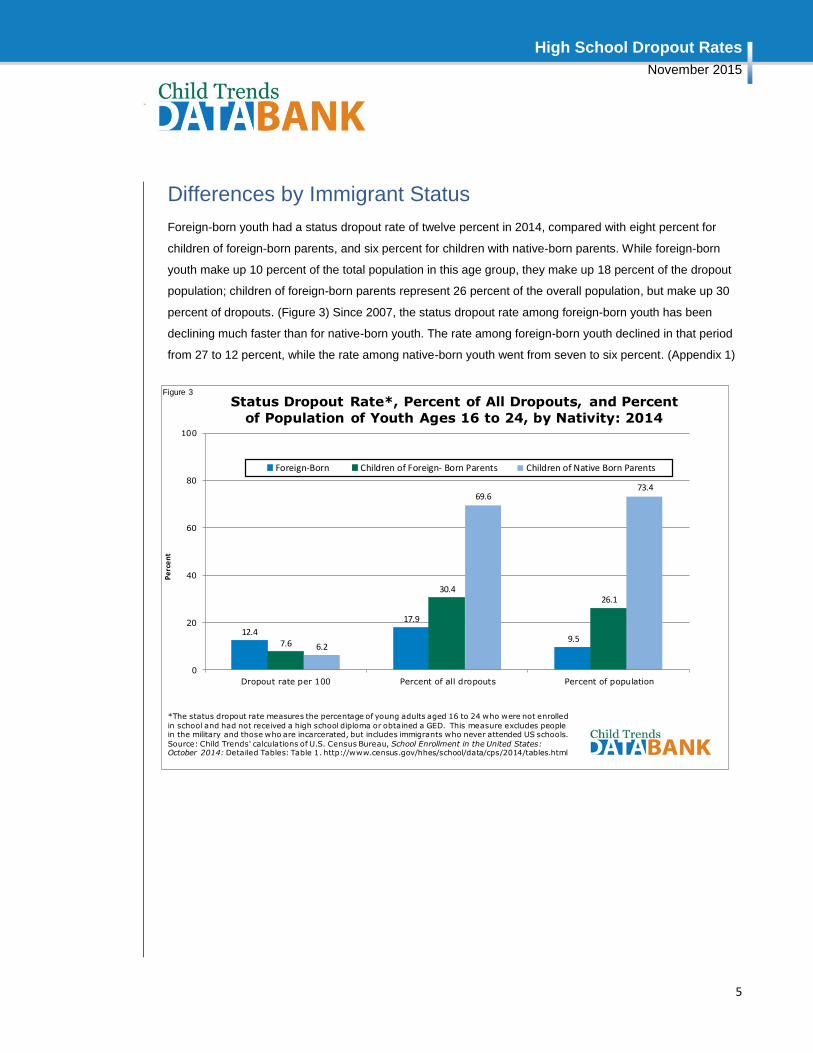
Differences by Immigrant Status
Foreign-born youth had a status dropout rate of twelve percent in 2014, compared with eight percent for
children of foreign-born parents, and six percent for children with native-born parents. While foreign-born
youth make up 10 percent of the total population in this age group, they make up 18 percent of the dropout
population; children of foreign-born parents represent 26 percent of the overall population, but make up 30
percent of dropouts. (Figure 3) Since 2007, the status dropout rate among foreign-born youth has been
declining much faster than for native-born youth. The rate among foreign-born youth declined in that period
from 27 to 12 percent, while the rate among native-born youth went from seven to six percent. (Appendix 1)
12.4
17.9
9.57.6
30.426.1
6.2
69.673.4
0
20
40
60
80
100
Dropout rate per 100 Percent of all dropouts Percent of population
Pe
rce
nt
Status Dropout Rate*, Percent of All Dropouts, and Percent
of Population of Youth Ages 16 to 24, by Nativity: 2014
Foreign-Born Children of Foreign- Born Parents Children of Native Born Parents
*The status dropout rate measures the percentage of young adults aged 16 to 24 who were not enrolled
in school and had not received a high school diploma or obtained a GED. This measure excludes people in the military and those who are incarcerated, but includes immigrants who never attended US schools.
Source: Child Trends' calculations of U.S. Census Bureau, School Enrollment in the United States: October 2014: Detailed Tables: Table 1. http://www.census.gov/hhes/school/data/cps/2014/tables.html
Figure 3
High School Dropout Rates
November 2015
6
State and Local Estimates
State estimates from 2000 through 2014 (including ages 16-19 only) are available at the KIDS COUNT Data
Center.
State estimates of public school on-time graduation rates for the classes of 2010-11, 2011-12, and 2012-13
are available from the National Center for Education Statistics: https://nces.ed.gov/ccd/tables/ACGR_2010-
11_to_2012-13.asp
International Estimates
International estimates (2010 data) of upper-secondary graduation rates for most countries are available
from the Organization for Economic Co-operation and Development (OECD) at:
http://www.oecd.org/edu/eag2012.htm
(See Indicator A2)
National Goals
Healthy People 2020, a federal government initiative to improve the health of Americans, has among its
goals one to increase the averaged (high school) freshman graduation rate from 74.9 percent in 2007-08 to
82.4 percent in 2020.
For more information, see:
http://www.healthypeople.gov/2020/topicsobjectives2020/objectiveslist.aspx?topicId=2 (goal AH-5.1)
High School Dropout Rates
November 2015
7
What Works to Make Progress on This Indicator
Several recent reviews summarize the knowledge-base on effective, evidence-based practices to prevent or
reduce the risk of students dropping out of school.
Beyond the indicators: An integrated school-level approach to dropout prevention
http://eric.ed.gov/?q=ED539776&id=ED539776
IES What Works Clearinghouse: http://ies.ed.gov/ncee/wwc/reports/topic.aspx?tid=06
What works for education: Lessons from experimental evaluations of programs and social
interventions to enhance educational outcomes. www.childtrends.org/Files/Child_Trends-
2008_05_28_FS_WWEducation.pdf
Related Indicators
Educational Attainment (Youth): www.childtrends.org/?indicators=educational-attainment
Youth Neither Enrolled in School Nor Working: www.childtrends.org/?indicators=youth-neither-
enrolled-in-school-nor-working
Student Absenteeism: www.childtrends.org/?indicators=student-absenteeism
Children Who Repeated a Grade: www.childtrends.org/?indicators=children-who-repeated-a-grade
Parental Expectations for Their Children’s Academic Attainment:
www.childtrends.org/?indicators=parental-expectations-for-their-childrens-academic-attainment
Definition
This indicator uses the “status” dropout rate,25 which measures the percentage of young adults aged 16
through 24 in the civilian, non-institutionalized population who were not enrolled in a high school program
and had not received a high school diploma or obtained an equivalency certificate.26 Note that this measure
does not include youth in prison or in the military.
While this indicator uses the status dropout rate, other indicators (such as on-time high school completion or
high school graduation rates) are also used to measure high school outcomes. For more information, see:
the National Institute of Statistical Sciences/Education Statistics Services Institute Task Force on
Graduation, Completion, and Dropout Indicators’ Final Report, available at
http://nces.ed.gov/pubs2005/2005105.pdf.
High School Dropout Rates
November 2015
8
Data Source
Child Trends' calculations based on: U.S. Census Bureau, Current Population Survey data on school
enrollment. Available at: http://www.census.gov/hhes/school/data/cps/index.html
Raw Data Source
U.S. Department of Commerce, Bureau of the Census, October Current Population Survey
http://www.census.gov/cps/per
High School Dropout Rates
November 2015
9
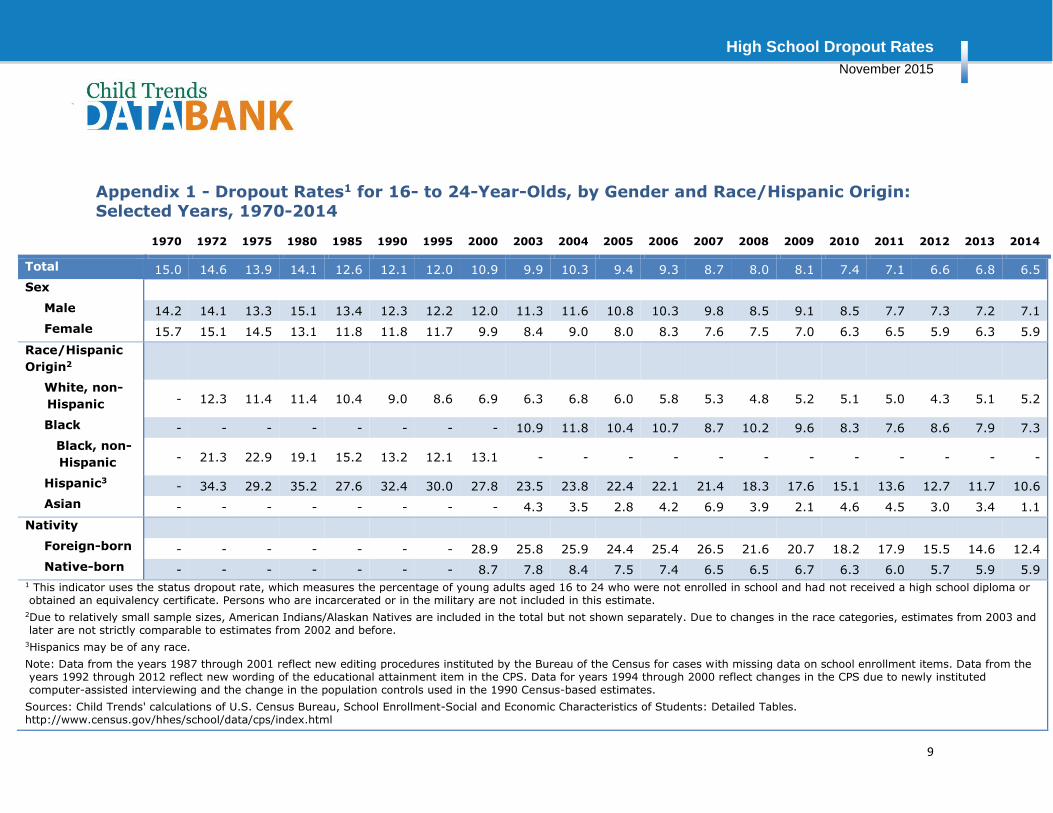
Appendix 1 - Dropout Rates1 for 16- to 24-Year-Olds, by Gender and Race/Hispanic Origin: Selected Years, 1970-2014
1970 1972 1975 1980 1985 1990 1995 2000 2003 2004 2005 2006 2007 2008 2009 2010 2011 2012 2013 2014
Total 15.0 14.6 13.9 14.1 12.6 12.1 12.0 10.9 9.9 10.3 9.4 9.3 8.7 8.0 8.1 7.4 7.1 6.6 6.8 6.5
Sex
Male 14.2 14.1 13.3 15.1 13.4 12.3 12.2 12.0 11.3 11.6 10.8 10.3 9.8 8.5 9.1 8.5 7.7 7.3 7.2 7.1
Female 15.7 15.1 14.5 13.1 11.8 11.8 11.7 9.9 8.4 9.0 8.0 8.3 7.6 7.5 7.0 6.3 6.5 5.9 6.3 5.9
Race/Hispanic
Origin2
White, non-
Hispanic - 12.3 11.4 11.4 10.4 9.0 8.6 6.9 6.3 6.8 6.0 5.8 5.3 4.8 5.2 5.1 5.0 4.3 5.1 5.2
Black - - - - - - - - 10.9 11.8 10.4 10.7 8.7 10.2 9.6 8.3 7.6 8.6 7.9 7.3
Black, non-
Hispanic - 21.3 22.9 19.1 15.2 13.2 12.1 13.1 - - - - - - - - - - - -
Hispanic3 - 34.3 29.2 35.2 27.6 32.4 30.0 27.8 23.5 23.8 22.4 22.1 21.4 18.3 17.6 15.1 13.6 12.7 11.7 10.6
Asian - - - - - - - - 4.3 3.5 2.8 4.2 6.9 3.9 2.1 4.6 4.5 3.0 3.4 1.1
Nativity
Foreign-born - - - - - - - 28.9 25.8 25.9 24.4 25.4 26.5 21.6 20.7 18.2 17.9 15.5 14.6 12.4
Native-born - - - - - - - 8.7 7.8 8.4 7.5 7.4 6.5 6.5 6.7 6.3 6.0 5.7 5.9 5.9 1 This indicator uses the status dropout rate, which measures the percentage of young adults aged 16 to 24 who were not enrolled in school and had not received a high school diploma or obtained an equivalency certificate. Persons who are incarcerated or in the military are not included in this estimate.
2Due to relatively small sample sizes, American Indians/Alaskan Natives are included in the total but not shown separately. Due to changes in the race categories, estimates from 2003 and later are not strictly comparable to estimates from 2002 and before.
3Hispanics may be of any race.
Note: Data from the years 1987 through 2001 reflect new editing procedures instituted by the Bureau of the Census for cases with missing data on school enrollment items. Data from the years 1992 through 2012 reflect new wording of the educational attainment item in the CPS. Data for years 1994 through 2000 reflect changes in the CPS due to newly instituted computer-assisted interviewing and the change in the population controls used in the 1990 Census-based estimates.
Sources: Child Trends' calculations of U.S. Census Bureau, School Enrollment-Social and Economic Characteristics of Students: Detailed Tables. http://www.census.gov/hhes/school/data/cps/index.html
High School Dropout Rates
November 2015
10
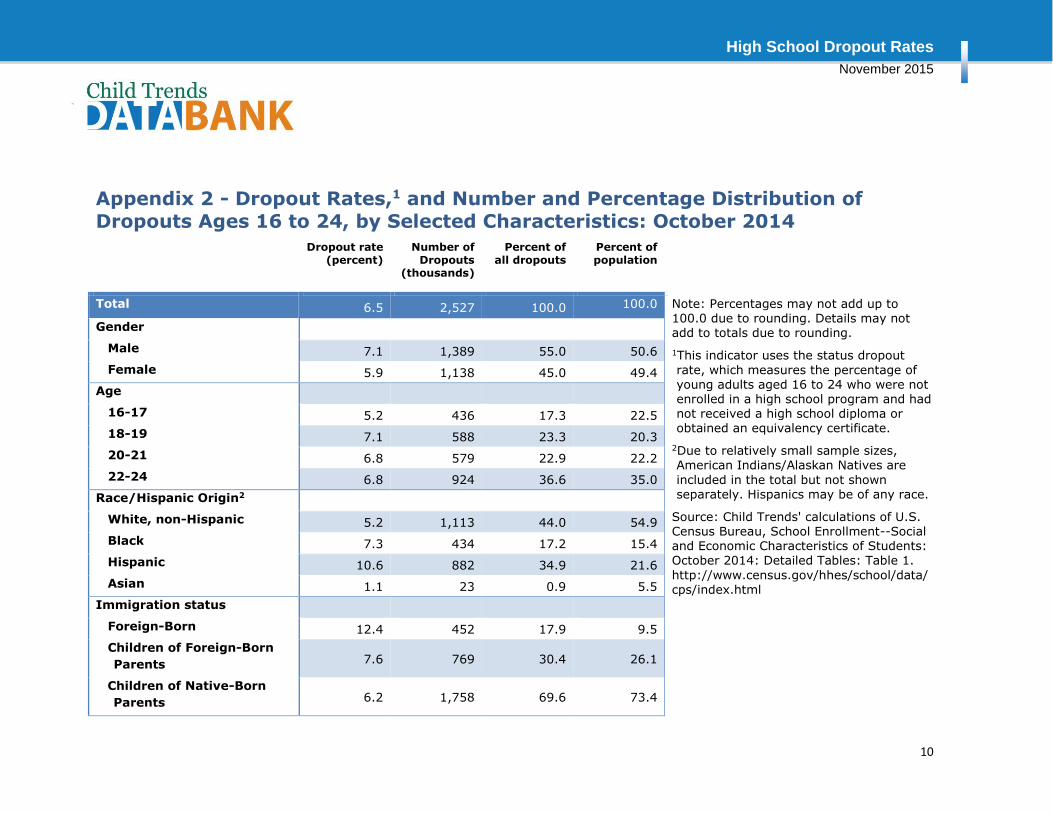
Appendix 2 - Dropout Rates,1 and Number and Percentage Distribution of Dropouts Ages 16 to 24, by Selected Characteristics: October 2014 Dropout rate
(percent) Number of
Dropouts (thousands)
Percent of all dropouts
Percent of population
Total 6.5 2,527 100.0 100.0 Note: Percentages may not add up to 100.0 due to rounding. Details may not add to totals due to rounding.
1This indicator uses the status dropout
rate, which measures the percentage of young adults aged 16 to 24 who were not enrolled in a high school program and had not received a high school diploma or obtained an equivalency certificate.
2Due to relatively small sample sizes, American Indians/Alaskan Natives are
included in the total but not shown separately. Hispanics may be of any race.
Source: Child Trends' calculations of U.S. Census Bureau, School Enrollment--Social and Economic Characteristics of Students: October 2014: Detailed Tables: Table 1.
http://www.census.gov/hhes/school/data/cps/index.html
Gender
Male 7.1 1,389 55.0 50.6
Female 5.9 1,138 45.0 49.4
Age
16-17 5.2 436 17.3 22.5
18-19 7.1 588 23.3 20.3
20-21 6.8 579 22.9 22.2
22-24 6.8 924 36.6 35.0
Race/Hispanic Origin2
White, non-Hispanic 5.2 1,113 44.0 54.9
Black 7.3 434 17.2 15.4
Hispanic 10.6 882 34.9 21.6
Asian 1.1 23 0.9 5.5
Immigration status
Foreign-Born 12.4 452 17.9 9.5
Children of Foreign-Born
Parents 7.6 769 30.4 26.1
Children of Native-Born
Parents 6.2 1,758 69.6 73.4
High School Dropout Rates
November 2015
ovm
11
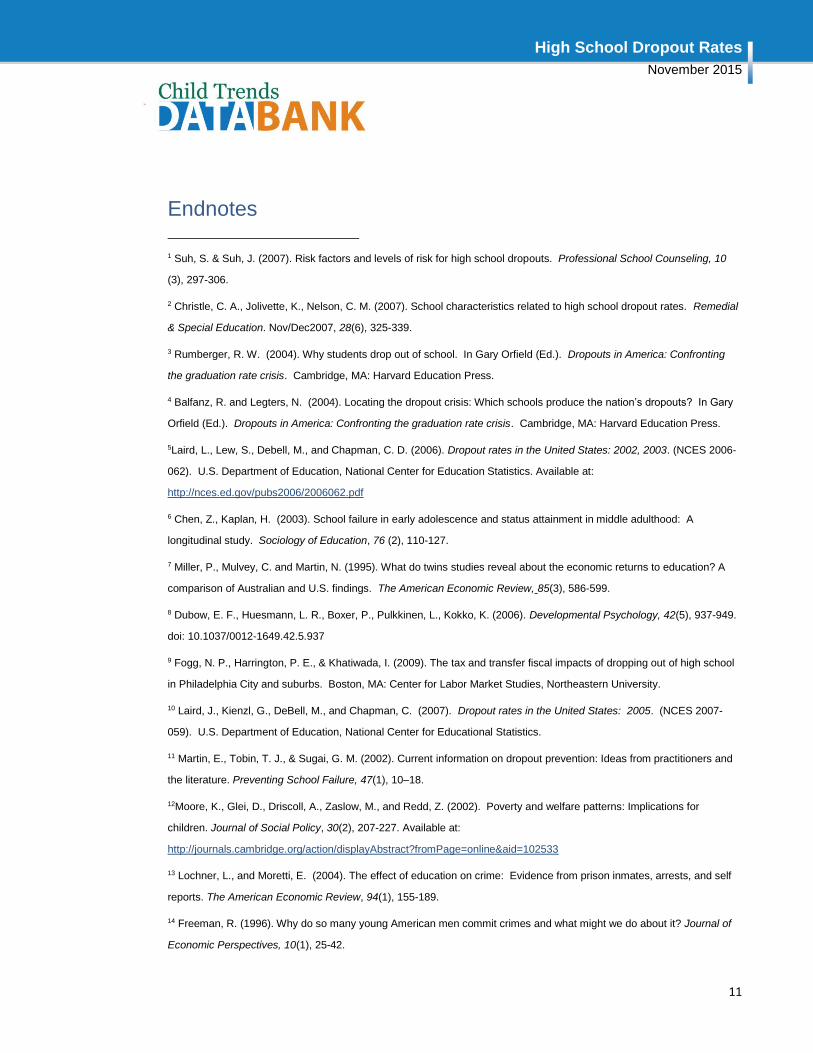
Endnotes
1 Suh, S. & Suh, J. (2007). Risk factors and levels of risk for high school dropouts. Professional School Counseling, 10
(3), 297-306.
2 Christle, C. A., Jolivette, K., Nelson, C. M. (2007). School characteristics related to high school dropout rates. Remedial
& Special Education. Nov/Dec2007, 28(6), 325-339.
3 Rumberger, R. W. (2004). Why students drop out of school. In Gary Orfield (Ed.). Dropouts in America: Confronting
the graduation rate crisis. Cambridge, MA: Harvard Education Press.
4 Balfanz, R. and Legters, N. (2004). Locating the dropout crisis: Which schools produce the nation’s dropouts? In Gary
Orfield (Ed.). Dropouts in America: Confronting the graduation rate crisis. Cambridge, MA: Harvard Education Press.
5Laird, L., Lew, S., Debell, M., and Chapman, C. D. (2006). Dropout rates in the United States: 2002, 2003. (NCES 2006-
062). U.S. Department of Education, National Center for Education Statistics. Available at:
http://nces.ed.gov/pubs2006/2006062.pdf
6 Chen, Z., Kaplan, H. (2003). School failure in early adolescence and status attainment in middle adulthood: A
longitudinal study. Sociology of Education, 76 (2), 110-127.
7 Miller, P., Mulvey, C. and Martin, N. (1995). What do twins studies reveal about the economic returns to education? A
comparison of Australian and U.S. findings. The American Economic Review, 85(3), 586-599.
8 Dubow, E. F., Huesmann, L. R., Boxer, P., Pulkkinen, L., Kokko, K. (2006). Developmental Psychology, 42(5), 937-949.
doi: 10.1037/0012-1649.42.5.937
9 Fogg, N. P., Harrington, P. E., & Khatiwada, I. (2009). The tax and transfer fiscal impacts of dropping out of high school
in Philadelphia City and suburbs. Boston, MA: Center for Labor Market Studies, Northeastern University.
10 Laird, J., Kienzl, G., DeBell, M., and Chapman, C. (2007). Dropout rates in the United States: 2005. (NCES 2007-
059). U.S. Department of Education, National Center for Educational Statistics.
11 Martin, E., Tobin, T. J., & Sugai, G. M. (2002). Current information on dropout prevention: Ideas from practitioners and
the literature. Preventing School Failure, 47(1), 10–18.
12Moore, K., Glei, D., Driscoll, A., Zaslow, M., and Redd, Z. (2002). Poverty and welfare patterns: Implications for
children. Journal of Social Policy, 30(2), 207-227. Available at:
http://journals.cambridge.org/action/displayAbstract?fromPage=online&aid=102533
13 Lochner, L., and Moretti, E. (2004). The effect of education on crime: Evidence from prison inmates, arrests, and self
reports. The American Economic Review, 94(1), 155-189.
14 Freeman, R. (1996). Why do so many young American men commit crimes and what might we do about it? Journal of
Economic Perspectives, 10(1), 25-42.
High School Dropout Rates
November 2015
ovm
12
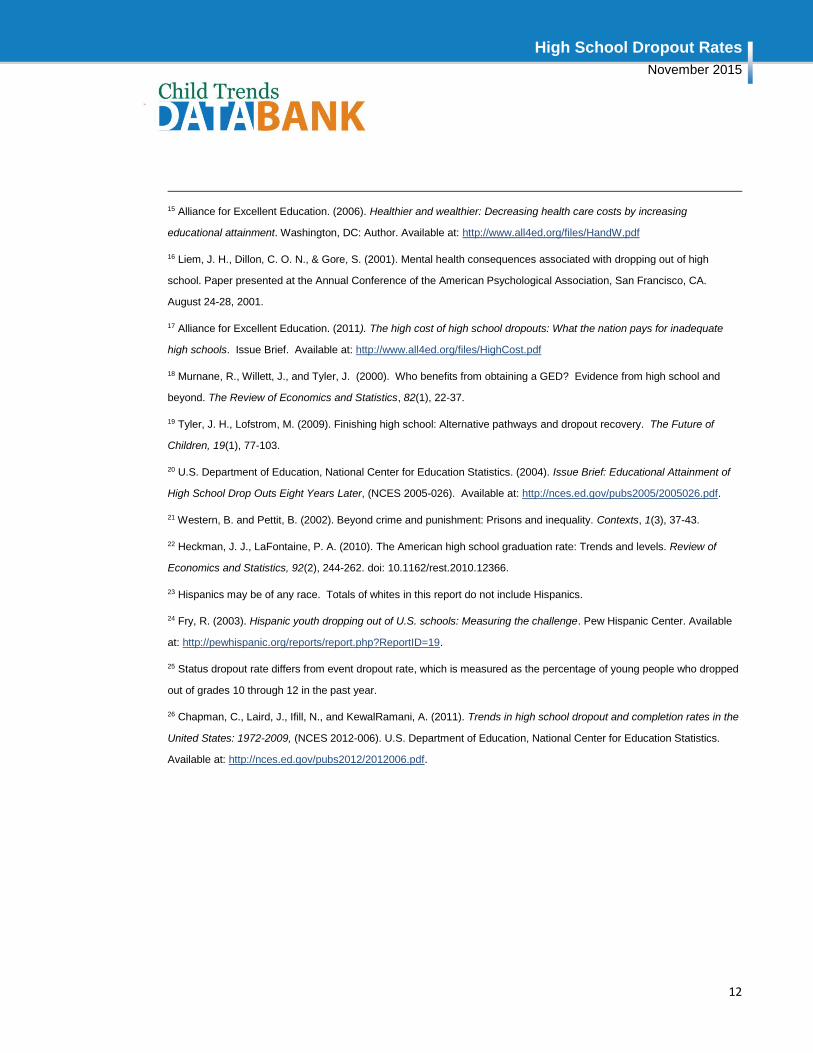
15 Alliance for Excellent Education. (2006). Healthier and wealthier: Decreasing health care costs by increasing
educational attainment. Washington, DC: Author. Available at: http://www.all4ed.org/files/HandW.pdf
16 Liem, J. H., Dillon, C. O. N., & Gore, S. (2001). Mental health consequences associated with dropping out of high
school. Paper presented at the Annual Conference of the American Psychological Association, San Francisco, CA.
August 24-28, 2001.
17 Alliance for Excellent Education. (2011). The high cost of high school dropouts: What the nation pays for inadequate
high schools. Issue Brief. Available at: http://www.all4ed.org/files/HighCost.pdf
18 Murnane, R., Willett, J., and Tyler, J. (2000). Who benefits from obtaining a GED? Evidence from high school and
beyond. The Review of Economics and Statistics, 82(1), 22-37.
19 Tyler, J. H., Lofstrom, M. (2009). Finishing high school: Alternative pathways and dropout recovery. The Future of
Children, 19(1), 77-103.
20 U.S. Department of Education, National Center for Education Statistics. (2004). Issue Brief: Educational Attainment of
High School Drop Outs Eight Years Later, (NCES 2005-026). Available at: http://nces.ed.gov/pubs2005/2005026.pdf.
21 Western, B. and Pettit, B. (2002). Beyond crime and punishment: Prisons and inequality. Contexts, 1(3), 37-43.
22 Heckman, J. J., LaFontaine, P. A. (2010). The American high school graduation rate: Trends and levels. Review of
Economics and Statistics, 92(2), 244-262. doi: 10.1162/rest.2010.12366.
23 Hispanics may be of any race. Totals of whites in this report do not include Hispanics.
24 Fry, R. (2003). Hispanic youth dropping out of U.S. schools: Measuring the challenge. Pew Hispanic Center. Available
at: http://pewhispanic.org/reports/report.php?ReportID=19.
25 Status dropout rate differs from event dropout rate, which is measured as the percentage of young people who dropped
out of grades 10 through 12 in the past year.
26 Chapman, C., Laird, J., Ifill, N., and KewalRamani, A. (2011). Trends in high school dropout and completion rates in the
United States: 1972-2009, (NCES 2012-006). U.S. Department of Education, National Center for Education Statistics.
Available at: http://nces.ed.gov/pubs2012/2012006.pdf.


![Combating the High School Dropout Crisis [Infographic]](https://img.pdfslide.net/doc/110x75/55391679550346bf308b4914/combating-the-high-school-dropout-crisis-infographic.jpg)