Embed Size (px)
Citation preview
1
High School Dropout Rates in Connecticut
Dropout Definition
All states are required to use the U.S. Department of Education National Center for Education Statistics
(NCES) definition of “dropout” and send these statistics to the federal government in the Common Core of
Data (CCD) collection, EDEN and EdFacts Reporting System. The NCES definition of a school dropout is
an individual who:
was enrolled in school at some time during the previous school year;
was not enrolled at the beginning of the current school year;
has not graduated from high school or completed a state- or district-approved educational
program; and
did not meet any of the following exclusionary conditions - transfer to another public school
district, private school, or state- or district-approved educational program, or absence due to
suspension, illness or death.
A state- or district-approved educational program may include special education programs, home-based
instruction and school-sponsored alternative secondary education programs. If a student completed an
approved high school credit-earning program and completed all equivalent high school required courses
and/or graduated before the next school year as of October 1, he or she is not a dropout. However, a
student who dropped out of school and passed a General Educational Development (GED) test is
considered a dropout unless there is a State policy of accepting a GED diploma as a high school diploma.
Currently, Connecticut does not have such a policy.
The four categories of dropouts include:
students 16 years of age or older who notified the school, officially dropping out of school with
parent signature, or students 18 years of age or older who notified the school officially without
parent consent, or students who dropped out without notifying the school;
students who leave school and do not return but for whom no transfer information to another
regular private or public secondary school is available;
students who are on a class roster from School A to attend School B but never reported to that
school, and for whom no transfer information to another regular secondary program is available;
and
students who leave school to enroll in a training program which is a non-high school credit
earning program, including GED classes.
Data Collection Methodology
Local public school districts report dropout data to the State Department of Education by submitting
individual student data through the Registration Module of the Public School Information System (PSIS).
Connecticut State Department of Education Division of Assessment, Research and Technology
DATA BULLETIN
Bureau of Data Collection, Research and Evaluation November 2009
2
The Registration Module is open all year. It only closes on a very limited basis when maintenance is
necessary.
Students who are unregistered with the following exit codes are considered dropouts:
Code 21 – Discontinued schooling;
Code 23 – Transfer to General Educational Development (GED)/External Diploma Program (EDP);
Code 24 – Transfer to a postsecondary education; and
Code 25 – Moved, not known to be continuing.
The official dropout period begins the summer before the beginning of a new school year and includes the
school year, e.g., July 1, 2007, through June 30, 2008. Establishing July 1 as the start date for dropout
identification ensures that all students are accounted for in the fall count and those dropouts are reported in
the appropriate grade. For example, if a student finishes Grade 10 over the summer and does not return in
the fall for the new school year, the student is a Grade 11 dropout. If the same student does not finish
Grade 10 and does not return to school in the fall, the student is a Grade 10 dropout.
Calculation of the Annual and Cumulative High School Dropout Rates
Annual Dropout Rate (total dropouts total October 1 enrollment of Grades 9-12) Percent
The annual dropout rate is calculated based on the formula used by the NCES. The October 1 enrollment
data used in the denominator for this formula are drawn from the PSIS and include students in Grades 9-12
enrolled in high school or a self-contained, high-school level program. The annual dropout rate
denominator does not include those students entering and transferring out of school after October 1.
Cumulative Dropout Rate (total dropouts of the class Grade 9 October 1 freshman enrollment of
the class) Percent
The cumulative dropout rate is calculated based on the formula researched and recommended, and
mandated by the NCES in the past. The cumulative dropout rate is a class rate that reflects the proportion of
students within a high school class who dropped out of school across four consecutive years. For
example, the graduating class of 2008 cumulative dropout rate = percent of (2004-05 Grade 9 dropouts +
2005-06 Grade 10 dropouts + 2006-07 Grade 11 dropouts + 2007-08 Grade 12 dropouts) Grade 9
enrollment as reported on October 1, 2004.
Highlights of the 2007-08 Connecticut Annual Dropout Rate
The annual dropout rate has ranged from 1.7 to 2.5 percent over seven years, 2001-02 through
2007-08 (see Table 1 and Appendix A).
Among the annual dropout rates for all grades from 2003-04 to 2007-08, Grade 11 had the largest
percentage; e.g., 2.0 percent for Grade 9, 2.4 percent for Grade 10, 2.7 percent for Grade 11 and
2.4 percent for Grade 12 in 2007-08. (see Table 2).
The annual dropout rate for females (1.7 percent) was lower than the annual dropout rate for males
(3.3 percent) in 2007-08.
The female dropout rate has been consistently lower than the male dropout rate since 2001-02 (see
Table 3).
In 2007-08, the annual dropout rates by student race/ethnicity include: 1.4 percent for Asian
American students, 2.1 percent for American Indian students, 4.7 percent for black students, 5.3
percent for Hispanic students and 1.4 percent for white students (see Table 4). and
The dropout rates for white and Asian American students were lower than the rates of the other
racial/ethnic categories (see Table 4).
3
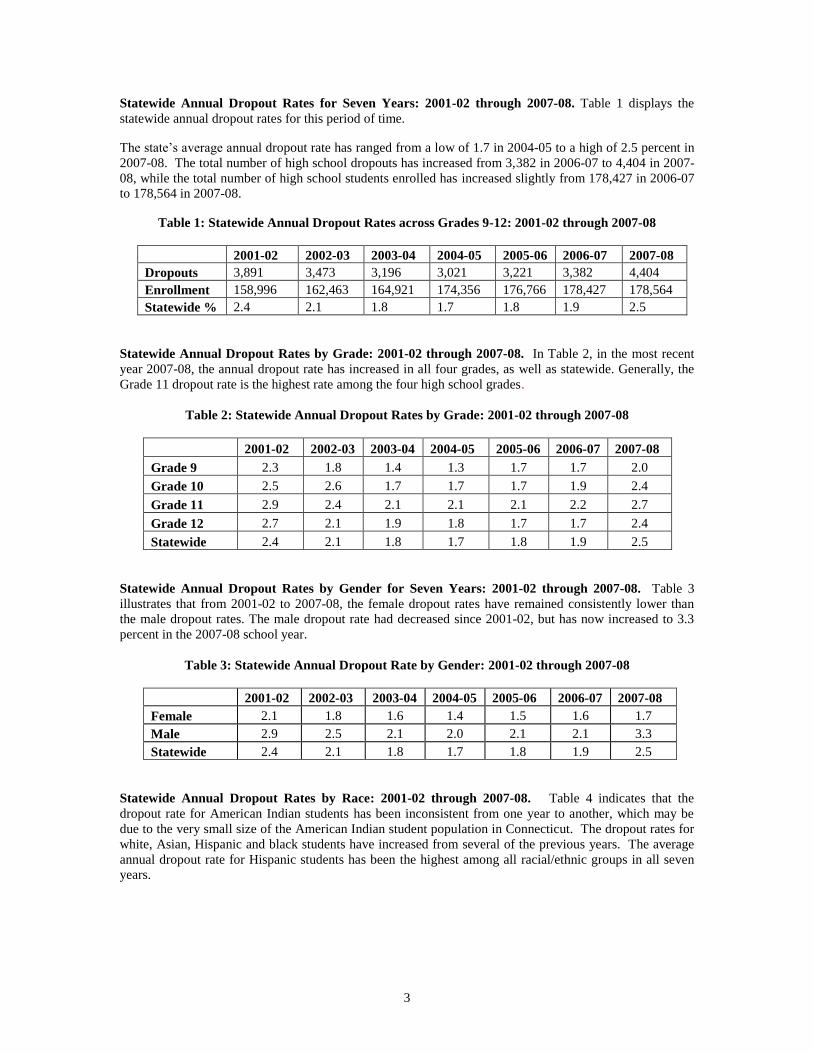
Statewide Annual Dropout Rates for Seven Years: 2001-02 through 2007-08. Table 1 displays the
statewide annual dropout rates for this period of time.
The state’s average annual dropout rate has ranged from a low of 1.7 in 2004-05 to a high of 2.5 percent in
2007-08. The total number of high school dropouts has increased from 3,382 in 2006-07 to 4,404 in 2007-
08, while the total number of high school students enrolled has increased slightly from 178,427 in 2006-07
to 178,564 in 2007-08.
Table 1: Statewide Annual Dropout Rates across Grades 9-12: 2001-02 through 2007-08
2001-02 2002-03 2003-04 2004-05 2005-06 2006-07 2007-08
Dropouts 3,891 3,473 3,196 3,021 3,221 3,382 4,404
Enrollment 158,996 162,463 164,921 174,356 176,766 178,427 178,564
Statewide % 2.4 2.1 1.8 1.7 1.8 1.9 2.5
Statewide Annual Dropout Rates by Grade: 2001-02 through 2007-08. In Table 2, in the most recent
year 2007-08, the annual dropout rate has increased in all four grades, as well as statewide. Generally, the
Grade 11 dropout rate is the highest rate among the four high school grades.
Table 2: Statewide Annual Dropout Rates by Grade: 2001-02 through 2007-08
2001-02 2002-03 2003-04 2004-05 2005-06 2006-07 2007-08
Grade 9 2.3 1.8 1.4 1.3 1.7 1.7 2.0
Grade 10 2.5 2.6 1.7 1.7 1.7 1.9 2.4
Grade 11 2.9 2.4 2.1 2.1 2.1 2.2 2.7
Grade 12 2.7 2.1 1.9 1.8 1.7 1.7 2.4
Statewide 2.4 2.1 1.8 1.7 1.8 1.9 2.5
Statewide Annual Dropout Rates by Gender for Seven Years: 2001-02 through 2007-08. Table 3
illustrates that from 2001-02 to 2007-08, the female dropout rates have remained consistently lower than
the male dropout rates. The male dropout rate had decreased since 2001-02, but has now increased to 3.3
percent in the 2007-08 school year.
Table 3: Statewide Annual Dropout Rate by Gender: 2001-02 through 2007-08
2001-02 2002-03 2003-04 2004-05 2005-06 2006-07 2007-08
Female 2.1 1.8 1.6 1.4 1.5 1.6 1.7
Male 2.9 2.5 2.1 2.0 2.1 2.1 3.3
Statewide 2.4 2.1 1.8 1.7 1.8 1.9 2.5
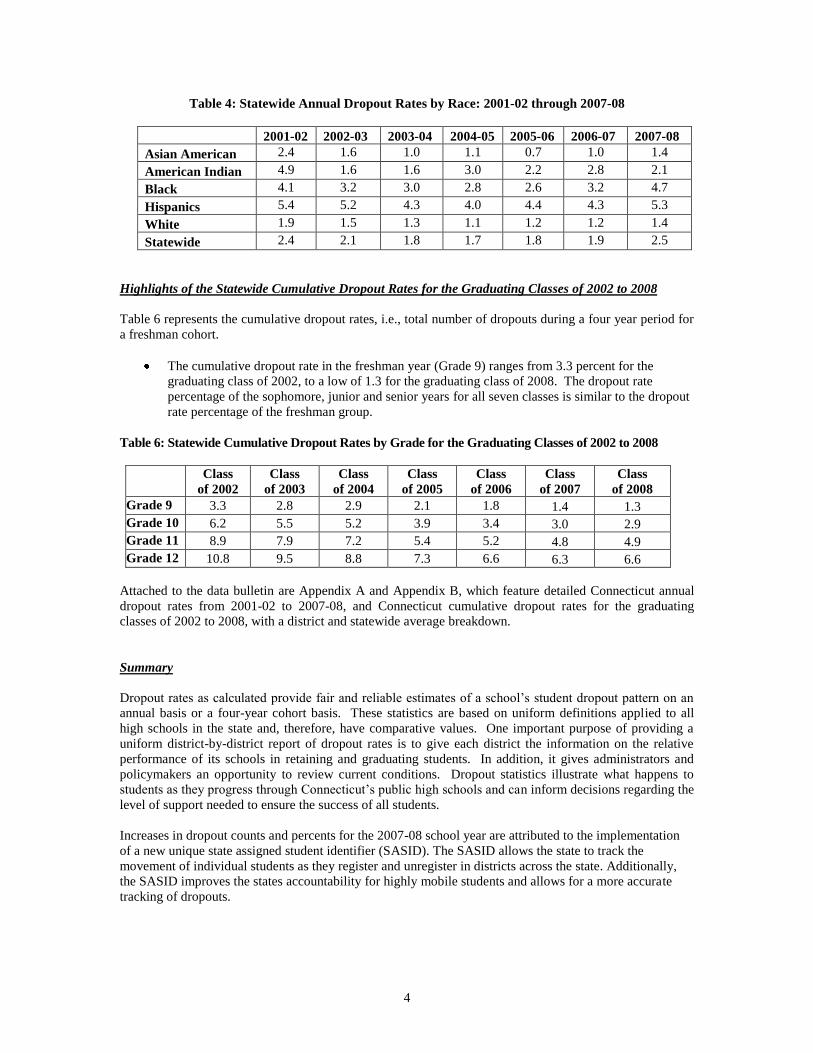
Statewide Annual Dropout Rates by Race: 2001-02 through 2007-08. Table 4 indicates that the
dropout rate for American Indian students has been inconsistent from one year to another, which may be
due to the very small size of the American Indian student population in Connecticut. The dropout rates for
white, Asian, Hispanic and black students have increased from several of the previous years. The average
annual dropout rate for Hispanic students has been the highest among all racial/ethnic groups in all seven
years.
4
Table 4: Statewide Annual Dropout Rates by Race: 2001-02 through 2007-08
2001-02 2002-03 2003-04 2004-05 2005-06 2006-07 2007-08
Asian American 2.4 1.6 1.0 1.1 0.7 1.0 1.4
American Indian 4.9 1.6 1.6 3.0 2.2 2.8 2.1
Black 4.1 3.2 3.0 2.8 2.6 3.2 4.7
Hispanics 5.4 5.2 4.3 4.0 4.4 4.3 5.3
White 1.9 1.5 1.3 1.1 1.2 1.2 1.4
Statewide 2.4 2.1 1.8 1.7 1.8 1.9 2.5
Highlights of the Statewide Cumulative Dropout Rates for the Graduating Classes of 2002 to 2008
Table 6 represents the cumulative dropout rates, i.e., total number of dropouts during a four year period for
a freshman cohort.
The cumulative dropout rate in the freshman year (Grade 9) ranges from 3.3 percent for the
graduating class of 2002, to a low of 1.3 for the graduating class of 2008. The dropout rate
percentage of the sophomore, junior and senior years for all seven classes is similar to the dropout
rate percentage of the freshman group.
Table 6: Statewide Cumulative Dropout Rates by Grade for the Graduating Classes of 2002 to 2008
Class
of 2002
Class
of 2003
Class
of 2004
Class
of 2005
Class
of 2006
Class
of 2007
Class
of 2008
Grade 9 3.3 2.8 2.9 2.1 1.8 1.4 1.3
Grade 10 6.2 5.5 5.2 3.9 3.4 3.0 2.9
Grade 11 8.9 7.9 7.2 5.4 5.2 4.8 4.9
Grade 12 10.8 9.5 8.8 7.3 6.6 6.3 6.6
Attached to the data bulletin are Appendix A and Appendix B, which feature detailed Connecticut annual
dropout rates from 2001-02 to 2007-08, and Connecticut cumulative dropout rates for the graduating
classes of 2002 to 2008, with a district and statewide average breakdown.
Summary
Dropout rates as calculated provide fair and reliable estimates of a school’s student dropout pattern on an
annual basis or a four-year cohort basis. These statistics are based on uniform definitions applied to all
high schools in the state and, therefore, have comparative values. One important purpose of providing a
uniform district-by-district report of dropout rates is to give each district the information on the relative
performance of its schools in retaining and graduating students. In addition, it gives administrators and
policymakers an opportunity to review current conditions. Dropout statistics illustrate what happens to
students as they progress through Connecticut’s public high schools and can inform decisions regarding the
level of support needed to ensure the success of all students.
Increases in dropout counts and percents for the 2007-08 school year are attributed to the implementation
of a new unique state assigned student identifier (SASID). The SASID allows the state to track the
movement of individual students as they register and unregister in districts across the state. Additionally,
the SASID improves the states accountability for highly mobile students and allows for a more accurate
tracking of dropouts.
5
Strategies for Reducing the Dropout Rate
There is a nationwide concern about ensuring that all students complete high school. The America’s
Promise Alliance lists five things that will help children thrive and succeed: Caring Adults, Safe Places, A
Healthy Start, An Effective Education and Opportunities to Help Others. Consequently, under the funding
of the America’s Promise Alliance Organization, a Dropout Prevention Summit is being held this year in
every state in the nation. The Connecticut State Department of Education held its Dropout Prevention
Summit on October 19, 2009. The Summit was a collaborative effort among educators, professional staff,
parents, local businessmen and other concerned citizens from all related agencies and communities, as well
as business and industry.
There are many reasons why students drop out of high school. Some students drop out because of
significant academic challenges, such as not being motivated, not being interested or simply failing
academically. Some drop out for personal or family reasons, such as the need to earn money to support
family, being pregnant or caring for a family member. However, studies have shown that dropping out of
school is a gradual process for students. Current practices and guidelines on dropout prevention suggest
that state and local school districts can institute policies and employ strategies to reduce the number of
students dropping out of school.
The widely effective strategies for dropout prevention include:
1. Establishing for all schools an evolving process of goals and structures related to policies and
practices that impact students’ learning. These goals and structures may include a system of
fostering multiple learning styles/multiple intelligences for all students, a student attendance
requirement system, a discipline notification procedure, a tracking system or a graduation
requirement system.
2. Building incentives and alternative schooling programs for graduating every student in the high
school. These programs may include early intervention at elementary and middle school levels,
such as early childhood education programs, reading/writing programs, after school programs,
Saturday or summer academies, individualized instruction, mentoring/tutoring programs,
alternative programs, adult education, career education/workforce readiness or job-
related/employability skills training programs.
3. Providing a supportive and caring environment to better engage all students, in particular, at-risk
students. For example, schools can increase student service resources by decreasing the
student/staff ratio, adding more counseling staff members, social workers and at-risk case
managers, and providing more health education programs, vocational rehabilitation services,
literacy programs or violent prevention/conflict resolution services.
4. Establishing the communication and connection among schools, parents and their communities.
Schools can offer students access to community-related workshops, programs and services,
building a sense of belonging to their communities and presenting them with opportunities to give
back to their families and communities.
5. Instituting peer-counseling programs and establishing partnerships with local businesses to
provide adult mentors, and creating employment readiness and internship opportunities for
students at risk.
Contact Y. H. Alison Zhou, Ed.D., at (860) 713-6893 or via e-mail at [email protected], for questions
related to this data bulletin.
6
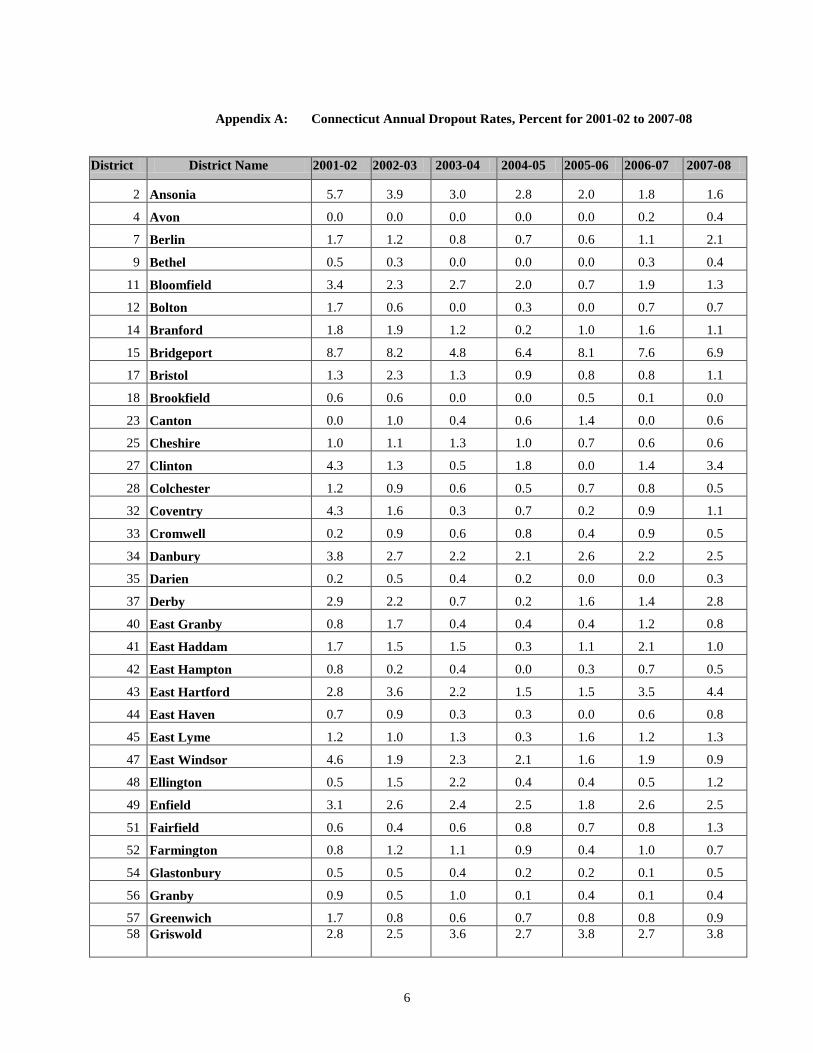
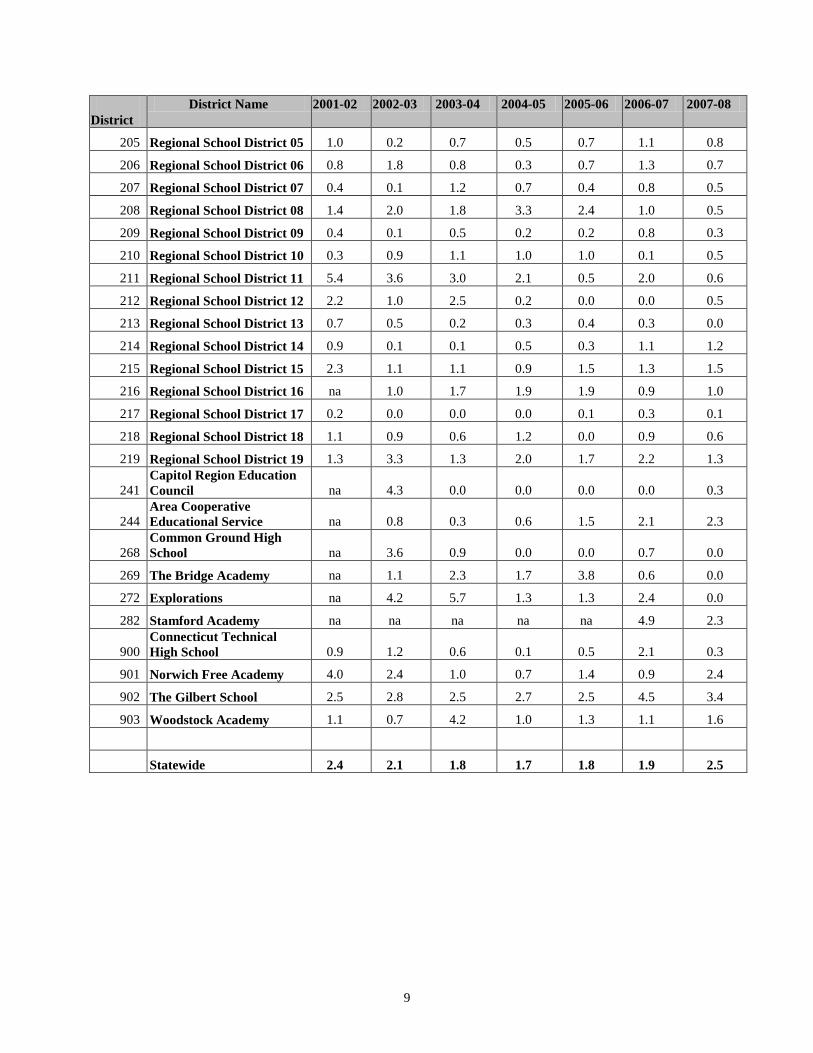
Appendix A: Connecticut Annual Dropout Rates, Percent for 2001-02 to 2007-08
District District Name 2001-02 2002-03 2003-04 2004-05 2005-06 2006-07 2007-08
2 Ansonia 5.7 3.9 3.0 2.8 2.0 1.8 1.6
4 Avon 0.0 0.0 0.0 0.0 0.0 0.2 0.4
7 Berlin 1.7 1.2 0.8 0.7 0.6 1.1 2.1
9 Bethel 0.5 0.3 0.0 0.0 0.0 0.3 0.4
11 Bloomfield 3.4 2.3 2.7 2.0 0.7 1.9 1.3
12 Bolton 1.7 0.6 0.0 0.3 0.0 0.7 0.7
14 Branford 1.8 1.9 1.2 0.2 1.0 1.6 1.1
15 Bridgeport 8.7 8.2 4.8 6.4 8.1 7.6 6.9
17 Bristol 1.3 2.3 1.3 0.9 0.8 0.8 1.1
18 Brookfield 0.6 0.6 0.0 0.0 0.5 0.1 0.0
23 Canton 0.0 1.0 0.4 0.6 1.4 0.0 0.6
25 Cheshire 1.0 1.1 1.3 1.0 0.7 0.6 0.6
27 Clinton 4.3 1.3 0.5 1.8 0.0 1.4 3.4
28 Colchester 1.2 0.9 0.6 0.5 0.7 0.8 0.5
32 Coventry 4.3 1.6 0.3 0.7 0.2 0.9 1.1
33 Cromwell 0.2 0.9 0.6 0.8 0.4 0.9 0.5
34 Danbury 3.8 2.7 2.2 2.1 2.6 2.2 2.5
35 Darien 0.2 0.5 0.4 0.2 0.0 0.0 0.3
37 Derby 2.9 2.2 0.7 0.2 1.6 1.4 2.8
40 East Granby 0.8 1.7 0.4 0.4 0.4 1.2 0.8
41 East Haddam 1.7 1.5 1.5 0.3 1.1 2.1 1.0
42 East Hampton 0.8 0.2 0.4 0.0 0.3 0.7 0.5
43 East Hartford 2.8 3.6 2.2 1.5 1.5 3.5 4.4
44 East Haven 0.7 0.9 0.3 0.3 0.0 0.6 0.8
45 East Lyme 1.2 1.0 1.3 0.3 1.6 1.2 1.3
47 East Windsor 4.6 1.9 2.3 2.1 1.6 1.9 0.9
48 Ellington 0.5 1.5 2.2 0.4 0.4 0.5 1.2
49 Enfield 3.1 2.6 2.4 2.5 1.8 2.6 2.5
51 Fairfield 0.6 0.4 0.6 0.8 0.7 0.8 1.3
52 Farmington 0.8 1.2 1.1 0.9 0.4 1.0 0.7
54 Glastonbury 0.5 0.5 0.4 0.2 0.2 0.1 0.5
56 Granby 0.9 0.5 1.0 0.1 0.4 0.1 0.4
57 Greenwich 1.7 0.8 0.6 0.7 0.8 0.8 0.9
58 Griswold 2.8 2.5 3.6 2.7 3.8 2.7 3.8
7
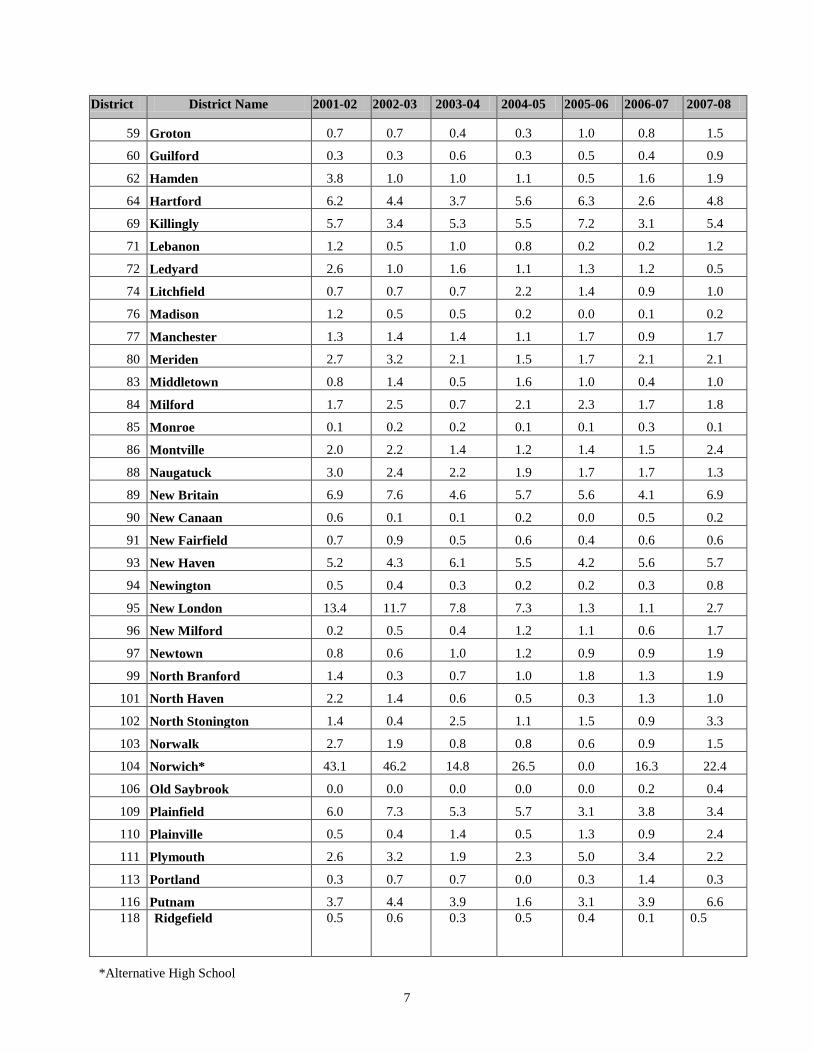
District District Name 2001-02 2002-03 2003-04 2004-05 2005-06 2006-07 2007-08
59 Groton 0.7 0.7 0.4 0.3 1.0 0.8 1.5
60 Guilford 0.3 0.3 0.6 0.3 0.5 0.4 0.9
62 Hamden 3.8 1.0 1.0 1.1 0.5 1.6 1.9
64 Hartford 6.2 4.4 3.7 5.6 6.3 2.6 4.8
69 Killingly 5.7 3.4 5.3 5.5 7.2 3.1 5.4
71 Lebanon 1.2 0.5 1.0 0.8 0.2 0.2 1.2
72 Ledyard 2.6 1.0 1.6 1.1 1.3 1.2 0.5
74 Litchfield 0.7 0.7 0.7 2.2 1.4 0.9 1.0
76 Madison 1.2 0.5 0.5 0.2 0.0 0.1 0.2
77 Manchester 1.3 1.4 1.4 1.1 1.7 0.9 1.7
80 Meriden 2.7 3.2 2.1 1.5 1.7 2.1 2.1
83 Middletown 0.8 1.4 0.5 1.6 1.0 0.4 1.0
84 Milford 1.7 2.5 0.7 2.1 2.3 1.7 1.8
85 Monroe 0.1 0.2 0.2 0.1 0.1 0.3 0.1
86 Montville 2.0 2.2 1.4 1.2 1.4 1.5 2.4
88 Naugatuck 3.0 2.4 2.2 1.9 1.7 1.7 1.3
89 New Britain 6.9 7.6 4.6 5.7 5.6 4.1 6.9
90 New Canaan 0.6 0.1 0.1 0.2 0.0 0.5 0.2
91 New Fairfield 0.7 0.9 0.5 0.6 0.4 0.6 0.6
93 New Haven 5.2 4.3 6.1 5.5 4.2 5.6 5.7
94 Newington 0.5 0.4 0.3 0.2 0.2 0.3 0.8
95 New London 13.4 11.7 7.8 7.3 1.3 1.1 2.7
96 New Milford 0.2 0.5 0.4 1.2 1.1 0.6 1.7
97 Newtown 0.8 0.6 1.0 1.2 0.9 0.9 1.9
99 North Branford 1.4 0.3 0.7 1.0 1.8 1.3 1.9
101 North Haven 2.2 1.4 0.6 0.5 0.3 1.3 1.0
102 North Stonington 1.4 0.4 2.5 1.1 1.5 0.9 3.3
103 Norwalk 2.7 1.9 0.8 0.8 0.6 0.9 1.5
104 Norwich* 43.1 46.2 14.8 26.5 0.0 16.3 22.4
106 Old Saybrook 0.0 0.0 0.0 0.0 0.0 0.2 0.4
109 Plainfield 6.0 7.3 5.3 5.7 3.1 3.8 3.4
110 Plainville 0.5 0.4 1.4 0.5 1.3 0.9 2.4
111 Plymouth 2.6 3.2 1.9 2.3 5.0 3.4 2.2
113 Portland 0.3 0.7 0.7 0.0 0.3 1.4 0.3
116 Putnam 3.7 4.4 3.9 1.6 3.1 3.9 6.6
118 Ridgefield 0.5 0.6 0.3 0.5 0.4 0.1 0.5
*Alternative High School
8
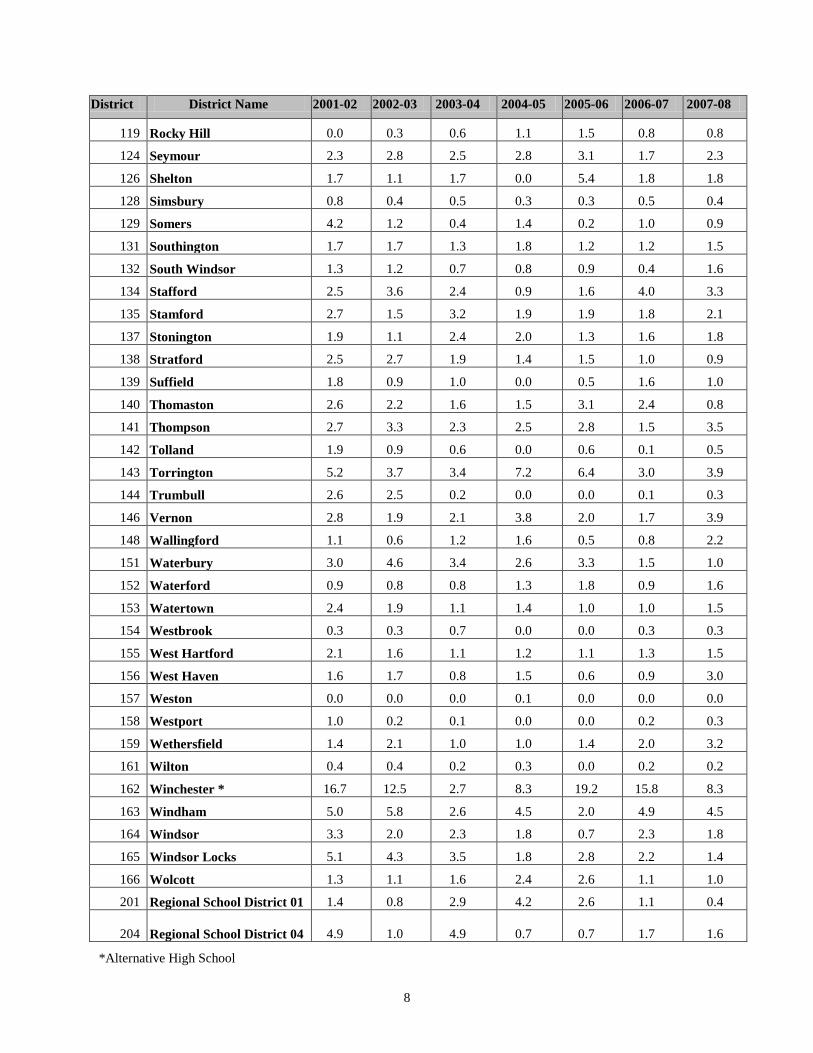
District District Name 2001-02 2002-03 2003-04 2004-05 2005-06 2006-07 2007-08
119 Rocky Hill 0.0 0.3 0.6 1.1 1.5 0.8 0.8
124 Seymour 2.3 2.8 2.5 2.8 3.1 1.7 2.3
126 Shelton 1.7 1.1 1.7 0.0 5.4 1.8 1.8
128 Simsbury 0.8 0.4 0.5 0.3 0.3 0.5 0.4
129 Somers 4.2 1.2 0.4 1.4 0.2 1.0 0.9
131 Southington 1.7 1.7 1.3 1.8 1.2 1.2 1.5
132 South Windsor 1.3 1.2 0.7 0.8 0.9 0.4 1.6
134 Stafford 2.5 3.6 2.4 0.9 1.6 4.0 3.3
135 Stamford 2.7 1.5 3.2 1.9 1.9 1.8 2.1
137 Stonington 1.9 1.1 2.4 2.0 1.3 1.6 1.8
138 Stratford 2.5 2.7 1.9 1.4 1.5 1.0 0.9
139 Suffield 1.8 0.9 1.0 0.0 0.5 1.6 1.0
140 Thomaston 2.6 2.2 1.6 1.5 3.1 2.4 0.8
141 Thompson 2.7 3.3 2.3 2.5 2.8 1.5 3.5
142 Tolland 1.9 0.9 0.6 0.0 0.6 0.1 0.5
143 Torrington 5.2 3.7 3.4 7.2 6.4 3.0 3.9
144 Trumbull 2.6 2.5 0.2 0.0 0.0 0.1 0.3
146 Vernon 2.8 1.9 2.1 3.8 2.0 1.7 3.9
148 Wallingford 1.1 0.6 1.2 1.6 0.5 0.8 2.2
151 Waterbury 3.0 4.6 3.4 2.6 3.3 1.5 1.0
152 Waterford 0.9 0.8 0.8 1.3 1.8 0.9 1.6
153 Watertown 2.4 1.9 1.1 1.4 1.0 1.0 1.5
154 Westbrook 0.3 0.3 0.7 0.0 0.0 0.3 0.3
155 West Hartford 2.1 1.6 1.1 1.2 1.1 1.3 1.5
156 West Haven 1.6 1.7 0.8 1.5 0.6 0.9 3.0
157 Weston 0.0 0.0 0.0 0.1 0.0 0.0 0.0
158 Westport 1.0 0.2 0.1 0.0 0.0 0.2 0.3
159 Wethersfield 1.4 2.1 1.0 1.0 1.4 2.0 3.2
161 Wilton 0.4 0.4 0.2 0.3 0.0 0.2 0.2
162 Winchester * 16.7 12.5 2.7 8.3 19.2 15.8 8.3
163 Windham 5.0 5.8 2.6 4.5 2.0 4.9 4.5
164 Windsor 3.3 2.0 2.3 1.8 0.7 2.3 1.8
165 Windsor Locks 5.1 4.3 3.5 1.8 2.8 2.2 1.4
166 Wolcott 1.3 1.1 1.6 2.4 2.6 1.1 1.0
201 Regional School District 01 1.4 0.8 2.9 4.2 2.6 1.1 0.4
204 Regional School District 04 4.9 1.0 4.9 0.7 0.7 1.7 1.6
*Alternative High School
9
District
District Name 2001-02 2002-03 2003-04 2004-05 2005-06 2006-07 2007-08
205 Regional School District 05 1.0 0.2 0.7 0.5 0.7 1.1 0.8
206 Regional School District 06 0.8 1.8 0.8 0.3 0.7 1.3 0.7
207 Regional School District 07 0.4 0.1 1.2 0.7 0.4 0.8 0.5
208 Regional School District 08 1.4 2.0 1.8 3.3 2.4 1.0 0.5
209 Regional School District 09 0.4 0.1 0.5 0.2 0.2 0.8 0.3
210 Regional School District 10 0.3 0.9 1.1 1.0 1.0 0.1 0.5
211 Regional School District 11 5.4 3.6 3.0 2.1 0.5 2.0 0.6
212 Regional School District 12 2.2 1.0 2.5 0.2 0.0 0.0 0.5
213 Regional School District 13 0.7 0.5 0.2 0.3 0.4 0.3 0.0
214 Regional School District 14 0.9 0.1 0.1 0.5 0.3 1.1 1.2
215 Regional School District 15 2.3 1.1 1.1 0.9 1.5 1.3 1.5
216 Regional School District 16 na 1.0 1.7 1.9 1.9 0.9 1.0
217 Regional School District 17 0.2 0.0 0.0 0.0 0.1 0.3 0.1
218 Regional School District 18 1.1 0.9 0.6 1.2 0.0 0.9 0.6
219 Regional School District 19 1.3 3.3 1.3 2.0 1.7 2.2 1.3
241 Capitol Region Education
Council na 4.3 0.0 0.0 0.0 0.0 0.3
244 Area Cooperative
Educational Service na 0.8 0.3 0.6 1.5 2.1 2.3
268 Common Ground High
School na 3.6 0.9 0.0 0.0 0.7 0.0
269 The Bridge Academy na 1.1 2.3 1.7 3.8 0.6 0.0
272 Explorations na 4.2 5.7 1.3 1.3 2.4 0.0
282 Stamford Academy na na na na na 4.9 2.3
900 Connecticut Technical
High School 0.9 1.2 0.6 0.1 0.5 2.1 0.3
901 Norwich Free Academy 4.0 2.4 1.0 0.7 1.4 0.9 2.4
902 The Gilbert School 2.5 2.8 2.5 2.7 2.5 4.5 3.4
903 Woodstock Academy 1.1 0.7 4.2 1.0 1.3 1.1 1.6
Statewide 2.4 2.1 1.8 1.7 1.8 1.9 2.5
10
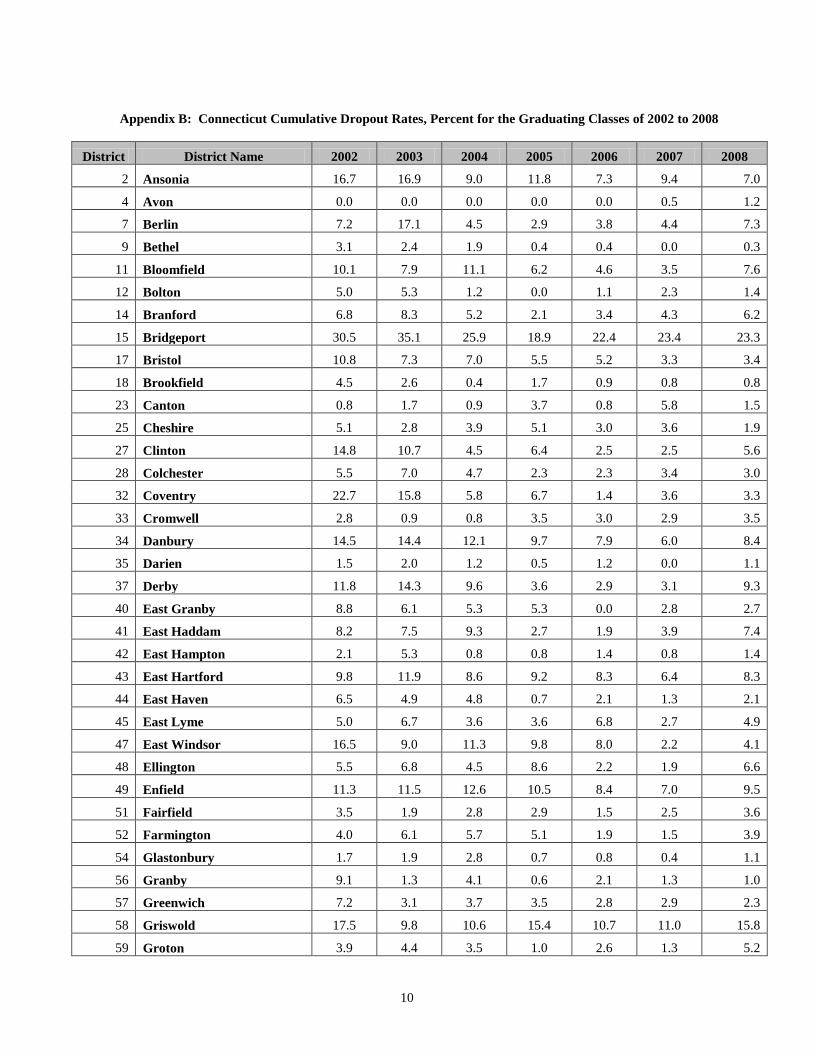
Appendix B: Connecticut Cumulative Dropout Rates, Percent for the Graduating Classes of 2002 to 2008
District District Name 2002 2003 2004 2005 2006 2007 2008
2 Ansonia 16.7 16.9 9.0 11.8 7.3 9.4 7.0
4 Avon 0.0 0.0 0.0 0.0 0.0 0.5 1.2
7 Berlin 7.2 17.1 4.5 2.9 3.8 4.4 7.3
9 Bethel 3.1 2.4 1.9 0.4 0.4 0.0 0.3
11 Bloomfield 10.1 7.9 11.1 6.2 4.6 3.5 7.6
12 Bolton 5.0 5.3 1.2 0.0 1.1 2.3 1.4
14 Branford 6.8 8.3 5.2 2.1 3.4 4.3 6.2
15 Bridgeport 30.5 35.1 25.9 18.9 22.4 23.4 23.3
17 Bristol 10.8 7.3 7.0 5.5 5.2 3.3 3.4
18 Brookfield 4.5 2.6 0.4 1.7 0.9 0.8 0.8
23 Canton 0.8 1.7 0.9 3.7 0.8 5.8 1.5
25 Cheshire 5.1 2.8 3.9 5.1 3.0 3.6 1.9
27 Clinton 14.8 10.7 4.5 6.4 2.5 2.5 5.6
28 Colchester 5.5 7.0 4.7 2.3 2.3 3.4 3.0
32 Coventry 22.7 15.8 5.8 6.7 1.4 3.6 3.3
33 Cromwell 2.8 0.9 0.8 3.5 3.0 2.9 3.5
34 Danbury 14.5 14.4 12.1 9.7 7.9 6.0 8.4
35 Darien 1.5 2.0 1.2 0.5 1.2 0.0 1.1
37 Derby 11.8 14.3 9.6 3.6 2.9 3.1 9.3
40 East Granby 8.8 6.1 5.3 5.3 0.0 2.8 2.7
41 East Haddam 8.2 7.5 9.3 2.7 1.9 3.9 7.4
42 East Hampton 2.1 5.3 0.8 0.8 1.4 0.8 1.4
43 East Hartford 9.8 11.9 8.6 9.2 8.3 6.4 8.3
44 East Haven 6.5 4.9 4.8 0.7 2.1 1.3 2.1
45 East Lyme 5.0 6.7 3.6 3.6 6.8 2.7 4.9
47 East Windsor 16.5 9.0 11.3 9.8 8.0 2.2 4.1
48 Ellington 5.5 6.8 4.5 8.6 2.2 1.9 6.6
49 Enfield 11.3 11.5 12.6 10.5 8.4 7.0 9.5
51 Fairfield 3.5 1.9 2.8 2.9 1.5 2.5 3.6
52 Farmington 4.0 6.1 5.7 5.1 1.9 1.5 3.9
54 Glastonbury 1.7 1.9 2.8 0.7 0.8 0.4 1.1
56 Granby 9.1 1.3 4.1 0.6 2.1 1.3 1.0
57 Greenwich 7.2 3.1 3.7 3.5 2.8 2.9 2.3
58 Griswold 17.5 9.8 10.6 15.4 10.7 11.0 15.8
59 Groton 3.9 4.4 3.5 1.0 2.6 1.3 5.2
11
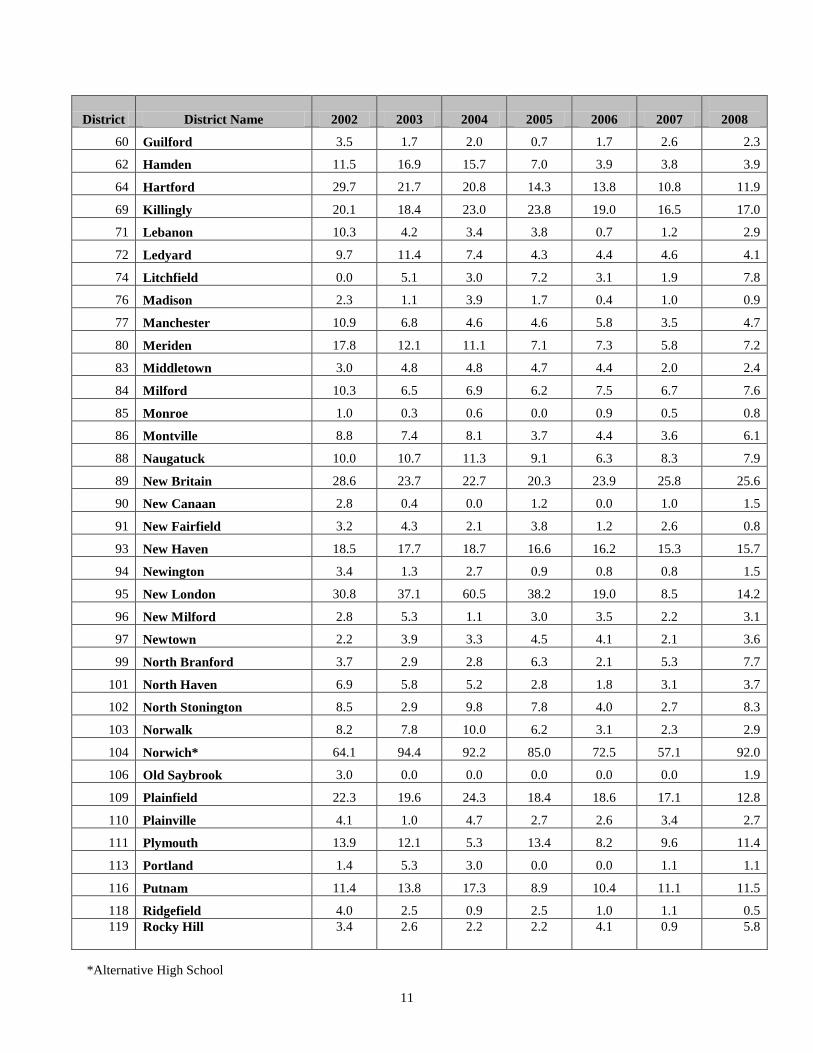
District District Name 2002 2003 2004 2005 2006 2007
2008
60 Guilford 3.5 1.7 2.0 0.7 1.7 2.6 2.3
62 Hamden 11.5 16.9 15.7 7.0 3.9 3.8 3.9
64 Hartford 29.7 21.7 20.8 14.3 13.8 10.8 11.9
69 Killingly 20.1 18.4 23.0 23.8 19.0 16.5 17.0
71 Lebanon 10.3 4.2 3.4 3.8 0.7 1.2 2.9
72 Ledyard 9.7 11.4 7.4 4.3 4.4 4.6 4.1
74 Litchfield 0.0 5.1 3.0 7.2 3.1 1.9 7.8
76 Madison 2.3 1.1 3.9 1.7 0.4 1.0 0.9
77 Manchester 10.9 6.8 4.6 4.6 5.8 3.5 4.7
80 Meriden 17.8 12.1 11.1 7.1 7.3 5.8 7.2
83 Middletown 3.0 4.8 4.8 4.7 4.4 2.0 2.4
84 Milford 10.3 6.5 6.9 6.2 7.5 6.7 7.6
85 Monroe 1.0 0.3 0.6 0.0 0.9 0.5 0.8
86 Montville 8.8 7.4 8.1 3.7 4.4 3.6 6.1
88 Naugatuck 10.0 10.7 11.3 9.1 6.3 8.3 7.9
89 New Britain 28.6 23.7 22.7 20.3 23.9 25.8 25.6
90 New Canaan 2.8 0.4 0.0 1.2 0.0 1.0 1.5
91 New Fairfield 3.2 4.3 2.1 3.8 1.2 2.6 0.8
93 New Haven 18.5 17.7 18.7 16.6 16.2 15.3 15.7
94 Newington 3.4 1.3 2.7 0.9 0.8 0.8 1.5
95 New London 30.8 37.1 60.5 38.2 19.0 8.5 14.2
96 New Milford 2.8 5.3 1.1 3.0 3.5 2.2 3.1
97 Newtown 2.2 3.9 3.3 4.5 4.1 2.1 3.6
99 North Branford 3.7 2.9 2.8 6.3 2.1 5.3 7.7
101 North Haven 6.9 5.8 5.2 2.8 1.8 3.1 3.7
102 North Stonington 8.5 2.9 9.8 7.8 4.0 2.7 8.3
103 Norwalk 8.2 7.8 10.0 6.2 3.1 2.3 2.9
104 Norwich* 64.1 94.4 92.2 85.0 72.5 57.1 92.0
106 Old Saybrook 3.0 0.0 0.0 0.0 0.0 0.0 1.9
109 Plainfield 22.3 19.6 24.3 18.4 18.6 17.1 12.8
110 Plainville 4.1 1.0 4.7 2.7 2.6 3.4 2.7
111 Plymouth 13.9 12.1 5.3 13.4 8.2 9.6 11.4
113 Portland 1.4 5.3 3.0 0.0 0.0 1.1 1.1
116 Putnam 11.4 13.8 17.3 8.9 10.4 11.1 11.5
118 Ridgefield 4.0 2.5 0.9 2.5 1.0 1.1 0.5
119 Rocky Hill 3.4 2.6 2.2 2.2 4.1 0.9 5.8
*Alternative High School
12
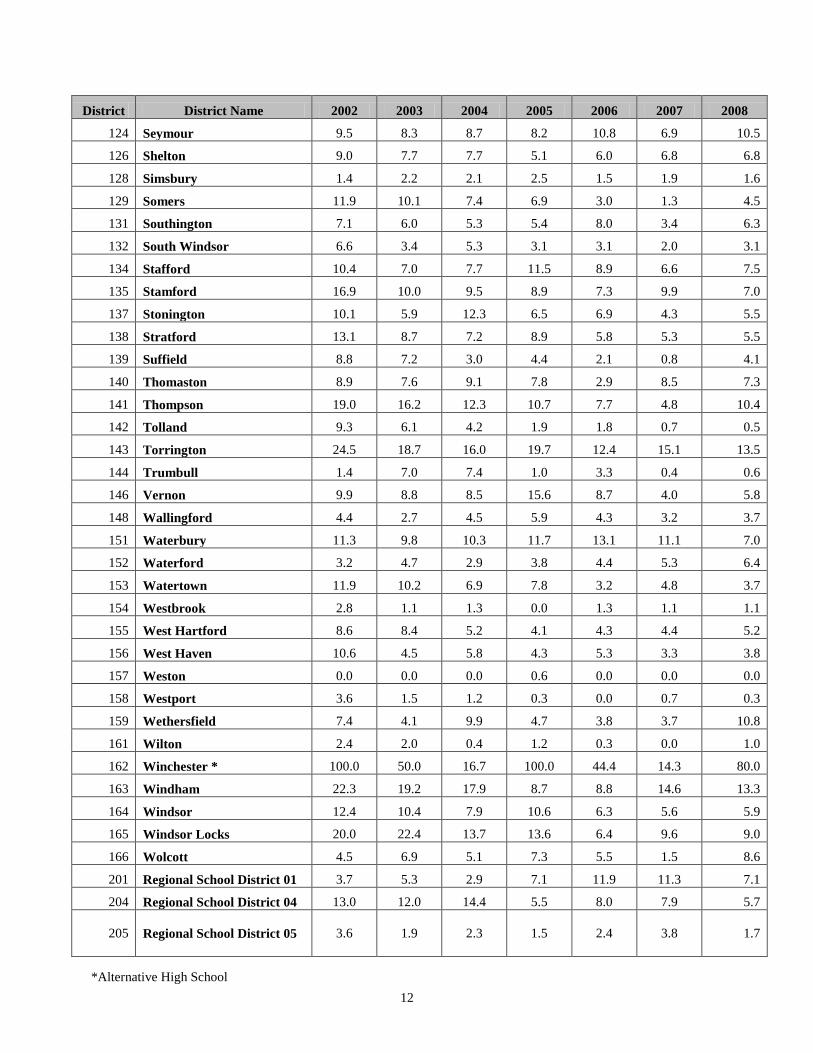
District District Name 2002 2003 2004 2005 2006 2007 2008
124 Seymour 9.5 8.3 8.7 8.2 10.8 6.9 10.5
126 Shelton 9.0 7.7 7.7 5.1 6.0 6.8 6.8
128 Simsbury 1.4 2.2 2.1 2.5 1.5 1.9 1.6
129 Somers 11.9 10.1 7.4 6.9 3.0 1.3 4.5
131 Southington 7.1 6.0 5.3 5.4 8.0 3.4 6.3
132 South Windsor 6.6 3.4 5.3 3.1 3.1 2.0 3.1
134 Stafford 10.4 7.0 7.7 11.5 8.9 6.6 7.5
135 Stamford 16.9 10.0 9.5 8.9 7.3 9.9 7.0
137 Stonington 10.1 5.9 12.3 6.5 6.9 4.3 5.5
138 Stratford 13.1 8.7 7.2 8.9 5.8 5.3 5.5
139 Suffield 8.8 7.2 3.0 4.4 2.1 0.8 4.1
140 Thomaston 8.9 7.6 9.1 7.8 2.9 8.5 7.3
141 Thompson 19.0 16.2 12.3 10.7 7.7 4.8 10.4
142 Tolland 9.3 6.1 4.2 1.9 1.8 0.7 0.5
143 Torrington 24.5 18.7 16.0 19.7 12.4 15.1 13.5
144 Trumbull 1.4 7.0 7.4 1.0 3.3 0.4 0.6
146 Vernon 9.9 8.8 8.5 15.6 8.7 4.0 5.8
148 Wallingford 4.4 2.7 4.5 5.9 4.3 3.2 3.7
151 Waterbury 11.3 9.8 10.3 11.7 13.1 11.1 7.0
152 Waterford 3.2 4.7 2.9 3.8 4.4 5.3 6.4
153 Watertown 11.9 10.2 6.9 7.8 3.2 4.8 3.7
154 Westbrook 2.8 1.1 1.3 0.0 1.3 1.1 1.1
155 West Hartford 8.6 8.4 5.2 4.1 4.3 4.4 5.2
156 West Haven 10.6 4.5 5.8 4.3 5.3 3.3 3.8
157 Weston 0.0 0.0 0.0 0.6 0.0 0.0 0.0
158 Westport 3.6 1.5 1.2 0.3 0.0 0.7 0.3
159 Wethersfield 7.4 4.1 9.9 4.7 3.8 3.7 10.8
161 Wilton 2.4 2.0 0.4 1.2 0.3 0.0 1.0
162 Winchester * 100.0 50.0 16.7 100.0 44.4 14.3 80.0
163 Windham 22.3 19.2 17.9 8.7 8.8 14.6 13.3
164 Windsor 12.4 10.4 7.9 10.6 6.3 5.6 5.9
165 Windsor Locks 20.0 22.4 13.7 13.6 6.4 9.6 9.0
166 Wolcott 4.5 6.9 5.1 7.3 5.5 1.5 8.6
201 Regional School District 01 3.7 5.3 2.9 7.1 11.9 11.3 7.1
204 Regional School District 04 13.0 12.0 14.4 5.5 8.0 7.9 5.7
205 Regional School District 05 3.6 1.9 2.3 1.5 2.4 3.8
1.7
*Alternative High School
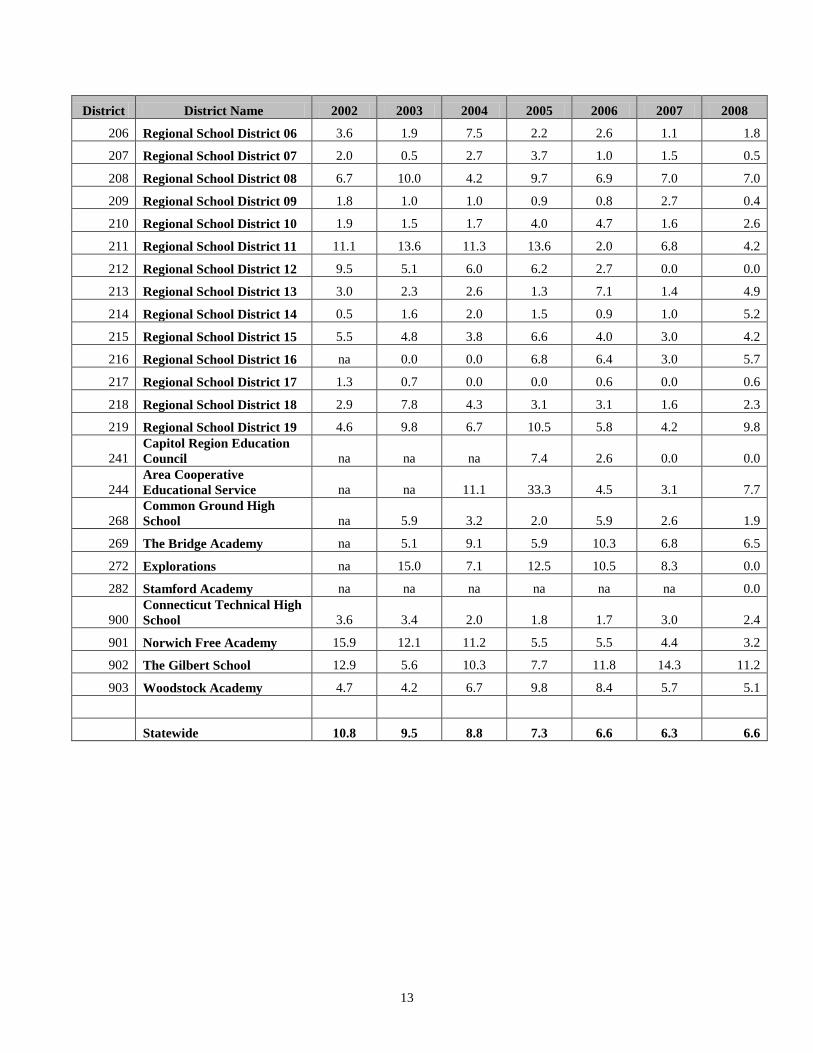
13
District District Name 2002 2003 2004 2005 2006 2007 2008
206 Regional School District 06 3.6 1.9 7.5 2.2 2.6 1.1 1.8
207 Regional School District 07 2.0 0.5 2.7 3.7 1.0 1.5 0.5
208 Regional School District 08 6.7 10.0 4.2 9.7 6.9 7.0 7.0
209 Regional School District 09 1.8 1.0 1.0 0.9 0.8 2.7 0.4
210 Regional School District 10 1.9 1.5 1.7 4.0 4.7 1.6 2.6
211 Regional School District 11 11.1 13.6 11.3 13.6 2.0 6.8 4.2
212 Regional School District 12 9.5 5.1 6.0 6.2 2.7 0.0 0.0
213 Regional School District 13 3.0 2.3 2.6 1.3 7.1 1.4 4.9
214 Regional School District 14 0.5 1.6 2.0 1.5 0.9 1.0 5.2
215 Regional School District 15 5.5 4.8 3.8 6.6 4.0 3.0 4.2
216 Regional School District 16 na 0.0 0.0 6.8 6.4 3.0 5.7
217 Regional School District 17 1.3 0.7 0.0 0.0 0.6 0.0 0.6
218 Regional School District 18 2.9 7.8 4.3 3.1 3.1 1.6 2.3
219 Regional School District 19 4.6 9.8 6.7 10.5 5.8 4.2 9.8
241 Capitol Region Education
Council na na na 7.4 2.6 0.0 0.0
244 Area Cooperative
Educational Service na na 11.1 33.3 4.5 3.1 7.7
268 Common Ground High
School na 5.9 3.2 2.0 5.9 2.6 1.9
269 The Bridge Academy na 5.1 9.1 5.9 10.3 6.8 6.5
272 Explorations na 15.0 7.1 12.5 10.5 8.3 0.0
282 Stamford Academy na na na na na na 0.0
900 Connecticut Technical High
School 3.6 3.4 2.0 1.8 1.7 3.0 2.4
901 Norwich Free Academy 15.9 12.1 11.2 5.5 5.5 4.4 3.2
902 The Gilbert School 12.9 5.6 10.3 7.7 11.8 14.3 11.2
903 Woodstock Academy 4.7 4.2 6.7 9.8 8.4 5.7 5.1
Statewide 10.8 9.5 8.8 7.3 6.6 6.3 6.6