Embed Size (px)
Citation preview

Higher Education in Connecticut
Higher Education Coordinating Council 2015 Accountability Report
The framework for this report was approved by the Higher Education Coordinating Council on November 29, 2012. The Connecticut Board of Regents for Higher Education is statutorily bound to produce this report pursuant to Section 10a-6b of the Connecticut General Statutes.
Members of the Higher Education Coordinating Council are:· Susan Weisselberg – Deputy Secretary of the Office of Policy and Management · Gregory W. Gray, Sr. - President of the Board of Regents for Higher Education (BOR)· Susan Herbst - President of University of Connecticut· Mon Choi – Provost and Chief Academic Officer University of Connecticut· David Levinson – BOR Vice President for Community Colleges· Elsa Nunez – BOR Vice President for Connecticut State University Systems· Nicholas Donofrio - Chair of the Board of Regents for Higher Education · Lawrence McHugh - Chair of the Board of Trustees for the University of Connecticut· Dianna R. Wentzell - Commissioner of State Department of Education
Data are provided for each institution of public higher education, each sector and for the state where applicable. Data are disaggregated by race, ethnicity, gender, undergraduate and graduate degree types where available and applicable, and the data provided are for the most recent year(s) available.
Framework
2
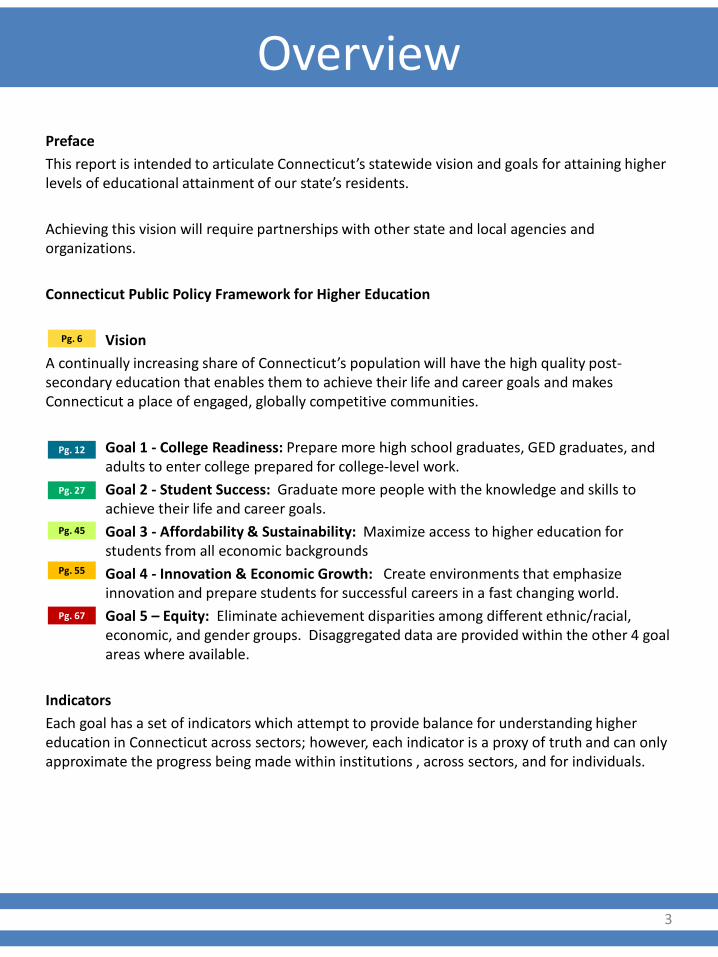
PrefaceThis report is intended to articulate Connecticut’s statewide vision and goals for attaining higher levels of educational attainment of our state’s residents.
Achieving this vision will require partnerships with other state and local agencies and organizations.
Connecticut Public Policy Framework for Higher Education
VisionA continually increasing share of Connecticut’s population will have the high quality post-secondary education that enables them to achieve their life and career goals and makes Connecticut a place of engaged, globally competitive communities.
• Goal 1 - College Readiness: Prepare more high school graduates, GED graduates, and adults to enter college prepared for college-level work.
• Goal 2 - Student Success: Graduate more people with the knowledge and skills to achieve their life and career goals.
• Goal 3 - Affordability & Sustainability: Maximize access to higher education for students from all economic backgrounds
• Goal 4 - Innovation & Economic Growth: Create environments that emphasize innovation and prepare students for successful careers in a fast changing world.
• Goal 5 – Equity: Eliminate achievement disparities among different ethnic/racial, economic, and gender groups. Disaggregated data are provided within the other 4 goal areas where available.
IndicatorsEach goal has a set of indicators which attempt to provide balance for understanding higher education in Connecticut across sectors; however, each indicator is a proxy of truth and can only approximate the progress being made within institutions , across sectors, and for individuals.
Pg. 12
Pg. 27
Pg. 45
Pg. 55
Pg. 67
Pg. 6
Overview
3
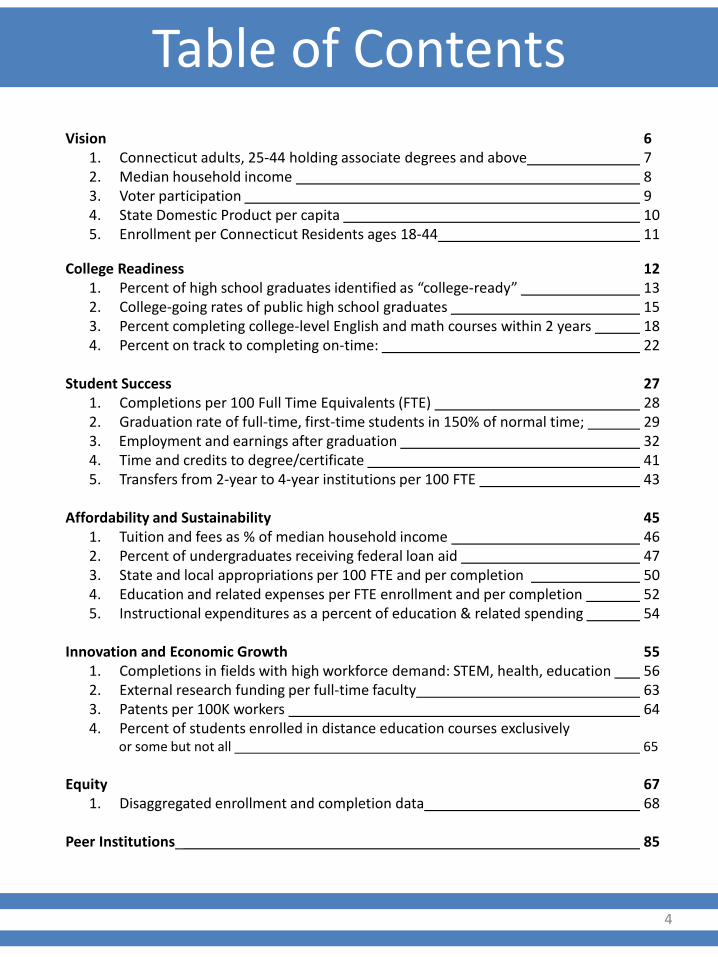
Vision 61. Connecticut adults, 25-44 holding associate degrees and above 72. Median household income 83. Voter participation 94. State Domestic Product per capita 105. Enrollment per Connecticut Residents ages 18-44 11
College Readiness 121. Percent of high school graduates identified as “college-ready” 132. College-going rates of public high school graduates 153. Percent completing college-level English and math courses within 2 years 184. Percent on track to completing on-time: 22
Student Success 271. Completions per 100 Full Time Equivalents (FTE) 282. Graduation rate of full-time, first-time students in 150% of normal time; 293. Employment and earnings after graduation 324. Time and credits to degree/certificate 415. Transfers from 2-year to 4-year institutions per 100 FTE 43
Affordability and Sustainability 451. Tuition and fees as % of median household income 462. Percent of undergraduates receiving federal loan aid 473. State and local appropriations per 100 FTE and per completion 504. Education and related expenses per FTE enrollment and per completion 525. Instructional expenditures as a percent of education & related spending 54
Innovation and Economic Growth 551. Completions in fields with high workforce demand: STEM, health, education 562. External research funding per full-time faculty 633. Patents per 100K workers 644. Percent of students enrolled in distance education courses exclusively
or some but not all 65
Equity 671. Disaggregated enrollment and completion data 68
Peer Institutions_ 85
Table of Contents
4
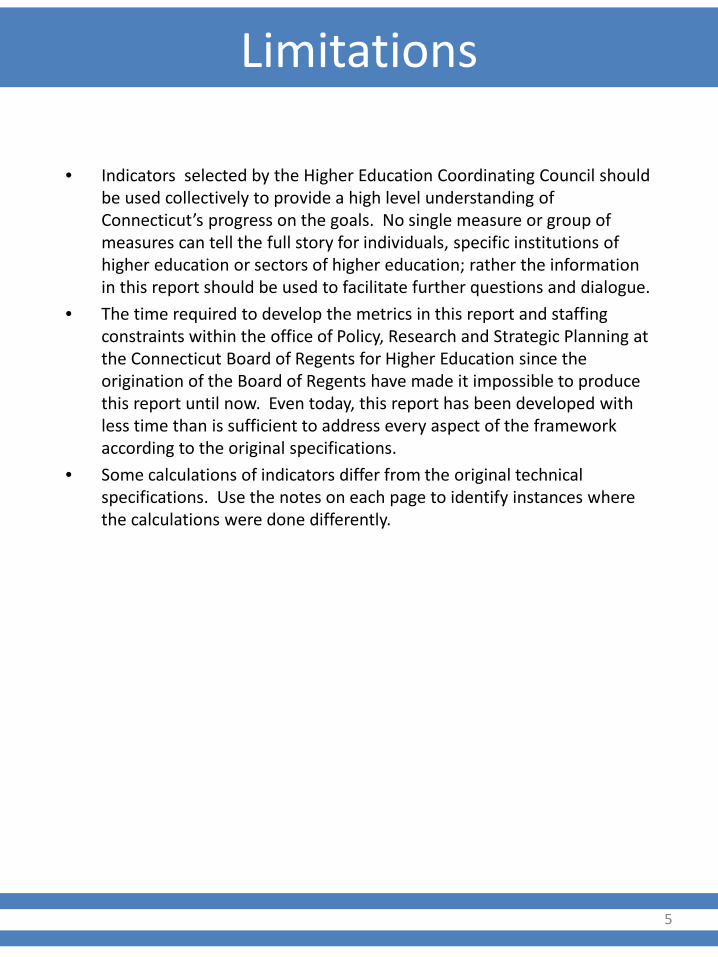
• Indicators selected by the Higher Education Coordinating Council should be used collectively to provide a high level understanding of Connecticut’s progress on the goals. No single measure or group of measures can tell the full story for individuals, specific institutions of higher education or sectors of higher education; rather the information in this report should be used to facilitate further questions and dialogue.
• The time required to develop the metrics in this report and staffing constraints within the office of Policy, Research and Strategic Planning at the Connecticut Board of Regents for Higher Education since the origination of the Board of Regents have made it impossible to produce this report until now. Even today, this report has been developed with less time than is sufficient to address every aspect of the frameworkaccording to the original specifications.
• Some calculations of indicators differ from the original technical specifications. Use the notes on each page to identify instances where the calculations were done differently.
Limitations
5
A continually increasing share of Connecticut’s population will have the high quality post-secondary education that enables them to achieve their life and career goals and makes Connecticut a place of engaged, globally competitive communities.
Indicators:1. Connecticut adults, 25-44 holding associate degrees and above2. Median household income3. Voter participation4. State Domestic Product per capita5. Enrollment per capita
Vision
6
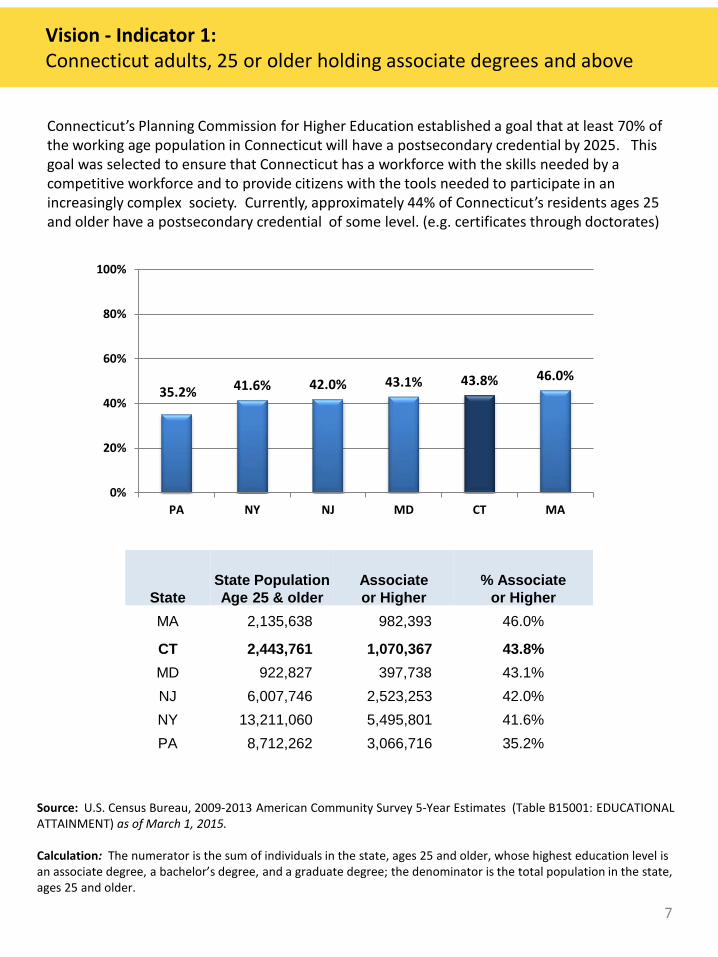
Source: U.S. Census Bureau, 2009-2013 American Community Survey 5-Year Estimates (Table B15001: EDUCATIONAL ATTAINMENT) as of March 1, 2015.
Calculation: The numerator is the sum of individuals in the state, ages 25 and older, whose highest education level is an associate degree, a bachelor’s degree, and a graduate degree; the denominator is the total population in the state, ages 25 and older.
Vision - Indicator 1: Connecticut adults, 25 or older holding associate degrees and above
Connecticut’s Planning Commission for Higher Education established a goal that at least 70% of the working age population in Connecticut will have a postsecondary credential by 2025. This goal was selected to ensure that Connecticut has a workforce with the skills needed by a competitive workforce and to provide citizens with the tools needed to participate in an increasingly complex society. Currently, approximately 44% of Connecticut’s residents ages 25 and older have a postsecondary credential of some level. (e.g. certificates through doctorates)
35.2% 41.6% 42.0% 43.1% 43.8% 46.0%
0%
20%
40%
60%
80%
100%
PA NY NJ MD CT MA
StateState PopulationAge 25 & older
Associate or Higher
% Associate or Higher
MA 2,135,638 982,393 46.0%
CT 2,443,761 1,070,367 43.8%MD 922,827 397,738 43.1%NJ 6,007,746 2,523,253 42.0%NY 13,211,060 5,495,801 41.6%PA 8,712,262 3,066,716 35.2%
7
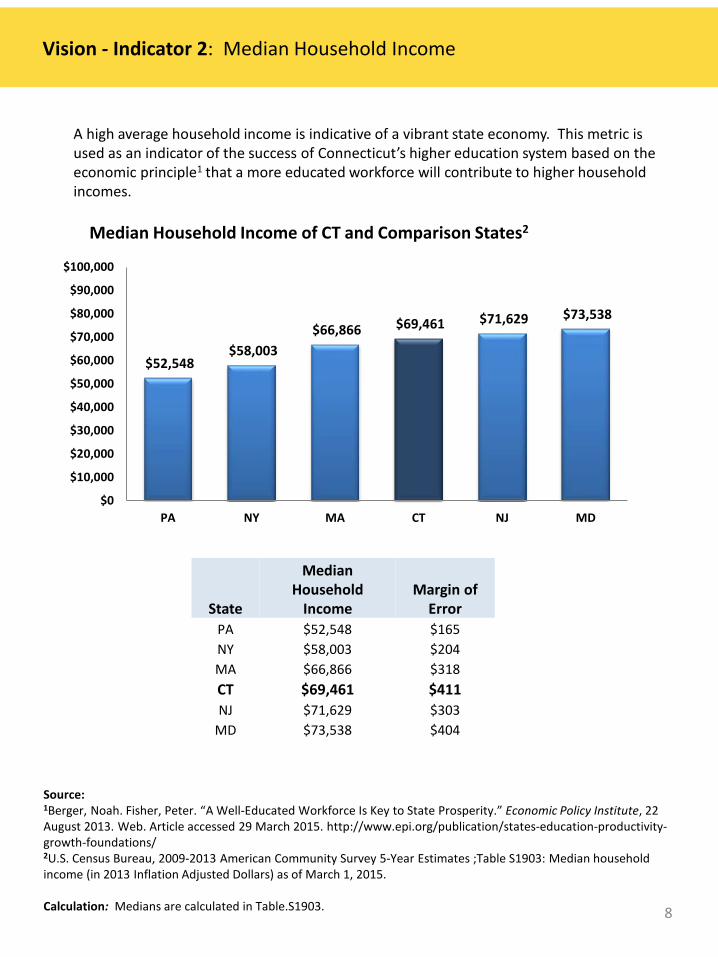
Source: 1Berger, Noah. Fisher, Peter. “A Well-Educated Workforce Is Key to State Prosperity.” Economic Policy Institute, 22 August 2013. Web. Article accessed 29 March 2015. http://www.epi.org/publication/states-education-productivity-growth-foundations/2U.S. Census Bureau, 2009-2013 American Community Survey 5-Year Estimates ;Table S1903: Median household income (in 2013 Inflation Adjusted Dollars) as of March 1, 2015.
Calculation: Medians are calculated in Table.S1903.
Vision - Indicator 2: Median Household Income
A high average household income is indicative of a vibrant state economy. This metric is used as an indicator of the success of Connecticut’s higher education system based on the economic principle1 that a more educated workforce will contribute to higher household incomes.
Median Household Income of CT and Comparison States2
$52,548 $58,003
$66,866 $69,461 $71,629 $73,538
$0
$10,000
$20,000
$30,000
$40,000
$50,000
$60,000
$70,000
$80,000
$90,000
$100,000
PA NY MA CT NJ MD
State
Median Household
IncomeMargin of
ErrorPA $52,548 $165NY $58,003 $204MA $66,866 $318CT $69,461 $411NJ $71,629 $303
MD $73,538 $404
8
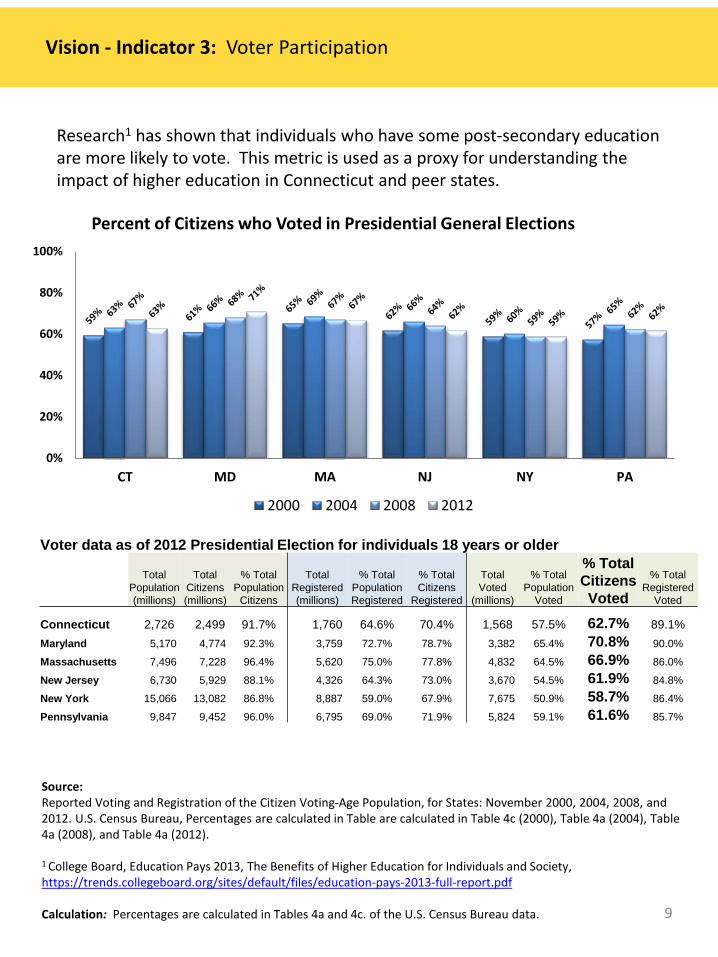
Source: Reported Voting and Registration of the Citizen Voting-Age Population, for States: November 2000, 2004, 2008, and 2012. U.S. Census Bureau, Percentages are calculated in Table are calculated in Table 4c (2000), Table 4a (2004), Table 4a (2008), and Table 4a (2012).
1 College Board, Education Pays 2013, The Benefits of Higher Education for Individuals and Society, https://trends.collegeboard.org/sites/default/files/education-pays-2013-full-report.pdf
Calculation: Percentages are calculated in Tables 4a and 4c. of the U.S. Census Bureau data.
Percent of Citizens who Voted in Presidential General Elections
0%
20%
40%
60%
80%
100%
CT MD MA NJ NY PA
2000 2004 2008 2012
Vision - Indicator 3: Voter Participation
Voter data as of 2012 Presidential Election for individuals 18 years or older
Total Population (millions)
Total Citizens(millions)
% Total Population
Citizens
Total Registered(millions)
% Total Population Registered
% Total Citizens
Registered
Total Voted
(millions)
% Total Population
Voted
% Total Citizens Voted
% Total Registered
Voted
Connecticut 2,726 2,499 91.7% 1,760 64.6% 70.4% 1,568 57.5% 62.7% 89.1%Maryland 5,170 4,774 92.3% 3,759 72.7% 78.7% 3,382 65.4% 70.8% 90.0%
Massachusetts 7,496 7,228 96.4% 5,620 75.0% 77.8% 4,832 64.5% 66.9% 86.0%
New Jersey 6,730 5,929 88.1% 4,326 64.3% 73.0% 3,670 54.5% 61.9% 84.8%
New York 15,066 13,082 86.8% 8,887 59.0% 67.9% 7,675 50.9% 58.7% 86.4%
Pennsylvania 9,847 9,452 96.0% 6,795 69.0% 71.9% 5,824 59.1% 61.6% 85.7%
Research1 has shown that individuals who have some post-secondary education are more likely to vote. This metric is used as a proxy for understanding the impact of higher education in Connecticut and peer states.
9
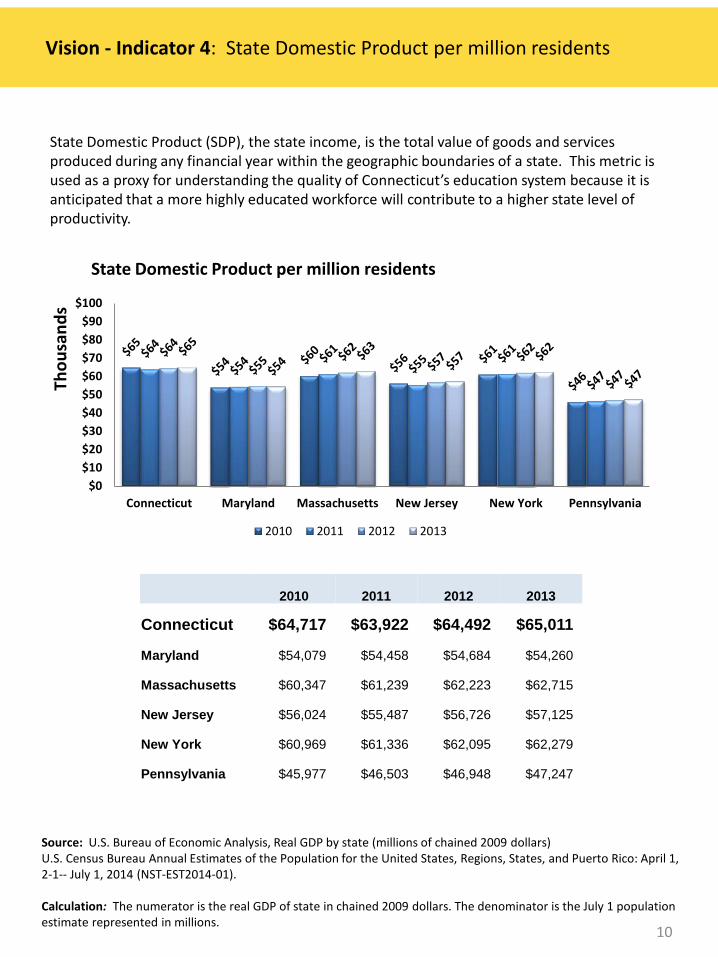
Source: U.S. Bureau of Economic Analysis, Real GDP by state (millions of chained 2009 dollars) U.S. Census Bureau Annual Estimates of the Population for the United States, Regions, States, and Puerto Rico: April 1, 2-1-- July 1, 2014 (NST-EST2014-01).
Calculation: The numerator is the real GDP of state in chained 2009 dollars. The denominator is the July 1 population estimate represented in millions.
Vision - Indicator 4: State Domestic Product per million residents
State Domestic Product (SDP), the state income, is the total value of goods and services produced during any financial year within the geographic boundaries of a state. This metric is used as a proxy for understanding the quality of Connecticut’s education system because it is anticipated that a more highly educated workforce will contribute to a higher state level of productivity.
State Domestic Product per million residents
$0$10$20$30$40$50$60$70$80$90
$100
Connecticut Maryland Massachusetts New Jersey New York Pennsylvania
Thou
sand
s
2010 2011 2012 2013
2010 2011 2012 2013
Connecticut $64,717 $63,922 $64,492 $65,011
Maryland $54,079 $54,458 $54,684 $54,260
Massachusetts $60,347 $61,239 $62,223 $62,715
New Jersey $56,024 $55,487 $56,726 $57,125
New York $60,969 $61,336 $62,095 $62,279
Pennsylvania $45,977 $46,503 $46,948 $47,247
10
Source: U.S. Dept. of Education, IPEDS Fall Enrollment Survey (EF) U.S. Census Bureau, July 1 intercensal estimates by age (Table series NST-EST2011-01)
Calculation: The numerator is fall headcount enrollment within the public Sector. The denominator is the July 1 population estimate of persons aged 18-44 years
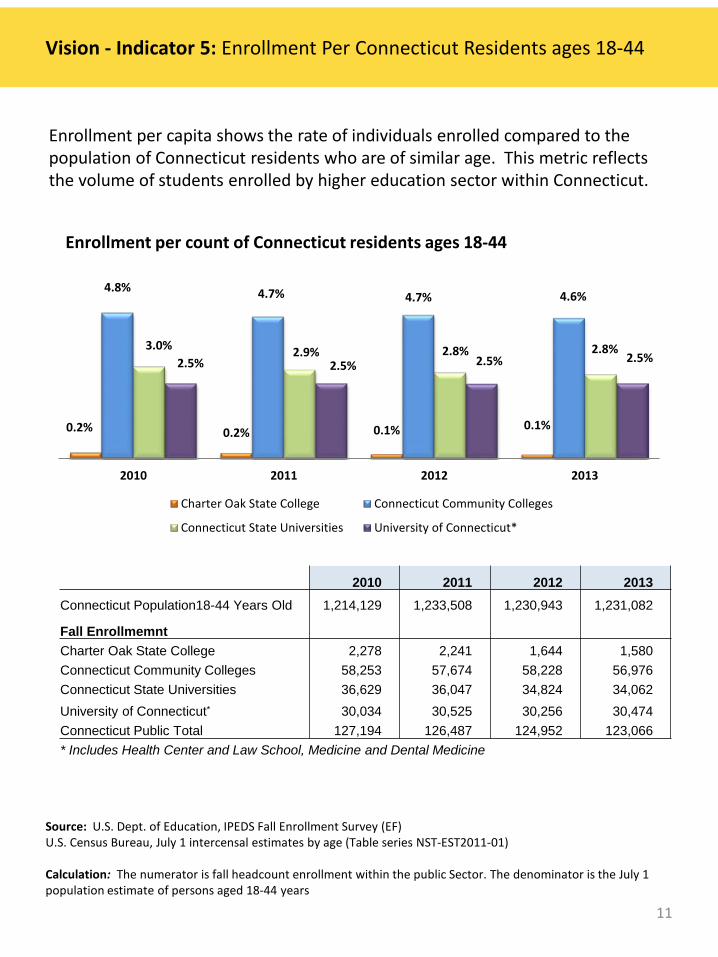
Vision - Indicator 5: Enrollment Per Connecticut Residents ages 18-44
Enrollment per capita shows the rate of individuals enrolled compared to the population of Connecticut residents who are of similar age. This metric reflects the volume of students enrolled by higher education sector within Connecticut.
Enrollment per count of Connecticut residents ages 18-44
2010 2011 2012 2013Connecticut Population18-44 Years Old 1,214,129 1,233,508 1,230,943 1,231,082
Fall EnrollmemntCharter Oak State College 2,278 2,241 1,644 1,580Connecticut Community Colleges 58,253 57,674 58,228 56,976Connecticut State Universities 36,629 36,047 34,824 34,062University of Connecticut* 30,034 30,525 30,256 30,474Connecticut Public Total 127,194 126,487 124,952 123,066* Includes Health Center and Law School, Medicine and Dental Medicine
0.2% 0.2% 0.1% 0.1%
4.8% 4.7% 4.7% 4.6%
3.0% 2.9% 2.8% 2.8%2.5% 2.5% 2.5% 2.5%
2010 2011 2012 2013
Charter Oak State College Connecticut Community Colleges
Connecticut State Universities University of Connecticut*
11
Prepare more high school graduates, GED graduates, and adults to enter college prepared for college-level work.
Indicators:1. Percent of high school graduates identified as “college-ready”2. College-going rates of public high school graduates3. Percent completing college-level English and math courses within 2 years4. Percent on track to completing on-time:
a. FT student completing 24 credits in 1st academic year, b. PT student completing 12 credits in 1st academic year
College Readiness
12
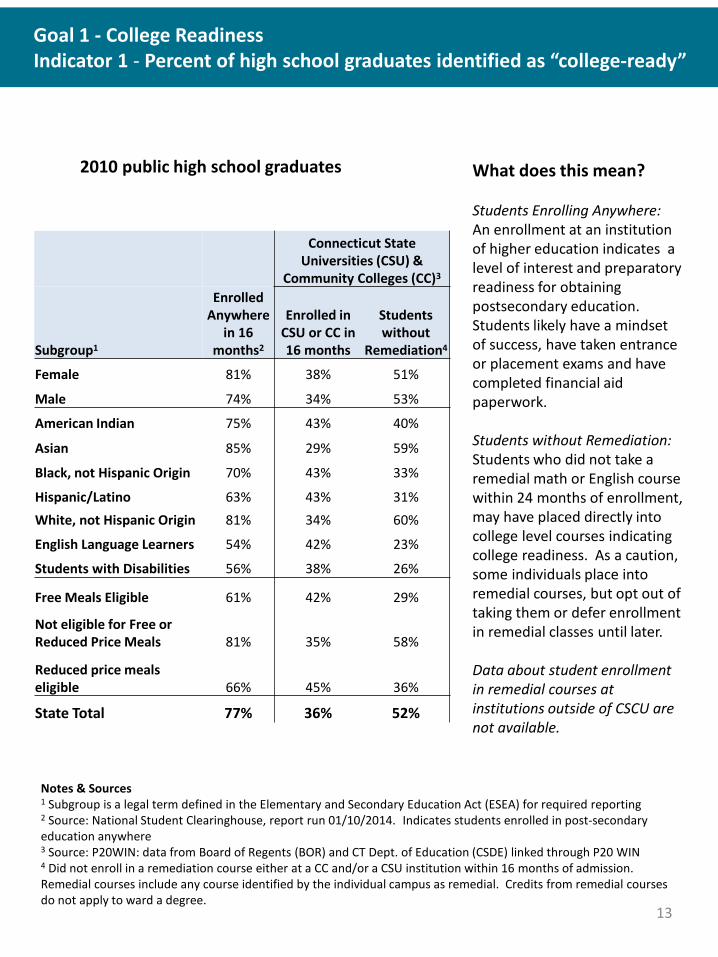
Notes & Sources1 Subgroup is a legal term defined in the Elementary and Secondary Education Act (ESEA) for required reporting2 Source: National Student Clearinghouse, report run 01/10/2014. Indicates students enrolled in post-secondary education anywhere3 Source: P20WIN: data from Board of Regents (BOR) and CT Dept. of Education (CSDE) linked through P20 WIN4 Did not enroll in a remediation course either at a CC and/or a CSU institution within 16 months of admission. Remedial courses include any course identified by the individual campus as remedial. Credits from remedial courses do not apply to ward a degree.
Connecticut State Universities (CSU) &
Community Colleges (CC)3
Subgroup1
Enrolled Anywhere
in 16 months2
Enrolled in CSU or CC in 16 months
Students without
Remediation4
Female 81% 38% 51%
Male 74% 34% 53%
American Indian 75% 43% 40%
Asian 85% 29% 59%
Black, not Hispanic Origin 70% 43% 33%
Hispanic/Latino 63% 43% 31%White, not Hispanic Origin 81% 34% 60%
English Language Learners 54% 42% 23%
Students with Disabilities 56% 38% 26%
Free Meals Eligible 61% 42% 29%
Not eligible for Free or Reduced Price Meals 81% 35% 58%
Reduced price meals eligible 66% 45% 36%
State Total 77% 36% 52%
2010 public high school graduates What does this mean?
Students Enrolling Anywhere: An enrollment at an institution of higher education indicates a level of interest and preparatory readiness for obtaining postsecondary education. Students likely have a mindset of success, have taken entrance or placement exams and have completed financial aid paperwork.
Students without Remediation: Students who did not take a remedial math or English course within 24 months of enrollment, may have placed directly into college level courses indicating college readiness. As a caution, some individuals place into remedial courses, but opt out of taking them or defer enrollment in remedial classes until later.
Data about student enrollment in remedial courses at institutions outside of CSCU are not available.
Goal 1 - College ReadinessIndicator 1 - Percent of high school graduates identified as “college-ready”
13
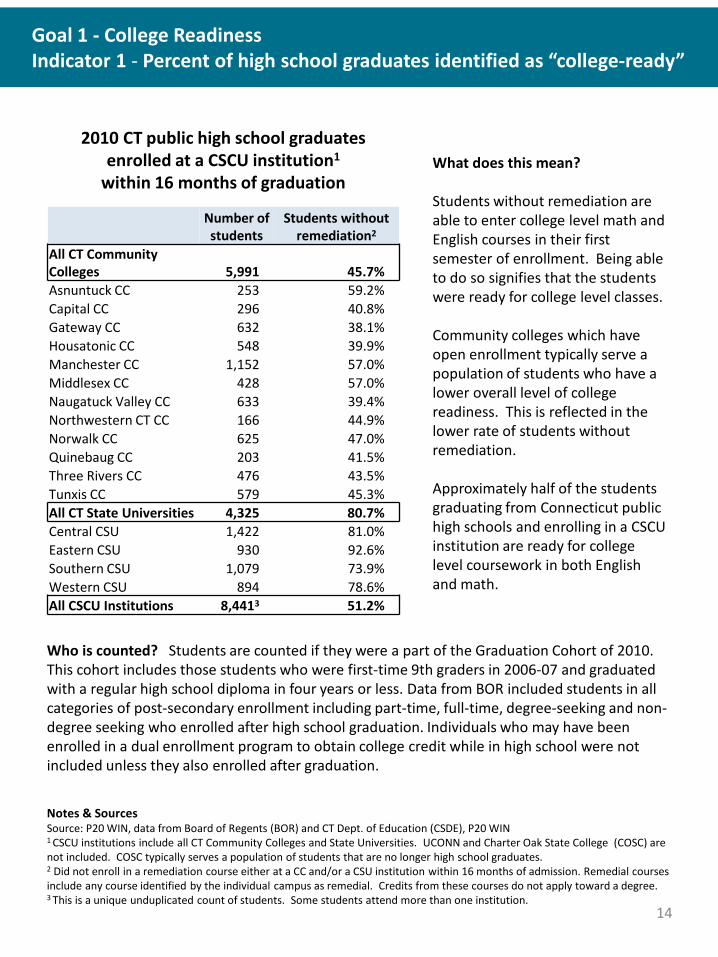
Notes & SourcesSource: P20 WIN, data from Board of Regents (BOR) and CT Dept. of Education (CSDE), P20 WIN1 CSCU institutions include all CT Community Colleges and State Universities. UCONN and Charter Oak State College (COSC) are not included. COSC typically serves a population of students that are no longer high school graduates.2 Did not enroll in a remediation course either at a CC and/or a CSU institution within 16 months of admission. Remedial courses include any course identified by the individual campus as remedial. Credits from these courses do not apply toward a degree.3 This is a unique unduplicated count of students. Some students attend more than one institution.
2010 CT public high school graduates enrolled at a CSCU institution1
within 16 months of graduationWhat does this mean?
Students without remediation are able to enter college level math and English courses in their first semester of enrollment. Being able to do so signifies that the students were ready for college level classes.
Community colleges which have open enrollment typically serve a population of students who have a lower overall level of college readiness. This is reflected in the lower rate of students without remediation.
Approximately half of the students graduating from Connecticut public high schools and enrolling in a CSCU institution are ready for college level coursework in both English and math.
Number of students
Students without remediation2
All CT Community Colleges 5,991 45.7%Asnuntuck CC 253 59.2%Capital CC 296 40.8%Gateway CC 632 38.1%Housatonic CC 548 39.9%Manchester CC 1,152 57.0%Middlesex CC 428 57.0%Naugatuck Valley CC 633 39.4%Northwestern CT CC 166 44.9%Norwalk CC 625 47.0%Quinebaug CC 203 41.5%Three Rivers CC 476 43.5%Tunxis CC 579 45.3%All CT State Universities 4,325 80.7%Central CSU 1,422 81.0%Eastern CSU 930 92.6%Southern CSU 1,079 73.9%Western CSU 894 78.6%All CSCU Institutions 8,4413 51.2%
Who is counted? Students are counted if they were a part of the Graduation Cohort of 2010. This cohort includes those students who were first-time 9th graders in 2006-07 and graduated with a regular high school diploma in four years or less. Data from BOR included students in all categories of post-secondary enrollment including part-time, full-time, degree-seeking and non-degree seeking who enrolled after high school graduation. Individuals who may have been enrolled in a dual enrollment program to obtain college credit while in high school were not included unless they also enrolled after graduation.
Goal 1 - College ReadinessIndicator 1 - Percent of high school graduates identified as “college-ready”
14
Notes & Sources1 Enrollments are counted if the student enrolled at any time during the first year after high school graduation.2 Source: State Department of Education’s report of National Student Clearinghouse data., as of November 26th, 2014 3 Eligibility for Free or reduced price lunch is a proxy for Economic Disadvantage.* Data not available due to re-structuring of demographic categories effective 2011.
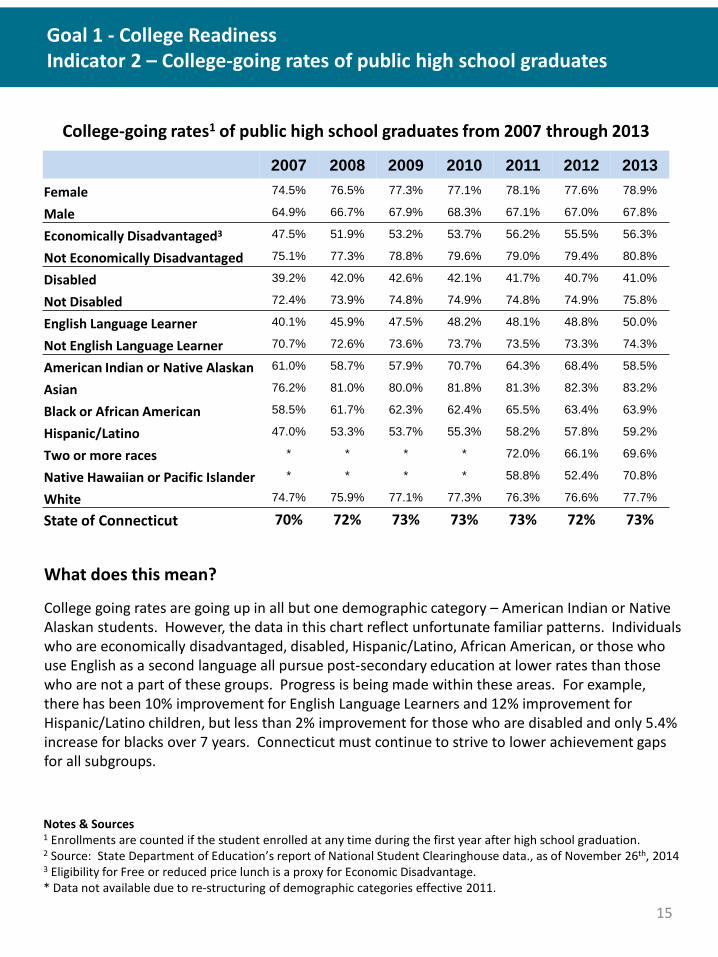
College-going rates1 of public high school graduates from 2007 through 2013
What does this mean?
College going rates are going up in all but one demographic category – American Indian or Native Alaskan students. However, the data in this chart reflect unfortunate familiar patterns. Individuals who are economically disadvantaged, disabled, Hispanic/Latino, African American, or those who use English as a second language all pursue post-secondary education at lower rates than those who are not a part of these groups. Progress is being made within these areas. For example, there has been 10% improvement for English Language Learners and 12% improvement for Hispanic/Latino children, but less than 2% improvement for those who are disabled and only 5.4% increase for blacks over 7 years. Connecticut must continue to strive to lower achievement gaps for all subgroups.
Goal 1 - College ReadinessIndicator 2 – College-going rates of public high school graduates
2007 2008 2009 2010 2011 2012 2013Female 74.5% 76.5% 77.3% 77.1% 78.1% 77.6% 78.9%
Male 64.9% 66.7% 67.9% 68.3% 67.1% 67.0% 67.8%
Economically Disadvantaged3 47.5% 51.9% 53.2% 53.7% 56.2% 55.5% 56.3%
Not Economically Disadvantaged 75.1% 77.3% 78.8% 79.6% 79.0% 79.4% 80.8%
Disabled 39.2% 42.0% 42.6% 42.1% 41.7% 40.7% 41.0%
Not Disabled 72.4% 73.9% 74.8% 74.9% 74.8% 74.9% 75.8%
English Language Learner 40.1% 45.9% 47.5% 48.2% 48.1% 48.8% 50.0%
Not English Language Learner 70.7% 72.6% 73.6% 73.7% 73.5% 73.3% 74.3%
American Indian or Native Alaskan 61.0% 58.7% 57.9% 70.7% 64.3% 68.4% 58.5%
Asian 76.2% 81.0% 80.0% 81.8% 81.3% 82.3% 83.2%
Black or African American 58.5% 61.7% 62.3% 62.4% 65.5% 63.4% 63.9%
Hispanic/Latino 47.0% 53.3% 53.7% 55.3% 58.2% 57.8% 59.2%
Two or more races * * * * 72.0% 66.1% 69.6%
Native Hawaiian or Pacific Islander * * * * 58.8% 52.4% 70.8%
White 74.7% 75.9% 77.1% 77.3% 76.3% 76.6% 77.7%
State of Connecticut 70% 72% 73% 73% 73% 72% 73%
15
Notes & Source1 Enrollments are counted if the student enrolled at any time during the first year after high school graduation.Source: State Department of Education’s report of National Student Clearinghouse data., as of November 26th, 2014
What does this mean?
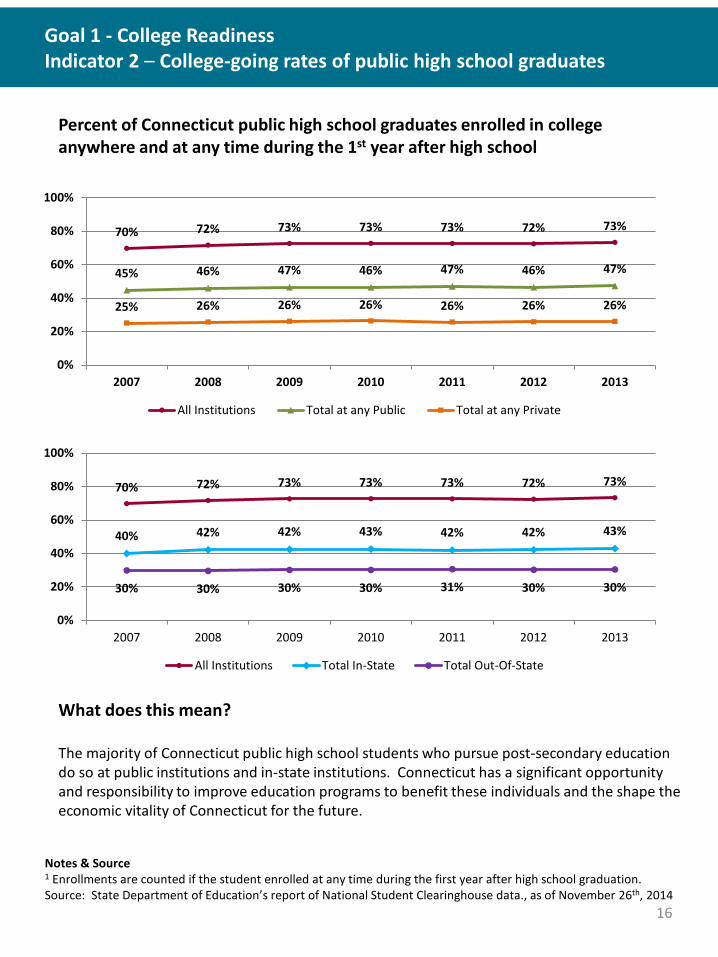
The majority of Connecticut public high school students who pursue post-secondary education do so at public institutions and in-state institutions. Connecticut has a significant opportunity and responsibility to improve education programs to benefit these individuals and the shape the economic vitality of Connecticut for the future.
Goal 1 - College Readiness Indicator 2 – College-going rates of public high school graduates
Percent of Connecticut public high school graduates enrolled in college anywhere and at any time during the 1st year after high school
70% 72% 73% 73% 73% 72% 73%
45% 46% 47% 46% 47% 46% 47%
25% 26% 26% 26% 26% 26% 26%
0%
20%
40%
60%
80%
100%
2007 2008 2009 2010 2011 2012 2013
All Institutions Total at any Public Total at any Private
70% 72% 73% 73% 73% 72% 73%
40% 42% 42% 43% 42% 42% 43%
30% 30% 30% 30% 31% 30% 30%
0%
20%
40%
60%
80%
100%
2007 2008 2009 2010 2011 2012 2013
All Institutions Total In-State Total Out-Of-State
16

SourceState Department of Education, National Student Clearinghouse Student Tracker Report for High Schools. Report Run Date: 03/04/2015.
ENROLLMENT AND PROGRESS OF THE CLASS OF 2007 The most complete picture of the pathways of progress in college can be obtained by following the class of 2007, through six years of National Student Clearinghouse data (see Chart below). The chart follows the class of 2007 from the fall of 2007 through the spring of 2014. Important highlights of the results include:
• 70 percent of this class enrolled in the first year, while an additional 4 percent enrolled in the second year, 2 percent more in the third year, and approximately 1 percent enrolled in each remaining year.
• 20 percent of students never enrolled in college, according to NSC. • 23 percent of the class enrolled but left college without earning a degree. • 8 percent of the class were still enrolled after six years, and 5.6 percent after seven years. • About 2 percent of the class returned each year after a gap in their postsecondary enrollment. • After six years, 48 percent of the high school class had earned a college degree.
CLASS OF 2007 Post secondary Enrollment and Progress
Goal 1 - College Readiness Indicator 2 – College-going rates of public high school graduates
17
Goal 1 - College ReadinessIndicator 3 – Percent completing college-level English and math courses within 2 years
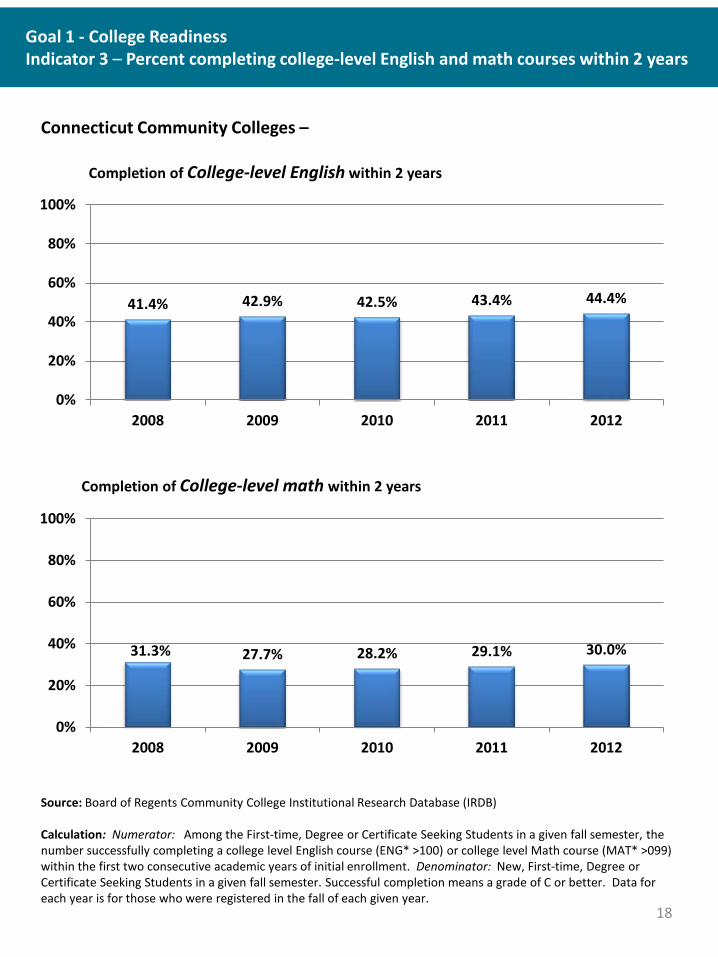
Connecticut Community Colleges –
Completion of College-level English within 2 years
Completion of College-level math within 2 years
Source: Board of Regents Community College Institutional Research Database (IRDB)
Calculation: Numerator: Among the First-time, Degree or Certificate Seeking Students in a given fall semester, the number successfully completing a college level English course (ENG* >100) or college level Math course (MAT* >099) within the first two consecutive academic years of initial enrollment. Denominator: New, First-time, Degree or Certificate Seeking Students in a given fall semester. Successful completion means a grade of C or better. Data for each year is for those who were registered in the fall of each given year.
41.4% 42.9% 42.5% 43.4% 44.4%
0%
20%
40%
60%
80%
100%
2008 2009 2010 2011 2012
31.3% 27.7% 28.2% 29.1% 30.0%
0%
20%
40%
60%
80%
100%
2008 2009 2010 2011 2012
18
Goal 1 - College ReadinessIndicator 3 – Percent completing college-level English and math courses within 2 years
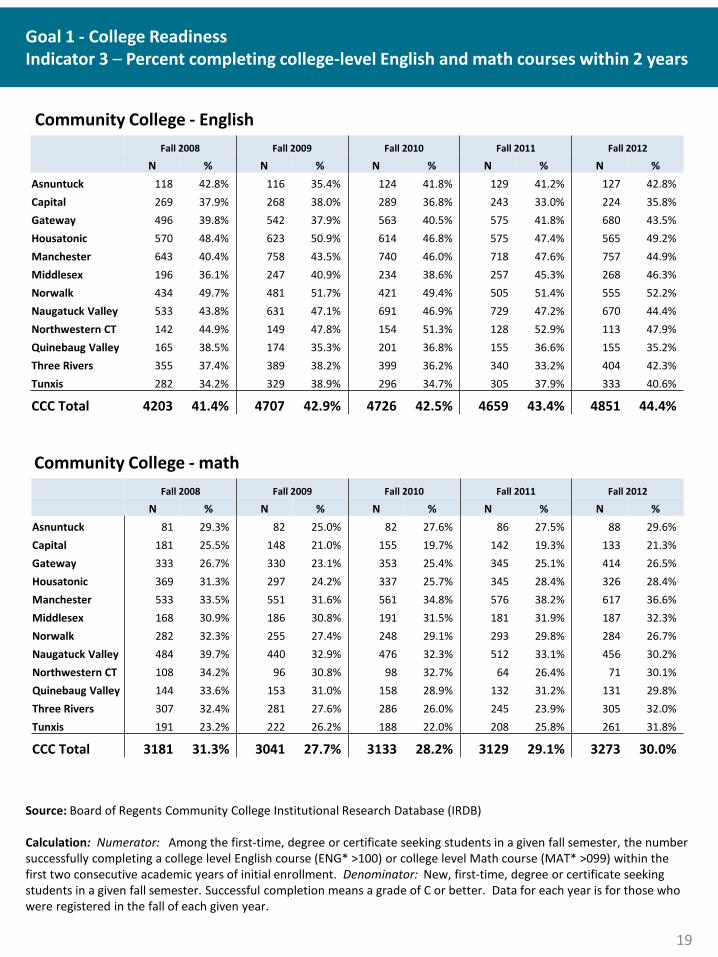
Community College - English
Community College - math
Source: Board of Regents Community College Institutional Research Database (IRDB)
Calculation: Numerator: Among the first-time, degree or certificate seeking students in a given fall semester, the number successfully completing a college level English course (ENG* >100) or college level Math course (MAT* >099) within the first two consecutive academic years of initial enrollment. Denominator: New, first-time, degree or certificate seeking students in a given fall semester. Successful completion means a grade of C or better. Data for each year is for those who were registered in the fall of each given year.
Fall 2008 Fall 2009 Fall 2010 Fall 2011 Fall 2012
N % N % N % N % N %Asnuntuck 118 42.8% 116 35.4% 124 41.8% 129 41.2% 127 42.8%Capital 269 37.9% 268 38.0% 289 36.8% 243 33.0% 224 35.8%Gateway 496 39.8% 542 37.9% 563 40.5% 575 41.8% 680 43.5%Housatonic 570 48.4% 623 50.9% 614 46.8% 575 47.4% 565 49.2%Manchester 643 40.4% 758 43.5% 740 46.0% 718 47.6% 757 44.9%Middlesex 196 36.1% 247 40.9% 234 38.6% 257 45.3% 268 46.3%Norwalk 434 49.7% 481 51.7% 421 49.4% 505 51.4% 555 52.2%Naugatuck Valley 533 43.8% 631 47.1% 691 46.9% 729 47.2% 670 44.4%Northwestern CT 142 44.9% 149 47.8% 154 51.3% 128 52.9% 113 47.9%Quinebaug Valley 165 38.5% 174 35.3% 201 36.8% 155 36.6% 155 35.2%Three Rivers 355 37.4% 389 38.2% 399 36.2% 340 33.2% 404 42.3%Tunxis 282 34.2% 329 38.9% 296 34.7% 305 37.9% 333 40.6%
CCC Total 4203 41.4% 4707 42.9% 4726 42.5% 4659 43.4% 4851 44.4%
Fall 2008 Fall 2009 Fall 2010 Fall 2011 Fall 2012
N % N % N % N % N %Asnuntuck 81 29.3% 82 25.0% 82 27.6% 86 27.5% 88 29.6%Capital 181 25.5% 148 21.0% 155 19.7% 142 19.3% 133 21.3%Gateway 333 26.7% 330 23.1% 353 25.4% 345 25.1% 414 26.5%Housatonic 369 31.3% 297 24.2% 337 25.7% 345 28.4% 326 28.4%Manchester 533 33.5% 551 31.6% 561 34.8% 576 38.2% 617 36.6%Middlesex 168 30.9% 186 30.8% 191 31.5% 181 31.9% 187 32.3%Norwalk 282 32.3% 255 27.4% 248 29.1% 293 29.8% 284 26.7%Naugatuck Valley 484 39.7% 440 32.9% 476 32.3% 512 33.1% 456 30.2%Northwestern CT 108 34.2% 96 30.8% 98 32.7% 64 26.4% 71 30.1%Quinebaug Valley 144 33.6% 153 31.0% 158 28.9% 132 31.2% 131 29.8%Three Rivers 307 32.4% 281 27.6% 286 26.0% 245 23.9% 305 32.0%Tunxis 191 23.2% 222 26.2% 188 22.0% 208 25.8% 261 31.8%
CCC Total 3181 31.3% 3041 27.7% 3133 28.2% 3129 29.1% 3273 30.0%
19
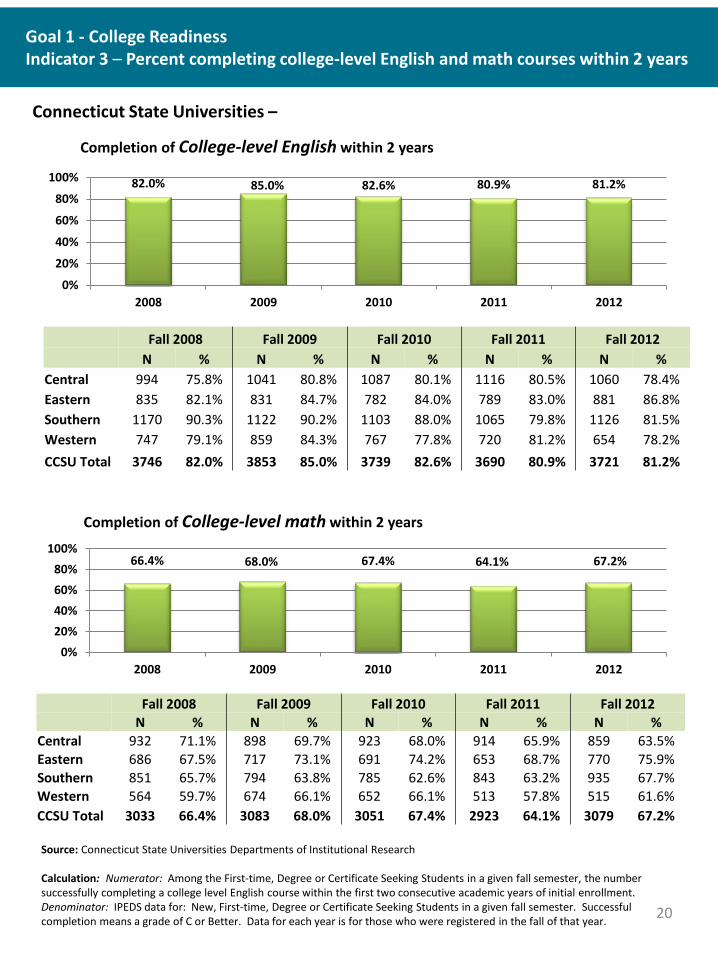
Goal 1 - College ReadinessIndicator 3 – Percent completing college-level English and math courses within 2 years
Completion of College-level math within 2 years
Connecticut State Universities –
Completion of College-level English within 2 years
Source: Connecticut State Universities Departments of Institutional Research
Calculation: Numerator: Among the First-time, Degree or Certificate Seeking Students in a given fall semester, the number successfully completing a college level English course within the first two consecutive academic years of initial enrollment. Denominator: IPEDS data for: New, First-time, Degree or Certificate Seeking Students in a given fall semester. Successful completion means a grade of C or Better. Data for each year is for those who were registered in the fall of that year.
Fall 2008 Fall 2009 Fall 2010 Fall 2011 Fall 2012N % N % N % N % N %
Central 994 75.8% 1041 80.8% 1087 80.1% 1116 80.5% 1060 78.4%Eastern 835 82.1% 831 84.7% 782 84.0% 789 83.0% 881 86.8%Southern 1170 90.3% 1122 90.2% 1103 88.0% 1065 79.8% 1126 81.5%Western 747 79.1% 859 84.3% 767 77.8% 720 81.2% 654 78.2%CCSU Total 3746 82.0% 3853 85.0% 3739 82.6% 3690 80.9% 3721 81.2%
Fall 2008 Fall 2009 Fall 2010 Fall 2011 Fall 2012N % N % N % N % N %
Central 932 71.1% 898 69.7% 923 68.0% 914 65.9% 859 63.5%Eastern 686 67.5% 717 73.1% 691 74.2% 653 68.7% 770 75.9%Southern 851 65.7% 794 63.8% 785 62.6% 843 63.2% 935 67.7%Western 564 59.7% 674 66.1% 652 66.1% 513 57.8% 515 61.6%CCSU Total 3033 66.4% 3083 68.0% 3051 67.4% 2923 64.1% 3079 67.2%
82.0% 85.0% 82.6% 80.9% 81.2%
0%
20%
40%
60%
80%
100%
2008 2009 2010 2011 2012
66.4% 68.0% 67.4% 64.1% 67.2%
0%20%40%60%80%
100%
2008 2009 2010 2011 2012
20
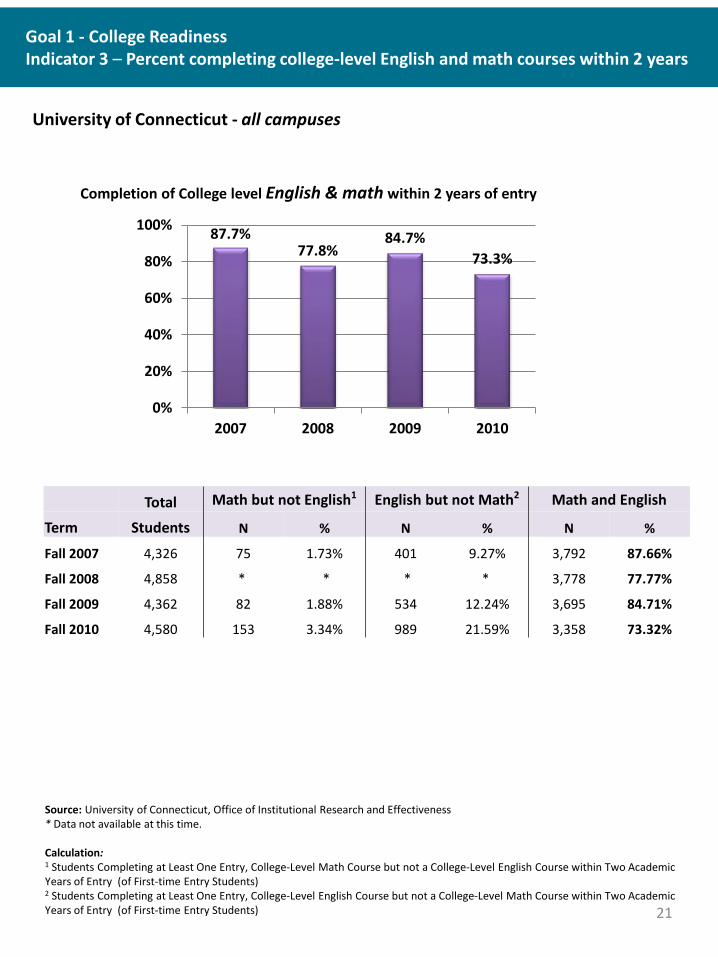
Goal 1 - College ReadinessIndicator 3 – Percent completing college-level English and math courses within 2 years
University of Connecticut - all campuses
Completion of College level English & math within 2 years of entry
Source: University of Connecticut, Office of Institutional Research and Effectiveness* Data not available at this time.
Calculation:1 Students Completing at Least One Entry, College-Level Math Course but not a College-Level English Course within Two Academic Years of Entry (of First-time Entry Students) 2 Students Completing at Least One Entry, College-Level English Course but not a College-Level Math Course within Two Academic Years of Entry (of First-time Entry Students)
87.7%77.8%
84.7%73.3%
0%
20%
40%
60%
80%
100%
2007 2008 2009 2010
Total Math but not English1 English but not Math2 Math and English
Term Students N % N % N %
Fall 2007 4,326 75 1.73% 401 9.27% 3,792 87.66%
Fall 2008 4,858 * * * * 3,778 77.77%
Fall 2009 4,362 82 1.88% 534 12.24% 3,695 84.71%
Fall 2010 4,580 153 3.34% 989 21.59% 3,358 73.32%
21

Goal 1 - College ReadinessIndicator 4 – Percent on track to completing on-time
Community Colleges- Full-time students completing 24 credits in 1st academic year
Source: Board of Regents Community College Institutional Research Database (IRDB)
Calculation: Full-time: Percent of first-time, full-time undergraduate or degree seeking students in a fall IPEDS Graduation Rate Survey cohort who completed 24 or more credit hours before the following fall. Part-time: Percent of first-time, part-time, undergraduate, degree seeking students in a fall GRS cohort who completed 12 or more credit hours that count towards a degree before the following fall.
Table 1.4a: Full-time Students
19.9% 22.2% 22.2% 22.2% 25.3% 27.7%
0%
20%
40%
60%
80%
100%
2008 2009 2010 2011 2012 2013
2008 2009 2010 2011 2012 20135 year
% changeAsnuntuck 40.9% 44.8% 32.1% 27.8% 46.1% 46.5% 5.6%Capital 10.8% 9.3% 10.8% 7.1% 10.7% 11.9% 1.1%Gateway 10.1% 11.6% 12.2% 11.9% 15.4% 21.2% 11.1%Housatonic 9.9% 12.1% 13.3% 14.8% 18.2% 15.2% 5.2%Manchester 20.3% 24.8% 27.4% 27.6% 27.6% 30.1% 9.7%Middlesex 14.1% 16.5% 20.1% 16.5% 24.4% 23.1% 9.0%Norwalk 38.1% 36.1% 37.8% 36.9% 30.9% 42.1% 4.0%Naugatuck Valley 10.4% 14.8% 17.1% 18.2% 18.9% 20.3% 9.9%Northwestern CT 17.2% 18.1% 19.7% 17.4% 16.4% 20.3% 3.1%Quinebaug Valley 46.0% 45.2% 40.9% 45.8% 44.8% 49.5% 3.5%Three Rivers 22.1% 20.7% 20.6% 18.8% 27.8% 26.7% 4.7%Tunxis 29.2% 36.7% 32.0% 35.8% 39.9% 39.5% 10.4%CCC Total - FT 19.9% 22.2% 22.2% 22.2% 25.3% 27.7% 7.8%
22
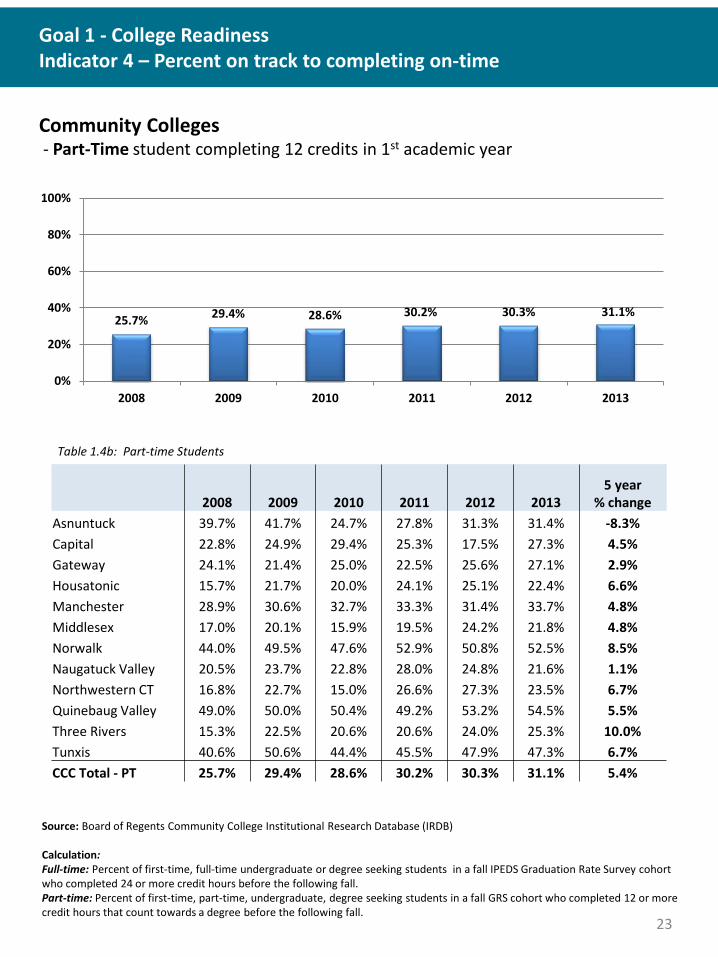
Goal 1 - College ReadinessIndicator 4 – Percent on track to completing on-time
Community Colleges- Part-Time student completing 12 credits in 1st academic year
Source: Board of Regents Community College Institutional Research Database (IRDB)
Calculation: Full-time: Percent of first-time, full-time undergraduate or degree seeking students in a fall IPEDS Graduation Rate Survey cohort who completed 24 or more credit hours before the following fall. Part-time: Percent of first-time, part-time, undergraduate, degree seeking students in a fall GRS cohort who completed 12 or more credit hours that count towards a degree before the following fall.
Table 1.4b: Part-time Students
25.7% 29.4% 28.6% 30.2% 30.3% 31.1%
0%
20%
40%
60%
80%
100%
2008 2009 2010 2011 2012 2013
2008 2009 2010 2011 2012 20135 year
% changeAsnuntuck 39.7% 41.7% 24.7% 27.8% 31.3% 31.4% -8.3%Capital 22.8% 24.9% 29.4% 25.3% 17.5% 27.3% 4.5%Gateway 24.1% 21.4% 25.0% 22.5% 25.6% 27.1% 2.9%Housatonic 15.7% 21.7% 20.0% 24.1% 25.1% 22.4% 6.6%Manchester 28.9% 30.6% 32.7% 33.3% 31.4% 33.7% 4.8%Middlesex 17.0% 20.1% 15.9% 19.5% 24.2% 21.8% 4.8%Norwalk 44.0% 49.5% 47.6% 52.9% 50.8% 52.5% 8.5%Naugatuck Valley 20.5% 23.7% 22.8% 28.0% 24.8% 21.6% 1.1%Northwestern CT 16.8% 22.7% 15.0% 26.6% 27.3% 23.5% 6.7%Quinebaug Valley 49.0% 50.0% 50.4% 49.2% 53.2% 54.5% 5.5%Three Rivers 15.3% 22.5% 20.6% 20.6% 24.0% 25.3% 10.0%Tunxis 40.6% 50.6% 44.4% 45.5% 47.9% 47.3% 6.7%CCC Total - PT 25.7% 29.4% 28.6% 30.2% 30.3% 31.1% 5.4%
23

Goal 1 - College ReadinessIndicator 4 – Percent on track to completing on-time
Connecticut State Universities- Full-Time student completing 24 credits in 1st academic year
Sources: Numerator: Connecticut State UniversitiesDenominator: Integrated Postsecondary Education Data System (IPEDS)
Calculation: Full-time: Percent of first-time, full-time undergraduate or degree seeking students in a fall Graduation Rate Survey cohort who completed 24 or more credit hours before the following fall. Part-time: Percent of first-time, part-time, undergraduate, degree seeking students in a fall GRS cohort who completed 12 or more credit hours that count towards a degree before the following fall.
- Part-Time student completing 12 credits in 1st academic year
2008 2009 2010 2011 2012 20135 year
% change
Central 69.1% 73.3% 73.6% 69.0% 68.6% 74.4% 5.3%
Eastern 77.3% 78.7% 78.9% 77.5% 81.6% 84.4% 7.1%
Southern 73.1% 72.5% 71.0% 68.6% 75.3% 70.1% -3.0%
Western 62.9% 70.9% 71.6% 73.9% 78.2% 79.7% 16.8%
CSU Total 70.7% 73.7% 73.5% 71.6% 75.2% 76.2% 5.5%
Table 1.4c: Full-time Students
Table 1.4d: Part-time Students
70.7% 73.7% 73.5% 71.6% 75.2% 76.2%
0%
20%
40%
60%
80%
100%
2008 2009 2010 2011 2012 2013
Fall 2008 Fall 2009 Fall 2010 Fall 2011 Fall 2012 Fall 2013
College>=12 Hrs %
>=12 Hrs %
>=12 Hrs %
>=12 Hrs %
>=12 Hrs %
>=12 Hrs %
Central 3 42.9% 4 57.1% 5 71.4% 6 46.2% 10 83.3% 8 53.3%Eastern 46 69.7% 27 73.0% 10 62.5% 18 75.0% 32 88.9% 20 90.9%Southern 5 62.5% 1 14.3% 2 40.0% 5 33.3% 7 31.8% 4 21.1%Western 4 28.6% 2 18.2% 4 36.4% 12 70.6% 5 33.3% 6 46.2%CSU Total 58 61.1% 34 54.8% 21 53.8% 41 59.4% 54 63.5% 38 55.1%
24
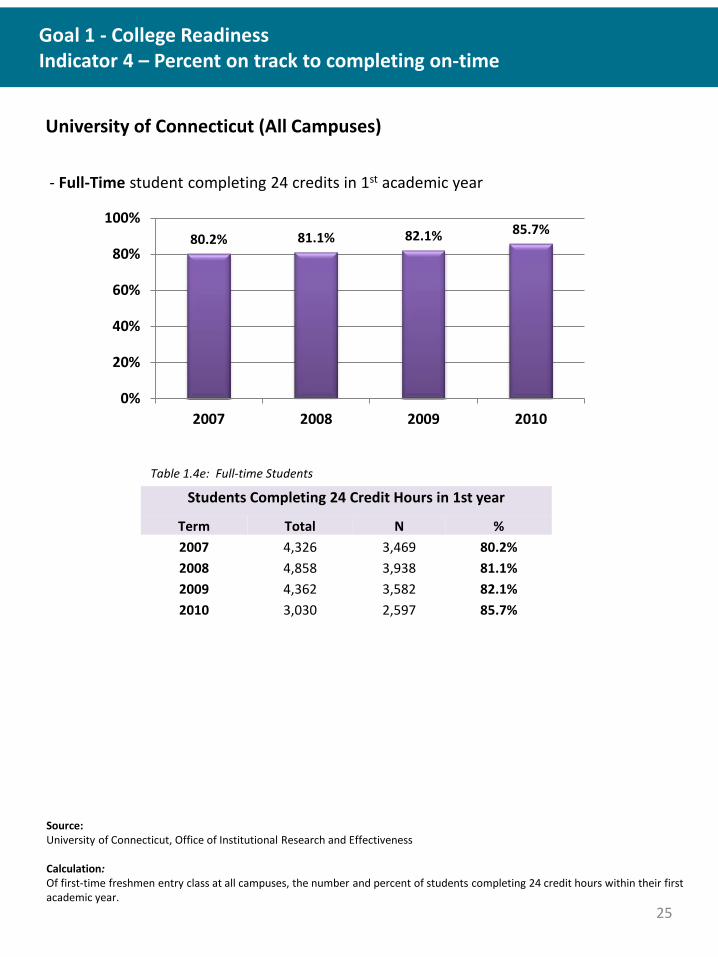
Goal 1 - College ReadinessIndicator 4 – Percent on track to completing on-time
University of Connecticut (All Campuses)
- Full-Time student completing 24 credits in 1st academic year
Source: University of Connecticut, Office of Institutional Research and Effectiveness
Calculation: Of first-time freshmen entry class at all campuses, the number and percent of students completing 24 credit hours within their first academic year.
Table 1.4e: Full-time Students
Students Completing 24 Credit Hours in 1st year
Term Total N %2007 4,326 3,469 80.2%2008 4,858 3,938 81.1%2009 4,362 3,582 82.1%2010 3,030 2,597 85.7%
80.2% 81.1% 82.1% 85.7%
0%
20%
40%
60%
80%
100%
2007 2008 2009 2010
25
Goal 1 - College ReadinessIndicator 4 – Percent on track to completing on-time
What does this mean?
Students are identified as full-time students if they are enrolled in 12 or more credits per term. This is the amount of credit hours students need to take in order to be eligible for financial aid. At this rate, a full-time student will be able to complete 24 credits in a year, while a part-time student can accumulate 12. This metric was developed to identify the volume of students who are on track to completing on-time; however, at this pace, students pursuing a Bachelor’s degree, which typically requires a minimum of 120 credit hours, will graduate in 6 years instead of 4 years – the popular expectation. Similarly, students pursuing an associate degree, which typically requires a minimum of 60 credit hours, will complete their degree in 3 years instead of 2.
This pace is 150% of normal program completion time, and although it may be a longer period of time than is expected by the general public, the vast majority of students pursuing post-secondary credentials in public institutions are spending additional years in school. Graduation rates are now commonly reported in terms of 150% and 200% of normal time.1
Tables 1.4a and 1.4b show that for both full-time and part-time community college students, the proportion of students maintaining academic momentum in their first year has risen consistently across campuses and the sector over the past five years. This improvement is important because students who complete their degrees earlier accumulate less debt and can enter the workforce or pursue additional schooling earlier which bolsters their future earning potential.
Rates for State University students are higher because these institutions are more likely to attract students who are interested in pursuing post-secondary education on a full-time basis. These students frequently live on campus furthering the opportunity for them to focus their time on academic pursuits. A majority of students attending a CT State University do so on a full-time basis; therefore, the rates of on-track part-time students need to be reviewed along with the actual count of those students. In many cases, the cohort of individuals attending part-time was less than 10 individuals. Rates based upon a cohort this small need to be used with caution.
There are no data for Charter Oak State College for this metric because Charter Oak does not enroll individuals who are first-time students.
Source: 1 U.S. Department of Education, Tracking Students to 200 Percent of Normal Time: Effect on Institutional Graduation Rates, December 2010 NCES 2011-221, http://nces.ed.gov/pubs2011/2011221.pdf
26
Graduate more people with the knowledge and skills to achieve their life and career goals.
Indicators:1. Completions per 100 FTE student by level 2. Graduation rate of full-time, first-time students in 150% of
normal time; community colleges only will include transfers out to another institution
3. Employment and earnings after graduation4. Time and credits to degree/certificate5. Transfers from 2-year to 4-year institutions per 100 FTE
Student Success
27
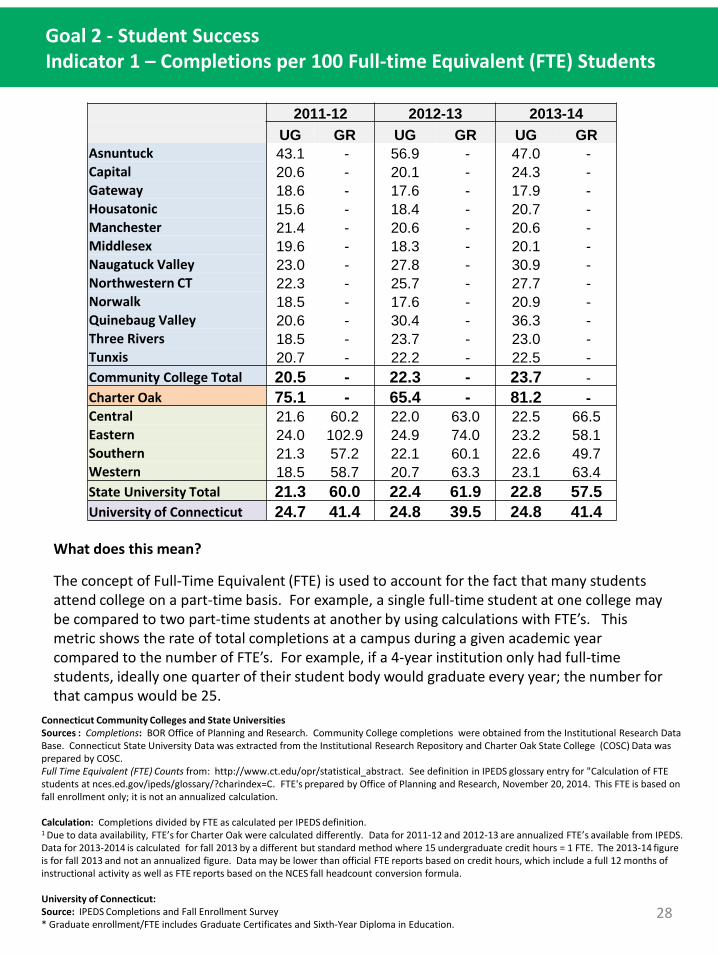
Connecticut Community Colleges and State UniversitiesSources : Completions: BOR Office of Planning and Research. Community College completions were obtained from the Institutional Research Data Base. Connecticut State University Data was extracted from the Institutional Research Repository and Charter Oak State College (COSC) Data was prepared by COSC. Full Time Equivalent (FTE) Counts from: http://www.ct.edu/opr/statistical_abstract. See definition in IPEDS glossary entry for "Calculation of FTE students at nces.ed.gov/ipeds/glossary/?charindex=C. FTE's prepared by Office of Planning and Research, November 20, 2014. This FTE is based on fall enrollment only; it is not an annualized calculation.
Calculation: Completions divided by FTE as calculated per IPEDS definition.1 Due to data availability, FTE’s for Charter Oak were calculated differently. Data for 2011-12 and 2012-13 are annualized FTE’s available from IPEDS. Data for 2013-2014 is calculated for fall 2013 by a different but standard method where 15 undergraduate credit hours = 1 FTE. The 2013-14 figure is for fall 2013 and not an annualized figure. Data may be lower than official FTE reports based on credit hours, which include a full 12 months of instructional activity as well as FTE reports based on the NCES fall headcount conversion formula.
University of Connecticut: Source: IPEDS Completions and Fall Enrollment Survey* Graduate enrollment/FTE includes Graduate Certificates and Sixth-Year Diploma in Education.
Goal 2 - Student SuccessIndicator 1 – Completions per 100 Full-time Equivalent (FTE) Students
What does this mean?
The concept of Full-Time Equivalent (FTE) is used to account for the fact that many students attend college on a part-time basis. For example, a single full-time student at one college may be compared to two part-time students at another by using calculations with FTE’s. This metric shows the rate of total completions at a campus during a given academic year compared to the number of FTE’s. For example, if a 4-year institution only had full-time students, ideally one quarter of their student body would graduate every year; the number for that campus would be 25.
2011-12 2012-13 2013-14UG GR UG GR UG GR
Asnuntuck 43.1 - 56.9 - 47.0 -Capital 20.6 - 20.1 - 24.3 -Gateway 18.6 - 17.6 - 17.9 -Housatonic 15.6 - 18.4 - 20.7 -Manchester 21.4 - 20.6 - 20.6 -Middlesex 19.6 - 18.3 - 20.1 -Naugatuck Valley 23.0 - 27.8 - 30.9 -Northwestern CT 22.3 - 25.7 - 27.7 -Norwalk 18.5 - 17.6 - 20.9 -Quinebaug Valley 20.6 - 30.4 - 36.3 -Three Rivers 18.5 - 23.7 - 23.0 -Tunxis 20.7 - 22.2 - 22.5 -Community College Total 20.5 - 22.3 - 23.7 -Charter Oak 75.1 - 65.4 - 81.2 -Central 21.6 60.2 22.0 63.0 22.5 66.5Eastern 24.0 102.9 24.9 74.0 23.2 58.1Southern 21.3 57.2 22.1 60.1 22.6 49.7Western 18.5 58.7 20.7 63.3 23.1 63.4State University Total 21.3 60.0 22.4 61.9 22.8 57.5University of Connecticut 24.7 41.4 24.8 39.5 24.8 41.4
28

Goal 2 - Student SuccessIndicator 2 – Graduation rate and transfer rate of full-time, first-time students in 150% of normal time
What does this mean?Completion rates for students attending a community college have historically been low. Individuals pursuing education through a community college may have additional interests or they may face challenges in life which are reflected in a longer path toward completion. Students may arrive at college lacking basic skills, they may be working simultaneously or balancing school with family life. Transportation and childcare issues may also hinder continuous progress.
Community colleges also enable students to pursue additional education at institutions that provide bachelor degrees. If students don’t complete a degree at a community college but transfer to another institution, those transfers are considered successes for the institution which helped prepare the students, and it is success for the students who are continuing to further their education. For these reasons, the Community College Success Rate includes both degree completers and a count of students who transfer out.
Connecticut Community Colleges – 3 Year Success Rates*
Source: Integrated Postsecondary Education Data system (IPEDS)
*Calculation: Connecticut Community Colleges: The numerator is the number of students from the adjusted cohort of first-time full-time degree or certificate seeking students who completed their program or who transferred out without an award within 150% of normal time; the denominator is the adjusted cohort. The resulting metric is the 150% completion rate reported to IPEDS.
First-time, Full-time Cohorts by Year of Entrance
31.3% 32.4% 33.5% 31.1% 31.8% 31.4% 32.7% 32.5%
0%
20%
40%
60%
80%
100%
2003 2004 2005 2006 2007 2008 2009 2010
2003 2004 2005 2006 2007 2008 2009 20105 year
changeAsnuntuck 49.2% 42.0% 40.0% 45.9% 50.0% 46.2% 56.3% 48.2% 2.3%Capital 30.6% 30.1% 28.4% 29.2% 30.5% 33.9% 29.7% 31.8% 2.5%Gateway 9.1% 31.0% 32.8% 26.1% 28.9% 28.7% 26.7% 29.1% 3.0%Housatonic 29.0% 28.3% 28.1% 9.7% 28.6% 15.4% 17.1% 28.0% 18.3%Manchester 38.8% 35.8% 37.6% 34.7% 36.5% 41.7% 40.2% 39.4% 4.8%Middlesex 39.1% 38.0% 41.0% 33.1% 33.6% 34.9% 40.7% 39.3% 6.2%Naugatuck Valley 31.4% 28.2% 28.4% 33.7% 31.4% 25.3% 31.3% 31.0% -2.7%Northwestern CT 35.6% 37.2% 42.3% 34.6% 35.0% 33.0% 31.6% 31.6% -3.0%Norwalk 32.7% 33.5% 30.0% 32.7% 29.3% 35.3% 31.6% 28.1% -4.7%Quinebaug Valley 34.6% 35.6% 34.7% 42.7% 35.8% 40.4% 33.1% 33.8% -8.9%Three Rivers 37.4% 32.2% 37.6% 31.9% 30.0% 30.1% 33.2% 29.3% -2.6%Tunxis 33.0% 30.4% 32.7% 33.7% 24.6% 25.9% 34.6% 32.3% -1.4%CCC Overall Success Rate 31.3% 32.4% 33.5% 31.1% 31.8% 31.4% 32.7% 32.5% 1.4%
29
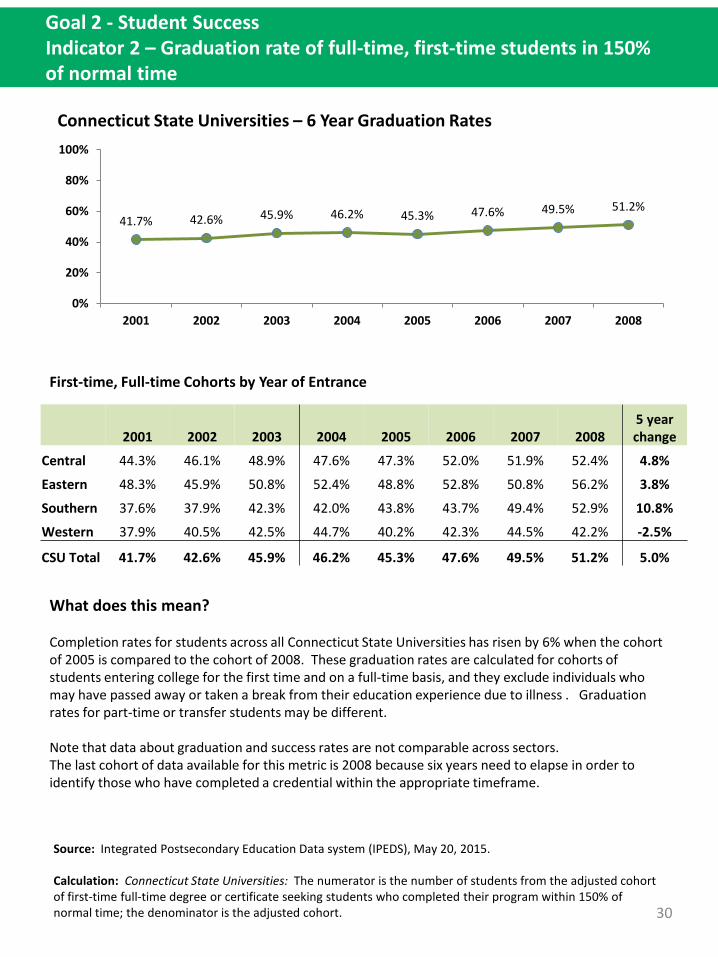
Goal 2 - Student SuccessIndicator 2 – Graduation rate of full-time, first-time students in 150% of normal time
What does this mean?
Completion rates for students across all Connecticut State Universities has risen by 6% when the cohort of 2005 is compared to the cohort of 2008. These graduation rates are calculated for cohorts of students entering college for the first time and on a full-time basis, and they exclude individuals who may have passed away or taken a break from their education experience due to illness . Graduation rates for part-time or transfer students may be different.
Note that data about graduation and success rates are not comparable across sectors.The last cohort of data available for this metric is 2008 because six years need to elapse in order to identify those who have completed a credential within the appropriate timeframe.
Source: Integrated Postsecondary Education Data system (IPEDS), May 20, 2015.
Calculation: Connecticut State Universities: The numerator is the number of students from the adjusted cohort of first-time full-time degree or certificate seeking students who completed their program within 150% of normal time; the denominator is the adjusted cohort.
Connecticut State Universities – 6 Year Graduation Rates
First-time, Full-time Cohorts by Year of Entrance
41.7% 42.6% 45.9% 46.2% 45.3% 47.6% 49.5% 51.2%
0%
20%
40%
60%
80%
100%
2001 2002 2003 2004 2005 2006 2007 2008
2001 2002 2003 2004 2005 2006 2007 20085 year change
Central 44.3% 46.1% 48.9% 47.6% 47.3% 52.0% 51.9% 52.4% 4.8%
Eastern 48.3% 45.9% 50.8% 52.4% 48.8% 52.8% 50.8% 56.2% 3.8%
Southern 37.6% 37.9% 42.3% 42.0% 43.8% 43.7% 49.4% 52.9% 10.8%
Western 37.9% 40.5% 42.5% 44.7% 40.2% 42.3% 44.5% 42.2% -2.5%
CSU Total 41.7% 42.6% 45.9% 46.2% 45.3% 47.6% 49.5% 51.2% 5.0%
30
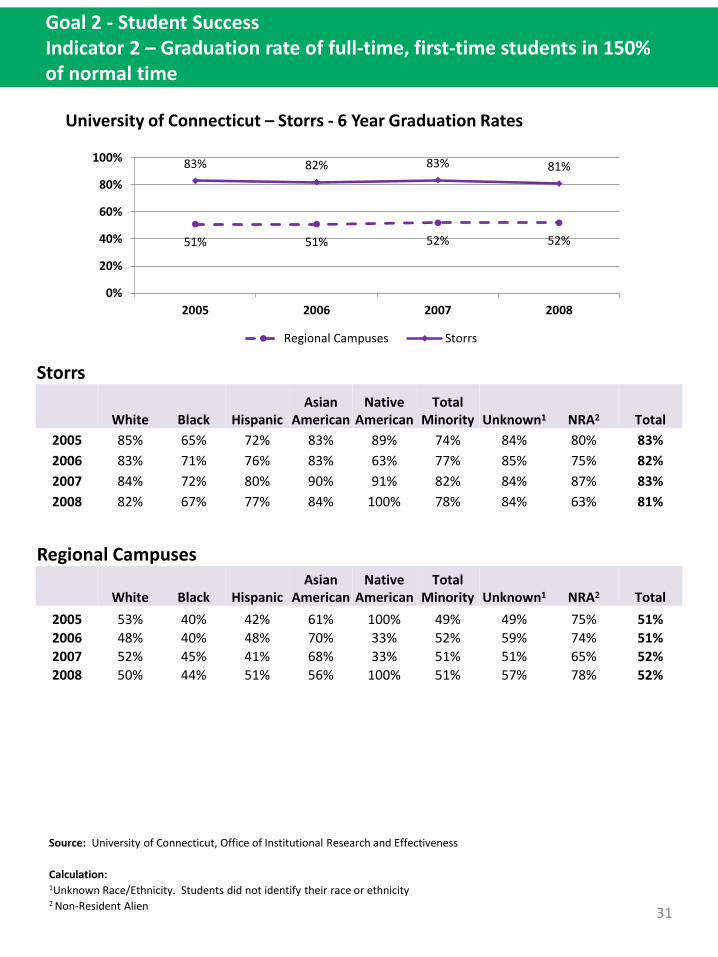
Goal 2 - Student SuccessIndicator 2 – Graduation rate of full-time, first-time students in 150% of normal time
Source: University of Connecticut, Office of Institutional Research and Effectiveness
Calculation: 1Unknown Race/Ethnicity. Students did not identify their race or ethnicity2 Non-Resident Alien
University of Connecticut – Storrs - 6 Year Graduation Rates
51% 51% 52% 52%
83% 82% 83% 81%
0%
20%
40%
60%
80%
100%
2005 2006 2007 2008
Regional Campuses Storrs
Storrs
White Black HispanicAsian
AmericanNative
AmericanTotal
Minority Unknown1 NRA2 Total2005 85% 65% 72% 83% 89% 74% 84% 80% 83%2006 83% 71% 76% 83% 63% 77% 85% 75% 82%2007 84% 72% 80% 90% 91% 82% 84% 87% 83%2008 82% 67% 77% 84% 100% 78% 84% 63% 81%
Regional Campuses
White Black HispanicAsian
AmericanNative
AmericanTotal
Minority Unknown1 NRA2 Total2005 53% 40% 42% 61% 100% 49% 49% 75% 51%2006 48% 40% 48% 70% 33% 52% 59% 74% 51%2007 52% 45% 41% 68% 33% 51% 51% 65% 52%2008 50% 44% 51% 56% 100% 51% 57% 78% 52%
31
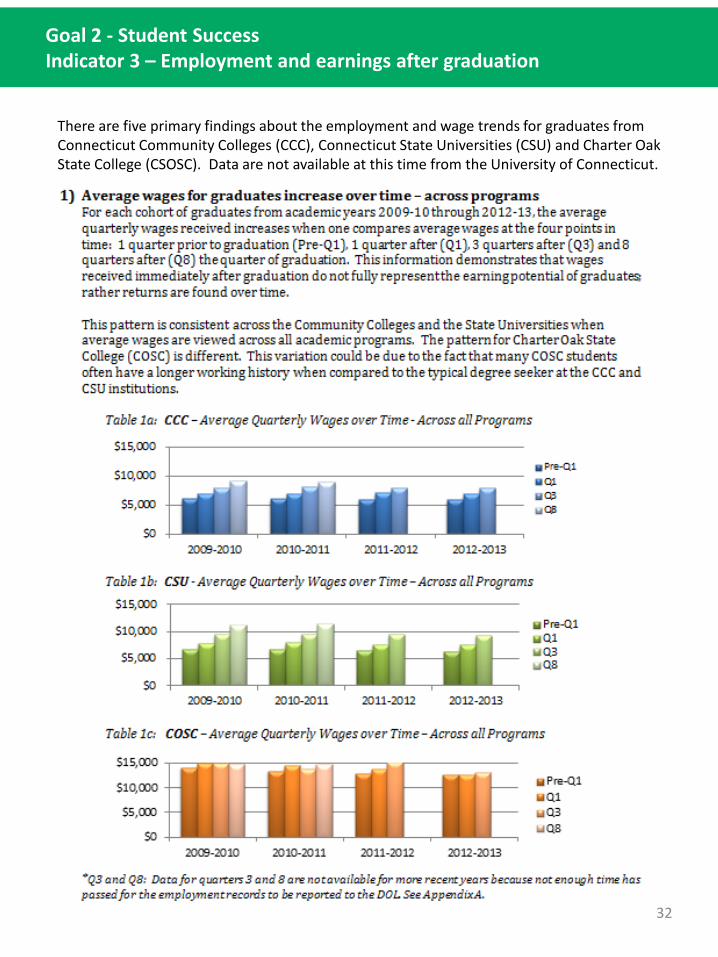
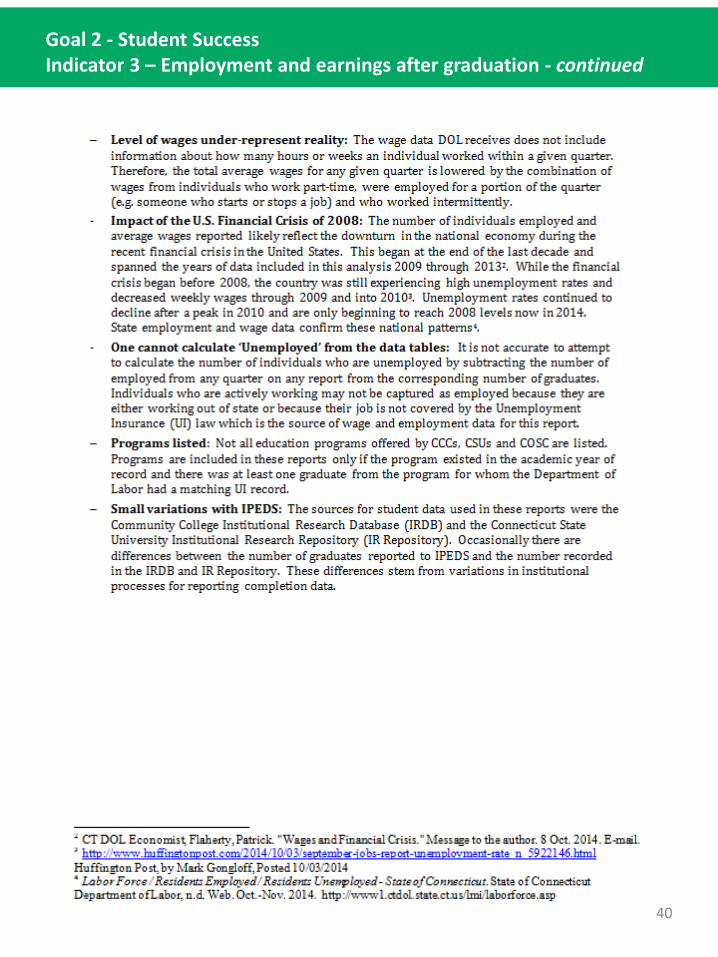
There are five primary findings about the employment and wage trends for graduates from Connecticut Community Colleges (CCC), Connecticut State Universities (CSU) and Charter Oak State College (CSOSC). Data are not available at this time from the University of Connecticut.
Goal 2 - Student SuccessIndicator 3 – Employment and earnings after graduation
32
Goal 2 - Student SuccessIndicator 3 – Employment and earnings after graduation - continued
33
Goal 2 - Student SuccessIndicator 3 – Employment and earnings after graduation - continued
34
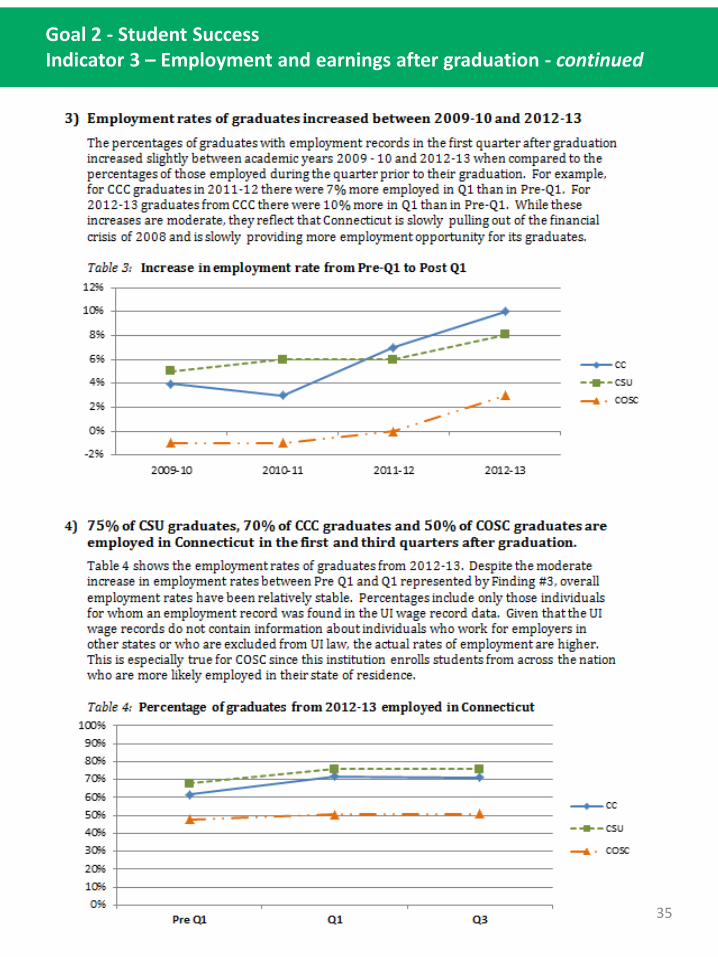
Goal 2 - Student SuccessIndicator 3 – Employment and earnings after graduation - continued
35

Goal 2 - Student SuccessIndicator 3 – Employment and earnings after graduation - continued
36
Goal 2 - Student SuccessIndicator 3 – Employment and earnings after graduation - continued
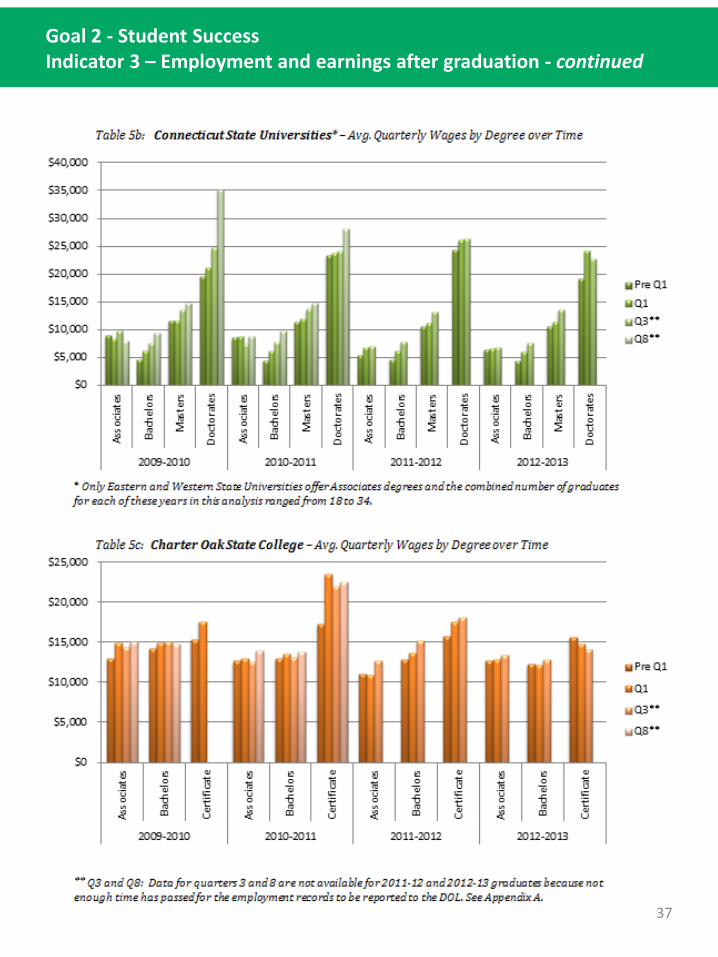
37
Goal 2 - Student SuccessIndicator 3 – Employment and earnings after graduation - continued
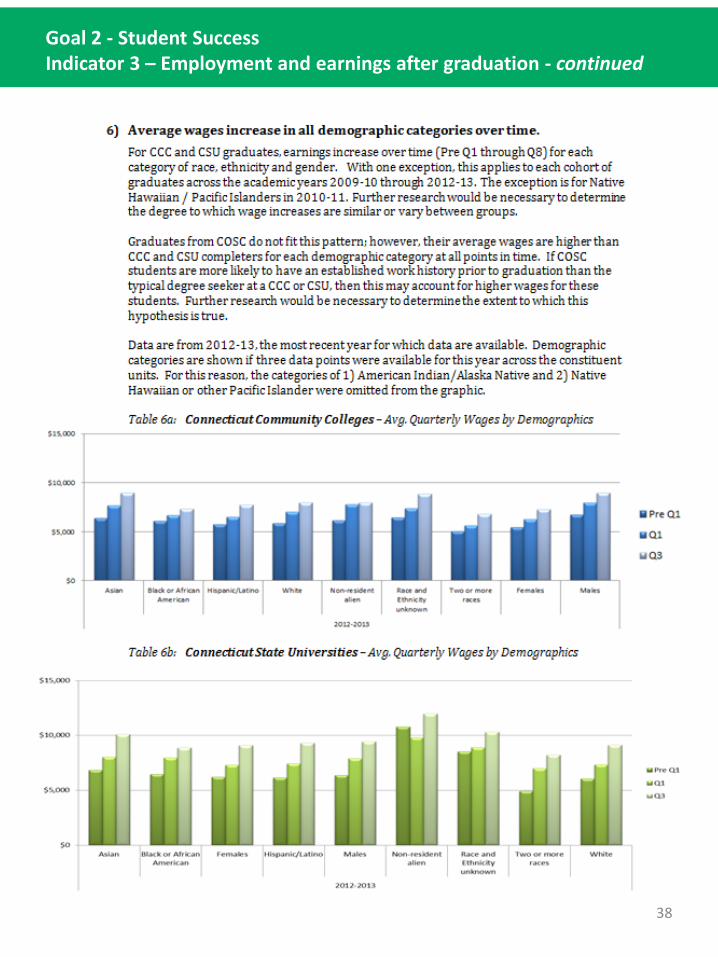
38
Goal 2 - Student SuccessIndicator 3 – Employment and earnings after graduation - continued
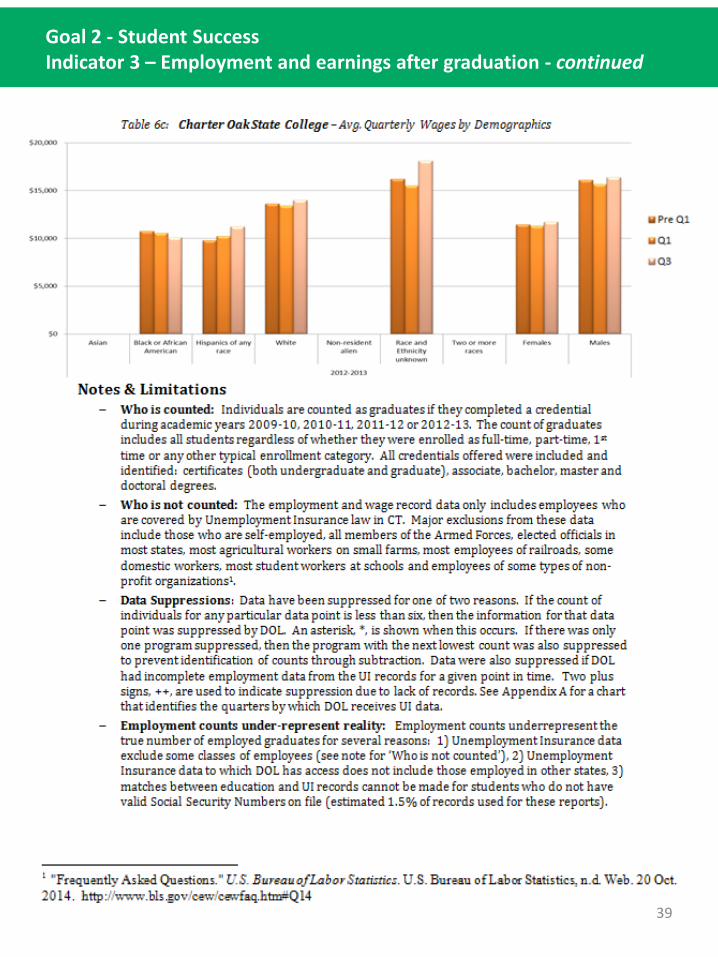
39
Goal 2 - Student SuccessIndicator 3 – Employment and earnings after graduation - continued
40
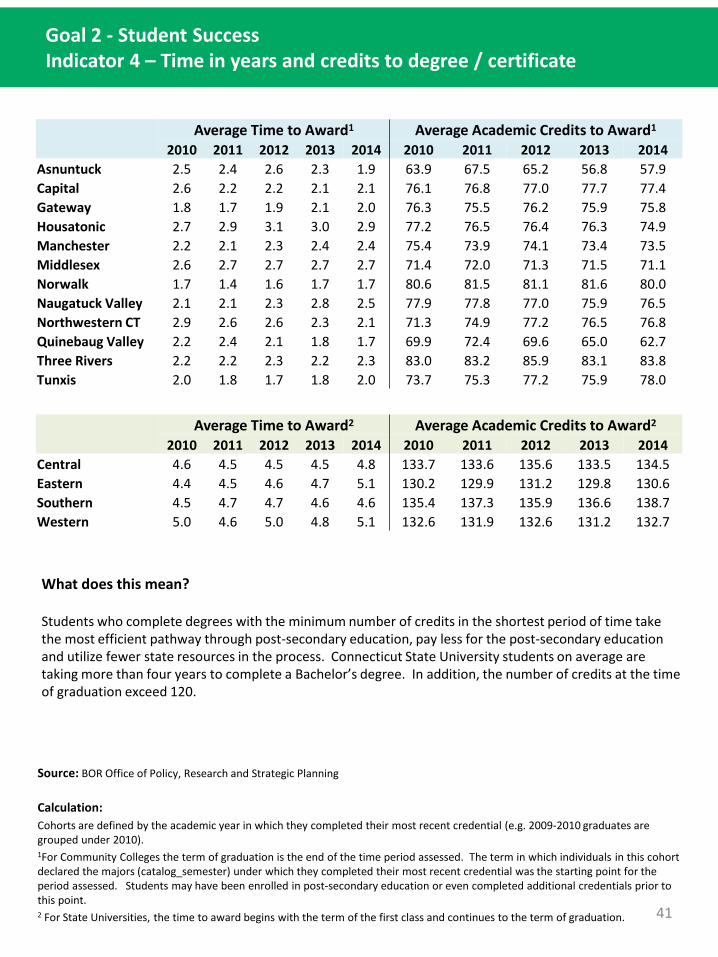
Goal 2 - Student SuccessIndicator 4 – Time in years and credits to degree / certificate
What does this mean?
Students who complete degrees with the minimum number of credits in the shortest period of time take the most efficient pathway through post-secondary education, pay less for the post-secondary education and utilize fewer state resources in the process. Connecticut State University students on average are taking more than four years to complete a Bachelor’s degree. In addition, the number of credits at the time of graduation exceed 120.
Source: BOR Office of Policy, Research and Strategic Planning
Calculation:Cohorts are defined by the academic year in which they completed their most recent credential (e.g. 2009-2010 graduates are grouped under 2010). 1For Community Colleges the term of graduation is the end of the time period assessed. The term in which individuals in this cohort declared the majors (catalog_semester) under which they completed their most recent credential was the starting point for theperiod assessed. Students may have been enrolled in post-secondary education or even completed additional credentials prior tothis point.2 For State Universities, the time to award begins with the term of the first class and continues to the term of graduation.
Average Time to Award1 Average Academic Credits to Award1
2010 2011 2012 2013 2014 2010 2011 2012 2013 2014Asnuntuck 2.5 2.4 2.6 2.3 1.9 63.9 67.5 65.2 56.8 57.9 Capital 2.6 2.2 2.2 2.1 2.1 76.1 76.8 77.0 77.7 77.4 Gateway 1.8 1.7 1.9 2.1 2.0 76.3 75.5 76.2 75.9 75.8 Housatonic 2.7 2.9 3.1 3.0 2.9 77.2 76.5 76.4 76.3 74.9 Manchester 2.2 2.1 2.3 2.4 2.4 75.4 73.9 74.1 73.4 73.5 Middlesex 2.6 2.7 2.7 2.7 2.7 71.4 72.0 71.3 71.5 71.1 Norwalk 1.7 1.4 1.6 1.7 1.7 80.6 81.5 81.1 81.6 80.0 Naugatuck Valley 2.1 2.1 2.3 2.8 2.5 77.9 77.8 77.0 75.9 76.5 Northwestern CT 2.9 2.6 2.6 2.3 2.1 71.3 74.9 77.2 76.5 76.8 Quinebaug Valley 2.2 2.4 2.1 1.8 1.7 69.9 72.4 69.6 65.0 62.7 Three Rivers 2.2 2.2 2.3 2.2 2.3 83.0 83.2 85.9 83.1 83.8 Tunxis 2.0 1.8 1.7 1.8 2.0 73.7 75.3 77.2 75.9 78.0
Average Time to Award2 Average Academic Credits to Award2
2010 2011 2012 2013 2014 2010 2011 2012 2013 2014Central 4.6 4.5 4.5 4.5 4.8 133.7 133.6 135.6 133.5 134.5 Eastern 4.4 4.5 4.6 4.7 5.1 130.2 129.9 131.2 129.8 130.6 Southern 4.5 4.7 4.7 4.6 4.6 135.4 137.3 135.9 136.6 138.7 Western 5.0 4.6 5.0 4.8 5.1 132.6 131.9 132.6 131.2 132.7
41
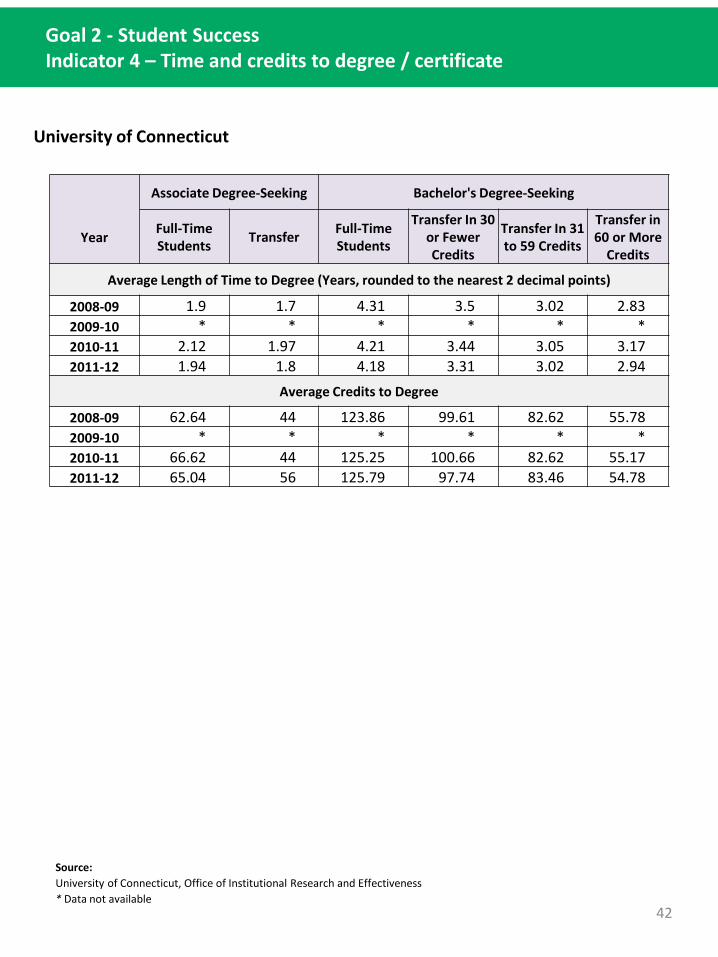
Goal 2 - Student SuccessIndicator 4 – Time and credits to degree / certificate
University of Connecticut
Source: University of Connecticut, Office of Institutional Research and Effectiveness* Data not available
Year
Associate Degree-Seeking Bachelor's Degree-Seeking
Full-Time Students Transfer Full-Time
Students
Transfer In 30 or Fewer Credits
Transfer In 31 to 59 Credits
Transfer in 60 or More
Credits
Average Length of Time to Degree (Years, rounded to the nearest 2 decimal points)
2008-09 1.9 1.7 4.31 3.5 3.02 2.832009-10 * * * * * *2010-11 2.12 1.97 4.21 3.44 3.05 3.172011-12 1.94 1.8 4.18 3.31 3.02 2.94
Average Credits to Degree
2008-09 62.64 44 123.86 99.61 82.62 55.782009-10 * * * * * *2010-11 66.62 44 125.25 100.66 82.62 55.172011-12 65.04 56 125.79 97.74 83.46 54.78
42
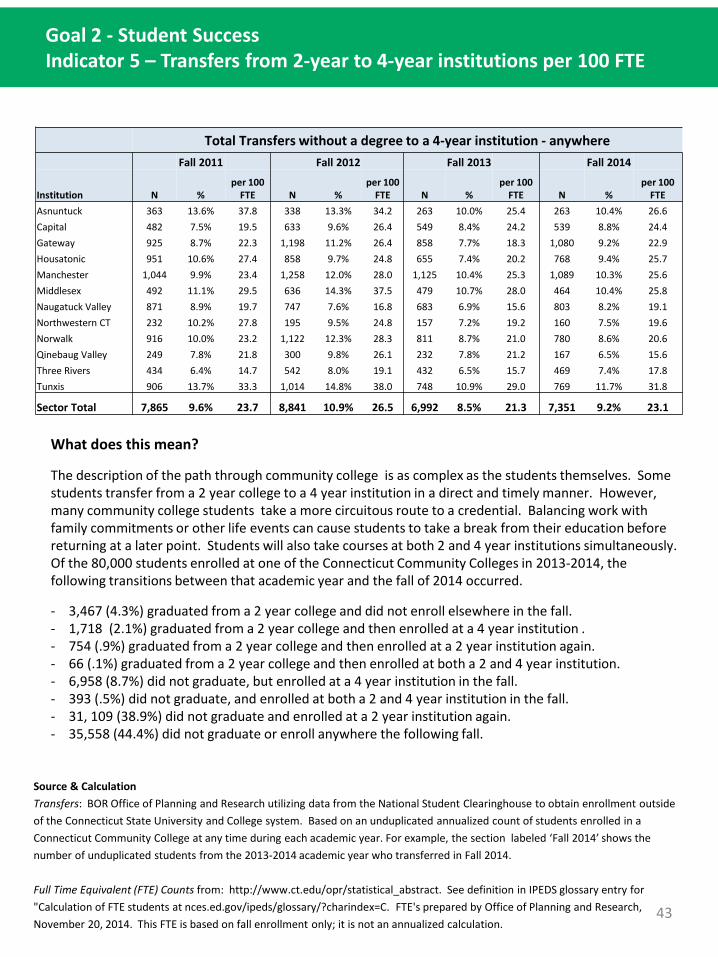
Goal 2 - Student SuccessIndicator 5 – Transfers from 2-year to 4-year institutions per 100 FTE
Source & Calculation Transfers: BOR Office of Planning and Research utilizing data from the National Student Clearinghouse to obtain enrollment outside of the Connecticut State University and College system. Based on an unduplicated annualized count of students enrolled in a Connecticut Community College at any time during each academic year. For example, the section labeled ‘Fall 2014’ shows the number of unduplicated students from the 2013-2014 academic year who transferred in Fall 2014.
Full Time Equivalent (FTE) Counts from: http://www.ct.edu/opr/statistical_abstract. See definition in IPEDS glossary entry for "Calculation of FTE students at nces.ed.gov/ipeds/glossary/?charindex=C. FTE's prepared by Office of Planning and Research, November 20, 2014. This FTE is based on fall enrollment only; it is not an annualized calculation.
What does this mean?
The description of the path through community college is as complex as the students themselves. Some students transfer from a 2 year college to a 4 year institution in a direct and timely manner. However, many community college students take a more circuitous route to a credential. Balancing work with family commitments or other life events can cause students to take a break from their education before returning at a later point. Students will also take courses at both 2 and 4 year institutions simultaneously. Of the 80,000 students enrolled at one of the Connecticut Community Colleges in 2013-2014, the following transitions between that academic year and the fall of 2014 occurred.
- 3,467 (4.3%) graduated from a 2 year college and did not enroll elsewhere in the fall.- 1,718 (2.1%) graduated from a 2 year college and then enrolled at a 4 year institution .- 754 (.9%) graduated from a 2 year college and then enrolled at a 2 year institution again.- 66 (.1%) graduated from a 2 year college and then enrolled at both a 2 and 4 year institution.- 6,958 (8.7%) did not graduate, but enrolled at a 4 year institution in the fall.- 393 (.5%) did not graduate, and enrolled at both a 2 and 4 year institution in the fall.- 31, 109 (38.9%) did not graduate and enrolled at a 2 year institution again.- 35,558 (44.4%) did not graduate or enroll anywhere the following fall.
Total Transfers without a degree to a 4-year institution - anywhere Fall 2011 Fall 2012 Fall 2013 Fall 2014
Institution N %per 100
FTE N %per 100
FTE N %per 100
FTE N %per 100
FTEAsnuntuck 363 13.6% 37.8 338 13.3% 34.2 263 10.0% 25.4 263 10.4% 26.6Capital 482 7.5% 19.5 633 9.6% 26.4 549 8.4% 24.2 539 8.8% 24.4Gateway 925 8.7% 22.3 1,198 11.2% 26.4 858 7.7% 18.3 1,080 9.2% 22.9Housatonic 951 10.6% 27.4 858 9.7% 24.8 655 7.4% 20.2 768 9.4% 25.7Manchester 1,044 9.9% 23.4 1,258 12.0% 28.0 1,125 10.4% 25.3 1,089 10.3% 25.6Middlesex 492 11.1% 29.5 636 14.3% 37.5 479 10.7% 28.0 464 10.4% 25.8Naugatuck Valley 871 8.9% 19.7 747 7.6% 16.8 683 6.9% 15.6 803 8.2% 19.1Northwestern CT 232 10.2% 27.8 195 9.5% 24.8 157 7.2% 19.2 160 7.5% 19.6Norwalk 916 10.0% 23.2 1,122 12.3% 28.3 811 8.7% 21.0 780 8.6% 20.6Qinebaug Valley 249 7.8% 21.8 300 9.8% 26.1 232 7.8% 21.2 167 6.5% 15.6Three Rivers 434 6.4% 14.7 542 8.0% 19.1 432 6.5% 15.7 469 7.4% 17.8Tunxis 906 13.7% 33.3 1,014 14.8% 38.0 748 10.9% 29.0 769 11.7% 31.8
Sector Total 7,865 9.6% 23.7 8,841 10.9% 26.5 6,992 8.5% 21.3 7,351 9.2% 23.1
43
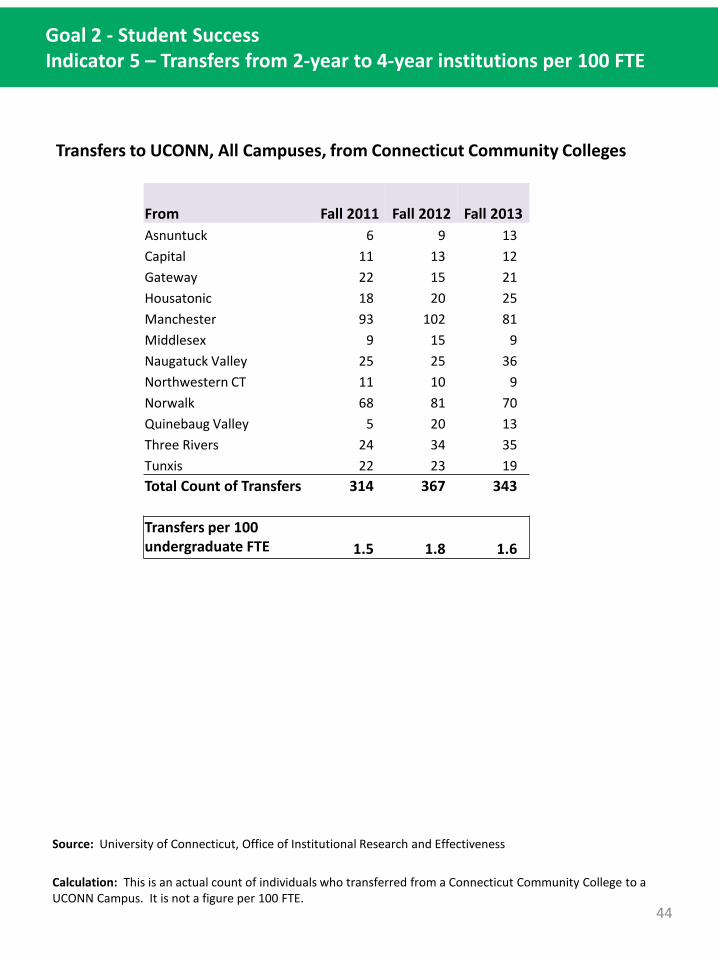
Goal 2 - Student SuccessIndicator 5 – Transfers from 2-year to 4-year institutions per 100 FTE
Transfers to UCONN, All Campuses, from Connecticut Community Colleges
Source: University of Connecticut, Office of Institutional Research and Effectiveness
Calculation: This is an actual count of individuals who transferred from a Connecticut Community College to a UCONN Campus. It is not a figure per 100 FTE.
From Fall 2011 Fall 2012 Fall 2013Asnuntuck 6 9 13Capital 11 13 12Gateway 22 15 21Housatonic 18 20 25Manchester 93 102 81Middlesex 9 15 9Naugatuck Valley 25 25 36Northwestern CT 11 10 9Norwalk 68 81 70Quinebaug Valley 5 20 13Three Rivers 24 34 35Tunxis 22 23 19Total Count of Transfers 314 367 343
Transfers per 100 undergraduate FTE 1.5 1.8 1.6
44
Affordability & Sustainability
Maximize access to higher education for students from all economic backgrounds
Indicators:1. Tuition and fees as % of median household income2. Percent of undergraduates receiving federal loan aid3. State and local appropriations per completion and per 100 FTE4. Education and related expenses per completion and per FTE
enrollment5. Instructional expenditures as a percent of Education & Related
spending
45
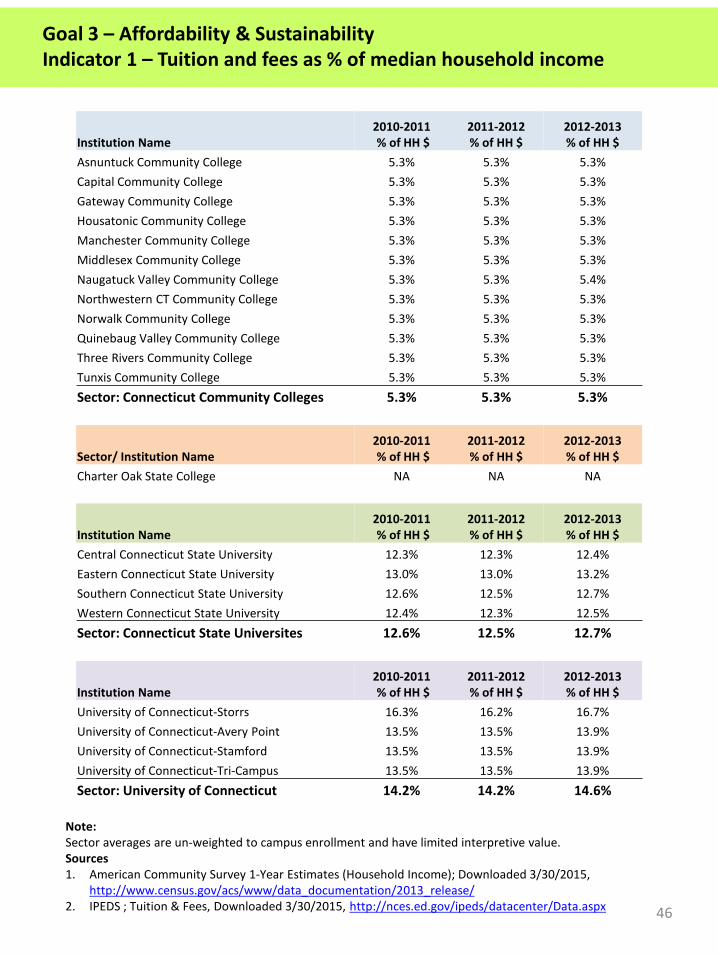
Goal 3 – Affordability & SustainabilityIndicator 1 – Tuition and fees as % of median household income
Note:Sector averages are un-weighted to campus enrollment and have limited interpretive value.Sources1. American Community Survey 1-Year Estimates (Household Income); Downloaded 3/30/2015,
http://www.census.gov/acs/www/data_documentation/2013_release/2. IPEDS ; Tuition & Fees, Downloaded 3/30/2015, http://nces.ed.gov/ipeds/datacenter/Data.aspx
Institution Name2010-2011% of HH $
2011-2012% of HH $
2012-2013% of HH $
Asnuntuck Community College 5.3% 5.3% 5.3%Capital Community College 5.3% 5.3% 5.3%Gateway Community College 5.3% 5.3% 5.3%Housatonic Community College 5.3% 5.3% 5.3%Manchester Community College 5.3% 5.3% 5.3%Middlesex Community College 5.3% 5.3% 5.3%Naugatuck Valley Community College 5.3% 5.3% 5.4%Northwestern CT Community College 5.3% 5.3% 5.3%Norwalk Community College 5.3% 5.3% 5.3%Quinebaug Valley Community College 5.3% 5.3% 5.3%Three Rivers Community College 5.3% 5.3% 5.3%Tunxis Community College 5.3% 5.3% 5.3%Sector: Connecticut Community Colleges 5.3% 5.3% 5.3%
Sector/ Institution Name2010-2011% of HH $
2011-2012% of HH $
2012-2013% of HH $
Charter Oak State College NA NA NA
Institution Name2010-2011% of HH $
2011-2012% of HH $
2012-2013% of HH $
Central Connecticut State University 12.3% 12.3% 12.4%Eastern Connecticut State University 13.0% 13.0% 13.2%Southern Connecticut State University 12.6% 12.5% 12.7%Western Connecticut State University 12.4% 12.3% 12.5%Sector: Connecticut State Universites 12.6% 12.5% 12.7%
Institution Name2010-2011% of HH $
2011-2012% of HH $
2012-2013% of HH $
University of Connecticut-Storrs 16.3% 16.2% 16.7%University of Connecticut-Avery Point 13.5% 13.5% 13.9%University of Connecticut-Stamford 13.5% 13.5% 13.9%University of Connecticut-Tri-Campus 13.5% 13.5% 13.9%Sector: University of Connecticut 14.2% 14.2% 14.6%
46
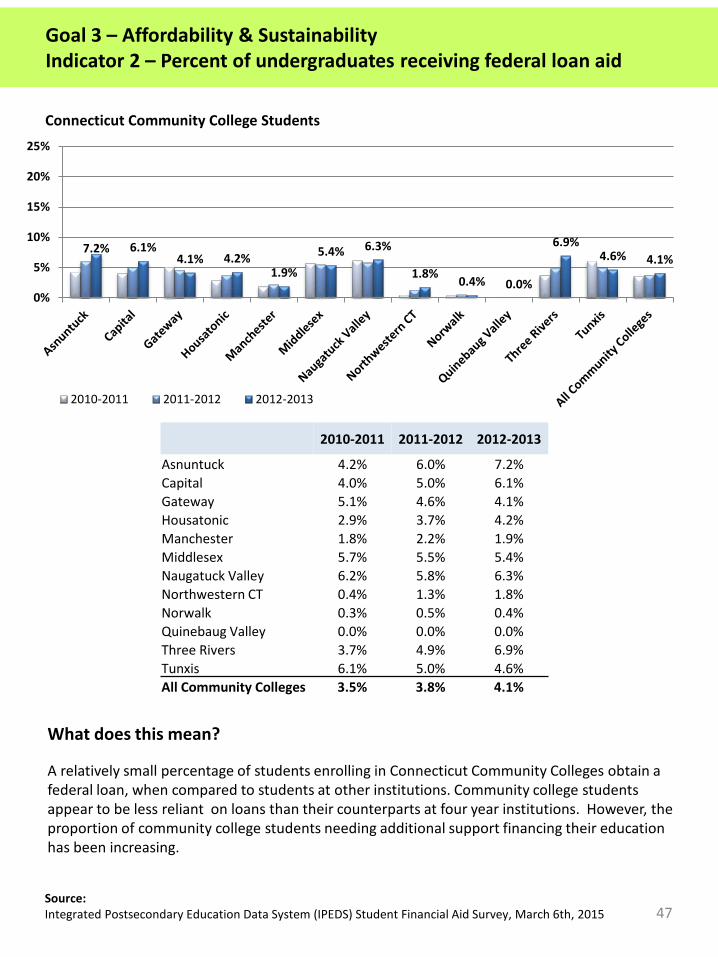
Goal 3 – Affordability & SustainabilityIndicator 2 – Percent of undergraduates receiving federal loan aid
Connecticut Community College Students
7.2% 6.1%4.1% 4.2%
1.9%
5.4% 6.3%
1.8% 0.4% 0.0%
6.9%4.6% 4.1%
0%
5%
10%
15%
20%
25%
2010-2011 2011-2012 2012-2013
What does this mean?
A relatively small percentage of students enrolling in Connecticut Community Colleges obtain a federal loan, when compared to students at other institutions. Community college students appear to be less reliant on loans than their counterparts at four year institutions. However, the proportion of community college students needing additional support financing their education has been increasing.
2010-2011 2011-2012 2012-2013
Asnuntuck 4.2% 6.0% 7.2%Capital 4.0% 5.0% 6.1%Gateway 5.1% 4.6% 4.1%Housatonic 2.9% 3.7% 4.2%Manchester 1.8% 2.2% 1.9%Middlesex 5.7% 5.5% 5.4%Naugatuck Valley 6.2% 5.8% 6.3%Northwestern CT 0.4% 1.3% 1.8%Norwalk 0.3% 0.5% 0.4%Quinebaug Valley 0.0% 0.0% 0.0%Three Rivers 3.7% 4.9% 6.9%Tunxis 6.1% 5.0% 4.6%All Community Colleges 3.5% 3.8% 4.1%
Source:Integrated Postsecondary Education Data System (IPEDS) Student Financial Aid Survey, March 6th, 2015 47
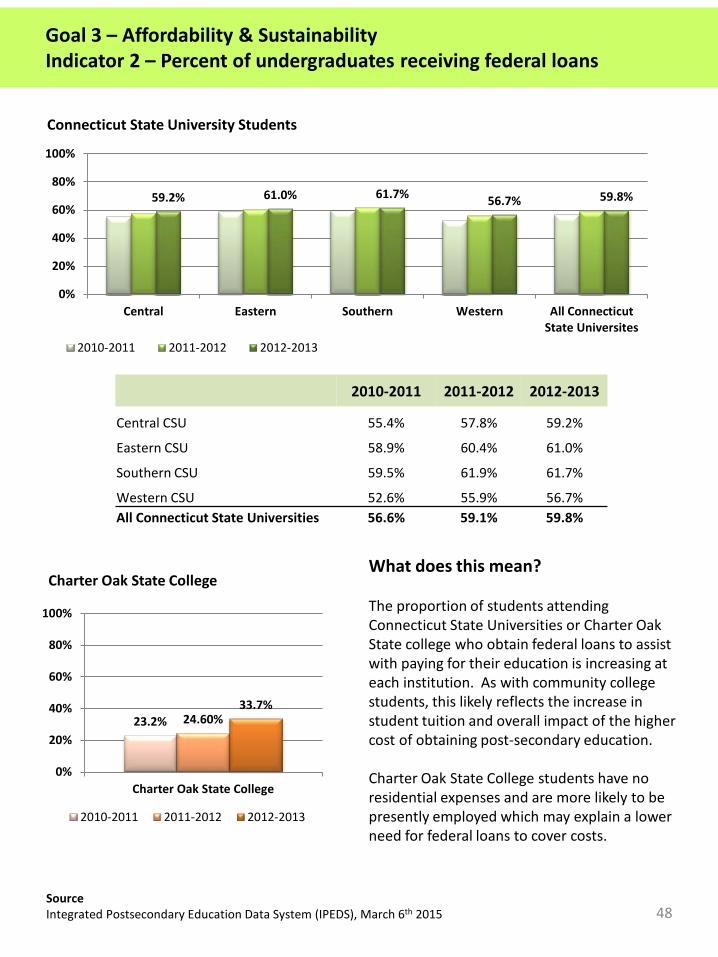
Goal 3 – Affordability & SustainabilityIndicator 2 – Percent of undergraduates receiving federal loans
59.2% 61.0% 61.7% 56.7% 59.8%
0%
20%
40%
60%
80%
100%
Central Eastern Southern Western All ConnecticutState Universites
2010-2011 2011-2012 2012-2013
Connecticut State University Students
Charter Oak State College
23.2% 24.60%33.7%
0%
20%
40%
60%
80%
100%
Charter Oak State College
2010-2011 2011-2012 2012-2013
SourceIntegrated Postsecondary Education Data System (IPEDS), March 6th 2015
What does this mean?
The proportion of students attending Connecticut State Universities or Charter Oak State college who obtain federal loans to assist with paying for their education is increasing at each institution. As with community college students, this likely reflects the increase in student tuition and overall impact of the higher cost of obtaining post-secondary education.
Charter Oak State College students have no residential expenses and are more likely to be presently employed which may explain a lower need for federal loans to cover costs.
2010-2011 2011-2012 2012-2013
Central CSU 55.4% 57.8% 59.2%
Eastern CSU 58.9% 60.4% 61.0%
Southern CSU 59.5% 61.9% 61.7%
Western CSU 52.6% 55.9% 56.7%All Connecticut State Universities 56.6% 59.1% 59.8%
48
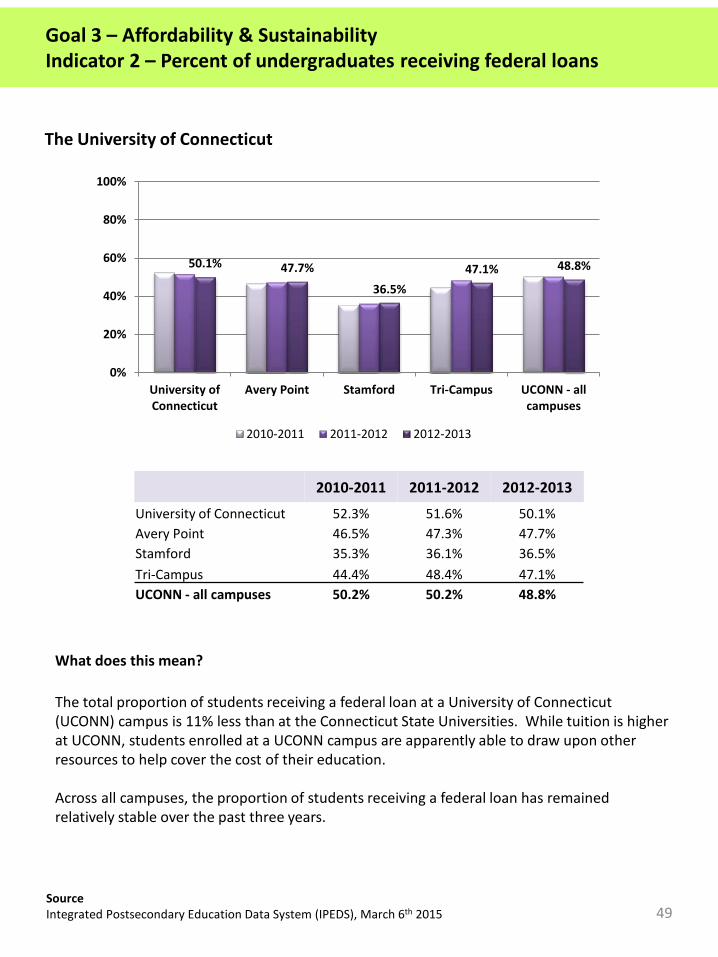
Goal 3 – Affordability & SustainabilityIndicator 2 – Percent of undergraduates receiving federal loans
What does this mean?
The total proportion of students receiving a federal loan at a University of Connecticut (UCONN) campus is 11% less than at the Connecticut State Universities. While tuition is higher at UCONN, students enrolled at a UCONN campus are apparently able to draw upon other resources to help cover the cost of their education.
Across all campuses, the proportion of students receiving a federal loan has remained relatively stable over the past three years.
The University of Connecticut
50.1% 47.7%
36.5%47.1% 48.8%
0%
20%
40%
60%
80%
100%
University ofConnecticut
Avery Point Stamford Tri-Campus UCONN - allcampuses
2010-2011 2011-2012 2012-2013
SourceIntegrated Postsecondary Education Data System (IPEDS), March 6th 2015
2010-2011 2011-2012 2012-2013
University of Connecticut 52.3% 51.6% 50.1%Avery Point 46.5% 47.3% 47.7%Stamford 35.3% 36.1% 36.5%Tri-Campus 44.4% 48.4% 47.1%UCONN - all campuses 50.2% 50.2% 48.8%
49
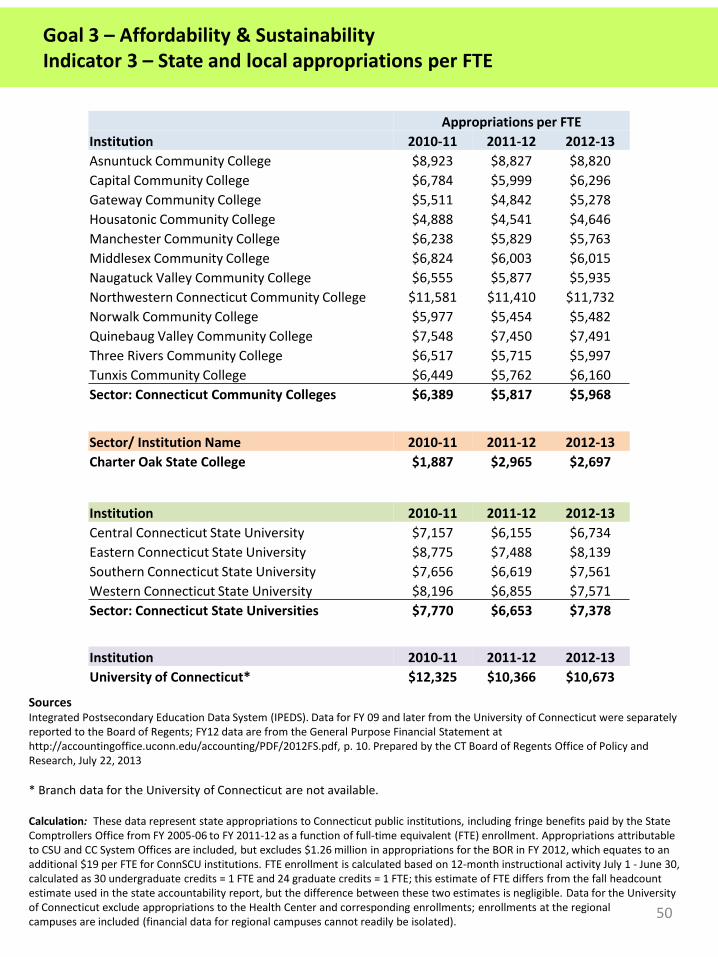
Goal 3 – Affordability & SustainabilityIndicator 3 – State and local appropriations per FTE
SourcesIntegrated Postsecondary Education Data System (IPEDS). Data for FY 09 and later from the University of Connecticut were separately reported to the Board of Regents; FY12 data are from the General Purpose Financial Statement at http://accountingoffice.uconn.edu/accounting/PDF/2012FS.pdf, p. 10. Prepared by the CT Board of Regents Office of Policy and Research, July 22, 2013
* Branch data for the University of Connecticut are not available.
Calculation: These data represent state appropriations to Connecticut public institutions, including fringe benefits paid by the State Comptrollers Office from FY 2005-06 to FY 2011-12 as a function of full-time equivalent (FTE) enrollment. Appropriations attributable to CSU and CC System Offices are included, but excludes $1.26 million in appropriations for the BOR in FY 2012, which equates to an additional $19 per FTE for ConnSCU institutions. FTE enrollment is calculated based on 12-month instructional activity July 1 - June 30, calculated as 30 undergraduate credits = 1 FTE and 24 graduate credits = 1 FTE; this estimate of FTE differs from the fall headcount estimate used in the state accountability report, but the difference between these two estimates is negligible. Data for the University of Connecticut exclude appropriations to the Health Center and corresponding enrollments; enrollments at the regional campuses are included (financial data for regional campuses cannot readily be isolated).
Appropriations per FTEInstitution 2010-11 2011-12 2012-13Asnuntuck Community College $8,923 $8,827 $8,820Capital Community College $6,784 $5,999 $6,296Gateway Community College $5,511 $4,842 $5,278Housatonic Community College $4,888 $4,541 $4,646Manchester Community College $6,238 $5,829 $5,763Middlesex Community College $6,824 $6,003 $6,015Naugatuck Valley Community College $6,555 $5,877 $5,935Northwestern Connecticut Community College $11,581 $11,410 $11,732Norwalk Community College $5,977 $5,454 $5,482Quinebaug Valley Community College $7,548 $7,450 $7,491Three Rivers Community College $6,517 $5,715 $5,997Tunxis Community College $6,449 $5,762 $6,160Sector: Connecticut Community Colleges $6,389 $5,817 $5,968
Sector/ Institution Name 2010-11 2011-12 2012-13Charter Oak State College $1,887 $2,965 $2,697
Institution 2010-11 2011-12 2012-13Central Connecticut State University $7,157 $6,155 $6,734Eastern Connecticut State University $8,775 $7,488 $8,139Southern Connecticut State University $7,656 $6,619 $7,561Western Connecticut State University $8,196 $6,855 $7,571Sector: Connecticut State Universities $7,770 $6,653 $7,378
Institution 2010-11 2011-12 2012-13University of Connecticut* $12,325 $10,366 $10,673
50
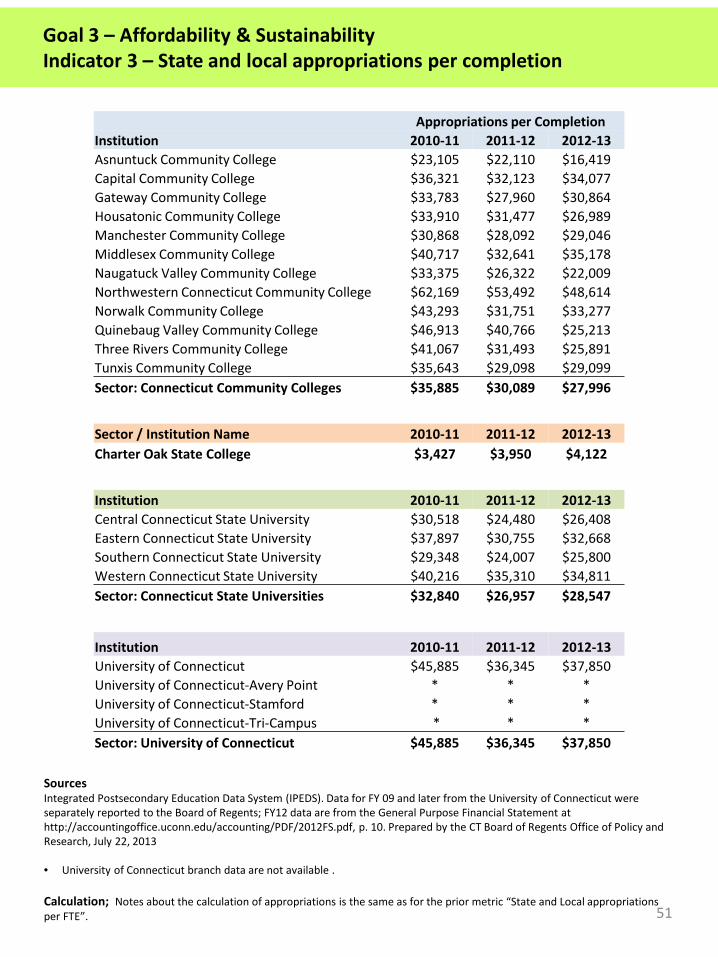
Goal 3 – Affordability & SustainabilityIndicator 3 – State and local appropriations per completion
SourcesIntegrated Postsecondary Education Data System (IPEDS). Data for FY 09 and later from the University of Connecticut were separately reported to the Board of Regents; FY12 data are from the General Purpose Financial Statement at http://accountingoffice.uconn.edu/accounting/PDF/2012FS.pdf, p. 10. Prepared by the CT Board of Regents Office of Policy and Research, July 22, 2013
• University of Connecticut branch data are not available .
Calculation; Notes about the calculation of appropriations is the same as for the prior metric “State and Local appropriations per FTE”.
Appropriations per CompletionInstitution 2010-11 2011-12 2012-13Asnuntuck Community College $23,105 $22,110 $16,419Capital Community College $36,321 $32,123 $34,077Gateway Community College $33,783 $27,960 $30,864Housatonic Community College $33,910 $31,477 $26,989Manchester Community College $30,868 $28,092 $29,046Middlesex Community College $40,717 $32,641 $35,178Naugatuck Valley Community College $33,375 $26,322 $22,009Northwestern Connecticut Community College $62,169 $53,492 $48,614Norwalk Community College $43,293 $31,751 $33,277Quinebaug Valley Community College $46,913 $40,766 $25,213Three Rivers Community College $41,067 $31,493 $25,891Tunxis Community College $35,643 $29,098 $29,099Sector: Connecticut Community Colleges $35,885 $30,089 $27,996
Sector / Institution Name 2010-11 2011-12 2012-13Charter Oak State College $3,427 $3,950 $4,122
Institution 2010-11 2011-12 2012-13Central Connecticut State University $30,518 $24,480 $26,408Eastern Connecticut State University $37,897 $30,755 $32,668Southern Connecticut State University $29,348 $24,007 $25,800Western Connecticut State University $40,216 $35,310 $34,811Sector: Connecticut State Universities $32,840 $26,957 $28,547
Institution 2010-11 2011-12 2012-13University of Connecticut $45,885 $36,345 $37,850University of Connecticut-Avery Point * * *University of Connecticut-Stamford * * *University of Connecticut-Tri-Campus * * *Sector: University of Connecticut $45,885 $36,345 $37,850
51
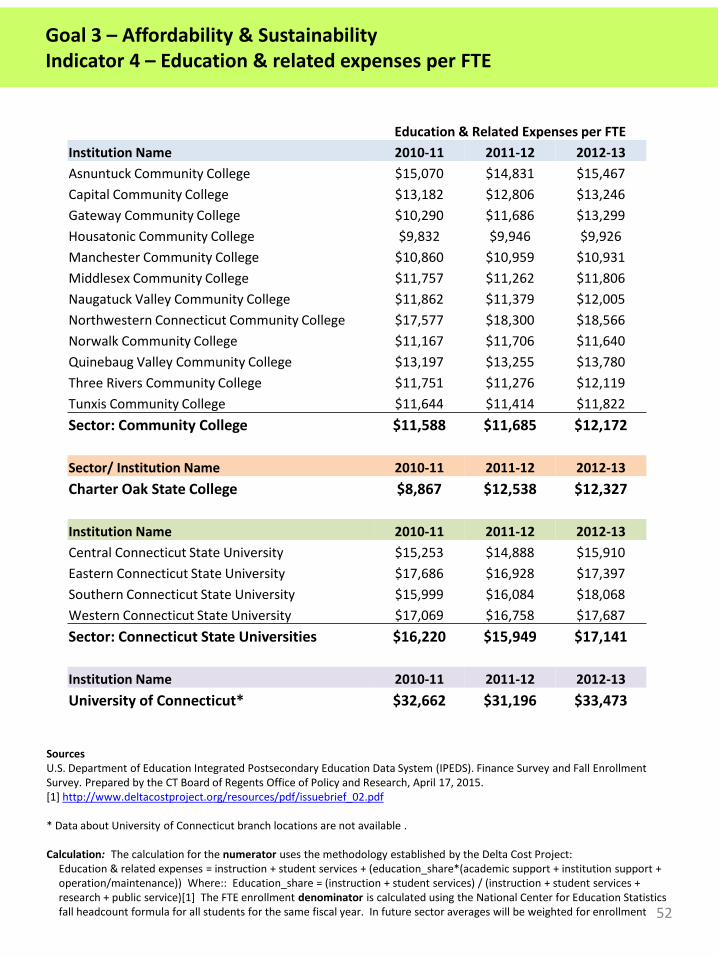
Goal 3 – Affordability & SustainabilityIndicator 4 – Education & related expenses per FTE
SourcesU.S. Department of Education Integrated Postsecondary Education Data System (IPEDS). Finance Survey and Fall Enrollment Survey. Prepared by the CT Board of Regents Office of Policy and Research, April 17, 2015.[1] http://www.deltacostproject.org/resources/pdf/issuebrief_02.pdf
* Data about University of Connecticut branch locations are not available .
Calculation: The calculation for the numerator uses the methodology established by the Delta Cost Project:Education & related expenses = instruction + student services + (education_share*(academic support + institution support + operation/maintenance)) Where:: Education_share = (instruction + student services) / (instruction + student services + research + public service)[1] The FTE enrollment denominator is calculated using the National Center for Education Statistics fall headcount formula for all students for the same fiscal year. In future sector averages will be weighted for enrollment
Education & Related Expenses per FTEInstitution Name 2010-11 2011-12 2012-13Asnuntuck Community College $15,070 $14,831 $15,467Capital Community College $13,182 $12,806 $13,246Gateway Community College $10,290 $11,686 $13,299Housatonic Community College $9,832 $9,946 $9,926Manchester Community College $10,860 $10,959 $10,931Middlesex Community College $11,757 $11,262 $11,806Naugatuck Valley Community College $11,862 $11,379 $12,005Northwestern Connecticut Community College $17,577 $18,300 $18,566Norwalk Community College $11,167 $11,706 $11,640Quinebaug Valley Community College $13,197 $13,255 $13,780Three Rivers Community College $11,751 $11,276 $12,119Tunxis Community College $11,644 $11,414 $11,822Sector: Community College $11,588 $11,685 $12,172
Sector/ Institution Name 2010-11 2011-12 2012-13Charter Oak State College $8,867 $12,538 $12,327
Institution Name 2010-11 2011-12 2012-13Central Connecticut State University $15,253 $14,888 $15,910Eastern Connecticut State University $17,686 $16,928 $17,397Southern Connecticut State University $15,999 $16,084 $18,068Western Connecticut State University $17,069 $16,758 $17,687Sector: Connecticut State Universities $16,220 $15,949 $17,141
Institution Name 2010-11 2011-12 2012-13University of Connecticut* $32,662 $31,196 $33,473
52
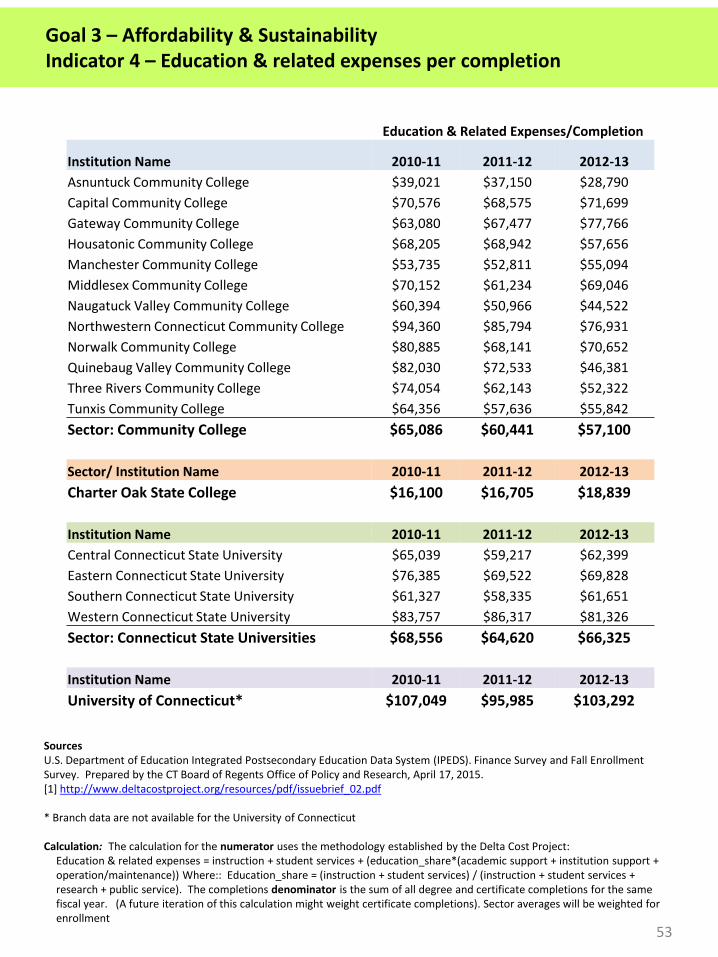
Goal 3 – Affordability & SustainabilityIndicator 4 – Education & related expenses per completion
SourcesU.S. Department of Education Integrated Postsecondary Education Data System (IPEDS). Finance Survey and Fall Enrollment Survey. Prepared by the CT Board of Regents Office of Policy and Research, April 17, 2015.[1] http://www.deltacostproject.org/resources/pdf/issuebrief_02.pdf
* Branch data are not available for the University of Connecticut
Calculation: The calculation for the numerator uses the methodology established by the Delta Cost Project:Education & related expenses = instruction + student services + (education_share*(academic support + institution support + operation/maintenance)) Where:: Education_share = (instruction + student services) / (instruction + student services + research + public service). The completions denominator is the sum of all degree and certificate completions for the same fiscal year. (A future iteration of this calculation might weight certificate completions). Sector averages will be weighted for enrollment
Education & Related Expenses/Completion
Institution Name 2010-11 2011-12 2012-13Asnuntuck Community College $39,021 $37,150 $28,790Capital Community College $70,576 $68,575 $71,699Gateway Community College $63,080 $67,477 $77,766Housatonic Community College $68,205 $68,942 $57,656Manchester Community College $53,735 $52,811 $55,094Middlesex Community College $70,152 $61,234 $69,046Naugatuck Valley Community College $60,394 $50,966 $44,522Northwestern Connecticut Community College $94,360 $85,794 $76,931Norwalk Community College $80,885 $68,141 $70,652Quinebaug Valley Community College $82,030 $72,533 $46,381Three Rivers Community College $74,054 $62,143 $52,322Tunxis Community College $64,356 $57,636 $55,842Sector: Community College $65,086 $60,441 $57,100
Sector/ Institution Name 2010-11 2011-12 2012-13Charter Oak State College $16,100 $16,705 $18,839
Institution Name 2010-11 2011-12 2012-13Central Connecticut State University $65,039 $59,217 $62,399Eastern Connecticut State University $76,385 $69,522 $69,828Southern Connecticut State University $61,327 $58,335 $61,651Western Connecticut State University $83,757 $86,317 $81,326Sector: Connecticut State Universities $68,556 $64,620 $66,325
Institution Name 2010-11 2011-12 2012-13University of Connecticut* $107,049 $95,985 $103,292
53
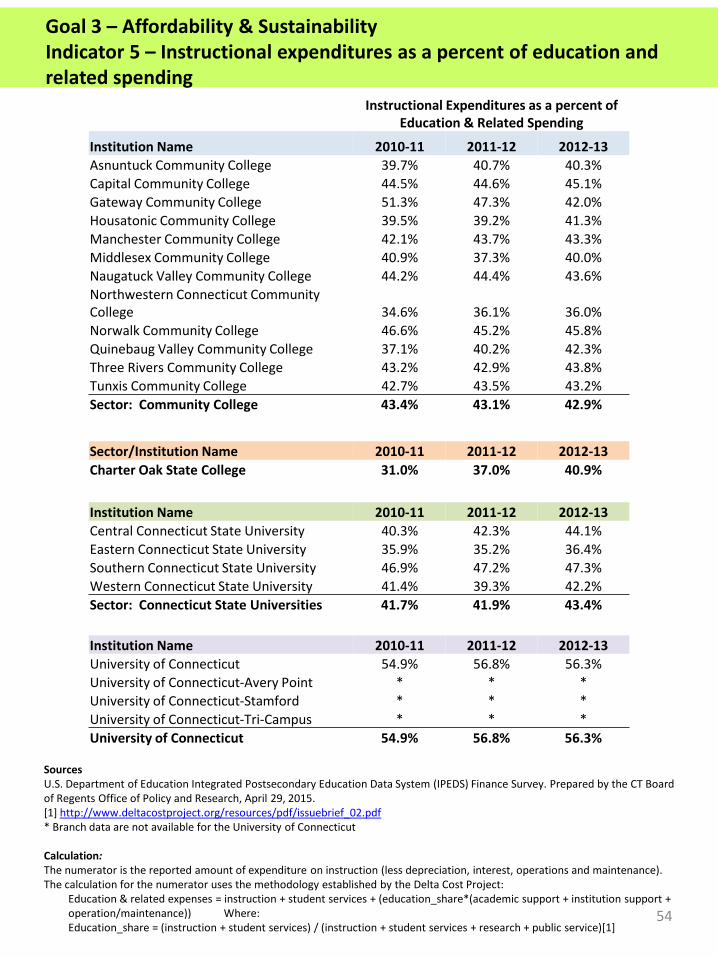
Goal 3 – Affordability & SustainabilityIndicator 5 – Instructional expenditures as a percent of education and related spending
SourcesU.S. Department of Education Integrated Postsecondary Education Data System (IPEDS) Finance Survey. Prepared by the CT Board of Regents Office of Policy and Research, April 29, 2015.[1] http://www.deltacostproject.org/resources/pdf/issuebrief_02.pdf* Branch data are not available for the University of Connecticut
Calculation: The numerator is the reported amount of expenditure on instruction (less depreciation, interest, operations and maintenance).The calculation for the numerator uses the methodology established by the Delta Cost Project:
Education & related expenses = instruction + student services + (education_share*(academic support + institution support + operation/maintenance)) Where:Education_share = (instruction + student services) / (instruction + student services + research + public service)[1]
Instructional Expenditures as a percent of Education & Related Spending
Institution Name 2010-11 2011-12 2012-13Asnuntuck Community College 39.7% 40.7% 40.3%Capital Community College 44.5% 44.6% 45.1%Gateway Community College 51.3% 47.3% 42.0%Housatonic Community College 39.5% 39.2% 41.3%Manchester Community College 42.1% 43.7% 43.3%Middlesex Community College 40.9% 37.3% 40.0%Naugatuck Valley Community College 44.2% 44.4% 43.6%Northwestern Connecticut Community College 34.6% 36.1% 36.0%Norwalk Community College 46.6% 45.2% 45.8%Quinebaug Valley Community College 37.1% 40.2% 42.3%Three Rivers Community College 43.2% 42.9% 43.8%Tunxis Community College 42.7% 43.5% 43.2%Sector: Community College 43.4% 43.1% 42.9%
Sector/Institution Name 2010-11 2011-12 2012-13Charter Oak State College 31.0% 37.0% 40.9%
Institution Name 2010-11 2011-12 2012-13Central Connecticut State University 40.3% 42.3% 44.1%Eastern Connecticut State University 35.9% 35.2% 36.4%Southern Connecticut State University 46.9% 47.2% 47.3%Western Connecticut State University 41.4% 39.3% 42.2%Sector: Connecticut State Universities 41.7% 41.9% 43.4%
Institution Name 2010-11 2011-12 2012-13University of Connecticut 54.9% 56.8% 56.3%University of Connecticut-Avery Point * * *University of Connecticut-Stamford * * *University of Connecticut-Tri-Campus * * *University of Connecticut 54.9% 56.8% 56.3%
54
Innovation and Economic Growth
Create environments that emphasize innovation and prepare students for successful careers in a fast changing world.
Indicators:1. Completions in fields with high workforce demand: STEM,
health, education2. External research funding per full-time faculty3. Patents per 100K workers4. Percent of students enrolled in distance education courses
exclusively/some but not all.
55
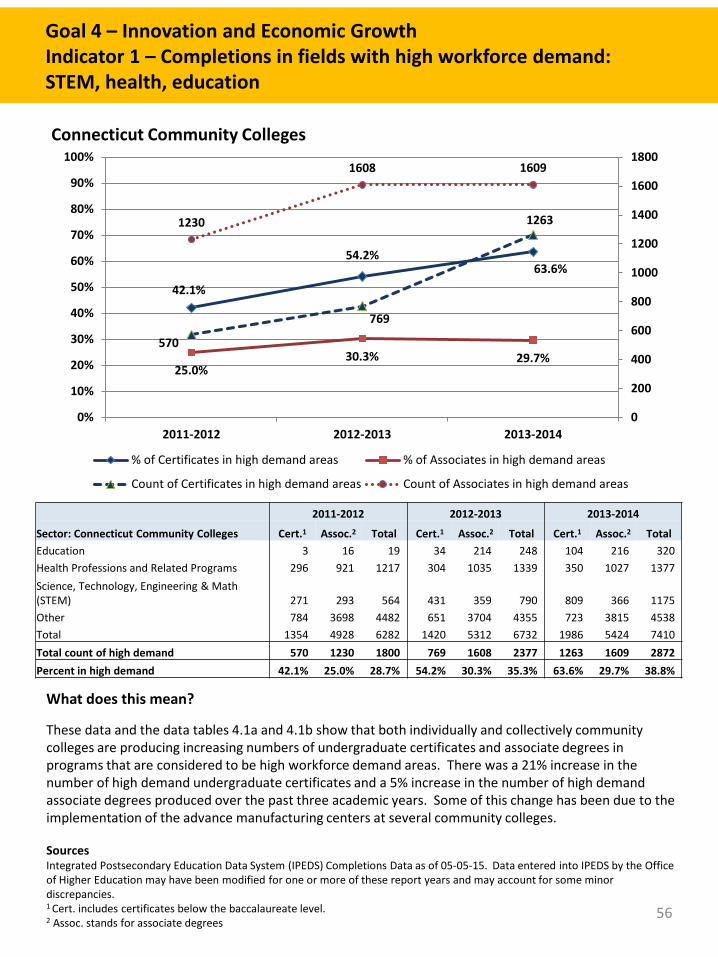
Goal 4 – Innovation and Economic GrowthIndicator 1 – Completions in fields with high workforce demand: STEM, health, education
SourcesIntegrated Postsecondary Education Data System (IPEDS) Completions Data as of 05-05-15. Data entered into IPEDS by the Office of Higher Education may have been modified for one or more of these report years and may account for some minor discrepancies.1 Cert. includes certificates below the baccalaureate level.2 Assoc. stands for associate degrees
What does this mean?
These data and the data tables 4.1a and 4.1b show that both individually and collectively community colleges are producing increasing numbers of undergraduate certificates and associate degrees in programs that are considered to be high workforce demand areas. There was a 21% increase in the number of high demand undergraduate certificates and a 5% increase in the number of high demand associate degrees produced over the past three academic years. Some of this change has been due to the implementation of the advance manufacturing centers at several community colleges.
Connecticut Community Colleges
42.1%
54.2%63.6%
25.0%30.3% 29.7%
570
769
12631230
1608 1609
0
200
400
600
800
1000
1200
1400
1600
1800
0%
10%
20%
30%
40%
50%
60%
70%
80%
90%
100%
2011-2012 2012-2013 2013-2014
% of Certificates in high demand areas % of Associates in high demand areas
Count of Certificates in high demand areas Count of Associates in high demand areas
2011-2012 2012-2013 2013-2014
Sector: Connecticut Community Colleges Cert.1 Assoc.2 Total Cert.1 Assoc.2 Total Cert.1 Assoc.2 TotalEducation 3 16 19 34 214 248 104 216 320Health Professions and Related Programs 296 921 1217 304 1035 1339 350 1027 1377Science, Technology, Engineering & Math (STEM) 271 293 564 431 359 790 809 366 1175Other 784 3698 4482 651 3704 4355 723 3815 4538Total 1354 4928 6282 1420 5312 6732 1986 5424 7410Total count of high demand 570 1230 1800 769 1608 2377 1263 1609 2872Percent in high demand 42.1% 25.0% 28.7% 54.2% 30.3% 35.3% 63.6% 29.7% 38.8%
56
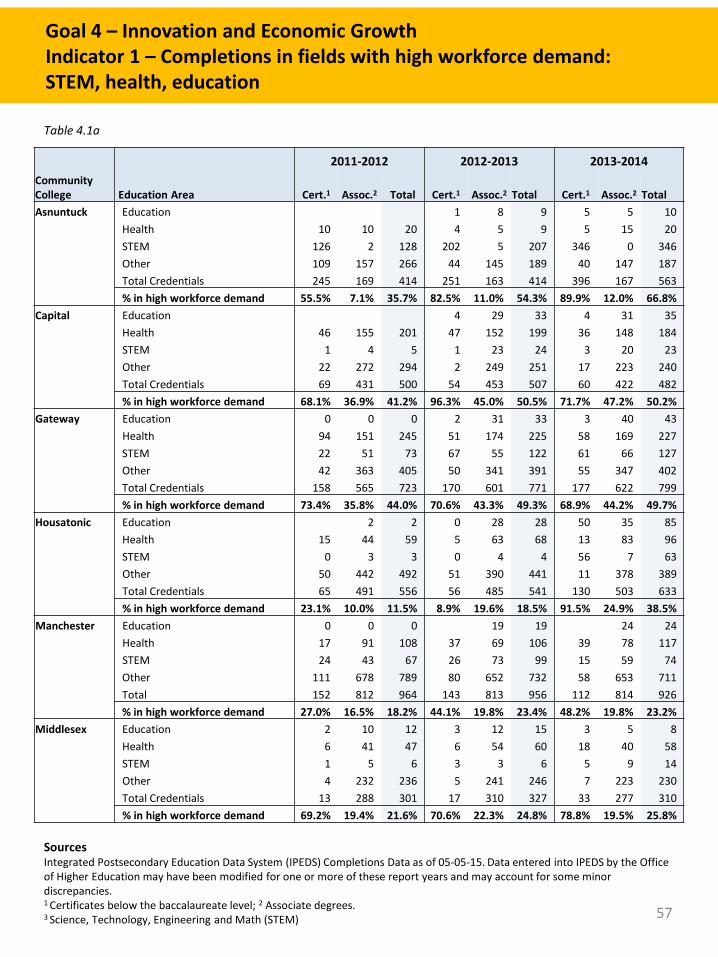
Goal 4 – Innovation and Economic GrowthIndicator 1 – Completions in fields with high workforce demand: STEM, health, education
Table 4.1a
SourcesIntegrated Postsecondary Education Data System (IPEDS) Completions Data as of 05-05-15. Data entered into IPEDS by the Office of Higher Education may have been modified for one or more of these report years and may account for some minor discrepancies.1 Certificates below the baccalaureate level; 2 Associate degrees. 3 Science, Technology, Engineering and Math (STEM)
2011-2012 2012-2013 2013-2014CommunityCollege Education Area Cert.1 Assoc.2 Total Cert.1 Assoc.2 Total Cert.1 Assoc.2 TotalAsnuntuck Education 1 8 9 5 5 10
Health 10 10 20 4 5 9 5 15 20STEM 126 2 128 202 5 207 346 0 346Other 109 157 266 44 145 189 40 147 187Total Credentials 245 169 414 251 163 414 396 167 563% in high workforce demand 55.5% 7.1% 35.7% 82.5% 11.0% 54.3% 89.9% 12.0% 66.8%
Capital Education 4 29 33 4 31 35Health 46 155 201 47 152 199 36 148 184STEM 1 4 5 1 23 24 3 20 23Other 22 272 294 2 249 251 17 223 240Total Credentials 69 431 500 54 453 507 60 422 482% in high workforce demand 68.1% 36.9% 41.2% 96.3% 45.0% 50.5% 71.7% 47.2% 50.2%
Gateway Education 0 0 0 2 31 33 3 40 43Health 94 151 245 51 174 225 58 169 227STEM 22 51 73 67 55 122 61 66 127Other 42 363 405 50 341 391 55 347 402Total Credentials 158 565 723 170 601 771 177 622 799% in high workforce demand 73.4% 35.8% 44.0% 70.6% 43.3% 49.3% 68.9% 44.2% 49.7%
Housatonic Education 2 2 0 28 28 50 35 85Health 15 44 59 5 63 68 13 83 96STEM 0 3 3 0 4 4 56 7 63Other 50 442 492 51 390 441 11 378 389Total Credentials 65 491 556 56 485 541 130 503 633% in high workforce demand 23.1% 10.0% 11.5% 8.9% 19.6% 18.5% 91.5% 24.9% 38.5%
Manchester Education 0 0 0 19 19 24 24Health 17 91 108 37 69 106 39 78 117STEM 24 43 67 26 73 99 15 59 74Other 111 678 789 80 652 732 58 653 711Total 152 812 964 143 813 956 112 814 926% in high workforce demand 27.0% 16.5% 18.2% 44.1% 19.8% 23.4% 48.2% 19.8% 23.2%
Middlesex Education 2 10 12 3 12 15 3 5 8Health 6 41 47 6 54 60 18 40 58STEM 1 5 6 3 3 6 5 9 14Other 4 232 236 5 241 246 7 223 230Total Credentials 13 288 301 17 310 327 33 277 310% in high workforce demand 69.2% 19.4% 21.6% 70.6% 22.3% 24.8% 78.8% 19.5% 25.8%
57
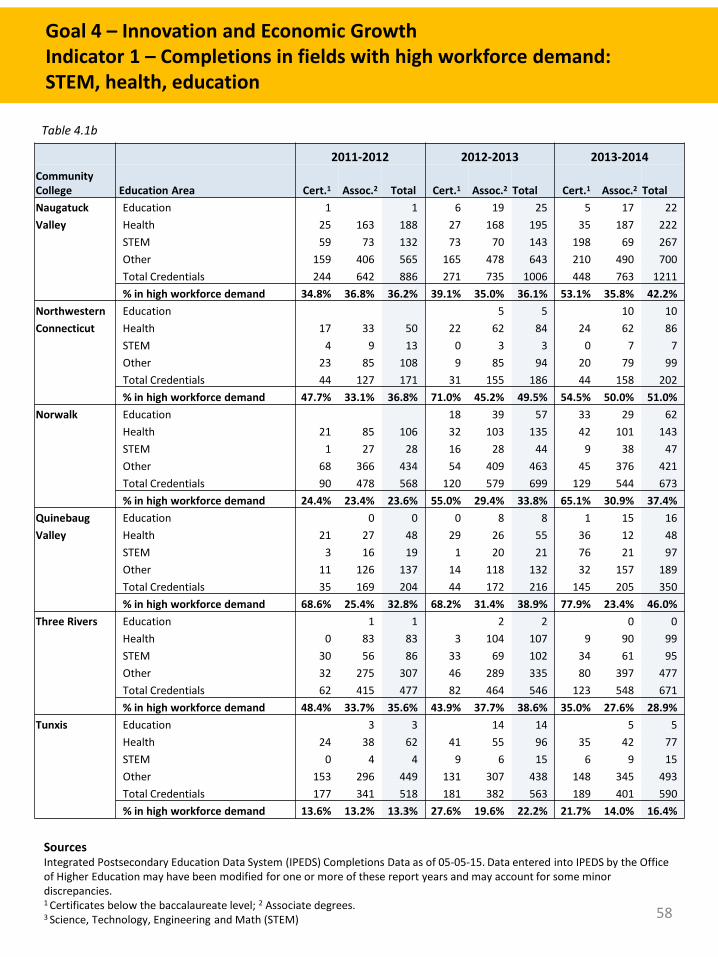
Goal 4 – Innovation and Economic GrowthIndicator 1 – Completions in fields with high workforce demand: STEM, health, education
Table 4.1b
SourcesIntegrated Postsecondary Education Data System (IPEDS) Completions Data as of 05-05-15. Data entered into IPEDS by the Office of Higher Education may have been modified for one or more of these report years and may account for some minor discrepancies.1 Certificates below the baccalaureate level; 2 Associate degrees. 3 Science, Technology, Engineering and Math (STEM)
2011-2012 2012-2013 2013-2014CommunityCollege Education Area Cert.1 Assoc.2 Total Cert.1 Assoc.2 Total Cert.1 Assoc.2 TotalNaugatuck Education 1 1 6 19 25 5 17 22Valley Health 25 163 188 27 168 195 35 187 222
STEM 59 73 132 73 70 143 198 69 267Other 159 406 565 165 478 643 210 490 700Total Credentials 244 642 886 271 735 1006 448 763 1211% in high workforce demand 34.8% 36.8% 36.2% 39.1% 35.0% 36.1% 53.1% 35.8% 42.2%
Northwestern Education 5 5 10 10Connecticut Health 17 33 50 22 62 84 24 62 86
STEM 4 9 13 0 3 3 0 7 7Other 23 85 108 9 85 94 20 79 99Total Credentials 44 127 171 31 155 186 44 158 202% in high workforce demand 47.7% 33.1% 36.8% 71.0% 45.2% 49.5% 54.5% 50.0% 51.0%
Norwalk Education 18 39 57 33 29 62Health 21 85 106 32 103 135 42 101 143STEM 1 27 28 16 28 44 9 38 47Other 68 366 434 54 409 463 45 376 421Total Credentials 90 478 568 120 579 699 129 544 673% in high workforce demand 24.4% 23.4% 23.6% 55.0% 29.4% 33.8% 65.1% 30.9% 37.4%
Quinebaug Education 0 0 0 8 8 1 15 16Valley Health 21 27 48 29 26 55 36 12 48
STEM 3 16 19 1 20 21 76 21 97Other 11 126 137 14 118 132 32 157 189Total Credentials 35 169 204 44 172 216 145 205 350% in high workforce demand 68.6% 25.4% 32.8% 68.2% 31.4% 38.9% 77.9% 23.4% 46.0%
Three Rivers Education 1 1 2 2 0 0Health 0 83 83 3 104 107 9 90 99STEM 30 56 86 33 69 102 34 61 95Other 32 275 307 46 289 335 80 397 477Total Credentials 62 415 477 82 464 546 123 548 671% in high workforce demand 48.4% 33.7% 35.6% 43.9% 37.7% 38.6% 35.0% 27.6% 28.9%
Tunxis Education 3 3 14 14 5 5Health 24 38 62 41 55 96 35 42 77STEM 0 4 4 9 6 15 6 9 15Other 153 296 449 131 307 438 148 345 493Total Credentials 177 341 518 181 382 563 189 401 590% in high workforce demand 13.6% 13.2% 13.3% 27.6% 19.6% 22.2% 21.7% 14.0% 16.4%
58
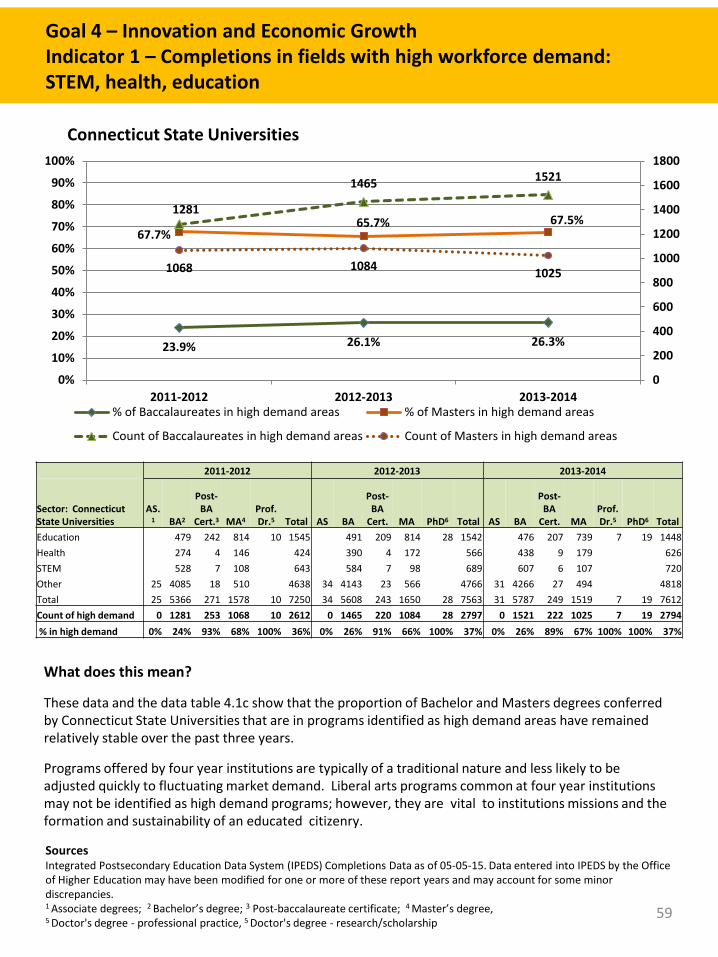
Goal 4 – Innovation and Economic GrowthIndicator 1 – Completions in fields with high workforce demand: STEM, health, education
Connecticut State Universities
What does this mean?
These data and the data table 4.1c show that the proportion of Bachelor and Masters degrees conferred by Connecticut State Universities that are in programs identified as high demand areas have remained relatively stable over the past three years.
Programs offered by four year institutions are typically of a traditional nature and less likely to be adjusted quickly to fluctuating market demand. Liberal arts programs common at four year institutions may not be identified as high demand programs; however, they are vital to institutions missions and the formation and sustainability of an educated citizenry.
SourcesIntegrated Postsecondary Education Data System (IPEDS) Completions Data as of 05-05-15. Data entered into IPEDS by the Office of Higher Education may have been modified for one or more of these report years and may account for some minor discrepancies.1 Associate degrees; 2 Bachelor’s degree; 3 Post-baccalaureate certificate; 4 Master’s degree, 5 Doctor's degree - professional practice, 5 Doctor's degree - research/scholarship
23.9% 26.1% 26.3%
67.7%65.7% 67.5%
1281
1465 1521
1068 1084 1025
0
200
400
600
800
1000
1200
1400
1600
1800
0%
10%
20%
30%
40%
50%
60%
70%
80%
90%
100%
2011-2012 2012-2013 2013-2014% of Baccalaureates in high demand areas % of Masters in high demand areas
Count of Baccalaureates in high demand areas Count of Masters in high demand areas
2011-2012 2012-2013 2013-2014
Sector: Connecticut State Universities
AS.1 BA2
Post-BA
Cert.3 MA4Prof. Dr.5 Total AS BA
Post-BA
Cert. MA PhD6 Total AS BA
Post-BA
Cert. MAProf. Dr.5 PhD6 Total
Education 479 242 814 10 1545 491 209 814 28 1542 476 207 739 7 19 1448Health 274 4 146 424 390 4 172 566 438 9 179 626STEM 528 7 108 643 584 7 98 689 607 6 107 720Other 25 4085 18 510 4638 34 4143 23 566 4766 31 4266 27 494 4818Total 25 5366 271 1578 10 7250 34 5608 243 1650 28 7563 31 5787 249 1519 7 19 7612Count of high demand 0 1281 253 1068 10 2612 0 1465 220 1084 28 2797 0 1521 222 1025 7 19 2794% in high demand 0% 24% 93% 68% 100% 36% 0% 26% 91% 66% 100% 37% 0% 26% 89% 67% 100% 100% 37%
59
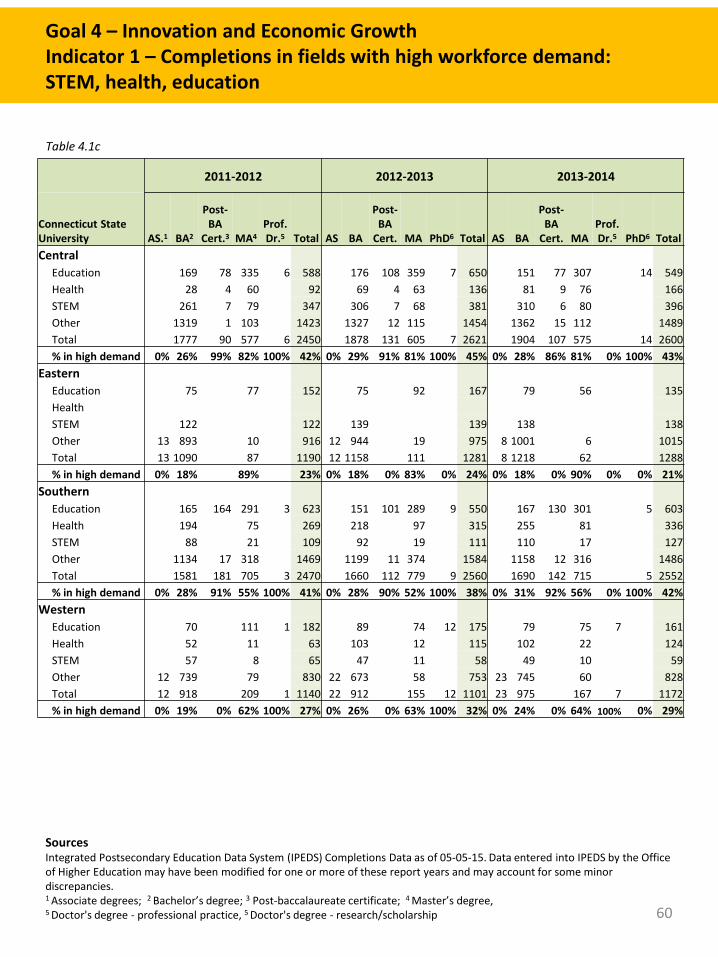
Goal 4 – Innovation and Economic GrowthIndicator 1 – Completions in fields with high workforce demand: STEM, health, education
Table 4.1c
2011-2012 2012-2013 2013-2014
Connecticut State University AS.1 BA2
Post-BA
Cert.3 MA4Prof. Dr.5 Total AS BA
Post-BA
Cert. MA PhD6 Total AS BA
Post-BA
Cert. MAProf. Dr.5 PhD6 Total
CentralEducation 169 78 335 6 588 176 108 359 7 650 151 77 307 14 549Health 28 4 60 92 69 4 63 136 81 9 76 166STEM 261 7 79 347 306 7 68 381 310 6 80 396Other 1319 1 103 1423 1327 12 115 1454 1362 15 112 1489Total 1777 90 577 6 2450 1878 131 605 7 2621 1904 107 575 14 2600% in high demand 0% 26% 99% 82% 100% 42% 0% 29% 91% 81% 100% 45% 0% 28% 86% 81% 0% 100% 43%
EasternEducation 75 77 152 75 92 167 79 56 135HealthSTEM 122 122 139 139 138 138Other 13 893 10 916 12 944 19 975 8 1001 6 1015Total 13 1090 87 1190 12 1158 111 1281 8 1218 62 1288% in high demand 0% 18% 89% 23% 0% 18% 0% 83% 0% 24% 0% 18% 0% 90% 0% 0% 21%
SouthernEducation 165 164 291 3 623 151 101 289 9 550 167 130 301 5 603Health 194 75 269 218 97 315 255 81 336STEM 88 21 109 92 19 111 110 17 127Other 1134 17 318 1469 1199 11 374 1584 1158 12 316 1486Total 1581 181 705 3 2470 1660 112 779 9 2560 1690 142 715 5 2552% in high demand 0% 28% 91% 55% 100% 41% 0% 28% 90% 52% 100% 38% 0% 31% 92% 56% 0% 100% 42%
WesternEducation 70 111 1 182 89 74 12 175 79 75 7 161Health 52 11 63 103 12 115 102 22 124STEM 57 8 65 47 11 58 49 10 59Other 12 739 79 830 22 673 58 753 23 745 60 828Total 12 918 209 1 1140 22 912 155 12 1101 23 975 167 7 1172% in high demand 0% 19% 0% 62% 100% 27% 0% 26% 0% 63% 100% 32% 0% 24% 0% 64% 100% 0% 29%
SourcesIntegrated Postsecondary Education Data System (IPEDS) Completions Data as of 05-05-15. Data entered into IPEDS by the Office of Higher Education may have been modified for one or more of these report years and may account for some minor discrepancies.1 Associate degrees; 2 Bachelor’s degree; 3 Post-baccalaureate certificate; 4 Master’s degree, 5 Doctor's degree - professional practice, 5 Doctor's degree - research/scholarship 60
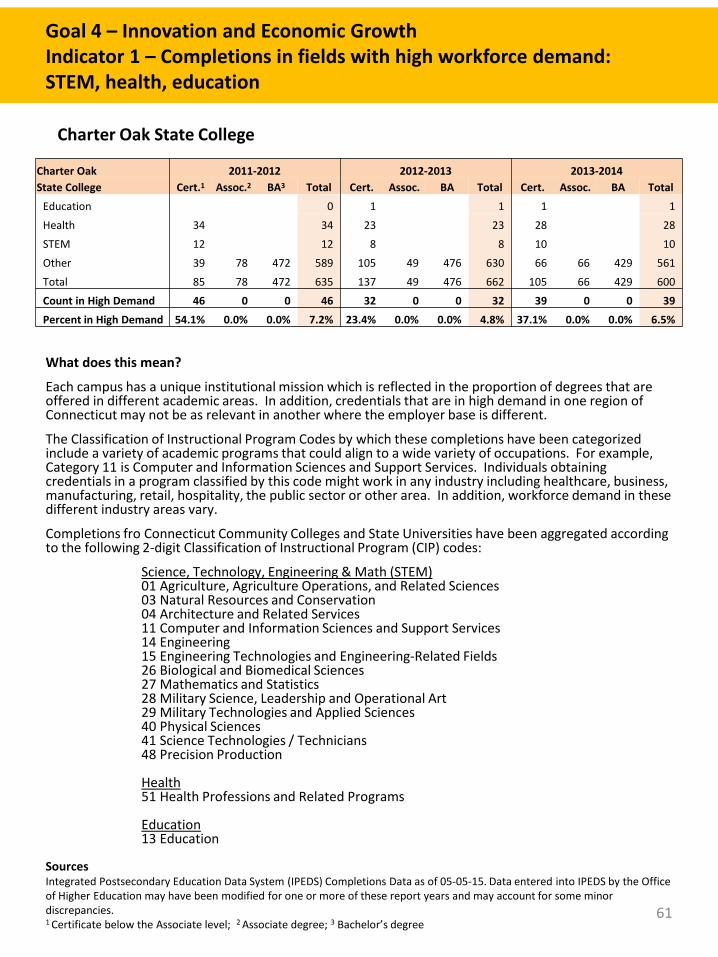
Goal 4 – Innovation and Economic GrowthIndicator 1 – Completions in fields with high workforce demand: STEM, health, education
What does this mean?
Each campus has a unique institutional mission which is reflected in the proportion of degrees that are offered in different academic areas. In addition, credentials that are in high demand in one region of Connecticut may not be as relevant in another where the employer base is different.
The Classification of Instructional Program Codes by which these completions have been categorized include a variety of academic programs that could align to a wide variety of occupations. For example, Category 11 is Computer and Information Sciences and Support Services. Individuals obtaining credentials in a program classified by this code might work in any industry including healthcare, business, manufacturing, retail, hospitality, the public sector or other area. In addition, workforce demand in these different industry areas vary.
Completions fro Connecticut Community Colleges and State Universities have been aggregated according to the following 2-digit Classification of Instructional Program (CIP) codes:
Science, Technology, Engineering & Math (STEM)01 Agriculture, Agriculture Operations, and Related Sciences03 Natural Resources and Conservation04 Architecture and Related Services11 Computer and Information Sciences and Support Services14 Engineering15 Engineering Technologies and Engineering-Related Fields26 Biological and Biomedical Sciences27 Mathematics and Statistics28 Military Science, Leadership and Operational Art29 Military Technologies and Applied Sciences40 Physical Sciences41 Science Technologies / Technicians48 Precision Production
Health51 Health Professions and Related Programs
Education13 Education
Charter Oak State College
SourcesIntegrated Postsecondary Education Data System (IPEDS) Completions Data as of 05-05-15. Data entered into IPEDS by the Office of Higher Education may have been modified for one or more of these report years and may account for some minor discrepancies.1 Certificate below the Associate level; 2 Associate degree; 3 Bachelor’s degree
Charter Oak 2011-2012 2012-2013 2013-2014State College Cert.1 Assoc.2 BA3 Total Cert. Assoc. BA Total Cert. Assoc. BA Total
Education 0 1 1 1 1Health 34 34 23 23 28 28STEM 12 12 8 8 10 10Other 39 78 472 589 105 49 476 630 66 66 429 561Total 85 78 472 635 137 49 476 662 105 66 429 600Count in High Demand 46 0 0 46 32 0 0 32 39 0 0 39Percent in High Demand 54.1% 0.0% 0.0% 7.2% 23.4% 0.0% 0.0% 4.8% 37.1% 0.0% 0.0% 6.5%
61
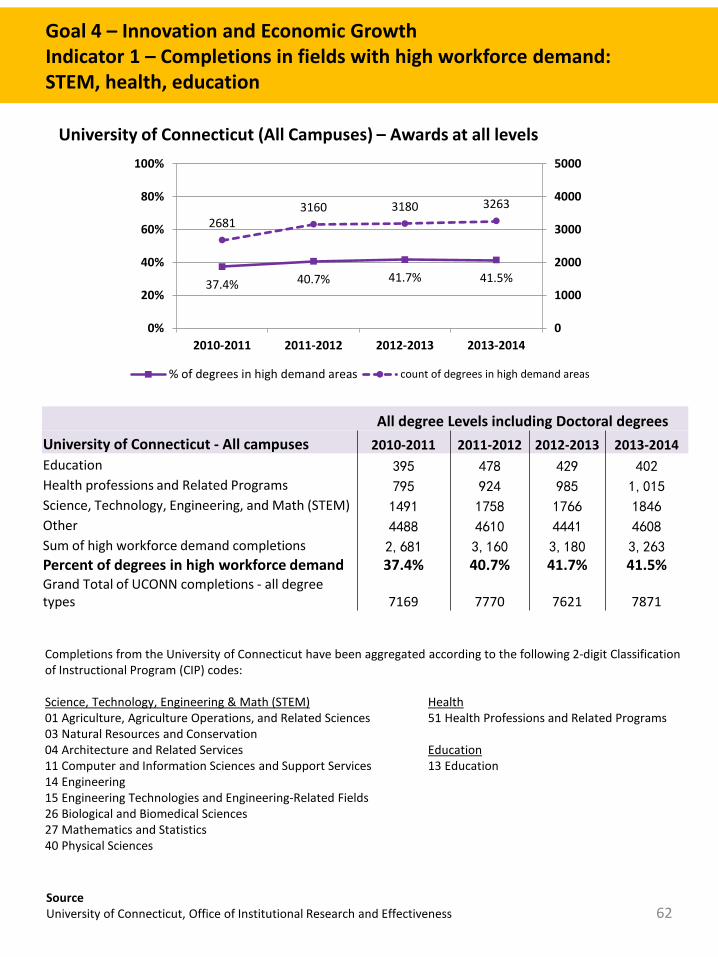
Goal 4 – Innovation and Economic GrowthIndicator 1 – Completions in fields with high workforce demand: STEM, health, education
Completions from the University of Connecticut have been aggregated according to the following 2-digit Classification of Instructional Program (CIP) codes:
Science, Technology, Engineering & Math (STEM) Health01 Agriculture, Agriculture Operations, and Related Sciences 51 Health Professions and Related Programs 03 Natural Resources and Conservation04 Architecture and Related Services Education11 Computer and Information Sciences and Support Services 13 Education14 Engineering15 Engineering Technologies and Engineering-Related Fields26 Biological and Biomedical Sciences27 Mathematics and Statistics40 Physical Sciences
University of Connecticut (All Campuses) – Awards at all levels
SourceUniversity of Connecticut, Office of Institutional Research and Effectiveness
37.4% 40.7% 41.7% 41.5%
26813160 3180 3263
0
1000
2000
3000
4000
5000
0%
20%
40%
60%
80%
100%
2010-2011 2011-2012 2012-2013 2013-2014
% of degrees in high demand areas count of degrees in high demand areas
All degree Levels including Doctoral degreesUniversity of Connecticut - All campuses 2010-2011 2011-2012 2012-2013 2013-2014Education 395 478 429 402Health professions and Related Programs 795 924 985 1,015Science, Technology, Engineering, and Math (STEM) 1491 1758 1766 1846Other 4488 4610 4441 4608Sum of high workforce demand completions 2,681 3,160 3,180 3,263Percent of degrees in high workforce demand 37.4% 40.7% 41.7% 41.5%Grand Total of UCONN completions - all degree types 7169 7770 7621 7871
62
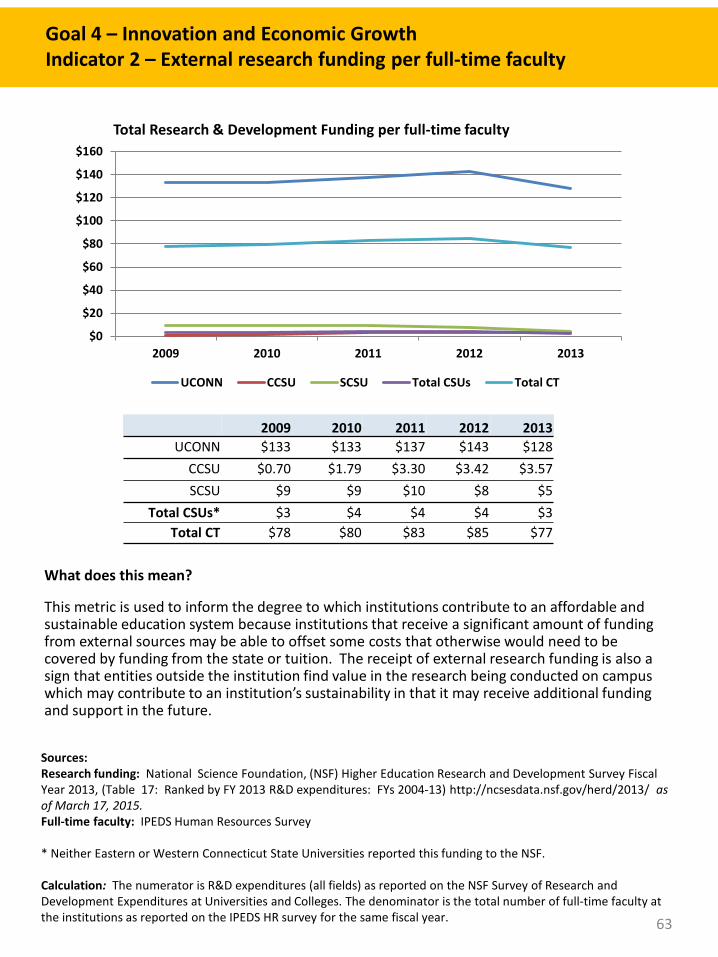
Sources: Research funding: National Science Foundation, (NSF) Higher Education Research and Development Survey Fiscal Year 2013, (Table 17: Ranked by FY 2013 R&D expenditures: FYs 2004-13) http://ncsesdata.nsf.gov/herd/2013/ as of March 17, 2015. Full-time faculty: IPEDS Human Resources Survey
* Neither Eastern or Western Connecticut State Universities reported this funding to the NSF.
Calculation: The numerator is R&D expenditures (all fields) as reported on the NSF Survey of Research and Development Expenditures at Universities and Colleges. The denominator is the total number of full-time faculty at the institutions as reported on the IPEDS HR survey for the same fiscal year.
2009 2010 2011 2012 2013UCONN $133 $133 $137 $143 $128
CCSU $0.70 $1.79 $3.30 $3.42 $3.57SCSU $9 $9 $10 $8 $5
Total CSUs* $3 $4 $4 $4 $3Total CT $78 $80 $83 $85 $77
Total Research & Development Funding per full-time faculty
Goal 4 – Innovation and Economic GrowthIndicator 2 – External research funding per full-time faculty
What does this mean?
This metric is used to inform the degree to which institutions contribute to an affordable and sustainable education system because institutions that receive a significant amount of funding from external sources may be able to offset some costs that otherwise would need to be covered by funding from the state or tuition. The receipt of external research funding is also a sign that entities outside the institution find value in the research being conducted on campus which may contribute to an institution’s sustainability in that it may receive additional funding and support in the future.
$0
$20
$40
$60
$80
$100
$120
$140
$160
2009 2010 2011 2012 2013
UCONN CCSU SCSU Total CSUs Total CT
63
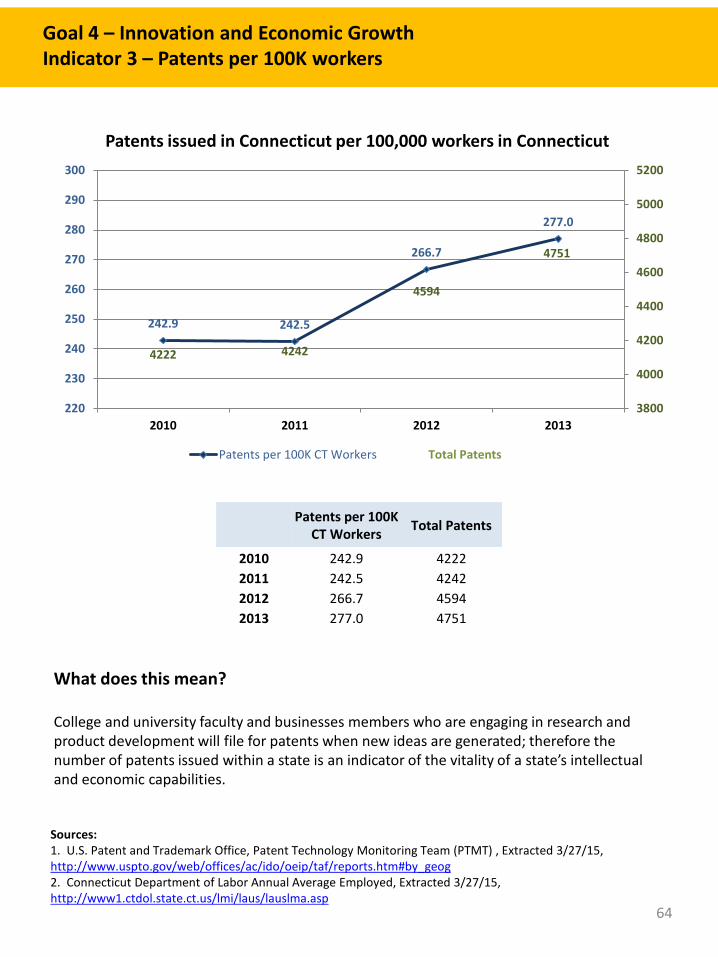
Goal 4 – Innovation and Economic GrowthIndicator 3 – Patents per 100K workers
Sources: 1. U.S. Patent and Trademark Office, Patent Technology Monitoring Team (PTMT) , Extracted 3/27/15, http://www.uspto.gov/web/offices/ac/ido/oeip/taf/reports.htm#by_geog2. Connecticut Department of Labor Annual Average Employed, Extracted 3/27/15, http://www1.ctdol.state.ct.us/lmi/laus/lauslma.asp
Patents issued in Connecticut per 100,000 workers in Connecticut
What does this mean?
College and university faculty and businesses members who are engaging in research and product development will file for patents when new ideas are generated; therefore the number of patents issued within a state is an indicator of the vitality of a state’s intellectual and economic capabilities.
242.9 242.5
266.7
277.0
4222 4242
4594
4751
3800
4000
4200
4400
4600
4800
5000
5200
220
230
240
250
260
270
280
290
300
2010 2011 2012 2013
Patents per 100K CT Workers Total Patents
Patents per 100K CT Workers Total Patents
2010 242.9 42222011 242.5 42422012 266.7 45942013 277.0 4751
64
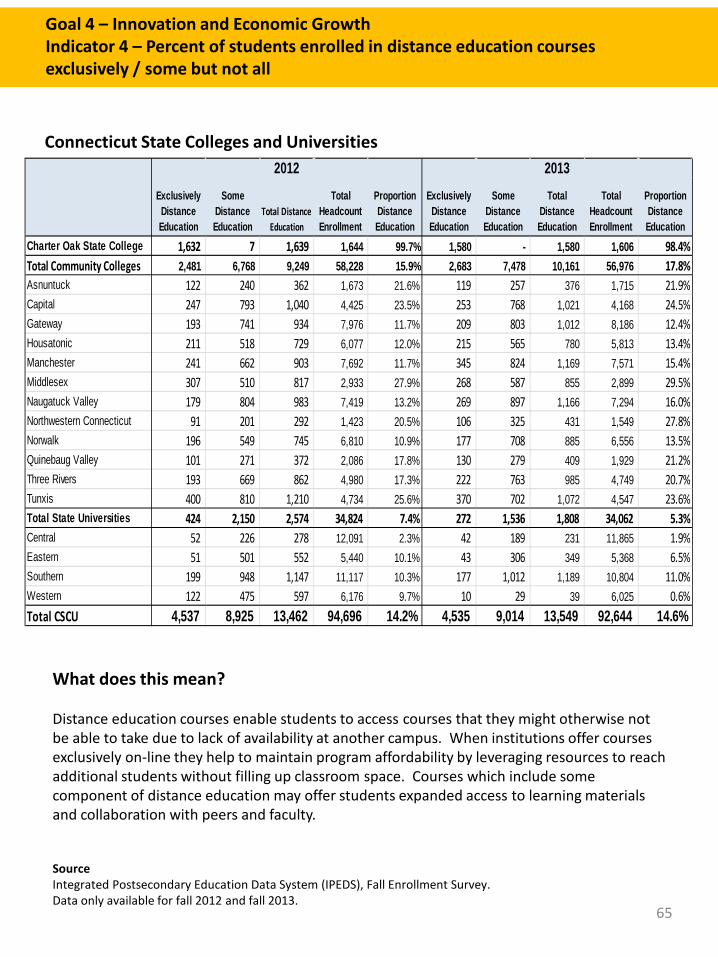
Goal 4 – Innovation and Economic GrowthIndicator 4 – Percent of students enrolled in distance education courses exclusively / some but not all
SourceIntegrated Postsecondary Education Data System (IPEDS), Fall Enrollment Survey. Data only available for fall 2012 and fall 2013.
What does this mean?
Distance education courses enable students to access courses that they might otherwise not be able to take due to lack of availability at another campus. When institutions offer courses exclusively on-line they help to maintain program affordability by leveraging resources to reach additional students without filling up classroom space. Courses which include some component of distance education may offer students expanded access to learning materials and collaboration with peers and faculty.
Connecticut State Colleges and Universities
Exclusively Distance Education
Some Distance Education
Total Distance Education
Total Headcount Enrollment
Proportion Distance Education
Exclusively Distance Education
Some Distance Education
Total Distance Education
Total Headcount Enrollment
Proportion Distance Education
Charter Oak State College 1,632 7 1,639 1,644 99.7% 1,580 - 1,580 1,606 98.4%Total Community Colleges 2,481 6,768 9,249 58,228 15.9% 2,683 7,478 10,161 56,976 17.8%Asnuntuck 122 240 362 1,673 21.6% 119 257 376 1,715 21.9%Capital 247 793 1,040 4,425 23.5% 253 768 1,021 4,168 24.5%Gateway 193 741 934 7,976 11.7% 209 803 1,012 8,186 12.4%Housatonic 211 518 729 6,077 12.0% 215 565 780 5,813 13.4%Manchester 241 662 903 7,692 11.7% 345 824 1,169 7,571 15.4%Middlesex 307 510 817 2,933 27.9% 268 587 855 2,899 29.5%Naugatuck Valley 179 804 983 7,419 13.2% 269 897 1,166 7,294 16.0%Northwestern Connecticut 91 201 292 1,423 20.5% 106 325 431 1,549 27.8%Norwalk 196 549 745 6,810 10.9% 177 708 885 6,556 13.5%Quinebaug Valley 101 271 372 2,086 17.8% 130 279 409 1,929 21.2%Three Rivers 193 669 862 4,980 17.3% 222 763 985 4,749 20.7%Tunxis 400 810 1,210 4,734 25.6% 370 702 1,072 4,547 23.6%Total State Universities 424 2,150 2,574 34,824 7.4% 272 1,536 1,808 34,062 5.3%Central 52 226 278 12,091 2.3% 42 189 231 11,865 1.9%Eastern 51 501 552 5,440 10.1% 43 306 349 5,368 6.5%Southern 199 948 1,147 11,117 10.3% 177 1,012 1,189 10,804 11.0%Western 122 475 597 6,176 9.7% 10 29 39 6,025 0.6%Total CSCU 4,537 8,925 13,462 94,696 14.2% 4,535 9,014 13,549 92,644 14.6%
2012 2013
65

Goal 4 – Innovation and Economic GrowthIndicator 4 – Percent of students enrolled in distance education courses exclusively / some but not all
SourcesUniversity of Connecticut, Office of Institutional Research and EffectivenessIntegrated Postsecondary Education Data System (IPEDS), Fall Enrollment Survey. First Fall reported to IPEDS is Fall 2012.
University of Connecticut – All Campuses
Exclusively Distance
Education
Some Distance
Education
Total Distance
Education
Total Headcount
Percent in Distance
Education
2012 505 1962 2467 30256 8.2%2013 284 1851 2135 30474 7.0%2014 572 1559 2131 31119 6.8%
University of Connecticut – All Campuses – by degree levelFall 2012 Fall 2013 Fall 2014
Undergraduate StudentsGraduate Students
Undergraduate StudentsGraduate Students
Undergraduate StudentsGraduate Students
Degree/Certificate
Seeking
Non-Degree/ Certificate
Seeking
Degree/Certificate
Seeking
Non-Degree/ Certificate
Seeking
Degree/Certificate
Seeking
Non-Degree/ Certificate
Seeking
Exclusively Distance Education
96 14 395 58 12 214 70 19 483
Some Distance Education 1,670 20 272 1,479 31 341 1,180 7 372
Not enrolled in Distance Education
19,859 642 7,288 20,398 617 7,324 21,044 653 7,291
Total number of students
21,625 676 7,955 21,935 660 7,879 22,294 679 8,146
Percent in Distance Education
8.2% 5.0% 8.4% 7.0% 6.5% 7.0% 5.6% 3.8% 10.5%
66
Eliminate achievement disparities among different ethnic/racial, economic, and gender groups. Disaggregated data are provided within the other four goal areas where available. There are no specific metrics for this goal.
Equity
67
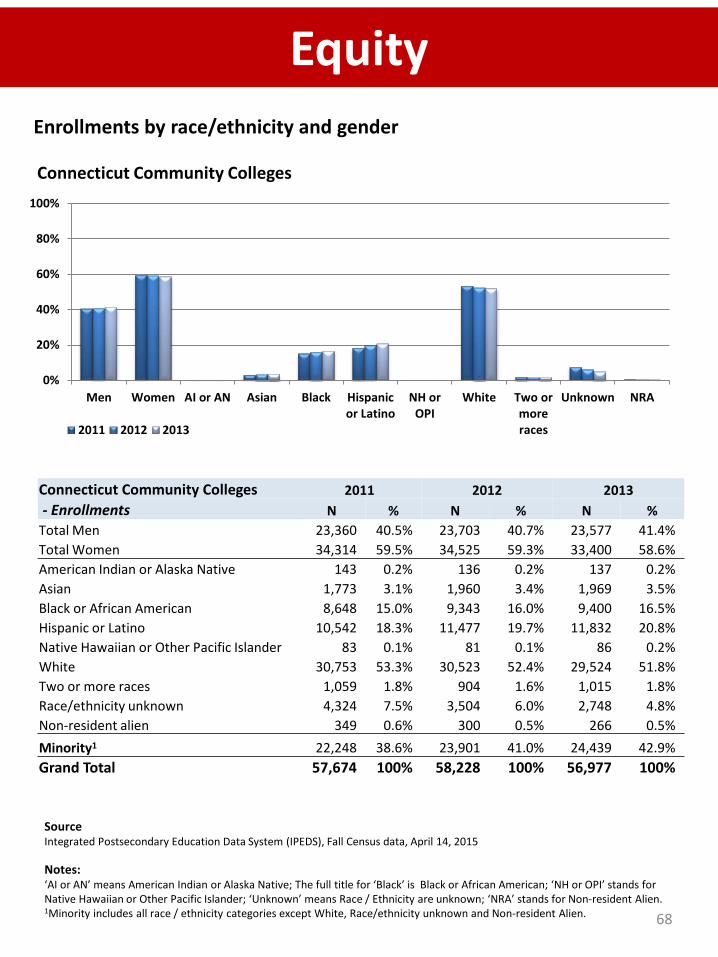
Equity
SourceIntegrated Postsecondary Education Data System (IPEDS), Fall Census data, April 14, 2015
Notes:‘AI or AN’ means American Indian or Alaska Native; The full title for ‘Black’ is Black or African American; ‘NH or OPI’ stands for Native Hawaiian or Other Pacific Islander; ‘Unknown’ means Race / Ethnicity are unknown; ‘NRA’ stands for Non-resident Alien.1Minority includes all race / ethnicity categories except White, Race/ethnicity unknown and Non-resident Alien.
Enrollments by race/ethnicity and gender
Connecticut Community Colleges
0%
20%
40%
60%
80%
100%
Men Women AI or AN Asian Black Hispanicor Latino
NH orOPI
White Two ormoreraces
Unknown NRA
2011 2012 2013
Connecticut Community Colleges 2011 2012 2013- Enrollments N % N % N %
Total Men 23,360 40.5% 23,703 40.7% 23,577 41.4%Total Women 34,314 59.5% 34,525 59.3% 33,400 58.6%American Indian or Alaska Native 143 0.2% 136 0.2% 137 0.2%Asian 1,773 3.1% 1,960 3.4% 1,969 3.5%Black or African American 8,648 15.0% 9,343 16.0% 9,400 16.5%Hispanic or Latino 10,542 18.3% 11,477 19.7% 11,832 20.8%Native Hawaiian or Other Pacific Islander 83 0.1% 81 0.1% 86 0.2%White 30,753 53.3% 30,523 52.4% 29,524 51.8%Two or more races 1,059 1.8% 904 1.6% 1,015 1.8%Race/ethnicity unknown 4,324 7.5% 3,504 6.0% 2,748 4.8%Non-resident alien 349 0.6% 300 0.5% 266 0.5%Minority1 22,248 38.6% 23,901 41.0% 24,439 42.9%Grand Total 57,674 100% 58,228 100% 56,977 100%
68

EquityEnrollments by race/ethnicity and gender
Connecticut State Universities
SourceIntegrated Postsecondary Education Data System (IPEDS), Fall Census data, April 14, 2015
Notes:‘AI or AN’ means American Indian or Alaska Native; The full title for ‘Black’ is Black or African American; ‘NH or OPI’ stands for Native Hawaiian or Other Pacific Islander; ‘Unknown’ means Race / Ethnicity are unknown; ‘NRA’ stands for Non-resident Alien.1Minority includes all race / ethnicity categories except white, Race/ethnicity unknown and Non-resident alien.
0%
20%
40%
60%
80%
100%
Men Women AI or AN Asian Black Hispanicor Latino
NH or OPI White Two ormoreraces
Unknown NRA
2011 2012 2013
Connecticut State Universities 2011 2012 2013- Enrollments N % N % N %
Total men 15,709 43.6% 15,151 43.5% 14,911 43.8%Total Women 20,338 56.4% 19,673 56.5% 19,151 56.2%American Indian or Alaska Native (AI or AN) 98 0.3% 102 0.3% 70 0.2%Asian 955 2.6% 933 2.7% 988 2.9%Black or African American 3,439 9.5% 3,553 10.2% 3,619 10.6%Hispanic or Latino 3,203 8.9% 3,387 9.7% 3,584 10.5%Native Hawaiian or Other Pacific Islander 31 0.1% 59 0.2% 36 0.1%White 26,151 72.5% 24,290 69.8% 23,064 67.7%Two or more races 664 1.8% 705 2.0% 657 1.9%Race/ethnicity unknown 1,246 3.5% 1,524 4.4% 1,754 5.1%Nonresident alien 260 0.7% 271 0.8% 290 0.9%Minority1 8,390 23.3% 8,739 25.1% 8,954 26.3%Grand Total 36,047 100% 34,824 100% 34,062 100%
69
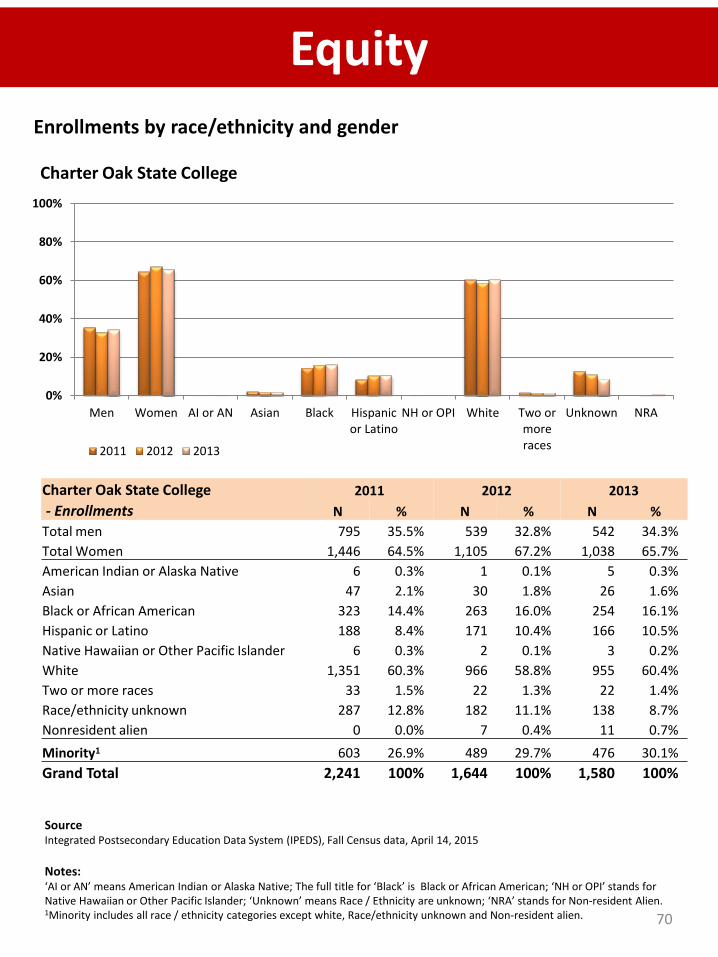
EquityEnrollments by race/ethnicity and gender
Charter Oak State College
SourceIntegrated Postsecondary Education Data System (IPEDS), Fall Census data, April 14, 2015
Notes:‘AI or AN’ means American Indian or Alaska Native; The full title for ‘Black’ is Black or African American; ‘NH or OPI’ stands for Native Hawaiian or Other Pacific Islander; ‘Unknown’ means Race / Ethnicity are unknown; ‘NRA’ stands for Non-resident Alien.1Minority includes all race / ethnicity categories except white, Race/ethnicity unknown and Non-resident alien.
0%
20%
40%
60%
80%
100%
Men Women AI or AN Asian Black Hispanicor Latino
NH or OPI White Two ormoreraces
Unknown NRA
2011 2012 2013
Charter Oak State College 2011 2012 2013- Enrollments N % N % N %
Total men 795 35.5% 539 32.8% 542 34.3%Total Women 1,446 64.5% 1,105 67.2% 1,038 65.7%American Indian or Alaska Native 6 0.3% 1 0.1% 5 0.3%Asian 47 2.1% 30 1.8% 26 1.6%Black or African American 323 14.4% 263 16.0% 254 16.1%Hispanic or Latino 188 8.4% 171 10.4% 166 10.5%Native Hawaiian or Other Pacific Islander 6 0.3% 2 0.1% 3 0.2%White 1,351 60.3% 966 58.8% 955 60.4%Two or more races 33 1.5% 22 1.3% 22 1.4%Race/ethnicity unknown 287 12.8% 182 11.1% 138 8.7%Nonresident alien 0 0.0% 7 0.4% 11 0.7%Minority1 603 26.9% 489 29.7% 476 30.1%Grand Total 2,241 100% 1,644 100% 1,580 100%
70

EquityEnrollments by race/ethnicity and gender
University of Connecticut
SourcesUniversity of Connecticut, Office of Institutional Research and EffectivenessIntegrated Postsecondary Education Data System (IPEDS), Fall Census data1Includes degree and non-degree seeking headcount, but does not include the medical or dental schools
Notes:‘AI or AN’ means American Indian or Alaska Native; The full title for ‘Black’ is Black or African American; ‘NH or OPI’ stands for Native Hawaiian or Other Pacific Islander; ‘Unknown’ means Race / Ethnicity are unknown; ‘NRA’ stands for Non-resident Alien.1Minority includes all race / ethnicity categories except white, Race/ethnicity unknown and Non-resident alien.
UCONN1 -All campuses
Fall 2011 Fall 2012 Fall 2013N % N % N %
Total Men 14,946 49.8% 14,830 49.9% 14,842 49.6%Total Women 15,048 50.2% 14,898 50.1% 15,090 50.4%American Indian or Alaska Native 68 0.2% 56 0.2% 54 0.2%Asian 2,267 7.6% 2,300 7.7% 2,402 8.0%Black or African American 1,763 5.9% 1,740 5.9% 1,703 5.7%Hispanic or Latino 2,155 7.2% 2,265 7.6% 2,447 8.2%Native Hawaiian or Other Pacific Islander 28 0.1% 29 0.1% 24 0.1%White 18,249 60.8% 17,946 60.4% 17,740 59.3%Two or More Races 367 1.2% 538 1.8% 639 2.1%Unknown Race/Ethnicity 3,187 10.6% 2,679 9.0% 2,545 8.5%Non-Resident Alien 1,910 6.4% 2,175 7.3% 2,378 7.9%Minority1 6,648 22.2% 6,928 23.3% 7,269 24.3%Grand Total 29,994 100% 29,728 100% 29,932 100%
0%
20%
40%
60%
80%
100%
Men Women AI or AN Asian Black Hispanicor Latino
NH orOPI
White Two orMoreRaces
Unknown NRA
Fall 2011 Fall 2012 Fall 2013
71
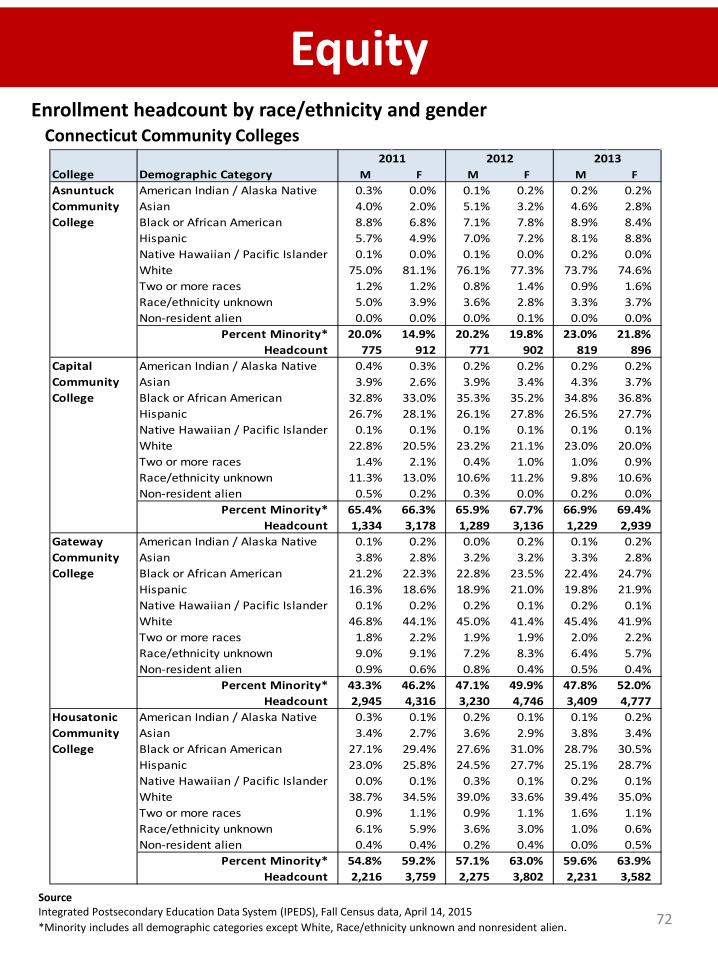
EquityEnrollment headcount by race/ethnicity and gender
SourceIntegrated Postsecondary Education Data System (IPEDS), Fall Census data, April 14, 2015*Minority includes all demographic categories except White, Race/ethnicity unknown and nonresident alien.
Connecticut Community Colleges
College Demographic Category M F M F M FAsnuntuck American Indian / Alaska Native 0.3% 0.0% 0.1% 0.2% 0.2% 0.2%Community Asian 4.0% 2.0% 5.1% 3.2% 4.6% 2.8%College Black or African American 8.8% 6.8% 7.1% 7.8% 8.9% 8.4%
Hispanic 5.7% 4.9% 7.0% 7.2% 8.1% 8.8%Native Hawaiian / Pacific Islander 0.1% 0.0% 0.1% 0.0% 0.2% 0.0%White 75.0% 81.1% 76.1% 77.3% 73.7% 74.6%Two or more races 1.2% 1.2% 0.8% 1.4% 0.9% 1.6%Race/ethnicity unknown 5.0% 3.9% 3.6% 2.8% 3.3% 3.7%Non-resident alien 0.0% 0.0% 0.0% 0.1% 0.0% 0.0%
Percent Minority* 20.0% 14.9% 20.2% 19.8% 23.0% 21.8%Headcount 775 912 771 902 819 896
Capital American Indian / Alaska Native 0.4% 0.3% 0.2% 0.2% 0.2% 0.2%Community Asian 3.9% 2.6% 3.9% 3.4% 4.3% 3.7%College Black or African American 32.8% 33.0% 35.3% 35.2% 34.8% 36.8%
Hispanic 26.7% 28.1% 26.1% 27.8% 26.5% 27.7%Native Hawaiian / Pacific Islander 0.1% 0.1% 0.1% 0.1% 0.1% 0.1%White 22.8% 20.5% 23.2% 21.1% 23.0% 20.0%Two or more races 1.4% 2.1% 0.4% 1.0% 1.0% 0.9%Race/ethnicity unknown 11.3% 13.0% 10.6% 11.2% 9.8% 10.6%Non-resident alien 0.5% 0.2% 0.3% 0.0% 0.2% 0.0%
Percent Minority* 65.4% 66.3% 65.9% 67.7% 66.9% 69.4%Headcount 1,334 3,178 1,289 3,136 1,229 2,939
Gateway American Indian / Alaska Native 0.1% 0.2% 0.0% 0.2% 0.1% 0.2%Community Asian 3.8% 2.8% 3.2% 3.2% 3.3% 2.8%College Black or African American 21.2% 22.3% 22.8% 23.5% 22.4% 24.7%
Hispanic 16.3% 18.6% 18.9% 21.0% 19.8% 21.9%Native Hawaiian / Pacific Islander 0.1% 0.2% 0.2% 0.1% 0.2% 0.1%White 46.8% 44.1% 45.0% 41.4% 45.4% 41.9%Two or more races 1.8% 2.2% 1.9% 1.9% 2.0% 2.2%Race/ethnicity unknown 9.0% 9.1% 7.2% 8.3% 6.4% 5.7%Non-resident alien 0.9% 0.6% 0.8% 0.4% 0.5% 0.4%
Percent Minority* 43.3% 46.2% 47.1% 49.9% 47.8% 52.0%Headcount 2,945 4,316 3,230 4,746 3,409 4,777
Housatonic American Indian / Alaska Native 0.3% 0.1% 0.2% 0.1% 0.1% 0.2%Community Asian 3.4% 2.7% 3.6% 2.9% 3.8% 3.4%College Black or African American 27.1% 29.4% 27.6% 31.0% 28.7% 30.5%
Hispanic 23.0% 25.8% 24.5% 27.7% 25.1% 28.7%Native Hawaiian / Pacific Islander 0.0% 0.1% 0.3% 0.1% 0.2% 0.1%White 38.7% 34.5% 39.0% 33.6% 39.4% 35.0%Two or more races 0.9% 1.1% 0.9% 1.1% 1.6% 1.1%Race/ethnicity unknown 6.1% 5.9% 3.6% 3.0% 1.0% 0.6%Non-resident alien 0.4% 0.4% 0.2% 0.4% 0.0% 0.5%
Percent Minority* 54.8% 59.2% 57.1% 63.0% 59.6% 63.9%Headcount 2,216 3,759 2,275 3,802 2,231 3,582
2011 2012 2013
72
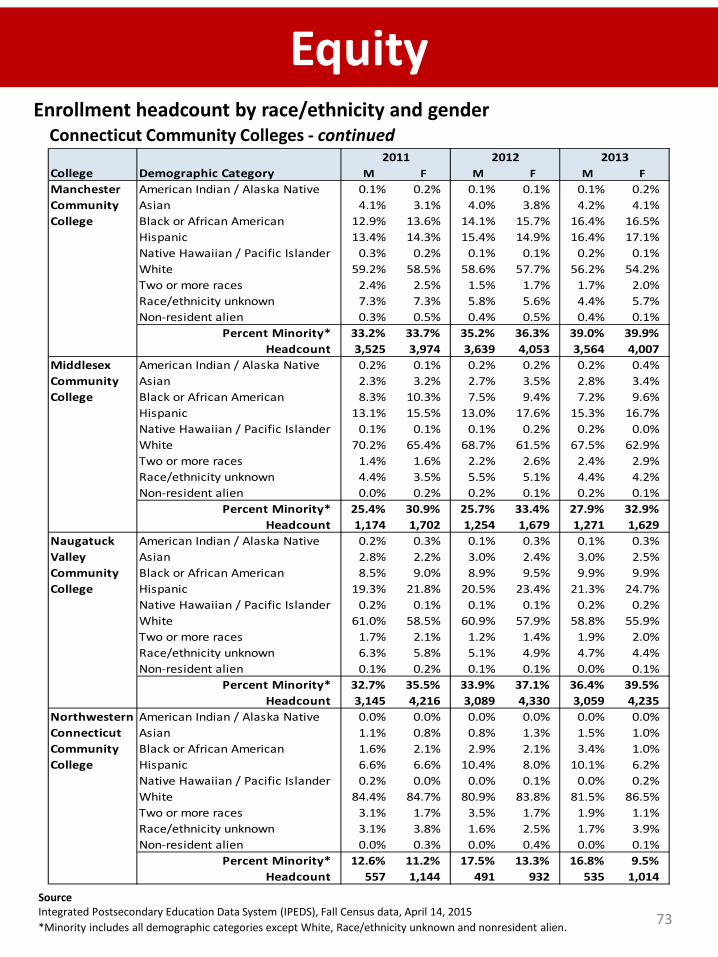
EquityEnrollment headcount by race/ethnicity and gender
Connecticut Community Colleges - continued
SourceIntegrated Postsecondary Education Data System (IPEDS), Fall Census data, April 14, 2015*Minority includes all demographic categories except White, Race/ethnicity unknown and nonresident alien.
College Demographic Category M F M F M FManchester American Indian / Alaska Native 0.1% 0.2% 0.1% 0.1% 0.1% 0.2%Community Asian 4.1% 3.1% 4.0% 3.8% 4.2% 4.1%College Black or African American 12.9% 13.6% 14.1% 15.7% 16.4% 16.5%
Hispanic 13.4% 14.3% 15.4% 14.9% 16.4% 17.1%Native Hawaiian / Pacific Islander 0.3% 0.2% 0.1% 0.1% 0.2% 0.1%White 59.2% 58.5% 58.6% 57.7% 56.2% 54.2%Two or more races 2.4% 2.5% 1.5% 1.7% 1.7% 2.0%Race/ethnicity unknown 7.3% 7.3% 5.8% 5.6% 4.4% 5.7%Non-resident alien 0.3% 0.5% 0.4% 0.5% 0.4% 0.1%
Percent Minority* 33.2% 33.7% 35.2% 36.3% 39.0% 39.9%Headcount 3,525 3,974 3,639 4,053 3,564 4,007
Middlesex American Indian / Alaska Native 0.2% 0.1% 0.2% 0.2% 0.2% 0.4%Community Asian 2.3% 3.2% 2.7% 3.5% 2.8% 3.4%College Black or African American 8.3% 10.3% 7.5% 9.4% 7.2% 9.6%
Hispanic 13.1% 15.5% 13.0% 17.6% 15.3% 16.7%Native Hawaiian / Pacific Islander 0.1% 0.1% 0.1% 0.2% 0.2% 0.0%White 70.2% 65.4% 68.7% 61.5% 67.5% 62.9%Two or more races 1.4% 1.6% 2.2% 2.6% 2.4% 2.9%Race/ethnicity unknown 4.4% 3.5% 5.5% 5.1% 4.4% 4.2%Non-resident alien 0.0% 0.2% 0.2% 0.1% 0.2% 0.1%
Percent Minority* 25.4% 30.9% 25.7% 33.4% 27.9% 32.9%Headcount 1,174 1,702 1,254 1,679 1,271 1,629
American Indian / Alaska Native 0.2% 0.3% 0.1% 0.3% 0.1% 0.3%Asian 2.8% 2.2% 3.0% 2.4% 3.0% 2.5%
Community Black or African American 8.5% 9.0% 8.9% 9.5% 9.9% 9.9%College Hispanic 19.3% 21.8% 20.5% 23.4% 21.3% 24.7%
Native Hawaiian / Pacific Islander 0.2% 0.1% 0.1% 0.1% 0.2% 0.2%White 61.0% 58.5% 60.9% 57.9% 58.8% 55.9%Two or more races 1.7% 2.1% 1.2% 1.4% 1.9% 2.0%Race/ethnicity unknown 6.3% 5.8% 5.1% 4.9% 4.7% 4.4%Non-resident alien 0.1% 0.2% 0.1% 0.1% 0.0% 0.1%
Percent Minority* 32.7% 35.5% 33.9% 37.1% 36.4% 39.5%Headcount 3,145 4,216 3,089 4,330 3,059 4,235
Northwestern American Indian / Alaska Native 0.0% 0.0% 0.0% 0.0% 0.0% 0.0%Connecticut Asian 1.1% 0.8% 0.8% 1.3% 1.5% 1.0%Community Black or African American 1.6% 2.1% 2.9% 2.1% 3.4% 1.0%College Hispanic 6.6% 6.6% 10.4% 8.0% 10.1% 6.2%
Native Hawaiian / Pacific Islander 0.2% 0.0% 0.0% 0.1% 0.0% 0.2%White 84.4% 84.7% 80.9% 83.8% 81.5% 86.5%Two or more races 3.1% 1.7% 3.5% 1.7% 1.9% 1.1%Race/ethnicity unknown 3.1% 3.8% 1.6% 2.5% 1.7% 3.9%Non-resident alien 0.0% 0.3% 0.0% 0.4% 0.0% 0.1%
Percent Minority* 12.6% 11.2% 17.5% 13.3% 16.8% 9.5%Headcount 557 1,144 491 932 535 1,014
Naugatuck Valley
2011 2012 2013
73
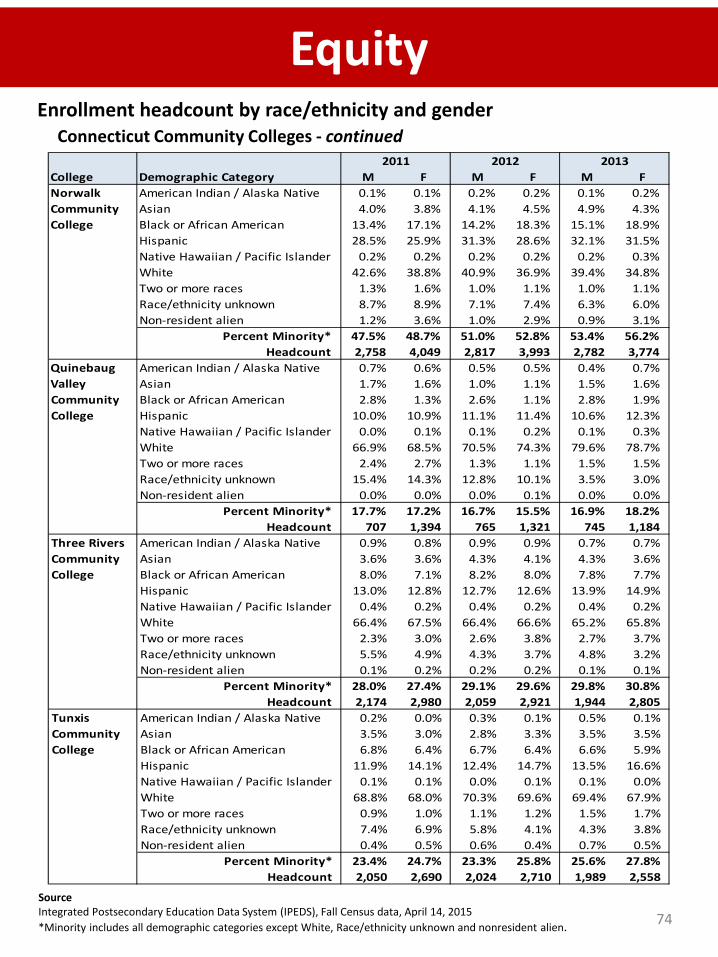
EquityEnrollment headcount by race/ethnicity and gender
Connecticut Community Colleges - continued
SourceIntegrated Postsecondary Education Data System (IPEDS), Fall Census data, April 14, 2015*Minority includes all demographic categories except White, Race/ethnicity unknown and nonresident alien.
College Demographic Category M F M F M FNorwalk American Indian / Alaska Native 0.1% 0.1% 0.2% 0.2% 0.1% 0.2%Community Asian 4.0% 3.8% 4.1% 4.5% 4.9% 4.3%College Black or African American 13.4% 17.1% 14.2% 18.3% 15.1% 18.9%
Hispanic 28.5% 25.9% 31.3% 28.6% 32.1% 31.5%Native Hawaiian / Pacific Islander 0.2% 0.2% 0.2% 0.2% 0.2% 0.3%White 42.6% 38.8% 40.9% 36.9% 39.4% 34.8%Two or more races 1.3% 1.6% 1.0% 1.1% 1.0% 1.1%Race/ethnicity unknown 8.7% 8.9% 7.1% 7.4% 6.3% 6.0%Non-resident alien 1.2% 3.6% 1.0% 2.9% 0.9% 3.1%
Percent Minority* 47.5% 48.7% 51.0% 52.8% 53.4% 56.2%Headcount 2,758 4,049 2,817 3,993 2,782 3,774
American Indian / Alaska Native 0.7% 0.6% 0.5% 0.5% 0.4% 0.7%Asian 1.7% 1.6% 1.0% 1.1% 1.5% 1.6%
Community Black or African American 2.8% 1.3% 2.6% 1.1% 2.8% 1.9%College Hispanic 10.0% 10.9% 11.1% 11.4% 10.6% 12.3%
Native Hawaiian / Pacific Islander 0.0% 0.1% 0.1% 0.2% 0.1% 0.3%White 66.9% 68.5% 70.5% 74.3% 79.6% 78.7%Two or more races 2.4% 2.7% 1.3% 1.1% 1.5% 1.5%Race/ethnicity unknown 15.4% 14.3% 12.8% 10.1% 3.5% 3.0%Non-resident alien 0.0% 0.0% 0.0% 0.1% 0.0% 0.0%
Percent Minority* 17.7% 17.2% 16.7% 15.5% 16.9% 18.2%Headcount 707 1,394 765 1,321 745 1,184
Three Rivers American Indian / Alaska Native 0.9% 0.8% 0.9% 0.9% 0.7% 0.7%Community Asian 3.6% 3.6% 4.3% 4.1% 4.3% 3.6%College Black or African American 8.0% 7.1% 8.2% 8.0% 7.8% 7.7%
Hispanic 13.0% 12.8% 12.7% 12.6% 13.9% 14.9%Native Hawaiian / Pacific Islander 0.4% 0.2% 0.4% 0.2% 0.4% 0.2%White 66.4% 67.5% 66.4% 66.6% 65.2% 65.8%Two or more races 2.3% 3.0% 2.6% 3.8% 2.7% 3.7%Race/ethnicity unknown 5.5% 4.9% 4.3% 3.7% 4.8% 3.2%Non-resident alien 0.1% 0.2% 0.2% 0.2% 0.1% 0.1%
Percent Minority* 28.0% 27.4% 29.1% 29.6% 29.8% 30.8%Headcount 2,174 2,980 2,059 2,921 1,944 2,805
Tunxis American Indian / Alaska Native 0.2% 0.0% 0.3% 0.1% 0.5% 0.1%Community Asian 3.5% 3.0% 2.8% 3.3% 3.5% 3.5%College Black or African American 6.8% 6.4% 6.7% 6.4% 6.6% 5.9%
Hispanic 11.9% 14.1% 12.4% 14.7% 13.5% 16.6%Native Hawaiian / Pacific Islander 0.1% 0.1% 0.0% 0.1% 0.1% 0.0%White 68.8% 68.0% 70.3% 69.6% 69.4% 67.9%Two or more races 0.9% 1.0% 1.1% 1.2% 1.5% 1.7%Race/ethnicity unknown 7.4% 6.9% 5.8% 4.1% 4.3% 3.8%Non-resident alien 0.4% 0.5% 0.6% 0.4% 0.7% 0.5%
Percent Minority* 23.4% 24.7% 23.3% 25.8% 25.6% 27.8%Headcount 2,050 2,690 2,024 2,710 1,989 2,558
2011 2012 2013
Quinebaug Valley
74
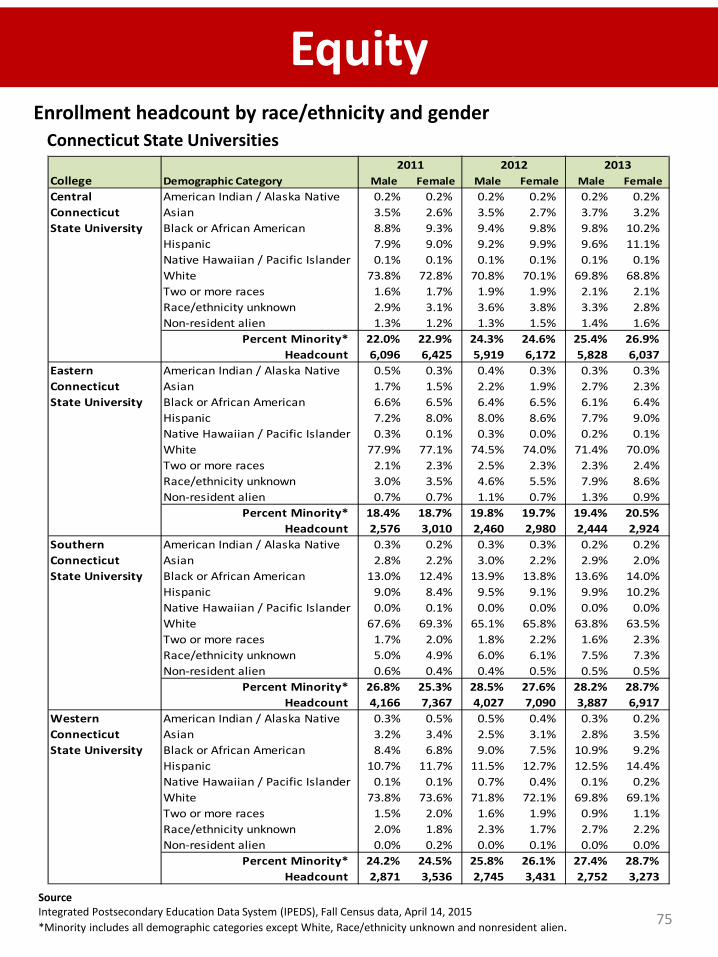
EquityEnrollment headcount by race/ethnicity and gender
Connecticut State Universities
SourceIntegrated Postsecondary Education Data System (IPEDS), Fall Census data, April 14, 2015*Minority includes all demographic categories except White, Race/ethnicity unknown and nonresident alien.
College Demographic Category Male Female Male Female Male FemaleCentral American Indian / Alaska Native 0.2% 0.2% 0.2% 0.2% 0.2% 0.2%Connecticut Asian 3.5% 2.6% 3.5% 2.7% 3.7% 3.2%State University Black or African American 8.8% 9.3% 9.4% 9.8% 9.8% 10.2%
Hispanic 7.9% 9.0% 9.2% 9.9% 9.6% 11.1%Native Hawaiian / Pacific Islander 0.1% 0.1% 0.1% 0.1% 0.1% 0.1%White 73.8% 72.8% 70.8% 70.1% 69.8% 68.8%Two or more races 1.6% 1.7% 1.9% 1.9% 2.1% 2.1%Race/ethnicity unknown 2.9% 3.1% 3.6% 3.8% 3.3% 2.8%Non-resident alien 1.3% 1.2% 1.3% 1.5% 1.4% 1.6%
Percent Minority* 22.0% 22.9% 24.3% 24.6% 25.4% 26.9%Headcount 6,096 6,425 5,919 6,172 5,828 6,037
Eastern American Indian / Alaska Native 0.5% 0.3% 0.4% 0.3% 0.3% 0.3%Connecticut Asian 1.7% 1.5% 2.2% 1.9% 2.7% 2.3%State University Black or African American 6.6% 6.5% 6.4% 6.5% 6.1% 6.4%
Hispanic 7.2% 8.0% 8.0% 8.6% 7.7% 9.0%Native Hawaiian / Pacific Islander 0.3% 0.1% 0.3% 0.0% 0.2% 0.1%White 77.9% 77.1% 74.5% 74.0% 71.4% 70.0%Two or more races 2.1% 2.3% 2.5% 2.3% 2.3% 2.4%Race/ethnicity unknown 3.0% 3.5% 4.6% 5.5% 7.9% 8.6%Non-resident alien 0.7% 0.7% 1.1% 0.7% 1.3% 0.9%
Percent Minority* 18.4% 18.7% 19.8% 19.7% 19.4% 20.5%Headcount 2,576 3,010 2,460 2,980 2,444 2,924
Southern American Indian / Alaska Native 0.3% 0.2% 0.3% 0.3% 0.2% 0.2%Connecticut Asian 2.8% 2.2% 3.0% 2.2% 2.9% 2.0%State University Black or African American 13.0% 12.4% 13.9% 13.8% 13.6% 14.0%
Hispanic 9.0% 8.4% 9.5% 9.1% 9.9% 10.2%Native Hawaiian / Pacific Islander 0.0% 0.1% 0.0% 0.0% 0.0% 0.0%White 67.6% 69.3% 65.1% 65.8% 63.8% 63.5%Two or more races 1.7% 2.0% 1.8% 2.2% 1.6% 2.3%Race/ethnicity unknown 5.0% 4.9% 6.0% 6.1% 7.5% 7.3%Non-resident alien 0.6% 0.4% 0.4% 0.5% 0.5% 0.5%
Percent Minority* 26.8% 25.3% 28.5% 27.6% 28.2% 28.7%Headcount 4,166 7,367 4,027 7,090 3,887 6,917
Western American Indian / Alaska Native 0.3% 0.5% 0.5% 0.4% 0.3% 0.2%Connecticut Asian 3.2% 3.4% 2.5% 3.1% 2.8% 3.5%State University Black or African American 8.4% 6.8% 9.0% 7.5% 10.9% 9.2%
Hispanic 10.7% 11.7% 11.5% 12.7% 12.5% 14.4%Native Hawaiian / Pacific Islander 0.1% 0.1% 0.7% 0.4% 0.1% 0.2%White 73.8% 73.6% 71.8% 72.1% 69.8% 69.1%Two or more races 1.5% 2.0% 1.6% 1.9% 0.9% 1.1%Race/ethnicity unknown 2.0% 1.8% 2.3% 1.7% 2.7% 2.2%Non-resident alien 0.0% 0.2% 0.0% 0.1% 0.0% 0.0%
Percent Minority* 24.2% 24.5% 25.8% 26.1% 27.4% 28.7%Headcount 2,871 3,536 2,745 3,431 2,752 3,273
2011 2012 2013
75
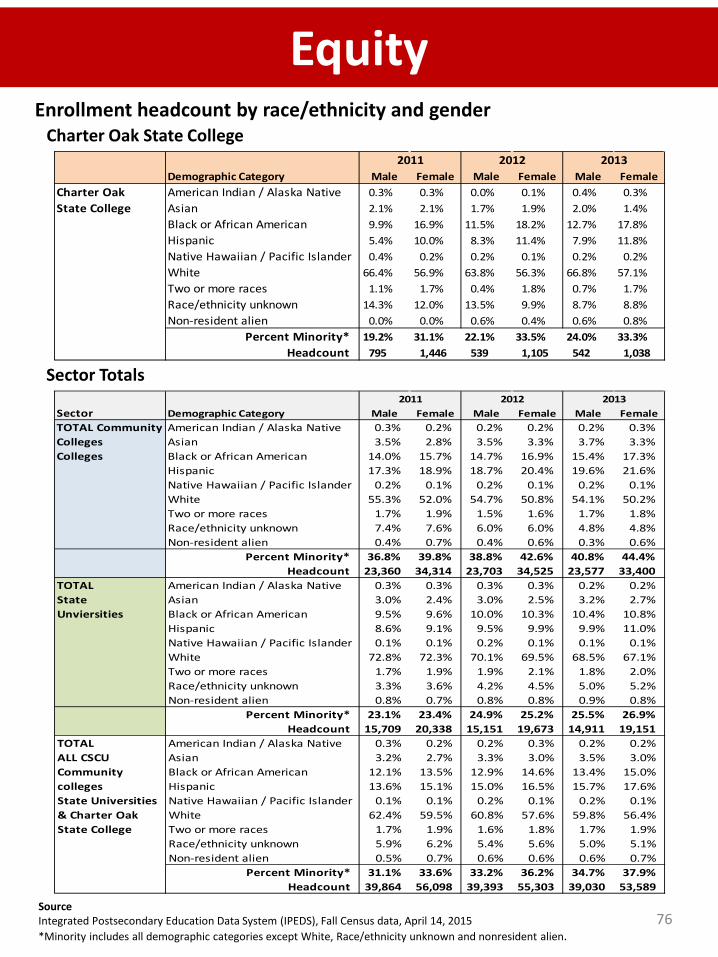
SourceIntegrated Postsecondary Education Data System (IPEDS), Fall Census data, April 14, 2015*Minority includes all demographic categories except White, Race/ethnicity unknown and nonresident alien.
Equity
Sector Totals
Enrollment headcount by race/ethnicity and gender Charter Oak State College
Sector Demographic Category Male Female Male Female Male FemaleAmerican Indian / Alaska Native 0.3% 0.2% 0.2% 0.2% 0.2% 0.3%Asian 3.5% 2.8% 3.5% 3.3% 3.7% 3.3%
Colleges Black or African American 14.0% 15.7% 14.7% 16.9% 15.4% 17.3%Hispanic 17.3% 18.9% 18.7% 20.4% 19.6% 21.6%Native Hawaiian / Pacific Islander 0.2% 0.1% 0.2% 0.1% 0.2% 0.1%White 55.3% 52.0% 54.7% 50.8% 54.1% 50.2%Two or more races 1.7% 1.9% 1.5% 1.6% 1.7% 1.8%Race/ethnicity unknown 7.4% 7.6% 6.0% 6.0% 4.8% 4.8%Non-resident alien 0.4% 0.7% 0.4% 0.6% 0.3% 0.6%
Percent Minority* 36.8% 39.8% 38.8% 42.6% 40.8% 44.4%Headcount 23,360 34,314 23,703 34,525 23,577 33,400
TOTAL American Indian / Alaska Native 0.3% 0.3% 0.3% 0.3% 0.2% 0.2%State Asian 3.0% 2.4% 3.0% 2.5% 3.2% 2.7%Unviersities Black or African American 9.5% 9.6% 10.0% 10.3% 10.4% 10.8%
Hispanic 8.6% 9.1% 9.5% 9.9% 9.9% 11.0%Native Hawaiian / Pacific Islander 0.1% 0.1% 0.2% 0.1% 0.1% 0.1%White 72.8% 72.3% 70.1% 69.5% 68.5% 67.1%Two or more races 1.7% 1.9% 1.9% 2.1% 1.8% 2.0%Race/ethnicity unknown 3.3% 3.6% 4.2% 4.5% 5.0% 5.2%Non-resident alien 0.8% 0.7% 0.8% 0.8% 0.9% 0.8%
Percent Minority* 23.1% 23.4% 24.9% 25.2% 25.5% 26.9%Headcount 15,709 20,338 15,151 19,673 14,911 19,151
TOTAL American Indian / Alaska Native 0.3% 0.2% 0.2% 0.3% 0.2% 0.2%ALL CSCU Asian 3.2% 2.7% 3.3% 3.0% 3.5% 3.0%Community Black or African American 12.1% 13.5% 12.9% 14.6% 13.4% 15.0%colleges Hispanic 13.6% 15.1% 15.0% 16.5% 15.7% 17.6%State Universities Native Hawaiian / Pacific Islander 0.1% 0.1% 0.2% 0.1% 0.2% 0.1%& Charter Oak White 62.4% 59.5% 60.8% 57.6% 59.8% 56.4%State College Two or more races 1.7% 1.9% 1.6% 1.8% 1.7% 1.9%
Race/ethnicity unknown 5.9% 6.2% 5.4% 5.6% 5.0% 5.1%Non-resident alien 0.5% 0.7% 0.6% 0.6% 0.6% 0.7%
Percent Minority* 31.1% 33.6% 33.2% 36.2% 34.7% 37.9%Headcount 39,864 56,098 39,393 55,303 39,030 53,589
2011 2012 2013
TOTAL Community Colleges
Demographic Category Male Female Male Female Male FemaleCharter Oak American Indian / Alaska Native 0.3% 0.3% 0.0% 0.1% 0.4% 0.3%State College Asian 2.1% 2.1% 1.7% 1.9% 2.0% 1.4%
Black or African American 9.9% 16.9% 11.5% 18.2% 12.7% 17.8%Hispanic 5.4% 10.0% 8.3% 11.4% 7.9% 11.8%Native Hawaiian / Pacific Islander 0.4% 0.2% 0.2% 0.1% 0.2% 0.2%White 66.4% 56.9% 63.8% 56.3% 66.8% 57.1%Two or more races 1.1% 1.7% 0.4% 1.8% 0.7% 1.7%Race/ethnicity unknown 14.3% 12.0% 13.5% 9.9% 8.7% 8.8%Non-resident alien 0.0% 0.0% 0.6% 0.4% 0.6% 0.8%
Percent Minority* 19.2% 31.1% 22.1% 33.5% 24.0% 33.3%Headcount 795 1,446 539 1,105 542 1,038
2011 2012 2013
76
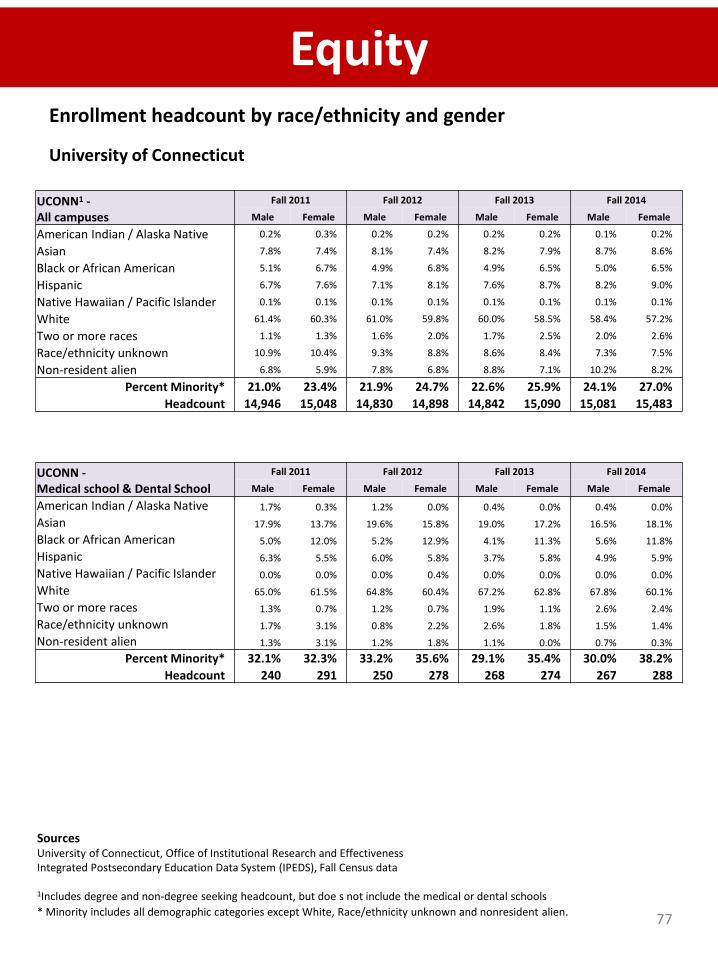
EquityEnrollment headcount by race/ethnicity and gender
University of Connecticut
SourcesUniversity of Connecticut, Office of Institutional Research and EffectivenessIntegrated Postsecondary Education Data System (IPEDS), Fall Census data
1Includes degree and non-degree seeking headcount, but doe s not include the medical or dental schools* Minority includes all demographic categories except White, Race/ethnicity unknown and nonresident alien.
UCONN1 -All campuses
Fall 2011 Fall 2012 Fall 2013 Fall 2014
Male Female Male Female Male Female Male Female
American Indian / Alaska Native 0.2% 0.3% 0.2% 0.2% 0.2% 0.2% 0.1% 0.2%
Asian 7.8% 7.4% 8.1% 7.4% 8.2% 7.9% 8.7% 8.6%
Black or African American 5.1% 6.7% 4.9% 6.8% 4.9% 6.5% 5.0% 6.5%
Hispanic 6.7% 7.6% 7.1% 8.1% 7.6% 8.7% 8.2% 9.0%
Native Hawaiian / Pacific Islander 0.1% 0.1% 0.1% 0.1% 0.1% 0.1% 0.1% 0.1%
White 61.4% 60.3% 61.0% 59.8% 60.0% 58.5% 58.4% 57.2%
Two or more races 1.1% 1.3% 1.6% 2.0% 1.7% 2.5% 2.0% 2.6%
Race/ethnicity unknown 10.9% 10.4% 9.3% 8.8% 8.6% 8.4% 7.3% 7.5%
Non-resident alien 6.8% 5.9% 7.8% 6.8% 8.8% 7.1% 10.2% 8.2%
Percent Minority* 21.0% 23.4% 21.9% 24.7% 22.6% 25.9% 24.1% 27.0%Headcount 14,946 15,048 14,830 14,898 14,842 15,090 15,081 15,483
UCONN -Medical school & Dental School
Fall 2011 Fall 2012 Fall 2013 Fall 2014
Male Female Male Female Male Female Male Female
American Indian / Alaska Native 1.7% 0.3% 1.2% 0.0% 0.4% 0.0% 0.4% 0.0%Asian 17.9% 13.7% 19.6% 15.8% 19.0% 17.2% 16.5% 18.1%Black or African American 5.0% 12.0% 5.2% 12.9% 4.1% 11.3% 5.6% 11.8%Hispanic 6.3% 5.5% 6.0% 5.8% 3.7% 5.8% 4.9% 5.9%Native Hawaiian / Pacific Islander 0.0% 0.0% 0.0% 0.4% 0.0% 0.0% 0.0% 0.0%White 65.0% 61.5% 64.8% 60.4% 67.2% 62.8% 67.8% 60.1%Two or more races 1.3% 0.7% 1.2% 0.7% 1.9% 1.1% 2.6% 2.4%Race/ethnicity unknown 1.7% 3.1% 0.8% 2.2% 2.6% 1.8% 1.5% 1.4%Non-resident alien 1.3% 3.1% 1.2% 1.8% 1.1% 0.0% 0.7% 0.3%
Percent Minority* 32.1% 32.3% 33.2% 35.6% 29.1% 35.4% 30.0% 38.2%Headcount 240 291 250 278 268 274 267 288
77

Equity
SourceIntegrated Postsecondary Education Data System (IPEDS), Number of Completions/Awards/degrees conferred. This is not an unduplicated count of students; rather, individuals who received more than one credential are counted for each degree earned.Notes:‘AI or AN’ means American Indian or Alaska Native; The full title for ‘Black’ is Black or African American; ‘NH or OPI’ stands for Native Hawaiian or Other Pacific Islander; ‘Unknown’ means Race / Ethnicity are unknown; ‘NRA’ stands for Non-resident Alien.1Minority includes all race / ethnicity categories except white, Race/ethnicity unknown and Non-resident alien.*Data entered into IPEDS by the Office of Higher Education may have been modified for one or more of these report years and may account for some minor discrepancies.
Completions by race/ethnicity and gender*
Connecticut Community Colleges
0%
20%
40%
60%
80%
100%
Men Women AI or AN Asian Black Hispanicor Latino
NH orOPI
White Two ormoreraces
Unknown NRA
2011 2012 2013
2010-2011 2011-2012 2012-2013Connecticut Community Colleges N % N % N %Total Men 2,429 38.7% 2,447 38.2% 2,726 39.2%Total Women 3,853 61.3% 3,963 61.8% 4,236 60.8%American Indian or Alaska Native 11 0.2% 22 0.3% 11 0.2%Asian 174 2.8% 209 3.3% 251 3.6%Black or African American 618 9.8% 793 12.4% 735 10.6%Hispanic or Latino 849 13.5% 944 14.7% 1,033 14.8%Native Hawaiian or Other Pacific Islander 9 0.1% 9 0.1% 9 0.1%White 3,380 53.8% 3,995 62.3% 4,250 61.0%Two or more races 173 2.8% 83 1.3% 93 1.3%Race/ethnicity unknown 952 15.2% 268 4.2% 513 7.4%Nonresident alien 116 1.8% 87 1.4% 67 1.0%
Minority1 1,834 29.2% 2,060 32.1% 2,132 30.6%Grand Total 6,282 100% 6,410 100% 6,962 100%
78
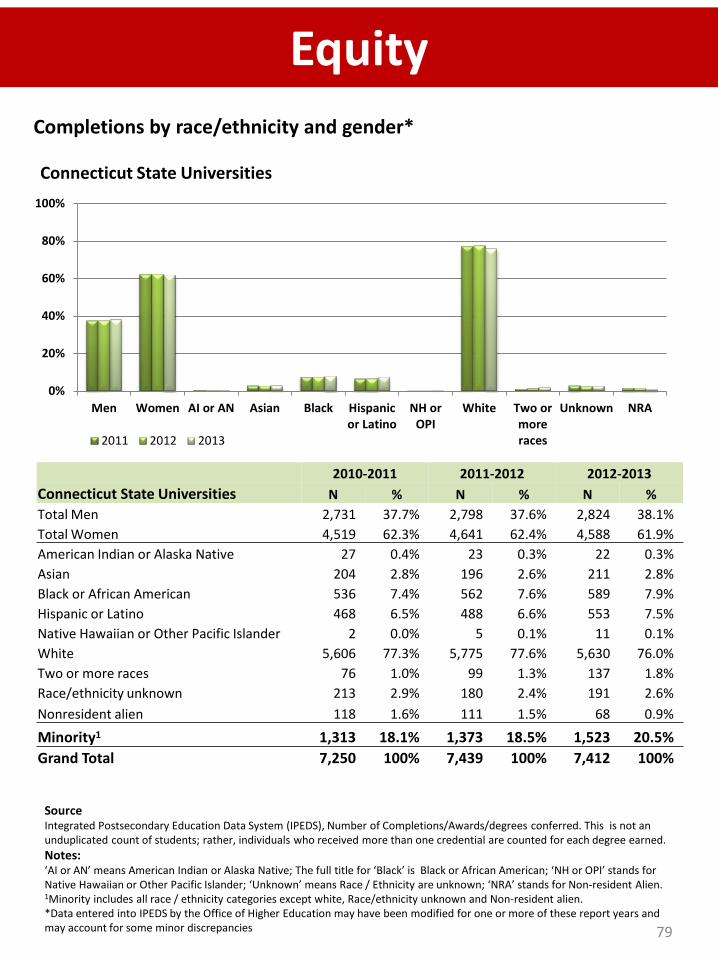
EquityCompletions by race/ethnicity and gender*
Connecticut State Universities
0%
20%
40%
60%
80%
100%
Men Women AI or AN Asian Black Hispanicor Latino
NH orOPI
White Two ormoreraces
Unknown NRA
2011 2012 2013
SourceIntegrated Postsecondary Education Data System (IPEDS), Number of Completions/Awards/degrees conferred. This is not an unduplicated count of students; rather, individuals who received more than one credential are counted for each degree earned.Notes:‘AI or AN’ means American Indian or Alaska Native; The full title for ‘Black’ is Black or African American; ‘NH or OPI’ stands for Native Hawaiian or Other Pacific Islander; ‘Unknown’ means Race / Ethnicity are unknown; ‘NRA’ stands for Non-resident Alien.1Minority includes all race / ethnicity categories except white, Race/ethnicity unknown and Non-resident alien.*Data entered into IPEDS by the Office of Higher Education may have been modified for one or more of these report years and may account for some minor discrepancies
2010-2011 2011-2012 2012-2013Connecticut State Universities N % N % N %Total Men 2,731 37.7% 2,798 37.6% 2,824 38.1%Total Women 4,519 62.3% 4,641 62.4% 4,588 61.9%American Indian or Alaska Native 27 0.4% 23 0.3% 22 0.3%Asian 204 2.8% 196 2.6% 211 2.8%Black or African American 536 7.4% 562 7.6% 589 7.9%Hispanic or Latino 468 6.5% 488 6.6% 553 7.5%Native Hawaiian or Other Pacific Islander 2 0.0% 5 0.1% 11 0.1%White 5,606 77.3% 5,775 77.6% 5,630 76.0%Two or more races 76 1.0% 99 1.3% 137 1.8%Race/ethnicity unknown 213 2.9% 180 2.4% 191 2.6%Nonresident alien 118 1.6% 111 1.5% 68 0.9%
Minority1 1,313 18.1% 1,373 18.5% 1,523 20.5%Grand Total 7,250 100% 7,439 100% 7,412 100%
79

EquityCompletions by race/ethnicity and gender*
Charter Oak State College
0%
20%
40%
60%
80%
100%
Men Women AI or AN Asian Black Hispanicor Latino
NH or OPI White Two ormoreraces
Unknown NRA
2011 2012 2013
SourceIntegrated Postsecondary Education Data System (IPEDS), Number of Completions/Awards/degrees conferred. This is not an unduplicated count of students; rather, individuals who received more than one credential are counted for each degree earned.Notes:‘AI or AN’ means American Indian or Alaska Native; The full title for ‘Black’ is Black or African American; ‘NH or OPI’ stands for Native Hawaiian or Other Pacific Islander; ‘Unknown’ means Race / Ethnicity are unknown; ‘NRA’ stands for Non-resident Alien.1Minority includes all race / ethnicity categories except white, Race/ethnicity unknown and Non-resident alien.*Data entered into IPEDS by the Office of Higher Education may have been modified for one or more of these report years and may account for some minor discrepancies.
2010-2011 2011-2012 2012-2013Charter Oak State College N % N % N %Total Men 245 38.6% 196 29.7% 186 31.2%Total Women 390 61.4% 463 70.3% 410 68.8%American Indian or Alaska Native 5 0.8% 1 0.2% 4 0.7%Asian 14 2.2% 11 1.7% 14 2.3%Black or African American 98 15.4% 89 13.5% 85 14.3%Hispanic or Latino 48 7.6% 46 7.0% 55 9.2%Native Hawaiian or Other Pacific Islander 0 0.0% 1 0.2% 0 0.0%White 420 66.1% 368 55.8% 355 59.6%Two or more races 0 0.0% 9 1.4% 7 1.2%Race/ethnicity unknown 49 7.7% 132 20.0% 74 12.4%Nonresident alien 1 0.2% 2 0.3% 2 0.3%
Minority1 165 26.0% 157 23.8% 165 27.7%Grand Total 635 100% 659 100% 596 100%
80

EquityCompletions by race/ethnicity and gender*
University of Connecticut – all branches
0%
20%
40%
60%
80%
100%
Men Women AI or AN Asian Black Hispanicor Latino
NH or OPI White Two ormoreraces
Unknown NRA
2011 2012 2013
2010-2011 2011-2012 2012-2013University of Connecticut N % N % N %Total Men 3,466 46.4% 3,502 46.8% 3,423 46.7%Total Women 4,004 53.6% 3,980 53.2% 3,899 53.3%American Indian or Alaska Native 18 0.2% 16 0.2% 20 0.3%Asian 516 6.9% 554 7.4% 529 7.2%Black or African American 392 5.2% 411 5.5% 377 5.1%Hispanic or Latino 400 5.4% 426 5.7% 417 5.7%Native Hawaiian or Other Pacific Islander 1 0.0% 1 0.0% 10 0.1%White 4,739 63.4% 4,699 62.8% 4,686 64.0%Two or more races 14 0.2% 18 0.2% 51 0.7%Race/ethnicity unknown 988 13.2% 925 12.4% 774 10.6%Nonresident alien 402 5.4% 432 5.8% 458 6.3%
Minority1 1,341 18.0% 1,426 19.1% 1,404 19.2%Grand total 7,470 100.0% 7,482 100.0% 7,322 100.0%
SourceIntegrated Postsecondary Education Data System (IPEDS), Number of Completions/Awards/degrees conferred. This is not an unduplicated count of students; rather, individuals who received more than one credential are counted for each degree earned.Notes:‘AI or AN’ means American Indian or Alaska Native; The full title for ‘Black’ is Black or African American; ‘NH or OPI’ stands for Native Hawaiian or Other Pacific Islander; ‘Unknown’ means Race / Ethnicity are unknown; ‘NRA’ stands for Non-resident Alien.1Minority includes all race / ethnicity categories except white, Race/ethnicity unknown and Non-resident alien.*Data entered into IPEDS by the Office of Higher Education may have been modified for one or more of these report years and may account for some minor discrepancies. 81
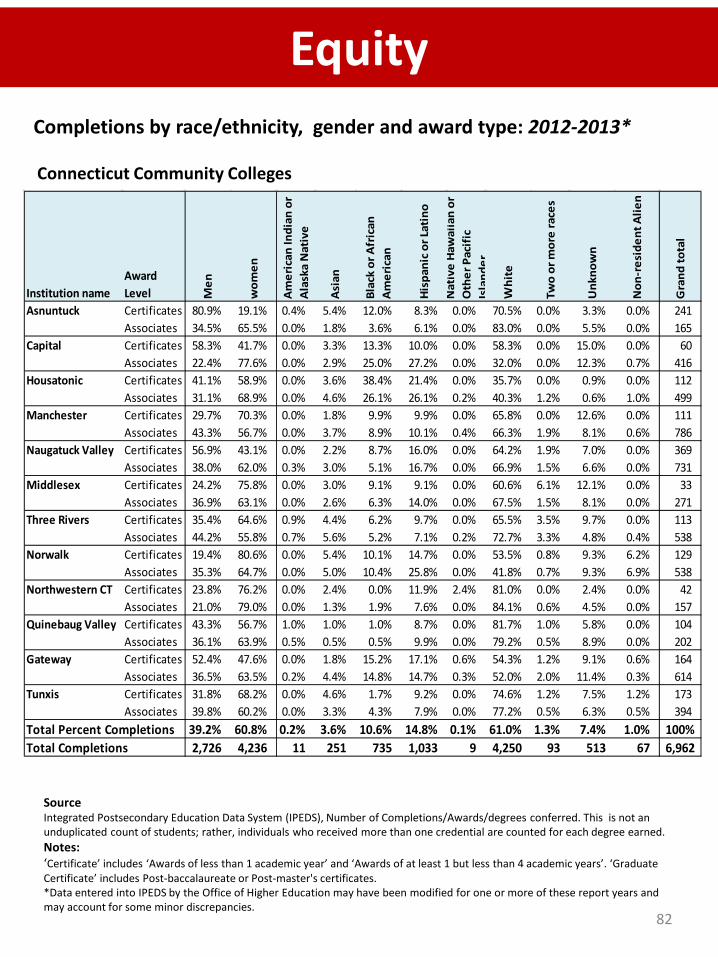
Equity
SourceIntegrated Postsecondary Education Data System (IPEDS), Number of Completions/Awards/degrees conferred. This is not an unduplicated count of students; rather, individuals who received more than one credential are counted for each degree earned.Notes:‘Certificate’ includes ‘Awards of less than 1 academic year’ and ‘Awards of at least 1 but less than 4 academic years’. ‘Graduate Certificate’ includes Post-baccalaureate or Post-master's certificates.*Data entered into IPEDS by the Office of Higher Education may have been modified for one or more of these report years and may account for some minor discrepancies.
Completions by race/ethnicity, gender and award type: 2012-2013*
Connecticut Community Colleges
Institution nameAward Level M
en
wom
en
Am
eric
an In
dian
or
Ala
ska
Nat
ive
Asi
an
Blac
k or
Afr
ican
A
mer
ican
His
pani
c or
Lat
ino
Nat
ive
Haw
aiia
n or
O
ther
Pac
ific
Is
land
er
Whi
te
Two
or m
ore
race
s
Unk
now
n
Non
-res
iden
t Alie
n
Gra
nd to
tal
Asnuntuck Certificates 80.9% 19.1% 0.4% 5.4% 12.0% 8.3% 0.0% 70.5% 0.0% 3.3% 0.0% 241Associates 34.5% 65.5% 0.0% 1.8% 3.6% 6.1% 0.0% 83.0% 0.0% 5.5% 0.0% 165
Capital Certificates 58.3% 41.7% 0.0% 3.3% 13.3% 10.0% 0.0% 58.3% 0.0% 15.0% 0.0% 60Associates 22.4% 77.6% 0.0% 2.9% 25.0% 27.2% 0.0% 32.0% 0.0% 12.3% 0.7% 416
Housatonic Certificates 41.1% 58.9% 0.0% 3.6% 38.4% 21.4% 0.0% 35.7% 0.0% 0.9% 0.0% 112Associates 31.1% 68.9% 0.0% 4.6% 26.1% 26.1% 0.2% 40.3% 1.2% 0.6% 1.0% 499
Manchester Certificates 29.7% 70.3% 0.0% 1.8% 9.9% 9.9% 0.0% 65.8% 0.0% 12.6% 0.0% 111Associates 43.3% 56.7% 0.0% 3.7% 8.9% 10.1% 0.4% 66.3% 1.9% 8.1% 0.6% 786
Naugatuck Valley Certificates 56.9% 43.1% 0.0% 2.2% 8.7% 16.0% 0.0% 64.2% 1.9% 7.0% 0.0% 369Associates 38.0% 62.0% 0.3% 3.0% 5.1% 16.7% 0.0% 66.9% 1.5% 6.6% 0.0% 731
Middlesex Certificates 24.2% 75.8% 0.0% 3.0% 9.1% 9.1% 0.0% 60.6% 6.1% 12.1% 0.0% 33Associates 36.9% 63.1% 0.0% 2.6% 6.3% 14.0% 0.0% 67.5% 1.5% 8.1% 0.0% 271
Three Rivers Certificates 35.4% 64.6% 0.9% 4.4% 6.2% 9.7% 0.0% 65.5% 3.5% 9.7% 0.0% 113Associates 44.2% 55.8% 0.7% 5.6% 5.2% 7.1% 0.2% 72.7% 3.3% 4.8% 0.4% 538
Norwalk Certificates 19.4% 80.6% 0.0% 5.4% 10.1% 14.7% 0.0% 53.5% 0.8% 9.3% 6.2% 129Associates 35.3% 64.7% 0.0% 5.0% 10.4% 25.8% 0.0% 41.8% 0.7% 9.3% 6.9% 538
Northwestern CT Certificates 23.8% 76.2% 0.0% 2.4% 0.0% 11.9% 2.4% 81.0% 0.0% 2.4% 0.0% 42Associates 21.0% 79.0% 0.0% 1.3% 1.9% 7.6% 0.0% 84.1% 0.6% 4.5% 0.0% 157
Quinebaug Valley Certificates 43.3% 56.7% 1.0% 1.0% 1.0% 8.7% 0.0% 81.7% 1.0% 5.8% 0.0% 104Associates 36.1% 63.9% 0.5% 0.5% 0.5% 9.9% 0.0% 79.2% 0.5% 8.9% 0.0% 202
Gateway Certificates 52.4% 47.6% 0.0% 1.8% 15.2% 17.1% 0.6% 54.3% 1.2% 9.1% 0.6% 164Associates 36.5% 63.5% 0.2% 4.4% 14.8% 14.7% 0.3% 52.0% 2.0% 11.4% 0.3% 614
Tunxis Certificates 31.8% 68.2% 0.0% 4.6% 1.7% 9.2% 0.0% 74.6% 1.2% 7.5% 1.2% 173Associates 39.8% 60.2% 0.0% 3.3% 4.3% 7.9% 0.0% 77.2% 0.5% 6.3% 0.5% 394
39.2% 60.8% 0.2% 3.6% 10.6% 14.8% 0.1% 61.0% 1.3% 7.4% 1.0% 100%2,726 4,236 11 251 735 1,033 9 4,250 93 513 67 6,962Total Completions
Total Percent Completions
82
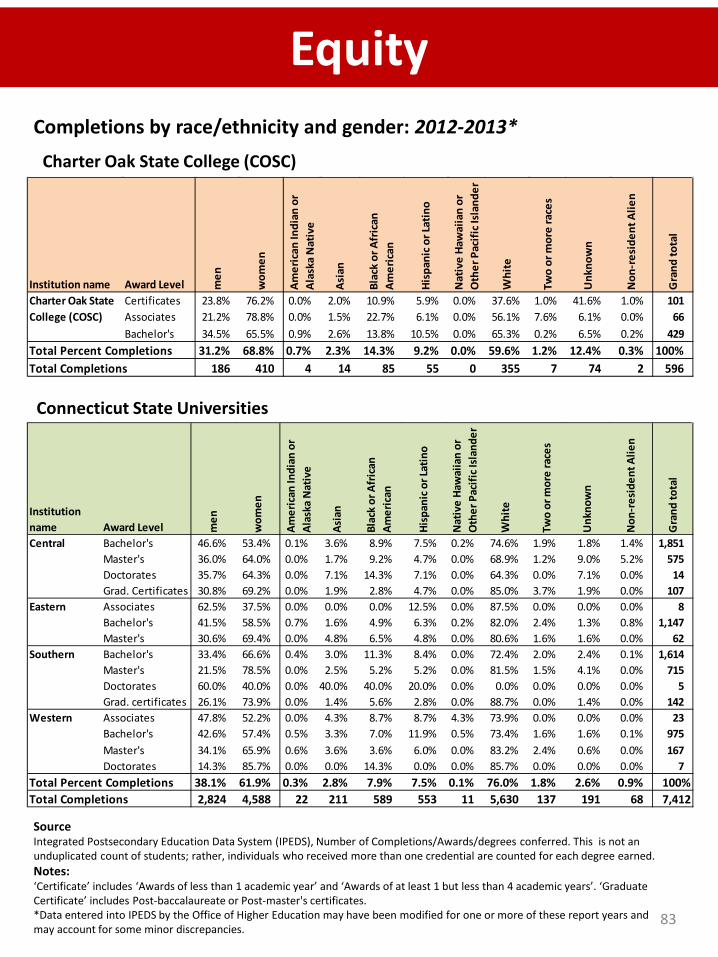
EquityCompletions by race/ethnicity and gender: 2012-2013*
Connecticut State Universities
Charter Oak State College (COSC)
SourceIntegrated Postsecondary Education Data System (IPEDS), Number of Completions/Awards/degrees conferred. This is not an unduplicated count of students; rather, individuals who received more than one credential are counted for each degree earned.Notes:‘Certificate’ includes ‘Awards of less than 1 academic year’ and ‘Awards of at least 1 but less than 4 academic years’. ‘Graduate Certificate’ includes Post-baccalaureate or Post-master's certificates.*Data entered into IPEDS by the Office of Higher Education may have been modified for one or more of these report years and may account for some minor discrepancies.
Institution name Award Level men
wom
en
Amer
ican
Indi
an o
r Al
aska
Nat
ive
Asia
n
Blac
k or
Afr
ican
Am
eric
an
Hisp
anic
or L
atin
o
Nat
ive
Haw
aiia
n or
O
ther
Pac
ific I
slan
der
Whi
te
Two
or m
ore
race
s
Unk
now
n
Non
-res
iden
t Alie
n
Gra
nd to
tal
Charter Oak State Certificates 23.8% 76.2% 0.0% 2.0% 10.9% 5.9% 0.0% 37.6% 1.0% 41.6% 1.0% 101College (COSC) Associates 21.2% 78.8% 0.0% 1.5% 22.7% 6.1% 0.0% 56.1% 7.6% 6.1% 0.0% 66
Bachelor's 34.5% 65.5% 0.9% 2.6% 13.8% 10.5% 0.0% 65.3% 0.2% 6.5% 0.2% 42931.2% 68.8% 0.7% 2.3% 14.3% 9.2% 0.0% 59.6% 1.2% 12.4% 0.3% 100%
186 410 4 14 85 55 0 355 7 74 2 596Total Percent CompletionsTotal Completions
Institution name Award Level m
en
wom
en
Amer
ican
Indi
an o
r Al
aska
Nat
ive
Asia
n
Blac
k or
Afr
ican
Am
eric
an
Hisp
anic
or L
atin
o
Nat
ive
Haw
aiia
n or
O
ther
Pac
ific I
slan
der
Whi
te
Two
or m
ore
race
s
Unk
now
n
Non
-res
iden
t Alie
n
Gra
nd to
tal
Central Bachelor's 46.6% 53.4% 0.1% 3.6% 8.9% 7.5% 0.2% 74.6% 1.9% 1.8% 1.4% 1,851Master's 36.0% 64.0% 0.0% 1.7% 9.2% 4.7% 0.0% 68.9% 1.2% 9.0% 5.2% 575Doctorates 35.7% 64.3% 0.0% 7.1% 14.3% 7.1% 0.0% 64.3% 0.0% 7.1% 0.0% 14Grad. Certificates 30.8% 69.2% 0.0% 1.9% 2.8% 4.7% 0.0% 85.0% 3.7% 1.9% 0.0% 107
Eastern Associates 62.5% 37.5% 0.0% 0.0% 0.0% 12.5% 0.0% 87.5% 0.0% 0.0% 0.0% 8Bachelor's 41.5% 58.5% 0.7% 1.6% 4.9% 6.3% 0.2% 82.0% 2.4% 1.3% 0.8% 1,147Master's 30.6% 69.4% 0.0% 4.8% 6.5% 4.8% 0.0% 80.6% 1.6% 1.6% 0.0% 62
Southern Bachelor's 33.4% 66.6% 0.4% 3.0% 11.3% 8.4% 0.0% 72.4% 2.0% 2.4% 0.1% 1,614Master's 21.5% 78.5% 0.0% 2.5% 5.2% 5.2% 0.0% 81.5% 1.5% 4.1% 0.0% 715Doctorates 60.0% 40.0% 0.0% 40.0% 40.0% 20.0% 0.0% 0.0% 0.0% 0.0% 0.0% 5Grad. certificates 26.1% 73.9% 0.0% 1.4% 5.6% 2.8% 0.0% 88.7% 0.0% 1.4% 0.0% 142
Western Associates 47.8% 52.2% 0.0% 4.3% 8.7% 8.7% 4.3% 73.9% 0.0% 0.0% 0.0% 23Bachelor's 42.6% 57.4% 0.5% 3.3% 7.0% 11.9% 0.5% 73.4% 1.6% 1.6% 0.1% 975Master's 34.1% 65.9% 0.6% 3.6% 3.6% 6.0% 0.0% 83.2% 2.4% 0.6% 0.0% 167Doctorates 14.3% 85.7% 0.0% 0.0% 14.3% 0.0% 0.0% 85.7% 0.0% 0.0% 0.0% 7
38.1% 61.9% 0.3% 2.8% 7.9% 7.5% 0.1% 76.0% 1.8% 2.6% 0.9% 100%2,824 4,588 22 211 589 553 11 5,630 137 191 68 7,412Total Completions
Total Percent Completions
83
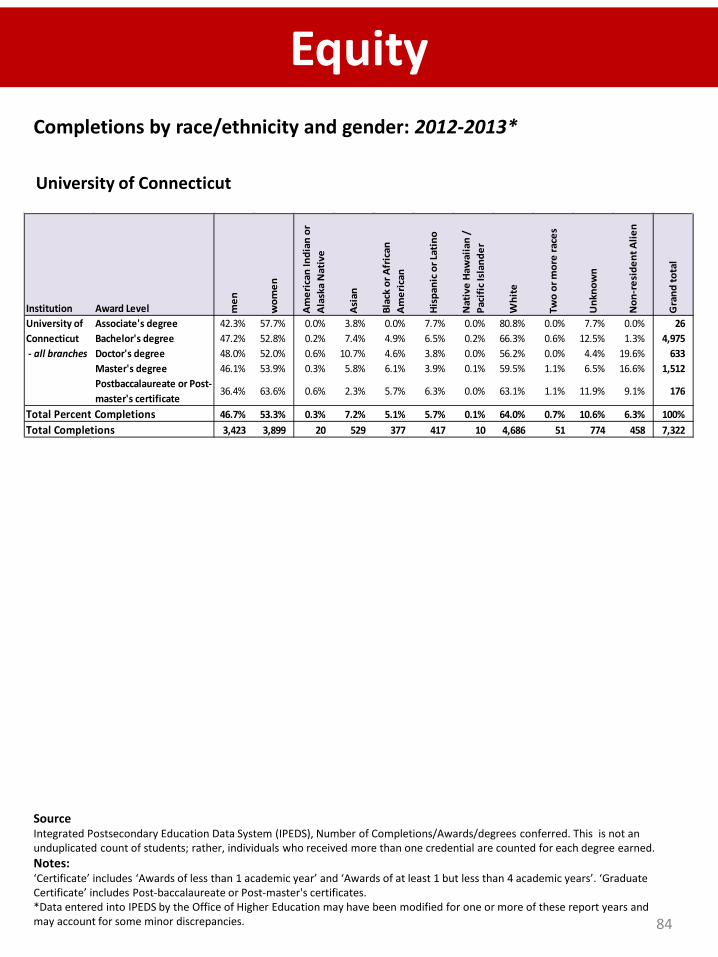
EquityCompletions by race/ethnicity and gender: 2012-2013*
University of Connecticut
SourceIntegrated Postsecondary Education Data System (IPEDS), Number of Completions/Awards/degrees conferred. This is not an unduplicated count of students; rather, individuals who received more than one credential are counted for each degree earned.Notes:‘Certificate’ includes ‘Awards of less than 1 academic year’ and ‘Awards of at least 1 but less than 4 academic years’. ‘Graduate Certificate’ includes Post-baccalaureate or Post-master's certificates.*Data entered into IPEDS by the Office of Higher Education may have been modified for one or more of these report years and may account for some minor discrepancies.
Institution Award Level men
wom
en
Am
eric
an In
dian
or
Ala
ska
Nat
ive
Asi
an
Blac
k or
Afr
ican
A
mer
ican
His
pani
c or
Lat
ino
Nat
ive
Haw
aiia
n /
Paci
fic
Isla
nder
Whi
te
Two
or m
ore
race
s
Unk
now
n
Non
-res
iden
t Alie
n
Gra
nd to
tal
University of Associate's degree 42.3% 57.7% 0.0% 3.8% 0.0% 7.7% 0.0% 80.8% 0.0% 7.7% 0.0% 26Connecticut Bachelor's degree 47.2% 52.8% 0.2% 7.4% 4.9% 6.5% 0.2% 66.3% 0.6% 12.5% 1.3% 4,975 - all branches Doctor's degree 48.0% 52.0% 0.6% 10.7% 4.6% 3.8% 0.0% 56.2% 0.0% 4.4% 19.6% 633
Master's degree 46.1% 53.9% 0.3% 5.8% 6.1% 3.9% 0.1% 59.5% 1.1% 6.5% 16.6% 1,512Postbaccalaureate or Post-master's certificate
36.4% 63.6% 0.6% 2.3% 5.7% 6.3% 0.0% 63.1% 1.1% 11.9% 9.1% 176
46.7% 53.3% 0.3% 7.2% 5.1% 5.7% 0.1% 64.0% 0.7% 10.6% 6.3% 100%3,423 3,899 20 529 377 417 10 4,686 51 774 458 7,322
Total Percent CompletionsTotal Completions
84
Peer Institution DataInformation about peer institutions can be found in the Integrated Postsecondary Education Data System (IPEDS) Feedback Reports that are available for each institution.
Links to these reports for the Connecticut Community Colleges and State Universities can be found at the Board of Regents website at: http://www.ct.edu/opr/ipeds. Links to each institutions 2013 report are also provided here and a sample report is available on the following pages. Additional information can be obtained from the IPEDS Data Center: http://nces.ed.gov/ipeds/datacenter/Default.aspx
Asnuntuck: http://www.ct.edu/files/opr/AsnuntuckCC-IPEDSDFR2014_128577.pdfCapital: http://www.ct.edu/files/opr/Capital-CC-IPEDSDFR2014_129367.pdfGateway: http://www.ct.edu/files/opr/Gateway-CC-IPEDSDFR2014_130396.pdfHousatonic: http://www.ct.edu/files/opr/Housatonic-CC-IPEDSDFR2014_129543.pdfManchester: http://www.ct.edu/files/opr/Manchester-CC-IPEDSDFR2014_129695.pdfMiddlesex: http://www.ct.edu/files/opr/Middlesex-CC-IPEDSDFR2014_129756.pdfNaugatuck Valley: http://www.ct.edu/files/opr/Naugatuck-Valley-CC-IPEDSDFR2014_129729.pdfNorthwestern CT: http://www.ct.edu/files/opr/Northwestern-CT-CC-IPEDSDFR2014_130040.pdfNorwalk: http://www.ct.edu/files/opr/Norwalk-CC-IPEDSDFR2014_130004.pdfQuinebaug Valley: http://www.ct.edu/files/opr/Quinebaug-Valley-CC-IPEDSDFR2014_130217.pdfThree Rivers: http://www.ct.edu/files/opr/Three-Rivers-CC-IPEDSDFR2014_129808.pdfTunxis: http://www.ct.edu/files/opr/Tunxis-CC-IPEDSDFR2014_130606.pdf
Charter Oak State College: http://www.ct.edu/files/opr/Charter-Oak-IPEDSDFR2014_128780.pdf
Central Connecticut State University: http://www.ct.edu/files/opr/CCSU-IPEDSDFR2014_128771.pdfEastern Connecticut State University: http://www.ct.edu/files/opr/ECSU-IPEDSDFR2014_129215.pdfSouthern Connecticut State University: http://www.ct.edu/files/opr/SCSU-IPEDSDFR2014_130493.pdfWestern Connecticut State University: http://www.ct.edu/files/opr/WCSU-IPEDSDFR2014_130776.pdf
University of Connecticut: http://nces.ed.gov/ipeds/DataCenter/DfrFiles/IPEDSDFR2014_129020.pdf
85
Peer Institution Data – an example
86
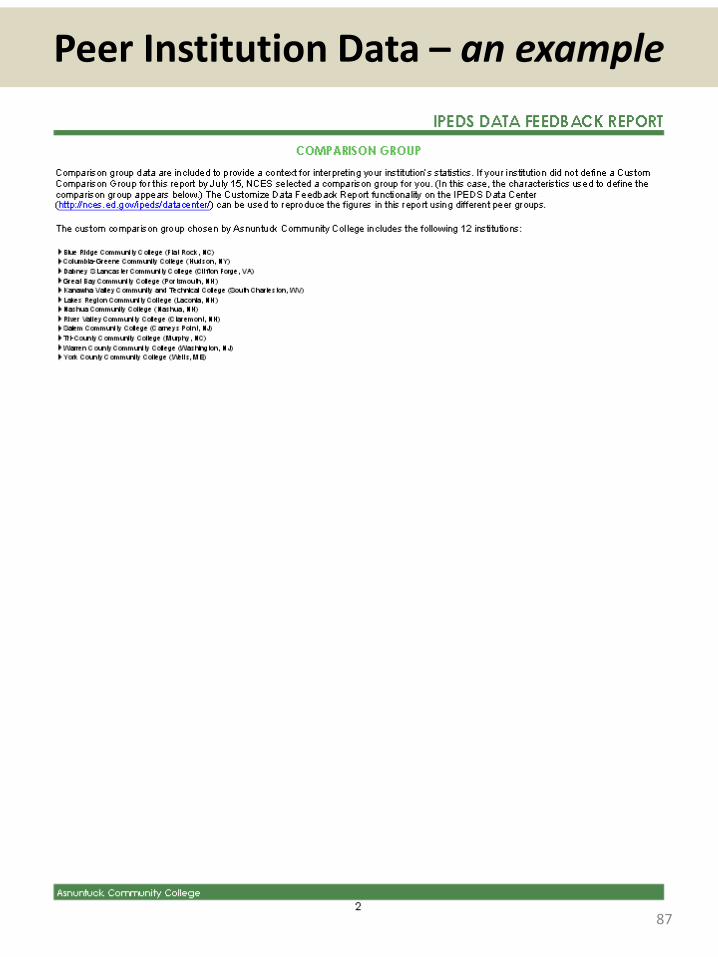
Peer Institution Data – an example
87
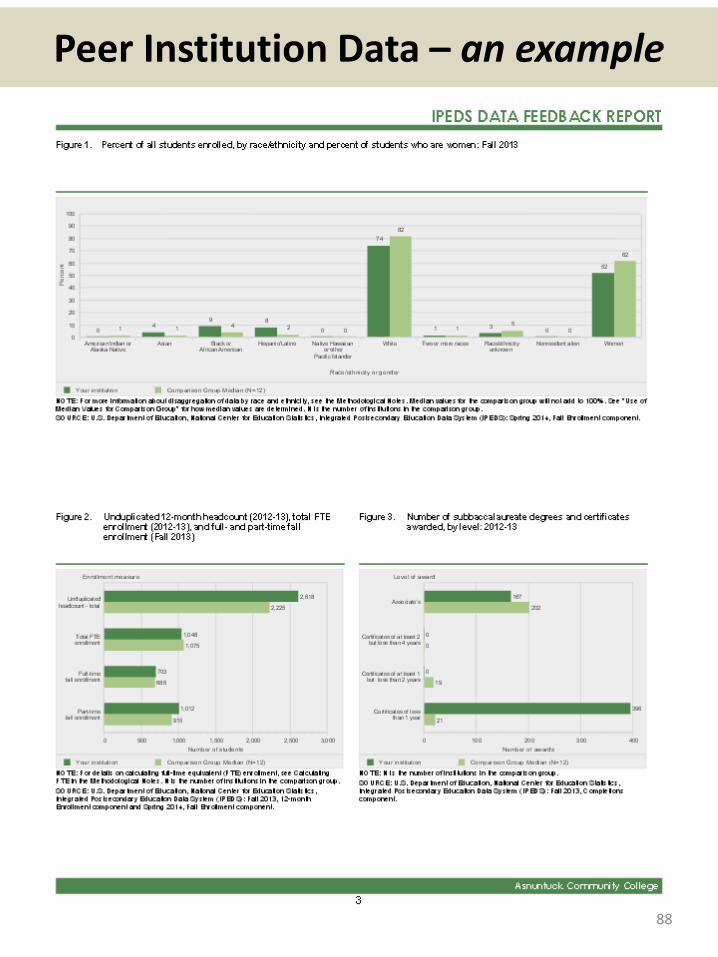
Peer Institution Data – an example
88
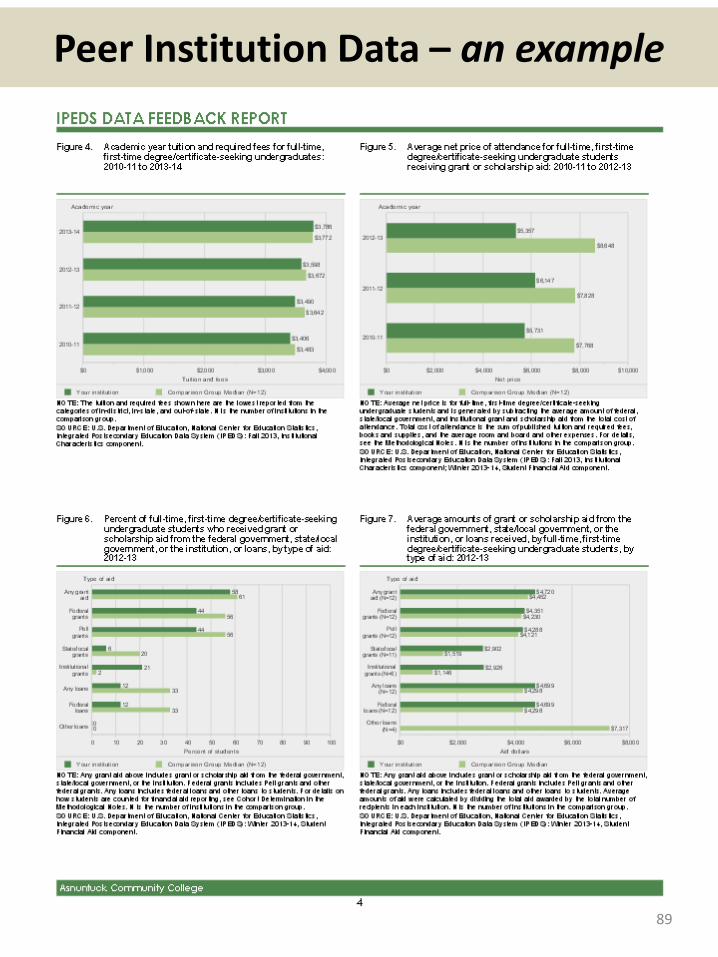
Peer Institution Data – an example
89
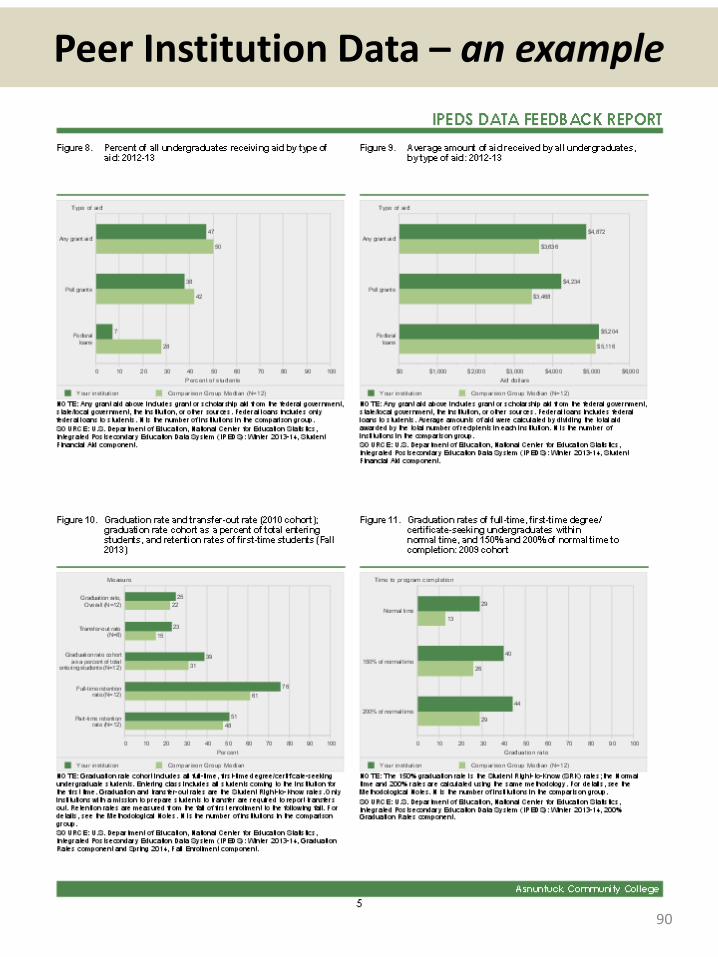
Peer Institution Data – an example
90
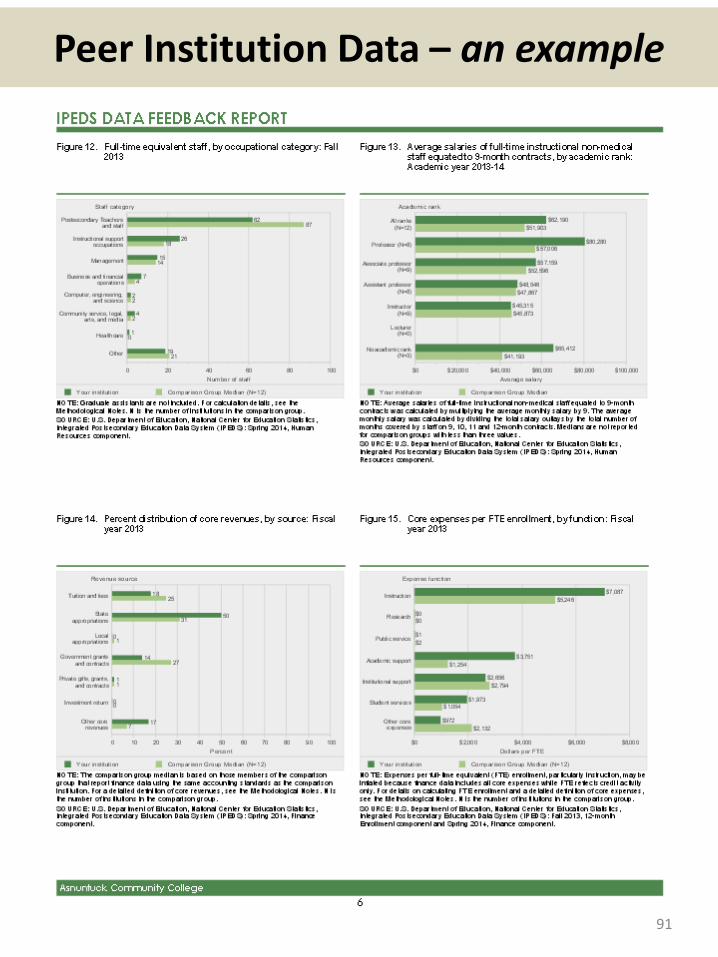
Peer Institution Data – an example
91
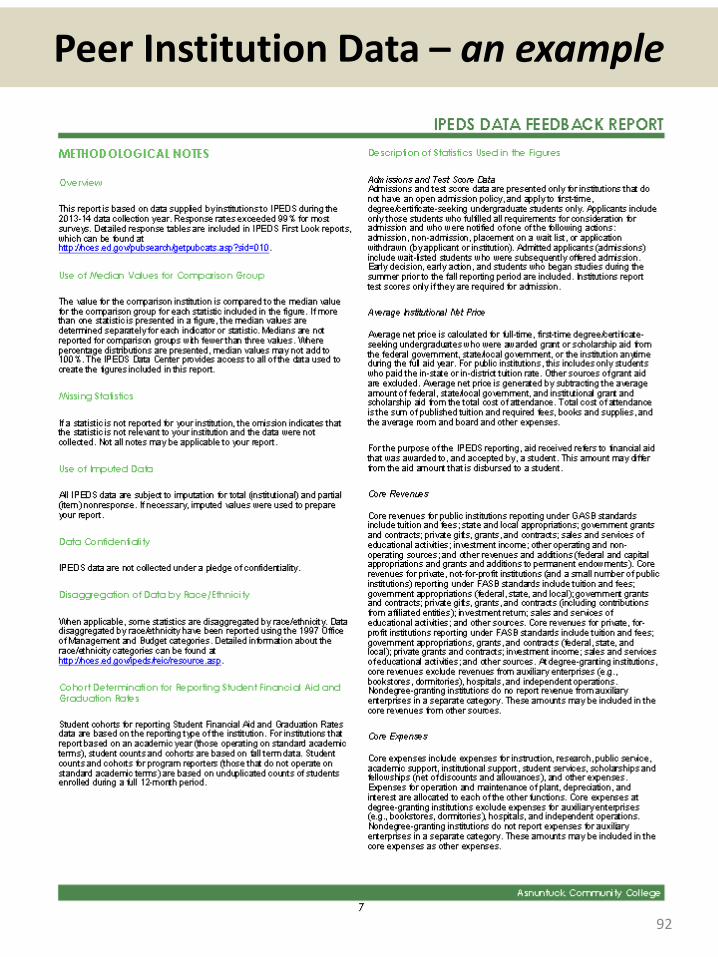
Peer Institution Data – an example
92

Peer Institution Data – an example
93
This report was compiled by staff at the Board of Regents for Higher Education in the Office of Research & System Effectiveness with the much appreciated support of Institutional Researchers from the Connecticut State Colleges and Universities and the University of Connecticut. If you have questions about the material, please contact:
William J. Gammell, Ph.D. | DirectorOffice of Research & System EffectivenessConnecticut State Colleges and Universities Board of Regents for Higher Education39 Woodland Street | Hartford, CT 06105
860-723-0054 | [email protected]
94