Embed Size (px)
Citation preview
Highlights from McKinsey’s 2021 sector researchThe pace and scale of change throughout industries as the world has responded to the COVID-19 pandemic is unprecedented. McKinsey experts break down key dynamics of relevance to investors.
2Advanced electronics
3 Aerospace and defense
4–5 Agriculture
6 Automotive and assembly
7 Capital projects and infrastructure
8–9 Consumer
10 Electric power and natural gas
11Engineering, construction, and building materials
12 Financial services
13 Healthcare systems and services
14 Oil and gas
15 Life sciences
16 Retail
17 Travel, transportation, and logistics
The automotive semiconductor shortage was sparked by the pandemic, but its effects could reverberate long afterwards
Advanced electronics
by Ondrej Burkacky, Stephanie Lingemann, and Klaus Pototzky
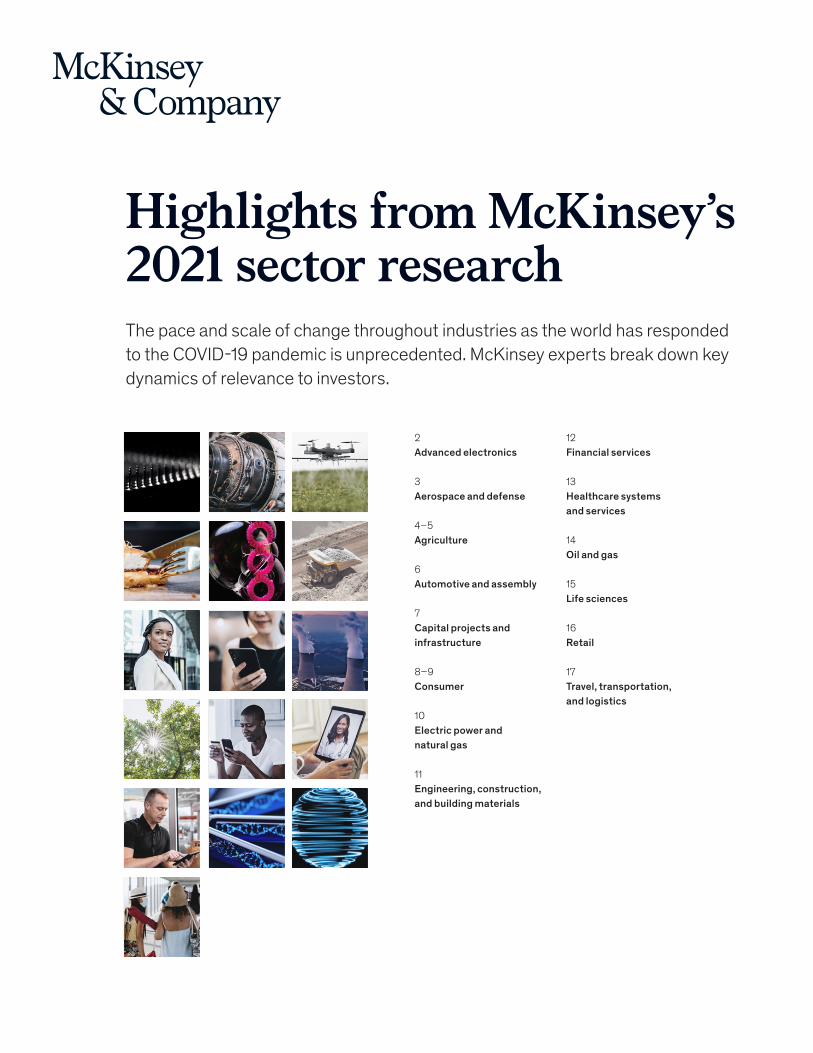
The supply-chain disruptions caused by the COVID-19 pandemic resulted in persistent under- supply of automotive semiconductors. Demand for vehicles plummeted but recovered faster than anticipated; by that point, the semiconductor industry had already shifted production to other applications. Other factors, including demand related to the 5G rollout, will continue to add to supply pressures. OEMs must consider new strategies, including rethinking just-in-time delivery systems, regional sourcing, and possibly in-house design.
© Giordano Trabucchi/EyeEm/Getty Images
Automotive semiconductor sales lagged in 2020, but growth in most other segments is expected to exceed pre-COVID-19 estimates.
Pre-COVID-19 forecast4
Semiconductor sales in 2019 by application,1 $ billions
Forecasted vs actual sales growth for 2020, %
1Products include actuators and sensors; microcomponents; and analog, discrete, logic, memory, and optoelectronic components.2Includes Chinese inventory e ect; growth rate without inventory is expected to be between –4% and –8%.3Graphics processing unit.4As of December 2019. The estimates for 2020 were calculated using a 2019 baseline, and percentages have been rounded.Source: IHS Markit; Strategy Analytics; McKinsey analysis
Wired communication
Server
Consumer electronics
Automotive
Industrial
Storage, GPU,3 peripherals
Personal computer (PC)
Wireless communication2
26
29
38
41
49
52
67
127
–10 –5 0 5 10 15 20
Actual
+6
+11
–16
–3
+15
+6
+7
+2
2 McKinsey on Investing Number 7, November 2021
Digitization: The $20 billion opportunity for aerospace and defense
Aerospace and defense
© EXTREME-PHOTOGRAPHER/Getty Images
by Reed Doucette, Sophie Hilaire, Varun Marya, and Rob Wavra
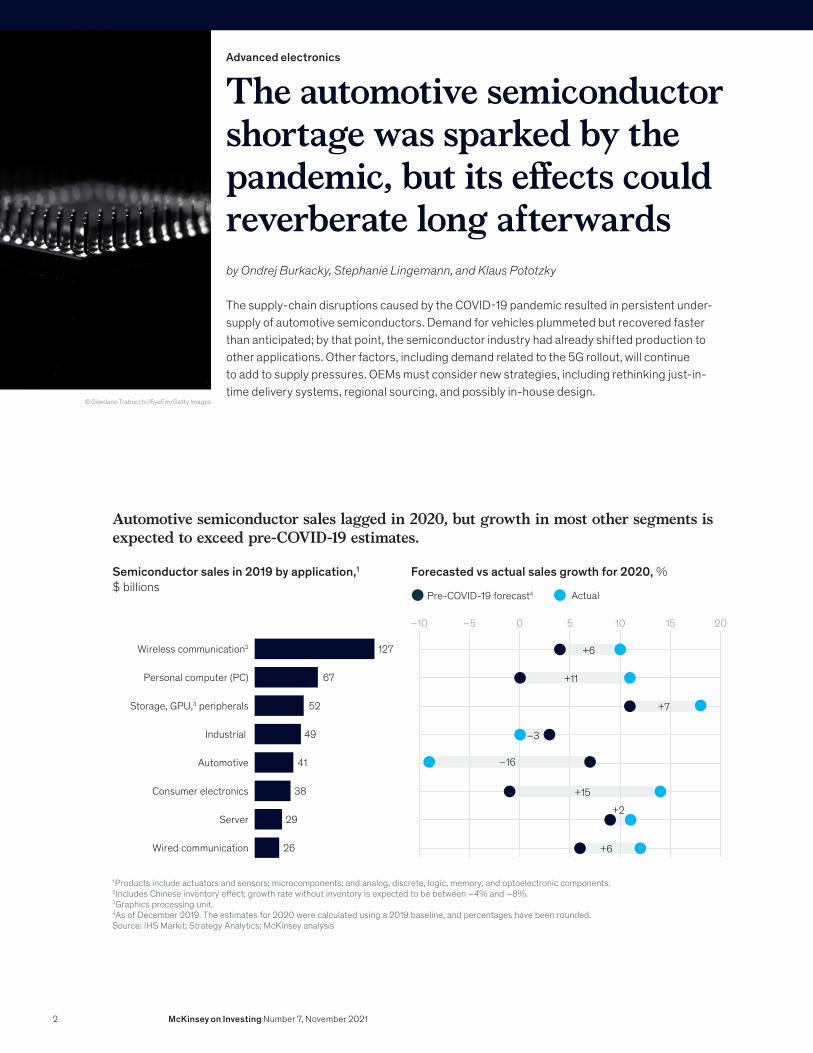
Aerospace and defense (A&D) companies create some of the world’s foremost technological marvels and have pioneered many different applications of digital and analytics technologies. Ironically, these industries still have a long way to go to leave behind paper-based processes, fragmented data systems, and stubbornly manual operations. A&D will need to transform how it approaches digital across strategy, talent, delivery, technology, data, and adoption. McKinsey’s estimate of the potential prize: $20 billion in incremental annual earnings before interest, taxes, depreciation, and amortization (EBITDA), an approximately 10 percent improvement based on the global sector EBITDA of $200 billion in 2018. This value would come from both cost and growth opportunities across the value stream—from engineering to supply chain, manufacturing, aftermarket services, and support functions.
Global aerospace and defense companies could unlock more than $20 billion in potential value from digitization.
9
Annual, $ billions
Potential value at stake
Procurement and supply chain
R&D and engineering
Manufacturing
Aftermarket services
Support functions
20
1
3
3
4
Source: McKinsey partnered with the Aerospace Industries Association to study the digital maturity of the aerospace and defense industry. We assessed digital maturity through McKinsey’s Digital Quotient, a benchmark of more than 25,000 respondents from 750 companies across 21 sectors.
3Highlights from McKinsey’s 2021 sector research
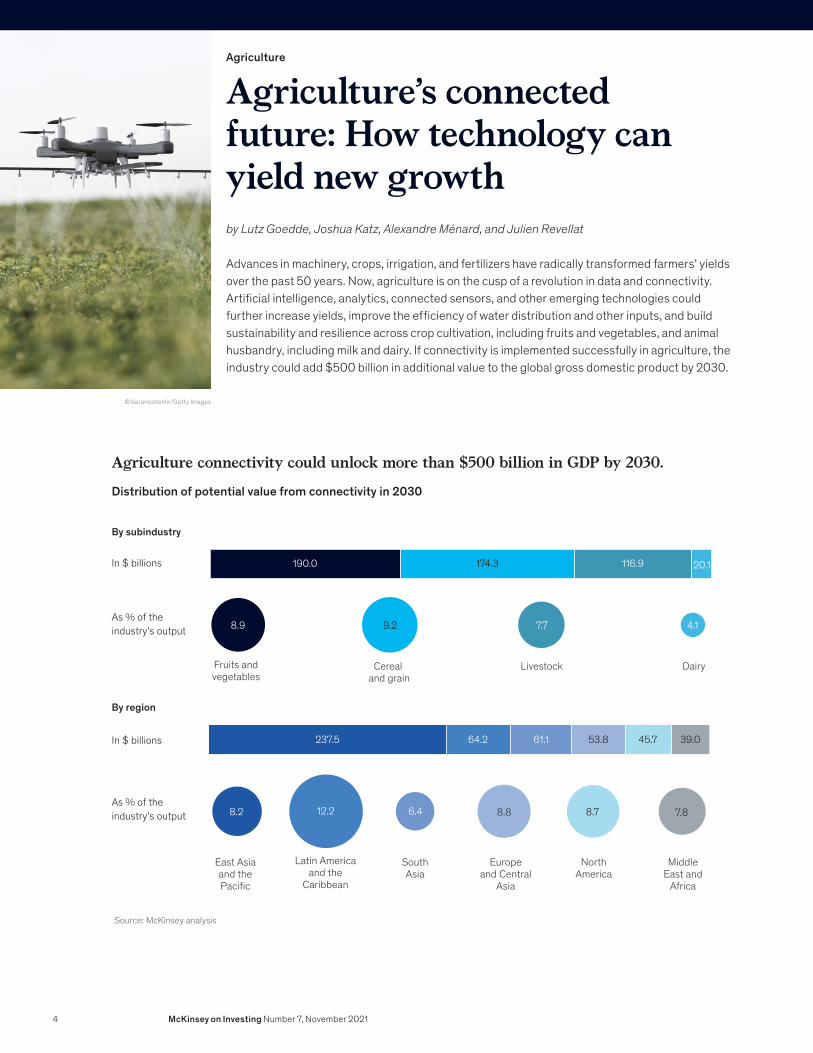
Agriculture’s connected future: How technology can yield new growth
Agriculture
by Lutz Goedde, Joshua Katz, Alexandre Ménard, and Julien Revellat
Advances in machinery, crops, irrigation, and fertilizers have radically transformed farmers’ yields over the past 50 years. Now, agriculture is on the cusp of a revolution in data and connectivity. Artificial intelligence, analytics, connected sensors, and other emerging technologies could further increase yields, improve the efficiency of water distribution and other inputs, and build sustainability and resilience across crop cultivation, including fruits and vegetables, and animal husbandry, including milk and dairy. If connectivity is implemented successfully in agriculture, the industry could add $500 billion in additional value to the global gross domestic product by 2030.
© baranozdemir/Getty Images
Agriculture connectivity could unlock more than $500 billion in GDP by 2030.
Distribution of potential value from connectivity in 2030
As % of the industry’s output
By subindustry
By region
As % of the industry’s output
190.0
237.5 64.2 61.1 53.8 45.7 39.0
174.3 116.9 20.1
Fruits and vegetables
NorthAmerica
Latin America and the
Caribbean
Europeand Central
Asia
MiddleEast and
Africa
SouthAsia
East Asiaand thePacific
Cereal and grain
DairyLivestock
7.7
8.2 6.4 8.812.2 8.7 7.8
8.9 9.2 4.1
In $ billions
In $ billions
Source: McKinsey analysis
4 McKinsey on Investing Number 7, November 2021
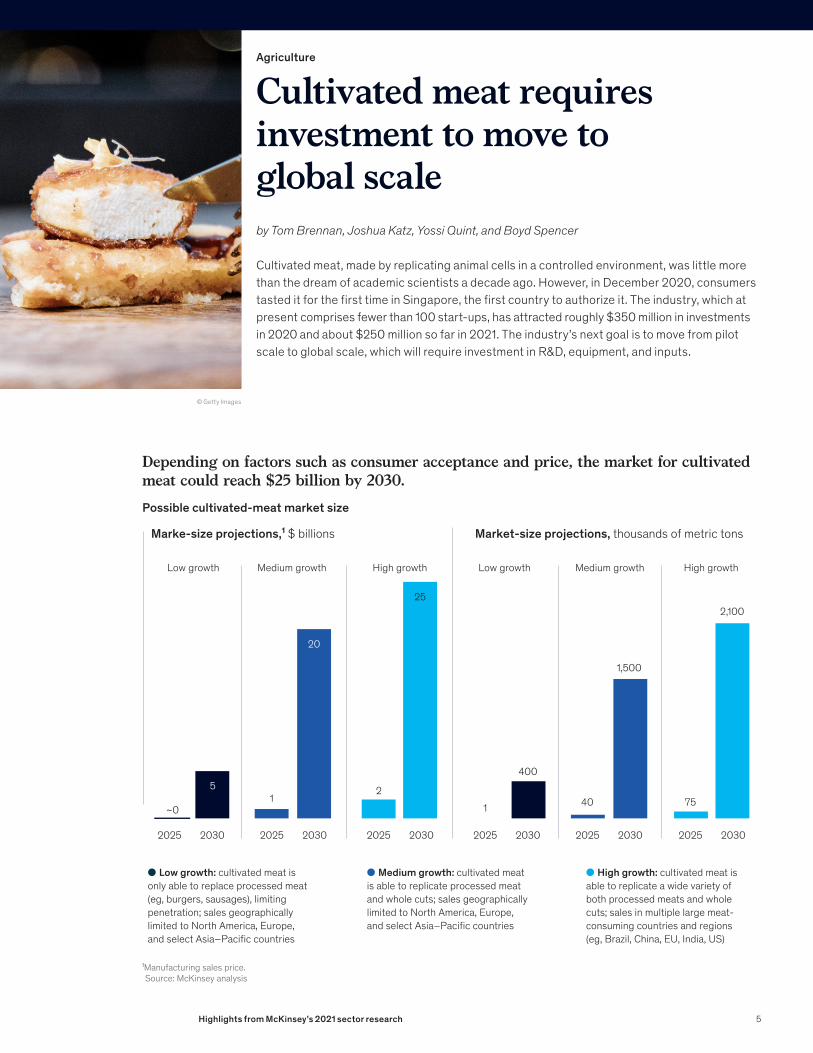
Cultivated meat requires investment to move to global scale
Agriculture
© Getty Images
by Tom Brennan, Joshua Katz, Yossi Quint, and Boyd Spencer
Cultivated meat, made by replicating animal cells in a controlled environment, was little more than the dream of academic scientists a decade ago. However, in December 2020, consumers tasted it for the first time in Singapore, the first country to authorize it. The industry, which at present comprises fewer than 100 start-ups, has attracted roughly $350 million in investments in 2020 and about $250 million so far in 2021. The industry’s next goal is to move from pilot scale to global scale, which will require investment in R&D, equipment, and inputs.
Marke-size projections,¹ $ billions Market-size projections, thousands of metric tons
Depending on factors such as consumer acceptance and price, the market for cultivated meat could reach $25 billion by 2030.
¹Manufacturing sales price. Source: McKinsey analysis
2025 20302025 20302025 2030 2025 20302025 20302025 2030
High growthMedium growthLow growth High growthMedium growthLow growth
● Low growth: cultivated meat is only able to replace processed meat (eg, burgers, sausages), limiting penetration; sales geographically limited to North America, Europe, and select Asia–Paci�c countries
● Medium growth: cultivated meat is able to replicate processed meat and whole cuts; sales geographicallylimited to North America, Europe, and select Asia–Paci�c countries
● High growth: cultivated meat is able to replicate a wide variety of both processed meats and whole cuts; sales in multiple large meat-consuming countries and regions (eg, Brazil, China, EU, India, US)
~0 1 40 75
2,100
1,500
4005
25
1
20
2
Possible cultivated-meat market size
5Highlights from McKinsey’s 2021 sector research
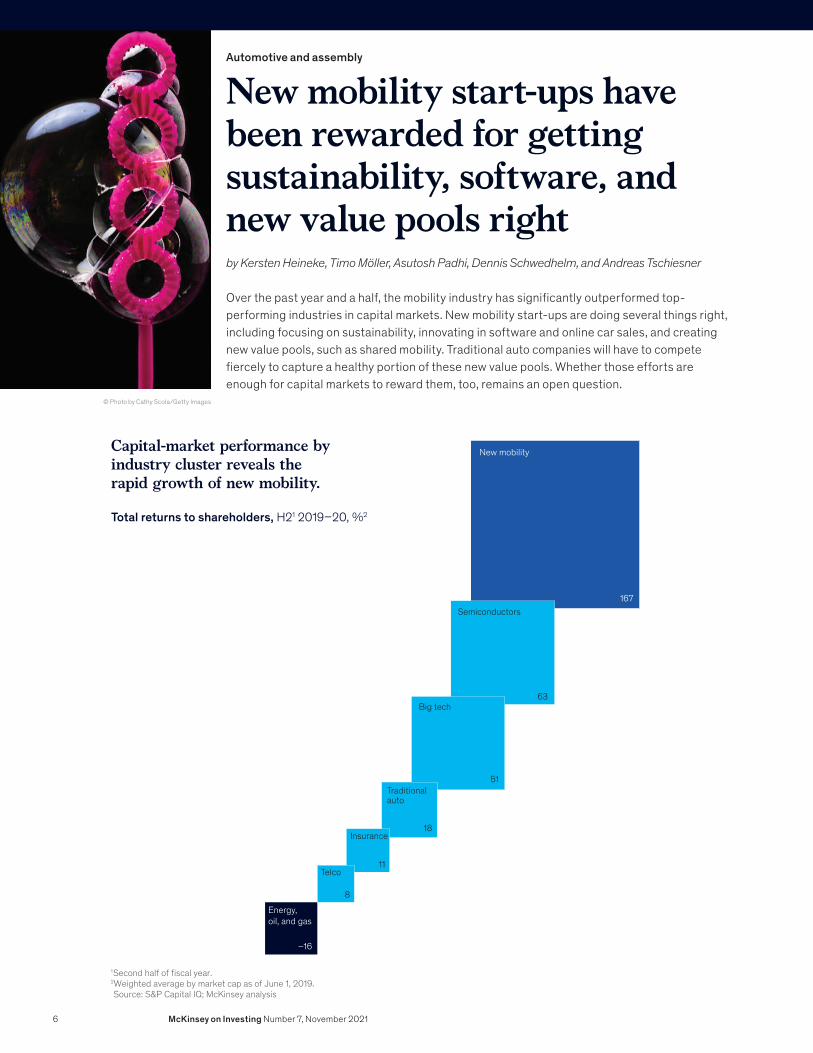
New mobility start-ups have been rewarded for getting sustainability, software, and new value pools right
Automotive and assembly
by Kersten Heineke, Timo Möller, Asutosh Padhi, Dennis Schwedhelm, and Andreas Tschiesner
Over the past year and a half, the mobility industry has significantly outperformed top-performing industries in capital markets. New mobility start-ups are doing several things right, including focusing on sustainability, innovating in software and online car sales, and creating new value pools, such as shared mobility. Traditional auto companies will have to compete fiercely to capture a healthy portion of these new value pools. Whether those efforts are enough for capital markets to reward them, too, remains an open question.
© Photo by Cathy Scola/Getty Images
Capital-market performance by industry cluster reveals the rapid growth of new mobility.
Total returns to shareholders, H21 2019–20, %2
New mobility
167Semiconductors
63Big tech
51Traditionalauto
18Insurance
11
Energy,oil, and gas
–16
Telco
8
1Second half of �scal year.2Weighted average by market cap as of June 1, 2019.Source: S&P Capital IQ; McKinsey analysis
6 McKinsey on Investing Number 7, November 2021
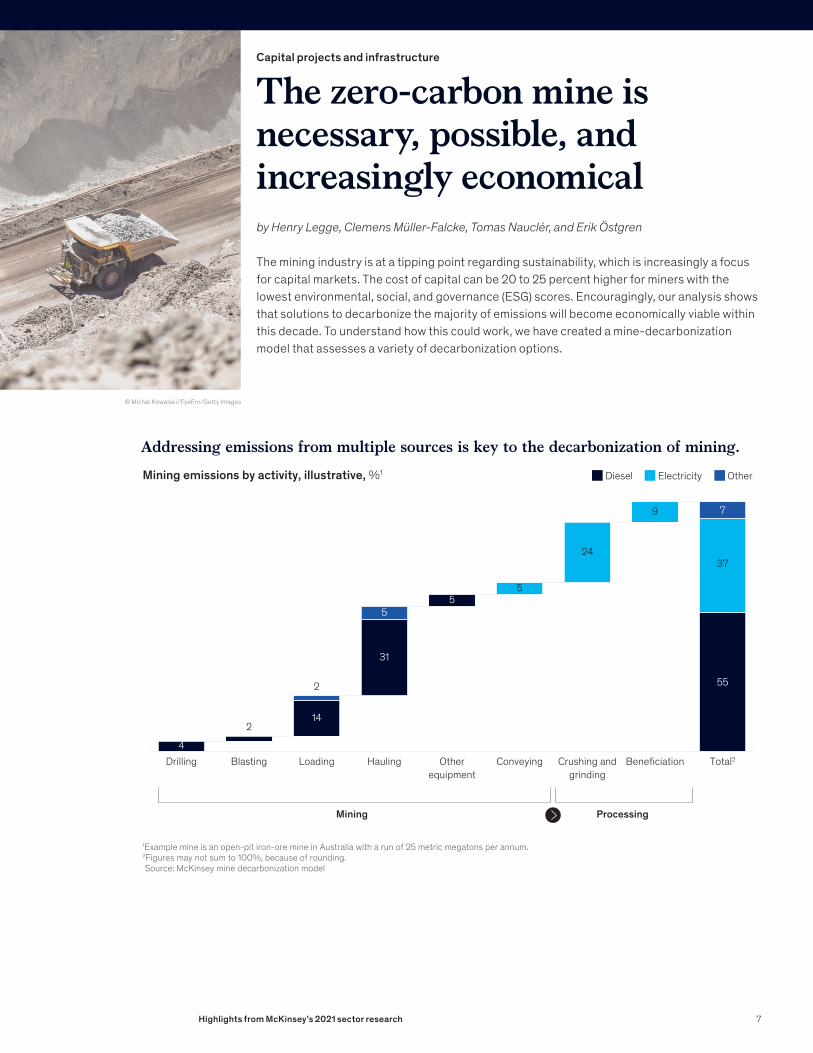
Capital projects and infrastructure
The zero-carbon mine is necessary, possible, and increasingly economical
© Michal Kowalski/EyeEm/Getty Images
by Henry Legge, Clemens Müller-Falcke, Tomas Nauclér, and Erik Östgren
The mining industry is at a tipping point regarding sustainability, which is increasingly a focus for capital markets. The cost of capital can be 20 to 25 percent higher for miners with the lowest environmental, social, and governance (ESG) scores. Encouragingly, our analysis shows that solutions to decarbonize the majority of emissions will become economically viable within this decade. To understand how this could work, we have created a mine-decarbonization model that assesses a variety of decarbonization options.
Addressing emissions from multiple sources is key to the decarbonization of mining.
Mining emissions by activity, illustrative, %1
Drilling
Mining Processing
Blasting Loading Hauling Other equipment
Conveying Crushing and grinding
Bene�ciation Total2
1Example mine is an open-pit iron-ore mine in Australia with a run of 25 metric megatons per annum.2Figures may not sum to 100%, because of rounding.Source: McKinsey mine decarbonization model
Diesel Electricity Other
55
37
9
24
2
5
2
55
31
14
4
7
7Highlights from McKinsey’s 2021 sector research
A flush recovery for consumers?Consumer
© Lorado/Getty Images
by Susan Lund, Anu Madgavkar, Jan Mischke, and Jaana Remes
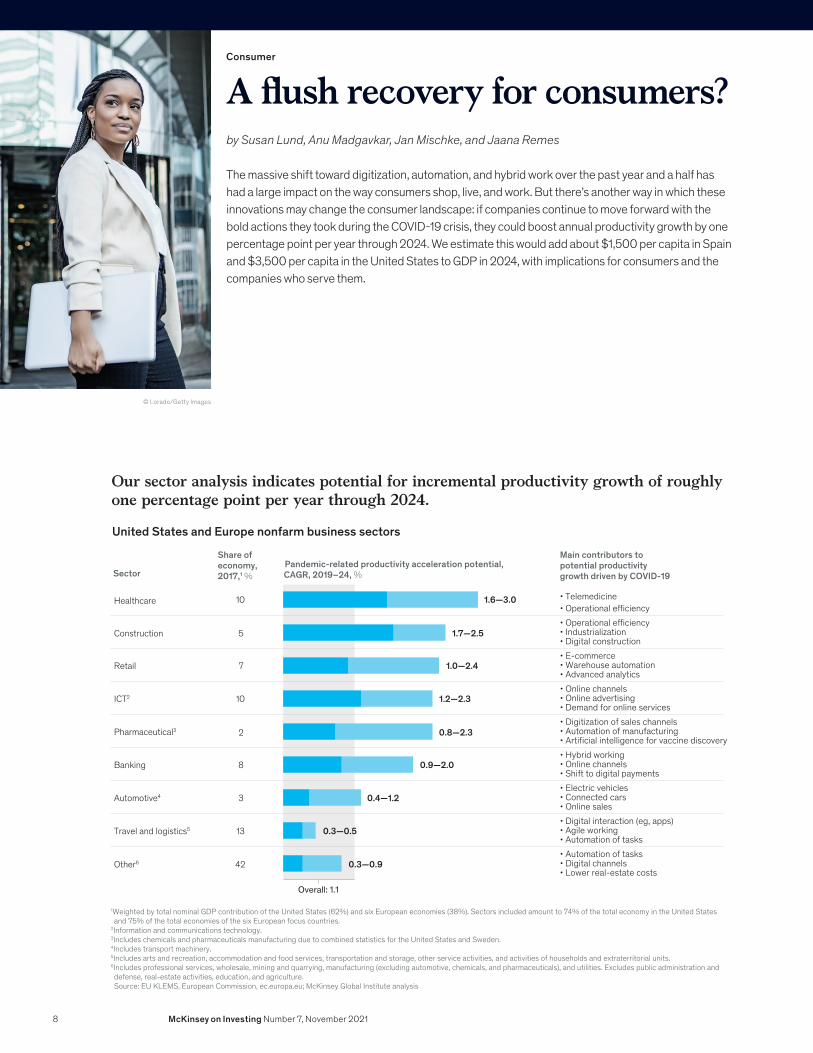
The massive shift toward digitization, automation, and hybrid work over the past year and a half has had a large impact on the way consumers shop, live, and work. But there’s another way in which these innovations may change the consumer landscape: if companies continue to move forward with the bold actions they took during the COVID-19 crisis, they could boost annual productivity growth by one percentage point per year through 2024. We estimate this would add about $1,500 per capita in Spain and $3,500 per capita in the United States to GDP in 2024, with implications for consumers and the companies who serve them.
Our sector analysis indicates potential for incremental productivity growth of roughly one percentage point per year through 2024.
United States and Europe nonfarm business sectors
1Weighted by total nominal GDP contribution of the United States (62%) and six European economies (38%). Sectors included amount to 74% of the total economy in the United States and 75% of the total economies of the six European focus countries.
2Information and communications technology.3Includes chemicals and pharmaceuticals manufacturing due to combined statistics for the United States and Sweden.4Includes transport machinery.5Includes arts and recreation, accommodation and food services, transportation and storage, other service activities, and activities of households and extraterritorial units.6Includes professional services, wholesale, mining and quarrying, manufacturing (excluding automotive, chemicals, and pharmaceuticals), and utilities. Excludes public administration and defense, real-estate activities, education, and agriculture.Source: EU KLEMS, European Commission, ec.europa.eu; McKinsey Global Institute analysis
Share ofeconomy,2017,1 %Sector
Pandemic-related productivity acceleration potential, CAGR, 2019–24, %
Main contributors topotential productivitygrowth driven by COVID-19
• Telemedicine• Operational e�ciency
Healthcare
• Operational e�ciency• Industrialization• Digital construction
Construction
• Hybrid working• Online channels• Shift to digital payments
Banking
• Electric vehicles• Connected cars• Online sales
Automotive4
• Digital interaction (eg, apps)• Agile working• Automation of tasks
Travel and logistics5
• Automation of tasks• Digital channels• Lower real-estate costs
Other6
• Online channels• Online advertising• Demand for online services
ICT2
• E-commerce• Warehouse automation• Advanced analytics
Retail
• Digitization of sales channels• Automation of manufacturing• Arti�cial intelligence for vaccine discovery
Pharmaceutical3
10
5
10
7
2
8
3
13
42
1.6—3.0
1.7—2.5
1.2—2.3
1.0—2.4
0.8—2.3
0.9—2.0
0.4—1.2
0.3—0.5
0.3—0.9
Overall: 1.1
8 McKinsey on Investing Number 7, November 2021
A huge new upper-middle class will emerge in China over the next decade
Consumer
by Jeongmin Seong, Jonathan Woetzel, and Daniel Zipser
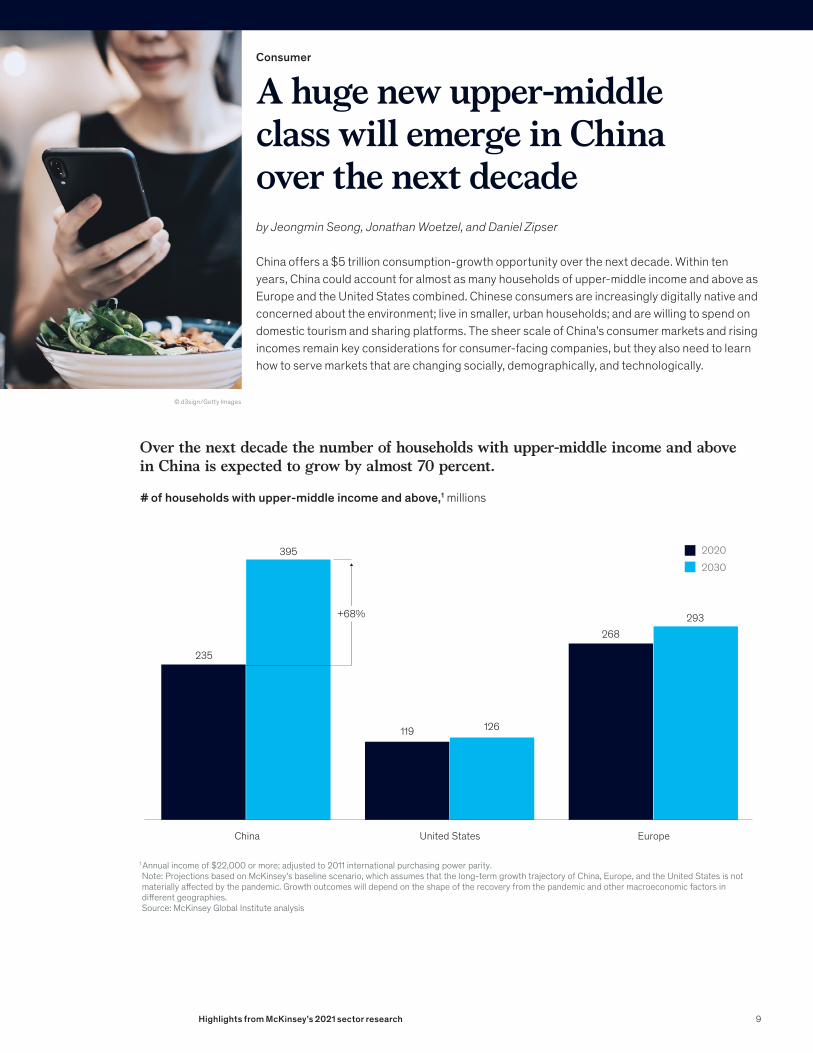
China offers a $5 trillion consumption-growth opportunity over the next decade. Within ten years, China could account for almost as many households of upper-middle income and above as Europe and the United States combined. Chinese consumers are increasingly digitally native and concerned about the environment; live in smaller, urban households; and are willing to spend on domestic tourism and sharing platforms. The sheer scale of China’s consumer markets and rising incomes remain key considerations for consumer-facing companies, but they also need to learn how to serve markets that are changing socially, demographically, and technologically.
© d3sign/Getty Images
Over the next decade the number of households with upper-middle income and above in China is expected to grow by almost 70 percent.
# of households with upper-middle income and above,1 millions
China United States
119 126
268293
20202030
235
395
Europe
1 Annual income of $22,000 or more; adjusted to 2011 international purchasing power parity.Note: Projections based on McKinsey’s baseline scenario, which assumes that the long-term growth trajectory of China, Europe, and the United States is not materially a�ected by the pandemic. Growth outcomes will depend on the shape of the recovery from the pandemic and other macroeconomic factors in di�erent geographies.Source: McKinsey Global Institute analysis
+68%
9Highlights from McKinsey’s 2021 sector research
Power companies can create value by modernizing existing plants.
Electric power and natural gas
by Harold Janin, Jochen Latz, Katsuhiro Sato, and Benjamin Sauer
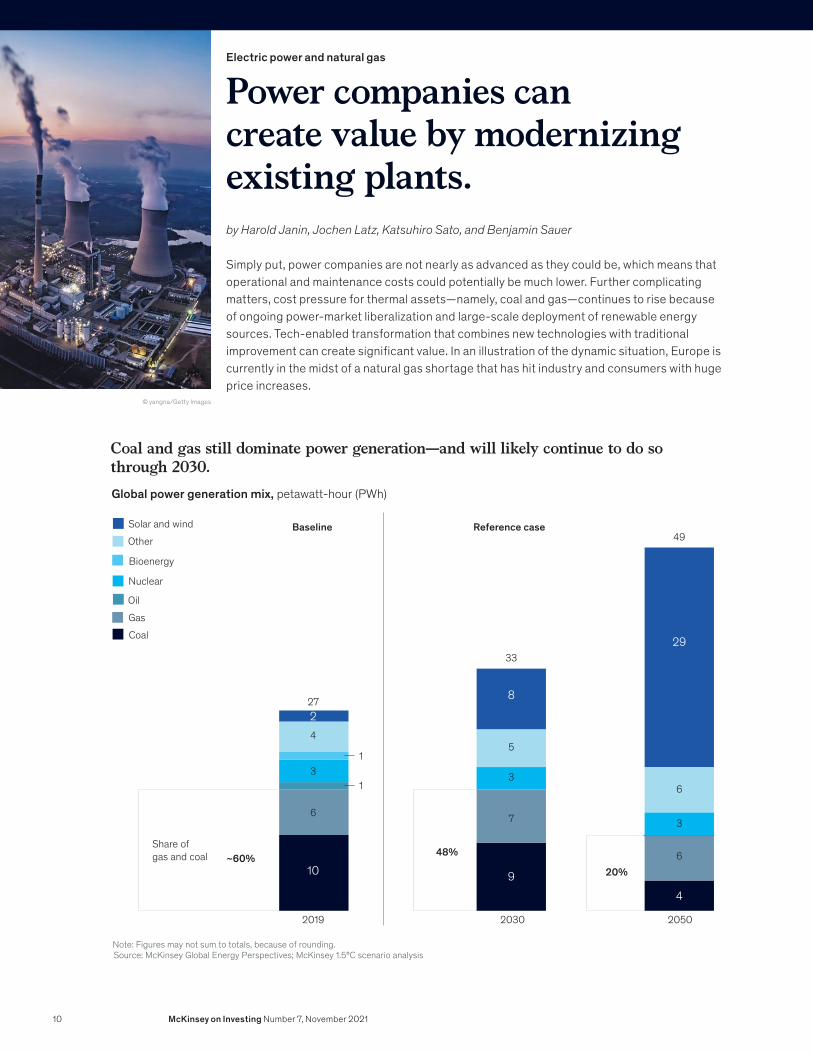
Simply put, power companies are not nearly as advanced as they could be, which means that operational and maintenance costs could potentially be much lower. Further complicating matters, cost pressure for thermal assets—namely, coal and gas—continues to rise because of ongoing power-market liberalization and large-scale deployment of renewable energy sources. Tech-enabled transformation that combines new technologies with traditional improvement can create significant value. In an illustration of the dynamic situation, Europe is currently in the midst of a natural gas shortage that has hit industry and consumers with huge price increases.
© yangna/Getty Images
Coal and gas still dominate power generation—and will likely continue to do so through 2030.Global power generation mix, petawatt-hour (PWh)
Baseline
2019
~60% 48%
20%
Share ofgas and coal
2030 2050
Reference caseSolar and wind
Other
Bioenergy
Nuclear
Oil
Gas
Coal
10 94
8
29
6
27
33
49
7
6
1
1
2
3 3
3
45
6
Note: Figures may not sum to totals, because of rounding.Source: McKinsey Global Energy Perspectives; McKinsey 1.5°C scenario analysis
10 McKinsey on Investing Number 7, November 2021
Existing buildings need retrofitting to meet decarbonization targets.
Engineering, construction, and building materials
by Jose Luis Blanco, Hauke Engel, Focko Imhorst, Maria João Ribeirinho, and Erik Sjödin
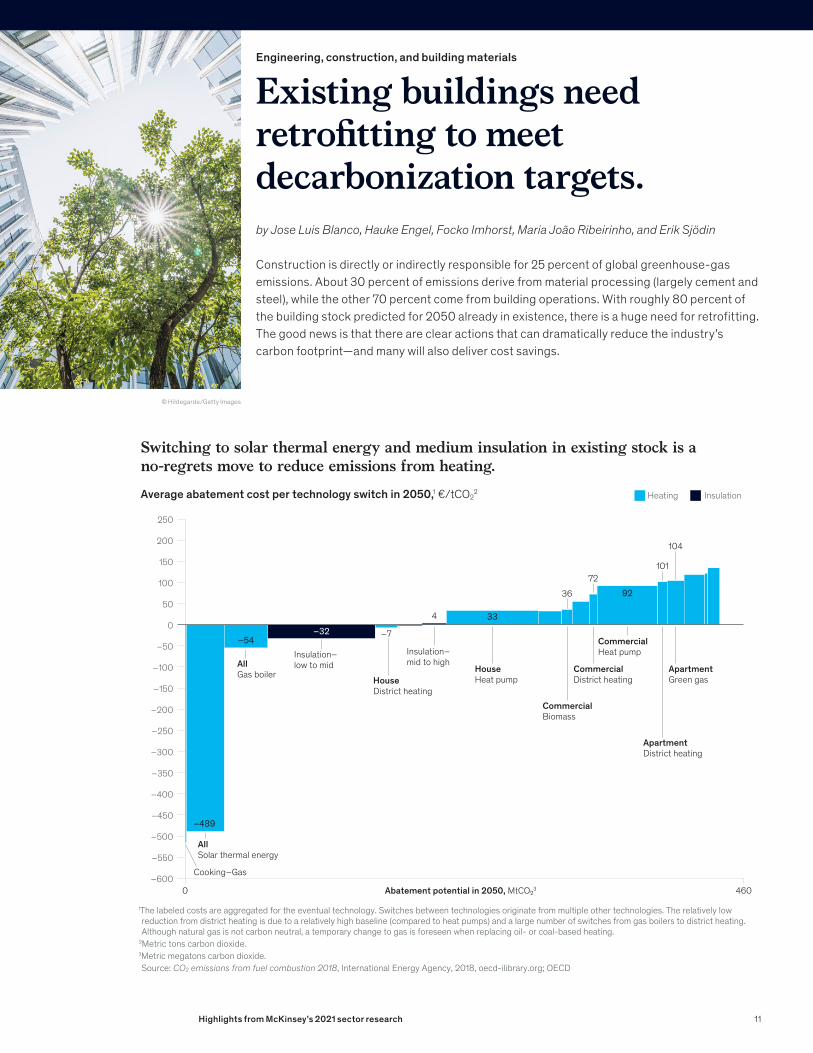
Construction is directly or indirectly responsible for 25 percent of global greenhouse-gas emissions. About 30 percent of emissions derive from material processing (largely cement and steel), while the other 70 percent come from building operations. With roughly 80 percent of the building stock predicted for 2050 already in existence, there is a huge need for retrofitting. The good news is that there are clear actions that can dramatically reduce the industry’s carbon footprint—and many will also deliver cost savings.
© Hildegarde/Getty Images
Switching to solar thermal energy and medium insulation in existing stock is a no-regrets move to reduce emissions from heating.
1The labeled costs are aggregated for the eventual technology. Switches between technologies originate from multiple other technologies. The relatively low reduction from district heating is due to a relatively high baseline (compared to heat pumps) and a large number of switches from gas boilers to district heating. Although natural gas is not carbon neutral, a temporary change to gas is foreseen when replacing oil- or coal-based heating.
2Metric tons carbon dioxide.3Metric megatons carbon dioxide.Source: CO2 emissions from fuel combustion 2018, International Energy Agency, 2018, oecd-ilibrary.org; OECD
Average abatement cost per technology switch in 2050,1 €/tCO22
Abatement potential in 2050, MtCO₂3
Cooking–Gas
AllSolar thermal energy
–489
–54
33
92
–7
4
36
72101
104
–32
150
250
200
100
–100
–150
–200
–250
–350
–300
–400
–450
–500
–550
–6000 460
50
–50
0
AllGas boiler
Insulation–low to mid
HouseDistrict heating
HouseHeat pump
CommercialBiomass
ApartmentDistrict heating
Insulation–mid to high
CommercialDistrict heating
CommercialHeat pump
ApartmentGreen gas
Heating Insulation
11Highlights from McKinsey’s 2021 sector research
Buy now, pay later: A small but rapidly growing new competitor to traditional unsecured lending
Financial services
by Puneet Dikshit, Diana Goldshtein, Blazej Karwowski, Udai Kaura, and Felicia Tan
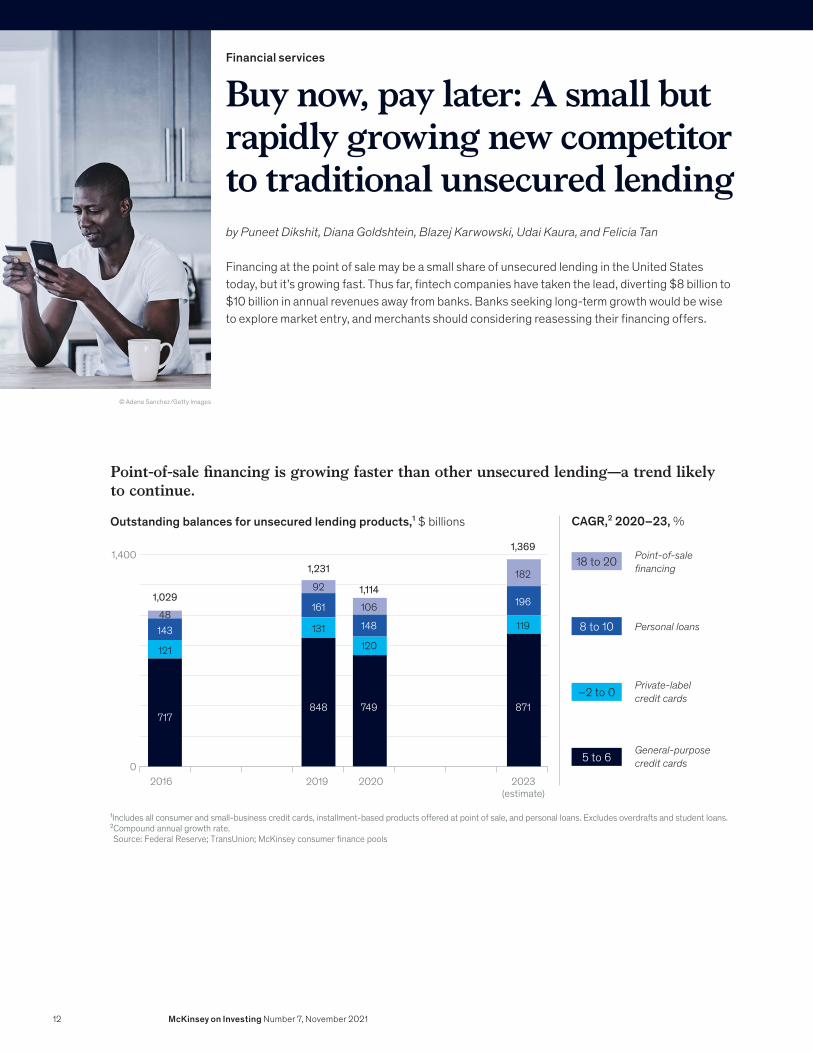
Financing at the point of sale may be a small share of unsecured lending in the United States today, but it’s growing fast. Thus far, fintech companies have taken the lead, diverting $8 billion to $10 billion in annual revenues away from banks. Banks seeking long-term growth would be wise to explore market entry, and merchants should considering reasessing their financing offers.
© Adene Sanchez/Getty Images
Point-of-sale �nancing is growing faster than other unsecured lending—a trend likely to continue.
Outstanding balances for unsecured lending products,¹ $ billions CAGR,² 2020–23, %
¹Includes all consumer and small-business credit cards, installment-based products offered at point of sale, and personal loans. Excludes overdrafts and student loans.²Compound annual growth rate.Source: Federal Reserve; TransUnion; McKinsey consumer finance pools
2016 2019 2020 2023 (estimate)
0
1,400
General-purpose credit cards
Personal loans
Private-labelcredit cards
Point-of-sale �nancing18 to 20
8 to 10
–2 to 0
5 to 6
717
143
121
848
161
131
92
749
148
120
106
871
196
119
182
48
1,231
1,114
1,369
1,029
12 McKinsey on Investing Number 7, November 2021
The pandemic turbocharged telehealth. Companies should capitalize on its momentum
Healthcare systems and services
© Morsa Images/Getty Images
by Oleg Bestsennyy, Greg Gilbert, Alex Harris, and Jennifer Rost
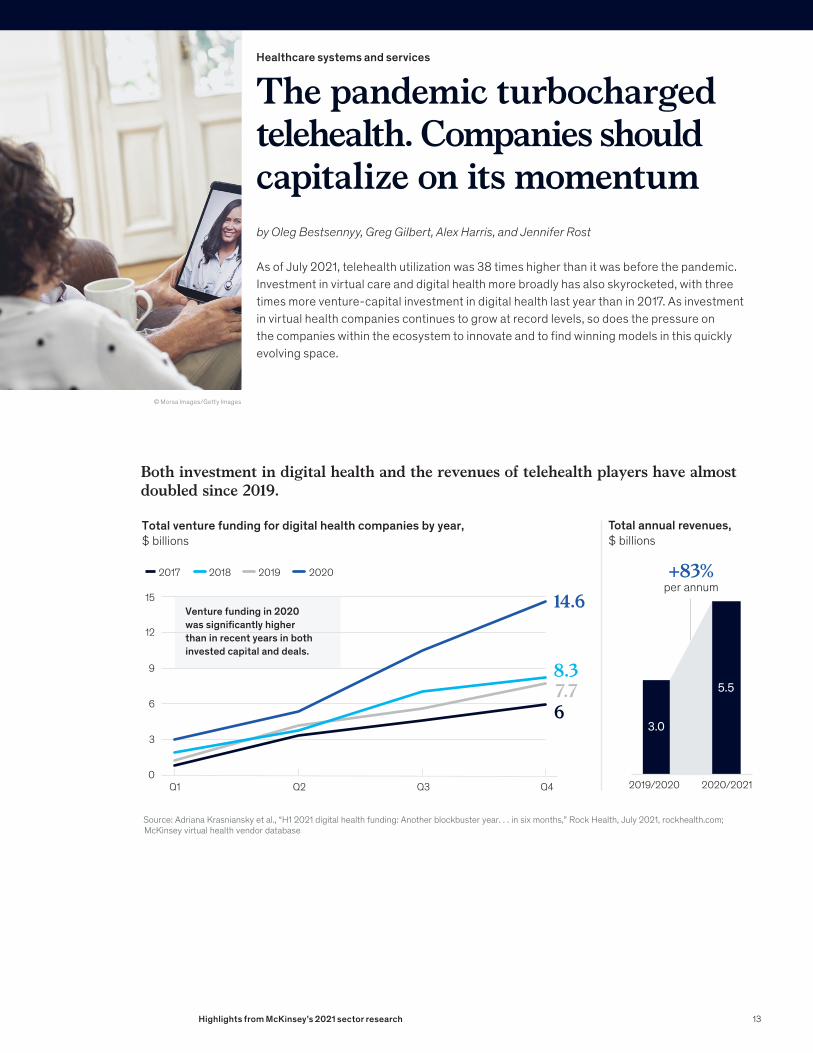
As of July 2021, telehealth utilization was 38 times higher than it was before the pandemic. Investment in virtual care and digital health more broadly has also skyrocketed, with three times more venture-capital investment in digital health last year than in 2017. As investment in virtual health companies continues to grow at record levels, so does the pressure on the companies within the ecosystem to innovate and to find winning models in this quickly evolving space.
Both investment in digital health and the revenues of telehealth players have almost doubled since 2019.
Total venture funding for digital health companies by year, $ billions
Source: Adriana Krasniansky et al., “H1 2021 digital health funding: Another blockbuster year. . . in six months,” Rock Health, July 2021, rockhealth.com; McKinsey virtual health vendor database
Total annual revenues, $ billions
2019/2020 2020/2021
3.0
5.5
2017
0Q1 Q2 Q3 Q4
3
6
9
12
15
2018 2019 2020
Venture funding in 2020was signi�cantly higherthan in recent years in bothinvested capital and deals.
14.6+83%
per annum
8.37.76
13Highlights from McKinsey’s 2021 sector research
Electric-vehicle charging and nonfuel sales represent opportunities for retailers who get trends right
Oil and gas
by Álvaro Bau, Arjun Chopra, Mladen Fruk, Lazar Krstić, Klaas Mantel, and Florian Nägele
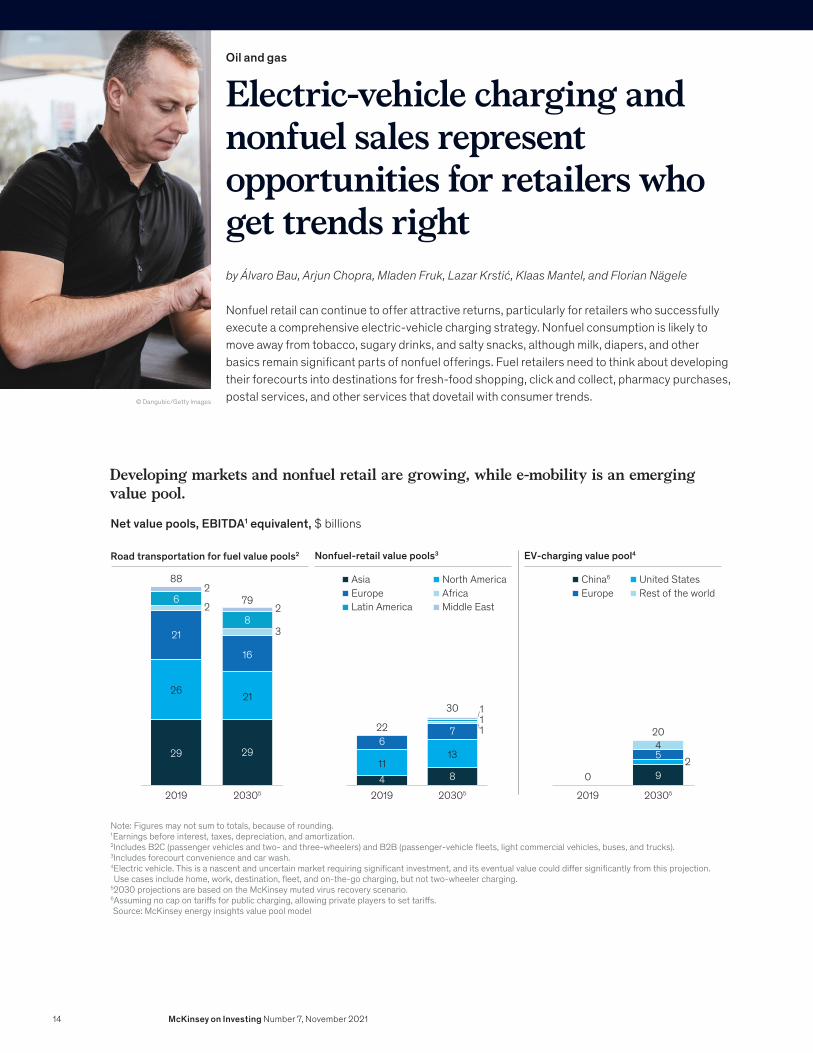
Nonfuel retail can continue to offer attractive returns, particularly for retailers who successfully execute a comprehensive electric-vehicle charging strategy. Nonfuel consumption is likely to move away from tobacco, sugary drinks, and salty snacks, although milk, diapers, and other basics remain significant parts of nonfuel offerings. Fuel retailers need to think about developing their forecourts into destinations for fresh-food shopping, click and collect, pharmacy purchases, postal services, and other services that dovetail with consumer trends.© Dangubic/Getty Images
Developing markets and nonfuel retail are growing, while e-mobility is an emerging value pool.
Net value pools, EBITDA1 equivalent, $ billions
Road transportation for fuel value pools2 Nonfuel-retail value pools3
2019 20305
88
79
2019 20305
22
30 1
11
2019 20305
0
20
Rest of the worldEuropeUnited StatesChina6
EV-charging value pool4
45 29
29
26
21
6
29
21
16
411
6
8
2
2 2
3
Middle EastLatin AmericaEurope
North AmericaAfrica
Asia
13
8
7
Note: Figures may not sum to totals, because of rounding.1Earnings before interest, taxes, depreciation, and amortization.2Includes B2C (passenger vehicles and two- and three-wheelers) and B2B (passenger-vehicle �eets, light commercial vehicles, buses, and trucks).3Includes forecourt convenience and car wash.4Electric vehicle. This is a nascent and uncertain market requiring signi�cant investment, and its eventual value could di�er signi�cantly from this projection. Use cases include home, work, destination, �eet, and on-the-go charging, but not two-wheeler charging.
52030 projections are based on the McKinsey muted virus recovery scenario.6Assuming no cap on tari�s for public charging, allowing private players to set tari�s.Source: McKinsey energy insights value pool model
14 McKinsey on Investing Number 7, November 2021
Quantum computing can accelerate drug discovery for firms that prepare for its potential
Life sciences
by Matthias Evers, Anna Heid, and Ivan Ostojic
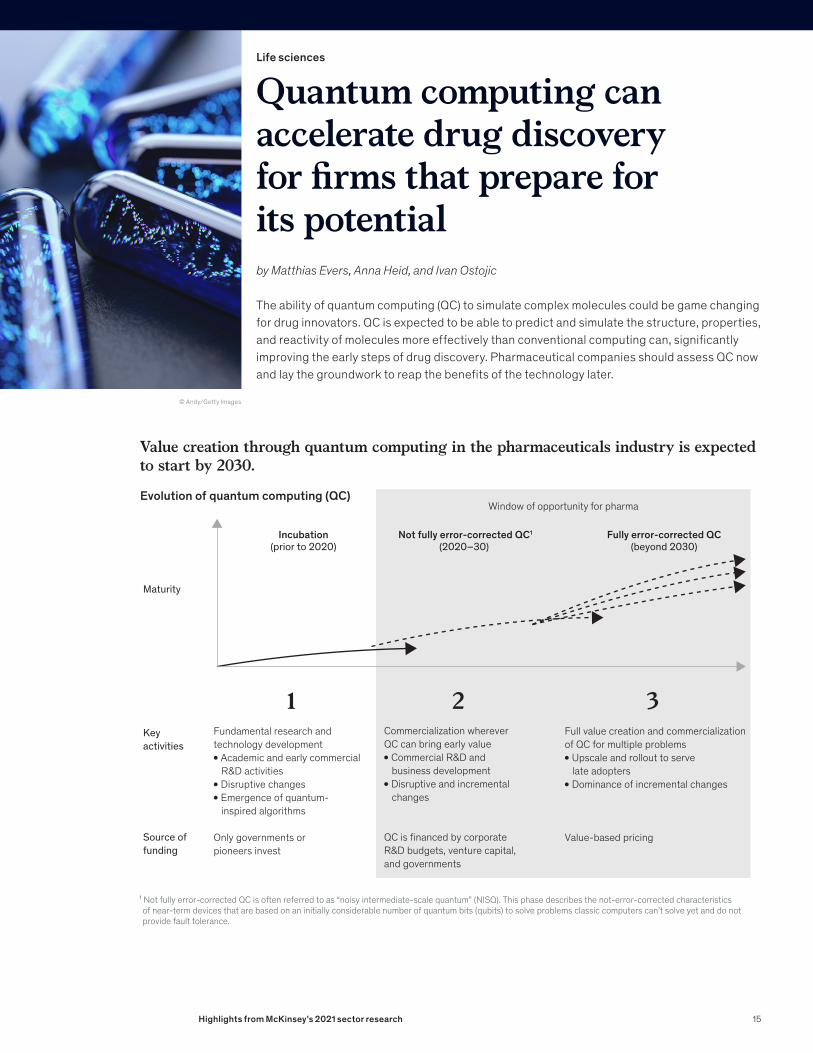
The ability of quantum computing (QC) to simulate complex molecules could be game changing for drug innovators. QC is expected to be able to predict and simulate the structure, properties, and reactivity of molecules more effectively than conventional computing can, significantly improving the early steps of drug discovery. Pharmaceutical companies should assess QC now and lay the groundwork to reap the benefits of the technology later.
© Andy/Getty Images
Value creation through quantum computing in the pharmaceuticals industry is expected to start by 2030.
Evolution of quantum computing (QC)
Incubation(prior to 2020)
Not fully error-corrected QC1
(2020–30) Fully error-corrected QC
(beyond 2030)
Fundamental research and technology development● Academic and early commercial
R&D activities● Disruptive changes● Emergence of quantum-
inspired algorithms
Only governments orpioneers invest
Commercialization whereverQC can bring early value● Commercial R&D and
business development● Disruptive and incremental
changes
QC is �nanced by corporate R&D budgets, venture capital, and governments
Full value creation and commercialization of QC for multiple problems● Upscale and rollout to serve
late adopters● Dominance of incremental changes
Value-based pricing
Keyactivities
Maturity
Source offunding
1 2 3
Window of opportunity for pharma
¹ Not fully error-corrected QC is often referred to as “noisy intermediate-scale quantum” (NISQ). This phase describes the not-error-corrected characteristics of near-term devices that are based on an initially considerable number of quantum bits (qubits) to solve problems classic computers can’t solve yet and do not provide fault tolerance.
15Highlights from McKinsey’s 2021 sector research
The recent winners in retail were best positioned to benefit from the pandemic-inspired flight to online sales
Retail
by Chris Bradley, Sajal Kohli, Dymfke Kuijpers, and Thomas Rüdiger Smith
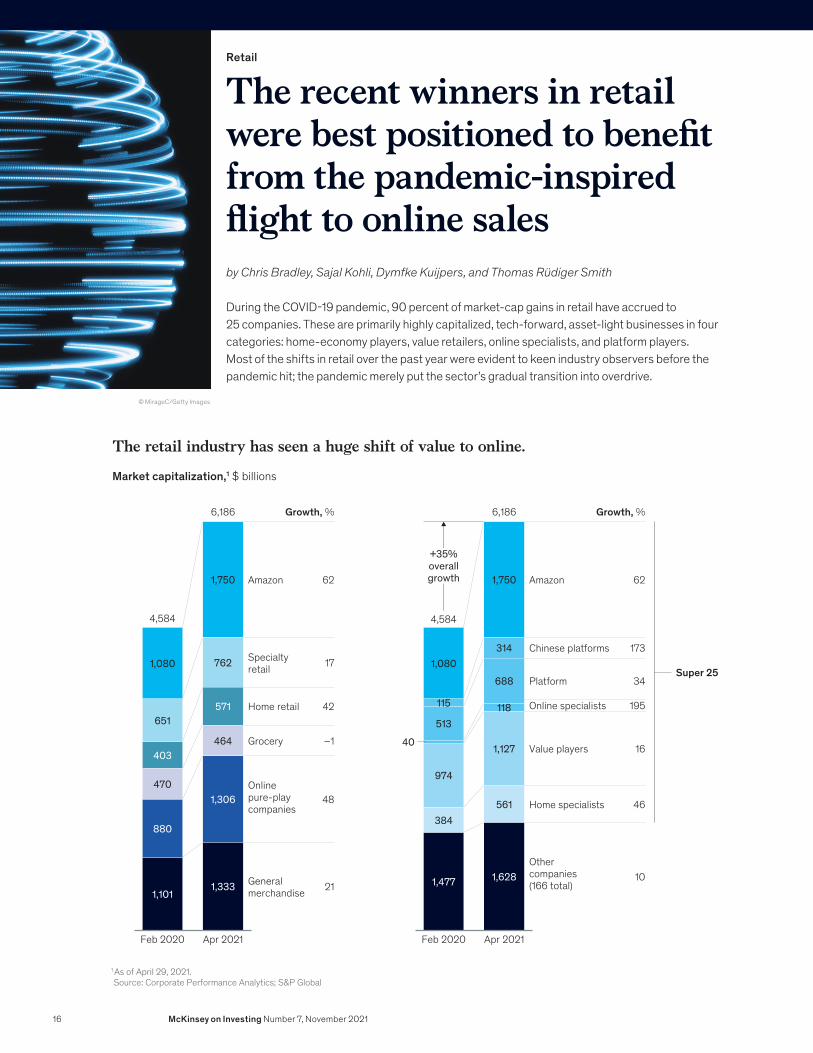
During the COVID-19 pandemic, 90 percent of market-cap gains in retail have accrued to 25 companies. These are primarily highly capitalized, tech-forward, asset-light businesses in four categories: home-economy players, value retailers, online specialists, and platform players. Most of the shifts in retail over the past year were evident to keen industry observers before the pandemic hit; the pandemic merely put the sector’s gradual transition into overdrive.
© MirageC/Getty Images
The retail industry has seen a huge shift of value to online.
Market capitalization,1 $ billions
Feb 2020Feb 2020
1,080
4,584
1,101
880
470
403
651
1,080
4,584
1,477
384
974
40
115
513
Apr 2021
6,186
1,333
1,306
464
571
762
1,750
Apr 2021
6,186
1,628
561
1,127
688
118
314
1,750Amazon
Home retail
Specialty retail
Grocery
General merchandise
Online pure-play companies
Growth, %
21
48
–1
42
17
62 Amazon
Super 25Platform
Chinese platforms
Online specialists
Home specialists
Value players
Other companies (166 total)
Growth, %
10
46
16
34
195
173
62
+35% overall growth
1 As of April 29, 2021.Source: Corporate Performance Analytics; S&P Global
16 McKinsey on Investing Number 7, November 2021
A travel boom is looming, but some pandemic-era changes could last for a long time
Travel, transportation, and logistics
© Westend61/Getty Images
by Jaap Bouwer, Vik Krishnan, Darren Rivas, Steve Saxon, and Nina Wittkamp
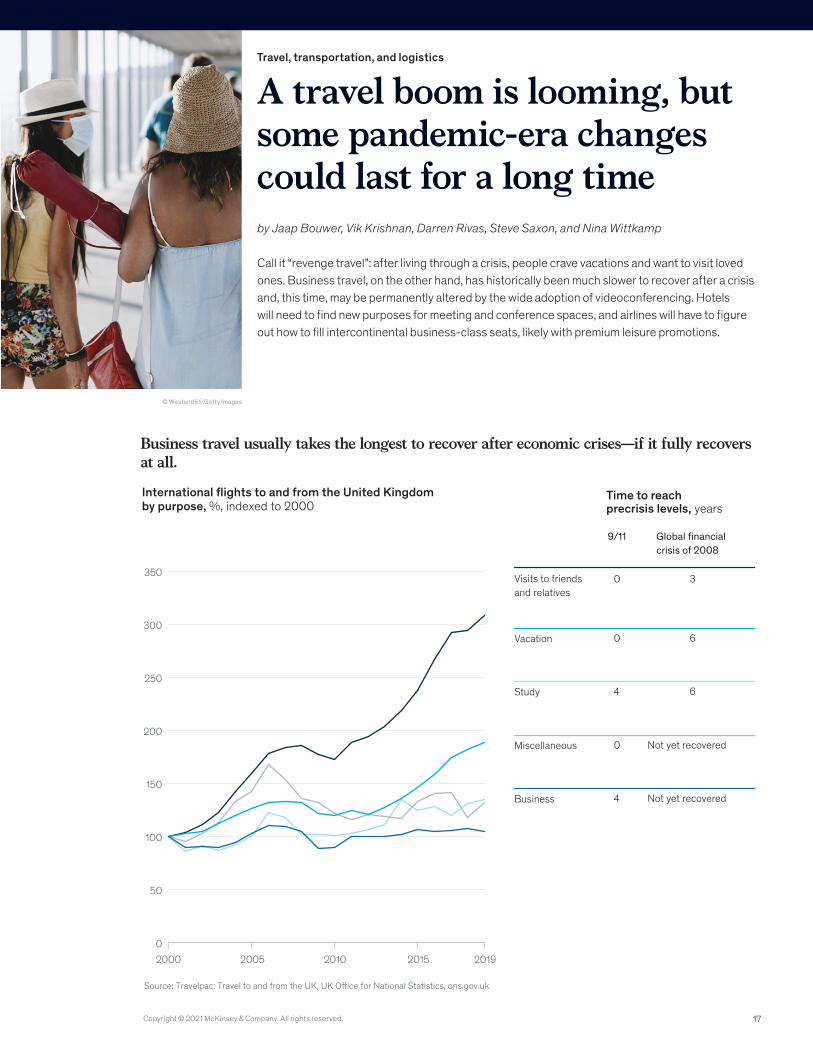
Call it “revenge travel”: after living through a crisis, people crave vacations and want to visit loved ones. Business travel, on the other hand, has historically been much slower to recover after a crisis and, this time, may be permanently altered by the wide adoption of videoconferencing. Hotels will need to find new purposes for meeting and conference spaces, and airlines will have to figure out how to fill intercontinental business-class seats, likely with premium leisure promotions.
Business travel usually takes the longest to recover after economic crises—if it fully recovers at all.
International �ights to and from the United Kingdom by purpose, %, indexed to 2000
Source: Travelpac: Travel to and from the UK, UK O�ce for National Statistics, ons.gov.uk
0
50
100
150
200
250
300
350
20192015201020052000
Global �nancial crisis of 2008
9/11
Time to reach precrisis levels, years
Visits to friends and relatives
30
Vacation 60
Study 64
Miscellaneous Not yet recovered0
Business Not yet recovered4
17Copyright © 2021 McKinsey & Company. All rights reserved.