Embed Size (px)
Citation preview

Stage 2 Feasibility Report
H i g H P l a i n s E x P r E s s i n i t i at i v E

ExEcutivE summary 3
HPx initiativE DEscriPtion 7
Basic information . . . . . . . . . . . . . . . . . . . . . . . 8
Initiative status . . . . . . . . . . . . . . . . . . . . . . . . 8
Estimated process timeframe . . . . . . . . . . . . . . . 8
Conceptual area . . . . . . . . . . . . . . . . . . . . . . . . 8
Initiative participants . . . . . . . . . . . . . . . . . . . 11
BEnEfits of HPx 13
Ratepayer benefits . . . . . . . . . . . . . . . . . . . . . 14
Macroeconomic benefits . . . . . . . . . . . . . . . . . 15
routing/PErmitting finDings 17
Route identification process . . . . . . . . . . . . . . 18
Summary of results . . . . . . . . . . . . . . . . . . . . 19
Permitting plan . . . . . . . . . . . . . . . . . . . . . . . 21
Permitting strategies . . . . . . . . . . . . . . . . . . . 22
Permitting outlook . . . . . . . . . . . . . . . . . . . . . 22
tEcHnical finDings 23
Transmission alternatives . . . . . . . . . . . . . . . . 24
Modeling . . . . . . . . . . . . . . . . . . . . . . . . . . . 25
Technical assumptions . . . . . . . . . . . . . . . . . . 26
Transmission line length assumptions . . . . . . . . 26
Transfer capability . . . . . . . . . . . . . . . . . . . . . 27
Cost estimates . . . . . . . . . . . . . . . . . . . . . . . . 28
Integration with other projects . . . . . . . . . . . . . 28
Summary of results . . . . . . . . . . . . . . . . . . . . 30
commErcial finDings 31
Methodology . . . . . . . . . . . . . . . . . . . . . . . . 32
Key assumptions . . . . . . . . . . . . . . . . . . . . . . 33
Resource additions without HPX . . . . . . . . . . . 36
Resource additions with HPX . . . . . . . . . . . . . . 38
Sensitivity cases . . . . . . . . . . . . . . . . . . . . . . . 40
Calculation of revenue requirements for each transmission alternative . . . . . . . . . . . . . . . . . 43
Comparison of net benefits to cost of the line . . . 46
Summary of ratepayer benefit-cost analysis . . . . 54
Other commercial findings . . . . . . . . . . . . . . . 56
conclusion 57
aPPEnDix 60
Glossary of acronyms . . . . . . . . . . . . . . . . . . . 60
Table of Contents


Executive Summarythe High Plains Express (HPx) initiative is a roadmap for transmission development in the Desert
southwest and rocky mountain regions to significantly strengthen the eastern portion of the western
power grid studies indicate that HPx would enhance regional reliability, improve market deliverability
for renewable and other low-cost energy, and potentially provide economic benefits for ratepayers,
utilities and the general public in Wyoming, colorado, new mexico and arizona

5 Executive summaryThe HPX initiative began in 2006 when
a group of interested parties executed a
formal agreement to engage in high-level
studies of the project’s feasibility . Stage 1
of the study effort culminated in a June
2008 Feasibility Study Report . Stage 2
commenced in late 2008 with a more
detailed feasibility assessment conducted
through an Executive Committee and
four standing committees: the Routing/
Permitting Study Committee, Technical
Study Committee, Commercial Study
Committee and Communications
Committee . The following report
summarizes each of the three study
committee’s findings, and marks the
conclusion of Stage 2 .
As outlined in this report, Stage 2 studies
continue to affirm that a high-voltage
transmission system could collect high
quality, low-cost resources and enable
delivery to match demand throughout
Colorado, New Mexico and Arizona .
Stage 2 analyses examined the routing,
technical and economic feasibility of
several transmission line configurations,
with the following general conclusions:
n HPx appears to be feasible from a routing perspective with one or two distinct circuits across the study area
n HPx appears to be technically feasible in any of the proposed line configurations
n HPx economic feasibility is highly dependent on uncertain assumptions
n HPx has the potential to be an economically viable project
The routing/permitting process determined that despite significant siting constraints and areas that present fatal flaws, there are numerous areas where high-voltage transmission could be developed . Project participants accept that there will be challenges associated with developing transmission in or near sensitive areas, and understand that the initiative will be heavily influenced by various regulatory, permitting and land-use activities that may affect the feasibility and risks of a potential project .
Technical analyses evaluated five transmission alternatives: single- and
double-circuit 500kV configurations in a two-corridor approach similar to Stage 1 studies; single- and double-circuit 500kV configurations in a single-corridor approach; and a single-corridor “progressive,” or “telescoping,” configuration that would employ a single 345kV line from Wyoming to Colorado, a double-circuit 345kV line from Colorado to New Mexico, and a single 500kV line from New Mexico to Arizona . Studies found that each of the five alternatives would be technically feasible, with the two-corridor alternatives resulting in both higher transfer capabilities and higher capital investment costs than the single-corridor alternatives .
Despite the seemingly positive outlook on overall project feasibility, the economic findings of Stage 2 present a level of uncertainty that warrants further study before the HPX initiative proceeds as a discrete project into the regulatory, build-out and commissioning stages .
In modeling the economic feasibility of HPX, the Commercial Study Committee and its contractors were required to control the variables surrounding a set of discrete scenarios by making
HPx appears to be feasible in terms of routing and technical considerations
its economic viability is highly dependent on a number of uncertain conditions

6
assumptions about market conditions in the future . Key assumptions are based on load forecasts, renewable demand, cost of generation, price of fuel and electricity, as well as attitude toward power sharing across state lines (as opposed to localized generation) .
Although key assumptions are easily and independently manipulated in the context of the study, there are numerous other factors such as changes to public policy, technological advancements and fluctuating market demands that could have large and unpredictable impacts on the economics of the HPX initiative . Already the results of the study’s limited scenarios demonstrate a wide variation in economic viability—with benefit-cost ratios ranging between .83 and 2 .19 for a single configuration—but in the volatility of the actual market and regulatory environment, these ranges could easily change .
Assumptions used in Stage 2 were based on the best information available to participants at the time of study, but participants recognize that realities
may change at any time to undermine the validity of the economic portion of the report . For example, much of the economic evaluation is based on assumed cost estimates that point to solar options remaining approximately twice the cost of wind—a reality that may or may not be revealed in time . HPX participants also recognize that there are several assumptions used in the study that may or may not align with real markets, or the desires of states or utilities . For example, Stage 2 studies assume no constraints on where renewable energy generation would be located within the four-state study area; however, most or all states have at least some preference for in-state renewables, due to the economic benefits and incentives of such development .
Additional uncertainty exists beyond the assumptions made in the economic evaluation . Even with benefit-cost ratios that exceed 1 .0, no clear mechanisms exist within the HPX footprint for cost allocation and cost recovery, which provides varying benefits to multiple
jurisdictions . Further, a liquid market for
HPX does not currently exist, making
it difficult to monetize the benefits
identified in Stage 2 .
The commercial studies demonstrate
that, under some scenarios, the benefits
provided by HPX would outweigh the
cost of the project . But under other
scenarios, the benefits fall short of the
cost, which could potentially make
the project an imprudent investment
for ratepayers and other entities .
Conversely, if customers or independent
developers are identified who are willing
to financially support the project, there
would be additional incentive for HPX
participants to advance development of
the initiative .
Because of the wide range of outcomes
that are possible at the close of Stage
2, participants have elected to pursue a
Stage 3 evaluation, which will focus on
additional studies and monitor public
policy, market conditions and technical
needs that may impact the viability of the
project .


HPX Initiative DescriptionHPx is intended to be a cost-effective, high-voltage backbone transmission system through
Wyoming, colorado, new mexico and arizona that will enhance reliability and increase access to
renewable and diverse generation resources within regional energy resource zones

9 HPx initiative DescriptionThe initiative was designed to address the region’s:
n anticipated load forecasts, which show a demand for new energy and capacity
n mandated renewable Portfolio standard (rPs) goals
n location-dependent conventional and renewable generation resources, and the cost implications thereof
n Potential risk of renewable curtailment
Basic information
n transmission voltage: 500kv ac
n capacity: 1600 to 8000 mW
n length: approximately 1450 (one-corridor configuration - see figure 2, page 9) to 2250 line-miles (two-corridor configurations - see figure 1, page 10)
n route: originates in southeastern Wyoming and traverses the eastern plains of colorado and new mexico, turning west to a terminus at Palo verde, west of the Phoenix, arizona area
n Preliminary capital cost estimates: $3 4 billion (one-corridor single-circuit line) to $8 3 billion (two-corridor double-circuit lines)
n in-service date: 5 to 8 years after initiation of routing/permitting process
initiativE status
Stage 2, now complete, expanded the feasibility considerations of the transmission alternatives explored in Stage 1, and included more detailed studies to further address issues such as siting, permitting, preliminary design options, and commercial feasibility . The results of Stage 2 confirmed the technical feasibility of various alternatives and refined the transfer capabilities and costs .
As a result of uncertainties that remain at the close of Stage 2, project participants plan to embark on a Stage 3 evaluation effort that will focus on monitoring pertinent regulatory developments, and forming strategies for moving the initiative forward . Stage 3 will include further examination of:
n Energy demand forecasts
n changes in projected costs
n renewable technology developments and improvements
n Public policy developments
n cost recovery mechanisms
n other factors that could impact both the need for and the economic viability of HPx
The length of Stage 3 will depend on how quickly changes occur in the primary factors noted above, but is currently estimated to take between one and three years . It is anticipated that at the conclusion of Stage 3 the participants will
be able to determine whether the project fundamentals justify moving forward with development stages of the project .
EstimatED ProcEss timEframE
n stage 1, preliminary feasibility study (complete) – 2006 to 2008
n stage 2, feasibility study (complete) – 2008 to 2010
n stage 3, evaluation – 2 to 3 years
n corridor development, preliminary engineering and permitting – 3 5-4 5 years (subject to variability on both sides)
n Build-out – 3 to 6 years (subject to variability on both sides)
n commissioning – 2020 to 2025 timeframe
concEPtual arEa
The conceptual area and general transmission routing for the two-corridor and single-corridor alternatives are shown in Figures 1 and 2 . Figure 1, page 9, shows the two-corridor configuration . The eastern/southern corridor originates in Wyoming, follows an easterly route through Colorado and New Mexico, and terminates in central New Mexico at the SunZia Project . The western/northern route also originates in Wyoming, but follows a more western route through Colorado and New Mexico . It also connects to the SunZia Project, but continues into Arizona and terminates at Palo Verde . Figure 2, page 10, shows the

10
figurE 1
HPX Two-Corridor Configuration Conceptual Map

11
figurE 2
HPX One-Corridor Configuration Conceptual Map

12
conceptual routing for the single-corridor alternative . Note that the single-corridor routing overlaps with portions of each of the routes used for the two-corridor alternatives . The transmission would interconnect with numerous substations and coordinate with other proposed transmission projects within the HPX conceptual area .
initiativE ParticiPants
Preliminary meetings to discuss concepts, interest and scope led to the development of an agreement for a transmission feasibility study . Each of the interested parties felt that the best
way to conduct a joint study would be to pool resources and hire independent consultants for the bulk of the transmission studies . These participants entered into a formal agreement that described the scope of the study effort and the participant responsibilities .
Participants include:
n colorado springs utilities
n Public service company of new mexico
n salt river Project
n ls Power
n tri-state g&t
n Western area Power administration
n xcel Energy
n new mexico renewable Energy transmission authority
n Wyoming infrastructure authority
n colorado clean Energy Development authority
n Black Hills corporation
n nextera Energy resources
Participants then divided into five standing committees to distribute study tasks as shown in the following organization chart .
(ls PoWEr) (xcEl EnErgy)
figurE 3
HPX Organization
(xcEl EnErgy & ls PoWEr)


Benefits of HPXas described in the Executive summary (page 3-5), the primary benefits of HPx would be derived from
allowing lower-cost resources to be delivered to markets that they would not otherwise be able to reach
in turn, this would enable these resources to expand utilities’ and states’ options for procuring renewable
energy, and may help them achieve mandated rPs targets furthermore, collaboration among projects
and utilities within the HPx footprint could minimize environmental impacts and control expenses of
future development through the use of shared planned utility corridors

15 Benefits of HPxIn evaluating the viability of the HPX initiative, it is necessary to weigh the quantifiable benefits of HPX—such as potential savings to ratepayers, macroeconomic growth and access to renewable resources—against the total start-up and ongoing costs . This section qualitatively describes the long- and short-term benefits to ratepayers and regional economies . For a quantitative analysis of how these benefits compare to the overall cost of the project, please refer to page 4 (Comparison of net benefits to cost of the line) .
ratEPayEr BEnEfits
Ratepayers benefit when a project reduces a utility’s revenue requirement, lowering the amount the utility needs to collect from its customers . Many factors contribute to offsetting a utility’s revenue requirement, but three primary opportunities for the HPX initiative include: reduction in the cost of resource procurement, operational benefits resulting from increased efficiency of resource dispatch to meet load, and the value of shared capacity resources to meet peaks among balancing authorities .
Stage 2 studies attempt to quantify the
impact that HPX will have on all three
factors .
long-term procurement benefits
Increased transfer capability between
Wyoming, Colorado, New Mexico
and Arizona may benefit ratepayers
by reducing the costs of procuring
energy to meet renewable and load-
service requirements . A transmission
line from Wyoming to Arizona would
allow Colorado, New Mexico and
Arizona utilities to access additional
wind resources to meet their renewable
generation needs . These resources,
developed with the line, may be able to
displace the traditionally higher-cost wind
in Colorado and New Mexico, and the
higher-cost solar resources in New Mexico
and Arizona, thereby reducing the cost of
renewable procurement in each of these
states . While the study presumed that the
highest capacity factor for wind power
would remain in Wyoming, Colorado
and New Mexico may also develop wind
resources for export, depending on the
line’s configuration .
operational benefits
Increasing the transfer capacity among the four states in the study area could initiate more competition among fossil fuel resources in the West, leading to lower costs to ratepayers . The proposed line would allow natural gas generators in Wyoming and Colorado to compete with those in New Mexico and Arizona, displacing power generated with higher-cost Southwestern gas and replacing it with power from plants that have access to the traditionally lower-cost Rockies gas market . Entities in the Southwest may benefit from depressed market prices at the Palo Verde trading hub in Arizona, while those in Colorado and Wyoming that control much of the fossil fleet in that region could benefit due to increased plant operation . Any benefits would be passed on to ratepayers in the region . In addition, the line may provide an outlet to allow surplus solar energy from the Southwest to be transferred back to New Mexico and Colorado .
capacity-sharing benefits
The proposed line would increase the transfer capability among the various utilities in the study area . This increased
HPx would enhance regional reliability, improve market deliverability for
renewable and other low-cost energy, and potentially provide economic benefits
for ratepayers, utilities and the general public

16
transfer capability would allow for increased capacity sharing between utilities as they build generation portfolios to meet planning reserve margins .
Increased transfer capability within the study area would allow for utilities to benefit from the diversity of their peak loads and resource portfolio mix, especially renewable resources . Differences in weather patterns and load characteristics mean that different utilities experience their system peak at different times during the year . The quantity of resources that a given utility needs to build to meet its reserve requirement is determined by that utility’s peak load . Without transfer capability between zones, each utility must build sufficient new capacity to meet the growth of its non-coincident peak . However, HPX would enable additional transfer capability between utilities, increasing their ability to import or export more power during peak load hours to assist neighboring states in meeting load and reserve requirements . This allows utilities to avoid or defer new capacity investments . The benefits from avoided investments in new generation capacity would be shared by ratepayers across the region .
other ratepayer benefits
Increasing the transfer capability between states in the West may also have operational reliability benefits, although
those benefits have not been quantified in this stage . Additional transfer capacity can defer the need for reliability-driven system upgrades and reduce the operating costs associated with maintaining the hour-to-hour reliability of the system .
One particularly interesting operational benefit that has not been quantified in this analysis is the benefit of blending geographically diverse wind resources on time segments of an hour and less . The intermittency of wind generation is one of the major challenges of its integration into the electric power system . However, HPX would facilitate the development of wind generation from multiple remote geographic regions and solar resources in the Southwest, thereby providing a more diverse portfolio of renewable resources . Especially at the high renewable penetrations targeted by some states, this could reduce the cost of operating with respect to the variability and uncertainty of wind and solar resources .
The increased reliability of the system with HPX may ultimately reduce utility costs associated with insurance and risk mitigation measures, however this is not confirmed . System operators would have increased operational flexibility during reliability events because of the increased robustness resulting from the construction of HPX .
There are several other potential benefits of the line that are not included in the
ratepayer analysis . Non-ratepayer benefits of the line include a possible reduction in WECC-wide greenhouse gas emissions, the potential for lowered regional fuel prices and the availability of other ancillary services .
macroEconomic BEnEfits
In addition to ratepayer benefits, the construction of HPX would bring other benefits to the four affected states . The construction of the line and associated resources would provide macroeconomic benefits to states where the majority of development would occur: the project would provide new jobs and increase the states’ tax bases . Based on the assumptions of the study, Arizona, by contrast, would experience the greatest benefit from ratepayer savings, rather than economic development .
The Stage 2 Economic and Fiscal Impact Analysis performed by Cardno ENTRIX found that there would be three sources of economic impact in Wyoming: the construction and operation of the HPX transmission line, the construction and operation of 3,000 MW of wind power generation, and ratepayer savings . There would be four sources of economic impact in Colorado: the construction and operation of the HPX transmission line, the construction and operation of gas combined turbine (CT) generation, ratepayer savings, and the manufacture of wind turbine blades and towers for

17
HPX-related wind farms located in other states . And there would be two sources of economic impact in New Mexico: the construction and operation of the HPX transmission line and ratepayer savings .
Combined estimated economic impacts, in terms of increased jobs and income, above and beyond what the region would experience without HPX, are as follows:
n construction phase impacts are estimated at $2 7 billion and 21,700 jobs
n construction phase income in each of the three states ranges from $800 million to $1 billion
n total recurring annual operations impacts are estimated at $74 million and 850 annual jobs
n recurring operations phase income ranges from $8 million annually (nm) to $33 million annually (co, Wy)
A portion of the operation and
construction costs of HPX and related
generation facilities would go toward
local and state governments in the form
of taxes . Using income, sales/use and
property tax data collected by Cardno
ENTRIX, it is estimated that total taxes
collected during construction would be
$371 million in Wyoming, $30 million
in Colorado and $51 million in New
Mexico . Ongoing annual tax collection,
almost exclusively due to property
tax, is estimated to total $58 million in
Wyoming, $28 million in Colorado and
$11 million in New Mexico .

Routing/Permitting Findingsstage 2 routing/permitting studies evaluated opportunities and constraints within the
initiative footprint, and developed permitting scenarios at the local, state and federal
levels the study area included 123,000,000 acres, spanning 62 counties in four states, and
representing the gamut of land-ownership classifications as described in figure 4, page 18

19
figurE 4
Land ownership within the HPX study area
routing/Permitting findingsroutE iDEntification ProcEss
An opportunities and constraints analysis is a preliminary activity in the process of identifying routes for a proposed transmission line, though specific corridor and route identification was not a goal of Stage 2 studies . Corridors between interconnection points can be determined by capitalizing on areas of opportunity and attempting to avoid or mitigate the use of areas of constraint within the overall study area . The opportunities and constraints analysis consisted of the following steps:
Data collection
Resource data within the study area were collected from federal, state, and local government agencies as well as non-governmental organizations, HPX participants and private companies . Data obtained were used to prepare resource maps showing the following resource categories: land use, transportation, land cover, utilities, water resources, cultural and historic resources, biological resources, and geology and soils .
identification of opportunities and constraints
Data were classified into one of three categories based on the resource’s compatibility with transmission facilities and restrictions on proximity of those facilities to sensitive resources .
n opportunity areas (14 classes) are considered favorable for transmission line routing and tend to contain existing development or linear features (e g , roads, transmission lines, pipelines) that minimize the need to develop new corridors
n sensitivity areas (50 classes) are areas where environmental effects are likely to occur or be negatively perceived, given the placement of extra-high voltage facilities Examples of sensitive areas include native american reservations, Blm-designated areas of critical Environmental concern, wetlands and big game wintering areas it may be possible to mitigate the effects of facilities in these areas using routing adjustments, careful placement of transmission structures and access roads, and other similar mitigation measures
n Exclusion areas (20+ classes) represent the area of greatest potential environmental, social or economic effects these areas generally are excluded from routing, often as a matter of law or regulation impacts to exclusion areas generally do not have mitigation potential the HPx study area includes more than 6,000,000 acres of exclusions comprised of usfs wilderness, usfs roadless areas, wilderness study areas, national Park services lands, etc
identification of stakeholder issues
There are several transmission projects in various stages of planning and implementation within the HPX study area . Documents containing public input from 17 transmission or generation projects were reviewed to identify potential public concerns and incorporate them into the opportunities and constraints analysis .

20
future considerations
This analysis was designed to consider landscape features and land management at a state/county level . During the data collection effort, 45 additional criteria were identified that would be useful during corridor and route identification in future phases of the initiative . Examples of these criteria include the locations of airports, oil and gas wells, scenic easements, wetlands, floodplains, historic sites, Native American Sacred Sites, occurrences of protected species and separation requirements between high-voltage transmission facilities .
composite mapping
Classification of resources in this manner helps to rapidly assess potential impacts to sensitive areas, and to avoid restricted areas in the corridor identification and routing processes . A composite map was prepared of opportunity, sensitivity, and exclusion areas using GIS analysis (Figure 5) . The opportunities and constraints map for the study area is shown in Figure 6, page 20, in the Results section below .
summary of rEsults
Table 1 summarizes the acreages of opportunity, sensitivity and exclusion areas by state, while Figure 6, page 20, shows an overlay of these areas on a regional map . Locations where opportunity areas overlap are shown in darker green as having the greatest opportunity . Overlapping sensitivities are shown in shades of yellow and orange . Exclusion areas are shown in red .
figurE 5
Opportunities/constraints mapping
taBlE 1
Acreage of opportunities and constraints by state
Category WY
(acres) CO
(acres) NM
(acres) AZ
(acres) Opportunity Areas
11.7 million 17.8 million 24.5 million 13.3 million
Sensitivity Areas
4.3 million 8.0 million 23.5 million 12.6 million
Exclusion Areas
0.4 million 0.4 million 3.5 million 3.0 million

21
figurE 6
Opportunities and constraints within the HPX study area

22
PErmitting Plan
Routing a transmission line and
associated facilities would require
compliance with federal, state and local
laws to varying degrees, dependent
upon the routes, ownership of facilities
and funding mechanisms . The purpose
of a permitting plan is to identify these
requirements for the construction and
operation of HPX . The plan defines
plausible permitting scenarios based
on agency jurisdiction in the study area;
identifies applicable permits, approvals
and process requirements of agencies that may have future guidance for route selection and are necessary to construct and operate HPX; identifies a tentative permitting schedule; and identifies and discusses critical issues that may affect compliance requirements, costs and schedules .
PErmitting scEnarios
Given the broad study area, the proposed length of the HPX transmission project and the number of federal agencies
with jurisdiction pertaining to lands or resources in the study area, it is likely that federal approval and National Environmental Policy Act (NEPA) compliance will be necessary (Figure 7) . Plausible permitting scenarios have been identified based on the type of federal action triggering NEPA, the scope of the NEPA process, and how compliance with state and local regulations would be achieved . The timeframe for permitting a multi-state transmission project can be expected to take approximately 2 .5 to 3 years to complete .
figurE 7
NEPA permitting process

23
PErmitting stratEgiEs
The most land-intensive transmission
alternative for HPX would require
construction of two double-circuit 500kV
AC transmission lines . Given the length of
the proposed line, number of landowners
and agencies involved, and the necessary
coordination between utilities, permitting
will require significant investments in
time and funding .
Other factors that may facilitate
permitting include coordination of
field studies for environmental impacts
that are required by various agencies
and permit applications, as well as
identification of data needed early in the
process . The timing of the NEPA process
and state permit process should also be
considered . The Arizona Corporation
Commission and Power Plant and
Transmission Line Siting Committee,
the Wyoming Industrial Siting Division, and the New Mexico Public Regulation Commission express a strong preference with projects also requiring a NEPA process that at least a draft Environmental Assessment or EIS be completed before public hearings with these state agencies .
PErmitting outlook
While further study is needed to determine the economic viability of proceeding with the development stages of HPX, project participants recognize that the future will likely bring a variety of conditions to the study area that will affect the feasibility of currently proposed routing and permitting strategies, as well as the conceptual schedule . Factors may include:
n Population growth
n oil, gas and wind development
n new wilderness proposals
n Energy corridor designation by state and federal governments
n conservation easement protections
n critical wildlife corridor designations
n more endangered species designations
n increase in permitting and/or mitigation costs
These factors will be critical to track
as the initiative moves forward . An
efficient and productive routing and
permitting process is dependent on
early involvement and comprehensive
participation from stakeholders, including
the public, landowners and permitting
agencies, and will invest the time
necessary to engage diverse stakeholders
from all four states .

Technical Findingsstage 2 technical studies expanded on the stage 1 effort, and evaluated five transmission
alternatives Each alternative consists of a set of high-voltage transmission system
additions that would originate in Wyoming and terminate in arizona

25 technical findings transmission altErnativEs
Stage 1 studies focused on a line configuration that would occupy two transmission corridors, as shown in Figure 1, page 9 . Stage 2 technical analyses started with that premise, using a slightly modified layout of the corridors . In Wyoming, the transmission was assumed to originate at a proposed Windstar substation, which has been considered as a potential location for wind development . In New Mexico, the eastern corridor was moved farther to the east to interconnect with the existing Blackwater substation . This would allow the project to accommodate resources on the eastern side of New Mexico and would present an opportunity to connect to the proposed Tres Amigas project . In Arizona, the transmission has been extended past the Phoenix area to terminate at the existing Palo Verde station . Finally, since the SunZia project is considered an independent project for the Stage 2 analysis, most studies assumed that SunZia would be in place and the eastern corridor would terminate at the western terminus of SunZia at a substation referred to as “SunZia East” .
In addition to the original two-corridor configuration, Stage 2 studies also examined system alternatives that would utilize a single transmission corridor, shown in Figure 2, page 10 . The single-corridor routing would use portions of the paths used for the two-corridor alternatives . From Wyoming to
Colorado, the western path was used, with transmission running from Windstar through Laramie River, then to Pawnee . From Pawnee, a transmission path would be developed to Wray, where the eastern corridor would be used down to Vilas . From Vilas, the path would connect to Gladstone, where the western/northern corridor would be used into Arizona . The single corridor alternatives still have the potential for coordinating with the Wyoming-Colorado Intertie Project and the Colorado SB100 transmission .
Two of the alternatives evaluated utilized the two-corridor configuration: a single-circuit 500kV transmission, and a double-circuit 500kV transmission in each corridor . Three of the alternatives utilized the new, single-corridor approach: a single-circuit 500kV transmission, a double-circuit 500kV transmission, and a “progressive,” or “telescoping,” alternative . This progressive alternative modeled a single 345kV line from Wyoming to Colorado, a double-circuit 345kV line from Colorado into New Mexico, and a single 500kV line from New Mexico to Arizona . The basic transmission alternatives are summarized in Table 2 . Table 3 lists the interconnection locations that were modeled for the alternatives .
moDEling
Base casesStudies were performed using ten-year planning horizon powerflow and
dynamic models . The WECC-approved 2019 Heavy Summer (19hs1a .sav) was used as the seed case for this analysis . The cases were reviewed and modified by the Technical Study Committee participants to represent the system loads and topology expected for the year 2020 .
resource/interconnection modelingGenerally, the incremental transfer capability as a result of the HPX transmission additions for each alternative was measured by increasing generation at the originating substations in Wyoming, and by decreasing generation in Arizona .
WyomingGeneration was added at the proposed Windstar substation and the existing Laramie River substation in Wyoming . For the most part, generation was added at each location in equal amounts . Generation added in Wyoming was balanced by a generation reduction in Arizona .
coloradoFor Colorado, some generation was added at each interconnection within the state . Many of these have a high potential for renewable energy development . Any increase in generation at the interconnections within Colorado was balanced by (a) an increase in load due to load growth in the 2020 forecast, and (b) reduced generation at Denver-metro fossil-fuel plants . Therefore, there was

26
Alternative Interconnection points – west corridor Interconnection points – east corridor Two-‐corridor, single-‐ or double-‐circuit Windstar
Laramie River Pawnee Big Sandy Boone Gladstone Guadalupe Corona Springerville Abel Palo Verde
Windstar Wray Burlington Lamar Blackwater Corona SunZia East
One-‐corridor, single-‐ or double-‐circuit Windstar Laramie River Pawnee Wray Burlington Lamar Vilas Gladstone Guadalupe Corona Springerville Abel Palo Verde
taBlE 3
HPX interconnection locations
Alternative Description 1 Two single-circuit 500kV lines from Wyoming to Arizona 2 Two double-circuit 500kV lines from Wyoming to Arizona 3 One single-circuit 500kV line from Wyoming to Arizona 4 One double-circuit 500kV line from Wyoming to Arizona 5 “Progressive” 345-kV & 500-kV System (This alternative modeled a single 345kV line from
Wyoming to Colorado; a double-circuit 345kV line from Colorado into New Mexico; and a single 500kV line from New Mexico to Arizona.)
taBlE 2
HPX configuration alternatives

27
no net impact on imports or exports for Colorado as a result of the additional generation within Colorado .
new mexicoFor New Mexico, modeling was conducted with a similar approach as in Colorado . The benchmark base case included 3000 MW of generation associated with the SunZia project, which was scheduled to Arizona . However, the Technical Study Committee agreed to modify the generation to place 1000 MW at three New Mexico locations: SunZia East, Corona, and Blackwater . In addition, some generation was added at Gladstone and Guadalupe . That generation was balanced by (a) an increase in load due to load growth in the 2020 forecast, and (b) reducing generation at New Mexico fossil-fuel plants .
arizonaTo balance the generation added in Wyoming and scheduled on HPX, fossil-fired units in Arizona were decremented on a pro-rata basis . Specifically, the following generation sites were used for balancing the generation increases at Windstar and Laramie River in Wyoming:
n Palo verde Hub area generation (arlington, mesquite, red Hawk, Harquahala)
n Pinal central area generation (Desert Basin)
n Willow generation (Bowie)
n abel s generation (abel)
n springerville sub generation (springerville)
tEcHnical assumPtions
n HPx transmission line characteristics were modeled using 3-conductor bundled 1590 kcmil “lapwing” conductor with a normal rating of 2892 mva and an emergency rating of 3336 mva
n the study assumed 70% series compensation for all HPx line segments stage 1 studies evaluated various levels of series compensation, but this study maintained a level of 70% on all HPx transmission segments the continuous and emergency ratings for the series compensation were assumed to be at least that of the transmission conductors
n impedances for each transmission line segment were calculated based on line length assumptions as described below
transmission linE lEngtH assumPtions
In order to calculate estimated line impedances, the length of each transmission line was estimated . While precise transmission line routing has not been conducted, the Routing/Permitting Study Committee’s findings were used to estimate routing lengths between upload
and download locations . Lengths of each segment are summarized in Table 4 .
Westerly route: The western route would start in Wyoming at the proposed Windstar substation near Dave Johnston power plant . The line would interconnect at Laramie River station, then cross into Colorado and interconnect at Pawnee, Big Sandy and Boone . From Boone the line would travel to New Mexico and connect to Gladstone . In New Mexico intermediate interconnection points were modeled at Guadalupe and Corona . Leaving New Mexico, the western corridor would take a more northerly route to Arizona . In Arizona interconnections were modeled at Springerville and Abel, terminating at Palo Verde .
Easterly route: This eastern route would start in Wyoming at the proposed Windstar substation, and follow an easterly route to the eastern Colorado substations at Wray, Burlington, Lamar and Vilas . From Vilas the line would continue through eastern New Mexico and connect to Blackwater . This is a deviation from the Stage 1 studies, where both lines remained in a common corridor from Gladstone to Ft . Craig . For Stage 2, the eastern route continues from Blackwater to Corona, where it would meet with the western corridor . At Corona, a tie would be created to SunZia by a line from Corona to SunZia East substation .

28
transfEr caPaBility
Because HPX would traverse four states and interconnect the existing transmission system at a multitude of locations, it does not make sense to think of the project as having a single MW rating . In fact, the transfer capability will vary along the project length . WECC “paths” are defined by a discrete set of transmission elements that cross a defined boundary . The HPX transmission
configuration crosses many different
existing paths and creates the potential
for numerous path definitions .
To simplify the issue for the Stage 2 study
effort, three new transmission paths were
defined to evaluate potential transfer
capabilities . For simplification, the paths
are now defined by the state boundaries
that the transmission elements crossed .
HPX Path 1 is defined as the Wyoming/
Colorado border, HPX Path 2 is defined
as the Colorado/New Mexico border, and
HPX Path 3 is defined as the New Mexico/
Arizona border .
Stage 2 technical studies established
preliminary transfer capability ratings for
each of these three new paths . It should
be cautioned that the scope of this study
is considered preliminary and is limited,
compared to a complete path rating
Alternative Voltages Line Project Miles 1 2 3 4 5 Windstar – LRS New 75 500X1 500x2 500X1 500x2 345X1 LRS – Pawnee WYCO 180 500X1 500x2 500X1 500x2 345X1 Pawnee – Wray New 85 500X1 500x2 345x1 Wray – Burlington New 60 500X1 500x2 500X1 500x2 345x1 Burlington – Lamar SB100 100 500X1 500x2 500X1 500x2 345x2 Lamar – Vilas SB100 60 500X1 500x2 500X1 500x2 345x2
Vilas – Gladstone New 120 500X1 500x2 345x2 Gladstone–Guadalupe New 104 500X1 500x2 500X1 500x2 345x2 Guadalupe – Corona New 65 500X1 500x2 500X1 500x2 345x2 Corona–SunZia East New 30 500X1 500x1 500X1 500x1 500x1 Corona–Springerville New 262 500X1 500x2 500X1 500x2 500x1 Springerville – Abel New 180 500X1 500x2 500X1 500x2 500x1 Abel – Palo Verde New 127 500X1 500x2 500X1 500x2 500x1 Windstar – Wray New 285 500X1 500x2 -- -- -- Pawnee – Big Sandy New 61 500X1 500x2 -- -- -- Big Sandy – Boone New 79 500X1 500x2 -- -- -- Boone – Gladstone New 140 500X1 500x2 -- -- -- Gladstone – Guadalupe New 104 500X1 500x2 -- -- -- Vilas - Blackwater New 285 500X1 500x2 -- -- -- Blackwater – SunZia East New 150 500X1 500x2 -- -- --
taBlE 4
HPX estimated line lengths and requirements by segment

29
study consistent with the WECC Three Phase Path Rating Process, but more along the lines of a preliminary Phase 1 path rating study .
interaction with sunZia
For comparison purposes, Stage 1 technical studies considered the SunZia Project to be incorporated into the HPX Initiative as a potential segment of HPX and the number of circuits and voltage levels would match other series components . Stage 2 studies, however, model the SunZia project as a separate and independent project from HPX, consisting of two 500kV AC lines for modeling purposes . Between New Mexico and Arizona, the HPX Path 3 transmission consists of either one single-circuit 500kV line or one double-circuit 500kV line stretching from Corona to Palo Verde . To evaluate how HPX and SunZia might complement each other as part of the interconnected system between New Mexico and Arizona, Path 3A has been established to evaluate synergies between HPX and SunZia . Path 3A consists of HPX Path 3 combined with SunZia flows .
cost EstimatEs
The Technical Study Committee also developed planning level cost estimates for each alternative . Transmission cost data was compiled from several sources in the western interconnection including utility data, and information compiled
by the Western Governors’ Association (“WGA”) .1 Costs have been developed for transmission lines (per mile), transformers, substations and reactive devices . From the accumulated cost data, cost estimates have been developed for each of the HPX transmission alternatives . The 500kV transmission alternatives were evaluated as one- and two-corridor configurations (see Figures 1 and 2, pages 9 and 10) . Cost estimates examined both single-circuit and double-circuit designs for each corridor . The single-circuit alternatives also include a cost sensitivity to address the possibility of building single circuit towers in a manner that would facility expansion to double-circuit in the future . Cost estimates are in 2010 dollars .
intEgration WitH otHEr ProjEcts
One of the primary goals of the HPX initiative is to determine how development of the transmission system would be able to coordinate with other high-voltage transmission projects within the region of study . There are several other projects within the HPX project footprint that are under various stages of development including the Wyoming-Colorado Intertie Transmission Project (WCI), the Colorado Senate Bill 07-100 (SB100) transmission projects, the New Mexico Wind Collector System, and the SunZia Southwest Transmission Project (SunZia) . These projects are included in Figure 1, page 9 .
For the Stage 2 technical studies, WCI and the SB100 projects were assumed to be—and modeled as—components of HPX . The New Mexico Wind Collector System does not have any specific projects recommended to date, and therefore neither the collector system nor any components of the system were modeled as components of HPX . The SunZia Project was considered to be independent of HPX, although studies did consider how HPX and SunZia transmissions could complement each other . Most studies modeled the SunZia project as two 500kV AC lines between New Mexico and Arizona . However, some sensitivity work modeled the project as a single 500kV AC line and a single 500kV DC line .
The following sections describe the transmission projects that were considered during the course of studies .
1 Wyoming-colorado intertie
Through a public/private partnership, LS Power and the Wyoming Infrastructure Authority are developing the Wyoming-Colorado Intertie (WCI), an investment in new electric transmission infrastructure between southeast Wyoming and northeast Colorado . The project has been planned as a single 345kV line between Dave Johnston and Laramie River station in Wyoming, and the Pawnee substation in Colorado, northeast of the Denver metro area . Since HPX contemplates having a transmission line from the Dave
1Data published in the Western Renewable Energy Zones (“WREZ”) Transmission Model

30
Johnston/Laramie River to the Pawnee
area, Stage 2 studies considered WCI to
be an integral segment of HPX .
2 colorado sB07-100 projects
In Colorado, Senate Bill 07-100 (“SB 07-
100”) requires regulated utilities in the
state (PSCo and BHP) to designate “Energy
Resource Zones,” plan transmission
projects to alleviate constraints to those
zones, and petition the Colorado Public
Utilities Commission for approval of
such plans . PSCo has developed several
transmission plans as the result of
SB07-100, all of which were modeled in
the Stage 2 studies . One of the planned
projects is the Lamar-Front Range
transmission project . Portions
of that project have the potential to be components of HPX, specifically transmission along the eastern edge of the state .
3 new mexico Wind collector
Public Service Company of New Mexico (PNM) has been evaluating transmission alternatives for wind collector systems that could deliver power from potential wind resource development zones to load centers in the state . No specific projects have been recommended to date, so there were no high-voltage collector systems modeled for Stage 2 studies .
4 sunZia
The SunZia Southwest transmission project (“SunZia”) is contemplated
as an approximately 500-mile, 500kV
transmission system that would run
between central New Mexico and
southern Arizona . SunZia is currently
evaluating two primary permitting
alternatives . The first consists of two
500kV AC lines with a transmission
capacity of approximately 3000 MW .
The second is a hybrid configuration
consisting of one 500kV AC line and
a bi-pole 500kV DC line . The hybrid
configuration would have a transmission
capacity of approximately 4500 MW .
Stage 2 studies modeled the SunZia
project as a separate and independent
project from HPX, consisting of two 500kV
AC lines for modeling purposes .
Alternative HPX Path Transfer Capability (MW) Cost ($Billions)
#. Description Path 1 (WY-CO)
Path 2 (CO-NM)
Path 3 (NM-AZ)
Path 3A (Path 3+SunZia)
1 Two corridors; Single-circuit 500Kv
3500 3700 2200 6000 $5.5-$7.22
2 Two corridors; Double-circuit 500kV
6700 6800 4000 7900 $8.3
3 One Corridor Single-circuit 500
1600 1800 1600 1600 $3.4-$4.52
4 One Corridor Double-circuit 500
3900 3700 4300 8000 $5.5
5 Progressive
1000 2000 2000 5800 $4.8
taBlE 5
Summary of alternative flows and costs
2The single-circuit transmission alternatives show a range of costs. The lower cost reflects a scenario in which the project is constructed with single-circuit towers. The higher cost reflects the increase in cost if the towers are constructed so that a second circuit could be added in the future (“double-circuit capable”).

31
summary of rEsults
Table 5 shows the approximate transfer capabilities of each of the HPX paths, and the estimated costs for each of the transmission alternatives . The ratings are “non-simultaneous,” meaning that they do not consider interaction with any other existing or accepted WECC path ratings . Further detailed studies will be
required in subsequent stages of the HPX
Initiative to verify that the paths chosen
are appropriate, and determine any
impacts or interaction with other WECC
paths and regional projects . The costs
shown in the table represent the costs of
each transmission alternative alone, and
do not include any costs to potentially
adjust other transmission system
elements that experience a change in load with the addition of HPX .
To achieve some of the transfer capability values listed in Table 5, mitigation measures will be required for certain contingency conditions . The mitigation generally is expected to consist of generator tripping for double-circuit outages of HPX lines .

Commercial Findingsstage 2 commercial studies evaluated potential economic benefits of the construction of
HPx in relation to overall project costs the HPx commercial study committee contracted
Energy+Environmental Economics (E3), a san francisco-based firm that specializes in large-
scale predictive modeling and analysis for the electricity industry, to perform the economic
analysis for stage 2 this report contains an abridged version of E3’s findings

33
# Technical Study Commercial Study (original) Commercial Study (updated)
1 Two-‐corridor, single-‐circuit 500kV Parallel single-‐circuit 500kV lines 2 Two-‐corridor, double-‐circuit
500kV
3 One-‐corridor, single-‐circuit 500kV Single-‐circuit 500kV line Single-‐circuit 500kV line (updated specs)
4 One-‐corridor, double-‐circuit 500kV Double-‐circuit 500kV line 5 Progressive (single 345kV/double
345kV/single 500kV)
6 Single-‐circuit 500kV Line in the progressive configuration
7 Parallel single-‐circuit 500kV lines in the progressive configuration
Please note that, due to time constraints
in Stage 2, the Commercial Study
Committee and the Technical Study
Committee performed their evaluations
simultaneously . The Commercial Study
Committee used the best information
available at the time to identify probable
scenarios and key assumptions, and
to estimate project costs and transfer
capability . However, over the course
of the study it became clear that the
findings of the Technical Study diverged
from the assumptions used in the
Commercial Study . Rather than delay the
completion of Stage 2, the Commercial
Study Committee used initial cost
estimates from the Technical Study to
update the analysis for the single-circuit
500kV transmission alternative, which
was believed at the time to offer the
best balance of benefit-cost and overall
cost considerations . The new results for
this alternative are labeled as “updated specs,” while the results of the other four configurations considered by the Commercial Study Committee remain unchanged from their original estimates prior to the Technical Study’s conclusions . All results will be updated or addressed as appropriate in Stage 3 .
It should also be noted that the Commercial and Technical Study Committees had identified slightly different configuration specs for their respective studies: three configurations are the same in both studies, while two are different . This discrepancy does not affect the outcome of the study, but for purposes of clarity is outlined in Table 6 .
mEtHoDology
E3 calculated the benefits of the HPX project—assuming that there is free
capacity on HPX unhindered by any single transmission tariff—and compared these benefits to the cost of the transmission project . This method is intended to allow an overall evaluation of the project’s cost-effectiveness, independent of any cost-allocation decisions . In order to project realistic outcomes for the HPX initiative, E3 developed a series of the most likely scenarios in which certain market variables were held constant and others were manipulated . The assumptions used to create these scenarios are described on page 33 .
A benefit-to-cost ratio for each scenario was then derived using state-by-state resource plans that comply with any and all regulations within that state . This includes consideration of how the different state requirements treat different classes of utilities (public, cooperative, IOUs, etc .), but does not
taBlE 6
Comparison of alternatives between the Technical and Commercial Studies

34
differentiate between utilities within
a state when building up portfolios .
Instead, E3’s model aggregates all utilities
within a state into a single “state-utility,”
which bases its renewable requirements
on the requirements for each individual
utility within the state, and selects
resources to meet the aggregated need .
This methodology allows E3 to evaluate
the relative magnitude of the line’s impact
on ratepayers in each state without
modeling individual utilities; it also
enables E3 to integrate the results of the
production simulation into the analysis .
Again, this simplification may affect the
distribution of costs and benefits, but will
not affect the overall cost-effectiveness of
the line .
The resource portfolios developed in the
model are designed to ensure that all
RPS, energy and capacity requirements
are met . For RPS requirements, the
model takes into account provisions
of the specific laws that constrain the
resource mix—for instance, Arizona’s 30%
distributed generation requirement .3
Once the renewable portfolios are
developed, the model adds combined-
cycle gas turbines (CCGTs) and simple
cycle gas turbines (CTs) to ensure that
energy and peak capacity and reserve
requirement needs are adequately met .
The economic analysis did not investigate
the addition of conventional coal-fired
generation .
The analysis done by E3 is a “snapshot”
analysis, looking at the effect of the line
in 2025 . This year was chosen because
this is the first year in which the full
RPS requirements are in effect in every
state . Full production cost modeling
of all hours of the year was conducted .
A snapshot analysis is appropriate
because the primary benefit is due to
long-term procurement of renewable
resources, however it should be noted
that a snapshot analysis does not
capture expected long-term changes in
operational benefits .
The resource plans developed for each
state-utility are used to estimate each
state-utility’s electric sector revenue
requirement, both with and without
HPX . Each state’s revenue requirement
utilized in this study was considered to
be all-inclusive, taking into account the
costs associated with transmission and
distribution assets, as well as fixed and
variable costs of generation, though
individual studies of those factors were
not conducted . Thus, the difference
between the revenue requirements
with and without the line (neither of
which include the cost of the HPX line)
represents the gross potential benefits
that the HPX project could deliver to
the region . These benefits can then be
compared to the estimated revenue
requirement of the HPX project to
determine the relative benefit-cost ratio .
kEy assumPtions
load forecast
Power demand in the four states affected by HPX is projected to rise steadily as population increases . The largest demand is projected to be in Arizona, while the greatest opportunities for energy development—and cost-effective energy resources—exist in Wyoming . Using the Transmission Expansion Planning Policy Committee’s (TEPPC) 2020 production simulation cases, load growth estimates within each state were developed . Peak demand in each state was assumed to grow at the same rate as load .
renewable demand
Renewable Portfolio Standard (RPS) is a legal requirement that exists in many states to promote renewable energy investment by mandating that a percentage of energy must come from renewable sources . RPS targets create a marketplace for renewable energy and change the mix of conventional and alternative resources used for power generation . HPX would provide an opportunity for states to pool renewable resources to meet portfolio standard goals, if desired .
The constraint of meeting RPS policies in each state will guide resource development over the next decade by encouraging substantial investments in new renewable energy . Because the major benefits of the HPX project
3The one exception is that E3 did not include Colorado’s 25% bonus for in-state renewable development.

35
stem from the opportunity to alter the conditions for renewable development in the West, the RPS policy assumptions are critical inputs to the ratepayer model . Each state’s RPS policy is uniquely codified in the Database of State Incentives for Renewables & Efficiency (DSIRE), and includes different requirements for different provider types . The total demand for renewables within each state is calculated by combining data on these RPS policies with the forecasts of statewide retail sales; each state’s demand, as calculated by a third party (E3 in this case), is shown in Table 8 .
cost of generation resources
Within the four states affected by HPX,
the cost to produce new power sources is unequal, and depends on resources available, as well as capital costs and regulations involved in startup and commissioning . At the time of the study, Busbar costs indicated that Wyoming wind is the least expensive of the renewable opportunities considered, while solar photovoltaics in the Desert Southwest were estimated to be approximately 2 .5 times as costly . This inequity is the key to realizing benefits via providing high-demand areas with access to less costly resources .
Table 9 shows the average cost of renewable technologies utilized for this evaluation . For most technologies,
these costs are based on the average cost of the corresponding cost in the Western Renewable Energy Zones (WREZ) Transmission Model . Adjustments to the WREZ average cost were made for two technologies where WREZ data was deemed insufficient . Distributed solar PV is assumed to be 20% higher than the capital cost of large-scale solar PV with a fixed axis . E3 developed a proxy for large-scale solar by blending solar thermal and large-scale solar PV . This cost is assumed to be 15% less than the average cost of solar thermal with wet cooling .
Table 10 lists the assumptions used for the cost of conventional generating technologies . It is assumed that all new
Arizona Colorado New
Mexico Wyoming
Net Energy to Load (GWh) 2008 84,155 62,293 23,280 11,880 2020 109,483 72,399 24,785 18,540 Growth Rate 2.2% 1.3% 0.5% 3.8%
Retail Sales (GWh)
2008 79,106 58,555 21,884 11,167 2020 102,914 68,055 23,297 17,428 2025 114,839 72,455 23,913 20,979 Growth Rate 2.2% 1.3% 0.5% 3.8%
Peak Demand (MW) 2008 19,428 11,603 4,075 1,753 2020 25,276 13,486 4,338 2,736 Growth Rate 2.2% 1.3% 0.5% 3.8%
taBlE 7
Load forecast assumptions within the HPX study area

36
Arizona Colorado New
Mexico Wyoming
IOU 9,451 12,684 3,237 672 Publics 6,478 1,254 -‐ -‐ Cooperative 646 1,717 483 333 Federal -‐ -‐ -‐ -‐ Facility -‐ -‐ -‐ -‐ Total RPS Requirement 16,575 15,655 3,720 1,005
Existing Resources 996 3,824 525 3,633 Total RPS Net Short 15,579 11,831 3,195 -‐
taBlE 10
Characterization of new conventional generating technologies in each state
taBlE 8
Renewable demand and RPS net short calculation in 2025 (GWh) .
taBlE 9
Average costs of new renewable technologies used in E3’s ratepayer model of HPX4
Capital Cost
($/kW)
Fixed O&M
($/kW-‐yr)
Variable O&M
($/MWh)
Heat Rate (Btu/kWh)
Biomass $4,354 $-‐ $33.69 15,000 Geothermal 6,321 -‐ 36.56 -‐ Distributed Solar PV 5,512 50.00 -‐ -‐ Large Scale Solar 4,414 66.00 -‐ -‐ Wind 2,453 60.00 -‐ -‐
Generator State Capital Cost ($/kW)
Fixed O&M
($/kW-‐yr)
Variable O&M
($/MWh) Heat Rate
Capacity Factor (%)
Gas CCGT Arizona $1,130 $10.57 $4.81 6,924 71.5% Gas CCGT Colorado 1,145 10.80 4.88 6,924 71.7% Gas CCGT New Mexico 1,124 10.49 4.79 6,924 66.5% Gas CCGT Wyoming 1,109 10.25 4.72 6,924 59.6% Gas CT Arizona 799 14.46 4.74 9,600 12.8% Gas CT Colorado 825 14.78 4.90 9,600 14.1% Gas CT New Mexico 790 14.35 4.69 9,600 10.8% Gas CT Wyoming 764 14.03 4.53 9,600 8.0%
4Participants understand that costs for these technologies have changed drastically in recent time, and will likely continue to be volatile in the future. Stage 3 efforts will closely monitor the relative costs of renewable technologies and the impacts those costs will have both on the benefit-cost and overall cost requirements of the HPX initiative.

37
conventional plants will be gas-fired combined cycle gas turbines (CCGTs) or simple cycle gas turbines (CTs) . The cost and performance assumptions vary by state and are summarized below .
E3 utilized a pro-forma financing model to calculate the levelized cost of each resource . It is assumed that the each resource cost is based on power purchase agreement (PPA) between an independent power producer and a utility . Key inputs to the financing model are summarized in Table 11 .
The pro-forma model calculates the levelized costs over the lifetime of the technology based on cost and performance of each technology . The generic all-in levelized costs for new technologies is summarized in Figure 8, page 37 .
fuel and electricity price assumptions
The forecast gas prices used in the ratepayer model to evaluate the potential benefits of HPX is based on a combination of NYMEX Henry Hub futures and a characterization of the western natural gas markets developed by the Northwest Power and Conservation Council (NWPCC) . The NWPCC models expected basis differentials from Henry Hub at major natural gas hubs throughout the WECC, which E3 uses to calculate the monthly cost of natural gas at various locations in 2020 . The burnertip cost of gas within each of the load bubbles is
calculated based on the monthly gas cost at the local trading hub, a local delivery charge (LDC) obtained from TEPPC, and any relevant excise taxes on gas within the state .
E3’s ratepayer model also includes a basic characterization of wholesale energy markets at various critical points in the WECC used to evaluate the cost of balancing load and resources . While Wyoming, Colorado, and New Mexico do not have a major liquid trading hub like Palo Verde in Arizona, E3 has developed estimates of the value of energy in each of the 24 time periods used in the model, which serves as a proxy for such a market . The market characterization relies upon historical data on spot market prices and gas prices at Palo Verde between 2006 and 2008; this data is used to estimate the average market heat rate at this hub during each of the 24 time periods .5 The product of these market heat rates and the forecasted monthly gas prices yields a reasonable estimate of average wholesale market prices at Palo Verde in 2020 .
rEsourcE aDDitions WitHout HPx
rPs resources
Without HPX, each state-utility will fill its RPS gap with locally available renewable resources . Each state’s renewable resource mix is based directly on projected resource builds developed by the TEPPC, which were based largely on published
utility resource plans for each region .
The plans reflect the availability and
relative quality of different renewable
technologies in the region, as well as the
nuances of each state’s RPS policy . For
instance, Arizona relies predominantly
on large-scale solar resources to meet
its goals, but its projected portfolio
includes a 30% set-aside for distributed
generation and a limited amount of local
wind and geothermal . At the other end
of the spectrum, Colorado’s portfolio
is dominated by the development of
high-quality wind . New Mexico’s portfolio
is the most balanced; its goals are met
by a combination of local solar and wind
resources . Table 12 summarizes the base
case assumptions for local resource
additions to meet each state’s RPS goals
without the large-scale interstate power-
sharing capabilities of HPX . The energy
and dependable capacity associated
with these renewable resources are
also assumed to contribute to each
state-utility’s required additions to meet
growth .
It should be noted that state-by-state
policies toward Renewable Energy Credits
(RECs) can significantly impact how the RPS
requirements are achieved in each state .
Stage 2 studies considered annual demand,
but aspects such as banking, in-state
development incentives, bundled delivery
and anything other than specific carve-
outs were not factored in at this stage .
5Electricity and gas spot market prices used to characterize the Palo Verde trading hub were obtained from the Intercontinental Exchange (ICE) Report Center: https://www.theice.com/marketdata/reports/ReportCenter.shtml.

38
Generic IPP Solar IPP
Financing Lifetime (yrs) 20 20 Debt Cost (%) 7.27% 7.27% Equity Cost (%) 15.29% 13.25% Equity Share (%) 40.00% 55.00% Federal Tax (%) 35.00% 35.00% State Tax (%) 8.84% 8.84% After-‐Tax Nominal WACC (%) 8.70% 9.23%
taBlE 11
Financing assumptions used to calculate the levelized costs of renewable and conventional generating technologies
figurE 8
Summary of all-in levelized costs of generic new resources in the HPX ratepayer model
taBlE 12
Base case resources added to meet RPS goals without HPX (GWh)
Generation (GWh) Installed Capacity (MW)
Arizona
Colorado New Mexico
Wyoming
Arizona
Colorado
New Mexico
Wyoming
WITHOUT HPX Biomass -‐ 30 324 -‐ -‐ 4 43 -‐ Geothermal -‐ 149 -‐ -‐ -‐ 19 -‐ -‐ Distributed Solar PV 3,029 1,252 97 -‐ 1,533 637 48 -‐ Large Scale Solar 10,652 421 1,173 -‐ 4,466 207 499 -‐ Wind 1,711 9,559 2,022 -‐ 595 2,959 621 -‐ Gas CCGT 6,761 -‐ -‐ 6,762 1,080 -‐ -‐ 1,296
Gas CT 2,988 1,685 17 -‐ 2,664 1,369 18 -‐

39
Delivery Point
Arizona Colorado
New Mexico
Wyoming
Colorado 82% 0% 18% 0% New Mexico 100% 0% 0% 0%
Expo
rt
Zone
Wyoming 46% 44% 10% 0%
conventional resources
In addition to meeting RPS targets, each state must add new resources to keep pace with load growth: each state’s total new resources must provide enough energy to meet growth in demand and sufficient capacity to meet peak period demand plus each state’s planning reserve margin .6 Thus, any growth that is not met by new renewable resources must be met with a combination of combined-cycle (CCGT) and simple cycle (CT) gas turbines . CCGTs, which operate with a high capacity factor, are used to meet energy requirements, while CTs are built to meet any remaining capacity or reserve requirements . However, E3 models an interaction between the two: CCGTs provide reliable capacity as well as energy, while CTs will produce a small amount of energy to offset the requirement of CCGTs . This planning framework for the fossil build-out minimizes the fixed costs of new fossil resources required to maintain reliability .
rEsourcE aDDitions WitH HPx
rPs resources
The ratepayer analysis assumes that the construction of HPX would greatly expand the options for renewable development in the four states, enabling access to remote, high-quality renewable resources that could not be delivered over existing transmission . The set of additional resources considered for development is based on resource zones identified in the WREZ model . Individual ranking costs are calculated for each of the resources included in the non-HPX resource plans and the WREZ model; the least costly resources in the WREZ model are assumed to displace the highest cost resources in the non-HPX build, subject to the transmission capacity available along each segment of the HPX line . HPX would thus expand the supply curve of renewables from which portfolios in each state are constructed .
One key modeling assumption that affects the distribution of benefits among the four state-utilities is the allocation of renewable resources developed along HPX for RPS compliance accounting purposes . Should HPX development proceed, utilities along the line would contract with renewable developers to deliver energy and the associated renewable energy credits, allowing them to count those resources towards their individual RPS goals . For this analysis, E3 assumes that resources developed along the line would be divided among downstream states in direct proportion to each state’s renewable demand . For instance, claims to all resources in Wyoming are divided among Arizona (46%), Colorado (44%), and New Mexico (10%), while claims to resources in New Mexico are assigned exclusively to Arizona (shown in Table 13) . The capacity freed up by the delivery of high-quality renewables to various points on the line is used to export lower
taBlE 13
Allocation of renewable resources developed with HPX among the state-utilities
6The planning reserve margin is a reliability criterion that requires utilities to maintain excess capacity above its forecasted peak demand to account for potential grid contingencies and uncertainty in load forecasting. For the ratepayer analysis, E3 assumes each state-utility maintains a planning reserve margin of 17%.

40
taBlE 14
Base Case resources added to meet RPS goals with HPX
Generation (GWh) Installed Capacity (MW)
Arizona
Colorado New Mexico
Wyoming
Arizona
Colorado
New Mexico
Wyoming
PARALLEL SINGLE-‐CIRCUIT 500kv LINES Biomass -‐ 30 324 -‐ -‐ 4 43 -‐ Geothermal -‐ 149 -‐ -‐ -‐ 19 -‐ -‐ Distributed Solar PV 3,029 1,252 97 -‐ 1,533 637 48 -‐ Large Scale Solar 1,193 421 1,173 -‐ 500 207 499 -‐ Wind -‐ 7,931 2,022 12,985 -‐ 2,455 621 3,500 Gas CCGT 5,228 -‐ -‐ 6,762 835 -‐ -‐ 1,296
Gas CT 5,237 1,715 23 -‐ 4,668 1,393 25 -‐
PARALLEL SINGLE-‐CIRCUIT 500kv LINES (PROGRESSIVE CONFIGURATION) Biomass -‐ 30 324 -‐ -‐ 4 43 -‐ Geothermal -‐ 149 -‐ -‐ -‐ 19 -‐ -‐ Distributed Solar PV 3,029 1,252 97 -‐ 1,533 637 48 -‐ Large Scale Solar 1,193 421 1,173 -‐ 500 207 499 -‐
Wind -‐ 9,310 10,846 2,782 -‐ 2,882 3,371 750
Gas CCGT 5,029 -‐ -‐ 6,762 803 -‐ -‐ 1,296
Gas CT 5,244 1,696 19 -‐ 4,674 1,377 20 -‐
SINGLE-‐CIRCUIT 500kv LINE
Biomass -‐ 30 324 -‐ -‐ 4 43 -‐ Geothermal -‐ 149 -‐ -‐ -‐ 19 -‐ -‐ Distributed Solar PV 3,029 1,252 97 -‐ 1,533 637 48 -‐ Large Scale Solar 4,160 421 1,173 -‐ 1,744 207 499 -‐ Wind 1,711 9,559 2,022 6,492 595 2,959 621 1,750 Gas CCGT 5,642 -‐ -‐ 6,762 901 -‐ -‐ 1,296
Gas CT 4,517 1,700 20 -‐ 4,026 1,381 21 -‐
SINGLE-‐CIRCUIT 500kv LINE (PROGRESSIVE CONFIGURATION) Biomass -‐ 30 324 -‐ -‐ 4 43 -‐ Geothermal -‐ 149 -‐ -‐ -‐ 19 -‐ -‐ Distributed Solar PV 3,029 1,252 97 -‐ 1,533 637 48 -‐ Large Scale Solar 4,661 421 1,173 -‐ 1,954 207 499 -‐ Wind 1,711 9,559 5,231 2,782 595 2,959 1,621 750 Gas CCGT 5,717 -‐ -‐ 6,762 913 -‐ -‐ 1,296
Gas CT 4,393 1,696 19 -‐ 3,916 1,377 20 -‐
DOUBLE-‐CIRCUIT

41
quality local resources downstream
(e .g . Colorado off-takes Wyoming wind
and uploads Colorado wind for delivery
to Arizona) . This framework allows for
cascading benefits along the length of
the line without hindering renewable
development in Colorado and New
Mexico .
conventional resources
Once the renewable builds for each state
with the construction of HPX are set, the
model determines the appropriate build-
out of fossil resources . The methodology
for determining the required capacity
from new CTs and CCGTs is identical to
that described in the scenario without
HPX; however, because the renewable
mix in each state will have changed due
to the construction of HPX, the residual
gaps in energy and peak demand growth
will be different, and will require a
different fossil build-out than in the non-
HPX case .
sEnsitivity casEs
The value to ratepayers of constructing HPX is highly sensitive to a number of key modeling inputs, including but not limited to assumptions regarding specific resource cost and performance, demand for renewables, and federal policy regarding clean energy in the future . Many of these parameters are highly uncertain, and it is difficult to confidently predict the landscape for renewable development in the WECC by 2020 . E3
taBlE 14
Base Case resources added to meet RPS goals with HPX
SINGLE-‐CIRCUIT 500kv LINE (PROGRESSIVE CONFIGURATION) Biomass -‐ 30 324 -‐ -‐ 4 43 -‐ Geothermal -‐ 149 -‐ -‐ -‐ 19 -‐ -‐
Distributed Solar PV 3,029 1,252 97 -‐
1,533 637 48 -‐
Large Scale Solar 4,661 421 1,173 -‐
1,954 207 499 -‐
Wind 1,711 9,559 5,231 2,782 595 2,959 1,621 750 Gas CCGT 5,717 -‐ -‐ 6,762 913 -‐ -‐ 1,296
Gas CT 4,393 1,696 19 -‐
3,916 1,377 20 -‐
DOUBLE-‐CIRCUIT 500kv LINE Biomass -‐ 30 324 -‐ -‐ 4 43 -‐ Geothermal -‐ 149 -‐ -‐ -‐ 19 -‐ -‐
Distributed Solar PV 3,029 1,252 97 -‐
1,533 637 48 -‐
Large Scale Solar 1,193 421 1,173 -‐ 500 207 499 -‐ Wind -‐ 7,931 2,022 12,985 -‐ 2,455 621 3,500 Gas CCGT 5,228 -‐ -‐ 6,762 835 -‐ -‐ 1,296
Gas CT 5,237 1,715 23 -‐
4,668 1,393 25 -‐

42
developed five sensitivity cases that show the effects of manipulating several assumptions to which the line’s value is most sensitive . This scenario analysis reveals the wide range of potential net benefits, both positive and negative, associated with the line .
case 1: Base case
The inputs and assumptions that make up the Base Case represent what E3 believes to be a reasonable, middle-of-the-road future . Overall, E3’s design of this Base Case uses similar assumptions that have been vetted in other long-term planning modeling work that E3 has done: all renewable resource costs are assumed to remain constant in real terms based on their 2009 levels, the federal incentive structure for renewable resources does not change, loads throughout the region grow at moderate rates, and resource performance is based on the best available data . Modifications to the key assumptions that make up this Base Case are tested in the sensitivities described below .
case 2: low Demand
The value of HPX is linked to the demand for renewables in each state, which is directly tied to the demand for energy through RPS legislation that specifies a requirement for renewable generation as a percentage of total retail sales . However, predicting load growth has inherent uncertainties—demand for energy is tied to exogenous parameters such as
economic growth—so E3 has tested a scenario in which the growth rates of retail sales in each state are reduced by 0 .5% . This serves as a reasonable lower limit on growth that could reflect a number of possible scenarios . For instance, the lower growth rate could be the result of slower economic growth over the next ten years; it could also result from state legislation requiring accelerated implementation of energy efficiency, such as Arizona’s recently passed requirement that efficiency meet 22% of load by 2020 .
case 3: reduction of federal incentives
Renewable technologies in the United States in recent years have benefited from favorable federal policies—the
Production Tax Credit (PTC) and the Investment Tax Credit (ITC)—which provide a financial incentive for renewable development in the form of tax credits . These policies narrow the cost gap between renewable technologies and their conventional counterparts, and the historical rate of renewable development is closely linked to their historical levels . The PTC offers a tax benefit to renewable technologies based on the amount of energy produced: for instance, for each kilowatt-hour of wind generation, the owner receives a tax credit of 2 .1¢ . The ITC, which is most often claimed by solar developers, currently gives those developers a tax credit based on their initial investment, equal to 30% of applicable capital costs .
figurE 9
Effect of the discontinuation of federal tax incentives for renewables on the costs of various technologies

43
figurE 11
Capacity factor adjustments and the resulting effect on busbar costs used in the Low Wind Capacity Factors sensitivity (best available capacity factors in each state are shown below)
Current patterns of renewable development and the relative competitiveness of different renewable technologies are highly dependent upon this incentive structure, which may not continue into the future . E3 has therefore developed a sensitivity to explore the effects that a discontinuation of these federal policies would have on the benefits associated with the line . Without federal incentives, the cost of all renewable resources increases, as shown in Figure 9, page 41—however, the effect on solar resource costs is substantially larger than on other renewables, widening the gap between solar and wind . The magnitude of this gap has important implications for the line’s cost-effectiveness .
case 4: reduced solar costs
The capital costs of solar generating technologies have dropped dramatically in the past several years . E3’s Base Case assumes that the costs of solar resources remain at their current levels, but it is quite possible that the cost of solar thermal and solar PV will continue to drop, making these resources more competitive with other renewable technologies on a cost basis . Because a fundamental benefit of the line comes from the displacement of expensive solar resources with cheap remote wind, future cost reductions in solar would reduce the benefits of constructing such a line: as the cost of solar drops, so do the benefits of developing alternative resources . To illustrate the sensitivity of the solar cost
figurE 10
Comparison of solar resource costs in Arizona and New Mexico under Base Case and Low Solar Cost assumptions

44
upon the line’s benefit, E3 has designed a scenario in which the capital costs of solar resources are reduced to 15% below their current levels by 2020 . Under such a case, the busbar cost of large-scale solar drops from between $170 and $180/MWh to just above $150/MWh (Figure 10, page 42) .
case 5: low Wind capacity factors
There is considerable uncertainty as to the capacity factors that wind resources developed along the HPX corridor would achieve . E3 adjusted the original capacity factors in the WREZ model upwards based on stakeholder agreement that they were on the low end; however, the possibility remains that wind resources could produce less energy than anticipated by E3’s assumed capacity factors . Like many renewable technologies, wind is a capital-intensive resource with low operating costs, so the cost of energy is highly dependent upon the resource’s performance . For this reason, E3 has developed a scenario to show the effects of lower wind capacity factors on the line’s economic value . In
this sensitivity, E3 decreased the capacity factors of wind resources along the Front Range by five percentage points (e .g . a resource with a capacity factor of 40% in the Base Case is assigned a capacity factor of 35% for this sensitivity) . As shown in Figure 11, page 42, this has a substantial effect upon the cost of the PPA that a wind developer would negotiate with a utility and reduces the benefits associated with developing these remote resources in concert with the HPX initiative .
calculation of rEvEnuE rEquirEmEnts for EacH transmission altErnativE
It was assumed that the addition of the HPX transmission would have no effect on the capital costs associated with the existing all-inclusive data (e .g . generation, transmission and distribution assets) used in the analysis . Existing infrastructure was held constant across all analyses .
In general, the construction of HPX would serve to reduce the capital cost
component of the downstream state-
utilities . This is a result of the different
resources constructed to meet load
when HPX is available . In the absence of
HPX, Arizona must rely on a substantial
amount of large-scale solar generation
($4,414/kW) to meet its renewable
requirements . With HPX, Arizona would
be able to displace a significant amount
of installed large-scale solar generation
with wind generation ($2,453/kW), which
would lower the fixed cost portion of the
revenue requirement .
The reduction in capital costs with and
without HPX also reflects the benefits
of the capacity sharing enabled by the
line . It is assumed that the increase in
transfer capability between regions
would allow more efficient sharing of
capacity resources between utilities with
non-coincident peaks . This reduction
of installed capacity necessary to meet
the reserve requirements would serve
to reduce the fixed component of each
state-utility’s revenue requirement .
Arizona Colorado
New Mexico
Wyoming HPX
Region
WITHOUT HPX Capital Costs of Existing Gen & T&D
Resources $6,022 $4,119 $1,473 $546
$12,161 Capital Costs of New Generation Resources 3,297 1,443 344 248 5,332 Variable Cost of Load Service 2,717 1,632 534 223 5,106
Total Revenue Requirement 12,035 7,194 2,351 1,017 22,598
taBlE 15
State-by-state revenue requirements, Base Case without HPX (million 2008 $)

45
Base case (without HPx)
Table 15 shows the state-by-state revenue requirements in the absence of the proposed HPX line . In this case, RPS needs are met with local resources (those identified in TEPPC projections) and all utilities are required to procure sufficient capacity to meet their own peak load plus the planning reserve margin . It is assumed that there are no substantial interstate transmission investments without HPX .
Parallel single-circuit 500kv lines
Because wind generates substantially more annual energy per installed MW than solar, the capital cost of new generation resources decreases significantly when HPX allows wind resources to displace the local Arizona solar resources . This result is shown in Table 16, which shows the revenue requirements for each state with parallel single-circuit 500kv lines . The benefits realized by Colorado, New Mexico, and
Wyoming are largely due to their ability
to use HPX capacity to reduce the cost of
meeting each state’s reserve requirement .
Parallel single-circuit 500kv lines (Progressive configuration)
E3 also examined the impact of
constructing parallel 500kv lines but
operating them at 345 kV along the
northern parts of the line, which reduces
the transmission capacity but also
reduces the cost of the project . The
Arizona Colorado
New Mexico
Wyoming HPX
Region
PARALLEL SINGLE-‐CIRCUIT 500kv LINES
Capital Costs of Existing Gen & T&D Resources 6,022 4,119 1,473 546
12,161 Capital Costs of New Generation Resources 2,557 1,360 328 244 4,489 Variable Cost of Load Service 2,768 1,628 536 221 5,152
Total Revenue Requirement 11,346 7,108 2,337 1,011
21,802
taBlE 16
State-by-state revenue requirements, Base Case with Parallel Single-Circuit 500kv Lines (million 2008 $)
Arizona Colorado
New Mexico
Wyoming HPX
Region
PARALLEL SINGLE-‐CIRCUIT 500kv LINES (PROGRESSIVE CONFIGURATION)
Capital Costs of Existing Gen & T&D Resources 6,022 4,119 1,473 546
12,161 Capital Costs of New Generation Resources 2,606 1,409 337 244 4,597 Variable Cost of Load Service 2,760 1,630 535 221 5,145
Total Revenue Requirement 11,388 7,159 2,345 1,011
21,904
taBlE 17
State-by-state revenue requirements, Base Case with Parallel Single-Circuit 500kv Lines in the Progressive Configuration (million 2008 $)

46
progressive configuration was assumed to have a transfer capacity of 750 MW from Wyoming to Colorado, 1,750 MW from Colorado to New Mexico, and 3,500 MW from New Mexico to Arizona . While the standard configuration (3,500 MW of transfer capability from Wyoming to Arizona) serves as a pipeline for cheap Wyoming wind to access the Arizona market, the progressive configuration starts with a line full of Wyoming wind, and then picks up additional generation
in Colorado and New Mexico for delivery
to Arizona .
single-circuit 500kv line
Benefits of a single-circuit 500kv
configuration were also considered .
This line was assumed to increase
transfer capability by 1,750 MW between
Wyoming and Arizona . Though the
single-circuit line has half the capacity
of the parallel configuration, it achieves
more than half the benefits . This
occurs because the first 1,750 MW of
wind imports to Arizona displace solar
development exclusively, while the next
1,750 MW of wind imports displace a mix
of solar and lower-quality Arizona wind .
Toward the end of the evaluation the
Technical Study Committee produced
updated capacity values that reduced the
transfer capability for this configuration
to 1,600 MW . The impact of this change
results in increased revenue requirements,
taBlE 18
Calculation of state-by-state revenue requirements for one Single-Circuit 500kv line (million 2008 $)
Arizona Colorado
New Mexico
Wyoming HPX
Region
WITHOUT HPX Capital Costs of Existing Gen & T&D
Resources $6,022 $4,119 $1,473 $546
$12,161 Capital Costs of New Generation Resources 3,297 1,443 344 248 5,332 Variable Cost of Load Service 2,717 1,632 534 223 5,106
Total Revenue Requirement 12,035 7,194 2,351 1,017 22,598
SINGLE-‐CIRCUIT 500kv LINE (ORIGINAL SPECS) Capital Costs of Existing Gen & T&D
Resources 6,022 4,119 1,473 546 12,161
Capital Costs of New Generation Resources 2,811 1,391 334 244 4,781 Variable Cost of Load Service 2,753 1,632 535 222 5,142
Total Revenue Requirement 11,587 7,143 2,342 1,012 22,084
SINGLE-‐CIRCUIT 500kv LINE (UPDATED SPECS) Capital Costs of Existing Gen & T&D
Resources 6,022 4,119 1,473 546 12,161
Capital Costs of New Generation Resources 2,852 1,394 335 244 4,824 Variable Cost of Load Service 2,750 1,632 535 222 5,139 Total Revenue Requirement 11,624 7,146 2,343 1,012 22,125 Change from Original Analysis 37 3 0 0 40

47
primarily in Arizona, where the reduced wind imports are replaced by expensive large-scale solar . Increases in the other three states’ revenue requirements are moderate in comparison .
single-circuit 500kv line (Progressive configuration)
The next alternative examined was a 500kv line, operated in a progressive configuration . This single 500kv line was assumed to have a transfer capability of 750 MW from Wyoming to New Mexico, and 1,750 MW from New Mexico to Arizona . In this configuration, the progressive configuration results in similar state revenue requirements as the standard operation of the 500kv line for all state-utilities .
Double-circuit 500kv line
E3 also provided analysis for a double-circuit 500kv line, but as the total transfer capacity for this configuration is assumed to be the same as for the parallel single-circuit 500kv configuration, the effects
on the revenue requirement are identical between the two cases .
comParison of nEt BEnEfits to cost of tHE linE7
Base case (without HPx)
The following section presents a comparison of the costs and benefits of the different line configurations under the Base Case scenario . In order to present net cost figures for each state, the line’s cost is allocated among states to mirror the distribution of benefits between the different state-utilities; however, this is not a recommendation or endorsement of cost-allocation . As shown in the subsequent tables, E3’s analysis yields a benefit-cost ratio greater than 1 .0 for all line configurations under the Base Case assumptions . However, as described in the Executive Summary, the benefit-cost figure alone does not demonstrate associated financial risks or ensure that the benefits can be monetized .
Parallel single-circuit 500kv lines
If HPX is configured as parallel single-
circuit 500kv lines and operated at full
capacity along their entire length, it
would provide net benefits of $109
million to the study region, reducing the
total regional revenue requirement by
$796M with a line cost of $687M .
Parallel single-circuit 500kv lines (Progressive configuration)
Switching the parallel single-circuit lines
to a progressive configuration would
reduce the cost of the line from $687M
to $618M, but the reduced transfer
capacity on the line would reduce the
gross benefits (the reduction in total
revenue requirement) from $796M to
$694M . While this analysis finds that
the line would still be cost-effective,
the net benefit of constructing the
line would fall by $33M relative to the
parallel single-circuit lines operated at
full capacity .
Arizona Colorado
New Mexico
Wyoming HPX
Region
SINGLE-‐CIRCUIT 500kv LINE (PROGRESSIVE CONFIGURATION)
Capital Costs of Existing Gen & T&D Resources 6,022 4,119 1,473 546
12,161 Capital Costs of New Generation Resources 2,864 1,409 337 244 4,855 Variable Cost of Load Service 2,749 1,633 535 222 5,139
Total Revenue Requirement 11,635 7,162 2,346 1,012
22,155
taBlE 19
State-by-state revenue requirements, Base Case with Single-Circuit 500kv Line, Progressive Configuration (million 2008 $)
7All costs noted in this section are annualized costs in millions of 2008 dollars.

48
Arizona Colorado
New Mexico
Wyoming HPX Region
WITHOUT HPX
Total Revenue Requirement
$12,035 $7,194 $2,351 $1,017 $22,598
PARALLEL SINGLE-‐CIRCUIT 500kv LINES
Total Revenue Requirement 11,346 7,108 2,337 1,011 21,802 Gross Benefits of Line 689 86 14 6 796 HPX Line Cost 595 74 12 5 687 Net Benefits of Line 94 12 2 1 109
Regional Benefit-‐Cost Ratio 1.16
taBlE 20
Calculation of net benefits from line, Base Case with Parallel Single-Circuit 500kv Lines (annualized million 2008 $)
taBlE 21
Calculation of net benefits from line, Base Case with Parallel Single-Circuit 500kv Lines operated in a Progressive Configuration (annualized million 2008 $)
Arizona Colorado
New Mexico
Wyoming HPX Region
WITHOUT HPX
Total Revenue Requirement
$12,035 $7,194 $2,351 $1,017 $22,598
PARALLEL SINGLE-‐CIRCUIT 500kv LINES (PROGRESSIVE CONFIGURATION)
Total Revenue Requirement 11,388 7,159 2,345 1,011 21,904 Gross Benefits of Line 647 35 6 6 694 HPX Line Cost 576 31 5 5 618 Net Benefits of Line 71 4 1 1 76
Regional Benefit-‐Cost Ratio 1.12

49
Arizona Colorado
New Mexico
Wyoming HPX Region
WITHOUT HPX
Total Revenue Requirement
$12,035 $7,194 $2,351 $1,017 $22,598
SINGLE-‐CIRCUIT 500kv LINE (ORIGINAL SPECS)
Total Revenue Requirement 11,587 7,143 2,342 1,012 22,084 Gross Benefits of Line 449 51 9 5 514 HPX Line Cost 300 34 6 3 343 Net Benefits of Line 149 17 3 2 171
Regional Benefit-‐Cost Ratio 1.50
SINGLE-‐CIRCUIT 500kv LINE (UPDATED SPECS) Total Revenue Requirement 11,624 7,146 2,343 1,012 22,125 Gross Benefits of Line 412 48 9 5 473 HPX Line Cost 369 43 8 4 424 Net Benefits of Line 43 5 1 0 49
Regional Benefit-‐Cost Ratio 1.12
taBlE 22
Evaluation of net benefits in updated analysis, Base Case assumptions with Single-Circuit 500kv Line (annualized million 2008 $)
single-circuit 500kv line
Switching the line configuration from parallel single-circuit lines to a single line operated at 500kv along its entire length would initially decrease the total line cost from $687M to $343M, while the reduced capacity of the line would reduce the gross benefits from $796M to $514M . Overall, the net benefit of the single circuit 500kv line would increase $62M relative to the parallel 500kv lines configuration, for a total net benefit of $171M .
The benefit-cost ratio of this case (1 .50) was greater than the parallel configuration (1 .16) due to the lower cost
of the line . In subsequent evaluations, however, the combination of an increased line cost and reduced transfer capability in an updated analysis results in a net decrease in regional benefits under Base Case assumptions from $171M per year to $49M per year as summarized in Table 22 .
single-circuit 500kv line (Progressive configuration)
With the progressive configuration, the net benefits of the single 500kv line would decrease relative to those when it is operated at full capacity along the length, but remain higher than the net benefits from the parallel line configuration . Relative to the single
line operated at full capacity, the gross benefits would decrease by $71M due to the reduced transfer capability of the line, while the cost would decrease by $34M . The net effect is a reduction of net benefits to $134M .
Double-circuit 500kv line
Because the double-circuit 500kv line is assumed to have the same transfer capacity as the parallel single-circuit 500kv lines, the gross benefits of installing the line would remain the same at $796M . However, because of the lower cost of constructing a double-circuit line, the net benefits would increase to $281M, the difference in cost between the two lines .

50
Arizona Colorado
New Mexico
Wyoming HPX Region
WITHOUT HPX
Total Revenue Requirement
$12,035 $7,194 $2,351 $1,017 $22,598
SINGLE-‐CIRCUIT 500kv LINE (PROGRESSIVE CONFIGURATION)
Total Revenue Requirement 11,635 7,162 2,346 1,012 22,155 Gross Benefits of Line 401 32 6 5 443 HPX Line Cost 279 22 4 3 309 Net Benefits of Line 121 10 2 1 134
Regional Benefit-‐Cost Ratio 1.44
taBlE 23
Calculation of net benefits from line, Base Case with Single-Circuit 500kv Line Operated in a Progressive Configuration (annualized million 2008 $)
taBlE 24
Calculation of net benefits from line, Base Case with Double-Circuit 500kv Line (annualized million 2008 $)
Arizona Colorado
New Mexico
Wyoming HPX Region
WITHOUT HPX
Total Revenue Requirement
$12,035 $7,194
$2,351 $1,017
$22,598
DOUBLE-‐CIRCUIT 500kv LINE
Total Revenue Requirement 11,346 7,108 2,337 1,011 21,802 Gross Benefits of Line 689 86 14 6 796 HPX Line Cost 446 56 9 4 515 Net Benefits of Line 243 30 5 2 281 Regional Benefit-‐Cost Ratio 1.55
low Demand sensitivity
The Low Demand sensitivity results in
lower net benefits for the line under
all configurations because of changes
in the reference build that reduce the
amount of large-scale solar that can
be displaced by energy delivered over
the line . Since the RPS requirements in
Arizona are lower, the Arizona state-
utility selects less large-scale solar to meet its energy gap in the Base Case . Transfer capacity of the line remains the same and RPS requirements in the upstream zones are the same or lower under the Low Demand assumptions, so the resources available for export over the line will be of roughly the same quality as in the Base Case . This reduces net benefits because there is
less large-scale solar for the Wyoming wind to displace, and Wyoming wind is less of an improvement compared to less expensive resources . Under the Low Demand sensitivity, HPX is only cost-effective when configured as a single-circuit 500kv line (operated normally or progressively) or a double-circuit 500kv line; neither of the parallel single-circuit line configurations is cost-effective .

51
Arizona Colorado
New Mexico
Wyoming HPX Region
WITHOUT HPX
Total Revenue Requirement $11,252 $6,764
$2,247 $929
$21,192
PARALLEL SINGLE-‐CIRCUIT 500kv LINES
Total Revenue Requirement 10,695 6,687 2,235 924 20,541 Gross Benefits of Line 557 77 12 5 651 HPX Line Cost 588 81 13 5 687 Net Benefits of Line (31) (4) (1) (0) (36)
Regional Benefit-‐Cost Ratio 0.95
PARALLEL SINGLE-‐CIRCUIT 500kv LINES (PROGRESSIVE CONFIGURATION)
Total Revenue Requirement 10,740 6,741 2,244 924 20,649 Gross Benefits of Line 512 23 3 5 543 HPX Line Cost 583 26 4 5 618 Net Benefits of Line (71) (3) (0) (1) (75)
Regional Benefit-‐Cost Ratio 0.88
SINGLE-‐CIRCUIT 500kv LINE
Total Revenue Requirement 10,810 6,722 2,240 925 20,697 Gross Benefits of Line 442 42 7 4 495 HPX Line Cost 306 29 5 3 343 Net Benefits of Line 136 13 2 1 152
Regional Benefit-‐Cost Ratio 1.44
SINGLE-‐CIRCUIT 500kv LINE (PROGRESSIVE CONFIGURATION)
Total Revenue Requirement 10,858 6,741 2,244 925 20,767 Gross Benefits of Line 394 23 4 4 425 HPX Line Cost 287 17 3 3 309 Net Benefits of Line 107 6 1 1 116
Regional Benefit-‐Cost Ratio 1.37
DOUBLE-‐CIRCUIT 500kv LINE Total Revenue Requirement 10,695 6,687 2,235 924 20,541 Gross Benefits of Line 557 77 12 5 651 HPX Line Cost 441 61 10 4 515 Net Benefits of Line 116 16 3 1 136
Regional Benefit-‐Cost Ratio 1.26
taBlE 25
Calculation of net benefits from line, Low Demand with all configurations (annualized million 2008 $)

52
taBlE 26
Calculation of net benefits of line, Reduced Incentives with all configurations (annualized million 2008 $)
Arizona Colorado
New Mexico
Wyoming HPX Region
WITHOUT HPX
Total Revenue Requirement
$12,997 $7,627
$2,469 $1,017
$24,111
PARALLEL SINGLE-‐CIRCUIT 500kv LINES
Total Revenue Requirement 11,966 7,520 2,451 1,011 22,947 Gross Benefits of Line 1,032 107 18 6 1,163 HPX Line Cost 609 63 11 3 687 Net Benefits of Line 423 44 8 2 476
Regional Benefit-‐Cost Ratio 1.69
PARALLEL SINGLE-‐CIRCUIT 500kv LINES (PROGRESSIVE CONFIGURATION)
Total Revenue Requirement 12,027 7,587 2,462 1,011 23,087 Gross Benefits of Line 971 40 7 6 1,023 HPX Line Cost 586 24 4 4 618 Net Benefits of Line 384 16 3 2 405
Regional Benefit-‐Cost Ratio 1.66
SINGLE-‐CIRCUIT 500kv LINE
Total Revenue Requirement 12,322 7,566 2,458 1,012 23,358 Gross Benefits of Line 675 61 11 5 753 HPX Line Cost 308 28 5 2 343 Net Benefits of Line 368 33 6 3 410
Regional Benefit-‐Cost Ratio 2.19
SINGLE-‐CIRCUIT 500kv LINE (PROGRESSIVE CONFIGURATION)
Total Revenue Requirement 12,394 7,590 2,462 1,012 23,459 Gross Benefits of Line 604 37 7 5 652 HPX Line Cost 286 17 3 2 309 Net Benefits of Line 318 19 4 3 343
Regional Benefit-‐Cost Ratio 2.11
DOUBLE-‐CIRCUIT 500kv LINE Total Revenue Requirement 11,966 7,520 2,451 1,011 22,947 Gross Benefits of Line 1,032 107 18 6 1,163 HPX Line Cost 457 47 8 3 515 Net Benefits of Line 575 60 10 3 648
Regional Benefit-‐Cost Ratio 2.26
reduced incentives sensitivity
Reducing or eliminating federal tax incentives for renewable generators causes a significant increase in the net benefit of the line under all line configurations . If federal tax incentives are allowed to lapse, the levelized costs of all renewable generators will increase . While the average cost for wind resources increases by about $32/MWh, the average costs for large-scale solar and distributed PV increase by about $61/MWh and $91/MWh . The difference in the price change results in increased savings when HPX allows Arizona to replace local solar with imported wind, increasing the margin by which the lines are cost-effective for all configurations .
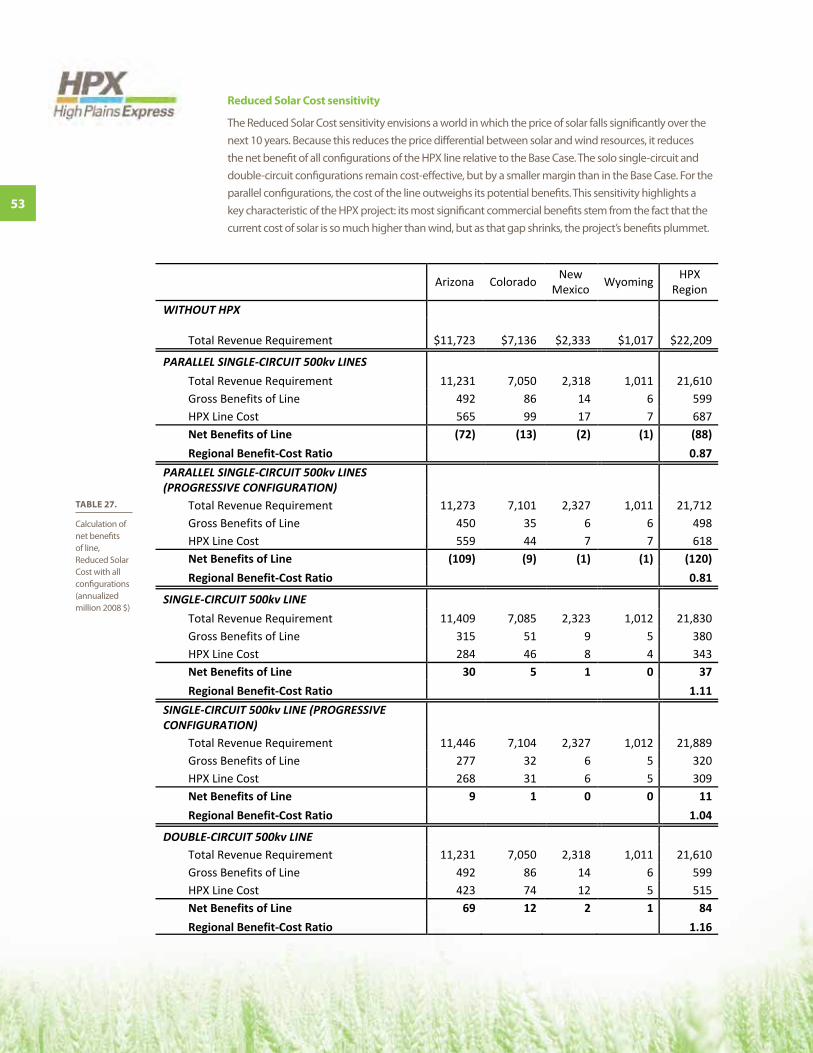
53
taBlE 27
Calculation of net benefits of line, Reduced Solar Cost with all configurations (annualized million 2008 $)
reduced solar cost sensitivity
The Reduced Solar Cost sensitivity envisions a world in which the price of solar falls significantly over the next 10 years . Because this reduces the price differential between solar and wind resources, it reduces the net benefit of all configurations of the HPX line relative to the Base Case . The solo single-circuit and double-circuit configurations remain cost-effective, but by a smaller margin than in the Base Case . For the parallel configurations, the cost of the line outweighs its potential benefits . This sensitivity highlights a key characteristic of the HPX project: its most significant commercial benefits stem from the fact that the current cost of solar is so much higher than wind, but as that gap shrinks, the project’s benefits plummet .
Arizona Colorado
New Mexico
Wyoming HPX Region
WITHOUT HPX
Total Revenue Requirement
$11,723 $7,136 $2,333 $1,017 $22,209
PARALLEL SINGLE-‐CIRCUIT 500kv LINES
Total Revenue Requirement 11,231 7,050 2,318 1,011 21,610 Gross Benefits of Line 492 86 14 6 599 HPX Line Cost 565 99 17 7 687 Net Benefits of Line (72) (13) (2) (1) (88)
Regional Benefit-‐Cost Ratio 0.87
PARALLEL SINGLE-‐CIRCUIT 500kv LINES (PROGRESSIVE CONFIGURATION)
Total Revenue Requirement 11,273 7,101 2,327 1,011 21,712 Gross Benefits of Line 450 35 6 6 498 HPX Line Cost 559 44 7 7 618 Net Benefits of Line (109) (9) (1) (1) (120)
Regional Benefit-‐Cost Ratio 0.81
SINGLE-‐CIRCUIT 500kv LINE
Total Revenue Requirement 11,409 7,085 2,323 1,012 21,830 Gross Benefits of Line 315 51 9 5 380 HPX Line Cost 284 46 8 4 343 Net Benefits of Line 30 5 1 0 37
Regional Benefit-‐Cost Ratio 1.11
SINGLE-‐CIRCUIT 500kv LINE (PROGRESSIVE CONFIGURATION)
Total Revenue Requirement 11,446 7,104 2,327 1,012 21,889 Gross Benefits of Line 277 32 6 5 320 HPX Line Cost 268 31 6 5 309 Net Benefits of Line 9 1 0 0 11
Regional Benefit-‐Cost Ratio 1.04
DOUBLE-‐CIRCUIT 500kv LINE Total Revenue Requirement 11,231 7,050 2,318 1,011 21,610 Gross Benefits of Line 492 86 14 6 599 HPX Line Cost 423 74 12 5 515 Net Benefits of Line 69 12 2 1 84
Regional Benefit-‐Cost Ratio 1.16
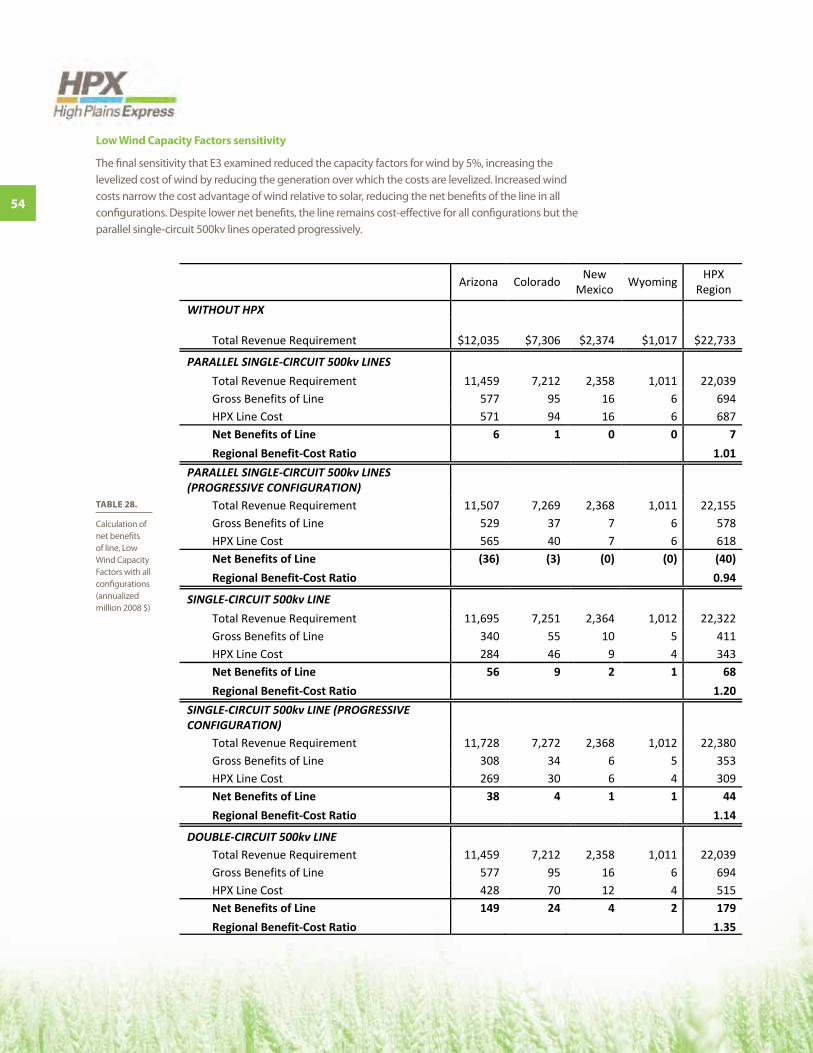
54
taBlE 28
Calculation of net benefits of line, Low Wind Capacity Factors with all configurations (annualized million 2008 $)
low Wind capacity factors sensitivity
The final sensitivity that E3 examined reduced the capacity factors for wind by 5%, increasing the levelized cost of wind by reducing the generation over which the costs are levelized . Increased wind costs narrow the cost advantage of wind relative to solar, reducing the net benefits of the line in all configurations . Despite lower net benefits, the line remains cost-effective for all configurations but the parallel single-circuit 500kv lines operated progressively .
Arizona Colorado
New Mexico
Wyoming HPX Region
WITHOUT HPX
Total Revenue Requirement
$12,035 $7,306 $2,374 $1,017 $22,733
PARALLEL SINGLE-‐CIRCUIT 500kv LINES
Total Revenue Requirement 11,459 7,212 2,358 1,011 22,039 Gross Benefits of Line 577 95 16 6 694 HPX Line Cost 571 94 16 6 687 Net Benefits of Line 6 1 0 0 7
Regional Benefit-‐Cost Ratio 1.01
PARALLEL SINGLE-‐CIRCUIT 500kv LINES (PROGRESSIVE CONFIGURATION)
Total Revenue Requirement 11,507 7,269 2,368 1,011 22,155 Gross Benefits of Line 529 37 7 6 578 HPX Line Cost 565 40 7 6 618 Net Benefits of Line (36) (3) (0) (0) (40)
Regional Benefit-‐Cost Ratio 0.94
SINGLE-‐CIRCUIT 500kv LINE
Total Revenue Requirement 11,695 7,251 2,364 1,012 22,322 Gross Benefits of Line 340 55 10 5 411 HPX Line Cost 284 46 9 4 343 Net Benefits of Line 56 9 2 1 68
Regional Benefit-‐Cost Ratio 1.20
SINGLE-‐CIRCUIT 500kv LINE (PROGRESSIVE CONFIGURATION)
Total Revenue Requirement 11,728 7,272 2,368 1,012 22,380 Gross Benefits of Line 308 34 6 5 353 HPX Line Cost 269 30 6 4 309 Net Benefits of Line 38 4 1 1 44
Regional Benefit-‐Cost Ratio 1.14
DOUBLE-‐CIRCUIT 500kv LINE Total Revenue Requirement 11,459 7,212 2,358 1,011 22,039 Gross Benefits of Line 577 95 16 6 694 HPX Line Cost 428 70 12 4 515 Net Benefits of Line 149 24 4 2 179
Regional Benefit-‐Cost Ratio 1.35

55
summary of ratEPayEr BEnEfit-cost analysis
This section provides a summary of the results of the ratepayer analysis for the transmission configurations described above for each transmission configuration, the regional benefit-cost results are shown for the Base Case and all four sensitivities side by side . Consistent with E3’s modeling methodology, the figures show the gross benefits of each scenario (ignoring the line cost or any potential transmission tariffs) and compare this against the line’s total annualized capital cost .
Parallel single-circuit 500kv lines
See Figure 12 .
Parallel single-circuit 500kv lines, Progressive configuration
See Figure 13 .
figurE 12
Summary of ratepayer benefit-cost analysis for Parallel Single-Circuit 500kv Lines (B/C ratios shown on top of bars)
figurE 13
Summary of ratepayer benefit-cost analysis for Parallel Single-Circuit 500kv Lines, Progressive Configuration (B/C ratios shown on top of bars)
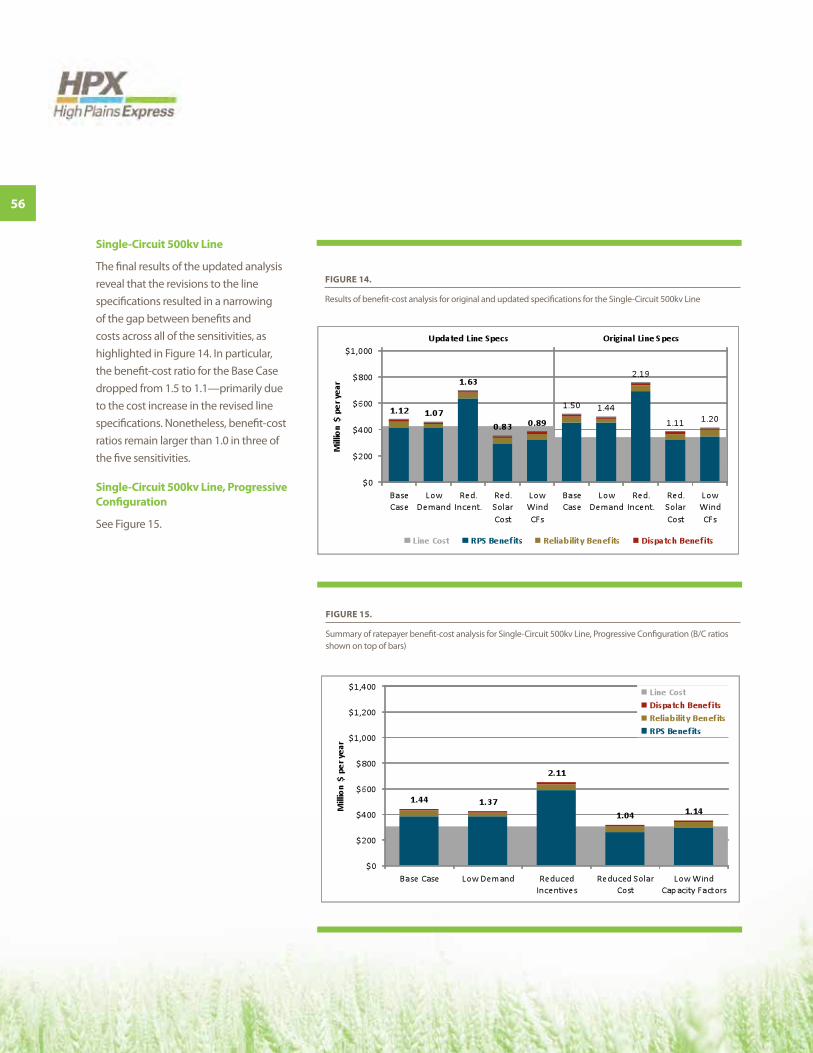
56
single-circuit 500kv line
The final results of the updated analysis reveal that the revisions to the line specifications resulted in a narrowing of the gap between benefits and costs across all of the sensitivities, as highlighted in Figure 14 . In particular, the benefit-cost ratio for the Base Case dropped from 1 .5 to 1 .1—primarily due to the cost increase in the revised line specifications . Nonetheless, benefit-cost ratios remain larger than 1 .0 in three of the five sensitivities .
single-circuit 500kv line, Progressive configuration
See Figure 15 .
figurE 14
Results of benefit-cost analysis for original and updated specifications for the Single-Circuit 500kv Line
figurE 15
Summary of ratepayer benefit-cost analysis for Single-Circuit 500kv Line, Progressive Configuration (B/C ratios shown on top of bars)
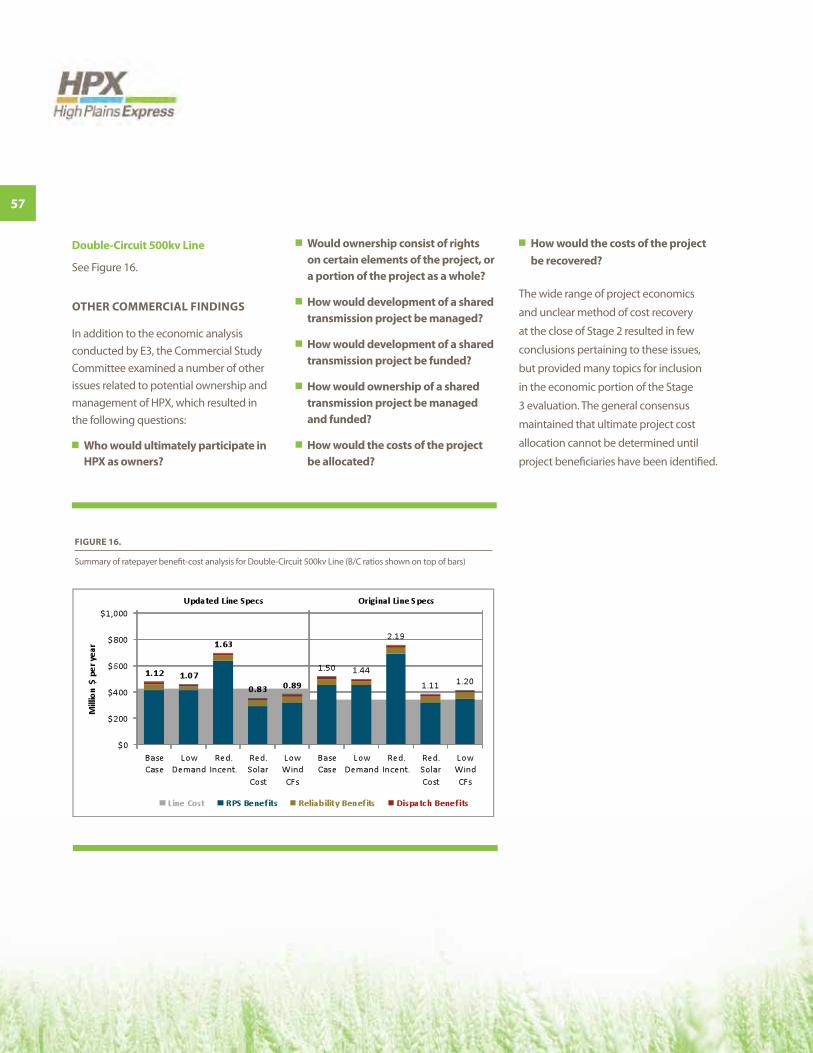
57
Double-circuit 500kv line
See Figure 16 .
otHEr commErcial finDings
In addition to the economic analysis conducted by E3, the Commercial Study Committee examined a number of other issues related to potential ownership and management of HPX, which resulted in the following questions:
n Who would ultimately participate in HPx as owners?
n Would ownership consist of rights on certain elements of the project, or a portion of the project as a whole?
n How would development of a shared transmission project be managed?
n How would development of a shared transmission project be funded?
n How would ownership of a shared transmission project be managed and funded?
n How would the costs of the project be allocated?
n How would the costs of the project be recovered?
The wide range of project economics
and unclear method of cost recovery
at the close of Stage 2 resulted in few
conclusions pertaining to these issues,
but provided many topics for inclusion
in the economic portion of the Stage
3 evaluation . The general consensus
maintained that ultimate project cost
allocation cannot be determined until
project beneficiaries have been identified .
figurE 16
Summary of ratepayer benefit-cost analysis for Double-Circuit 500kv Line (B/C ratios shown on top of bars)

Conclusion
routing/Permitting conclusions | technical conclusions | commercial conclusions | overall conclusions

59
routing/PErmitting conclusions
n the study area has significant siting constraints, but also presents some siting opportunities for a one- or two-corridor configuration
n no fatal flaws were identified for any project element
n Permitting of each element of the project would require a minimum of two to three years and could increase in difficulty with the passage of time
tEcHnical conclusions
n Project configurations of one or two corridors of single- or double-circuit 500kv, potentially including 345 kv elements, would all be feasible alternatives
n series compensation would improve the transfer capability of the project at a reasonable cost
n the incremental transfer capability and project cost would be as described in table 5, page 29
commErcial conclusions
n the benefit-cost ratio of various project configurations is generally greater than 1 0 under the key assumptions of the study
n there is a high level of uncertainty in regard to changes in public policy, technological advancements and fluctuating market demands, all of which may have large impacts on the benefit-cost ratio
n there is no clear method for cost allocation and cost recovery over multiple jurisdictions with varying benefits
n allocation of benefits will help determine cost allocation, once beneficiaries have been established
ovErall conclusions
n the HPx project could feasibly be developed
n under many scenarios the project benefits appear to outweigh the costs
n at this time, key uncertainties do not merit moving forward with a full commitment to develop the overall project unless a customer is identified that provides for cost recovery
n changes in load growth, resource cost, renewable energy policy, or transmission policy could have a material impact on the project feasibility
n additional monitoring and studies of economic drivers, costs, and public policy is warranted
n individual elements of the project should advance as needed by one or more project participants
n Project participants will proceed with a stage 3 evaluation of the HPx initiative
although feasible, the overall economics and associated risks identified during
stage 2 do not warrant development of HPx without further study

60
The Stage 2 effort determined that the HPX concept is technically feasible through five transmission alternatives, and that siting and permitting approximately 1450 to 2250 miles of line through four different states will be challenging, but given enough time, it appears possible . Selection of the most likely technical configuration will be dependent on the desired transfer capability and the associated costs . The extent of the required siting and permitting process is significant and will require cooperation of various local, state and federal entities . It is anticipated that siting and permitting
hurdles will increase with time due to factors such as population growth, an increase in exclusion areas and development of other resources .
Because a fundamental benefit of HPX line is derived from displacing high-cost resources with less expensive wind from upstream states, the benefits and costs included herein are very dependent on key assumptions such as technology costs and advancements, future energy efficiency requirements, RPS mandates, fuel costs and overall energy demand . Although many of the resulting benefit-
cost ratios indicate a net positive result, the overall economics and associated risks do not warrant development without further study .
HPX participants plan to initiate a Stage 3 effort to continue evaluating Stage 2 results and monitoring pertinent regulatory developments . Stage 3 will also include further examination of energy demand forecasts, changes in projected costs, renewable technology improvements, and other cost factors that could impact both the need for and economic viability of the project .

B/c Benefit-Cost Ratio
BH Black Hills Power
ct Simple cycle gas turbine
ccgt Combined-cycle gas turbine
DsirE Database of State Incentives for Renewables & Efficiency
E3 Energy+Environmental Economics Consultants
Eis Environmental Impact Statement
gDa Generation Development Areas
HPx High Plains Express Transmission Project
iou Investor-Owned Utility
itc Investment Tax Credit
lDc Local Delivery Charge
nEPa National Environmental Policy Act
nmrEta New Mexico Renewable Energy Transmission Authority
nWPcc Northwest Power and Conservation Council
PPa Power Purchasing Agreement
Psco Public Service of Colorado
Ptc Production Tax Credit
rEc Renewable Energy Credit
rPs Renewable Portfolio Standard
sB100 Colorado Senate Bill 07-100 Transmission Project
tEPPc Transmission Expansion Planning Policy Committee
tsgt TriState Generation and Transmission Association
WEcc Western Electricity Coordinating Council
Wci Wyoming-Colorado Intertie Transmission Project
WrEZ Western Renewable Energy Zone
Appendixglossary of acronyms

o u r Pa r t n E r s