Embed Size (px)
Citation preview

Abstract The Midwest ISO has developed a process to design conceptual transmission expansion plans based on economic justification and not reliability justification. The process is outlined in this paper along with the information used to make decisions in the process. Preliminary results indicate that it may be possible to construct transmission for to serve multiple generation scenario futures and that the benefit to cost ratio would be positive.
Index Terms—Renewable, Economic Transmission Plan, Constraints, Loop Flow, Performance Merits
I. INTRODUCTION
HIS document provides an example of the desired layout for a PES technical work and can be used as a Microsoft
Word template. It contains information regarding desktop publishing format, type sizes, and typefaces. Style rules are provided that explain how to handle equations, units, figures, tables, abbreviations, and acronyms. Sections are also devoted to the preparation of acknowledgments, references, and authors’ biographies. For additional information including electronic file requirements for text and graphics, please refer to the IEEE Power Engineering Society Author’s Kit. The kit may be obtained from the PES web site at http://www.ieee.org/power, or the PES Executive Office, 445 Hoes Lane, Piscataway, NJ 08855-1331, USA, phone: +1 732 562 3883, fax: +1 732 562 3881, e-mail: [email protected]. The PES Author's Kit also contains a Session Summary Submission Cover Sheet, a Discussion Submission Cover Sheet, and an IEEE Copyright Form.
T
II. DiscussionJoint reliability studies with other ISO’s that the Midwest ISO has been involved with show few transmission upgrades required for Reliability purposes. Economic studies performed by the Midwest ISO show that there are opportunities to expand the transmission system significantly. Wind energy creates and energy surplus in areas with Renewable Portfolio Standard mandates. The highest RPS in the Midwest ISO is 30% for Xcel and 25% for the rest of Minnesota.
For the Midwest ISO Transmission Expansion Plan 2008 (MTEP 08), four futures were run:
1. Reference- most economic choice of generation with wind mandates
2. Environmental- $25/ton carbon tax with wind mandates
3. Fuel Limited-natural gas restricted to 80% with wind mandates
Dale Osborn is with the Midwest ISO, St. Paul, MN (email:[email protected])
Zheng Zhou is with the Midwest ISO, St. Paul, MN(email:[email protected])
4. Renewable-40,000 Mw of wind generation including mandates, 20% wind energy across the Midwest ISO.
The Midwest ISO has a multi-step process was conducted to develop transmission conceptual plans for each future:
Step 1: Generation expansion forecasts were developed for Midwest ISO and the surrounding areas for each of the futures. Note the surplus in the Renewable future on the right in Figure 1.
Future Capacity Requirements 2008-2027
6,326 6,326 6,326 6,326
12,000
22,800
9,60027,600
18,000
4,800 3,600
6,000
4,800
3,2001,280
4,160
2,880
13,800
13,200
40,50012,600
72,506
56,686
46,006
50,926
-
10,000
20,000
30,000
40,000
50,000
60,000
70,000
80,000
Ref Env Fuel Ren
Future
Adde
d C
apac
ity (M
W)
Queue Nulcear Coal CC CT Wind
Generation Mix by Type for Each FutureFigure 1
Step 2: Generation was sited using screening criteria for fuel sources, transportation, brown field sites, environmental exclusion areas, urban areas, etc. Figure 2 shows the generation locations and the siting of transmission to interconnect the generation and deliver the energy.
Location of the Generation from the Queue plus the Generation Expansion Optimization
Figure 2
Step 3: Transmission expansion concepts for the year 2021 were developed for each future.
a. Hourly economic simulations were run to determine the properties of the “Constrained” base system.
Transmission Plan Based on Economic StudiesD. Osborn, Member, and Z. Zhou, Member
1

b. Hourly economic simulations were run to determine the properties of an unconstrained base system or “Copper Sheet”.
c. “Constrained” system and the “Copper Sheet” differences provides:
1. The total benefit by geographic area that potentially could be “captured” by a conceptual transmission expansion.
2. The areas of economic sources and sinks as shown graphically in Figure 3.
3. Interface Area boundary identification for monitoring as indicated by the color changes in Figure 3.
Location of Economic Sources and SinksFigure 3
d. “Monitored” case provides the hourly flow information into each Interface Area and the benefit of the change of flow from the “Constrained” case. The benefit provides a rough budget estimate for transmission construction. The flows can be used to estimate the voltage and type of construction of the lines and transformers. Figure 4 shows the cut set of lines that define a west to east interface near the Ohio-Pennsylvania state lines.
East West Interface Cut SetFigure 4
Figure 5 is a plot of the summation of the hourly line flows across the interface with a sixth order curve fit showing a smoothed pattern by month. The impact of wind appears in the diminished summer flows. The tendency of all areas to be on gas also contributes to the diminished summer flows. The load factor is about 74%. Wind generation in this model had a 40% capacity factor. Other forms of generation also contribute to the interface flows. For economic transmission expansion, a 80% of peak value is usually a target for line ratings and not the 100% rating as may be associated with reliability studies. Further studies are needed to determine the exact ratings.
Hourly Flow West East InterfaceFigure 5
Figure 6 is the flow duration curve for the interface.
West to East Flow with HVDC
0
5000
10000
15000
20000
25000
1 1008 2015 3022 4029 5036 6043 7050 8057Hours
Flow
(MW
)
Flow Duration Curve West to East InterfaceFigure 6
e. Transmission concepts are formed and tested by economic simulation to determine the benefit
2
West to East Interface Flows OH-PA
0
5000
10000
15000
20000
25000
0 720 1440 2160 2880 3600 4320 5040 5760 6480 7200 7920 8640
Hour of the Year
MW
Jan Feb Mar Apr May Jun Jul Aug Sep Oct Nov Dec
capture percentage by area, individual hourly line and transformer hourly flow, the Interface flows, and flow not achieved in the “Monitored” case. Transmission constraints that are sorted by the summation of the hourly shadow prices for a year are also produced. Maps of the generation are used to locate transmission through areas requiring future interconnections. See Figure 2. The transmission configurations are modified using the information provided. Then “e” is repeated until there are few issues to resolve. Four steps are required to converge on an adequate solution.
Table 7 is the calculation of the benefit captured to transmission cost for the four futures after two iterations of step “e”. Three of the four futures have a positive ratio. Other information provides the area summaries that indicate improvement potential by area.
Benefit Capture Summary after Two IterationsTable 7
3

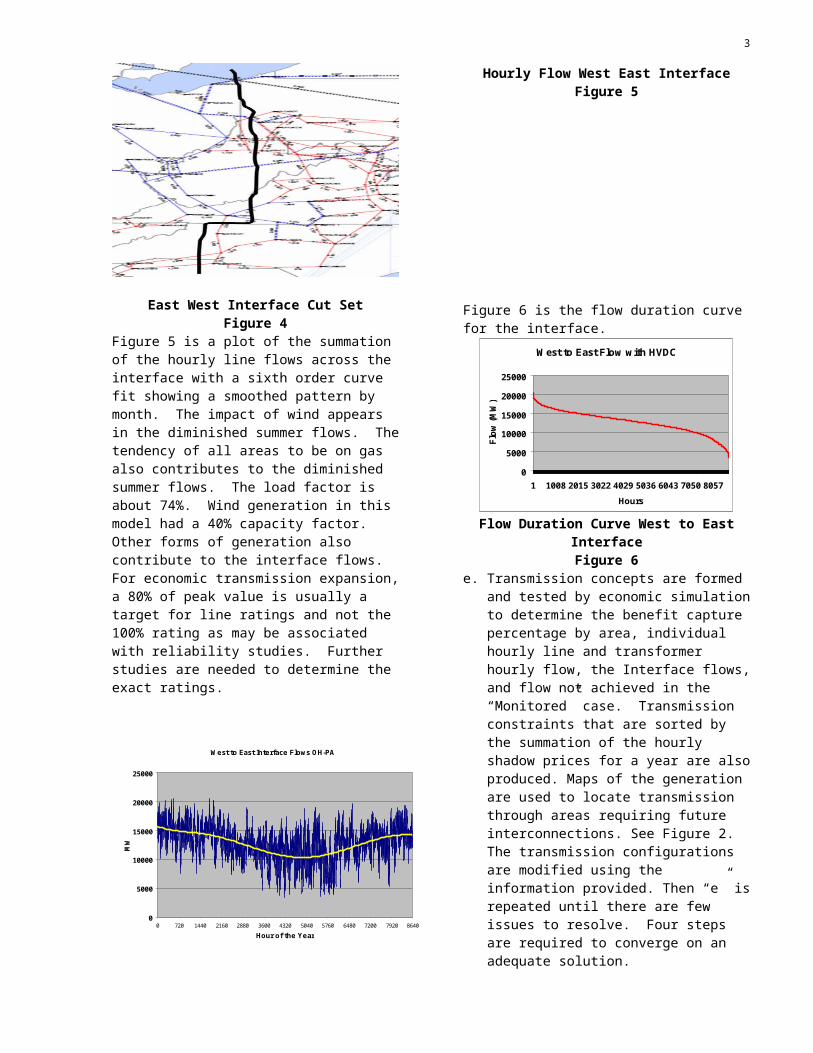
Table 8 shows the unachieved potential interface flow by interface. Figure 9 is the graphical representation of the same information. Figure 9 allows one to propose a line more readily than the table data.
Unachieved Interface FlowTable 8
Figure 9 shows the direction and magnitude of unachieved interface flows by balancing area. The lines tending toward red are the candidate locations for lines to increase power transfer. Similar plots can be produced of the simulated flows to analyze loop flow and serpentine flows that use more transmission MW-miles than necessary to deliver the power and energy. Differences between futures
or iteration steps can be used to identify improvements or other changes.
Graphical Unachieved Interface Flows Figure 9
Table 10 contains the lists of the top binding constraints by the summation of hourly shadow prices after two iterations. The Total Shadow Price provides an annual revenue target estimate for building facilities to mitigate a constraint. Conceptual mitigation measures may involve multiple flow gates as can be seen on the graph in Figure 9. Resolving transmission constraints involves mitigation of flow gates in multiple RTO footprints.
For the second iteration, 331 flow gates were eliminated, 6 made better and 7 made worse or added with the conceptual transmission modeled. Just relieving flow gates as a study method builds a transmission system with increased capacity in the direction of dominate flows. Constraint mitigation does not deliver the desired power to the desired locations efficiently.
Total Binding Total ShadowHours Price (k$/MW) Area
01DOUBS 20459 01AQUEDT 20456 330 4881 3043.8 PJM01DOUBS 20105 01DOUBS 20459 1 1354 2581.14 PJMNEWROAD6 50403 6W.NROAD 98414 1 4866 2214.78 SPPPLAT T#1 79593 WILLIS E 79595 1 8035 1556.87 NYISOMED-LDG3 58773 MED-LDG4 58774 1 3305 1522.73 SPPWHITPAIN 15 WHITPAN3 4601 1 2026 1454.97 PJMMANOR 3071 MILLWOOD 3104 363 1132 1259.23 PJMNIAGAR2W 79592 PA27 REG 81516 1 4538 1057.59 NYISO-IMOCRAIGJT4 54015 ASHWEST4 53226 19 4956 957.17 SPPINTERFACE ISONE - CAPITAL 10 1 8435 861.17 ISONE
Total Binding Total ShadowHours Price (k$/MW) Area
MT VRNON 32328 ASHLEY 32334 216 1861 873.72 IPCENTER 3 66791 JAMESTN3 63369 1 1451 494.92 OTPPR ISLD3 60105 REDROCK3 60236 209 5783 445.83 NSP08WHITST 25380 16GUION 27821 255 2026 362.59 PSI-IPLCENTER 4 66751 HESKETT4 67342 1 910 288.29 OTP-MDUQUAD ; 36382 ROCK CK3 34036 1 2384 222.66 ALTW-COEDQUAD ; 36382 ROCK CK3 34036 273 3251 195.78 ALTW-COEDEASTDALE 33307 E SPFLD 33158 197 687 142.32 AMRENDUCK CRK 33161 IPAVA 30788 1 755 119.53 AMRENMNVLTAP4 60150 GRANITF4 66550 1 279 113.52 NSP-WAPA
Top 10 Binding Constraints outside of MISO
Top 10 Binding Constraints in MISO
Top Binding Constraints by Summation of Hourly Shadow Prices
Table 10Table 11 provides a summary of the status changes on constrained flow gates for the four futures. Generally the total impact is a reduction in hours of constraint and the total summation of shadow prices for the year when transmission is added. There are new constrained flow gates added also. This
INTERFACE
Total Positive
Total Negative
Additional Capacity
Energy EnergyNeeded to Deliver
(MWh) (MWh)80% Energy(MW)
WPENN-EPENN 59269504 -25750 6411AEP-EAST 41534228 -1061275 5647IN-AEP 39992537 -164926 4397AEP-COMED 156377 -35084953 3964SOCO-TVA 7977 -26480566 3580TVA-EES 395634 -17130336 2903PJM-NYISO 25829416 -12223 2890MICH-SOUTH 1856437 -5267915 2364AMRN-EAST 18580068 -195205 2337DUK-SOCO 4623699 -5715025 2290
4
information provides information on the merit of performance of the transmission concept.
Constraint Status ChangeTable 11
Figure 12 is the generator annual average LMP in the “Constrained” case without the transmission expansion and the second iteration with the transmission expansion.
Generation LMP Contour Plots“Constrained” vs. Renewable Transmission
Figure 12f. Line ratings are then placed on the conceptual
lines using a rating system as a multiple of the Surge Impedance Loading based on the line length. Step “f” may require a few iterations to converge on an adequate solution. The same information that is available in Step “e” is available in Step “f” to refine the transmission concept.
Information on the mitigation of carbon dioxide and other pollutants is also available from the computer simulations. For the second iteration case, the carbon dioxide reduction was about 17% for a 20% wind energy mandate across the Midwest ISO.Affects on capacity factors and fuel usage by other generation is also available.
Step 4: Evaluates each of the other futures generation simulated with one futures transmission for all futures. Optional transmission may be added to the base future’s transmission to make this work.
Step 5: The results of Step 4 are used to form a core transmission concept that would work reasonably well with all futures and sets of options that would have to be added to the core transmission concept to accommodate the generation of a specific future. A weighted merit system is used to select lines and transformers from the four futures runs.
Step 6: Step 6 is a traditional Reliability analysis and has multiple steps also. The result is a transmission concept that is both Economic and Reliable.
Step 7: Step 7 is to allocate transmission costs. Tariffs exist to allocate costs. The higher voltage overlays developed by the economic process do not create beneficiaries on the same basis as which the tariffs were first written. The higher voltage overlays produce benefits mainly in areas outside of the Midwest ISO. The generation net revenue produced from energy sales are not achieved necessarily by generation in areas where transmission is constructed. The benefits are sufficient to support the cost of the transmission and it is hoped that a tariff that would have the beneficiaries pay for the transmission could be determined possibly by adding a transmission component to the LMP. The RTO’s could collect the transmission revenue and distribute the transmission revenue to the transmission owners.
Step 8: Step 8 is to move the transmission items into the MTEP Appendix A and have the expansion approved for construction by the Board of Directors. Part of this step is an extensive review by the stakeholders in the Midwest ISO Committee structure.
III. Conclusion
The conceptual transmission design process being developed by the Midwest ISO provides an efficient method of developing economic transmission conceptual plans.The issues of economic operation, constrained areas and loop flow mitigation can be addressed at one time.
Conceptual transmission expansions that include large amounts of wind generation may affect a good part of the Eastern Interconnection if overall economics are considered. The need to coordinate with other RTO’s for the evaluation of wind development in large quantities is needed. The Midwest ISO, PJM, SPP, TVA and other volunteers have initiated a Joint Coordinated System Plan in coordination with the DOE-NREL Eastern Wind Integration Study to address the transmission required for wind as well as other generation futures.
Early results indicate that it may be possible to fund the transmission with the benefits derived with a positive benefit to cost ratio.
II. BIOGRAPHIES
.Dale Osborn ( M’ 1964) received a B. Sc, M. S in Electrical Engineering form the University of Nebraska, Lincoln, Nebraska. He is the Transmission Technical Director for the Transmission Asset Management group of the Midwest ISO. His primary responsibilities involve wind issues and the coordination of studies.
Zheng Zhou received B.Sc., M.Sc. Degrees in Electrical Engineering from Tsinghua University of People's Republic of China in 1997,2000, and Ph.D. degree in Electrical Power Engineering in 2004 from Iowa State University.
5

Since then he has been a senior engineer at Midwest Independent System Operator, Inc. He has been working in projects related to economic expansion planning of power systems
6


![home.eng.iastate.eduhome.eng.iastate.edu/~tge/ce326/hyd.pdfAuthor ellis [ TE-ELLIS ] Created Date 4/14/2003 11:06:37 AM](https://img.pdfslide.net/doc/110x75/5b0563137f8b9a58148b531a/homeeng-tgece326hydpdfauthor-ellis-te-ellis-created-date-4142003-110637.jpg)