Embed Size (px)
Citation preview
~ ) Pergamon Renewabh, Energy. Vol. 4+ No. I, pp. 101 108, 1994
Copyright L 1994 Elsevier Science Ltd Printed in Great Britain. All rights reserved
096ff 1481/94 $6.00 + 0.00
D A T A B A N K
Hourly distributions of global and diffuse solar radiation in Lagos, Nigeria
M. A. C. CHENDO and A. A. L. MADUEKWE Department of Physics, Faculty of Science, University of Lagos, Akoka, Lagos, Nigeria
(Received 12 March 1993; accepted 26 April 1993)
A b s t r a e ~ T h e division of global solar radiation into its direct and diffuse components has been studied for Lagos (Lat. 6.58~N, Long. 3.33°E) using data obtained over a period of 2 years. The dependences upon the amount of global solar irradiance, solar elevation and season of the year have been obtained.
!. I N T R O D U C T I O N
Many studies of global solar radiation data through division into its components have been carried out elsewhere, notably by Iqbal [1] and Garrison [2, 3]. Their data have been mainly from North America, and no such data have yet been reported for any location in Nigeria. In this paper, the prop- erties of the diffuse radiation and total hemispherical radi- ation, and the relationship between them under varying solar elevation (air mass) and time of day or of year and season are studied. The distributions and mean values associated with these quantities are obtained, and the relative import- ance of the various variables affecting diffuse and hemi- spherical radiation and the effects of changing these variables are studied.
2. DATA
t tourly radiation data (global and diffuse) for the years 1990 and 1991 measured at a site in the University of Lagos, located within the Lagos metropolis, have been used. Mid- dleton pyranometers and recorders were used and a shade ring was used to obtain diffuse radiation which was thereafter corrected for the shading effect. Altogether, about 2200 data points were obtained but further scrutiny reduced the num- ber used to 1714 data points. The data points dropped either had no diffuse component recorded for that hour, or they violated the physical limits, which are the same as those given by Reindl et al. [4].
3. N O T A T I O N
The notat ion used is similar to that of Garrison [2, 3]. Let 10, 1 and ld be the intensity of solar radiation just above the atmosphere, the intensity of total hemispherical solar radiation on a horizontal surface at the Earth 's surface (hemispherical irradiance), and the intensity of diffuse radi- ation on the same horizontal surface (diffuse irradiance), respectively, all at the same location taken at the same time of day. Let z be the zenith angle, In be the intensity of direct normal radiation and t be the time. The following can be defined :
H0 = f l 0 cosz dt, (1) J
and:
H = f ld t , (2)
D = fia dt, (3)
KI - H/Ho (clearness index) (4)
K,i = D/ Ho (diffuse index). (5)
In addition, we have :
l d = I - - I n COSZ (6)
and :
D/H = (diffuse fraction). (7)
4. PROCEDURE AND RESULTS
As a first step, the entire data set was separated into ranges of solar elevations that were within 10 ° intervals, as follows :
(a) 0 ° 20 +, (b) 20' 30 °, (c) 30+-40 ", (d) 40 + 50 o, (e) 50 ° 60 +', (f) 60~-70, (g) 70+-80, (h) 80 ' -90 ' .
Fractions of Kt were arranged in an ascending order of mag- nitude and groups of K, in fractional steps of 0.05 were formed within each interval of solar elevation given above. Within each group, averages of Kt and Kd were obtained and plotted.
The entire data was also split on a seasonal basis as fol- lows :
Wet season: April, May, June, July, August , September, October. Dry season: January, February, March, November, December.
The data for each of the seasons were separated into solar elevation intervals as follows :
101
102 Data Bank
(i) f f 30 ':. (ii) 3 0 50 ,
(iii) 50* 70 , (iv) 7 0 9 0 .
As in the case for the entire data set, fractions of K~ were arranged in an ascending order of magnitude, and groups of Kt in fractional steps of 0.05 were formed within each interval of solar elevation given above for the seasonal analysis. Within each group averages of K, and K d were obtained and plotted for the seasonal data.
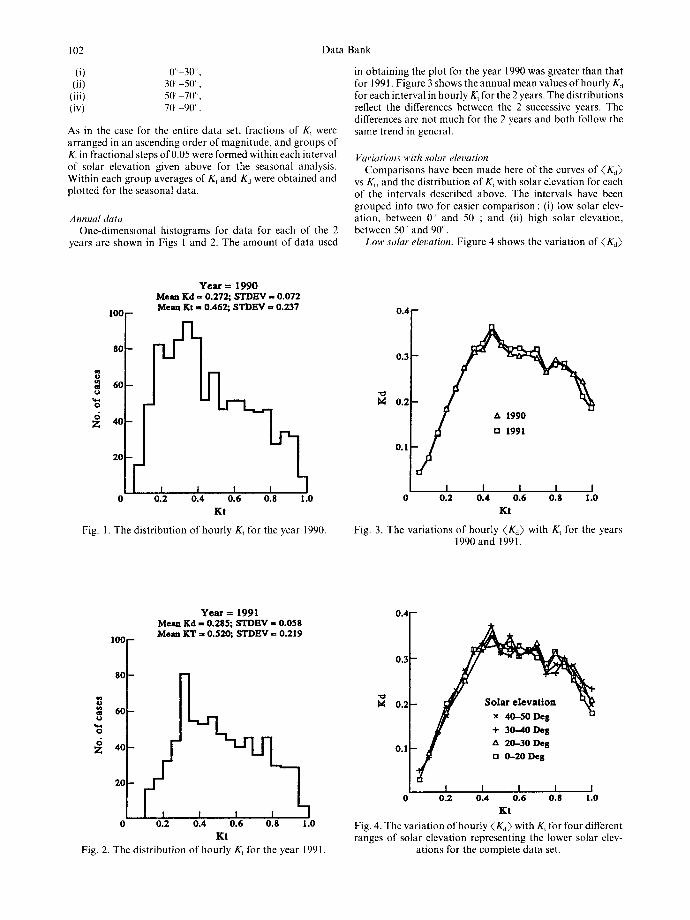
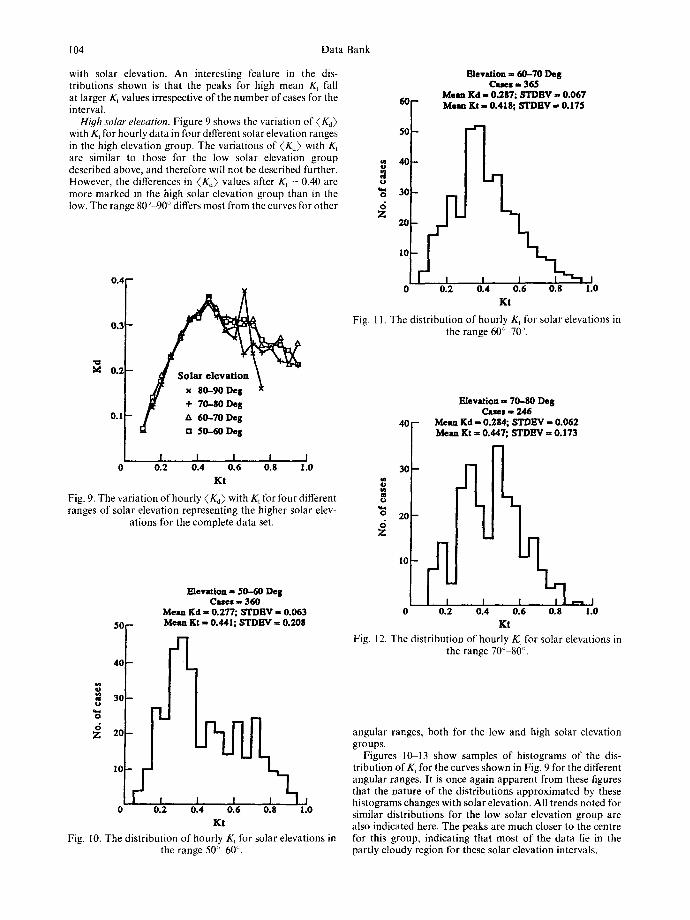
Annual data One-dimensional histograms for data for each of the 2
years are shown in Figs 1 and 2. The amount of data used
in obtaining the plot for the year 1990 was greater than that for 1991. Figure 3 shows the annual mean values of hourly Kd for each interval in hourly K, for the 2 years. The distributions reflect the differences between the 2 successive years. The differences are not much for the 2 years and both follow the same trend in general.
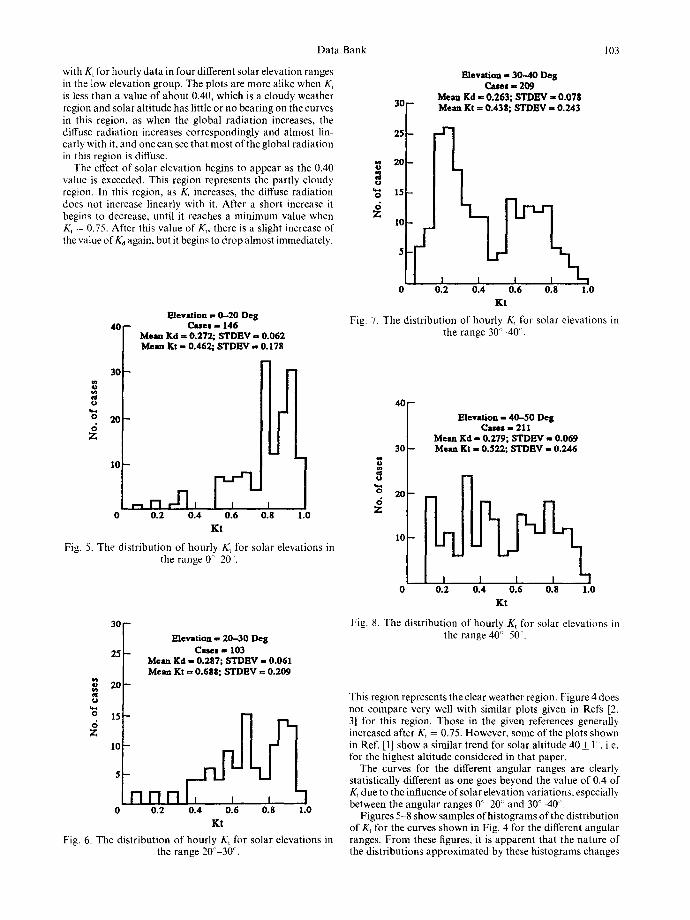
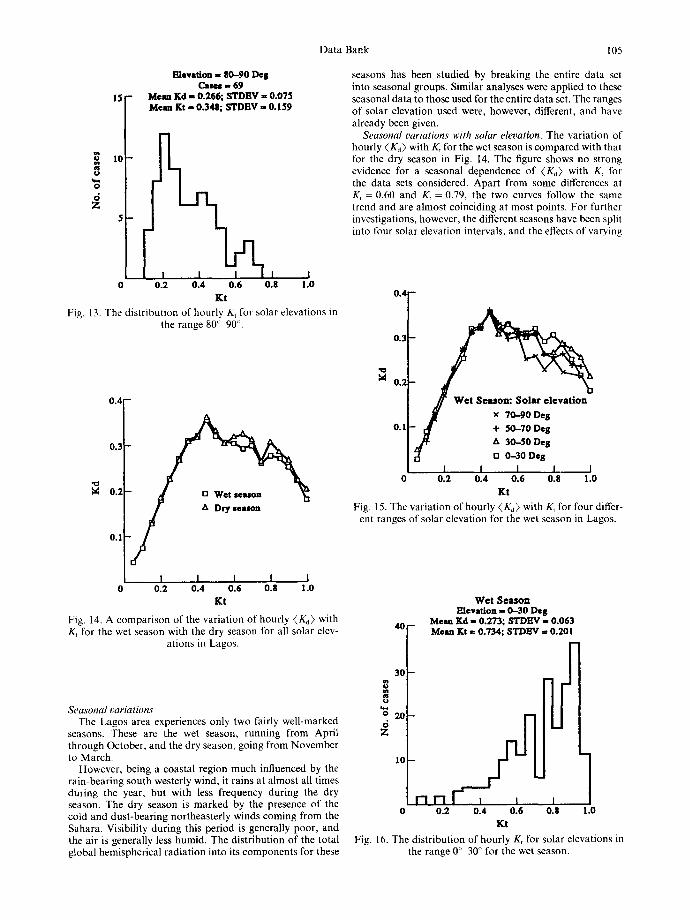
Variations with so&r elevation Comparisons have been made here of the curves of (Kd)
vs Kt, and the distribution of K~ with solar elevation for each of the intervals described above. The intervals have been grouped into two for easier comparison : (i) low solar elev- ation, between 0 and 5 0 ; and (ii) high solar elevation, between 50' and 90'.
Low solar elevation. Figure 4 shows the variation of (K j )
Year = 1990 Mean Kd = 0.272; STDEV - 0.072 Mean Kt = 0.462; STDEV = 0.237
10G
80
60
Z 40
20
I I I I ] 0 0.2 0.4 0.6 0.8 1.0
Kt
Fig. 1. The distribution of hourly Kt for the year 1990.
0.4
• ~ 0.3
0.2
0.1 / tl 1991
I I I I I 0 0.2 0.4 0.6 0.8 1.0
Kt
Fig. 3. The variations of hourly (Kd) with K t for the years 1990 and 1991.
100 --
Year = 1991 Mean Kd = 0.285; STDBV - 0.058 Mean KT = 0.520; STDEV = 0.219
80
o~ 60 "d 6 2; 4o
2o b '51
I I I ] 0.4 0.6 0.8 1.0
Kt Fig. 2. The distribution of hourly K, for the year 1991.
( 0.2
0 . 4 -
0 . 3 -
0.2
0 . 1 - I • 2 0 - 3 0 D e 8 t3 0-20 Dell
I I I I I 0 0.2 0.4 0.6 0.8 1.0
Kt
Fig. 4. The variation of hourly (Ka) with Kt for four different ranges of solar elevation representing the lower solar elev-
ations for the complete data set.
Data Bank
with Kt lbr hourly data in four different solar elevation ranges in the low elevation group. The plots are more alike when K~ is less than a value of about 0.40, which is a cloudy weather region and solar altitude has little or no bearing on the curves in this region, as when the global radiation increases, the diffuse radiation increases correspondingly and almost lin- early with it, and one can see that most of the global radiation in this region is diffuse.
The effect of solar elevation begins to appear as the 0.40 value is exceeded. This region represents the partly cloudy region. In this region, as KL increases, the diffuse radiation does not increase linearly with it. After a short increase it begins to decrease, until it reaches a min imum value when K~ :- 0.75. After this value of K, there is a slight increase of the value ofKd agaim but it begins to drop almost immediately.
E l e v a t i o n ~, 0 - 2 0 D e g 4 0 - Cases - 146
M e a n K d = 0 . 2 7 2 ; S T D E V m 0 . 0 6 2 M e a n Kt = 0 .462; S T D E V ~ 0 .178
i'° '~ 20
Z
0 0 . 2 0 . 4 0 .6 0 .8 1.0
K t
Fig. 5. The distribution of hourly K t for solar elevations in the range 0 ' 20'.
3 0 -
E l e v a t i o n = 2 0 - 3 0 D e 8
25 - Cases = 103 M e a n Kd - 0 .287 ; S T D E V - 0 .061 M e a n Kt m 0 . 6 8 8 ; S T D E V ~ 0 . 2 0 9
2 0 -
u
Z 1o
5 ,
"1 I-I I-i i I , , l 0 .2 0 . 4 0 .6 0 .8 1.0
K t
Fig. 6. The distribution of hourly K~ for solar elevations in the range 20°-30 ~.
103
3C
25
2G
6 Z 10
J I
0 0 . 2
E l e v a t i o n = 3 0 - 4 0 D e S Cases = 2 0 9
M e a n Kd = 0 . 2 6 3 ; S T D E V = 0 . 0 7 8 M e a n Kt = 0 .438; S T D E V ,~ 0 . 2 4 3
l I I I ~ - ~
0 .4 0 .6 0 .8 1.0
K t
Fig. 7. The distribution of hourly Kt for solar elevations in the range 3 0 ' 4 0 ' .
4 0 -
3O
2 0 -
IO
Elevation = 40-50 De s Cases - 211
Mean Kd = 0.279; STDEV = 0.069 M e a n Kt - 0 . 5 2 2 ; S T D E V - 0 . 2 4 6
i i ] 0 0 . 2 0 .4 0 .6 0 .8 1.0
K t
Fig. 8. The distribution of hourly Kt for solar elevations in the range 40 ~' 50'.
This region represents the clear weather region. Figure 4 does not compare very well with similar plots given in Refs [2, 3] for this region. Those in the given references generally increased after K, = 0.75. However, some of the plots shown in Ref. [I] show a similar trend for solar altitude 40+ 1', i.e. for the highest altitude considered in that paper.
The curves for the different angular ranges are clearly statistically different as one goes beyond the value of 0.4 of Kt due to the influence of solar elevation variations, especially between the angular ranges 0 ° 20 ~> and 30 ~ -40'.
Figures 5-8 show samples of histograms of the distribution of K t for the curves shown in Fig. 4 for the different angular ranges. From these figures, it is apparent that the nature of the distributions approximated by these histograms changes
104 Data Bank
with solar elevation. An interesting feature in the dis- tributions shown is that the peaks for high mean K t fall at larger Kt values irrespective of the number of cases for the interval.
High solar elevation. Figure 9 shows the variation of (Kd) with Kt for hourly data in four different solar elevation ranges in the high elevation group. The variations of (Kd) with K t are similar to those for the low solar elevation group described above, and therefore will not be described further. However, the differences in <Kd> values after Kt - 0.40 arc more marked in the high solar elevation group than in the low. The range 80"-90 ° differs most from the curves for other
U.41
0.3
0.2
0.I
I I I I I 0 0 .2 0 .4 0 .6 0 .8 1.0
K t
Fig+ 9. The variation of hourly (Kd> with Kt for four different ranges of solar elevation representing the higher solar elev-
ations for the complete data set.
l~levation , , 5 0 - 6 0 D e g C u e s - 3 6 0
M e a n K d = 0 .277; S T D E V = 0 . 0 6 3 5 0 - M e a n Kt - 0 .441 ; S T D B V = 0 .208
4C
u
Z 2c
113
i I I l 0 .2 0 .4 0 . 6 0 .8 1.0
K t
Fig. I0. The distribution of hourly Kt for solar elevations in the range 50 ° 60 c.
E l e v a t i o n = 6 0 - 7 0 D e g Cases , , 3 6 5
M e a n K d = 0 . 2 8 7 ; S T D E V ~ 0 . 0 6 7 60 M e a n Kt - 0 .418; S T D B V - 0 .175
513
413
'3 313 6
z 2o J
1o
I I 0 .2 0 .4 0 .6 0 .8 1.0
K |
Fig. 11. The distribution of hourly K t for solar elevations in the range 60" 70'.
Elevation = 70-80 De S Cases - 246
40- Mean Kd = 0.284 STDEV = 0.062
M e a n Kt = 0 . 4 4 7 S T D E V -- 0 , 1 7 3
313
P,
~ 20
Z
'°t h ' I I I ~ I
0 0 .2 0 .4 0 .6 0 .8 1.0
K t
Fig. 12. The distribution of hourly Kt for solar elevations in the range 70 ° 80".
angular ranges, both for the low and high solar elevation groups.
Figures 10-13 show samples of histograms of the dis- tribution of K~ for the curves shown in Fig. 9 for the different angular ranges. It is once again apparent from these figures that the nature of the distributions approximated by these histograms changes with solar elevation. All trends noted for similar distributions for the low solar elevation group are also indicated here. The peaks are much closer to the centre for this group, indicating that most of the data lie in the partly cloudy region for these solar elevation intervals.
Data Bank 105
g
6 Z
15
10
E l e v a t i o n - 8 0 - 9 0 D e 8 C u e s - 69
M e a n K d - 0 .266 ; S T D E V ~- 0 . 0 7 5 M e a n Kt - 0 . 3 4 8 ; S T D E V - 0 . 1 5 9
1 I I I I t t
0 0 . 2 0 .4 o . 6 o . s i . o
K t
Fig. 13. The distribution of hourly K, for solar elevations in the range 80 ~ 90'.
0 . 4 -
0.3
O.2
0.1
I I I I I 0 0 .2 0 . 4 0 . 6 0 .8 1.0
K t
Fig. 14. A comparison of the variation of hourly ( K d ) with Kt for the wet season with the dry season for all solar elev-
ations in Lagos.
Seasonal variations The Lagos area experiences only two fairly well-marked
seasons. These are the wet season, running from April through October, and the dry season, going from November to March.
However, being a coastal region much influenced by the rain-bearing south westerly wind, it rains at almost all times during the year, but with less frequency during the dry season. The dry season is marked by the presence of the cold and dust-bearing northeasterly winds coming from the Sahara. Visibility during this period is generally poor, and the air is generally less humid. The distribution of the total global hemispherical radiation into its components for these
seasons has been studied by breaking the entire data set into seasonal groups. Similar analyses were applied to these seasonal data to those used for the entire data set. The ranges of solar elevation used were, however, different, and have already been given.
Seasonal variations with solar elevation, The variation of hourly (Kd) with Kt for the wet season is compared with that for the dry season in Fig. 14. The figure shows no strong evidence for a seasonal dependence of (Kd) with K~ for the data sets considered. Apart from some differences at K~ = 0.60 and K~ = 0.79, the two curves follow the same trend and are almost coinciding at most points. For further investigations, however, the different seasons have been split into four solar elevation intervals, and the effects of varying
0.4
• ~ 0 .3
:~ O.2
~1~ x 7 0 - 9 0 D e s
U 0-30 Deg
I I I I I 0 0 . 2 0 . 4 0 . 6 0 .8 1.0
K t
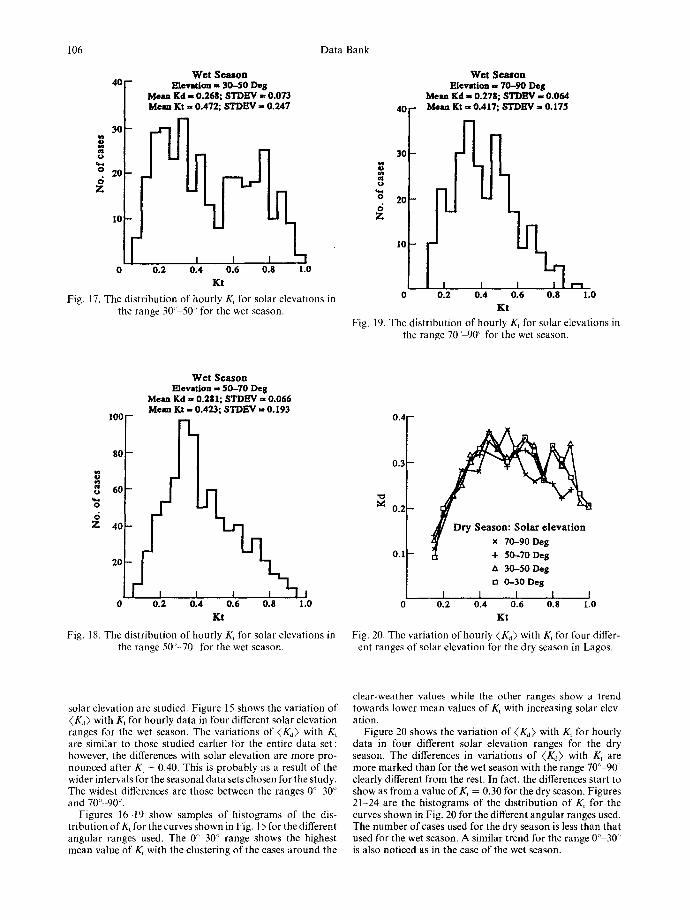
Fig. 15. The variation of hourly (Kd) with K~ for four differ- ent ranges of solar elevation for the wet season in Lagos.
40
3O
o
2O 6 Z
Wet Season Elevation m 0--30 Deg
Mean Xd .- 0.273; STDEV - 0.063
M e a n Kt ~ 0 .734 ; S T D E V = 0 .201
io I I
0 0.2 0.4 0.6 0.8 1 .0
K t
Fig. 16. The distribution of hourly K, for solar elevations in the range 0 ° 30 ° for the wet season.
m
I"1 r l [" i
I06 Data Bank
40
3O
o"
20 6 Z
10
0 0.2
W e t S e a s o n Blevation ,- 30-50 De 8
Mean Kd - 0.268; STDEV , , 0.073 Mean Kt = 0.472; STDI~V -- 0.247
- - l . r -
1 I I 7
0.4 0.6 0.8 1.0
Kt
Fig. 17. The distribution of hourly K, for solar elevations in the range 3 0 50 '~' for the wet season.
4 0 -
3O
20 6 Z
10
W e t S e a s o n Elevation -, 70-90 Deg
Mean Kd ,- 0.278; STDHV ,~ 0.064 Mean Kt ,- 0.417; STDEV = 0.175 [Jt
I I I I I 0 0.2 0.4 0.6 0.8 1.0
Kt
Fig. 19. The distribution of hourly Kt for solar elevations in the range 70' 90' for the wet season.
lOO
80
60
6 Z 40
20
W e t S e a s o n Elevation - 50-70 De 8
Mean Kd ~, 0.281; STDEV = 0.066 Mean Kt - 0.423; STDEV = 0.193
I 0.2
I I % 1 0.4 0.6 0.8 1.0
Kt
Fig. 18. The distribution of hourly K, for solar elevations in the range 50 °--70 for the wet season.
0 .4 -
0 .3 -
0.2
~/ x 70--90 Deg
0.1 r~ + 50--70 Deg
zX 30-50 Deg 13 0-30 Deg
I I I I I 0 0.2 0.4 0.6 0.8 1.0
Kt
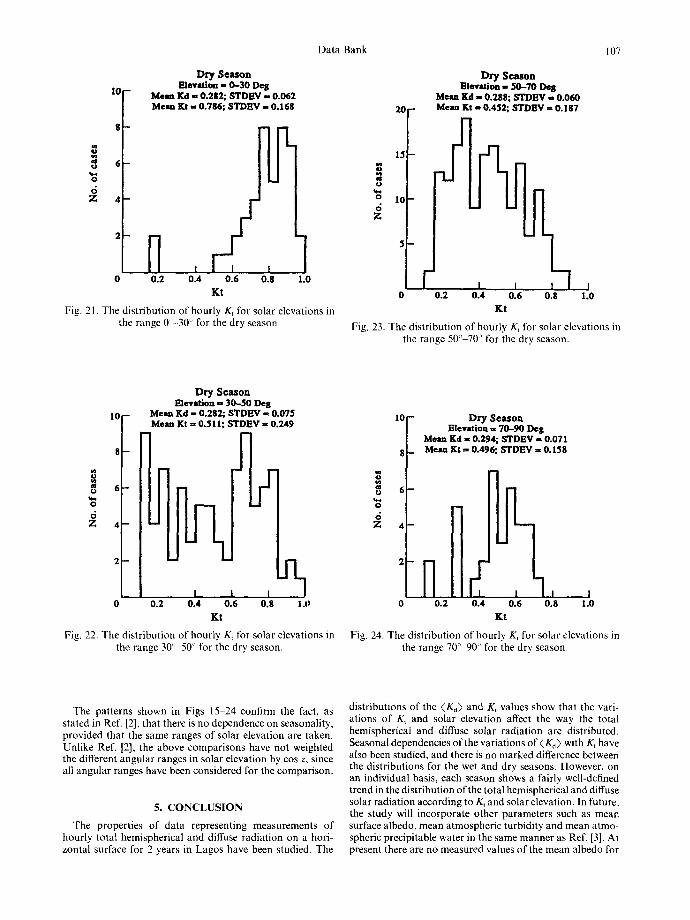
Fig. 20. The variation of hourly (Kd) with K~ for four differ- ent ranges of solar elevation for the dry season in Lagos.
solar elevation are studied. Figure 15 shows the variation of {Kd) with K~ for hourly data in four different solar elevation ranges for the wet season. The variations of {Kd) with K~ are similar to those studied earlier for the entire data set; however, the differences with solar elevation are more pro- nounced after K t = 0.40. This is probably as a result of the wider intervals for the seasonal data sets chosen for the study. The widest differences are those between the ranges 0' 30 ° and 70 ° -90.
Figures 16 19 show samples of histograms of the dis- tribution of K~ for the curves shown in Fig. 15 for the different angular ranges used. The 0" 30 ° range shows the highest mean value of K~ with the clustering of the cases around the
clear-weather values while the other ranges show a trend towards lower mean values of K~ with increasing solar elev- ation.
Figure 20 shows the variation of (Kd) with K~ for hourly data in four different solar elevation ranges for the dry season. The differences in variations of (Kd) with K, are more marked than for the wet season with the range 70"-90' clearly different from the rest. In fact, the differences start to show as from a value of K, = 0.30 for the dry season. Figures 21-24 are the histograms of the distribution of Kt for the curves shown in Fig. 20 for the different angular ranges used. The number of cases used for the dry season is less than that used for the wet season. A similar trend for the range 0 ° 30 ~ is also noticed as in the case of the wet season.
Data Bank
I G -
D r y S e a s o n Elevation , , 0 - 3 0 De S
Mean Kd = 0.282; STDEV ,- 0.062 Mean Kt -. 0.786; STDEV m 0.168
O
6
6 Z 4
0 0.2 0.4 0.6 0.8 1.0
Kt
Fig. 21. The distribution of hourly Kt for solar elevations in the range O- 30 c for the dry season.
107
15
Io
Z
o
D r y S e a s o n Elevation m 5 0 - 7 0 DeS
Mean Kd - 0.288; STDEV = 0 .060 Mean Kt m 0.452; STDBV = 0.187
I I I I I I
0 .2 0.4 0.6 0.8 1.0
Kt
Fig. 23. The distribution of hourly Kt for solar elevations in the range 5if' 70-' for the dry season.
O
D r y S e a s o n Elevation = 30-50 De S
Mean Kd = 0.282; STDEV m 0.075 1 0 ~ Mean Kt = 0.511; STDEV ,= 0.249
i
8 - -
6
4 - J I
0.2 0.4 I
0.6
Kt
J]_ , I
0.8 1.0
Fig. 22. The distribution of hourly Kt for solar elevations in the range 30 ° 50 c' for the dry season.
6 Z
I0 - D r y S e a s o n Elevation I,, 7 0 - 9 0 Deg
Mean Kd = 0.294; STDEV = 0.071 8 - M e a n K t = 0 . 4 9 6 ; S T D E V = 0 . 1 5 8
6 -
H I I [ q I I 0.2 0.4 0.6 0.8 1.0
Kt
Fig. 24. The distribution of hourly K, for solar elevations in the range 70 ° 90 c' for the dry season.
The patterns shown in Figs 15 24 confirm the fact, as staled in Ref. [2], that there is no dependence on seasonality, provided that the same ranges of solar elevation are taken. Unlike Ref. [2], the above comparisons have not weighted the different angular ranges in solar elevation by cos z, since all angular ranges have been considered tbr the comparison.
5. CONCLUSION
The properties of data representing measurements of hourly total hemispherical and diffuse radiation on a hori- zontal surface for 2 years in Lagos have been studied. The
distributions of the (Kd) and K, values show that the vari- ations of /£1 and solar elevation affect the way the total hemispherical and diffuse solar radiation are distributed. Seasonal dependencies of the variations of (Kd) with Kt have also been studied, and there is no marked difference between the distributions for the wet and dry seasons. However, on an individual basis, each season shows a fairly well-defined trend in the distribution of the total hemispherical and diffuse solar radiation according to Kt and solar elevation. In future, the study will incorporate other parameters such as mean surface albedo, mean atmospheric turbidity and mean atmo- spheric precipitable water in the same manner as Ref. [3]. At present there are no measured values of the mean albedo for

108 Data Bank
Lagos, while there are some data for atmospheric turbidity and precipitable water vapour.
REFERENCES
I. M. |qbal, Prediction ofhourly diffuse solar radiation from measured hourly global radiation on a horizontal surface. Solar Energy 24, 491-504 (1980).
2. J. D. Garrison, A study of solar irradiation data for six sites. Solar Energy 32, 237-250 (1984).
3. J. D. Garrison, A study of the division of global irradiance into direct and diffuse irradianee at thirty-three U.S. sites. Solar Energy 35, 341 352 (1985).
4. D. T, Reindl, W. A. Beckman and J. A. Duffle, Diffuse fraction correlations. Solar Energy 45, 1 8 (1990).