Embed Size (px)
Citation preview
INCOME AND SAVINGS NATIONAL INCOME PER CAPITA
HOUSEHOLD DISPOSABLE INCOME HOUSEHOLD SAVINGS
INCOME INEQUALITY AND POVERTY
INCOME INEQUALITY POVERTY RATES AND GAPS
HOUSEHOLD WEALTH
HOUSEHOLD FINANCIAL ASSETS HOUSEHOLD DEBT
NON-FINANCIAL ASSETS BY HOUSEHOLDS
HOUSEHOLD INCOME AND WEALTH
NATIONAL INCOME PER CAPITAWhile per capita gross domestic product is the indicatormost commonly used to compare income levels, twoother measures are preferred, at least in theory, by manyanalysts. These are per capita Gross National Income(GNI) and Net National Income (NNI). Whereas GDP refersto the income generated by production activities on theeconomic territory of the country, GNI measures theincome generated by the residents of a country, whetherearned on the domestic territory or abroad.
DefinitionGNI is defined as GDP plus receipts from abroad lesspayments to abroad of wages and salaries and ofproperty income plus net taxes and subsidies receivablefrom abroad. NNI is equal to GNI net of depreciation.
Wages and salaries from abroad are those that areearned by residents who essentially live and consumeinside the economic territory but work abroad (thishappens in border areas on a regular basis) or for personsthat live and work abroad for only short periods(seasonal workers) and whose centre of economicinterest remains in their home country. Guest-workersand other migrant workers who live abroad for twelvemonths or more are considered to be resident in thecountry where they are working. Such persons may sendpart of their earnings to relatives at home, but theseremittances are treated as transfers between residentand non-resident households and are recorded innational disposable income but not national income.
Property income from/to abroad includes interest anddividends. It also includes all or part of the retainedearnings of foreign enterprises owned fully or in part byresidents (and vice versa). In this respect, it is importantto note that retained earnings of foreign enterprisesowned by residents do not actually return to theresidents concerned. Nevertheless, the retained earningsare recorded as a receipt. As such, it is an imputation,and, since there is no actual transaction, it is necessaryto impute an outflow of the same amount. The imputedoutflow is treated as a financial transaction (areinvestment of earnings abroad) and not as an outflowof property income. Countries with large stocks ofoutward foreign direct investment may be shown ashaving large receipts of property income from abroadand therefore high GNI even though much of the
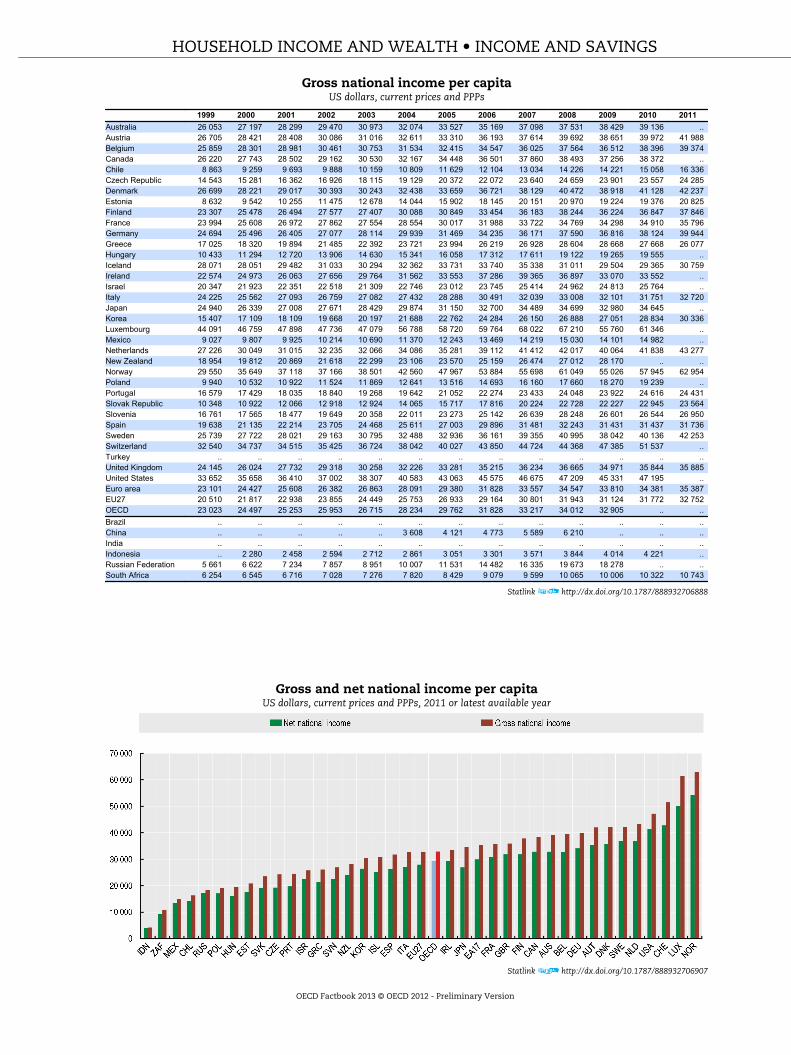
OverviewRanking countries according to GNI per capita, showsthat on average GNI per capita is usually around 15-19%higher than NNI per capita. The country rankings are notgreatly affected by the choice of income measure. Theonly countries that would be more than one place lowerin the ranking if NNI per capita were used instead of GNIare Belgium, Hungary and Japan; the only countries thatwould be more than one place higher in the ranking ifNNI per capita were used are Canada, Israel, Korea andthe Russian Federation.GNI per capita does not differ significantly from GDP percapita. Usually, the differences are (significantly) smallerthan USD 2 000. There are, however, four exceptions. ForLuxembourg, GNI per capita in 2010, although stillhighest in the OECD, is nearly USD 25 000 lower than GDPper capita. In Iceland and Ireland, GNI is USD 6 000-7 000lower. On the other hand, GNI in Switzerland is higherthan GDP per capita by approximately USD 3 000.
property income may never actually be returned to thecountry but instead add to foreign direct investment.
ComparabilityAll countries compile data according to the 1993 SNA“System of National Accounts, 1993” with the exceptionof Australia where data are compiled according to thenew 2008 SNA. It’s important to note however thatdifferences between the 2008 SNA and the 1993 SNA donot have a significant impact of the comparability of theindicators presented here and this implies that data arehighly comparable across countries.
However, there are practical difficulties in themeasurement both of international flows of wages andsalaries and property income and of depreciation. It is forthat reason that GDP per capita is the most widely usedindicator of income or welfare, even though, GNI istheoretically superior.
Sources• OECD (2012), National Accounts of OECD Countries,
OECD Publishing.Further informationAnalytical publications• OECD (2012), OECD Economic Outlook, OECD
Publishing.• OECD (2011), Perspectives on Global Development, OECD
Publishing.• OECD (2003),
The Sources of Economic Growth in OECD Countries,OECD Publishing.
Statistical publications• OECD (2011), National Accounts at a Glance,
OECD Publishing.• Maddison, A. (2003),
The World Economy: Historical Perspectives,Development Centre Studies, OECD Publishing.
Methodological publications• OECD (2000),
System of National Accounts, 1993 – Glossary, OECDPublishing.
• United Nations, OECD, International Monetary Fundand Eurostat (eds.) (2010),System of National Accounts 2008, United Nations,Geneva.
Online databases• OECD National Accounts Statistics.• OECD Economic Outlook: Statistics and Projections.
Websites• OECD Economic Outlook – Sources and Methods,
www.oecd.org/eco/sources-and-methods.• The World Economy (supplementary material),
www.theworldeconomy.org.
HOUSEHOLD INCOME AND WEALTH • INCOME AND SAVINGS
OECD Factbook 2013 © OECD 2012 - Preliminary Version
Gross national income per capitaUS dollars, current prices and PPPs
1999 2000 2001 2002 2003 2004 2005 2006 2007 2008 2009 2010 2011Australia 26 053 27 197 28 299 29 470 30 973 32 074 33 527 35 169 37 098 37 531 38 429 39 136 ..Austria 26 705 28 421 28 408 30 086 31 016 32 611 33 310 36 193 37 614 39 692 38 651 39 972 41 988Belgium 25 859 28 301 28 981 30 461 30 753 31 534 32 415 34 547 36 025 37 564 36 512 38 396 39 374Canada 26 220 27 743 28 502 29 162 30 530 32 167 34 448 36 501 37 860 38 493 37 256 38 372 ..Chile 8 863 9 259 9 693 9 888 10 159 10 809 11 629 12 104 13 034 14 226 14 221 15 058 16 336Czech Republic 14 543 15 281 16 362 16 926 18 115 19 129 20 372 22 072 23 640 24 659 23 901 23 557 24 285Denmark 26 699 28 221 29 017 30 393 30 243 32 438 33 659 36 721 38 129 40 472 38 918 41 128 42 237Estonia 8 632 9 542 10 255 11 475 12 678 14 044 15 902 18 145 20 151 20 970 19 224 19 376 20 825Finland 23 307 25 478 26 494 27 577 27 407 30 088 30 849 33 454 36 183 38 244 36 224 36 847 37 846France 23 994 25 608 26 972 27 862 27 554 28 554 30 017 31 988 33 722 34 769 34 298 34 910 35 796Germany 24 694 25 496 26 405 27 077 28 114 29 939 31 469 34 235 36 171 37 590 36 816 38 124 39 944Greece 17 025 18 320 19 894 21 485 22 392 23 721 23 994 26 219 26 928 28 604 28 668 27 668 26 077Hungary 10 433 11 294 12 720 13 906 14 630 15 341 16 058 17 312 17 611 19 122 19 265 19 555 ..Iceland 28 071 28 051 29 482 31 033 30 294 32 362 33 731 33 740 35 338 31 011 29 504 29 365 30 759Ireland 22 574 24 973 26 063 27 656 29 764 31 562 33 553 37 286 39 365 36 897 33 070 33 552 ..Israel 20 347 21 923 22 351 22 518 21 309 22 746 23 012 23 745 25 414 24 962 24 813 25 764 ..Italy 24 225 25 562 27 093 26 759 27 082 27 432 28 288 30 491 32 039 33 008 32 101 31 751 32 720Japan 24 940 26 339 27 008 27 671 28 429 29 874 31 150 32 700 34 489 34 699 32 980 34 645 ..Korea 15 407 17 109 18 109 19 668 20 197 21 688 22 762 24 284 26 150 26 888 27 051 28 834 30 336Luxembourg 44 091 46 759 47 898 47 736 47 079 56 788 58 720 59 764 68 022 67 210 55 760 61 346 ..Mexico 9 027 9 807 9 925 10 214 10 690 11 370 12 243 13 469 14 219 15 030 14 101 14 982 ..Netherlands 27 226 30 049 31 015 32 235 32 066 34 086 35 281 39 112 41 412 42 017 40 064 41 838 43 277New Zealand 18 954 19 812 20 869 21 618 22 299 23 106 23 570 25 159 26 474 27 012 28 170 .. ..Norway 29 550 35 649 37 118 37 166 38 501 42 560 47 967 53 884 55 698 61 049 55 026 57 945 62 954Poland 9 940 10 532 10 922 11 524 11 869 12 641 13 516 14 693 16 160 17 660 18 270 19 239 ..Portugal 16 579 17 429 18 035 18 840 19 268 19 642 21 052 22 274 23 433 24 048 23 922 24 616 24 431Slovak Republic 10 348 10 922 12 066 12 918 12 924 14 065 15 717 17 816 20 224 22 728 22 227 22 945 23 564Slovenia 16 761 17 565 18 477 19 649 20 358 22 011 23 273 25 142 26 639 28 248 26 601 26 544 26 950Spain 19 638 21 135 22 214 23 705 24 468 25 611 27 003 29 896 31 481 32 243 31 431 31 437 31 736Sweden 25 739 27 722 28 021 29 163 30 795 32 488 32 936 36 161 39 355 40 995 38 042 40 136 42 253Switzerland 32 540 34 737 34 515 35 425 36 724 38 042 40 027 43 850 44 724 44 368 47 385 51 537 ..Turkey .. .. .. .. .. .. .. .. .. .. .. .. ..United Kingdom 24 145 26 024 27 732 29 318 30 258 32 226 33 281 35 215 36 234 36 665 34 971 35 844 35 885United States 33 652 35 658 36 410 37 002 38 307 40 583 43 063 45 575 46 675 47 209 45 331 47 195 ..Euro area 23 101 24 427 25 608 26 382 26 863 28 091 29 380 31 828 33 557 34 547 33 810 34 381 35 387EU27 20 510 21 817 22 938 23 855 24 449 25 753 26 933 29 164 30 801 31 943 31 124 31 772 32 752OECD 23 023 24 497 25 253 25 953 26 715 28 234 29 762 31 828 33 217 34 012 32 905 .. ..Brazil .. .. .. .. .. .. .. .. .. .. .. .. ..China .. .. .. .. .. 3 608 4 121 4 773 5 589 6 210 .. .. ..India .. .. .. .. .. .. .. .. .. .. .. .. ..Indonesia .. 2 280 2 458 2 594 2 712 2 861 3 051 3 301 3 571 3 844 4 014 4 221 ..Russian Federation 5 661 6 622 7 234 7 857 8 951 10 007 11 531 14 482 16 335 19 673 18 278 .. ..South Africa 6 254 6 545 6 716 7 028 7 276 7 820 8 429 9 079 9 599 10 065 10 006 10 322 10 743
Statlink http://dx.doi.org/10.1787/888932706888
Gross and net national income per capitaUS dollars, current prices and PPPs, 2011 or latest available year
Statlink http://dx.doi.org/10.1787/888932706907
HOUSEHOLD INCOME AND WEALTH • INCOME AND SAVINGS
OECD Factbook 2013 © OECD 2012 - Preliminary Version

HOUSEHOLD DISPOSABLE INCOMEDisposable income, as a concept, is closer to the conceptof income generally understood in economics, thaneither national income or GDP. At the total economylevel it differs from national income in that additionalincome items are included, mainly other currenttransfers such as remittances. For countries where theseadditional items form significant sources of income theimportance of focusing on disposable income informulating policy is clear. Another important differencebetween national income and disposable incomeconcerns the allocation of income across sectors. At thislevel significant differences arise. In the main thesereflect the reallocation of national income: fromcorporations and households to government, on accountof income taxes; from households to government toreflect social contributions; and, from government andcorporations to households to reflect social benefitsother than social transfers in kind. It is mainly thisreallocation of income that brings the concept of incomecloser to the economic concept. Disposable income canbe seen as the maximum amount that a unit can affordto spend on consumption goods or services withouthaving to reduce its financial or non-financial assets orby increasing its liabilities.
DefinitionHousehold disposable income is the sum of householdfinal consumption expenditure and savings (minus thechange in net equity of households in pension funds). Italso corresponds to the sum of wages and salaries, mixedincome, net property income, net current transfers andsocial benefits other than social transfers in kind, lesstaxes on income and wealth and social securitycontributions paid by employees, the self-employed andthe unemployed.
The indicator for the household sector includes thedisposable income of non-profit institutions servinghouseholds (NPISH). The price deflator used to obtainreal values is consistent with that used to deflate thefinal consumption expenditure of households and NPISH.
ComparabilityAll countries compile data according to the 1993 SNA“System of National Accounts, 1993” with the exception
OverviewIn average over the period 2008-10, household disposableincome in real terms increased for all OECD countrieswith some notable exceptions. In Greece, Hungary andEstonia, household disposable income fell by 9-13% in thethree year period. Of the 28 OECD countries whereinformation is available, decreases in disposable incomewere also recorded in Italy, Mexico, Portugal, theNetherlands and Austria. All other countries sawincreases in real household disposable income in theperiod 2008-10. Chile, New Zealand, Norway and theSlovak Republic showed increases of over 10% for thisthree year period.Across OECD countries, comparisons of growth of realhousehold disposable income over the three years to 2010compared to growth in the three years to 2001 show arather consistent picture, with most countries showingslower growth. An exception is Japan, where moderategrowth rates in the recent period compare to an averagefall in the three years up to 2001.
of Australia where data are compiled according to thenew 2008 SNA. It’s important to note however thatdifferences between the 2008 SNA and the 1993 SNA donot have a significant impact of the comparability of theindicators presented here and this implies that data arehighly comparable across countries.
Real household disposable incomeAnnual growth in percentage
Statlink http://dx.doi.org/10.1787/888932706964
Sources• OECD (2012), National Accounts of OECD Countries,
OECD Publishing.• OECD (2011), National Accounts at a Glance, OECD
Publishing.Further informationStatistical publications• OECD (2012), Taxing Wages, OECD Publishing.• OECD (2011), OECD Pensions at a Glance, OECD
Publishing.• OECD (2011),
Society at a Glance: OECD Social Indicators, OECDPublishing.
Methodological publications• OECD (2007), Understanding National Accounts,
OECD Publishing.• OECD (2000),
System of National Accounts, 1993 – Glossary, OECDPublishing.
• United Nations, OECD, International Monetary Fundand Eurostat (eds.) (2010),System of National Accounts 2008, United Nations,Geneva.
Online databases• OECD Social Expenditure Statistics.
HOUSEHOLD INCOME AND WEALTH • INCOME AND SAVINGS
OECD Factbook 2013 © OECD 2012 - Preliminary Version
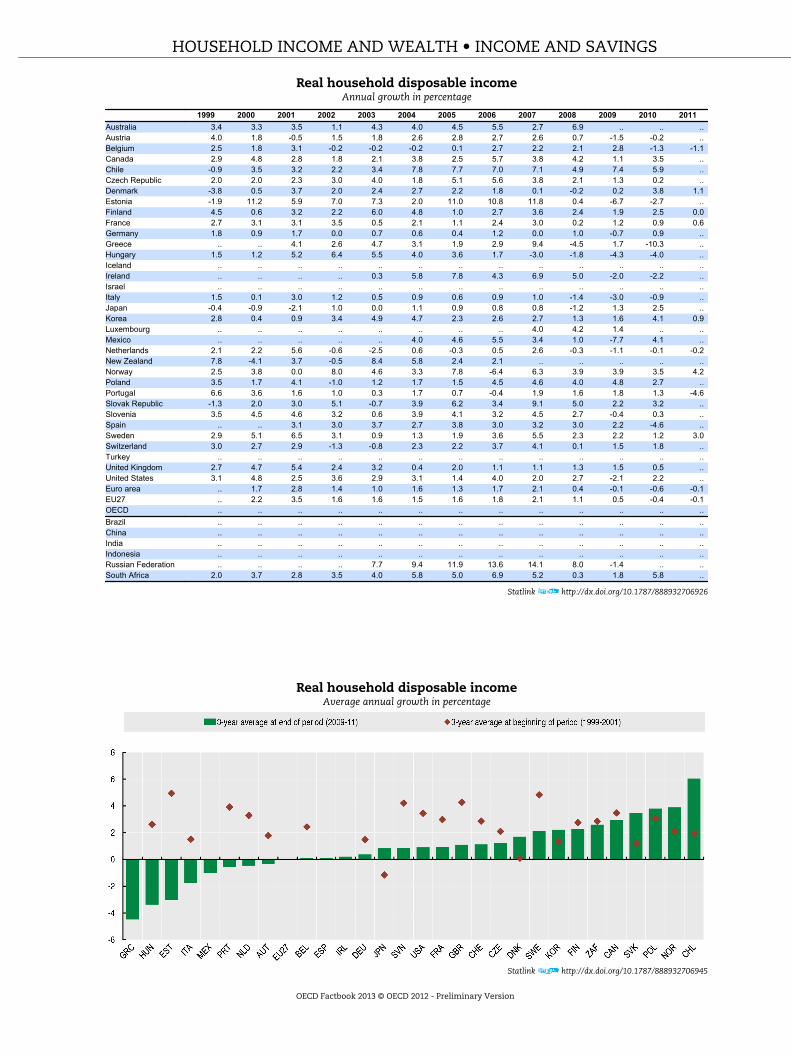
Real household disposable incomeAnnual growth in percentage
1999 2000 2001 2002 2003 2004 2005 2006 2007 2008 2009 2010 2011Australia 3.4 3.3 3.5 1.1 4.3 4.0 4.5 5.5 2.7 6.9 .. .. ..Austria 4.0 1.8 -0.5 1.5 1.8 2.6 2.8 2.7 2.6 0.7 -1.5 -0.2 ..Belgium 2.5 1.8 3.1 -0.2 -0.2 -0.2 0.1 2.7 2.2 2.1 2.8 -1.3 -1.1Canada 2.9 4.8 2.8 1.8 2.1 3.8 2.5 5.7 3.8 4.2 1.1 3.5 ..Chile -0.9 3.5 3.2 2.2 3.4 7.8 7.7 7.0 7.1 4.9 7.4 5.9 ..Czech Republic 2.0 2.0 2.3 3.0 4.0 1.8 5.1 5.6 3.8 2.1 1.3 0.2 ..Denmark -3.8 0.5 3.7 2.0 2.4 2.7 2.2 1.8 0.1 -0.2 0.2 3.8 1.1Estonia -1.9 11.2 5.9 7.0 7.3 2.0 11.0 10.8 11.8 0.4 -6.7 -2.7 ..Finland 4.5 0.6 3.2 2.2 6.0 4.8 1.0 2.7 3.6 2.4 1.9 2.5 0.0France 2.7 3.1 3.1 3.5 0.5 2.1 1.1 2.4 3.0 0.2 1.2 0.9 0.6Germany 1.8 0.9 1.7 0.0 0.7 0.6 0.4 1.2 0.0 1.0 -0.7 0.9 ..Greece .. .. 4.1 2.6 4.7 3.1 1.9 2.9 9.4 -4.5 1.7 -10.3 ..Hungary 1.5 1.2 5.2 6.4 5.5 4.0 3.6 1.7 -3.0 -1.8 -4.3 -4.0 ..Iceland .. .. .. .. .. .. .. .. .. .. .. .. ..Ireland .. .. .. .. 0.3 5.8 7.8 4.3 6.9 5.0 -2.0 -2.2 ..Israel .. .. .. .. .. .. .. .. .. .. .. .. ..Italy 1.5 0.1 3.0 1.2 0.5 0.9 0.6 0.9 1.0 -1.4 -3.0 -0.9 ..Japan -0.4 -0.9 -2.1 1.0 0.0 1.1 0.9 0.8 0.8 -1.2 1.3 2.5 ..Korea 2.8 0.4 0.9 3.4 4.9 4.7 2.3 2.6 2.7 1.3 1.6 4.1 0.9Luxembourg .. .. .. .. .. .. .. .. 4.0 4.2 1.4 .. ..Mexico .. .. .. .. .. 4.0 4.6 5.5 3.4 1.0 -7.7 4.1 ..Netherlands 2.1 2.2 5.6 -0.6 -2.5 0.6 -0.3 0.5 2.6 -0.3 -1.1 -0.1 -0.2New Zealand 7.8 -4.1 3.7 -0.5 8.4 5.8 2.4 2.1 .. .. .. .. ..Norway 2.5 3.8 0.0 8.0 4.6 3.3 7.8 -6.4 6.3 3.9 3.9 3.5 4.2Poland 3.5 1.7 4.1 -1.0 1.2 1.7 1.5 4.5 4.6 4.0 4.8 2.7 ..Portugal 6.6 3.6 1.6 1.0 0.3 1.7 0.7 -0.4 1.9 1.6 1.8 1.3 -4.6Slovak Republic -1.3 2.0 3.0 5.1 -0.7 3.9 6.2 3.4 9.1 5.0 2.2 3.2 ..Slovenia 3.5 4.5 4.6 3.2 0.6 3.9 4.1 3.2 4.5 2.7 -0.4 0.3 ..Spain .. .. 3.1 3.0 3.7 2.7 3.8 3.0 3.2 3.0 2.2 -4.6 ..Sweden 2.9 5.1 6.5 3.1 0.9 1.3 1.9 3.6 5.5 2.3 2.2 1.2 3.0Switzerland 3.0 2.7 2.9 -1.3 -0.8 2.3 2.2 3.7 4.1 0.1 1.5 1.8 ..Turkey .. .. .. .. .. .. .. .. .. .. .. .. ..United Kingdom 2.7 4.7 5.4 2.4 3.2 0.4 2.0 1.1 1.1 1.3 1.5 0.5 ..United States 3.1 4.8 2.5 3.6 2.9 3.1 1.4 4.0 2.0 2.7 -2.1 2.2 ..Euro area .. 1.7 2.8 1.4 1.0 1.6 1.3 1.7 2.1 0.4 -0.1 -0.6 -0.1EU27 .. 2.2 3.5 1.6 1.6 1.5 1.6 1.8 2.1 1.1 0.5 -0.4 -0.1OECD .. .. .. .. .. .. .. .. .. .. .. .. ..Brazil .. .. .. .. .. .. .. .. .. .. .. .. ..China .. .. .. .. .. .. .. .. .. .. .. .. ..India .. .. .. .. .. .. .. .. .. .. .. .. ..Indonesia .. .. .. .. .. .. .. .. .. .. .. .. ..Russian Federation .. .. .. .. 7.7 9.4 11.9 13.6 14.1 8.0 -1.4 .. ..South Africa 2.0 3.7 2.8 3.5 4.0 5.8 5.0 6.9 5.2 0.3 1.8 5.8 ..
Statlink http://dx.doi.org/10.1787/888932706926
Real household disposable incomeAverage annual growth in percentage
Statlink http://dx.doi.org/10.1787/888932706945
HOUSEHOLD INCOME AND WEALTH • INCOME AND SAVINGS
OECD Factbook 2013 © OECD 2012 - Preliminary Version
HOUSEHOLD SAVINGSHousehold saving is the main domestic source of fundsto finance capital investment, which is a major impetusfor long-term economic growth. Household saving ratesvary considerably between countries because ofinstitutional, demographic and socio-economicdifferences. For example, government provisions for old-age pensions and the demographic age structure of thepopulation will all influence the rate at whichpopulations save (older persons tend to run down theirfinancial assets during their retirement to the detrimentof saving). Equally the availability and price of credit, aswell as attitudes towards debt, may also influencechoices made by individuals regarding whether to spendor save.
DefinitionIn the national accounts, household saving is estimatedby subtracting household consumption expenditure fromhousehold disposable income plus the change in netequity of households in pension funds (since thiscomponent is also a determinant of householddisposable income but with an opposite sign).
Household disposable income consists essentially ofincome from employment and from the operation ofunincorporated enterprises, plus receipts of interest,dividends and social benefits minus payments of currenttaxes, interest and social contributions. Note thatenterprise income includes imputed rents “paid” byowner-occupiers of dwellings.
Household consumption expenditure consists mainly ofcash outlays for consumer goods and services but it alsoincludes the imputed expenditures that owner occupierspay, as occupiers, to themselves as owners of theirdwellings and the production of goods for own-final use
OverviewHousehold saving rates differ significantly acrosscountries. In 2011 or the most recent available year (2010in most cases), saving rates of above 10% were recordedin France, Germany, Slovenia, Switzerland and theRussian Federation. Savings rates were slightly negativein Denmark (minus 0.2%), whereas Greece reported anegative savings rate of 11.1% in 2010. Of the 27 countrieswhere data is available for 2010, more than two thirdssaw decreases in their savings rate compared to 2009.These differences are partly due to institutionaldifferences between countries. These include the extentto which old-age pensions are funded by governmentrather than through personal savings, and the extent towhich governments provide insurance against sicknessand unemployment. The age composition of thepopulation is also relevant, as the elderly tend to rundown financial assets acquired during their working life.This implies that a country with a high share of retiredpersons will usually have a low household saving rate.Considering the years covered in the graph, householdsaving rates in Japan decreased markedly in 2001, with amuch more moderate decrease in the following years.Saving rates have also decreased in Canada, although to amuch lesser extent. Rates have remained broadly stablein Germany and France, at rather high levels of 10-12%and 11-13%, respectively. The United States saw a ratherstable development of its household saving rate in theperiod 1999-2007; after that year, the household savingrate started to pick up and is now above 5%.
such as agricultural products - the values of which arealso included in income.
The household saving rate is calculated as the ratio ofhousehold saving to household disposable income.
ComparabilityAll countries compile data according to the 1993 SNA“System of National Accounts, 1993” with the exceptionof Australia where data are compiled according to thenew 2008 SNA. It’s important to note however thatdifferences between the 2008 SNA and the 1993 SNA donot have a significant impact of the comparability of theindicators presented here and this implies that data arehighly comparable across countries.
Saving rates may be measured on either a net or a grossbasis. Net saving rates are measured after deductingconsumption of fixed capital (in respect of assets used inunincorporated enterprises and in respect of owner-occupied dwellings), from saving and from thedisposable income of households, so that both savingand disposable income are shown on a net basis.
Most countries publish ratios on a net basis. Howeversome countries publish these ratios on a gross basis;which causes an upward bias compared to net ratios.
Sources• OECD (2012), National Accounts of OECD Countries,
OECD Publishing.Further informationAnalytical publications• Fournier, J. and I. Koske (2010), “A Simple Model of
the Relationship between Productivity, Saving andthe Current Account”,OECD Economics Department Working Papers, No. 816.
• Harvey, R. (2004), “Comparison of Household SavingRatios: Euro Area/United States/Japan”, OECDStatistics Brief, No. 8, June,www.oecd.org/std/statisticsbrief.
• Hüfner, F. and I. Koske (2010), “ExplainingHousehold Saving Rates in G7 Countries:Implications for Germany”,OECD Economics Department Working Papers, No. 754.
• de Laiglesia, J. and C. Morrison (2008), “HouseholdStructures and Savings: Evidence from HouseholdSurveys”, OECD Development Centre Working Papers,No. 267.
Statistical publications• OECD (2011), National Accounts at a Glance, OECD
Publishing.
Websites• OECD Economic Outlook – Sources and Methods,
www.oecd.org/eco/sources-and-methods.
HOUSEHOLD INCOME AND WEALTH • INCOME AND SAVINGS
OECD Factbook 2013 © OECD 2012 - Preliminary Version

Household net saving ratesAs a percentage of household disposable income
1999 2000 2001 2002 2003 2004 2005 2006 2007 2008 2009 2010 2011Australia 2.8 2.6 2.6 0.2 -0.9 -1.5 0.4 1.3 0.5 4.5 8.9 9.2 ..Austria 10.0 9.4 7.6 8.0 8.8 9.2 9.7 10.4 11.7 11.5 10.7 8.3 ..Belgium 13.2 12.5 13.8 13.1 12.3 10.7 9.9 10.7 11.4 11.5 13.3 10.1 8.8Canada 4.1 4.8 5.3 3.5 2.7 3.2 2.2 3.6 2.9 4.0 4.7 4.9 ..Chile 6.8 6.1 6.6 6.4 6.1 6.8 6.7 7.3 7.3 6.0 10.9 8.1 ..Czech Republic 4.7 5.8 5.2 5.2 4.1 2.9 4.8 6.1 5.7 4.8 6.1 5.7 ..Denmark -5.6 -4.0 2.1 2.1 2.4 -1.3 -4.2 -2.3 -4.0 -3.7 -0.4 -0.2 -0.2Estonia -5.4 -3.0 -4.0 -6.4 -7.1 -12.8 -10.8 -13.1 -8.2 -2.6 5.7 3.7 ..Finland 2.4 0.5 0.3 0.4 1.4 2.7 0.9 -1.1 -0.9 -0.3 4.2 3.3 ..France 11.3 11.0 11.7 13.0 11.9 12.2 11.1 11.2 11.7 11.7 12.6 12.1 12.3Germany 9.6 9.4 9.5 10.1 10.4 10.6 10.7 10.8 11.0 11.7 11.1 11.3 ..Greece .. -4.5 -5.5 -7.6 -6.2 -6.9 -1.7 -3.1 2.2 -6.5 -3.4 -11.1 ..Hungary 7.8 6.2 6.7 5.3 2.9 5.4 6.7 7.2 3.3 2.7 4.5 2.5 ..Iceland .. .. .. .. .. .. .. .. .. .. .. .. ..Ireland .. .. .. 0.4 -0.6 0.9 1.7 -0.9 -0.1 5.5 10.1 8.9 ..Israel .. .. .. .. .. .. .. .. .. .. .. .. ..Italy 10.0 7.9 10.0 10.8 10.3 10.5 10.2 9.5 8.9 8.5 6.9 5.1 ..Japan 10.2 8.8 3.8 3.3 2.7 2.3 1.6 1.3 1.1 0.5 2.3 2.3 ..Korea 16.1 9.3 5.2 0.4 5.2 9.2 7.2 5.2 2.9 2.9 4.6 4.3 3.1Luxembourg .. .. .. .. .. .. .. 3.8 4.3 5.0 6.4 .. ..Mexico .. .. .. .. 11.4 10.1 10.1 10.1 9.6 8.9 8.9 8.4 ..Netherlands 9.0 6.9 9.7 8.7 7.6 7.4 6.4 6.1 6.9 5.9 5.6 3.4 5.0New Zealand 1.0 -4.6 -3.6 -9.1 -6.9 -5.6 -7.6 -8.0 .. .. .. .. ..Norway 4.7 4.3 3.1 8.2 8.8 6.9 9.6 -0.5 0.8 3.4 6.6 6.1 8.0Poland 10.5 10.0 11.9 8.3 7.7 5.5 5.9 6.1 4.6 -0.3 6.8 6.4 ..Portugal 3.9 3.8 3.8 3.3 3.6 2.8 2.7 0.4 -0.7 -0.8 3.2 2.4 1.8Slovak Republic 6.2 6.0 3.8 3.3 1.1 0.3 1.1 0.1 2.2 1.1 .. .. ..Slovenia 4.5 7.8 9.8 10.5 8.2 9.5 11.2 11.7 10.3 9.4 9.1 10.0 ..Spain .. 6.1 5.9 5.8 6.7 5.2 4.8 3.9 4.0 7.5 13.0 7.7 ..Sweden 1.6 3.1 7.3 7.1 5.9 4.7 4.0 4.9 7.2 8.9 11.2 8.5 ..Switzerland 10.6 10.6 11.2 9.9 8.6 8.0 8.8 10.7 12.5 11.7 11.4 11.3 ..Turkey .. .. .. .. .. .. .. .. .. .. .. .. ..United Kingdom 0.9 0.1 1.6 -0.1 0.3 -1.7 -1.5 -2.5 -3.1 -1.8 3.1 2.7 ..United States 3.2 3.0 2.8 3.7 3.8 3.5 1.7 2.7 2.4 5.5 5.3 5.5 ..Euro area 9.2 8.2 8.9 9.4 9.2 9.2 8.6 8.2 8.6 8.7 9.7 8.2 7.9EU27 7.2 6.3 7.3 7.1 6.9 6.3 6.0 5.6 5.5 5.9 8.1 6.7 6.1OECD .. .. .. .. .. .. .. .. .. .. .. .. ..Brazil .. .. .. .. .. .. .. .. .. .. .. .. ..China .. .. .. .. .. .. .. .. .. .. .. .. ..India .. .. .. .. .. .. .. .. .. .. .. .. ..Indonesia .. .. .. .. .. .. .. .. .. .. .. .. ..Russian Federation .. .. .. .. .. .. 11.0 12.4 12.1 10.1 13.6 .. ..South Africa 1.2 1.0 0.4 0.7 0.6 0.4 0.1 -0.8 -1.2 -1.1 -0.7 -0.3 -0.1
Statlink http://dx.doi.org/10.1787/888932706983
Household net saving ratesAs a percentage of household disposable income
Statlink http://dx.doi.org/10.1787/888932707002
HOUSEHOLD INCOME AND WEALTH • INCOME AND SAVINGS
OECD Factbook 2013 © OECD 2012 - Preliminary Version

INCOME INEQUALITYIncome inequalities are one of the most visiblemanifestations of differences in living standards withineach country. High income inequalities typically imply awaste of human resources, in the form of a large share ofthe population out of work or trapped in low-paid andlow-skilled jobs.
DefinitionIncome is defined as household disposable income in aparticular year. It consists of earnings, self-employmentand capital income and public cash transfers; incometaxes and social security contributions paid byhouseholds are deducted. The income of the householdis attributed to each of its members, with an adjustmentto reflect differences in needs for households of differentsizes (i.e. the needs of a household composed of fourpeople are assumed to be twice as large as those of aperson living alone).
Income inequality among individuals is measured hereby four indicators. The Gini coefficient is based on thecomparison of cumulative proportions of the populationagainst cumulative proportions of income they receive,and it ranges between 0 in the case of perfect equalityand 1 in the case of perfect inequality. The P90/P10 ratiois the ratio of the upper bound value of the ninth decile(i.e. the 10% of people with highest income) to that of thefirst decile; the P90/P50 ratio is the ratio of the upperbound value of the ninth decile to the median income;and the P50/P10 ratio is the ratio of median income to theupper bound value of the first decile.
ComparabilityData used here were provided by national expertsapplying common methodologies and standardiseddefinitions. In many cases, experts have made severaladjustments to their source data to conform tostandardised definitions. While this approach improvescomparability, full standardisation cannot be achieved.Also, small differences between periods and acrosscountries are usually not significant.
OverviewThere is considerable variation in income inequalityacross OECD countries. Inequality as measured by theGini coefficient is lowest in Slovenia, Denmark andNorway and highest in Chile, Mexico and Turkey. It isabove-average in Israel, Portugal and the United States,and below-average in the remaining Nordic and manyContinental European countries. The Gini coefficient forthe most unequal country (Chile) is double the value ofthe most equal country (Slovenia). Overall, the differentmeasures of income inequalities provide similar rankingacross countries.From the mid-1980s to the late-2000s, inequality rose in15 out of 19 countries for which longer-run data areavailable. The increase was strongest in Finland,New Zealand and Sweden. Declines occurred in France,Greece, and Turkey. Income inequality generally rosefaster from the mid-1980s to the mid-1990s than in thefollowing period.With measurement-related differences in mind, non-OECD countries have higher levels of income inequalitythan OECD countries, particularly in Brazil and SouthAfrica.
Results refer to different years. “Late-2000s” data refer tothe income in 2008 in all countries except Japan (2006);Denmark, Hungary and Turkey (2007); and Chile (2009).“Mid-1990s” data refer to the income earned between1993 and 1996. “Mid-1980s” data refer to the incomeearned between 1983 and 1987 in all countries for whichdata are available except Greece (1988); Portugal (1990);and the Czech Republic (1992). “Mid-1980s” data refer tothe western Lander of Germany. “Late-2000s” data forAustria, Belgium, Ireland, Portugal and Spain are basedon EU-SILC and are not deemed to be fully comparablewith those for earlier years.
For non-OECD countries, 2008/9 Gini coefficients are notstrictly comparable with OECD countries as they arebased on per capita incomes except India and Indonesiafor which per capita consumption was used.
Sources• OECD (2011),
Divided We Stand: Why Inequality Keeps Rising, OECDPublishing.
Further informationAnalytical publications• OECD (2011), How’s Life? Measuring Well-being, OECD
Publishing.• OECD (2011),
Society at a Glance: OECD Social Indicators, OECDPublishing.
• OECD(2010), Tackling Inequalities in Brazil, China, India andSouth Africa: The Role of Labour Market and SocialPolicies, OECD Publishing.
• OECD (2008),Growing Unequal?: Income Distribution and Poverty inOECD Countries, OECD Publishing.
Websites• OECD Income Distribution and Poverty,
www.oecd.org/els/social/inequality.• OECD Social and Welfare Statistics,
www.oecd.org/social/statistics.
HOUSEHOLD INCOME AND WEALTH • INCOME INEQUALITY AND POVERTY
OECD Factbook 2013 © OECD 2012 - Preliminary Version
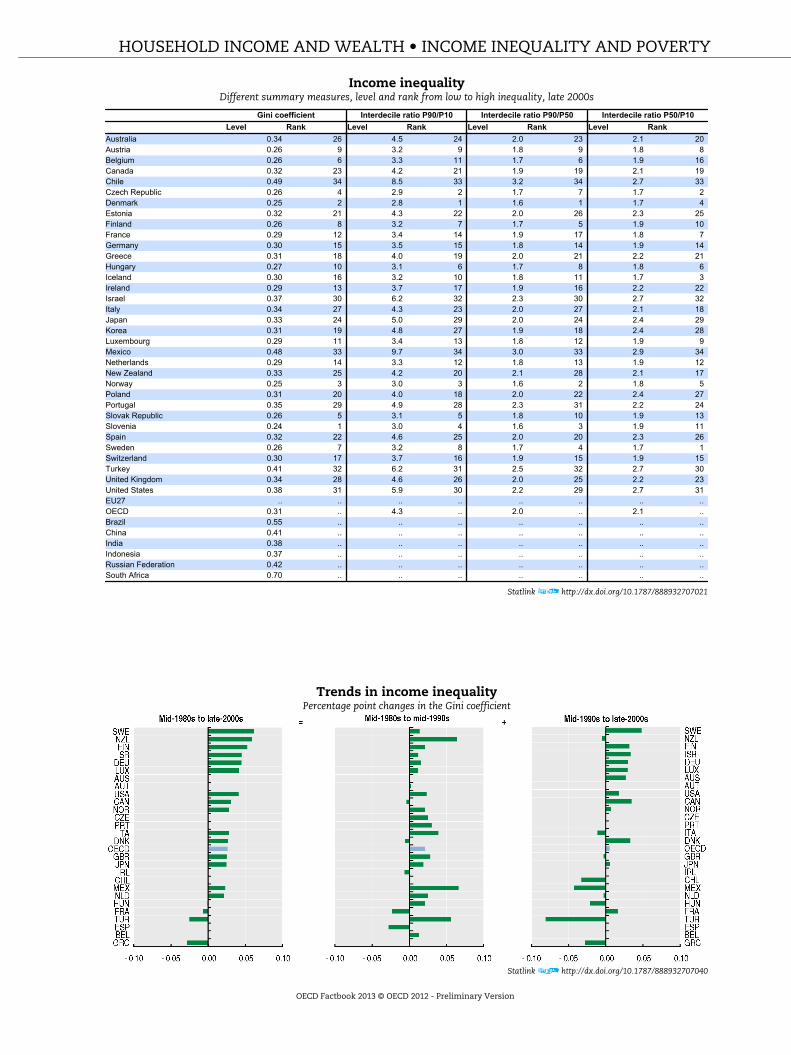
Income inequalityDifferent summary measures, level and rank from low to high inequality, late 2000s
Gini coefficient Interdecile ratio P90/P10 Interdecile ratio P90/P50 Interdecile ratio P50/P10Level Rank Level Rank Level Rank Level Rank
Australia 0.34 26 4.5 24 2.0 23 2.1 20Austria 0.26 9 3.2 9 1.8 9 1.8 8Belgium 0.26 6 3.3 11 1.7 6 1.9 16Canada 0.32 23 4.2 21 1.9 19 2.1 19Chile 0.49 34 8.5 33 3.2 34 2.7 33Czech Republic 0.26 4 2.9 2 1.7 7 1.7 2Denmark 0.25 2 2.8 1 1.6 1 1.7 4Estonia 0.32 21 4.3 22 2.0 26 2.3 25Finland 0.26 8 3.2 7 1.7 5 1.9 10France 0.29 12 3.4 14 1.9 17 1.8 7Germany 0.30 15 3.5 15 1.8 14 1.9 14Greece 0.31 18 4.0 19 2.0 21 2.2 21Hungary 0.27 10 3.1 6 1.7 8 1.8 6Iceland 0.30 16 3.2 10 1.8 11 1.7 3Ireland 0.29 13 3.7 17 1.9 16 2.2 22Israel 0.37 30 6.2 32 2.3 30 2.7 32Italy 0.34 27 4.3 23 2.0 27 2.1 18Japan 0.33 24 5.0 29 2.0 24 2.4 29Korea 0.31 19 4.8 27 1.9 18 2.4 28Luxembourg 0.29 11 3.4 13 1.8 12 1.9 9Mexico 0.48 33 9.7 34 3.0 33 2.9 34Netherlands 0.29 14 3.3 12 1.8 13 1.9 12New Zealand 0.33 25 4.2 20 2.1 28 2.1 17Norway 0.25 3 3.0 3 1.6 2 1.8 5Poland 0.31 20 4.0 18 2.0 22 2.4 27Portugal 0.35 29 4.9 28 2.3 31 2.2 24Slovak Republic 0.26 5 3.1 5 1.8 10 1.9 13Slovenia 0.24 1 3.0 4 1.6 3 1.9 11Spain 0.32 22 4.6 25 2.0 20 2.3 26Sweden 0.26 7 3.2 8 1.7 4 1.7 1Switzerland 0.30 17 3.7 16 1.9 15 1.9 15Turkey 0.41 32 6.2 31 2.5 32 2.7 30United Kingdom 0.34 28 4.6 26 2.0 25 2.2 23United States 0.38 31 5.9 30 2.2 29 2.7 31EU27 .. .. .. .. .. .. .. ..OECD 0.31 .. 4.3 .. 2.0 .. 2.1 ..Brazil 0.55 .. .. .. .. .. .. ..China 0.41 .. .. .. .. .. .. ..India 0.38 .. .. .. .. .. .. ..Indonesia 0.37 .. .. .. .. .. .. ..Russian Federation 0.42 .. .. .. .. .. .. ..South Africa 0.70 .. .. .. .. .. .. ..
Statlink http://dx.doi.org/10.1787/888932707021
Trends in income inequalityPercentage point changes in the Gini coefficient
Statlink http://dx.doi.org/10.1787/888932707040
HOUSEHOLD INCOME AND WEALTH • INCOME INEQUALITY AND POVERTY
OECD Factbook 2013 © OECD 2012 - Preliminary Version
POVERTY RATES AND GAPSAvoiding economic hardship is a primary objective ofsocial policy. As perceptions of “a decent standard ofliving” vary across countries and over time, nocommonly agreed measure of “absolute” poverty acrossOECD countries exists. A starting point for measuringpoverty is therefore to look at “relative” poverty, whosemeasure is based on the income that is most typical ineach country in each year.
DefinitionRelative income poverty is measured here by the povertyrate and the poverty gap. The poverty rate is the ratio ofthe number of people whose income falls below thepoverty line and the total population; the poverty line ishere taken as half the median household income.However, two countries with the same poverty rates maydiffer in terms of the relative income-level of the poor.To measure this dimension, the poverty gap, i.e. thepercentage by which the mean income of the poor fallsbelow the poverty line, is also presented.
Income is defined as household disposable income in aparticular year. It consists of earnings, self-employmentand capital income and public cash transfers; incometaxes and social security contributions paid byhouseholds are deducted. The income of the householdis attributed to each of its members, with an adjustmentto reflect differences in needs for households of differentsizes (i.e. the needs of a household composed of fourpeople are assumed to be twice as large as those of aperson living alone).
ComparabilityData used here were provided by national expertsapplying common methodologies and standardiseddefinitions. In many cases, experts have made severaladjustments to their source data to conform tostandardised definitions. While this approach improvescomparability, full standardisation cannot be achieved.Also, small differences between periods and acrosscountries are usually not significant.
Measurement problems are especially severe at thebottom end of the income scale. Further, as largeproportions of the population are clustered around the
OverviewAcross OECD countries, the average poverty rate wasabout 11% in the late-2000s. There is considerablediversity across countries: poverty rates are 20% or morein Israel and Mexico, but below 7% in the Czech Republic,Denmark, Hungary and Iceland. On average, in OECDcountries, the mean income of poor people is 27% belowthe poverty line (poverty gap), with larger gaps inKorea, Mexico, Spain and the United States and lowerones in Belgium, Luxembourg, Finland and theNetherlands. In general, countries with higher povertyrates also have higher poverty gaps but this is notuniversal; for example Norway combines low povertyrates and high poverty gaps, while the opposite occurs inEstonia.From the mid-1980s to the late-2000s, poverty rates rosein 16 out of 19 countries for which longer-run data areavailable, resulting in an overall increase of 2 percentagepoints for the OECD as a whole. The largest risewas experienced by Israel, and the largest declinewas registered in Greece.
poverty line used here, small changes in their incomecan lead to large swings in poverty measures. Smalldifferences between periods and across countries areusually not significant.
Results refer to different years. “Late-2000s” data refer tothe income in 2008 in all countries except Japan (2006);Denmark, Hungary and Turkey (2007); and Chile (2009).“Mid-1990s” data refer to the income earned between1993 and 1996. “Mid-1980s” data refer to the incomeearned between 1983 and 1987 in all countries for whichdata are available except Greece (1988); Portugal (1990);and the Czech Republic (1992). “Mid-1980s” data refer tothe western Lander of Germany. “Late-2000s” data forAustria, Belgium, Ireland, Portugal and Spain are basedon EU-SILC which are not deemed to be fully comparablewith those for earlier years.
Sources• OECD (2011),
Divided We Stand: Why Inequality Keeps Rising, OECDPublishing.
Further informationAnalytical publications• OECD (2011), How’s Life? Measuring Well-being, OECD
Publishing.• OECD (2011),
Society at a Glance: OECD Social Indicators, OECDPublishing.
• OECD (2008),Growing Unequal?: Income Distribution and Poverty inOECD Countries, OECD Publishing.
• Atkinson, A.B., and A. Brandolini (2004),“Global World Income Inequality: Absolute, Relative orIntermediate?”, paper presented at the 28th GeneralConference of the International Association forResearch in Income and Wealth, Cork, 22-28 August.
• Förster, M. (1994), “Measurement of Low Incomesand Poverty in a Perspective of InternationalComparisons”,OECD Labour Market and Social Policy OccasionalPapers, No. 14.
Websites• OECD Social and Welfare Statistics,
www.oecd.org/social/statistics.• OECD Income Distribution and Poverty,
www.oecd.org/els/social/inequality.
HOUSEHOLD INCOME AND WEALTH • INCOME INEQUALITY AND POVERTY
OECD Factbook 2013 © OECD 2012 - Preliminary Version

Poverty rates and poverty gapsLate-2000s
Statlink http://dx.doi.org/10.1787/888932707059
Trends in poverty ratesPercentage point changes in income poverty rate at 50% median level
Statlink http://dx.doi.org/10.1787/888932707078
HOUSEHOLD INCOME AND WEALTH • INCOME INEQUALITY AND POVERTY
OECD Factbook 2013 © OECD 2012 - Preliminary Version
HOUSEHOLD FINANCIAL ASSETSAlong with income, wealth is the central measure ofhouseholds’ economic resources. Households hold bothnon-financial and financial wealth. The structure offinancial assets affects households financial risks asdifferent types of securities carry different risk levels.
The data presented show the composition of the mostrelevant financial assets (currency and deposits,securities, shares, and technical reserves) for householdsand non-profit institutions serving households (NPISHs).
DefinitionThis set of indicators shows the share of each financialasset category according to the 1993 System of NationalAccounts (currency and deposits; securities other thanshares, except financial derivatives; shares and otherequity, except mutual fund shares; mutual fund shares;net equity of households in life insurance reserves; and,net equity of households in pension funds) in the totalfinancial assets of the households and NPISHs sector. Itexcludes financial derivatives, loans and other accountsreceivable.
The financial assets are classified according to theirliquidity.
ComparabilityAs a number of OECD countries are not able to provide abreakdown between households and NPISHs, householddebt refers to the aggregated sector “Households andNPISHs” to ensure the highest level of comparabilitybetween countries.
OverviewThe comparison of the structure of households’ stocks offinancial assets between 2007 and 2010 gives someinsight into the impact of recent economic developmentson the restructuring of their portfolio towards financialinstruments better adapted to the new environment, i.e.more liquid and less risky. The increase in the share ofcurrency and deposits in almost all OECD countries isnoticeable, with a significant rise in Greece (from 52% in2007 to 77% in 2010). Also the share of life insurance andpension funds assets increased in a large number ofOECD countries. On the other hand, shares became lesspopular in most OECD countries, the largest fall beingobserved in Greece (from 28% to 8%), followed by Spain(31% to 24%), Poland (31% to 20%), and Slovenia (28% to21%).Considerable differences in national preferences forfinancial instruments can be observed across the OECD.Currency and deposits, the most liquid of the assetcategories and also considered the one with the least risk,represents more than 50% in six OECD countries (theCzech Republic, Greece, Japan, Luxembourg, the SlovakRepublic and Slovenia) in 2010. The proportion ofsecurities held by households is low in most OECDcountries in 2010 with the exception of Mexico (37% in2009) and Italy (20%). Furthermore, despite the financialcrisis, shares remained a predominant portfolio assetheld by households in for example Estonia (67%), Mexico(39% in 2009) and the United States (32%). Householdreserves in life insurance and pension funds representedmore than half of the stock of total financial assets inChile (60%), the Netherlands (59%), Australia (59%) andthe United Kingdom (52%), whereas they remained at avery low level in Greece (3%) and Estonia (5%).
International comparability may be hampered bydifferences in the way pension systems are organisedand operated in the various countries. In countries withhighly funded pension systems, more pension reserveswill be recognised and recorded as part of the assets ofhouseholds.
It should be noted that any changes in the stocks offinancial assets over a period are the result of twocomponents: net acquisitions of financial assets andchanges in valuations (holding gains and lossesdepending on the performance of financial markets), ofwhich those for quoted shares are the most relevant.
In the graph, 2011 data are shown for Belgium, Canada,Chile, Denmark, Greece, Korea, the Netherlands, Norway,Portugal, Slovenia, Spain, the United Kingdom and theUnited States.
Sources• OECD (2012),“Financial Balance Sheets”,
OECD National Accounts Statistics (database).Further informationAnalytical publications• Babeau, A. and T. Sbano (2003), “Household Wealth
in the National Accounts of Europe, the UnitedStates and Japan”, OECD Statistics Working Papers,No. 2003/02.
• OECD (2012), OECD Economic Outlook, OECDPublishing.
• Ynesta, I. (2009), “Households’ wealth compositionacross OECD countries and financial risks borne byhouseholds”, OECD Journal: Financial Market Trends,Vol. 2008/2.
Statistical publications• OECD (2012),
National Accounts of OECD Countries, FinancialAccounts, OECD Publishing.
• OECD (2012),National Accounts of OECD Countries, Financial BalanceSheets, OECD Publishing.
• OECD (2011), National Accounts at a Glance, OECDPublishing.
Methodological publications• Lequiller, F. and D. Blades (2007),
Understanding National Accounts, OECD Publishing.• OECD et al. (2009), System of National Accounts, United
Nations, New York.
Online databases• OECD National Accounts Statistics.
Websites• Financial statistics,
www.oecd.org/std/financialstatistics.
HOUSEHOLD INCOME AND WEALTH • HOUSEHOLD WEALTH
OECD Factbook 2013 © OECD 2012 - Preliminary Version
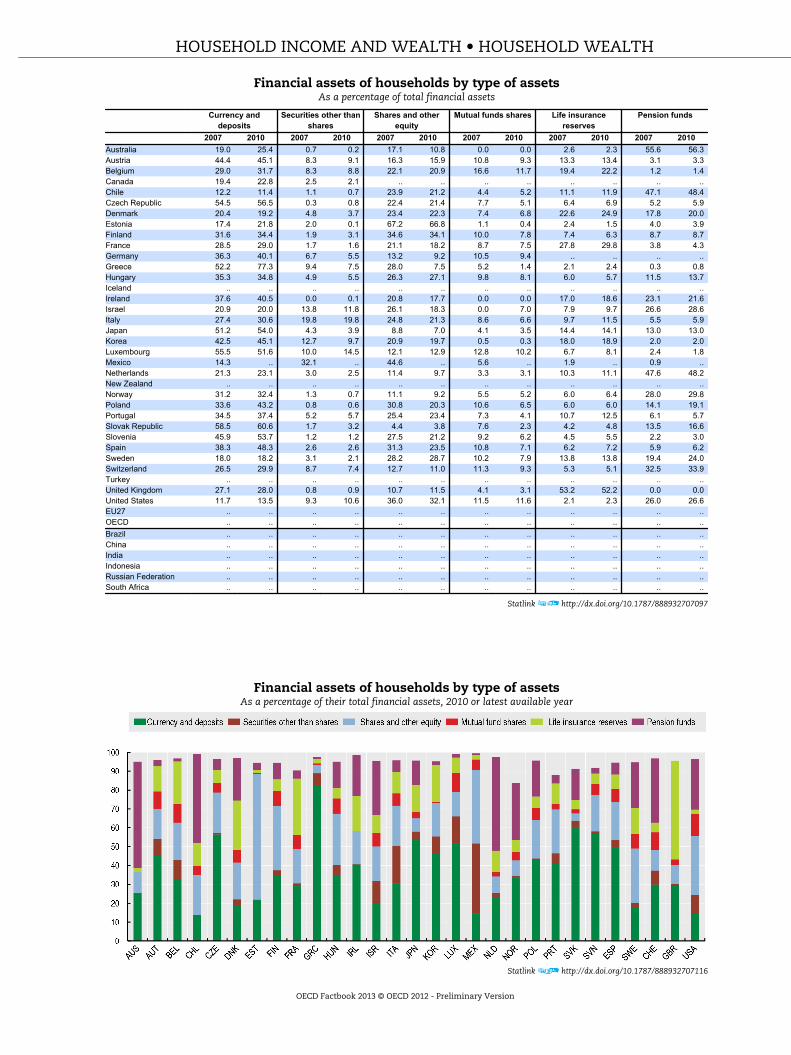
Financial assets of households by type of assetsAs a percentage of total financial assets
Currency anddeposits
Securities other thanshares
Shares and otherequity
Mutual funds shares Life insurancereserves
Pension funds
2007 2010 2007 2010 2007 2010 2007 2010 2007 2010 2007 2010Australia 19.0 25.4 0.7 0.2 17.1 10.8 0.0 0.0 2.6 2.3 55.6 56.3Austria 44.4 45.1 8.3 9.1 16.3 15.9 10.8 9.3 13.3 13.4 3.1 3.3Belgium 29.0 31.7 8.3 8.8 22.1 20.9 16.6 11.7 19.4 22.2 1.2 1.4Canada 19.4 22.8 2.5 2.1 .. .. .. .. .. .. .. ..Chile 12.2 11.4 1.1 0.7 23.9 21.2 4.4 5.2 11.1 11.9 47.1 48.4Czech Republic 54.5 56.5 0.3 0.8 22.4 21.4 7.7 5.1 6.4 6.9 5.2 5.9Denmark 20.4 19.2 4.8 3.7 23.4 22.3 7.4 6.8 22.6 24.9 17.8 20.0Estonia 17.4 21.8 2.0 0.1 67.2 66.8 1.1 0.4 2.4 1.5 4.0 3.9Finland 31.6 34.4 1.9 3.1 34.6 34.1 10.0 7.8 7.4 6.3 8.7 8.7France 28.5 29.0 1.7 1.6 21.1 18.2 8.7 7.5 27.8 29.8 3.8 4.3Germany 36.3 40.1 6.7 5.5 13.2 9.2 10.5 9.4 .. .. .. ..Greece 52.2 77.3 9.4 7.5 28.0 7.5 5.2 1.4 2.1 2.4 0.3 0.8Hungary 35.3 34.8 4.9 5.5 26.3 27.1 9.8 8.1 6.0 5.7 11.5 13.7Iceland .. .. .. .. .. .. .. .. .. .. .. ..Ireland 37.6 40.5 0.0 0.1 20.8 17.7 0.0 0.0 17.0 18.6 23.1 21.6Israel 20.9 20.0 13.8 11.8 26.1 18.3 0.0 7.0 7.9 9.7 26.6 28.6Italy 27.4 30.6 19.8 19.8 24.8 21.3 8.6 6.6 9.7 11.5 5.5 5.9Japan 51.2 54.0 4.3 3.9 8.8 7.0 4.1 3.5 14.4 14.1 13.0 13.0Korea 42.5 45.1 12.7 9.7 20.9 19.7 0.5 0.3 18.0 18.9 2.0 2.0Luxembourg 55.5 51.6 10.0 14.5 12.1 12.9 12.8 10.2 6.7 8.1 2.4 1.8Mexico 14.3 .. 32.1 .. 44.6 .. 5.6 .. 1.9 .. 0.9 ..Netherlands 21.3 23.1 3.0 2.5 11.4 9.7 3.3 3.1 10.3 11.1 47.6 48.2New Zealand .. .. .. .. .. .. .. .. .. .. .. ..Norway 31.2 32.4 1.3 0.7 11.1 9.2 5.5 5.2 6.0 6.4 28.0 29.8Poland 33.6 43.2 0.8 0.6 30.8 20.3 10.6 6.5 6.0 6.0 14.1 19.1Portugal 34.5 37.4 5.2 5.7 25.4 23.4 7.3 4.1 10.7 12.5 6.1 5.7Slovak Republic 58.5 60.6 1.7 3.2 4.4 3.8 7.6 2.3 4.2 4.8 13.5 16.6Slovenia 45.9 53.7 1.2 1.2 27.5 21.2 9.2 6.2 4.5 5.5 2.2 3.0Spain 38.3 48.3 2.6 2.6 31.3 23.5 10.8 7.1 6.2 7.2 5.9 6.2Sweden 18.0 18.2 3.1 2.1 28.2 28.7 10.2 7.9 13.8 13.8 19.4 24.0Switzerland 26.5 29.9 8.7 7.4 12.7 11.0 11.3 9.3 5.3 5.1 32.5 33.9Turkey .. .. .. .. .. .. .. .. .. .. .. ..United Kingdom 27.1 28.0 0.8 0.9 10.7 11.5 4.1 3.1 53.2 52.2 0.0 0.0United States 11.7 13.5 9.3 10.6 36.0 32.1 11.5 11.6 2.1 2.3 26.0 26.6EU27 .. .. .. .. .. .. .. .. .. .. .. ..OECD .. .. .. .. .. .. .. .. .. .. .. ..Brazil .. .. .. .. .. .. .. .. .. .. .. ..China .. .. .. .. .. .. .. .. .. .. .. ..India .. .. .. .. .. .. .. .. .. .. .. ..Indonesia .. .. .. .. .. .. .. .. .. .. .. ..Russian Federation .. .. .. .. .. .. .. .. .. .. .. ..South Africa .. .. .. .. .. .. .. .. .. .. .. ..
Statlink http://dx.doi.org/10.1787/888932707097
Financial assets of households by type of assetsAs a percentage of their total financial assets, 2010 or latest available year
Statlink http://dx.doi.org/10.1787/888932707116
HOUSEHOLD INCOME AND WEALTH • HOUSEHOLD WEALTH
OECD Factbook 2013 © OECD 2012 - Preliminary Version
HOUSEHOLD DEBTThis household leverage ratio measures theindebtedness of households in relation with theirincome, that is their spending and saving capacity. Highleverage ratios are often interpreted as a sign of financialvulnerability though not only debt and liabilities but alsoassets should be considered in such an assessment. Highindebtedness levels generally increase the financingcosts of the borrower, deteriorate balance sheet positionsand may restrict access to new financing.
The household debt-to-GDI ratio shows the debt ofhouseholds and non-profit institutions servinghouseholds (NPISHs), as a percentage of their GrossDisposable Income (GDI).
DefinitionDebt is a commonly used concept, defined as a specificsubset of liabilities identified according to the types offinancial instruments included or excluded. Generally,debt is defined as all liabilities that require payment orpayments of interest or principal by the debtor to thecreditor at a date or dates in the future.
Consequently, all debt instruments are liabilities, butsome liabilities such as shares, equity and financialderivatives are not considered as debt. Debt is thusobtained as the sum of the following liability categories(according to the 1993 System of National Accounts),whenever available/applicable in the financial balancesheet of the households and NPISHs sector: currency anddeposits; securities other than shares, except financialderivatives; loans; insurance technical reserves; andother accounts payable. For the households sector,liabilities predominantly consist of loans, and moreparticularly mortgage loans for the purchase of houses.
OverviewHouseholds remain highly indebted in a large number ofOECD economies. In 2010, the ratio of household debt togross disposable income (GDI) is far higher than theaverage of OECD countries, in Denmark, the Netherlands,Ireland and Norway, with respectively 309.5%, 277.3%,217.8% and 196.3%. On the other hand, Mexico has thelowest debt ratio at 9.4% in 2009.The level of household debt rose in most OECD countriesover the period 2007-10. As a percentage of GDI, theNetherlands and Greece recorded the largest increasesduring this period (respectively around 35 and 21percentage points). Hungary, Poland and the SlovakRepublic showed increases of 18 percentage points. A netfall was observed in the United Kingdom (minus 15percentage points) and the United States (minus 14percentage points), and to a (far) lesser extent inGermany, Norway, Spain and Japan.According to the most recent figures, long-term loans,mainly consisting of mortgage loans, remain the largestcomponent of household debt, contributing more than80% of the total household debt in twenty OECD countriesand even more than 90% in eleven countries. The highestlevel was recorded in Luxembourg (96% in 2010) and thelowest ratios were observed in the Slovak Republic (61%),and Italy (70%). In the Netherlands, the contribution oflong-term loans to the total household debt, whiledecreasing since 2007, is still above 92%. The sametendency can be observed since 2008 in two othercountries (Estonia and the United States at around 90%and 73% respectively).
According to the 1993 SNA, most debt instruments arevalued at market prices.
When going into details regarding the causes of changesin OECD countries, two elements have to be taken intoaccount: the variation due to the change in outstandingdebt, the ratio’s numerator, and that caused by the risein disposable income, its denominator. Thus, a reductionin the debt ratio during the deleveraging phase can beattributed to an improved GDI or to a reduced debt, inparticular consumer credit and mortgage loans.
ComparabilityAs a number of OECD countries are not able to provide abreakdown between households and NPISHs, householddebt refers to the aggregated sector “Households andNPISHs” to ensure the highest level of comparabilitybetween countries.
Sources• OECD (2012), National Accounts of OECD Countries,
OECD Publishing.Further informationAnalytical publications• Girouard, N., M. Kennedy and C. André (2006), “Has
the Rise in Debt Made Households MoreVulnerable?”,OECD Economics Department Working Papers, No. 535,OECD Publishing.
• OECD (2012), Economic Policy Reforms, OECDPublishing.
• OECD (2012), OECD Economic Outlook, OECDPublishing.
• OECD (2012), OECD Economic Surveys, OECDPublishing.
• Sebastian Schich and Jung-Hyun Ahn (2007),“Housing Markets and Household Debt: Short-termand Long-term Risks”, Financial Market Trends, Vol.2007/1.
• Isabelle Ynesta (2009), “Households’ wealthcomposition across OECD countries and financialrisks borne by households”,OECD Journal: Financial Market Trends, Vol. 2008/2.
Statistical publications• OECD (2012), Quarterly National Accounts, OECD
Publishing.• OECD (2011), National Accounts at a Glance, OECD
Publishing.
Methodological publications• OECD (2000),
System of National Accounts, 1993 - Glossary, OECDPublishing.
• United Nations, OECD, International Monetary Fundand Eurostat (eds.) (2010),System of National Accounts 2008, United Nations,Geneva.
Online databases• OECD National Accounts Statistics.
Websites• National accounts,
www.oecd.org/std/nationalaccounts.
HOUSEHOLD INCOME AND WEALTH • HOUSEHOLD WEALTH
OECD Factbook 2013 © OECD 2012 - Preliminary Version
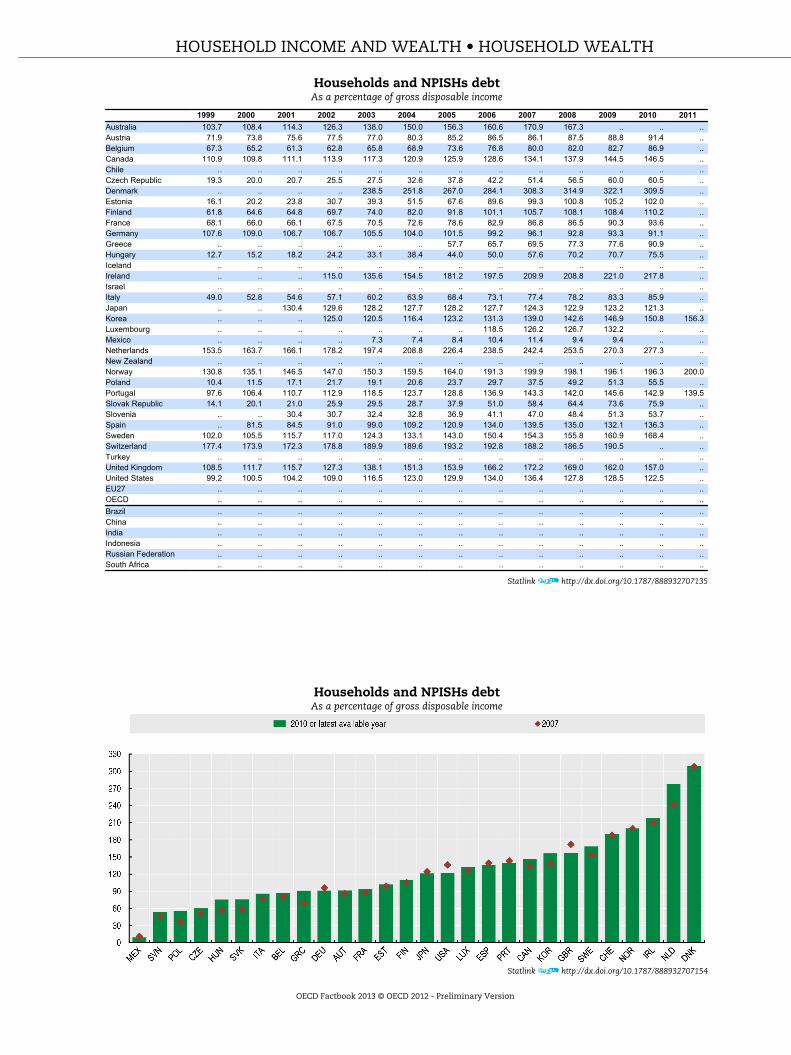
Households and NPISHs debtAs a percentage of gross disposable income
1999 2000 2001 2002 2003 2004 2005 2006 2007 2008 2009 2010 2011Australia 103.7 108.4 114.3 126.3 138.0 150.0 156.3 160.6 170.9 167.3 .. .. ..Austria 71.9 73.8 75.6 77.5 77.0 80.3 85.2 86.5 86.1 87.5 88.8 91.4 ..Belgium 67.3 65.2 61.3 62.8 65.8 68.9 73.6 76.8 80.0 82.0 82.7 86.9 ..Canada 110.9 109.8 111.1 113.9 117.3 120.9 125.9 128.6 134.1 137.9 144.5 146.5 ..Chile .. .. .. .. .. .. .. .. .. .. .. .. ..Czech Republic 19.3 20.0 20.7 25.5 27.5 32.6 37.8 42.2 51.4 56.5 60.0 60.5 ..Denmark .. .. .. .. 238.5 251.8 267.0 284.1 308.3 314.9 322.1 309.5 ..Estonia 16.1 20.2 23.8 30.7 39.3 51.5 67.6 89.6 99.3 100.8 105.2 102.0 ..Finland 61.8 64.6 64.8 69.7 74.0 82.0 91.8 101.1 105.7 108.1 108.4 110.2 ..France 68.1 66.0 66.1 67.5 70.5 72.6 78.6 82.9 86.8 86.5 90.3 93.6 ..Germany 107.6 109.0 106.7 106.7 105.5 104.0 101.5 99.2 96.1 92.8 93.3 91.1 ..Greece .. .. .. .. .. .. 57.7 65.7 69.5 77.3 77.6 90.9 ..Hungary 12.7 15.2 18.2 24.2 33.1 38.4 44.0 50.0 57.6 70.2 70.7 75.5 ..Iceland .. .. .. .. .. .. .. .. .. .. .. .. ..Ireland .. .. .. 115.0 135.6 154.5 181.2 197.5 209.9 208.8 221.0 217.8 ..Israel .. .. .. .. .. .. .. .. .. .. .. .. ..Italy 49.0 52.8 54.6 57.1 60.2 63.9 68.4 73.1 77.4 78.2 83.3 85.9 ..Japan .. .. 130.4 129.6 128.2 127.7 128.2 127.7 124.3 122.9 123.2 121.3 ..Korea .. .. .. 125.0 120.5 116.4 123.2 131.3 139.0 142.6 146.9 150.8 156.3Luxembourg .. .. .. .. .. .. .. 118.5 126.2 126.7 132.2 .. ..Mexico .. .. .. .. 7.3 7.4 8.4 10.4 11.4 9.4 9.4 .. ..Netherlands 153.5 163.7 166.1 178.2 197.4 208.8 226.4 238.5 242.4 253.5 270.3 277.3 ..New Zealand .. .. .. .. .. .. .. .. .. .. .. .. ..Norway 130.8 135.1 146.5 147.0 150.3 159.5 164.0 191.3 199.9 198.1 196.1 196.3 200.0Poland 10.4 11.5 17.1 21.7 19.1 20.6 23.7 29.7 37.5 49.2 51.3 55.5 ..Portugal 97.6 106.4 110.7 112.9 118.5 123.7 128.8 136.9 143.3 142.0 145.6 142.9 139.5Slovak Republic 14.1 20.1 21.0 25.9 29.5 28.7 37.9 51.0 58.4 64.4 73.6 75.9 ..Slovenia .. .. 30.4 30.7 32.4 32.8 36.9 41.1 47.0 48.4 51.3 53.7 ..Spain .. 81.5 84.5 91.0 99.0 109.2 120.9 134.0 139.5 135.0 132.1 136.3 ..Sweden 102.0 105.5 115.7 117.0 124.3 133.1 143.0 150.4 154.3 155.8 160.9 168.4 ..Switzerland 177.4 173.9 172.3 178.8 189.9 189.6 193.2 192.8 188.2 186.5 190.5 .. ..Turkey .. .. .. .. .. .. .. .. .. .. .. .. ..United Kingdom 108.5 111.7 115.7 127.3 138.1 151.3 153.9 166.2 172.2 169.0 162.0 157.0 ..United States 99.2 100.5 104.2 109.0 116.5 123.0 129.9 134.0 136.4 127.8 128.5 122.5 ..EU27 .. .. .. .. .. .. .. .. .. .. .. .. ..OECD .. .. .. .. .. .. .. .. .. .. .. .. ..Brazil .. .. .. .. .. .. .. .. .. .. .. .. ..China .. .. .. .. .. .. .. .. .. .. .. .. ..India .. .. .. .. .. .. .. .. .. .. .. .. ..Indonesia .. .. .. .. .. .. .. .. .. .. .. .. ..Russian Federation .. .. .. .. .. .. .. .. .. .. .. .. ..South Africa .. .. .. .. .. .. .. .. .. .. .. .. ..
Statlink http://dx.doi.org/10.1787/888932707135
Households and NPISHs debtAs a percentage of gross disposable income
Statlink http://dx.doi.org/10.1787/888932707154
HOUSEHOLD INCOME AND WEALTH • HOUSEHOLD WEALTH
OECD Factbook 2013 © OECD 2012 - Preliminary Version
NON-FINANCIAL ASSETS BY HOUSEHOLDSNon-financial assets held by households reflect theassets owned by unincorporated household enterprisesand dwellings owned by households, with the lattercomponent forming by far the bulk of non-financialassets held by households. They form an important partof overall wealth and can provide an importantadditional source of revenue; either through their sale orrefinancing, or as income via rentals of residentialproperty for example. Estimates of non-financial assetsheld by households also play an important role ineconomic analyses, such as studies of asset bubbles, andanalyses of living standards.
DefinitionNon-financial assets held by households include, intheory, both produced and non-produced nonfinancialassets and therefore include: dwellings, other buildingsand structures, and land improvements; machinery andequipment including livestock; and even intellectualproperty products, such as software and literaryoriginals, and non-produced assets such as land andtaxi-licenses. In practice dwellings form by far the mostsignificant component.
Except for dwellings, only those assets owned byhousehold unincorporated enterprises, and used inproduction, are included as non-financial assets. Forexample a car used by a household purely for householdtransport is not a non-financial asset whereas a car usedby a self-employed taxi driver is.
Non-financial assets are valued at the market prices ofthe time of the balance sheet, and are recorded net ofdepreciation.
ComparabilityInformation on non-financial assets held by householdstypically relies on household based surveys. As aconsequence, the quality of this information, except forthat pertaining to dwellings and land, is generally oflower quality than it is for similar information collectedon incorporated businesses.
Moreover, in practice, countries use a variety of methodsto differentiate between the value of dwellings and theland on which the dwellings sit, meaning thatcomparisons of these subcomponents across countriesare challenging. Some countries, for example the UnitedKingdom, include the value of land under dwellingswithin the figures for dwellings. This matters not only forinternational comparability, and indeed temporal
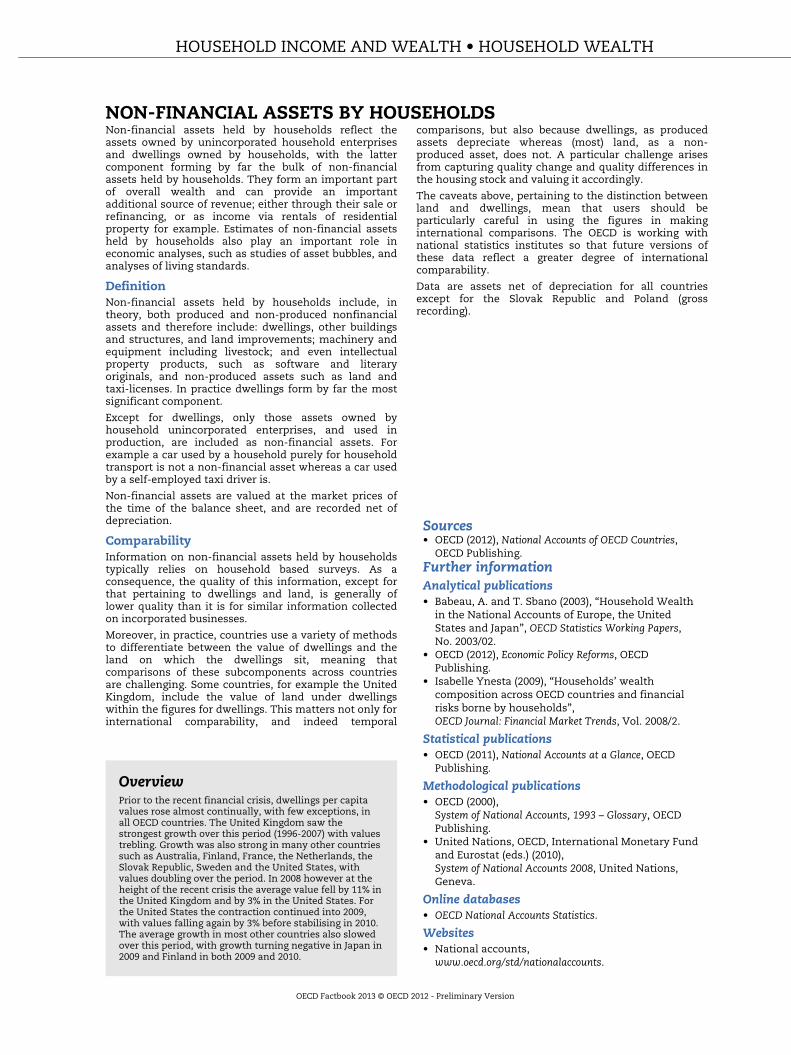
OverviewPrior to the recent financial crisis, dwellings per capitavalues rose almost continually, with few exceptions, inall OECD countries. The United Kingdom saw thestrongest growth over this period (1996-2007) with valuestrebling. Growth was also strong in many other countriessuch as Australia, Finland, France, the Netherlands, theSlovak Republic, Sweden and the United States, withvalues doubling over the period. In 2008 however at theheight of the recent crisis the average value fell by 11% inthe United Kingdom and by 3% in the United States. Forthe United States the contraction continued into 2009,with values falling again by 3% before stabilising in 2010.The average growth in most other countries also slowedover this period, with growth turning negative in Japan in2009 and Finland in both 2009 and 2010.
comparisons, but also because dwellings, as producedassets depreciate whereas (most) land, as a non-produced asset, does not. A particular challenge arisesfrom capturing quality change and quality differences inthe housing stock and valuing it accordingly.
The caveats above, pertaining to the distinction betweenland and dwellings, mean that users should beparticularly careful in using the figures in makinginternational comparisons. The OECD is working withnational statistics institutes so that future versions ofthese data reflect a greater degree of internationalcomparability.
Data are assets net of depreciation for all countriesexcept for the Slovak Republic and Poland (grossrecording).
Sources• OECD (2012), National Accounts of OECD Countries,
OECD Publishing.Further informationAnalytical publications• Babeau, A. and T. Sbano (2003), “Household Wealth
in the National Accounts of Europe, the UnitedStates and Japan”, OECD Statistics Working Papers,No. 2003/02.
• OECD (2012), Economic Policy Reforms, OECDPublishing.
• Isabelle Ynesta (2009), “Households’ wealthcomposition across OECD countries and financialrisks borne by households”,OECD Journal: Financial Market Trends, Vol. 2008/2.
Statistical publications• OECD (2011), National Accounts at a Glance, OECD
Publishing.
Methodological publications• OECD (2000),
System of National Accounts, 1993 – Glossary, OECDPublishing.
• United Nations, OECD, International Monetary Fundand Eurostat (eds.) (2010),System of National Accounts 2008, United Nations,Geneva.
Online databases• OECD National Accounts Statistics.
Websites• National accounts,
www.oecd.org/std/nationalaccounts.
HOUSEHOLD INCOME AND WEALTH • HOUSEHOLD WEALTH
OECD Factbook 2013 © OECD 2012 - Preliminary Version
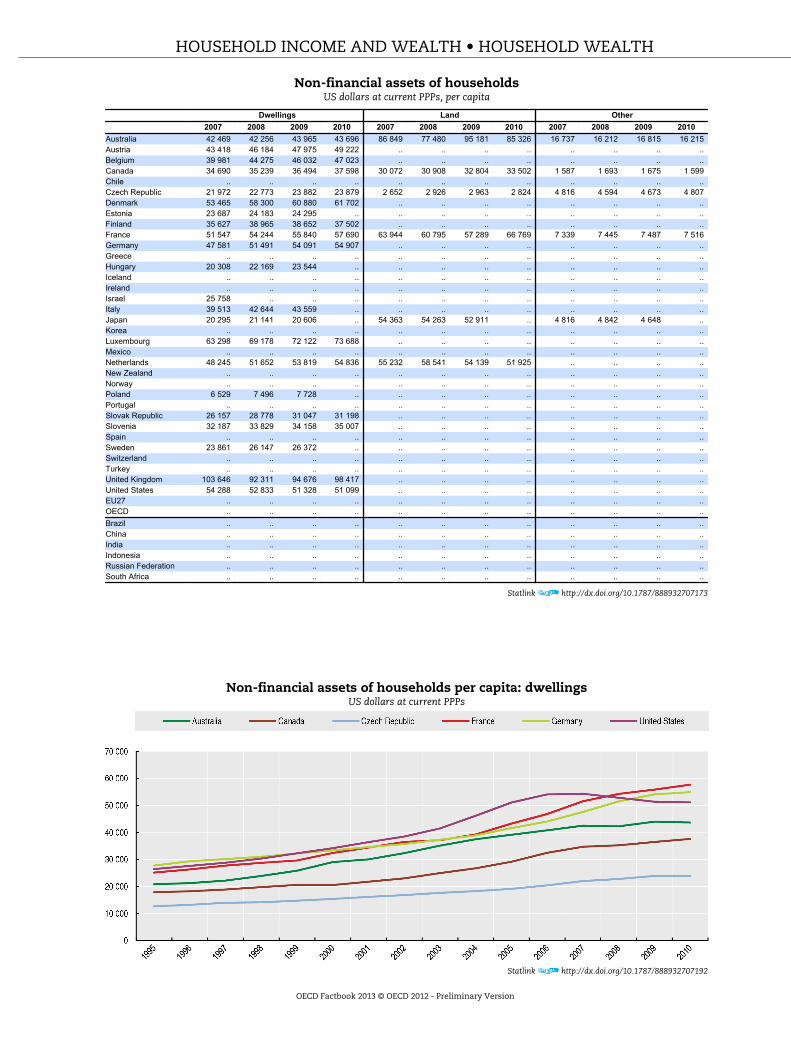
Non-financial assets of householdsUS dollars at current PPPs, per capita
Dwellings Land Other2007 2008 2009 2010 2007 2008 2009 2010 2007 2008 2009 2010
Australia 42 469 42 256 43 965 43 696 86 849 77 480 95 181 85 326 16 737 16 212 16 815 16 215Austria 43 418 46 184 47 975 49 222 .. .. .. .. .. .. .. ..Belgium 39 981 44 275 46 032 47 023 .. .. .. .. .. .. .. ..Canada 34 690 35 239 36 494 37 598 30 072 30 908 32 804 33 502 1 587 1 693 1 675 1 599Chile .. .. .. .. .. .. .. .. .. .. .. ..Czech Republic 21 972 22 773 23 882 23 879 2 652 2 926 2 963 2 824 4 816 4 594 4 673 4 807Denmark 53 465 58 300 60 880 61 702 .. .. .. .. .. .. .. ..Estonia 23 687 24 183 24 295 .. .. .. .. .. .. .. .. ..Finland 35 627 38 965 38 652 37 502 .. .. .. .. .. .. .. ..France 51 547 54 244 55 840 57 690 63 944 60 795 57 289 66 769 7 339 7 445 7 487 7 516Germany 47 581 51 491 54 091 54 907 .. .. .. .. .. .. .. ..Greece .. .. .. .. .. .. .. .. .. .. .. ..Hungary 20 308 22 169 23 544 .. .. .. .. .. .. .. .. ..Iceland .. .. .. .. .. .. .. .. .. .. .. ..Ireland .. .. .. .. .. .. .. .. .. .. .. ..Israel 25 758 .. .. .. .. .. .. .. .. .. .. ..Italy 39 513 42 644 43 559 .. .. .. .. .. .. .. .. ..Japan 20 295 21 141 20 606 .. 54 363 54 263 52 911 .. 4 816 4 842 4 648 ..Korea .. .. .. .. .. .. .. .. .. .. .. ..Luxembourg 63 298 69 178 72 122 73 688 .. .. .. .. .. .. .. ..Mexico .. .. .. .. .. .. .. .. .. .. .. ..Netherlands 48 245 51 652 53 819 54 836 55 232 58 541 54 139 51 925 .. .. .. ..New Zealand .. .. .. .. .. .. .. .. .. .. .. ..Norway .. .. .. .. .. .. .. .. .. .. .. ..Poland 6 529 7 496 7 728 .. .. .. .. .. .. .. .. ..Portugal .. .. .. .. .. .. .. .. .. .. .. ..Slovak Republic 26 157 28 778 31 047 31 198 .. .. .. .. .. .. .. ..Slovenia 32 187 33 829 34 158 35 007 .. .. .. .. .. .. .. ..Spain .. .. .. .. .. .. .. .. .. .. .. ..Sweden 23 861 26 147 26 372 .. .. .. .. .. .. .. .. ..Switzerland .. .. .. .. .. .. .. .. .. .. .. ..Turkey .. .. .. .. .. .. .. .. .. .. .. ..United Kingdom 103 646 92 311 94 676 98 417 .. .. .. .. .. .. .. ..United States 54 288 52 833 51 328 51 099 .. .. .. .. .. .. .. ..EU27 .. .. .. .. .. .. .. .. .. .. .. ..OECD .. .. .. .. .. .. .. .. .. .. .. ..Brazil .. .. .. .. .. .. .. .. .. .. .. ..China .. .. .. .. .. .. .. .. .. .. .. ..India .. .. .. .. .. .. .. .. .. .. .. ..Indonesia .. .. .. .. .. .. .. .. .. .. .. ..Russian Federation .. .. .. .. .. .. .. .. .. .. .. ..South Africa .. .. .. .. .. .. .. .. .. .. .. ..
Statlink http://dx.doi.org/10.1787/888932707173
Non-financial assets of households per capita: dwellingsUS dollars at current PPPs
Statlink http://dx.doi.org/10.1787/888932707192
HOUSEHOLD INCOME AND WEALTH • HOUSEHOLD WEALTH
OECD Factbook 2013 © OECD 2012 - Preliminary Version