Embed Size (px)
Citation preview
Household Interim Projections, 2011 to 2021, England
Contents
1. Introduction…………………..2
2. Household projections in
England…………..................2
3. Household projections by
local authority……………......5
4. Drivers of household
growth…….………..............12
5. Sensitivity of the
projections………………….13
6. Comparison with previous
projections...........................16
7. Accompanying tables……...19
8. Uses of the data……………19
9. Data sources……………….20
10. Data quality…………………21
11. Methodology..................…..21
12. Related statistics…………..22
13. Revisions policy……………22
14. Glossary…………………….23
15. Background notes………….24
16. User consultation…………..24
17. Enquiries……………………24
Responsible Statistician: Yolanda Ruiz Statistical Enquiries: [email protected]
Media Enquiries: 0303 444 1201 [email protected]
• The number of households in England is projected to grow to
24.3 million in 2021, an increase of 2.2 million (10 per cent) over 2011, or 221,000 households per year.
• The projections represent a decrease in average household size from 2.36 to 2.33 in ten years.
• Collectively, couple households (with or without other adults) are projected to grow by around 87,000 per year on average, equating to forty percent of the total increase in households between 2011 and 2021.
• Two thirds (67 per cent) of the increase in households between 2011 and 2021 is projected for households without any dependent children.
• The increase in the number of households headed by the younger age groups is projected to be relatively lower than the increase in households headed by older people.
• In ten years, the number of households is projected to grow between 5 and 10 per cent in nearly half (46 per cent) of all local authority districts in England.
• The majority of local authorities (281 out of 326) have a projected decrease in average household size from 2011 to 2021.
• Changes in population account for about 98 per cent of the household formation between 2011 and 2021.
• The 2011-based projections show a lower growth in households compared with the 2008-based projections, equating to 24,900 fewer households per year between 2011 and 2021 in England.
Housing Statistical Release
9 April 2013

Housing Statistical Release 2
Introduction
This Statistical Release presents National Statistics on the projected number of households in England and its local authority districts to 2021. The figures in this release are based on the 2011-based interim sub-national population projections, published by the Office for National Statistics (ONS) in September 20121. They replace the 2008-based household projections released in November 2010.
The household projections are produced by applying projected household representative rates to the population projections published by the Office for National Statistics. Projected household representative rates are based on trends observed in Census and Labour Force Survey data. The assumptions underlying national household and population projections are demographic trend based. They are not forecasts as they do not attempt to predict the impact that future government policies, changing economic circumstances or other factors might have on demographic behaviour. They provide the household levels and structures that would result if the assumptions based on previous demographic trends in the population and rates of household formation were to be realised in practice.
Household projections in England
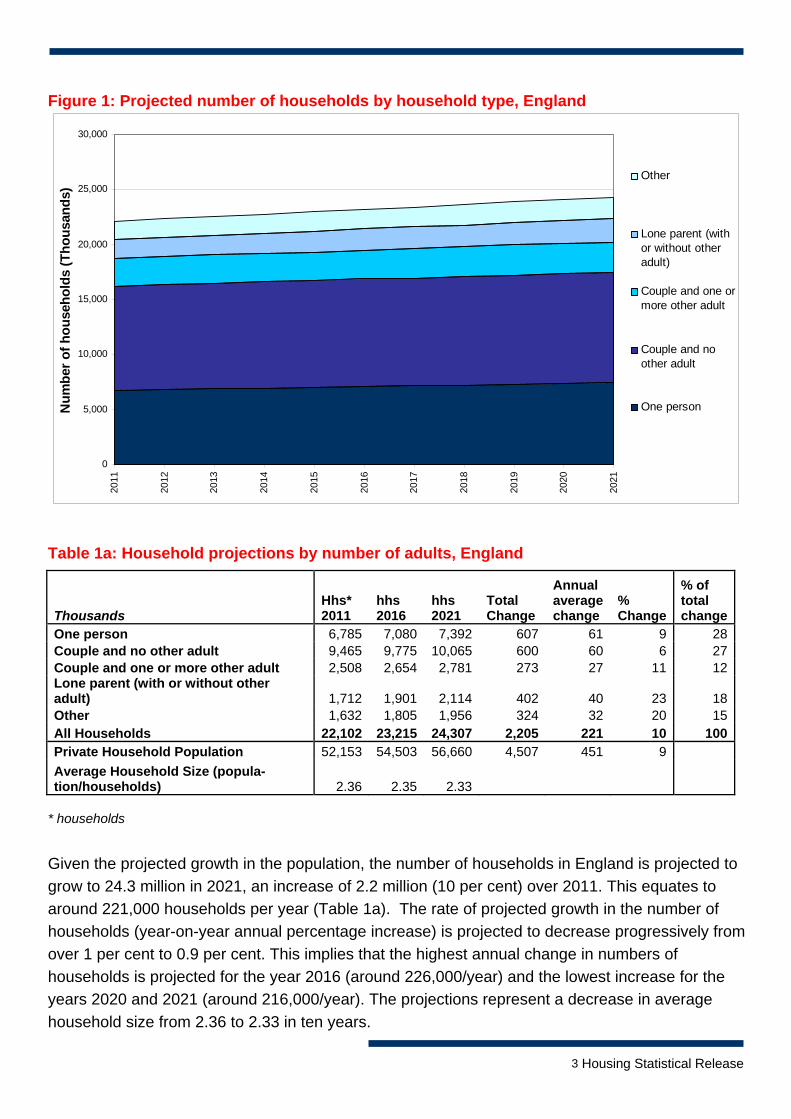
Figure 1: Projected number of households by household type, England
• The number of households in England is projected to grow to 24.3 million in 2021, an increase of 2.2 million (10 per cent) over 2011, or 221,000 households per year.
• The projections represent a decrease in average household size from 2.36 to 2.33 in ten years.
• Collectively, couple households (with or without other adults) are projected to grow by around 87,000 per year on average, equating to forty percent of the total increase in households between 2011 and 2021.
• Two thirds (67 per cent) of the increase in households between 2011 and 2021 is projected for households without any dependent children.
• The increase in the number of households headed by the younger age groups is projected to be relatively lower than the increase in households headed by older people.
1 http://www.ons.gov.uk/ons/rel/snpp/sub-national-population-projections/Interim-2011-based/index.html
3 Housing Statistical Release
Figure 1: Projected number of households by household type, England
0
5,000
10,000
15,000
20,000
25,000
30,000
2011
2012
2013
2014
2015
2016
2017
2018
2019
2020
2021
Num
ber o
f hou
seho
lds
(Tho
usan
ds)
Other
Lone parent (withor without otheradult)
Couple and one ormore other adult
Couple and noother adult
One person
Table 1a: Household projections by number of adults, England
Thousands Hhs* 2011
hhs 2016
hhs 2021
Total Change
Annual average change
% Change
% of total change
One person 6,785 7,080 7,392 607 61 9 28Couple and no other adult 9,465 9,775 10,065 600 60 6 27Couple and one or more other adult 2,508 2,654 2,781 273 27 11 12Lone parent (with or without other adult) 1,712 1,901 2,114 402 40 23 18Other 1,632 1,805 1,956 324 32 20 15All Households 22,102 23,215 24,307 2,205 221 10 100Private Household Population 52,153 54,503 56,660 4,507 451 9 Average Household Size (popula-tion/households) 2.36 2.35 2.33
* households
Given the projected growth in the population, the number of households in England is projected to grow to 24.3 million in 2021, an increase of 2.2 million (10 per cent) over 2011. This equates to around 221,000 households per year (Table 1a). The rate of projected growth in the number of households (year-on-year annual percentage increase) is projected to decrease progressively from over 1 per cent to 0.9 per cent. This implies that the highest annual change in numbers of households is projected for the year 2016 (around 226,000/year) and the lowest increase for the years 2020 and 2021 (around 216,000/year). The projections represent a decrease in average household size from 2.36 to 2.33 in ten years.
Housing Statistical Release 4
Collectively, couple households (with or without other adults) are projected to grow by around 87,000 per year on average, equating to forty percent of the total increase in households between 2011 and 2021.
Over a quarter (28 per cent) of the increase in households is accounted for by one person households, which are projected to rise by around 61,000 a year from 2011 to 2021. This contributes to a decrease in the average size of households from 2.36 persons per household in 2011 to 2.33 persons per household in 2021. By 2021, 13 per cent of the private household population in England is projected to live alone, unchanged from 2011.
A further 15 per cent of the growth in total households is due to the growth in ‘other’ households. This group includes multi-person households including student households and adults sharing accommodation. Both of these household types experienced a large increase between the 2001 and the 2011 Census.
Lone parent households are projected to increase by 40,000 per annum, which amounts to 23 per cent increase in this type of household between 2011 and 2021.
Table 1b: Household projections by number of dependent children, England
Thousand households with: hhs 2011
hhs 2016
hhs 2021
Total Change
Annual aver-age change
% Change
% of total change
0 dependent children 15,941 16,714 17,409 1,468 147 9 671 dependent children 2,759 3,009 3,256 497 50 18 232 dependent children 2,309 2,356 2,437 128 13 6 63+ dependent children 1,094 1,137 1,206 113 11 10 5All Households 22,102 23,215 24,307 2,205 221 10 100
Two thirds (67 per cent) of the increase in households between 2011 and 2021 is projected for households without any dependent children. This reflects both the growth in one person households and the growth in multi-person households. Households with one dependent child account for nearly a quarter of the increase in households (23 percent). Households with two or more dependent children account for 11 percent of the total increase in households (Table 1b).
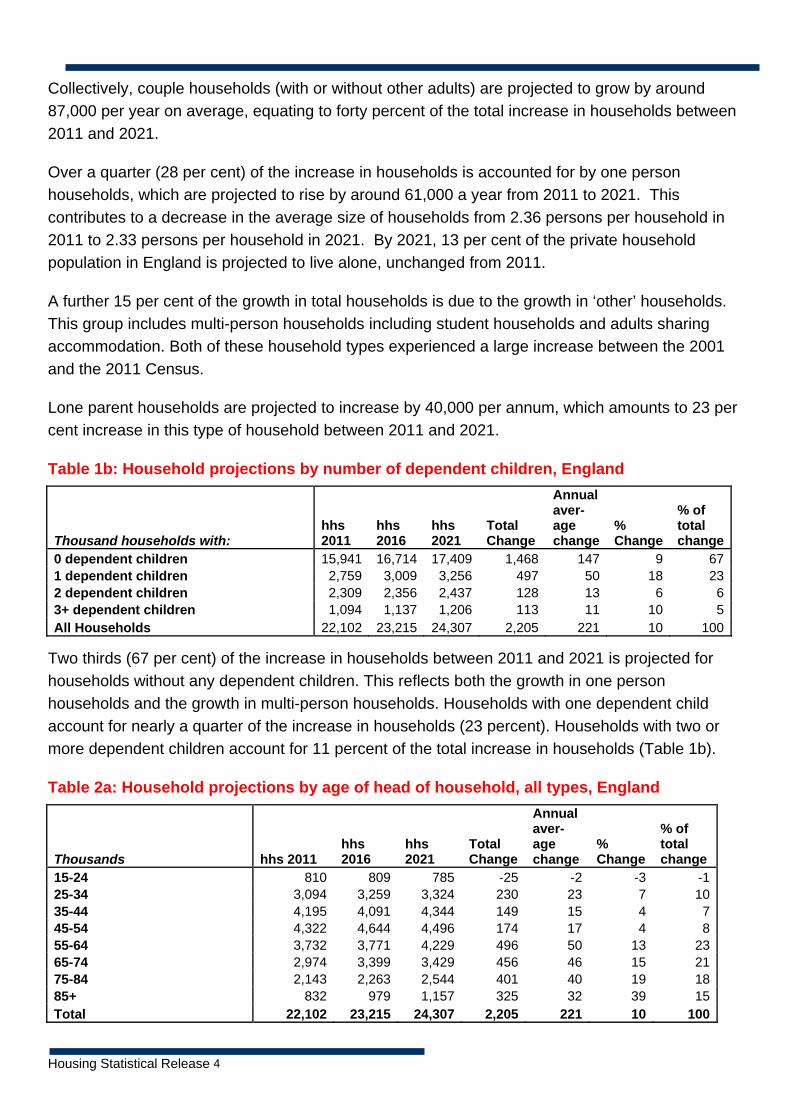
Table 2a: Household projections by age of head of household, all types, England
Thousands hhs 2011 hhs 2016
hhs 2021
Total Change
Annual aver-age change
% Change
% of total change
15-24 810 809 785 -25 -2 -3 -125-34 3,094 3,259 3,324 230 23 7 1035-44 4,195 4,091 4,344 149 15 4 745-54 4,322 4,644 4,496 174 17 4 855-64 3,732 3,771 4,229 496 50 13 2365-74 2,974 3,399 3,429 456 46 15 2175-84 2,143 2,263 2,544 401 40 19 1885+ 832 979 1,157 325 32 39 15Total 22,102 23,215 24,307 2,205 221 10 100

5 Housing Statistical Release
The increase in the number of households headed by the younger age groups is projected to be relatively lower than the increase in households headed by older people. The highest increase in the number of households is projected to be for those headed by someone between 55 and 64 years old (23 per cent of total increase). More than half (54 percent) of the increase in households is projected for households headed by someone aged 65 or over (Table 2a). This means that by 2021, 29 per cent of households will be headed by those aged 65, up from 27 per cent in 2011. By contrast, the number of households headed by someone aged 15 to 24 is projected to decrease by three per cent, and those headed by someone aged 25 to 34 is projected to grow by 7 per cent.
Table 2b: Household projections by age of head of household, one person households, England
Thousands hhs 2011 hhs 2016
hhs 2021
Total Change
Annual aver-age change
% Change
% of total change
15_24 222 205 183 -40 -4 -18 -725_34 794 832 841 47 5 6 835_44 889 882 940 50 5 6 845_54 966 1,054 1,029 62 6 6 1055_64 1,020 1,026 1,149 129 13 13 2165_74 989 1,076 1,040 51 5 5 875_84 1,332 1,351 1,459 127 13 10 2185+ 571 653 751 180 18 31 30Total 6,785 7,080 7,392 607 61 9 100
Similarly, much of the increase in one person households is seen in the older age groups, where households headed by someone aged 65 and over account for nearly 60 per cent of the total increase. For households headed by someone aged 15 to 24, there is nearly a 20 per cent projected decrease in household formation between 2011 and 2021 (Table 2b).
Household projections by local authority2
• In ten years, the number of households is projected to grow between 5 and 10 per cent in nearly half (46 per cent) of all local authority districts in England.
• The majority of local authorities (281 out of 326) have a projected decrease in average household size from 2011 to 2021.
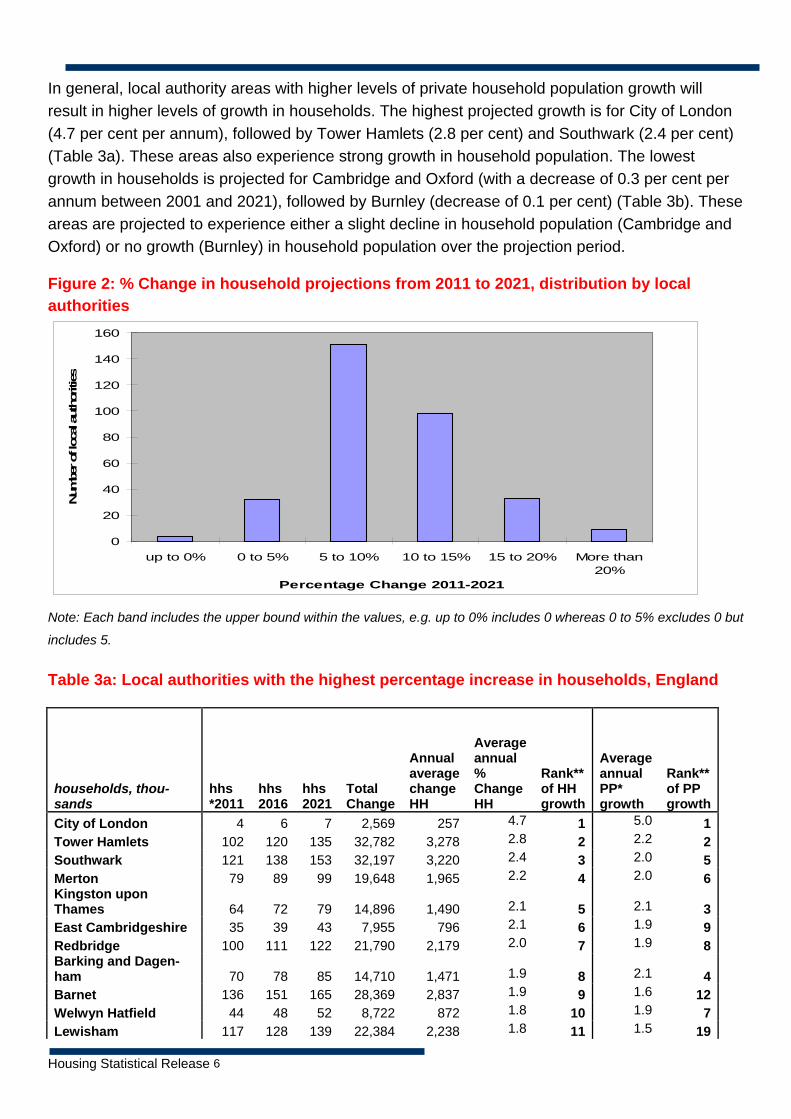
In ten years, the number of households is projected to grow between 5 and 10 per cent in nearly half (46 per cent) of all local authority districts in England. In 30 per cent of districts the projected growth is between 10 and 15 per cent (Figure 2).
2 As outlined in the Written Ministerial Statement of 18 September 2012, Official Report, Column 32WS, DCLG no longer publishes statistics by government office region.
Housing Statistical Release 6
In general, local authority areas with higher levels of private household population growth will result in higher levels of growth in households. The highest projected growth is for City of London (4.7 per cent per annum), followed by Tower Hamlets (2.8 per cent) and Southwark (2.4 per cent) (Table 3a). These areas also experience strong growth in household population. The lowest growth in households is projected for Cambridge and Oxford (with a decrease of 0.3 per cent per annum between 2001 and 2021), followed by Burnley (decrease of 0.1 per cent) (Table 3b). These areas are projected to experience either a slight decline in household population (Cambridge and Oxford) or no growth (Burnley) in household population over the projection period. Figure 2: % Change in household projections from 2011 to 2021, distribution by local authorities
0
20
40
60
80
100
120
140
160
up to 0% 0 to 5% 5 to 10% 10 to 15% 15 to 20% More than20%
Percentage Change 2011-2021
Num
ber o
f loc
al aut
horit
ies
Note: Each band includes the upper bound within the values, e.g. up to 0% includes 0 whereas 0 to 5% excludes 0 but
includes 5.
Table 3a: Local authorities with the highest percentage increase in households, England
households, thou-sands
hhs *2011
hhs 2016
hhs 2021
Total Change
Annual average change HH
Average annual % Change HH
Rank** of HH growth
Average annual PP* growth
Rank** of PP growth
City of London 4 6 7 2,569 257 4.7 1 5.0 1Tower Hamlets 102 120 135 32,782 3,278 2.8 2 2.2 2Southwark 121 138 153 32,197 3,220 2.4 3 2.0 5Merton 79 89 99 19,648 1,965 2.2 4 2.0 6Kingston upon Thames 64 72 79 14,896 1,490 2.1 5 2.1 3East Cambridgeshire 35 39 43 7,955 796 2.1 6 1.9 9Redbridge 100 111 122 21,790 2,179 2.0 7 1.9 8Barking and Dagen-ham 70 78 85 14,710 1,471 1.9 8 2.1 4Barnet 136 151 165 28,369 2,837 1.9 9 1.6 12Welwyn Hatfield 44 48 52 8,722 872 1.8 10 1.9 7Lewisham 117 128 139 22,384 2,238 1.8 11 1.5 19
7 Housing Statistical Release
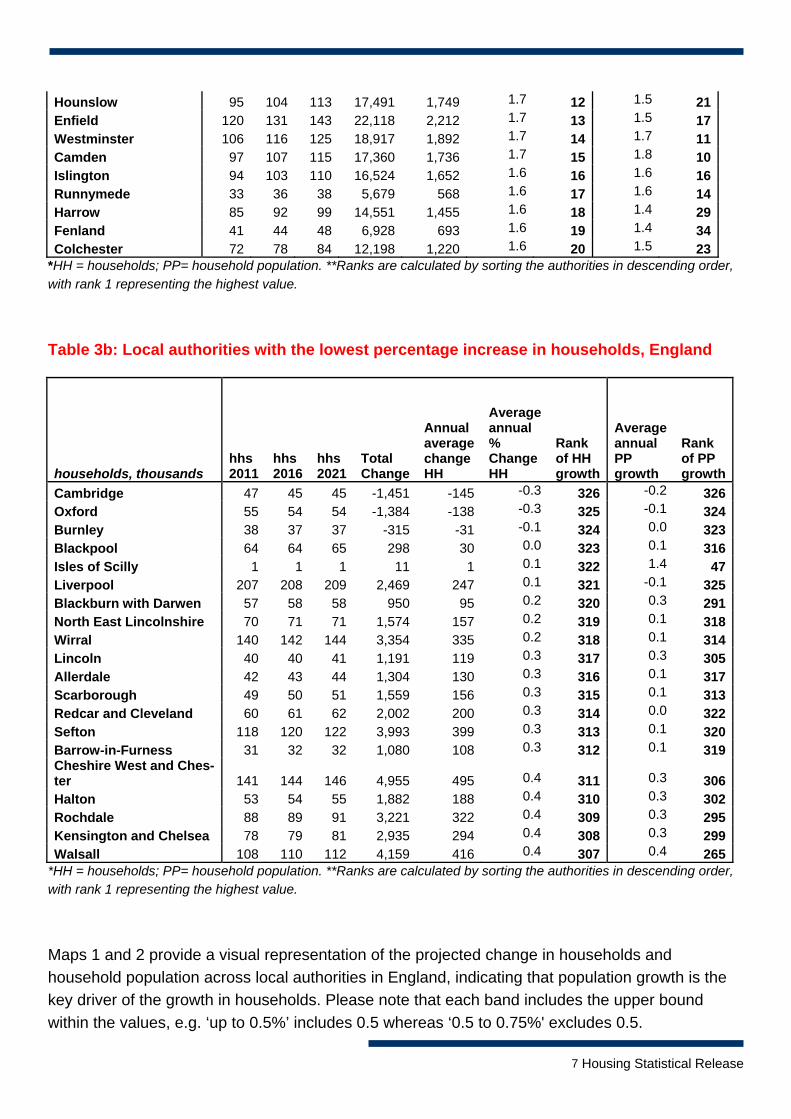
Hounslow 95 104 113 17,491 1,749 1.7 12 1.5 21Enfield 120 131 143 22,118 2,212 1.7 13 1.5 17Westminster 106 116 125 18,917 1,892 1.7 14 1.7 11Camden 97 107 115 17,360 1,736 1.7 15 1.8 10Islington 94 103 110 16,524 1,652 1.6 16 1.6 16Runnymede 33 36 38 5,679 568 1.6 17 1.6 14Harrow 85 92 99 14,551 1,455 1.6 18 1.4 29Fenland 41 44 48 6,928 693 1.6 19 1.4 34Colchester 72 78 84 12,198 1,220 1.6 20 1.5 23
*HH = households; PP= household population. **Ranks are calculated by sorting the authorities in descending order, with rank 1 representing the highest value.
Table 3b: Local authorities with the lowest percentage increase in households, England
households, thousands hhs 2011
hhs 2016
hhs 2021
Total Change
Annual average change HH
Average annual % Change HH
Rank of HH growth
Average annual PP growth
Rank of PP growth
Cambridge 47 45 45 -1,451 -145 -0.3 326 -0.2 326Oxford 55 54 54 -1,384 -138 -0.3 325 -0.1 324Burnley 38 37 37 -315 -31 -0.1 324 0.0 323Blackpool 64 64 65 298 30 0.0 323 0.1 316Isles of Scilly 1 1 1 11 1 0.1 322 1.4 47Liverpool 207 208 209 2,469 247 0.1 321 -0.1 325Blackburn with Darwen 57 58 58 950 95 0.2 320 0.3 291North East Lincolnshire 70 71 71 1,574 157 0.2 319 0.1 318Wirral 140 142 144 3,354 335 0.2 318 0.1 314Lincoln 40 40 41 1,191 119 0.3 317 0.3 305Allerdale 42 43 44 1,304 130 0.3 316 0.1 317Scarborough 49 50 51 1,559 156 0.3 315 0.1 313Redcar and Cleveland 60 61 62 2,002 200 0.3 314 0.0 322Sefton 118 120 122 3,993 399 0.3 313 0.1 320Barrow-in-Furness 31 32 32 1,080 108 0.3 312 0.1 319Cheshire West and Ches-ter 141 144 146 4,955 495 0.4 311 0.3 306Halton 53 54 55 1,882 188 0.4 310 0.3 302Rochdale 88 89 91 3,221 322 0.4 309 0.3 295Kensington and Chelsea 78 79 81 2,935 294 0.4 308 0.3 299Walsall 108 110 112 4,159 416 0.4 307 0.4 265
*HH = households; PP= household population. **Ranks are calculated by sorting the authorities in descending order, with rank 1 representing the highest value.
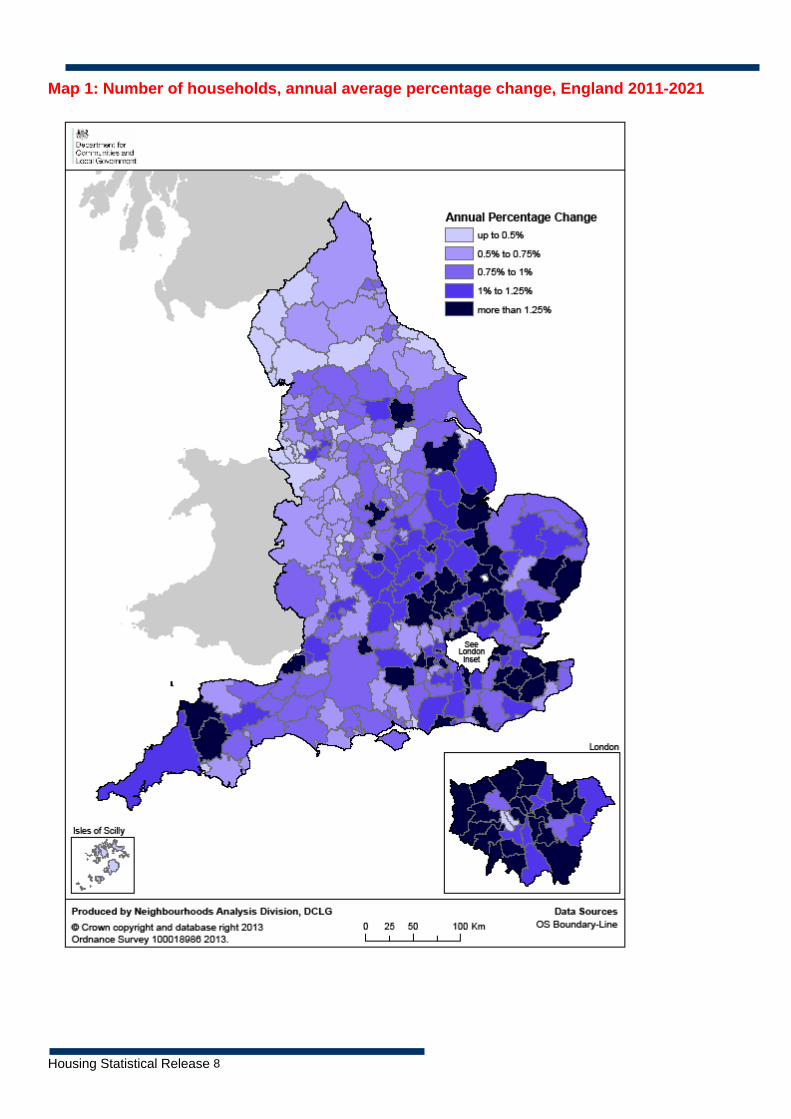
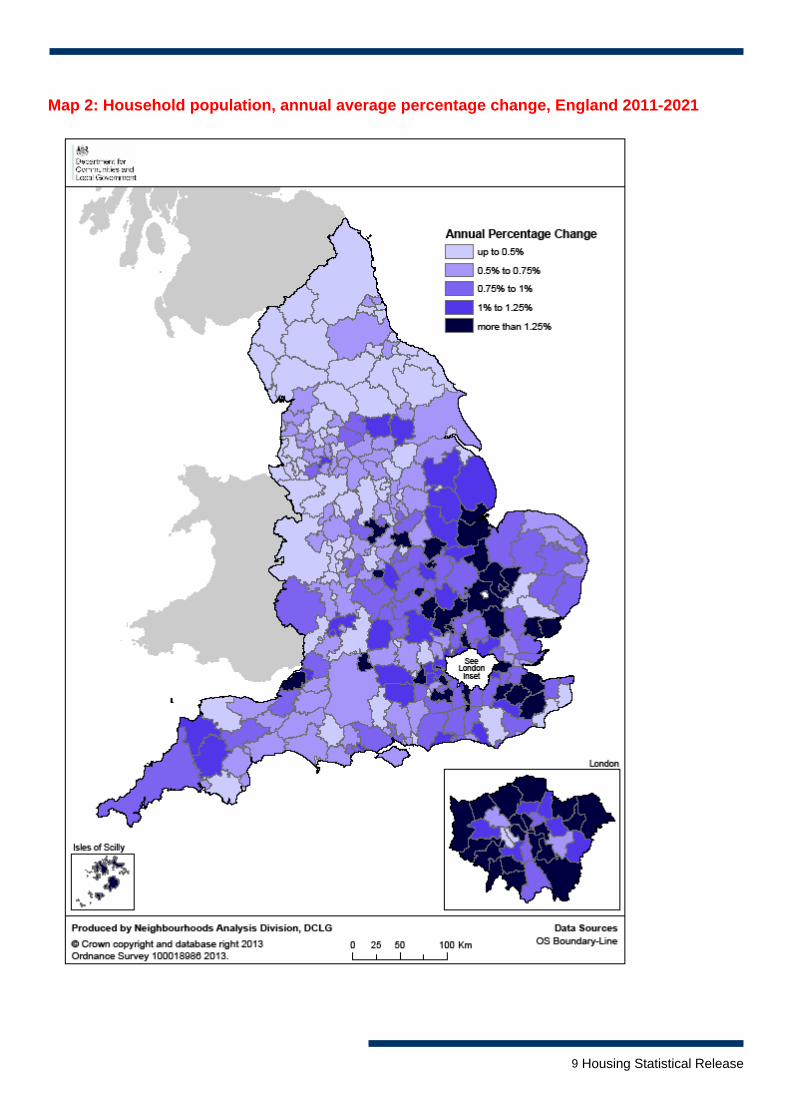
Maps 1 and 2 provide a visual representation of the projected change in households and household population across local authorities in England, indicating that population growth is the key driver of the growth in households. Please note that each band includes the upper bound within the values, e.g. ‘up to 0.5%’ includes 0.5 whereas ‘0.5 to 0.75%' excludes 0.5.
Housing Statistical Release 8
Map 1: Number of households, annual average percentage change, England 2011-2021
9 Housing Statistical Release
Map 2: Household population, annual average percentage change, England 2011-2021

Housing Statistical Release 10
The majority of local authorities (281 out of 326) have a projected decrease in average household size from 2011 to 2021 (Figure 3), leading to the overall decrease in average household size at the England level. This decrease in average household size implies that population increases relatively less than households in the majority of local authorities. Nearly a third (117) of local authorities have a projected decrease in average household size of 0.025 to 0.05. The local authority with the highest projected decrease in average household size is Tower Hamlets (from an average size of 2.47 in 2011 to 2.32 in 2021), followed by Craven and Southwark (Table 4a).
Declining average household size has been a feature of previous household projections for most local authorities, but at a faster rate (more detail in section ‘comparison with previous projections’, below). In the 2011-based projections average household size increases in some areas over the projection period, particularly in areas where the population of children is growing at a faster rate than the adult household population. The highest increase is projected for Isles of Scilly (although data for this local authority has to be interpreted with care given its small size) with a projected increase from 2.15 to 2.41, followed by Forest Heath and Oadby and Wigston (Table 4b).
Figure 3: Change in household average size from 2011 to 2021, distribution by local authorities
0
20
40
60
80
100
120
140
up to -0.05 from -0.05 to -0.025
from -0.025 to0
from 0 to 0.025 from 0.025 to0.05
More than 0.05
Change in household average size from 2011 to 2021
Num
ber
of lo
cal a
utho
ritie
s

11 Housing Statistical Release
Table 4a: Local authorities with the highest decrease in average household size, England
local authority Average Household Size, 2011
Average Household Size, 2021
Change in aver‐age HH size
Tower Hamlets 2.47 2.32 -0.16Craven 2.21 2.11 -0.10Southwark 2.35 2.25 -0.10Derbyshire Dales 2.26 2.17 -0.09Babergh 2.30 2.20 -0.09Canterbury 2.35 2.26 -0.09Ealing 2.70 2.61 -0.08Wealden 2.33 2.25 -0.08Haringey 2.48 2.40 -0.08Mid Suffolk 2.36 2.28 -0.08Horsham 2.34 2.26 -0.08Croydon 2.48 2.41 -0.08Slough 2.75 2.68 -0.08South Lakeland 2.16 2.08 -0.08Copeland 2.27 2.20 -0.07Harrogate 2.29 2.22 -0.07Chorley 2.32 2.25 -0.07Ribble Valley 2.33 2.26 -0.07Redcar and Cleveland 2.24 2.17 -0.07Merton 2.52 2.45 -0.07
Table 4b: Local authorities with the highest increase in average household size, England
local authority Average Household Size, 2011
Average Household Size, 2021
Change in aver‐age HH size
Isles of Scilly 2.15 2.41 0.27Forest Heath 2.29 2.36 0.06Oadby and Wigston 2.52 2.58 0.06City of London 1.64 1.69 0.05Rutland 2.28 2.34 0.05Bournemouth 2.17 2.22 0.05Oxford 2.41 2.45 0.04Guildford 2.43 2.47 0.04Barking and Dagenham 2.65 2.69 0.04Hillingdon 2.67 2.71 0.04Blackburn with Darwen 2.54 2.58 0.04Corby 2.42 2.45 0.04Havering 2.42 2.46 0.03Coventry 2.39 2.43 0.03Cambridge 2.30 2.33 0.03Plymouth 2.30 2.33 0.03Camden 2.18 2.20 0.03Boston 2.34 2.36 0.03Welwyn Hatfield 2.45 2.47 0.02Broxbourne 2.48 2.50 0.02
Housing Statistical Release 12
Accompanying Live Table 406 provides household projections by local authority for all the years of the projection period and Live Table 426 provides the projected household population.
Live Table 425 provides calculated total change, annual average change and percentage change in household projections for local authorities from 2011 to 2021, and Live Table 428 provides the same information for changes in household population. Live Table 427 calculates changes in average household size from Live Table 425 and Live Table 428.
Live tables also provide information on changes by household type for each local authority. Live Table 414 provides change in households by age group, Live Table 420 by number of adults and Live Table 424 by number of dependent children. Live tables for cross-tabulations (e.g. projected number of households by age group and number of dependent children) are not presented in live tables at local authority level. However a full dataset is provided for modelling purposes alongside this release and tables with cross-tabulations can be derived if required, although grouping some variables may be required to avoid very small numbers.
Drivers of household growth
Error!
• Changes in population account for about 98 per cent of the household formation between 2011 and 2021.
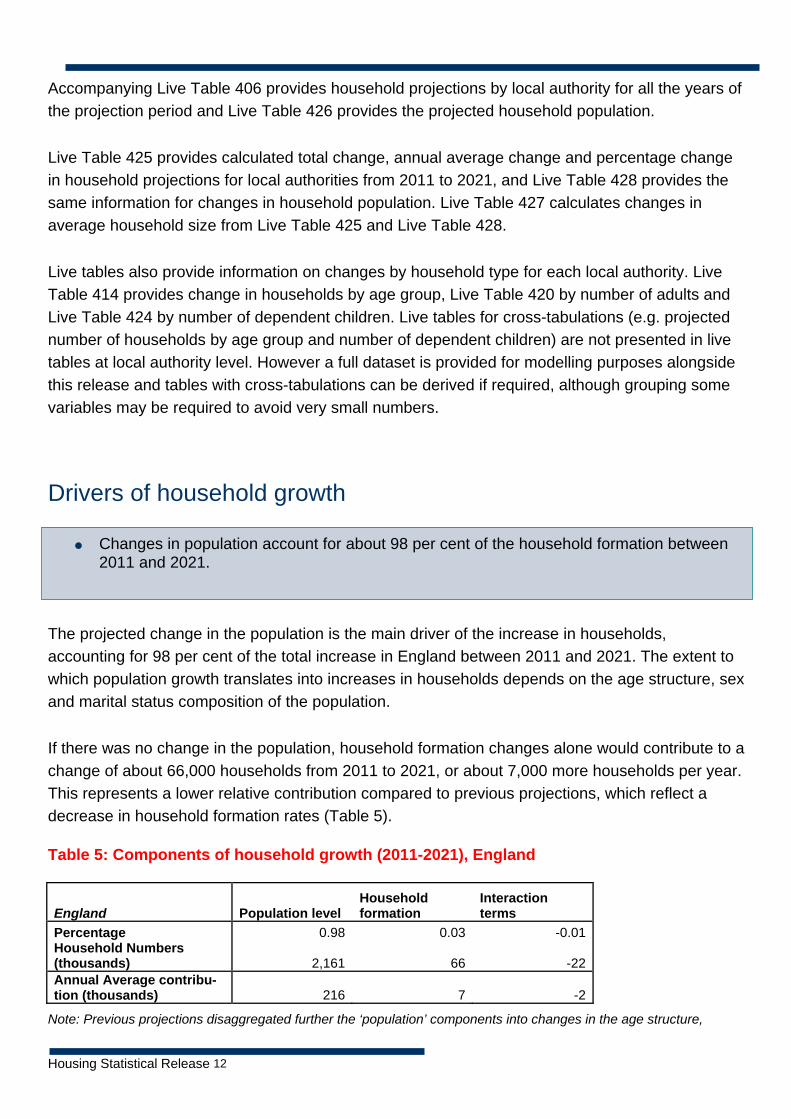
The projected change in the population is the main driver of the increase in households, accounting for 98 per cent of the total increase in England between 2011 and 2021. The extent to which population growth translates into increases in households depends on the age structure, sex and marital status composition of the population.
If there was no change in the population, household formation changes alone would contribute to a change of about 66,000 households from 2011 to 2021, or about 7,000 more households per year. This represents a lower relative contribution compared to previous projections, which reflect a decrease in household formation rates (Table 5).
Table 5: Components of household growth (2011-2021), England
England Population level Household formation
Interaction terms
Percentage 0.98 0.03 -0.01 Household Numbers (thousands) 2,161 66 -22 Annual Average contribu-tion (thousands) 216 7 -2
Note: Previous projections disaggregated further the ‘population’ components into changes in the age structure,

13 Housing Statistical Release
marital status and population level. For the 2008-based projections, for example, the equivalent ‘population’
component would contribute 85% of total growth. The household formation component represents changes in
household formation rates. The interaction between components arises due to the interdependence between the two
terms in the projections model.
The pattern is reflected across local authorities. For the majority of local authorities (221 out of 326), population changes contribute between 90 and 100 per cent of the total change in households (Figure 5). In 80 local authorities the population change contributes to over 100 per cent of growth, with household formation counteracting the effect with a negative contribution to household growth. The only three local authorities where the contribution of population change is less than 75 per cent are Wirral (69 per cent), Blackpool (30 per cent) and Liverpool (-11 per cent). Liverpool is the only local authority where the contribution of population change is negative and household formation therefore contributes to more than 100 per cent of household growth. Live Table 415 provides data on contributions to growth for all local authorities.
Figure 5: Contribution of population change to total change in households from 2011 to 2021, distribution by local authorities
0
50
100
150
200
250
less than75%
from 75% to90%
from 90% to100%
from 100 to110%
More than110%
Percentage contribution to change in households of population change
Num
ber o
f loc
al a
utho
ritie
s
Sensitivity of the projections
For previous household projections, variant household projections have been run alongside the main projection. These variant projections were based on the variant sub-national population projections published by the ONS, which showed the effect of alternative assumptions about fertility, life expectancy and net migration on future levels of population. The variant household projections were produced by applying the household formation rates from the household projections to the variant population projections, and this gave a broad indication of the sensitivity of the household projections to demographic assumptions at national level.
Housing Statistical Release 14
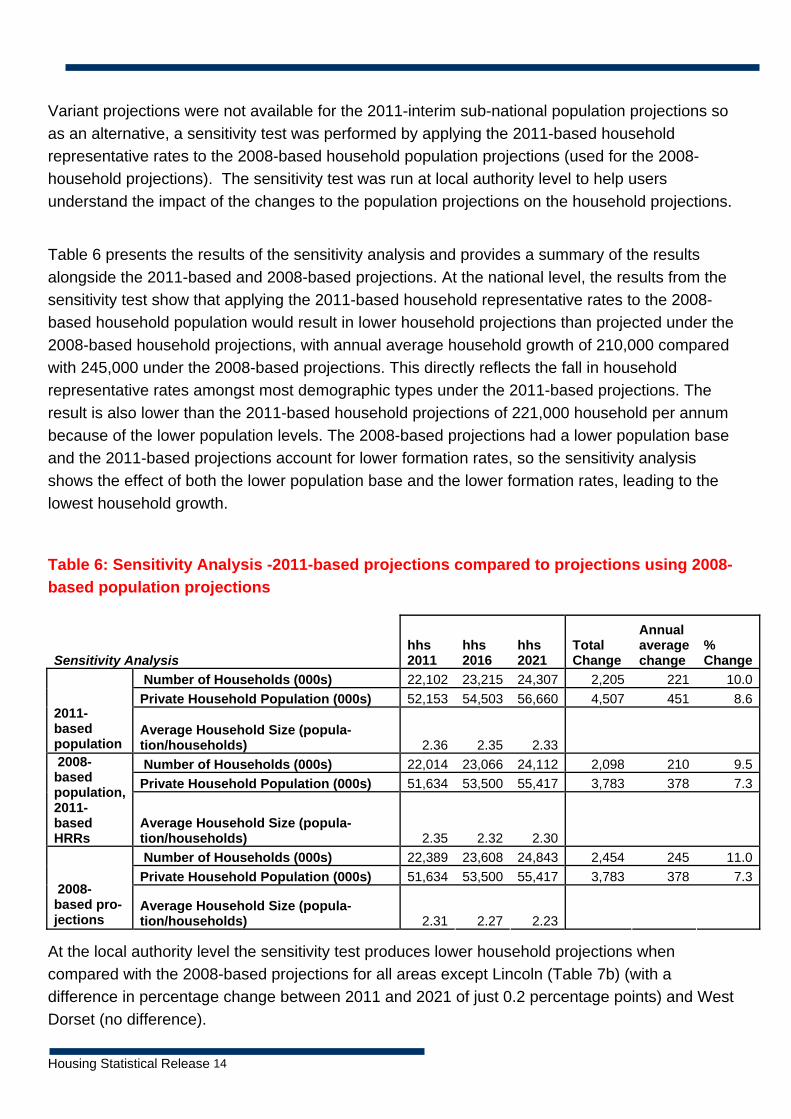
Variant projections were not available for the 2011-interim sub-national population projections so as an alternative, a sensitivity test was performed by applying the 2011-based household representative rates to the 2008-based household population projections (used for the 2008-household projections). The sensitivity test was run at local authority level to help users understand the impact of the changes to the population projections on the household projections.
Table 6 presents the results of the sensitivity analysis and provides a summary of the results alongside the 2011-based and 2008-based projections. At the national level, the results from the sensitivity test show that applying the 2011-based household representative rates to the 2008-based household population would result in lower household projections than projected under the 2008-based household projections, with annual average household growth of 210,000 compared with 245,000 under the 2008-based projections. This directly reflects the fall in household representative rates amongst most demographic types under the 2011-based projections. The result is also lower than the 2011-based household projections of 221,000 household per annum because of the lower population levels. The 2008-based projections had a lower population base and the 2011-based projections account for lower formation rates, so the sensitivity analysis shows the effect of both the lower population base and the lower formation rates, leading to the lowest household growth.
Table 6: Sensitivity Analysis -2011-based projections compared to projections using 2008-based population projections
Sensitivity Analysis hhs 2011
hhs 2016
hhs 2021
Total Change
Annual average change
% Change
Number of Households (000s) 22,102 23,215 24,307 2,205 221 10.0Private Household Population (000s) 52,153 54,503 56,660 4,507 451 8.6
2011-based population
Average Household Size (popula-tion/households) 2.36 2.35 2.33 Number of Households (000s) 22,014 23,066 24,112 2,098 210 9.5Private Household Population (000s) 51,634 53,500 55,417 3,783 378 7.3
2008-based population, 2011-based HRRs
Average Household Size (popula-tion/households) 2.35 2.32 2.30 Number of Households (000s) 22,389 23,608 24,843 2,454 245 11.0Private Household Population (000s) 51,634 53,500 55,417 3,783 378 7.3
2008-based pro-jections
Average Household Size (popula-tion/households) 2.31 2.27 2.23
At the local authority level the sensitivity test produces lower household projections when compared with the 2008-based projections for all areas except Lincoln (Table 7b) (with a difference in percentage change between 2011 and 2021 of just 0.2 percentage points) and West Dorset (no difference).

15 Housing Statistical Release
Some of the greatest differences are found in London – including City of London, Camden, Sutton, Harrow, Haringey and Newham (Table 7a). In fact 13 of the top 20 largest differences between the 2008-based projections and the results of the sensitivity test are found in London. The slower projected decline in household formation in the 2011-based projections compared with the 2008-based projections leads to the biggest differences in the sensitivity analysis.
Live Table 429 presents the sensitivity analysis for all local authorities.
Table 7a: Local authorities with the lowest increase in HHs under sensitivity analysis when compared to 2008-based projections
2008-based household projec-
tions (000s) Sensitivity Test HH projections (000s)
Local authority 2011 2016 2021 2011 2016 2021
2008-based
% change in HHs
Sens Test % change in HHs Difference*
City of London 7 9 10 7 8 9 31.3 28.0 -3.3 Camden 108 115 122 103 109 114 13.9 10.7 -3.2 York 88 95 101 87 92 98 15.2 12.5 -2.7 Sutton 85 91 98 80 85 90 14.4 11.8 -2.7 Harrow 90 96 103 84 89 94 14.7 12.1 -2.7 Haringey 100 104 108 94 96 99 8.5 5.9 -2.7 Slough 50 53 56 50 52 55 12.5 9.9 -2.6 Newham 92 93 95 81 81 82 3.7 1.0 -2.6 Oadby and Wig-ston 23 25 26 22 23 24 10.3 7.7 -2.6 Hounslow 96 103 110 91 97 102 14.4 11.9 -2.6 Ealing 126 132 138 121 125 129 9.1 6.6 -2.5 Leicester 127 136 145 119 127 134 14.3 11.8 -2.5 Westminster 128 140 151 126 136 145 17.5 15.0 -2.5 Wandsworth 128 133 139 125 128 132 8.3 5.8 -2.5 Bristol, City of 195 215 233 193 210 226 19.3 16.9 -2.4 Bradford 200 214 228 198 209 221 14.4 12.0 -2.4 Brighton and Hove 117 122 126 115 118 121 7.6 5.2 -2.4 Redbridge 104 111 118 100 105 110 13.1 10.7 -2.4 Hackney 92 96 100 92 94 97 8.3 5.9 -2.4 Barnet 143 154 164 137 146 154 14.7 12.3 -2.3
Note: The ‘sensitivity analysis’ columns refer to the household projections from the sensitivity analysis, using the
same household representative rates but applying them to the 2008-based population’. (*)Differences in percentage
points need to be taken as indicative only as the population base is different for the two percentages.
Housing Statistical Release 16
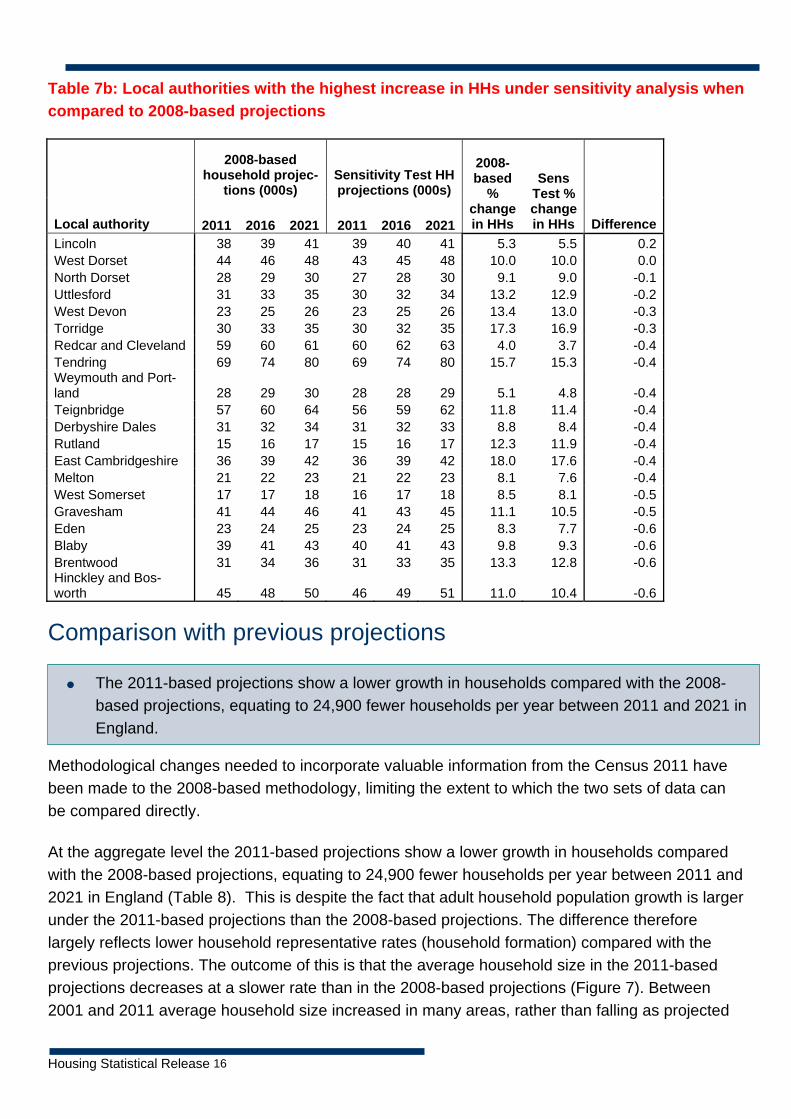
Table 7b: Local authorities with the highest increase in HHs under sensitivity analysis when compared to 2008-based projections
2008-based household projec-
tions (000s) Sensitivity Test HH projections (000s)
Local authority 2011 2016 2021 2011 2016 2021
2008-based
% change in HHs
Sens Test % change in HHs Difference
Lincoln 38 39 41 39 40 41 5.3 5.5 0.2West Dorset 44 46 48 43 45 48 10.0 10.0 0.0North Dorset 28 29 30 27 28 30 9.1 9.0 -0.1Uttlesford 31 33 35 30 32 34 13.2 12.9 -0.2West Devon 23 25 26 23 25 26 13.4 13.0 -0.3Torridge 30 33 35 30 32 35 17.3 16.9 -0.3Redcar and Cleveland 59 60 61 60 62 63 4.0 3.7 -0.4Tendring 69 74 80 69 74 80 15.7 15.3 -0.4Weymouth and Port-land 28 29 30 28 28 29 5.1 4.8 -0.4Teignbridge 57 60 64 56 59 62 11.8 11.4 -0.4Derbyshire Dales 31 32 34 31 32 33 8.8 8.4 -0.4Rutland 15 16 17 15 16 17 12.3 11.9 -0.4East Cambridgeshire 36 39 42 36 39 42 18.0 17.6 -0.4Melton 21 22 23 21 22 23 8.1 7.6 -0.4West Somerset 17 17 18 16 17 18 8.5 8.1 -0.5Gravesham 41 44 46 41 43 45 11.1 10.5 -0.5Eden 23 24 25 23 24 25 8.3 7.7 -0.6Blaby 39 41 43 40 41 43 9.8 9.3 -0.6Brentwood 31 34 36 31 33 35 13.3 12.8 -0.6Hinckley and Bos-worth 45 48 50 46 49 51 11.0 10.4 -0.6
Comparison with previous projections
• The 2011-based projections show a lower growth in households compared with the 2008-based projections, equating to 24,900 fewer households per year between 2011 and 2021 in England.
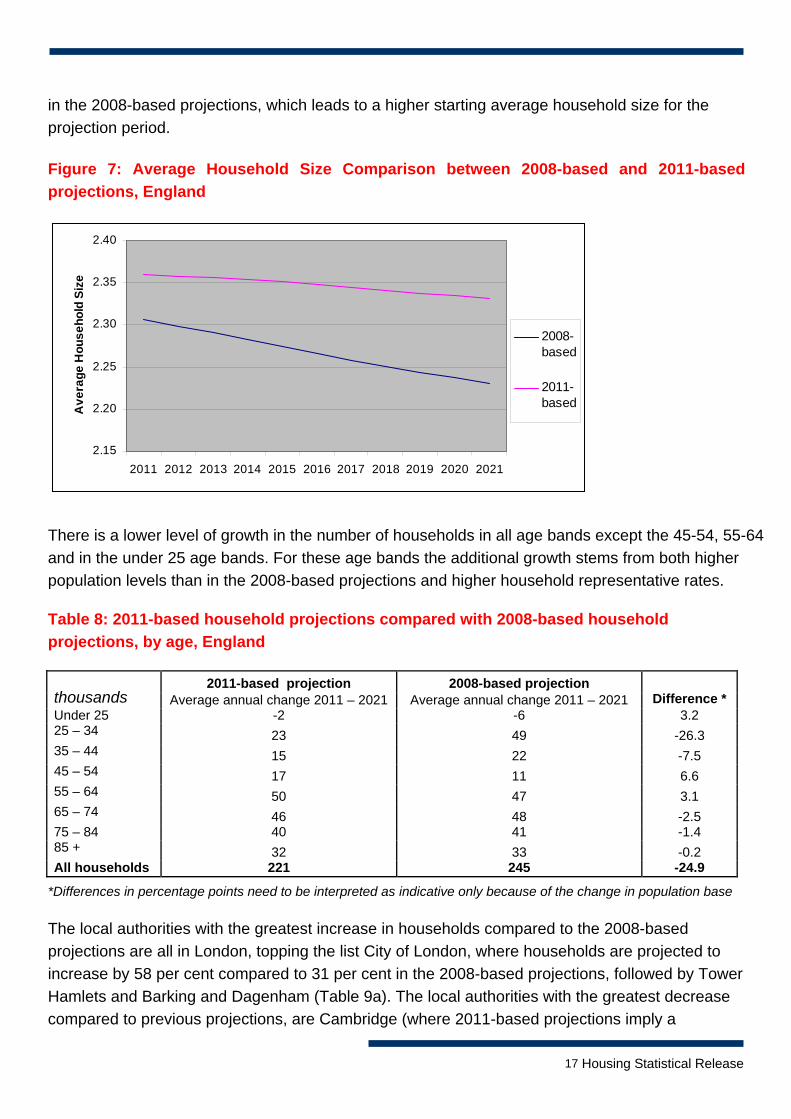
Methodological changes needed to incorporate valuable information from the Census 2011 have been made to the 2008-based methodology, limiting the extent to which the two sets of data can be compared directly. At the aggregate level the 2011-based projections show a lower growth in households compared with the 2008-based projections, equating to 24,900 fewer households per year between 2011 and 2021 in England (Table 8). This is despite the fact that adult household population growth is larger under the 2011-based projections than the 2008-based projections. The difference therefore largely reflects lower household representative rates (household formation) compared with the previous projections. The outcome of this is that the average household size in the 2011-based projections decreases at a slower rate than in the 2008-based projections (Figure 7). Between 2001 and 2011 average household size increased in many areas, rather than falling as projected
17 Housing Statistical Release
in the 2008-based projections, which leads to a higher starting average household size for the projection period.
Figure 7: Average Household Size Comparison between 2008-based and 2011-based projections, England
2.15
2.20
2.25
2.30
2.35
2.40
2011 2012 2013 2014 2015 2016 2017 2018 2019 2020 2021
Ave
rage
Hou
seho
ld S
ize
2008-based
2011-based
There is a lower level of growth in the number of households in all age bands except the 45-54, 55-64 and in the under 25 age bands. For these age bands the additional growth stems from both higher population levels than in the 2008-based projections and higher household representative rates.
Table 8: 2011-based household projections compared with 2008-based household projections, by age, England
2011-based projection 2008-based projection thousands Average annual change 2011 – 2021 Average annual change 2011 – 2021 Difference * Under 25 -2 -6 3.2 25 – 34 23 49 -26.3 35 – 44 15 22 -7.5 45 – 54 17 11 6.6 55 – 64 50 47 3.1 65 – 74 46 48 -2.5 75 – 84 40 41 -1.4 85 + 32 33 -0.2 All households 221 245 -24.9
*Differences in percentage points need to be interpreted as indicative only because of the change in population base
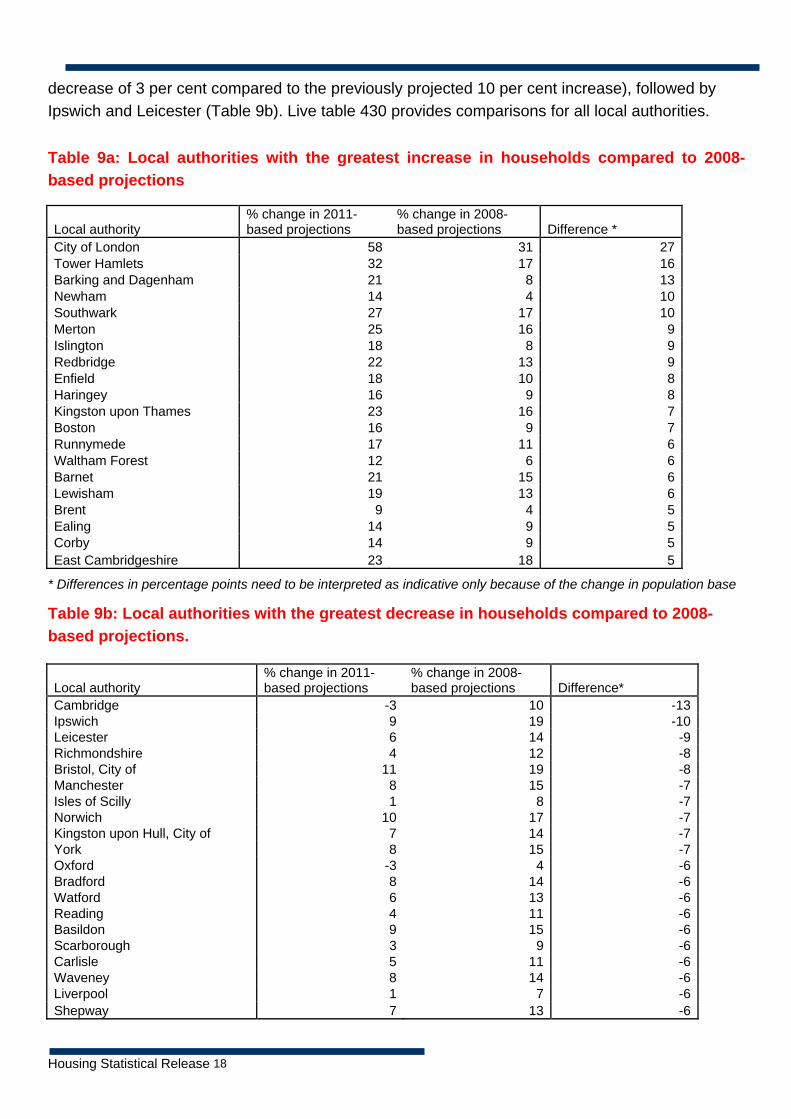
The local authorities with the greatest increase in households compared to the 2008-based projections are all in London, topping the list City of London, where households are projected to increase by 58 per cent compared to 31 per cent in the 2008-based projections, followed by Tower Hamlets and Barking and Dagenham (Table 9a). The local authorities with the greatest decrease compared to previous projections, are Cambridge (where 2011-based projections imply a
Housing Statistical Release 18
decrease of 3 per cent compared to the previously projected 10 per cent increase), followed by Ipswich and Leicester (Table 9b). Live table 430 provides comparisons for all local authorities.
Table 9a: Local authorities with the greatest increase in households compared to 2008-based projections
Local authority % change in 2011-based projections
% change in 2008-based projections Difference *
City of London 58 31 27Tower Hamlets 32 17 16Barking and Dagenham 21 8 13Newham 14 4 10Southwark 27 17 10Merton 25 16 9Islington 18 8 9Redbridge 22 13 9Enfield 18 10 8Haringey 16 9 8Kingston upon Thames 23 16 7Boston 16 9 7Runnymede 17 11 6Waltham Forest 12 6 6Barnet 21 15 6Lewisham 19 13 6Brent 9 4 5Ealing 14 9 5Corby 14 9 5East Cambridgeshire 23 18 5
* Differences in percentage points need to be interpreted as indicative only because of the change in population base
Table 9b: Local authorities with the greatest decrease in households compared to 2008-based projections.
Local authority % change in 2011-based projections
% change in 2008-based projections Difference*
Cambridge -3 10 -13Ipswich 9 19 -10Leicester 6 14 -9Richmondshire 4 12 -8Bristol, City of 11 19 -8Manchester 8 15 -7Isles of Scilly 1 8 -7Norwich 10 17 -7Kingston upon Hull, City of 7 14 -7York 8 15 -7Oxford -3 4 -6Bradford 8 14 -6Watford 6 13 -6Reading 4 11 -6Basildon 9 15 -6Scarborough 3 9 -6Carlisle 5 11 -6Waveney 8 14 -6Liverpool 1 7 -6Shepway 7 13 -6
19 Housing Statistical Release
Accompanying tables Accompanying tables are available to download alongside this release at https://www.gov.uk/government/statistical-data-sets/live-tables-on-household-projections
• Table 401: Household projections, United Kingdom, 1961-2033 • Chart 402: Household projections by household type, England, 2011-2021 • Table 406: Household projections by district, England, 1991- 2021 • Table 411: Household projections historical series, England, from 1861 • Table 414: Household projections by age & district, England, 2011- 2021 • Table 415: Components of household growth (from 2011 to 2021) by local authority • Table 417 Household projections: by age & household type (summary), England, 2011 & 2021 • Table 418 Household projections: by age and number of dependent children, England, 2011 & 2021 • Table 420: Household projections by type & district, England, 2011- 2021 • Table 424: Household projections by numbers of dependent children and district, 2011 & 2021 • Table 425: Total change, average change and percentage change in household projections for local
authority districts, England, 2011- 2021 • Table 426: Household population projections by district, England, 1991- 2021 • Table 427: Change in average household size, local authority districts and England, 2011- 2021 • Table 428: Total change, average change and percentage change in household population projec-
tions for local authority districts, England, 2011- 2021 • Table 429 : Sensitivity analysis of the 2011-based interim Household Projections using 2008-based
population, England, 2011- 2021 • Table 430: Comparison between 2011-based projections and 2008-based projections, England,
2011- 2021
Detailed data for analytical uses are also available for individual local authority areas.
Uses of the data The projections provide an important long term view of the number of households that would form given a projected population and previous demographic trends, showing the long-term trend in household numbers if previous demographic trends in the population and household formation rates were to continue into the future. These interim projections only span for a 10-year period so users that require a longer time span would need to judge whether recent household formation trends are likely to continue.
The household projections are not a forecast. That is, they do not attempt to predict the impact that future government policies, changing economic circumstances or other factors might have on demographic behaviour. They provide consistent household levels and structures at England and local authority level.
The projection model essentially combines population projections with Census data to give a view on likely household numbers 10 years into the future. It does not take into account the impact that future government policies, changing economic circumstances or other factors might have on demographic behaviour. While some short-term trends in household formation from the Labour

Housing Statistical Release 20
Force Survey (LFS) are taken into account, these are to provide a view on how long-term trends may be changing rather than to attempt to model short-term fluctuations in household formation across the economic cycle.
The data in this Statistical Release are important for a number of different purposes. They are used by the Secretary of State for Communities and Local Government, other government departments, local planning bodies and local authorities. The household projections provide an important part of the evidence base for the assessment of future requirements for housing and associated services.
The National Planning Policy Framework3 requires that assessment of future housing requirements in local spatial strategies should have regard to current and future demographic trends and profiles and take into account evidence including the Government’s latest published household projections.
The projections are also used in evidence-based policy decisions, answering Parliamentary Questions and other requests for information by Ministers, planning bodies, local authorities, other associations and the general public.
The household projections should be used as part of the evidence base regarding the future demand for housing that would arise as a result of these demographic trends. Users may wish to determine their own forecasts of how these projections could differ in light of alternative policy scenarios using local knowledge and models.
Data sources The household projections are produced using a number of component data sources. These are:
• Interim sub-national population projections published by the ONS in September 20124.
• Marital status projections (de jure and de factor) at the national level are taken from the latest ONS release (2008-based, published 24 June 2010). Projections at sub-national levels are assumed to follow the national pattern.
• The latest update of marital status estimates published on 29 November 2011.
• Household representative rates are extrapolated from Census data (1971, 1981, 1991, 2001, 2011), disaggregated by age, sex and marital status (except from 2011 Census, where disaggregated detail was not yet available for this update).
• Where 2011 Census data was not available to disaggregate the estimates of household
3 https://www.gov.uk/government/uploads/system/uploads/attachment_data/file/6077/2116950.pdf 4 http://www.ons.gov.uk/ons/rel/snpp/sub-national-population-projections/Interim-2011-based/stb-2011-based-snpp.html
21 Housing Statistical Release
representative rates, 2008-based projections and Labour Force Survey (LFS) data (from 2002 to 2010) were used to inform inter-Censual interpolations and future trends of household representative rates.
Data quality National Statistics are produced to high professional standards set out in the Code of Practice for Official Statistics. They undergo regular quality assurance reviews to ensure that they meet customer needs. They are produced free from any political interference. The main data sources for the household projections are also official National Statistics. The UK Statistics Authority is responsible for assessing compliance with the Code and for designating outputs of sufficient quality with the 'National Statistics' badge.
Department for Communities and Local Government have produced this statistical release but the work to produce the household projections was undertaken by Experian on behalf of the Department. All stages of the household projections work are quality assured by an independent Steering Group. This group includes national experts from Cambridge University, Reading University, Oxford Economics, Department for Communities and Local Government, Experian, Greater London Authority, independent advisors (formerly from Nottingham council and Birmingham council), ONS, Cambridge Centre for Housing and Planning Research, Welsh Assembly Government , Northern Ireland Statistics and Research Agency and the General Register Office for Scotland.
A detailed quality report is published alongside this report, which provides users information of the strengths of limitations of the 2011-based interim household projections.
Methodology The household projections are produced using the methodology developed for the 2008-based household projections. The availability of information from the Census 2011 meant that in some instances the methodology was adapted so this valuable source of information could be incorporated. A detailed methodology report is published alongside this release and therefore only a summary of the method is presented here.
The household projections are compiled using a two stage process.
Stage One produces the national and local projections for the total number of households by age group and marital status group over the projection period.
Stage One applies projected household membership rates to a projection of the private household population disaggregated by age, sex and relationship status and sums the resulting projections of household representatives. The number of people living in private households is estimated by taking the population projections for each year and subtracting the number of people living in communal establishments, such as student halls of residence, care homes or prisons.The household representative rates are projected from time trends estimated from past Census data

Housing Statistical Release 22
going back to 1971. The 2011 interim update includes information from the 2011 Census which together with data from the LFS has been used to create an additional data point that can be used in the household projections methodology at national level. The projections methodology uses time-series modeling which weights together simple and dampened logistics trends.
In Stage Two the Stage One estimates are disaggregated into detailed household types. Information on household composition for the 2011-based update has been taken from the 2001 and 2011 Census. Estimated headship (and non-headship) rates are projected forward using a modified two-point exponential model by local authority area and age group of the head of household.
A detailed description of the methodology and data sources used in the household projections is available at http://www.communities.gov.uk/housing/housingresearch/housingstatistics/housingstatisticsby/householdestimates/
Related statistics These projections relate to England only. Data for the devolved administrations can be found at:
• Wales www.statswales.wales.gov.uk • Scotland http://www.gro-scotland.gov.uk/statistics/theme/households/projections/index.html • Northern Ireland http://www.nisra.gov.uk/demography/default.asp21.htm
Revisions policy This policy has been developed in accordance with the UK Statistics Authority Code of Practise for Official Statistics and the Department for Communities and Local Government Revisions Policy. Scheduled Revisions Household projections are produced following the release of sub-national population projection by the ONS. There are no scheduled revisions for the projections data series, rather each set of projections supersedes the previous set. Projections for historic years are generally updated in line with revision to the population estimates. In the 2011-based update historic data has not been updated as there is no consistent update of the sub-national population data. Non-Scheduled Revisions If a substantial error occurred as a result of the compilation or dissemination process, the statistical release, live tables and other accompanying releases would be updated with a correction notice as soon as it is practical. Similarly, if substantive changes were issued for the sub-national population projections, the household projections may be revised in a consistent manner.
23 Housing Statistical Release
Glossary
The definitions of key terms used in this release are:
Household Throughout this release the 2001 Census definition of household is used. The definition was changed slightly for the 2011 Census but the disaggregated level information from the 2011 Census was not yet available for this update. ‘A household is defined as one person living alone, or a group of people (not necessarily related) living at the same address with common housekeeping – that is, sharing either a living room or sitting room or at least one meal a day.’ Households are divided into seventeen detailed household types based on the 2001 and 2011 Census. These are presented for five aggregate categories:
• A couple with no other adults: a household which contains one family and no others, comprising of a married or cohabiting couple, with or without dependent children.
• A couple with other adults: a household which contains one or more married or cohabiting couple families with one or more other adults present, with or without dependent children.
• Lone parent household: a household which contains one or more lone parent families, but no married couple or cohabiting couple families.
• One person household: a person living alone who shares neither housekeeping nor a living room with anyone else.
• Other household: a multi person household that is neither a couple household nor a lone parent household. Examples include lone parents with only non dependent children, brothers and sisters and unrelated (and non-cohabiting) adults sharing a house or flat. This category does not include households with dependent children.
Dependent child A dependent child is a person in a household aged 0 to 15 (whether or not in a family) or a person aged 16 to 18 who is a full time student in a family with parents. Household representative The household representative is the individual that is taken to represent that household. This is usually taken as the eldest male within the household.
Housing Statistical Release 24
Household representative rate The household representative rate is the probability of anyone in a particular population group being part of a separate household and can take any value between 0 and 1. The population groups are defined according to sex, age (15 bands from 15-19 to 85 and over) and relationship status group. This gives 75 population groups and 75 representative rates in total. Institutional population The institutional population is the population wholly resident in communal establishments. A communal establishment is defined in the 2001 Census as ‘an establishment providing managed residential accommodation’. ‘Managed’ means full-time or part-time supervision of the accommodation. Examples of communal establishments are prisons, large hospitals, managed university accommodation, hotels, guest houses and sheltered accommodation. Household population The private household population is the total resident population minus the institutional population.
Background notes
1. The 2011-based interim household projections for England and local authorities update the 2008-based projections that were published in November 2010.
2. The next release of household projections will be published following the production of the next release of sub-national population projections by the ONS. The ONS are currently planning to produce 2012-based sub-national projections in spring 2014.
User consultation Users’ comments on any issues relating to this statistical release are welcomed and encouraged. Responses should be addressed to the "statistical enquiries" contact given in the "Enquiries" section below.
Enquiries
Statistical Enquiries:
Contact: Yolanda Ruiz via the Housing Statistics enquiry line at E-mail: [email protected]
Media Enquiries:
Office hours: 0303 444 1157 Out of hours: 0303 444 1201 E-mail: [email protected]

25 Housing Statistical Release
Department for Communities and Local Government. © Crown Copyright, 2013 If you require this publication in an alternative format please email: [email protected]. Please note that the nature of content means that we may not be able to provide the Statistical series of publications in all requested formats. April 2013 ISBN: 978-1-4098-3856-2