Embed Size (px)
Citation preview
1
Housing Development and Urbanisation in China
Dan Luo , Shujie Yao and JianlingWang
University of Nottingham
Abstract: Rapid urbanisation and rising income have led to a strong demand for
housing in urban China. However, housing development has been distorted by
speculation, income inequality and lack of government support for low-cost houses.
In recent years, house prices become so high, making the vast majority of urban
residents unable to afford, whereas rich families are able to buy many and leave them
vacant. Income inequality is a major cause for rising house prices, which, in turn,
exaggerates income inequality further. This vicious relationship has caused social
tension between the rich and the poor and unhappiness among the middle and low
income groups. This paper discusses the factors responsible for the housing bubble in
China and recommends appropriate policies to resolve this problem.
Key Words: Economic affordable housing, China, Inequality
1. Introduction
The Chinese economy has grown rapidly for more than 30 years since 1978, with its
gross domestic product (GDP) growing at almost 10% per year during 1978-2010
(NBS, 2010). Despite the world financial crisis and the worsening European debt
crisis, China’s GDP still rose 9.2% in 2011 (NBS, 2012).
Such rapid economic expansion has raised people’s living standards and incomes
enormously, triggering a rising demand for consumer goods in general and
commercial housing in particular. A normal rise in housing demand and prices is
healthy for the country’s economic development and urbanisation. However, if house
prices rise too rapidly, making houses unaffordable by the vast majority of the
ordinary urban residents, it is a clear sign of housing bubble.
There are two detrimental consequences once the bubble becomes too big. First, it
will exclude many ordinary people from the housing market, generating a strong
sense of unhappiness among the population. Second, once the housing market bubble
2
bursts, it may bring China into a deep financial crisis and jeopardise its long term
ambition to become a world economic superpower in the future.
Starting from the second half of 2009 when the turbulence caused by the collapse of
the Chinese stock market and the world financial crisis has yet been fully arrested,
another round of economic bubble originated from China’s property market started to
emerge. Although the central government adopted various methods to cool the market
down, the monthly growth rate of sales prices of 70 large- and medium-sized cities
remained at a high level of more than 12% from March to May 2010.
The housing market bubble was fuelled by the so-called ‘land kings’ (single pieces of
land sold at ridiculously high and record-breaking prices) in Beijing and other major
cities throughout the country. Before the 2010 Chinese Spring Festival, hundreds of
thousands of rich Chinese flew to Hainan Island to queue for buying any houses
available there. Overnight, the cost of a hotel room in Sanya City at the south end of
the Island went up to over RMB 30,000 for one night, while the normal price was
about RMB 1000-3000 per night. House hunters offered prices doubling, or even
tripling the existing level within weeks. In Hangzhou, some developers raised the
selling price of new houses by RMB 4000 per squared-metre in one day. The
incremental price on top of the local average price of RMB 15,000 per squared-metre
was truly shocking to anyone in and outside China.
By March 2010, house prices in some large Chinese cities were as high as, or even
higher than those in the major cities outside London in the UK, but per capita GDP of
China was only one-eighth that of the UK. This level of house price is obviously
unsustainable in China. It was this alarming situation that triggered the central
government to issue a series of regulations in the following months, aiming at
appeasing the market, each more aggressive than the other.
The latest policy required buyers for a second home to have a down payment worth
50% of the house value and pay an interest rate 1.1 times the normal market rate. It
also urged commercial banks not to lend to those buying a third house. From May
2011, the central government ordered all the main cities throughout China to restrict
the numbers of houses each household could buy.
3
The sincerity and seriousness of such policy suggested that without government
intervention, the Chinese housing market would run out of control with unforeseen
devastating consequences. Thanks to these policies, house prices have been stabilised
but at the cost that house sales has declined sharply in some major cities. In the first 9
months of 2011, housing stock accumulated to over 45 million squared-metres in 8
large cities, and house sales declined by 44% in September alone (Caijing, 2011).
The overheating housing market and the unusual government policies to cool down
the market spark our research curiosity to explore the true nature of housing market
development in China. It is imperative to understand the history of the Chinese
housing market and its key drivers for demand and supply. It is also important to
know the extent to which the housing market bubble has been developing and the
potential consequences of rising house prices and the bursting of the housing bubble.
Given the importance of housing in people’s life, it has been argued that allocating
houses to individuals who only enjoyed the living rights was one of the biggest wealth
redistribution in China’s post-1949 history before economic reforms (Li, 2004).
However, the old policy was considered to be highly inefficient for housing
development. In addition, only a small proportion of the population had benefited
from the system.
Hence, China has faced an important dilemma in its housing policy, that is, how to
improve people’s living space, but at the same time, make sure that low and middle
income people are able to find affordable housing? Housing market reforms have
encountered many new challenges, such as how to balance the development of low-
cost (including rented) houses and commercial houses and how to balance housing
demand and urbanisation?
To analyse these questions, this paper starts from reviewing the history of the Chinese
housing market system from 1949, paying attention to housing market reforms after
1978. It will then examine the situation of the current housing market and how its
development will meet China’s long term goals of urbanisation and the establishment
of a harmonised society. It will compare the house prices in China and those in other
4
countries to see whether there is a housing market bubble in the making. Finally, it
will make some policy recommendations for China’s future housing development
over the next 20 to 30 years. A few scenarios of house construction and urbanisation
will be presented to see when and how China may be able to achieve its long term
development goals. The research results are not only important for understanding the
Chinese housing issue at present but also help us design some useful policies for the
country in the future.
2. Review of the Chinese Housing System
2.1 Housing market prior to economic reforms (1949-78)
A Soviet-style Chinese urban housing market was established in 1949. Along with
land reform, urban lands were nationalised and owned by local governments who
were empowered to allocate lands to various state-owned bodies, such as state-owned
enterprises (SOEs), administrative organisations and public institutions (Wang and
Murie, 1999). In the 1950s and 1960s, private houses in urban areas were gradually
transferred to local governments. In the meantime, the government built large
quantities of public housing through industrial expansion and urban renewal
programmes (Wang, 1995). Housing was regarded as welfare provision to state
employees, often through their work units such as SOEs and government agencies.
This housing system had two important features. First, the state through its agents
made decisions and regulations on investment, management, allocation and control of
houses. Second, rent incomes (very low) were used to support maintenance and
further development. This system had many problems. It neglected the role of market.
The floor space allocated to state employees did not depend on their performance but
on their job rankings, length of services, household size and profitability of
enterprises. Meanwhile, different work units were also treated differently. Larger
work units with higher administrative ranking and producing crucial products for the
state, provincial, or municipal plans had larger funds available for housing
construction. For smaller or collective work units, they could not afford to build
enough houses for their employees who then had to rely on private or municipal
housing which was of low quality and small (Walder, 1986).
5
Data from the NBS shows that although per capita floor space of residential building
in urban China improved to 7.6 m2 in 1978, in some big cities, such as Haerbin and
Guangzhou, per capita floor space remained as low as 2.93 m2
and 1.5 m2 respectively
(Zhang, 2009). Inequality and non-transparent land allocation and inadequate rents
impeded further housing construction and consequently imposed a heavy burden on
work units. Combined by accelerated economic development and rapid rise in urban
population, drawbacks of such welfare housing system became ever more apparent,
leading to its full abolition in the late 1970s.
2.2 Housing reforms from 1978
In accordance with China’s economic reform, its market-oriented housing reform had
also been implemented, aiming at increasing efficiency in the overall investment,
construction and allocation processes. The whole reform during the past 30 years
could be roughly divided into four stages.
The first sub-period 1978-88 witnessed the gradual sales of existing public housing to
state employees along with an acceleration of urbanisation. In the early 1980s, Beijing
Property Development Company was established and a series of new housing policies
was initiated by the government, such as the “third-third management system (san-san
zhi)”: existing or newly built public houses were sold to state employees but three
different parties, employees, enterprises and government, was each responsible for
one-third of the construction cost (Zhou and Logan, 2002).
The new system enabled the work-units to withdraw from direct housing construction
and urban development was centrally controlled by the government under the
principle of “six integration (liu tong yi)”: integration in planning, investment, design,
construction, distribution and management (Wang and Murie, 1999). Consequently,
large scale integrated urban development projects were implemented.
However, at this stage, housing was still heavily subsidised by enterprises as urban
incomes remained low. Worse more, some local governments transferred their duties
to the work-units and consequently made it almost impossible for small and private
6
firms to build houses for their employees. Nevertheless, for some SOEs operating in
favourable economic sectors with high profitability, sufficient funds were provided to
assist their employees for house purchasing. Such arrangement caused severe
inequality in house distribution, posing a heavy burden on the work-units. In 1986, the
central government issued related policies to prohibit discounted public housing
transaction and since then, urban public houses were sold at full price (Li, 2007).
The second stage of housing reform was during 1988-98 along with land reform. It
was the first time when ownership of state-owned land was allowed to be sold to
private individuals in China for up to 70 years (Wu, 2001). Under the new system,
land ownership structure had not been changed but local governments were given the
authority to acquire and sell land ownerships fixed for 70 years to developers. Three
methods, negotiation, invited tendering and auction, were proposed to auction for land
ownerships (Wang and Murie, 1999). However, the actual impact of the change was
quite limited as most land was still leased via negotiation rather than auction (Yeh and
Wu, 1996).
During this period, housing reform was directed at replacing the in-kind housing
allocation with a monetized housing distribution system. Through raising rental cost,
enhancing household incomes and increasing housing subsidies, the government tried
to encourage private house purchasing (Li, 2007). A number of preferential policies,
such as “strive to develop affordable housing” and “giving permission to sell
purchased old public houses in an open market after five years ownership” were
issued to stimulate demand. During Xiaoping Deng’s 1992 southern tour, he iterated
the determination of the government to establish a full market-oriented housing
system with more houses being built for the low- and meddle-income families.
Thereafter, investment in housing development surged. In 1992 and 1993, the growth
rate of investment in real-estate development reached 117.6% and 165% respectively,
while the GDP growth rates were 14.2% and 13.5% respectively over the same period
(Zhang, 2008). Such fast expansion caused serious inflation, resulting in the first
country-wide housing boom in late 1993.
To cool down the over-heated housing market, the Chinese government implemented
a series of adjustment approaches, pushing the housing reform to a new stage. In 1994,
7
the first real-estate legislation, “China Urban Housing Management Law” was passed
in the eighth National People’s Congress, setting up the basic rules for China’s real-
estate industry. In the same year, the State Council published “Several opinions on
deepening the urban housing system reform”, emphasising the strategic importance of
the real-estate industry in the overall economy.
In 1995, the “Comfortable Housing Project (anju gongcheng)” was lunched to provide
affordable housing to low- and middle-income families as houses were required to be
sold at construction costs. Meanwhile, collective house construction by work-units
and employees were encouraged. Although the policy was criticized for causing
problems in fund collection, construction standard unification and property right
allocation, it greatly helped improve the housing condition of urban households. Since
then, the government started to build up a multi-level housing system which aimed at
protecting the interests of those economically disadvantaged groups by offering them
houses with social security nature, while for people with higher income, they had to
buy commercial houses from the market at higher prices.
In the meantime, the housing provident fund was set up to facilitate house
construction and consumption (Zhang, 2008). Thereafter, the Chinese housing market
experienced a relatively healthy expansion until 1997, when the real-estate industry
was hit by the Asian financial crisis badly.
The third stage of housing reforms started from 1998. The central government
implemented a series of new policies to further transform the old housing system. The
main reform during this period was to classify households into three different
categories as income distribution in China became highly polarised.
Based on the classification of households, three kinds of houses were proposed to be
built: low-rent housing for low income households, economic and affordable housing
for middle income households and commercial housing for rich households. The first
two kinds of houses required different levels of state subsidies while the latter type
was intended to be sold at full market price. This policy sound very reasonable and
attractive but when it was actually implemented, two big problems emerged. First, it
was very difficult to classify households into different income groups. As a result,
8
low-rented and economically affordable houses were not necessarily allocated to the
neediest families. Rampant corruption at the local levels often exacerbated unfairness
in the house allocation system. Second, as low-rented and low-cost housing were
highly unprofitable compared to commercial housing, developers were more willing
to build commercial houses although this might violate state regulations.
After the Asia financial crisis, house construction was selected to become a national
pillar industry. In July 1998, the State Council issued “The notice of further deepening
urban housing reform and accelerating housing construction”, clearly stating that the
welfare housing system characterised by in kind allocation would be abolished and
replaced by a full functioning real-estate market by the end of the year (Feng and Ni,
2009). Under the new policy, newly started floor space in 1998 alone reached 203.9
million m2, up by 45% from the previous year. The growth rate of investments in
housing was twice as high as that of GDP, increasing by 17% per annum during 1998-
03 (NBS, 2008).
The booming real-estate industry prompted a sharp rise of house prices. Developers
exclusively focused their investments in profitable commercial housing, ignoring
government’s call for building “economically affordable housing” which was
restricted to have a low profit margin of 3%. From 1998 to 2003, the share of
economic housing in newly started floor space for residential houses declined from 23%
to 13% (NBS, 2008). Consequently, a large number of commercial houses had been
built but remained too expensive for the low and middle income households.
In 2003, the State Council restated the importance of controlling house prices at an
acceptable level and the necessity of building a sound housing security system.
However, lack of control on the application and purchase of “economically affordable
housing” and inadequate supply of “low-rent houses” made it difficult to solve the
housing problem for the socially or economically disadvantaged groups. Rental
incomes from low-rent housing were far from enough to support maintenance and
construction, turning the profit-oriented real-estate developers away from building
low-rent houses.
9
The fourth stage of housing reform from 2006 started to put more emphasis on
controlling house prices and offering more support to poor urban households. People
eligible to purchase “economically affordable housing” were changed to low-income
households only and house developers were required to increase the supply of smaller
and low-cost houses. In the meantime, land supply was under the guideline of
“limited selling price and habitable area” to enable real-estate developers to build
‘price-limited’ houses for middle income households.
In 2007, the State Council issued “Several opinions on solving the housing problem of
low-income urban households” and founded the Department of Housing Security
attached to the Ministry of Housing and Urban-rural Development (Feng and Ni,
2009). It was mainly responsible for formulating housing security related policies and
managing the central fund for “low-rent housing” development. Such arrangement
fully reflected the great importance attached by the central government on resolving
the housing difficulty of the urban poor. Despite all these positive acts, issues related
to more effective regulation of the real-estate market, in particular, land transaction
and housing construction by developers remained unresolved.
3. Current situation of China’s commercial housing system
3.1 Chinese housing market after 30 years of reform
After more than 30 years of reform, a comprehensive housing security system has
been established, dominated by ‘low-cost housing’, ‘price-limited housing’ and ‘low-
rent housing’. Up to 2008, all the major cities in China have established the low-rent
housing scheme, ameliorating the living condition of almost one million low-income
urban households (Zhang, 2009). Meanwhile, the housing provident fund system has
also been set up to assist employees to purchase commercial houses.
In 1978 when the economic reform started, per capita floor space of residential
building in urban China was just 6.7 square meters. Thirty years later, this figure rose
10
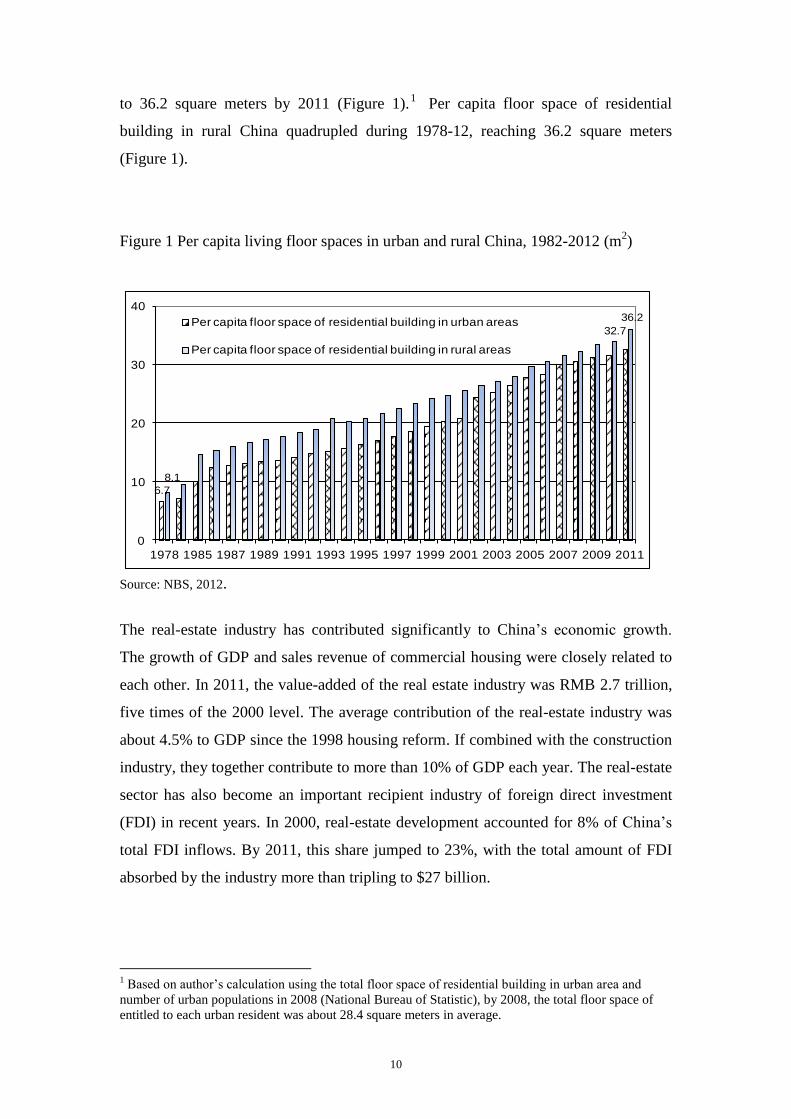
to 36.2 square meters by 2011 (Figure 1).1 Per capita floor space of residential
building in rural China quadrupled during 1978-12, reaching 36.2 square meters
(Figure 1).
Figure 1 Per capita living floor spaces in urban and rural China, 1982-2012 (m2)
6.7
32.7
8.1
36.2
0
10
20
30
40
1978 1985 1987 1989 1991 1993 1995 1997 1999 2001 2003 2005 2007 2009 2011
Per capita floor space of residential building in urban areas
Per capita floor space of residential building in rural areas
Source: NBS, 2012.
The real-estate industry has contributed significantly to China’s economic growth.
The growth of GDP and sales revenue of commercial housing were closely related to
each other. In 2011, the value-added of the real estate industry was RMB 2.7 trillion,
five times of the 2000 level. The average contribution of the real-estate industry was
about 4.5% to GDP since the 1998 housing reform. If combined with the construction
industry, they together contribute to more than 10% of GDP each year. The real-estate
sector has also become an important recipient industry of foreign direct investment
(FDI) in recent years. In 2000, real-estate development accounted for 8% of China’s
total FDI inflows. By 2011, this share jumped to 23%, with the total amount of FDI
absorbed by the industry more than tripling to $27 billion.
1 Based on author’s calculation using the total floor space of residential building in urban area and
number of urban populations in 2008 (National Bureau of Statistic), by 2008, the total floor space of
entitled to each urban resident was about 28.4 square meters in average.
11
Nevertheless, such drastic expansion also caused various side effects. The original
thought of establishing an integrated system which provides multi-level housing
targeting on buyers with different economic capacity was far from complete. In rural
areas, house supply still mainly depends on self-construction, whereas in the urban
areas, developers monopolize the market, forcing house buyers to accept whatever the
price is on offer (Xue, 2009).
Average selling prices of residential buildings went up by almost 269% during 1998-
2011 in urban China. As China is such a large country, house prices vary enormously
between cities. The selling price of residential buildings in 18 out of 31 provinces,
municipalities and autonomy regions doubled during the period 2005-2011. While in
Beijing, Zhejiang and Hainan, urban house prices rose as much as 152%, 147% and
218% respectively over the same period. Despite a flattering property sales and price
in the first half of 2009 due to the world financial crisis, the market revived sharply in
the second half of the year, inflated by the government’s RMB 4 trillion stimulus
package and RMB 9.6 trillion of new bank loans.
In addition, the housing provident fund system in China is also problematic, not only
because of its insufficient coverage but also because of the low efficiency usage of
funds. By the end of 2005, 63.3 million people in China had joined the system, with
an accumulative fund of RMB 626 billion (Jia and Liu, 2007). However, only 45% of
the fund was granted as housing loans while the rest was either deposited in banks or
managed by professional fund management institutions.
3.2 House price rise: a demand-supply analysis
There is no doubt that rising house prices have created many social problems in China.
Nevertheless, house price continued to rise and a large number of property
development projects were being undertaken. People are curious about the impetus
behind such enormous growth.
In terms of demand, housing has always been a scarcity product due to a large
population base and rapid urbanization in China. According to the sixth population
census, urban population accounted for 49.7% of China’s total population of 1.34
12
billion in 2010. This share rose to 52.6% by 2012. Out of the urban population,
however, 260 million were non-registered (Hukou) residents, who were mainly rural-
migrant workers living in cities for at least six months with or without their families
by the time of census. Over the same period, urban residential housing increased by
5.6 billion square meters, or 37 square meters for each new urban resident.
However, only one-third of these new buildings were commercial houses available to
the general public, leaving just over 10 square meters of living space for each of the
additional urban resident (China Statistical Yearbook, 2011). In addition, as wealthy
households tended to buy two or more houses, the amount of floor space left for the
low income groups became quite limited. This creates a fragmented demand market.
On one hand, there is always a hunger for housing but the poor are excluded from the
market due to rising prices. On the other hand, more and more houses are being built
for the wealthy people who have every temptation to buy more and more houses in
expectation of high investment returns.
Rising house prices have also been propelled by rapid household income growth. On
average, house price inflation is lower than the growth rates of urban per capita
disposable income and employees’ earnings. As a result, the demand for housing,
especially for high-quality housing, increased more strongly over time, prolonging the
housing boom.
Another factor pushing up house demand is China’s specific consumer behaviour. In
China, the psychological difference between owning and renting a house is huge, and
in most places, having a house is a pre-requisite for a boy to get married (Jia and Liu,
2007). House is not simply a place to live but a symbol of social status. Young people
tend to buy houses before they get married. Middle aged and high income people tend
to buy two or more than two houses for investment purposes and for their children, or
even grandchildren.
China’s homeownership is amongst the highest in the world. It reached 82% in 2008,
compared to 65.6%, 69%, 55%, 60% and 40.5% respectively in the US, the UK,
France, Japan and German (Dai, 2009). Houses are normally bought by young people
who are heavily subsidised by their parents and grandparents, draining away lifelong
13
savings of two or three generations. That explains why house prices are high and
increasing at all times, resulting in exceptionally high price/earnings ratios.
The gradual change of household structure also contributes for rising house demand.
In 2011, average household size was 3.07, down by 10% from 3.42 in 2001 (NBS,
2009). Although the decline in household size is not large, given China’s large
population base, the number of households increased significantly. In 2008, there
were 372 million households in China, which would be 37 million less had the
average household size remained at its 2000 level. The household size in the urban
areas declined much faster than that in the countryside. For instance, over the same
period, the average household size in Beijing and Shanghai declined by 12% and 13%
respectively.
Lack of investment channels is another reason for people to invest heavily in the
housing market. Bank deposit rate was low and was unable to keep up with inflation,
reducing people’s incentives to make savings in banks. As investments in the stock
markets had suffered enormous losses during 2007-08 and remained bearish since
then, people were left with no choice but relying on the housing market for better
returns (Yao and Luo, 2009).
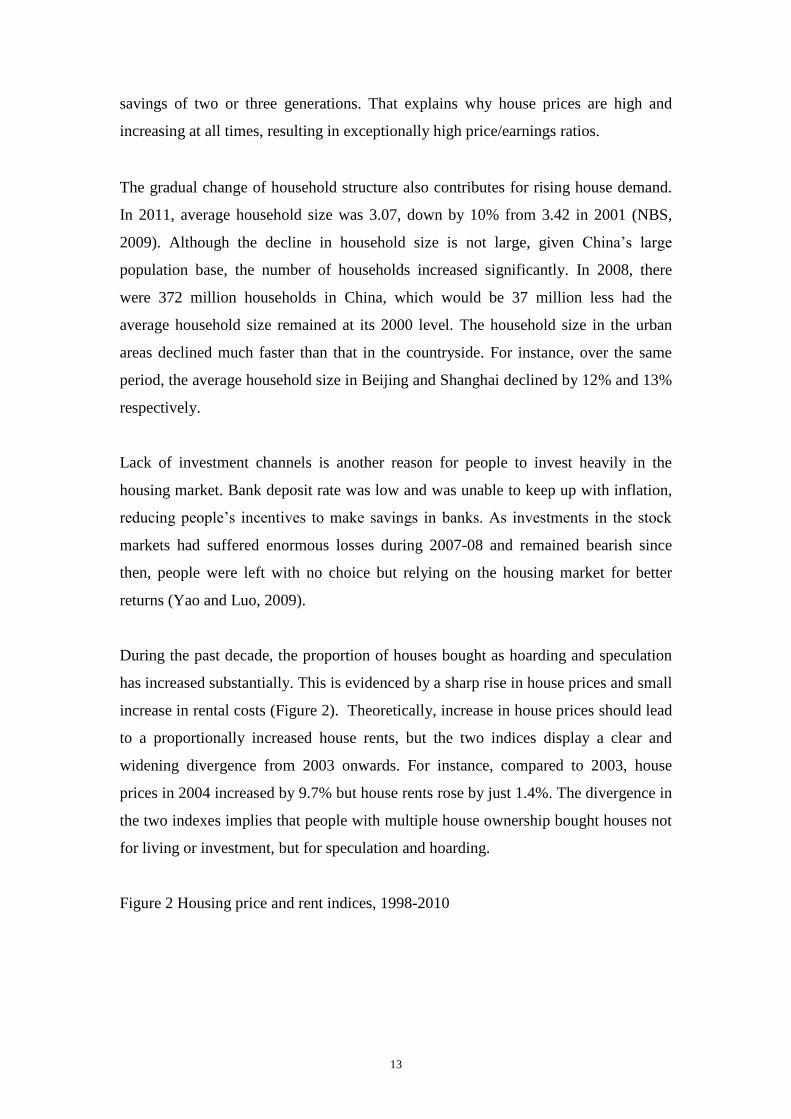
During the past decade, the proportion of houses bought as hoarding and speculation
has increased substantially. This is evidenced by a sharp rise in house prices and small
increase in rental costs (Figure 2). Theoretically, increase in house prices should lead
to a proportionally increased house rents, but the two indices display a clear and
widening divergence from 2003 onwards. For instance, compared to 2003, house
prices in 2004 increased by 9.7% but house rents rose by just 1.4%. The divergence in
the two indexes implies that people with multiple house ownership bought houses not
for living or investment, but for speculation and hoarding.
Figure 2 Housing price and rent indices, 1998-2010
14
101.4 101.4 102.5104.8
108.6
113.9
124.9
134.3
141.8
152.6162.5
164.9
181.4
102.4
118.9125.1
80
100
120
140
160
180
200
1998 1999 2000 2001 2002 2003 2004 2005 2006 2007 2008 2009 2010
Overall house selling index
residential house selling price index
house renting price index
Source: National Bureau of Statistics (NBS).
Note: Prices in 1997 is used as base point.
On the other hand, some supply side factors also contributed to the inflating house
prices. House price rise may have resulted from the collusion between local
governments and property developers. Local governments favour high house prices
because they reap huge revenues from land sales. Property developers like high house
prices because they can achieve a large profit margin.
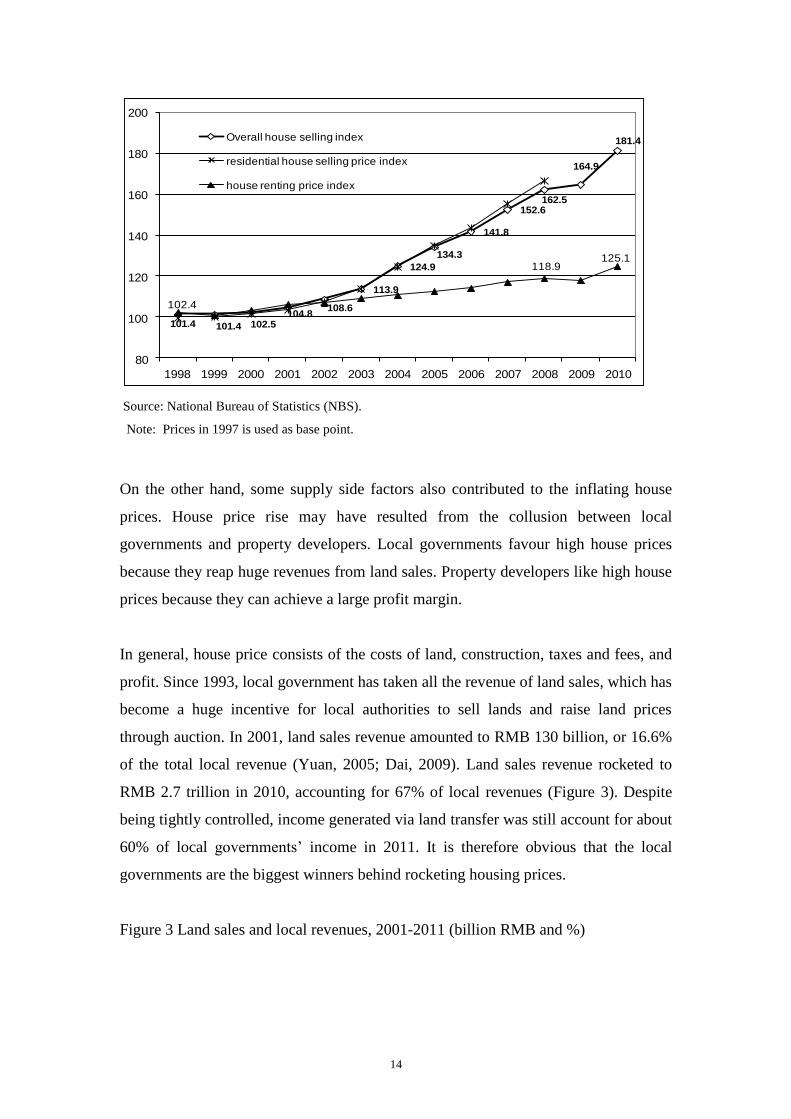
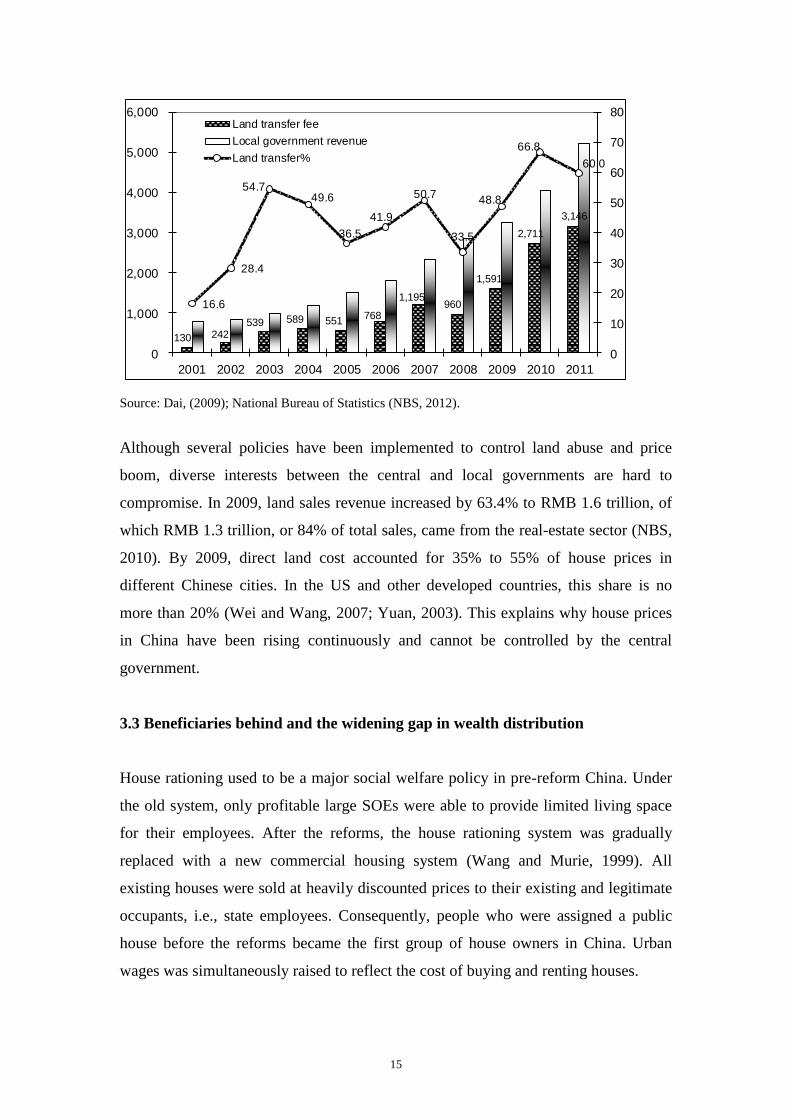
In general, house price consists of the costs of land, construction, taxes and fees, and
profit. Since 1993, local government has taken all the revenue of land sales, which has
become a huge incentive for local authorities to sell lands and raise land prices
through auction. In 2001, land sales revenue amounted to RMB 130 billion, or 16.6%
of the total local revenue (Yuan, 2005; Dai, 2009). Land sales revenue rocketed to
RMB 2.7 trillion in 2010, accounting for 67% of local revenues (Figure 3). Despite
being tightly controlled, income generated via land transfer was still account for about
60% of local governments’ income in 2011. It is therefore obvious that the local
governments are the biggest winners behind rocketing housing prices.
Figure 3 Land sales and local revenues, 2001-2011 (billion RMB and %)
15
130 242539 589 551
768
1,195960
1,591
2,711
3,146
16.6
28.4
54.749.6
36.5
41.9
50.7
33.5
48.8
66.8
60.0
0
10
20
30
40
50
60
70
80
0
1,000
2,000
3,000
4,000
5,000
6,000
2001 2002 2003 2004 2005 2006 2007 2008 2009 2010 2011
Land transfer fee
Local government revenue
Land transfer%
Source: Dai, (2009); National Bureau of Statistics (NBS, 2012).
Although several policies have been implemented to control land abuse and price
boom, diverse interests between the central and local governments are hard to
compromise. In 2009, land sales revenue increased by 63.4% to RMB 1.6 trillion, of
which RMB 1.3 trillion, or 84% of total sales, came from the real-estate sector (NBS,
2010). By 2009, direct land cost accounted for 35% to 55% of house prices in
different Chinese cities. In the US and other developed countries, this share is no
more than 20% (Wei and Wang, 2007; Yuan, 2003). This explains why house prices
in China have been rising continuously and cannot be controlled by the central
government.
3.3 Beneficiaries behind and the widening gap in wealth distribution
House rationing used to be a major social welfare policy in pre-reform China. Under
the old system, only profitable large SOEs were able to provide limited living space
for their employees. After the reforms, the house rationing system was gradually
replaced with a new commercial housing system (Wang and Murie, 1999). All
existing houses were sold at heavily discounted prices to their existing and legitimate
occupants, i.e., state employees. Consequently, people who were assigned a public
house before the reforms became the first group of house owners in China. Urban
wages was simultaneously raised to reflect the cost of buying and renting houses.
16
Although such company direct allocation and assisted house purchasing was officially
stopped since 1998, houses with welfare nature selling at severely discounted price
continued till the end of 2000 (Jian and Liu, 2007). Large SOEs, government
organisations and the army were key players in the institutional housing market. As
this group of people belong to the high income group, after they acquired cheap
houses from their organisations, they can then save money to buy additional
commercial houses. To a great extent, this distorted housing market explains why rich
people can occupy two or more than two houses, pushing up house prices and hence
excluding the poor from the housing market (Wang and Murie, 1999).
China’s house provident fund, which was established to help people to buy houses, is
also biased in nature. This fund is only available to registered formal urban employees
who account for less than one-quarter of the total urban labour force. As a result,
people who need help most are excluded from the system. The house provident fund
effectively helps accelerate the divide between the rich and the poor in urban China.
Property developers in China can be best described as a mediator of the housing
market. They obtain credits from banks and land from local authorities to build houses.
They then sell houses to urban residents. Bankers, local authorities and properties
developers share common interests, that is, profits. These three groups of people
collude with each other to achieve the highest possible sales revenues from buyers. To
do that, they have to create scarcity, complexity and opaqueness in the housing
market so that monopolistic power can be fully exploited for profit maximisation at
the expense of house buyers (Xue, 2007; Jian and Liu, 2007).
Finally, as the ultimate land owner and the only legal institution to acquire and sell
lands, local governments are the biggest beneficiary of the booming housing market.
Unlike in the western countries, houses sold in China do not involve the transfer of
land ownerships, but the right to use for up to 70 years. Therefore, to maximise profit,
the government on one hand slashes the agricultural land acquisition cost, while on
the other hand charges high land leasing fees from the developers. Apart from selling
lands, local governments levy more than 30 kinds of taxes and fees all the way
through project approval to final inspection and acceptance relating to house
construction and sales. All these charges in aggregate account for another 10-20% of
17
the house sale prices. Consequently, in total, local governments take over half of
house sales revenue through land sales, taxes and fees (Wei and Wang, 2007).
In summary, transforming the in-kind housing allocation to monetary subsidies based
on the housing provident fund is considered to be the most significant change to the
old housing system in China. However, due to serious market imperfection and
government interventions and control, not all the people have benefited from the
reform. In effect, house market reforms have exaggerated the social inequality
problem in China. SOEs employees, government officials, bankers and property
developers are the main beneficiaries, whereas the poor and low income people are
the biggest losers.
3.4 China-specific housing supply and demand curve
The previous sections explain various push and pull factors for rising house prices in
China. Inequality of house ownership is closely associated with wealth redistribution
and consequently leads to a deep division within the society. Figure 4 below shows
the supply and demand curves under the normal condition where the whole population
is relatively homogeneous.
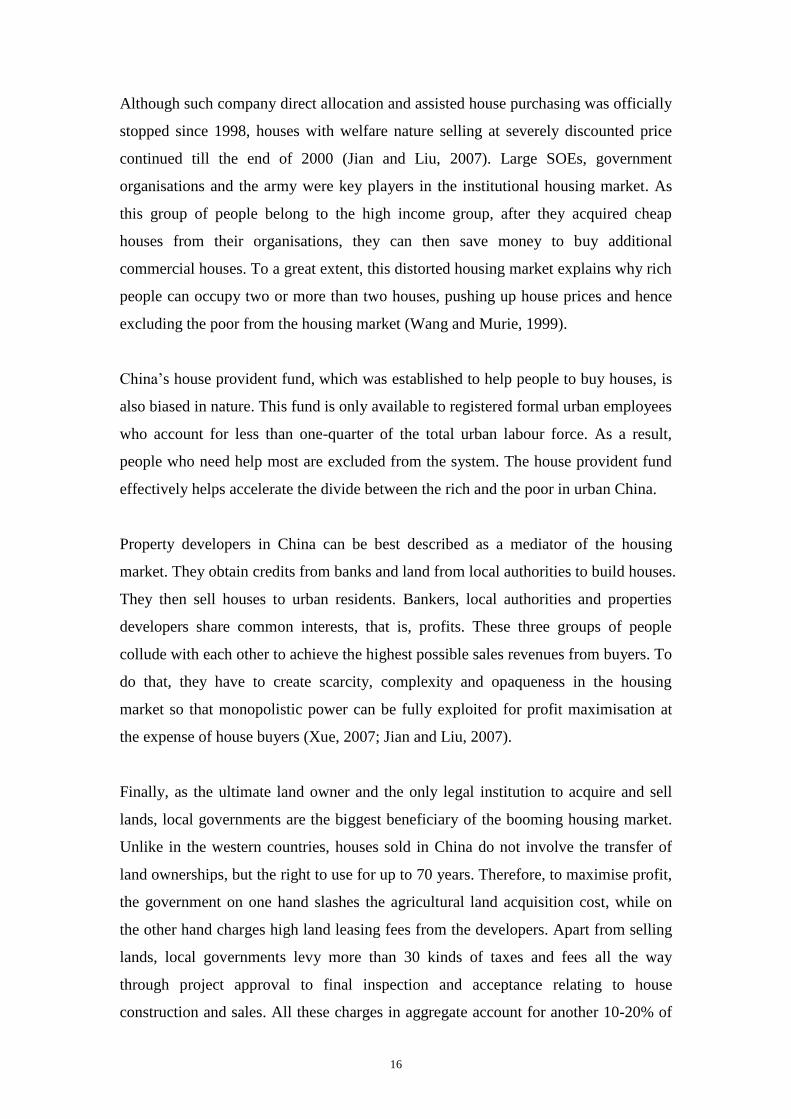
Figure 4 Supply and demand curves for a homogeneous population
S and D represent house supply and demand curves, respectively. At equilibrium
point A, the market clearance price is P1 and the quantity demanded is Q1. If the
0 Q
P
D
0
S
Q1
P1
S’
A
A’
Q2
2
P2
18
government wishes to reduce market price, it can help move the supply curve to the
right through providing more land for house construction, or relax various restrictions
on property development. The market price could be brought down to P2 and house
demanded increases to Q2 at point A’. This is a very simple but naïve solution to the
problem of housing shortage with high prices.
As the Chinese urban population can be divided into the rich and poor classes, the
population is heterogeneous and the house market can be represented by Figure 5.
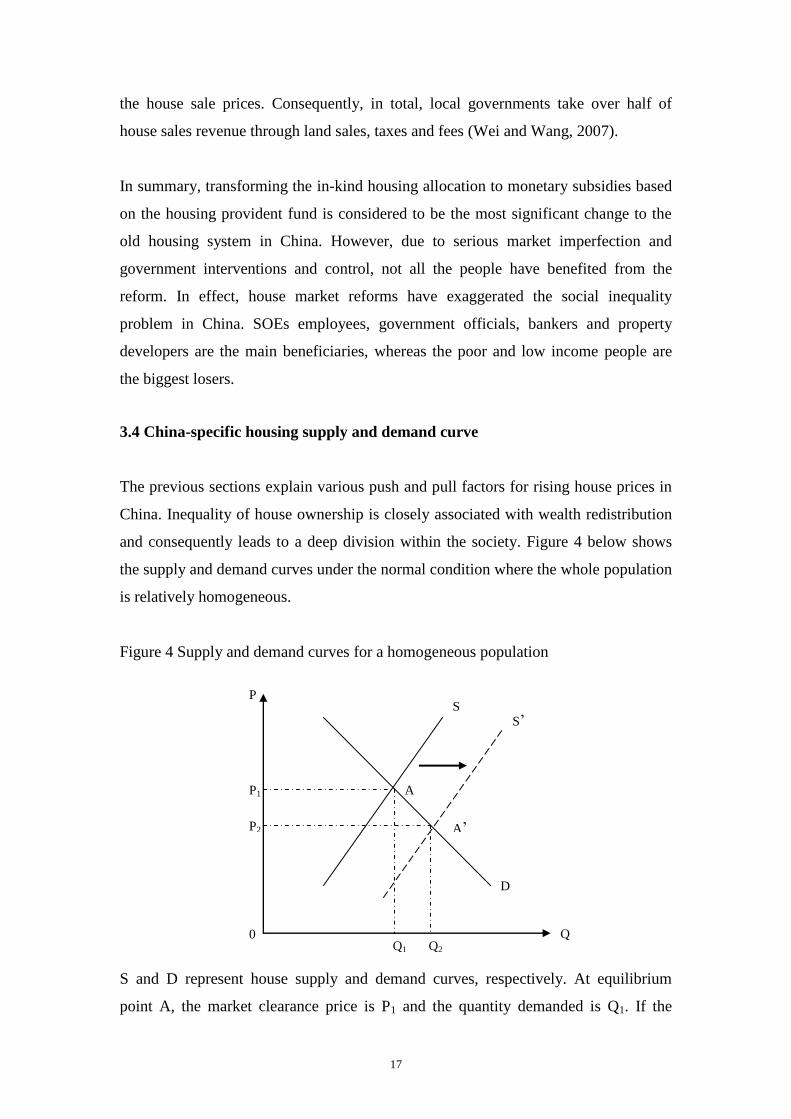
Figure 5 Supplies and demands of a heterogeneous population in urban China
Assuming urban China has two divided housing markets: commercial housing for the
rich and low-cost housing for the poor.
Sa and Da denote the supply and demand of commercial housing for high income
households. At equilibrium, market price and demand are respectively Pa and Qa.
The vast majority of low and middle income households are totally excluded from the
commercial housing market. They can only rely on low-cost housing. Sb and Db
respectively denote the demand and supply of low-cost housing by middle and low
income households. If there were sufficient supply of low-cost housing, the
equilibrium price and demand of low-cost housing would be Pb and Qb. As a result,
P Sa
Qb Qa’ Qa Qb’ Q
Sb
Da
Db
A1
A3
2
A2
Pa
Pb
Pb’
Pa’
19
despite the population being divided into two total different market segments, there
would not be housing shortage and excessive pressure on price.
The trouble is that the supply of low-cost housing is highly unprofitable compared to
commercial housing. Property developers only focus on building high-priced
commercial housing and little effort (land and investment) has been made to construct
low-cost housing. Assuming that low-cost housing supply is restricted to Qb’, there
would be a shortage of (Qb-Qb’) in low-cost housing, inducing an artificially high
market price of such houses at Pb’.
Shortage of low-cost housing has the following consequences. First, many middle and
low income households are not able to buy any houses. Second, prices of low-cost
housing are artificially high. Third, if the selling prices of low-cost housing were
capped at a level lower than Pb’ but still higher than Pb, house buyers would tend to
bribe housing officials to buy a low-cost house. Fourth, house shortage forces middle
and low income households to buy commercial houses in a desperate attempt to gain a
living space in the city. These four consequences explain why China’s housing is
always in short supply and why house prices have been unusually high by
international standards.
4. Household income and housing price
4.1 Income/price ratios of major countries
Housing bubble is a type of economic bubble which appears periodically in local or
global markets, notably in Japan in the early 1990s (Fackler, 2005) and the US after
2006. How to identify and prevent a housing bubble has been widely debated in the
literature (Baker, 2002; Case and Shiller, 2003; Garber, 2000; Siegel, 2003).
Case and Shiller (2003) argue that unrealistic expectation of future price is the
intrinsic reason for the formation of a housing bubble. However, how to define and
identify a housing bubble is not an easy task. The following outlines a series of
criteria to testify whether a bubble may exist.
House prices rise sharply and continuously;
20
Investments in real-estate development accounts for a large share of total
fixed-asset investment;
Price/income ratio is high and rises continuously;
Expenditure in housing to total household income ratio is high;
Price/rent ratio is high.
Hit by the world financial crisis, the Chinese housing market also plummeted by more
than 11.3% from 111.3 in January 2008 to 98.7 in March 2009, according to the index
of house sales price of 70 large- and medium-sized cities. However, due to China’s 4
trillion RMB stimulus package and 9.6 trillion RMB of new bank loans, house prices
picked up rapidly since April 2009. Average sales prices rose by 24% in 2009, and
another 16% during the first three months of 2010. In some cities, such as Beijing,
Shanghai and Shenzhen, sales prices increased by more than 50% over the same
period. The rapid growth of house prices triggers a hectic debate on whether there is a
huge housing bubble being developed in China.
One important indicator for a housing bubble is an unusually high house
price/household income ratio. According to the IMF, this ratio should be in the range
of 1.8 to 5.5 in developed nations and about 3 to 6 in emerging economies (Wei and
Wang, 2007). This ratio is well beyond the upper limits of the ranges in some major
Chinese cities (Table 1).
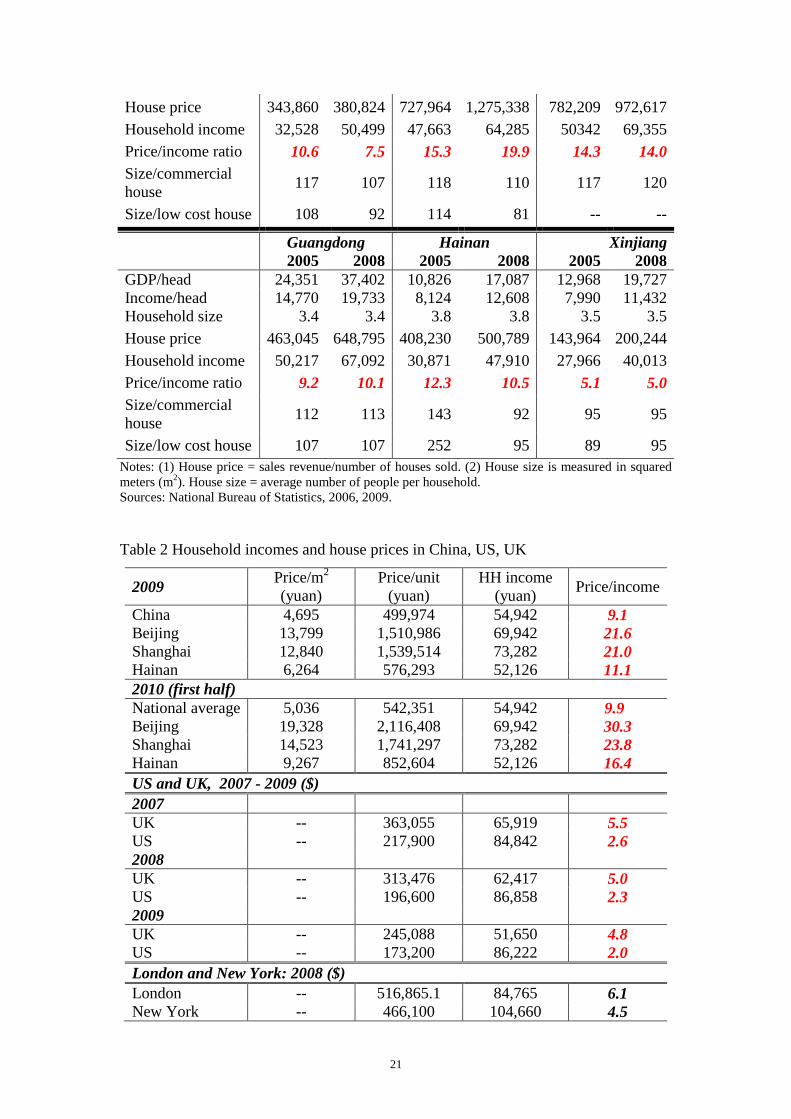
Measured by the house price/household income ratio, house prices in China’s main
cities are significantly more expensive than some of the world’s largest cities (Table
2). In the US and the UK, average house prices remained low in 2009 after the world
financial crisis. It is worth noting that even for cities with the highest house prices in
the UK and the US, none of them has a price/income multiple as high as that of
Beijing or Shanghai.
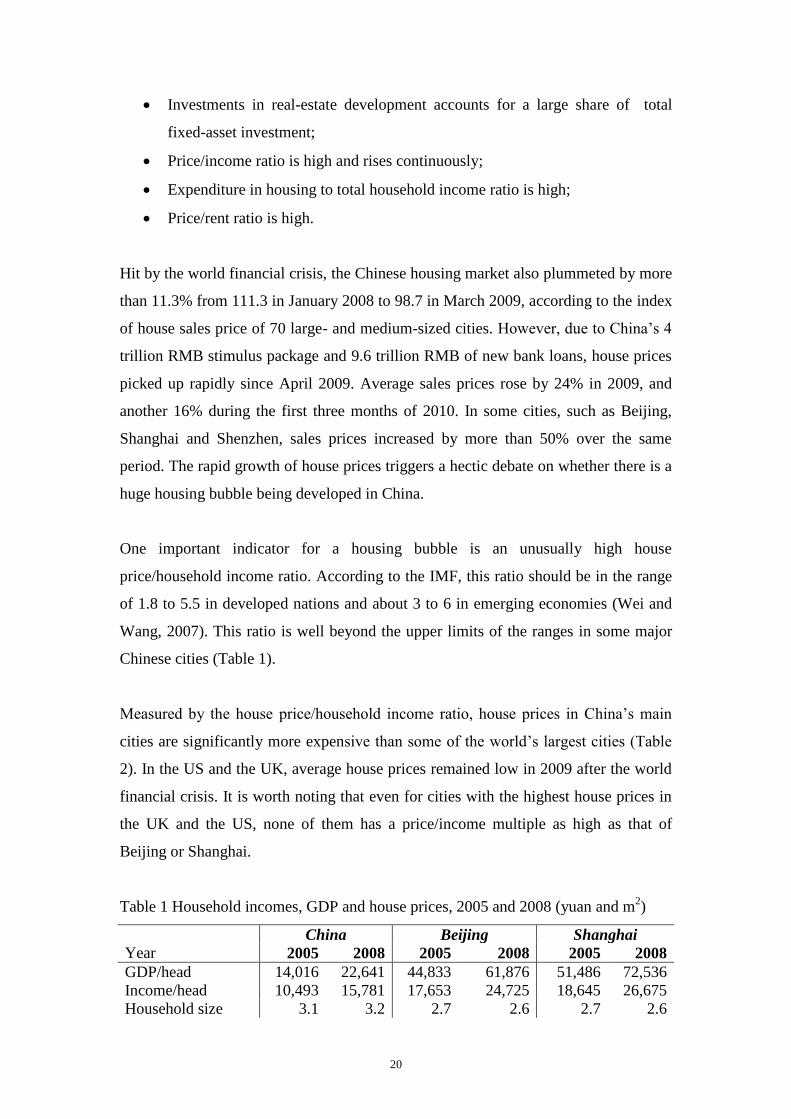
Table 1 Household incomes, GDP and house prices, 2005 and 2008 (yuan and m2)
China Beijing Shanghai
Year 2005 2008 2005 2008 2005 2008
GDP/head 14,016 22,641 44,833 61,876 51,486 72,536
Income/head 10,493 15,781 17,653 24,725 18,645 26,675
Household size 3.1 3.2 2.7 2.6 2.7 2.6
21
House price 343,860 380,824 727,964 1,275,338 782,209 972,617
Household income 32,528 50,499 47,663 64,285 50342 69,355
Price/income ratio 10.6 7.5 15.3 19.9 14.3 14.0
Size/commercial
house 117 107 118 110 117 120
Size/low cost house 108 92 114 81 -- --
Guangdong Hainan Xinjiang
2005 2008 2005 2008 2005 2008
GDP/head 24,351 37,402 10,826 17,087 12,968 19,727
Income/head 14,770 19,733 8,124 12,608 7,990 11,432
Household size 3.4 3.4 3.8 3.8 3.5 3.5
House price 463,045 648,795 408,230 500,789 143,964 200,244
Household income 50,217 67,092 30,871 47,910 27,966 40,013
Price/income ratio 9.2 10.1 12.3 10.5 5.1 5.0
Size/commercial
house 112 113 143 92 95 95
Size/low cost house 107 107 252 95 89 95
Notes: (1) House price = sales revenue/number of houses sold. (2) House size is measured in squared
meters (m2). House size = average number of people per household.
Sources: National Bureau of Statistics, 2006, 2009.
Table 2 Household incomes and house prices in China, US, UK
2009 Price/m
2
(yuan)
Price/unit
(yuan)
HH income
(yuan) Price/income
China 4,695 499,974 54,942 9.1
Beijing 13,799 1,510,986 69,942 21.6
Shanghai 12,840 1,539,514 73,282 21.0
Hainan 6,264 576,293 52,126 11.1
2010 (first half)
National average 5,036 542,351 54,942 9.9
Beijing 19,328 2,116,408 69,942 30.3
Shanghai 14,523 1,741,297 73,282 23.8
Hainan 9,267 852,604 52,126 16.4
US and UK, 2007 - 2009 ($)
2007
UK -- 363,055 65,919 5.5
US -- 217,900 84,842 2.6
2008
UK -- 313,476 62,417 5.0
US -- 196,600 86,858 2.3
2009
UK -- 245,088 51,650 4.8
US -- 173,200 86,222 2.0
London and New York: 2008 ($)
London -- 516,865.1 84,765 6.1
New York -- 466,100 104,660 4.5
22
Notes: For China, household income in 2009 = household income in 2008 (1 + average growth rate
of household income in 2009). The figure in the first two months of 2010 is assumed to remain at the
same 2009 level. Average household size and average house size were assumed to be unchanged in
2009 and 2010. The 2008 figure is based on the sales price of residential housing and the 2009 figure
on the sales price of commercial housing, the difference is not significant. For UK, household
income=per capita household income2.4 and for the US, household income=per capita household
income 2.6.
Source: Data for China: National Bureau of Statistic (NBS); Data for UK: house price:
http://www.nationwide.co.uk/hpi/historical.htm; per capita disposable income:
http://www.euromonitor.com/United_Kingdom; household size:
http://www.statistics.gov.uk/cci/nugget.asp?id=2325; UK £ and US $ exchange rate:
http://www.oanda.com/currency/historical-rates; Data for US: housing price:
http://www.census.gov/compendia/statab/cats/construction_housing.html; per capita disposable income:
http://www.euromonitor.com/factfile.aspx?country=US; household size:
http://factfinder.census.gov/servlet/ACSSAFFFacts?_event=&geo_id=01000US&_geoContext=01000
US&_street=&_county=&_cityTown=&_state=&_zip=&_lang=en&_sse=on&ActiveGeoDiv=&_useE
V=&pctxt=fph&pgsl=010&_submenuId=factsheet_1&ds_name=DEC_2000_SAFF&_ci_nbr=null&qr
_name=null®=&_keyword=&_industry=.
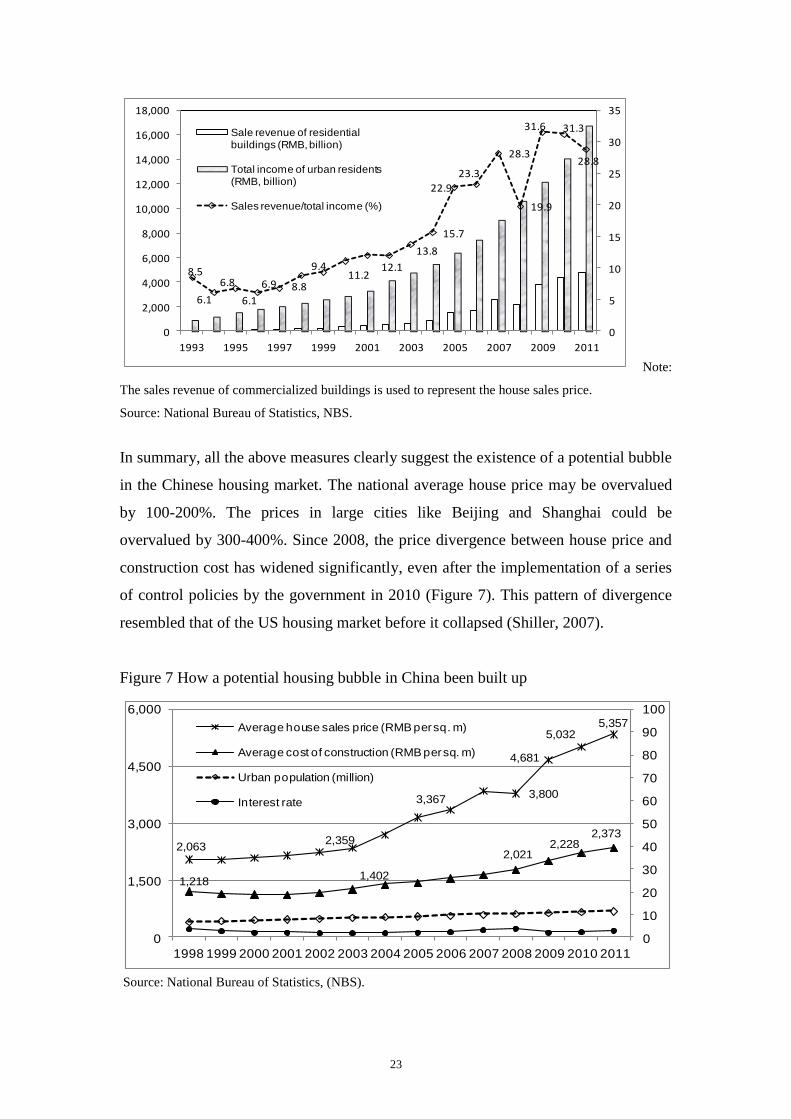
Household investment in housing as a proportion of total income measures the
propensity of consumer expenditure on housing. This is measured by the ratio of the
sales revenue of commercial housing over the total income of urban residents. Taking
into account of other living costs, this ratio should not be more than 30% (Liu, 2007).
However, as shown in Figure 6, after increasing steady for a few years, the ratio
increased sharply in 2005 and approached the warning threshold in 2007. Despite
moving downward slightly in 2008, it bounced back sharply in 2009, reaching 32%. A
rising proportion of urban incomes spent in housing is another indication of housing
bubble because such a trend is unlikely to be sustainable.
The price to rent (P/R) ratio is defined as the average cost of ownership per square
meter divided by monthly rental cost. A rapid increase in P/R ratio implies a potential
bubble. In a well-developed housing market, the general accepted P/R ratio should be
150-250 (Tang, 2009; An, 2008). However, in China, taking Beijing as an example,
the average P/R ratio in 2009 was 383 (SouFun.com, 2009). In 2010, house price in
Beijing rose further to RMB 16,431 per square meter in February, pushing the P/R
ratio up to 456. In other cities like Shanghai, Shenzhen and Hangzhou, the P/R ratio
ranges from 300 to 500 (Tang, 2009). It implies that currently, it would take a house
buyer 33 years to fully recover the cost if the house were rented out all the time, far
exceeding the generally accepted level of 16-21 years.
Figure 6 Household expenditure in housing and urban incomes
23
8.5
6.1
6.8
6.1
6.9 8.8
9.411.2
12.1
13.8
15.7
22.9
23.3
28.3
19.9
31.6 31.3
28.8
0
5
10
15
20
25
30
35
0
2,000
4,000
6,000
8,000
10,000
12,000
14,000
16,000
18,000
1993 1995 1997 1999 2001 2003 2005 2007 2009 2011
Sale revenue of residential buildings (RMB, billion)
Total income of urban residents (RMB, billion)
Sales revenue/total income (%)
Note:
The sales revenue of commercialized buildings is used to represent the house sales price.
Source: National Bureau of Statistics, NBS.
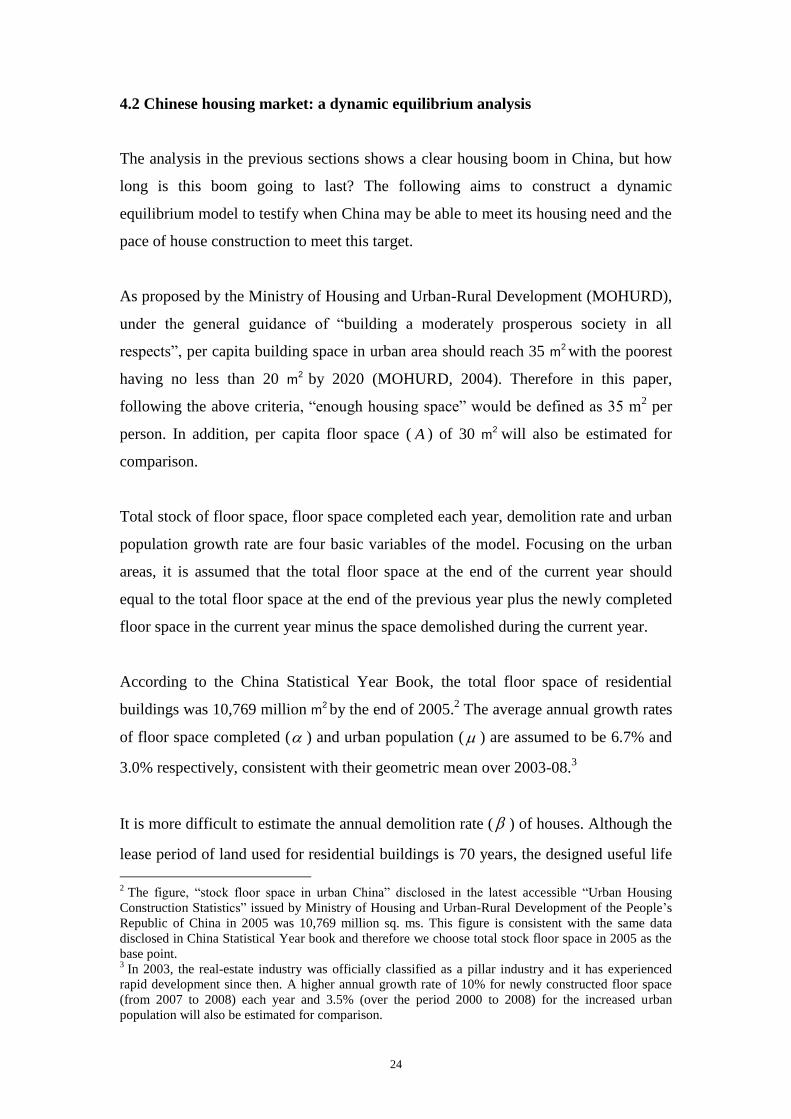
In summary, all the above measures clearly suggest the existence of a potential bubble
in the Chinese housing market. The national average house price may be overvalued
by 100-200%. The prices in large cities like Beijing and Shanghai could be
overvalued by 300-400%. Since 2008, the price divergence between house price and
construction cost has widened significantly, even after the implementation of a series
of control policies by the government in 2010 (Figure 7). This pattern of divergence
resembled that of the US housing market before it collapsed (Shiller, 2007).
Figure 7 How a potential housing bubble in China been built up
2,0632,359
3,3673,800
4,681
5,0325,357
1,2181,402
2,0212,228
2,373
0
10
20
30
40
50
60
70
80
90
100
0
1,500
3,000
4,500
6,000
1998 1999 2000 2001 2002 2003 2004 2005 2006 2007 2008 2009 2010 2011
Average house sales price (RMB per sq. m)
Average cost of construction (RMB per sq. m)
Urban population (million)
Interest rate
Source: National Bureau of Statistics, (NBS).
24
4.2 Chinese housing market: a dynamic equilibrium analysis
The analysis in the previous sections shows a clear housing boom in China, but how
long is this boom going to last? The following aims to construct a dynamic
equilibrium model to testify when China may be able to meet its housing need and the
pace of house construction to meet this target.
As proposed by the Ministry of Housing and Urban-Rural Development (MOHURD),
under the general guidance of “building a moderately prosperous society in all
respects”, per capita building space in urban area should reach 35 m2 with the poorest
having no less than 20 m2 by 2020 (MOHURD, 2004). Therefore in this paper,
following the above criteria, “enough housing space” would be defined as 35 m2 per
person. In addition, per capita floor space ( A ) of 30 m2 will also be estimated for
comparison.
Total stock of floor space, floor space completed each year, demolition rate and urban
population growth rate are four basic variables of the model. Focusing on the urban
areas, it is assumed that the total floor space at the end of the current year should
equal to the total floor space at the end of the previous year plus the newly completed
floor space in the current year minus the space demolished during the current year.
According to the China Statistical Year Book, the total floor space of residential
buildings was 10,769 million m2 by the end of 2005.2 The average annual growth rates
of floor space completed ( ) and urban population ( ) are assumed to be 6.7% and
3.0% respectively, consistent with their geometric mean over 2003-08.3
It is more difficult to estimate the annual demolition rate ( ) of houses. Although the
lease period of land used for residential buildings is 70 years, the designed useful life
2 The figure, “stock floor space in urban China” disclosed in the latest accessible “Urban Housing
Construction Statistics” issued by Ministry of Housing and Urban-Rural Development of the People’s
Republic of China in 2005 was 10,769 million sq. ms. This figure is consistent with the same data
disclosed in China Statistical Year book and therefore we choose total stock floor space in 2005 as the
base point. 3 In 2003, the real-estate industry was officially classified as a pillar industry and it has experienced
rapid development since then. A higher annual growth rate of 10% for newly constructed floor space
(from 2007 to 2008) each year and 3.5% (over the period 2000 to 2008) for the increased urban
population will also be estimated for comparison.
25
of residential buildings is 50 years (MOHURD). This means that at least 2% of all
residential buildings need to be demolished each year. However, a recent report by
MOHURD suggests that the life expectancy of China’s residential buildings is as low
as 25 to 30 years (Wang, 6 April 2010). To reflect this, it is necessary to assume a
higher demolition rate (e.g. 3% or 4%) in the following calculation.
The final model is defined as follows:
ttttt AFSPOPDFSNFSTFS *11 (1)
In equation (1), TFS denotes total floor space, NFS newly constructed floor space,
DFS demolished floor space, POP population and AFS floor space per capita, t
current period and (t-1) the previous period.
In 2005, urban China had a total floor space of 10,769 million square meters, newly
constructed floor space of 630 million square meters, a population of 577 million
people. Let ß denote house demolition rate, α the growth rate of newly constructed
floor space, μ population growth rate, then the following equation can be established,
resulting in a dynamic relationship between AFS (floor space per capita) and n
(number of years) for both sides to be equalised.
njiAFS in
i
jii
,)1(577)1()1(630)1(769,100
1
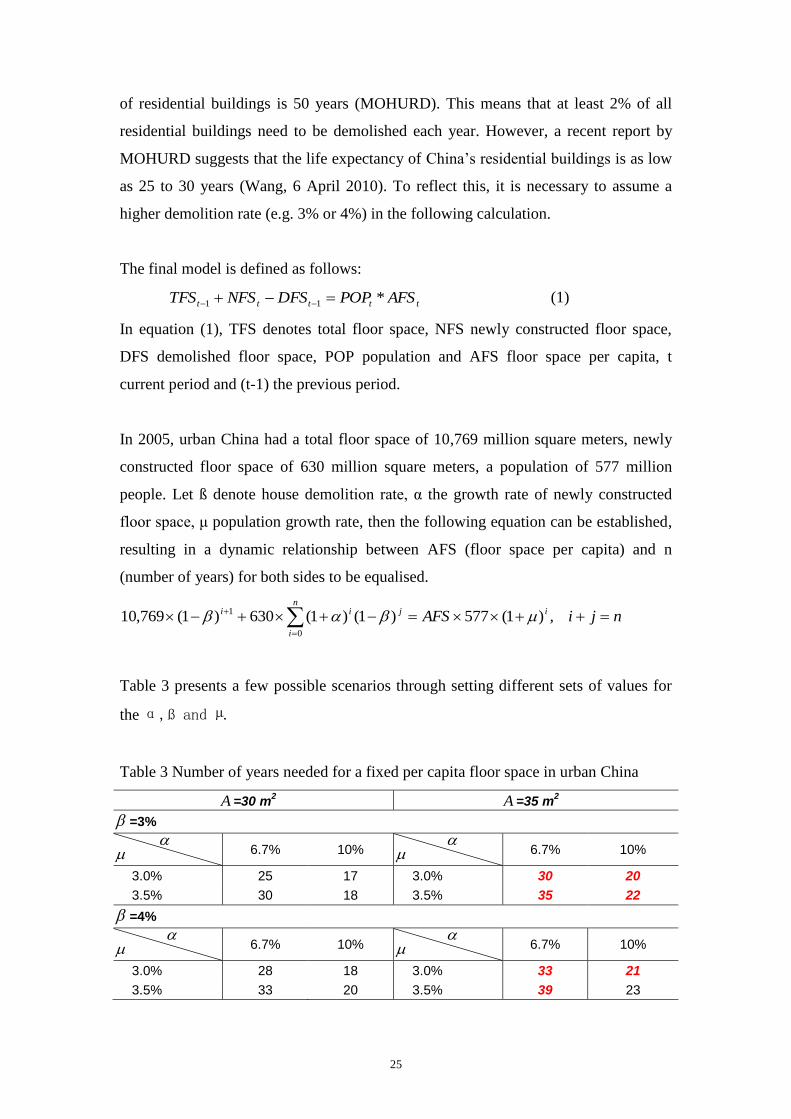
Table 3 presents a few possible scenarios through setting different sets of values for
the α,ß and µ.
Table 3 Number of years needed for a fixed per capita floor space in urban China
A =30 m2 A =35 m
2
=3%
6.7% 10%
6.7% 10%
3.0% 25 17 3.0% 30 20
3.5% 30 18 3.5% 35 22
=4%
6.7% 10%
6.7% 10%
3.0% 28 18 3.0% 33 21
3.5% 33 20 3.5% 39 23
26
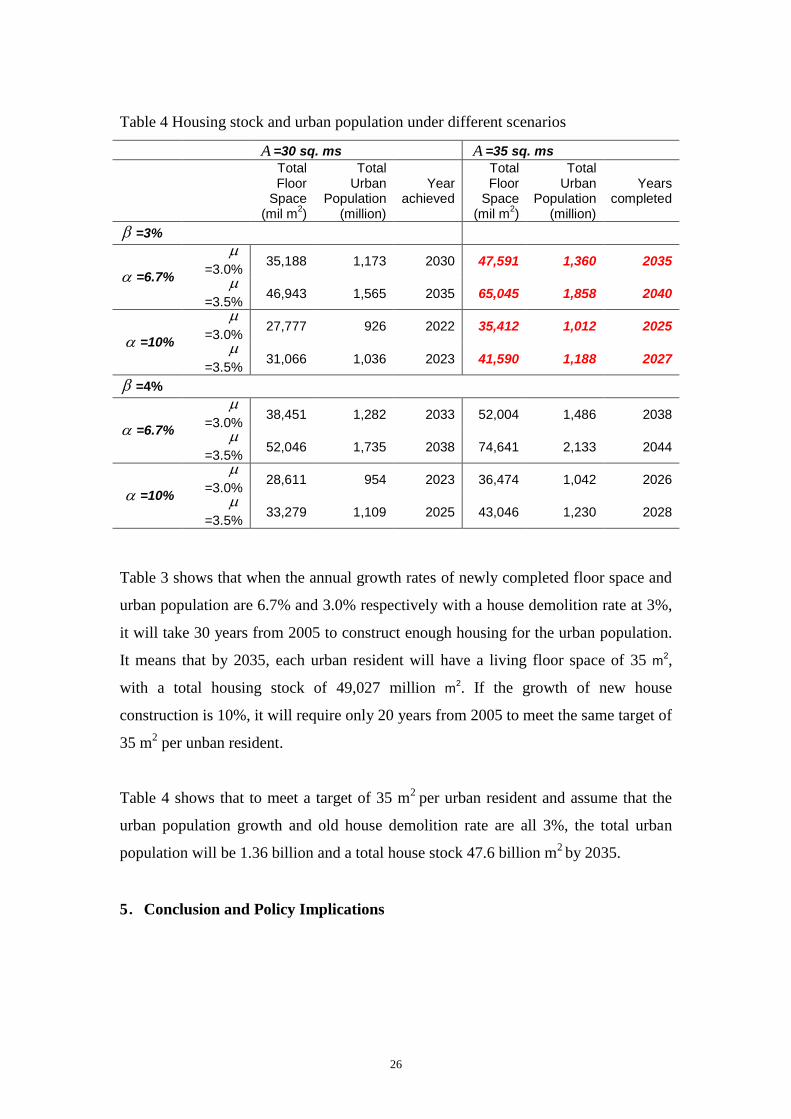
Table 4 Housing stock and urban population under different scenarios
A =30 sq. ms A =35 sq. ms
Total Floor
Space (mil m
2)
Total Urban
Population (million)
Year achieved
Total Floor
Space (mil m
2)
Total Urban
Population (million)
Years completed
=3%
=6.7%
=3.0% 35,188 1,173 2030 47,591 1,360 2035
=3.5% 46,943 1,565 2035 65,045 1,858 2040
=10%
=3.0% 27,777 926 2022 35,412 1,012 2025
=3.5% 31,066 1,036 2023 41,590 1,188 2027
=4%
=6.7%
=3.0% 38,451 1,282 2033 52,004 1,486 2038
=3.5% 52,046 1,735 2038 74,641 2,133 2044
=10%
=3.0% 28,611 954 2023 36,474 1,042 2026
=3.5% 33,279 1,109 2025 43,046 1,230 2028
Table 3 shows that when the annual growth rates of newly completed floor space and
urban population are 6.7% and 3.0% respectively with a house demolition rate at 3%,
it will take 30 years from 2005 to construct enough housing for the urban population.
It means that by 2035, each urban resident will have a living floor space of 35 m2,
with a total housing stock of 49,027 million m2. If the growth of new house
construction is 10%, it will require only 20 years from 2005 to meet the same target of
35 m2 per unban resident.
Table 4 shows that to meet a target of 35 m2
per urban resident and assume that the
urban population growth and old house demolition rate are all 3%, the total urban
population will be 1.36 billion and a total house stock 47.6 billion m2 by 2035.
5.Conclusion and Policy Implications
27
Housing reform commencing from 1978 has not only improved the living condition in
urban China, but also made the real-estate industry become a pillar industry which
contributes significantly to the country’s overall economic development.
Since the second half of 2009 when the world economy gradually moved out from
recession, ample liquidity and preferential policies provided by the Chinese
government during crisis has heated up the housing market again. Although various
adjustment policies were implemented thereafter to cool down the market, monthly
sales price of 70 large- and medium-sized cities rose by 10% in the first half of 2010.
Three key factors were responsible for the housing bubble, rapid urbanization, rising
income inequality, and control of land ownership by local governments.
This paper reviews the history of the Chinese housing market and urbanisation and it
also defines and explains various indicators for a housing bubble in China. In
particular, it provides a theoretical framework to explain that high house prices has
been caused by market fragmentation caused by rising income inequality and lack of
government support to the low and middle income groups.
To resolve the housing problem in China, policies must be designed to reduce house
prices through reducing income inequality, providing low-cost housing for the urban
poor and rural migrants working in cities, and introducing property taxes to eliminate
speculation in the housing market.
References
An, H. (2008), “How the price to rent ratio influences housing price”
(Chiense), Beijing Real Estate, 09:79-81.
Anderlini, J. (2009), “China Revived Property Tax to Avert Bubble”,
Financial Times, London, (10 December 2009).
Baker, D. (2002), “The Run-Up in Home Prices: A Bubble.” Challenge
45(6):93–119.
Case, K. E. and R. J. Shiller, (2003), “Is There a Bubble in the Housing
Market? An Analysis”, BPEA, 2: 299–342.
Caijing (2011), House sales decline in September among 8 large cities.
http://industry.caijing.com.cn/2011-10-13/110893863.html.
28
Dai, S. X. (2009), “Research on land finance and the usage of the land of local
government” (Chinese), Journal of Fujian Normal University (Philosophy and Socail
Science Edition), 157(4): 21-26.
Fackler, M. (2005), “Take it from Japan: Bubbles hurt”, The New York Times,
http://www.nytimes.com/2005/12/25/business/yourmoney/25japan.html?_r=1&pagew
anted=all, (25 December 2005).
Feng, H. and X. J. Ni (2009), “The establishment and development of urban
housing security system since the housing reform” (Chinese), Economic Research
Guide, 64 (26): 194-195.
Garber, P. M. (2000), Famous First Bubbles: The Fundamentals of Early
Manias, MIT Press.
Jia, K. and M. J. Liu (2007), “An analysis of issues related to China’s houing
reform and housing security system”, Public Finance research, 7: 8-23.
Li, F. A. (2004), “The Polariation and Anti-corruption in the Economy Reform
in China” (Chinese), Journal of Hubei Normal University (Philosophy and Social
Science), 24(4): 22-24.
Liu, L. (2005), “Reasons behind rocketing housing price” (Chinese), Urban
Development, 5:64-67.
Liu, L. (2007), “How to measure the affordabality of urban housing price in
China” (Chinese), China Investment, 4:19.
Li, Y. (2007), “Housing system in urban China: A review of its historical
development and future reform strategies” (Chinese), Academic Journal of
Zhongzhou, 159(3): 134-136.
Pan, D. and Z. Xu (2008), “Economic Globalizatio and the Bubble of
Globalization” (Chinese), Comtemporary Economy & Management, 30 (8): 78-82.
Shiller, R. J. (2008), The Subprim Solution: How Today’s Global Financial
Crisis Happened, and What to Do about it, Princeton University Press: Princeton,
New Jersey.
Siegel, J. J. (2003), “What Is an Asset Price Bubble? An Operational
Definition”, European Financial Management, 9(1): 11–24.
SouFun.com (2009), “A decreased rental cost in Beijing”,
http://rent.soufun.com/rent/news/2585373.htm, (20 May 2009).
Tang, P. (2009), “How to measure housing makret bubble: An analysis based
on the price to rent ratio” (Chinese), Economic and Trade Review, 03:206-207.
29
The Economists, (2010), “Asia: An Odd Sort of Tax; China Mulls A property
Tax”, The Economists, London, (13 March 2010), 394(8673): 44.
Walder, A. (1986), Communist Neo-Traditionalism: Work and Authority in
Chinese Industry, Berkeley: University of California Press.
Wang, Q. (2010), “Short-lived Buildings Creat Huge Waste”, ChinaDaily,
http://www.chinadaily.com.cn/china/2010-04/06/content_9687545.htm, (6 April
2010).
Wang, Y. P. and A. Murie (1999), “Commercial Housing Development in
Urban China”, Urban Studies, 36 (9): 1475-1494.
Wang, Y. P. (1995), “Public sector housing in urban China since 1949: the
case of Xi’an” (Chinese), Housing Studies, 10: 57-82.
Wei, J. and R. Wang (2007), “The Path of China’s Housing Reform: An
Analysis based on the Specific Nature of Housing” (Chinese), Reform of Economic
System, 2: 6-11.
Wu, F. L. (2001), “China’s recent urban development in the process of land
and housing marketisation and economic globalisation”, Habitat International, 25(3):
273-289.
Wu, J. L. (2005), “The Prospect of Economic Development in China”
(Chinese), Forward Position in Economics, 1: 4-6.
Xue, T. T. (2009), “Problems of housing supply in urban China” (Chinese),
Chinese Foreign Entrepreneurs, 325(5): 101-114.
Xun, G. D. (2008), “Why Housing Price in Germany could ramian Stable over
Decade” (Chinese), Journal of Party Members, 10:43.
Yao, S. J. and D. Luo (2009), ‘The economic psychology of stock market
bubbles in China’, The World Economy, 32, (5), 667-691.
Yeh, A. G. O. and F. L. Wu (1996), “The new land development process and
urban development in Chinese cities”, International Journal of Urban and Regional
Research, 20: 330-353.
Yuan, J. (2003), “Urban land control in China with reference to foreign
experiences” (Chinese), China Real-Estate Information, 203 (5): 12-13.
Yuan, J. (2005), “Urban land allocation and regulation” (Chinese),
Information of China Construction, 7: 37-40.
Zhang, Q. (2009), “30 years of housing reform: A perspective from related
legislations” (Chinese), Business Law Analysis, 129 (1): 70-75.
30
Zhang, Y. R. (2008), “The development of Chinese housing market during
past 30 years”, The Housing Industry, 12: 16-18.
Zhang, Y. J. (2009), “How economically affordable housing system reflecting
the nature of housing security” (Chinese), The Housing Industry, 8: 80-82.
Zhou, M. and J. R. Logan (2002), “Market transition and the commodification
of housing in urban China”, in Logan, J. R ed. The new Chinese Cities, Blackwell
Publisher: Oxford, UK.
Zou, B. (2009), “The Influence of Low Consumption Rate in China” (Chinese),
Journal of Economic Trade in China, 16: 76-98.


![Urbanisation 06.06.09[1]](https://img.pdfslide.net/doc/110x75/55a11bbe1a28abc87f8b45de/urbanisation-0606091.jpg)