Embed Size (px)
Citation preview

How AmericansCelebrate Christmas
Survey of 2,110 Adult Americans
2
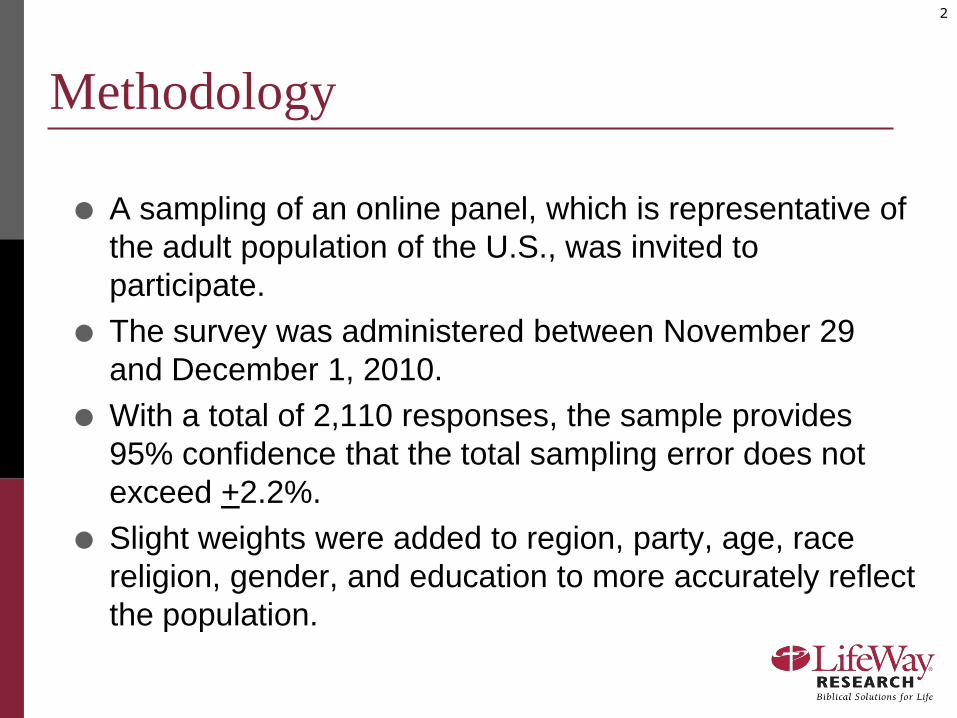
Methodology
A sampling of an online panel, which is representative of
the adult population of the U.S., was invited to
participate.
The survey was administered between November 29
and December 1, 2010.
With a total of 2,110 responses, the sample provides
95% confidence that the total sampling error does not
exceed +2.2%.
Slight weights were added to region, party, age, race
religion, gender, and education to more accurately reflect
the population.
3
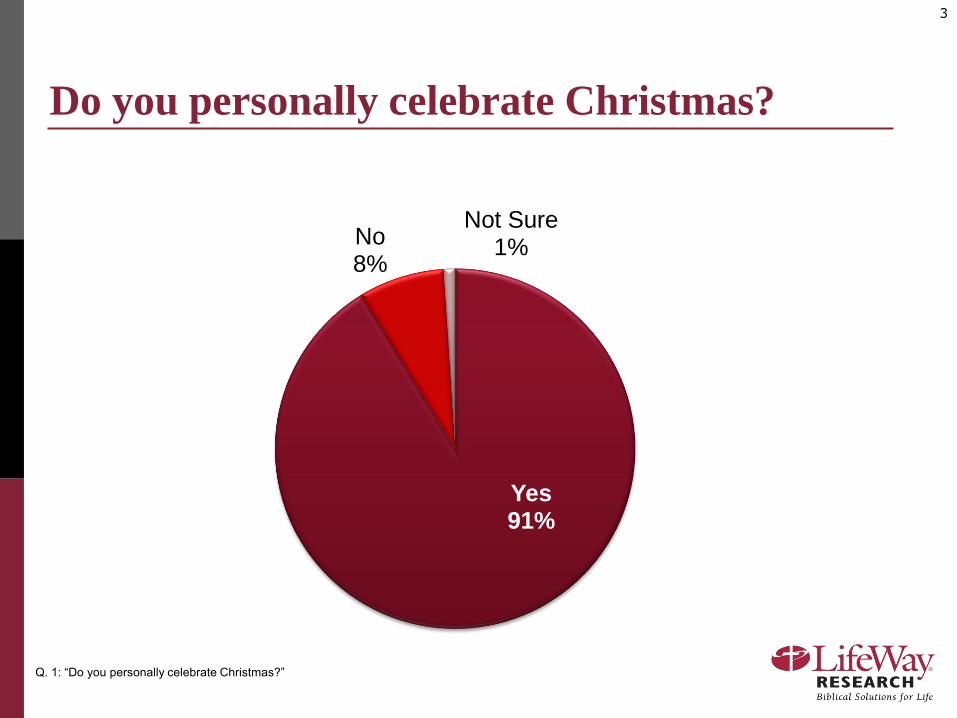
Do you personally celebrate Christmas?
Yes91%
No8%
Not Sure1%
Q. 1: “Do you personally celebrate Christmas?”
4
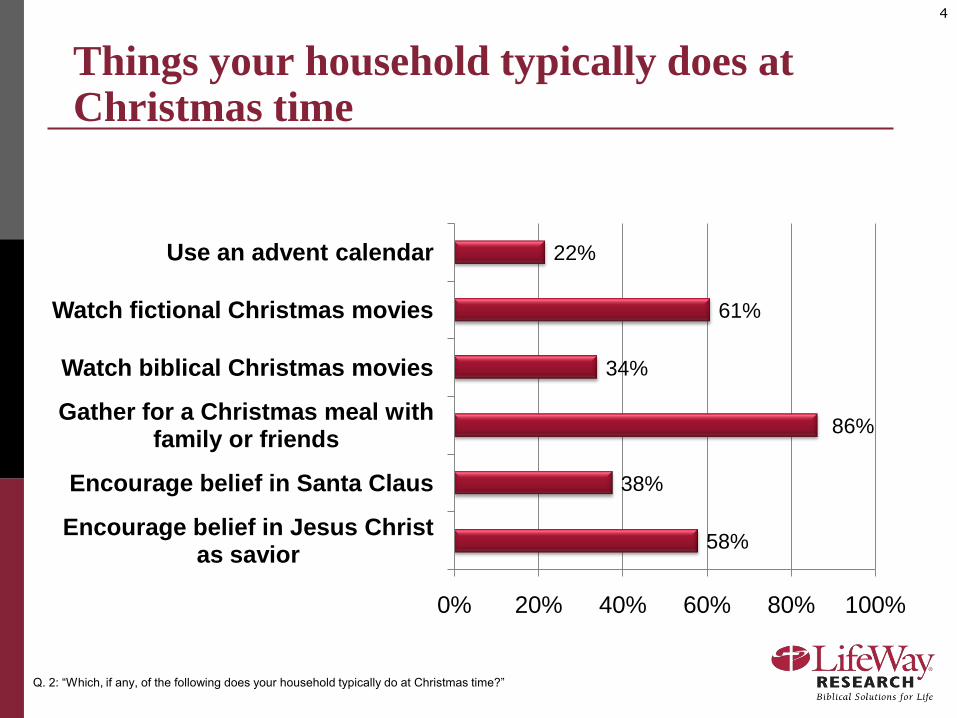
Things your household typically does at Christmas time
58%
38%
86%
34%
61%
22%
0% 20% 40% 60% 80% 100%
Encourage belief in Jesus Christ as savior
Encourage belief in Santa Claus
Gather for a Christmas meal with family or friends
Watch biblical Christmas movies
Watch fictional Christmas movies
Use an advent calendar
Q. 2: “Which, if any, of the following does your household typically do at Christmas time?”
5
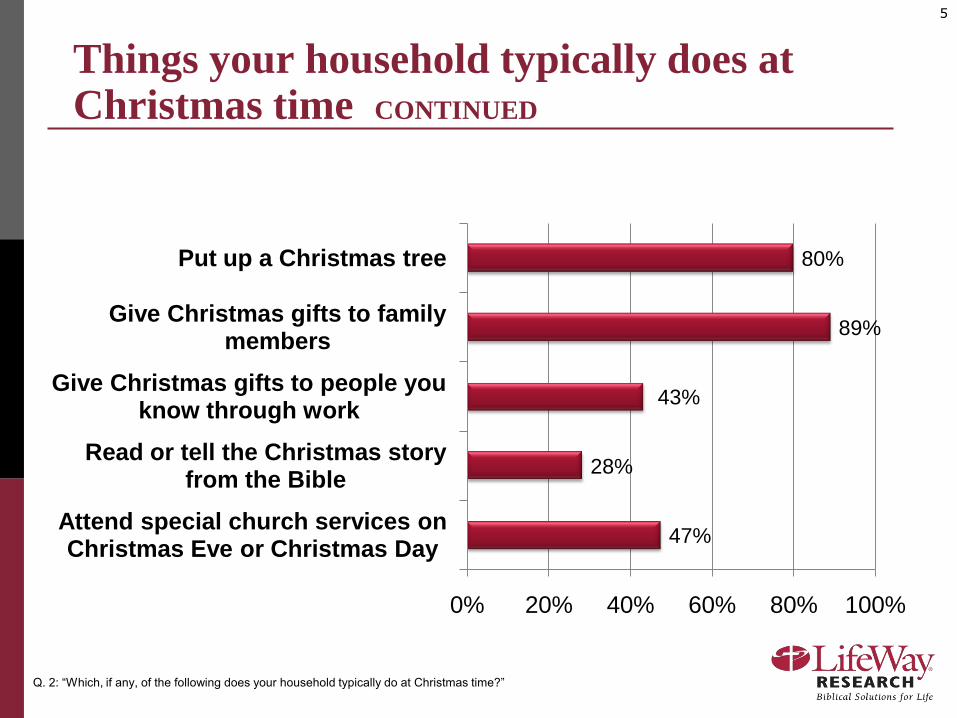
Things your household typically does at Christmas time CONTINUED
47%
28%
43%
89%
80%
0% 20% 40% 60% 80% 100%
Attend special church services on Christmas Eve or Christmas Day
Read or tell the Christmas story from the Bible
Give Christmas gifts to people you know through work
Give Christmas gifts to family members
Put up a Christmas tree
Q. 2: “Which, if any, of the following does your household typically do at Christmas time?”
6
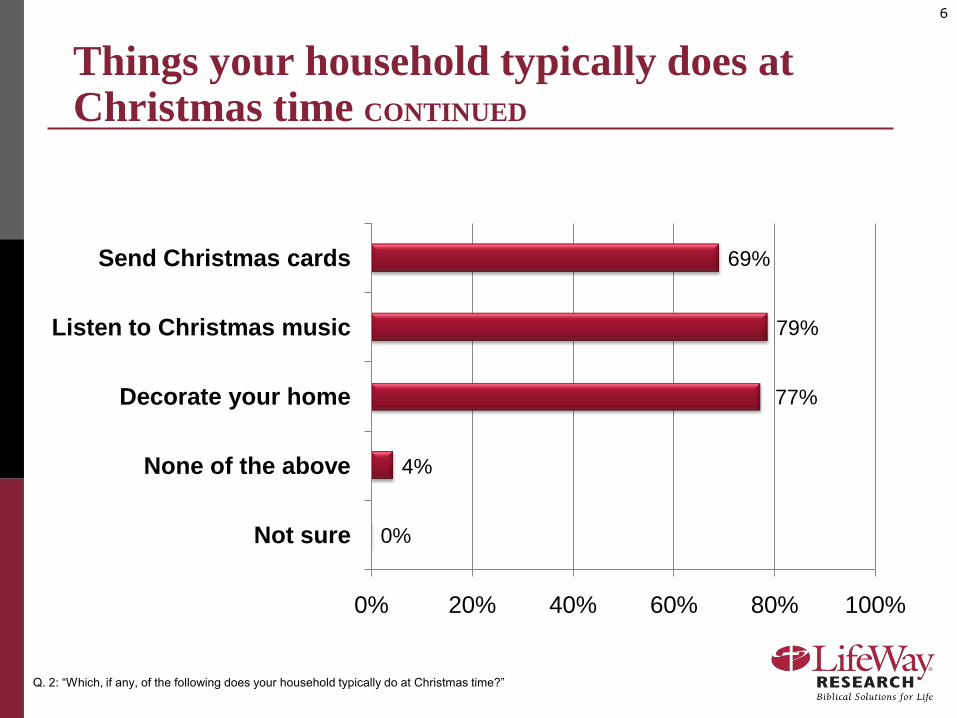
Things your household typically does at Christmas time CONTINUED
0%
4%
77%
79%
69%
0% 20% 40% 60% 80% 100%
Not sure
None of the above
Decorate your home
Listen to Christmas music
Send Christmas cards
Q. 2: “Which, if any, of the following does your household typically do at Christmas time?”
7
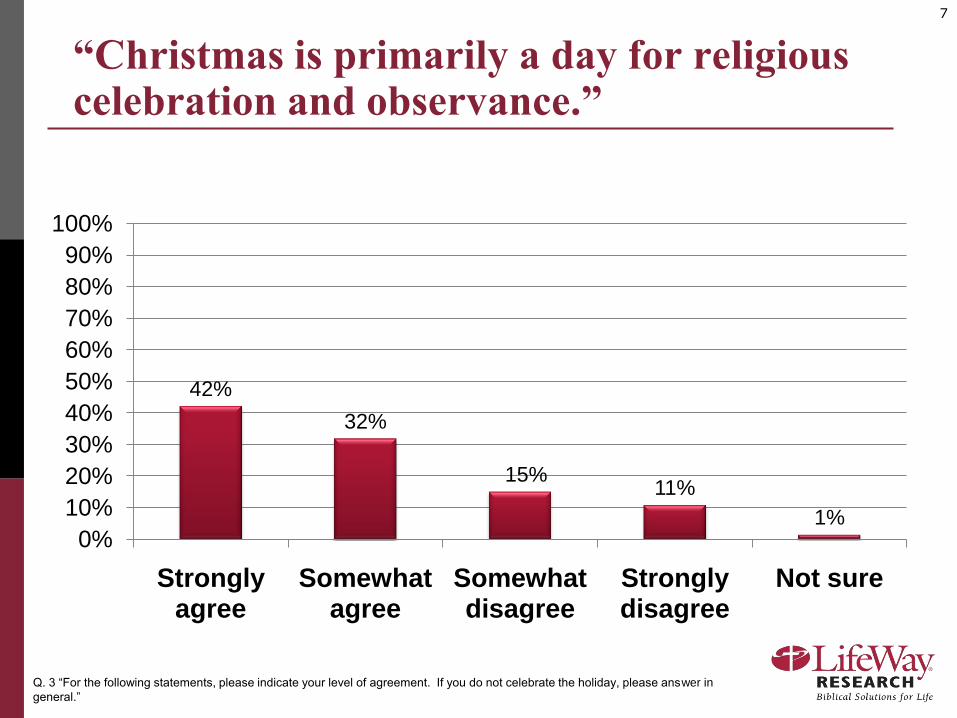
“Christmas is primarily a day for religious celebration and observance.”
42%
32%
15%11%
1%0%
10%
20%
30%
40%
50%
60%
70%
80%
90%
100%
Strongly agree
Somewhat agree
Somewhat disagree
Strongly disagree
Not sure
Q. 3 “For the following statements, please indicate your level of agreement. If you do not celebrate the holiday, please answer in
general.”
8
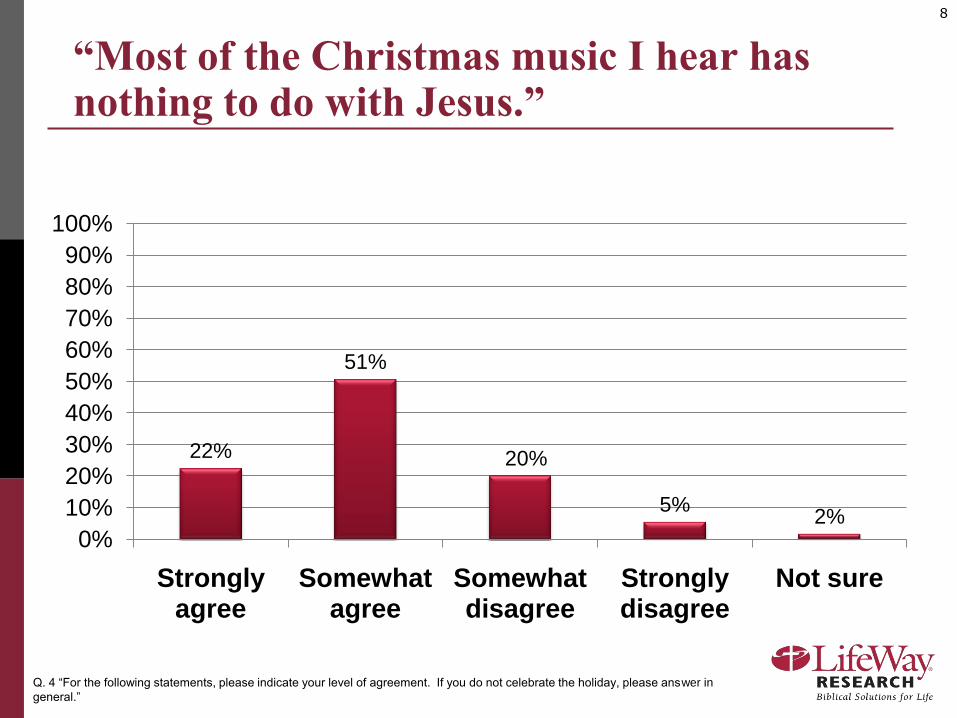
“Most of the Christmas music I hear has nothing to do with Jesus.”
22%
51%
20%
5%2%
0%
10%
20%
30%
40%
50%
60%
70%
80%
90%
100%
Strongly agree
Somewhat agree
Somewhat disagree
Strongly disagree
Not sure
Q. 4 “For the following statements, please indicate your level of agreement. If you do not celebrate the holiday, please answer in
general.”
9
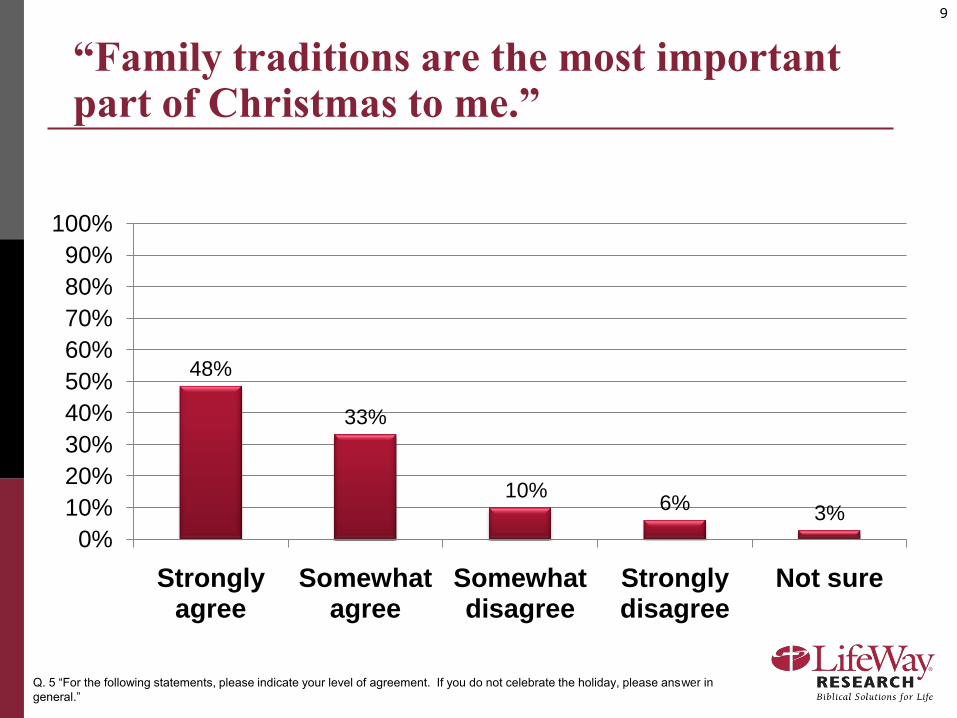
“Family traditions are the most important part of Christmas to me.”
48%
33%
10%6%
3%
0%
10%
20%
30%
40%
50%
60%
70%
80%
90%
100%
Strongly agree
Somewhat agree
Somewhat disagree
Strongly disagree
Not sure
Q. 5 “For the following statements, please indicate your level of agreement. If you do not celebrate the holiday, please answer in
general.”
10
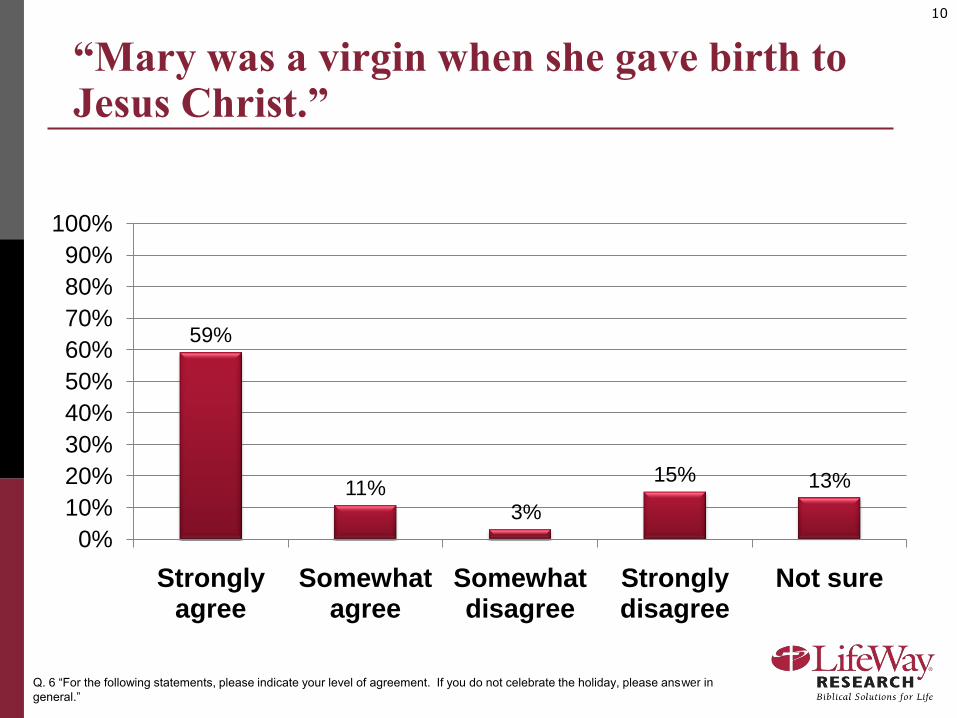
“Mary was a virgin when she gave birth to Jesus Christ.”
59%
11%3%
15% 13%
0%
10%
20%
30%
40%
50%
60%
70%
80%
90%
100%
Strongly agree
Somewhat agree
Somewhat disagree
Strongly disagree
Not sure
Q. 6 “For the following statements, please indicate your level of agreement. If you do not celebrate the holiday, please answer in
general.”
11
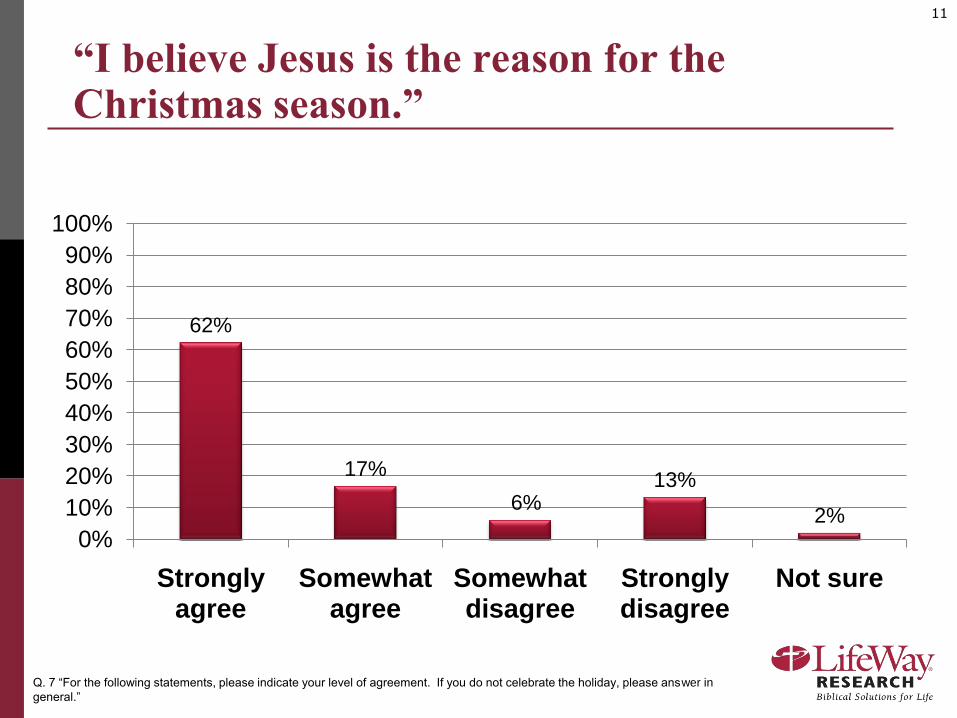
“I believe Jesus is the reason for the Christmas season.”
62%
17%
6%13%
2%0%
10%
20%
30%
40%
50%
60%
70%
80%
90%
100%
Strongly agree
Somewhat agree
Somewhat disagree
Strongly disagree
Not sure
Q. 7 “For the following statements, please indicate your level of agreement. If you do not celebrate the holiday, please answer in
general.”
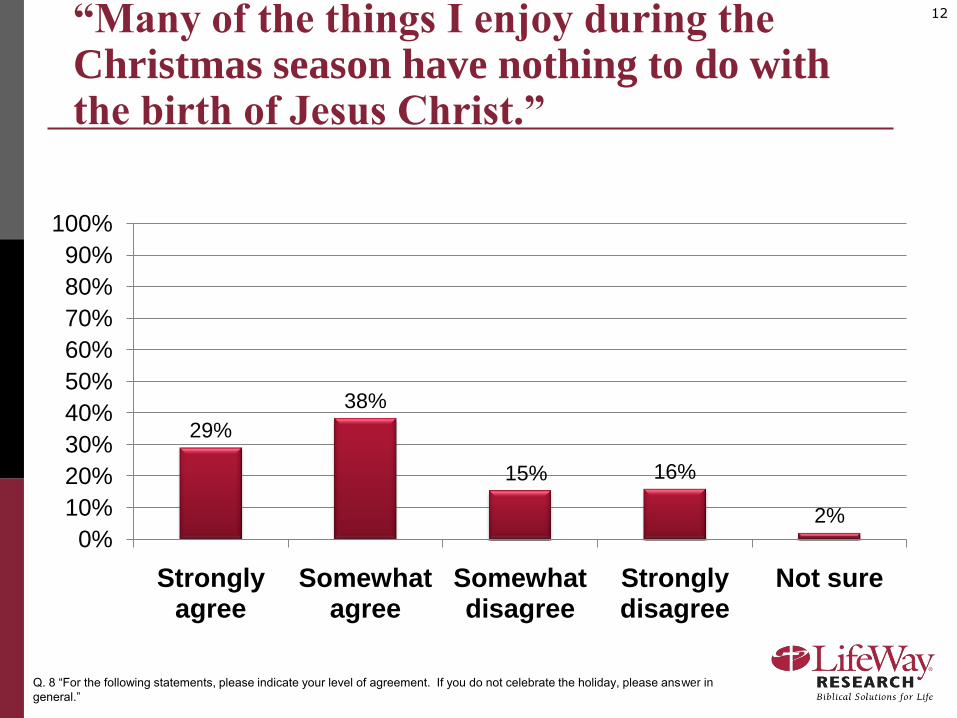
12“Many of the things I enjoy during the Christmas season have nothing to do with the birth of Jesus Christ.”
29%
38%
15% 16%
2%0%
10%
20%
30%
40%
50%
60%
70%
80%
90%
100%
Strongly agree
Somewhat agree
Somewhat disagree
Strongly disagree
Not sure
Q. 8 “For the following statements, please indicate your level of agreement. If you do not celebrate the holiday, please answer in
general.”
13
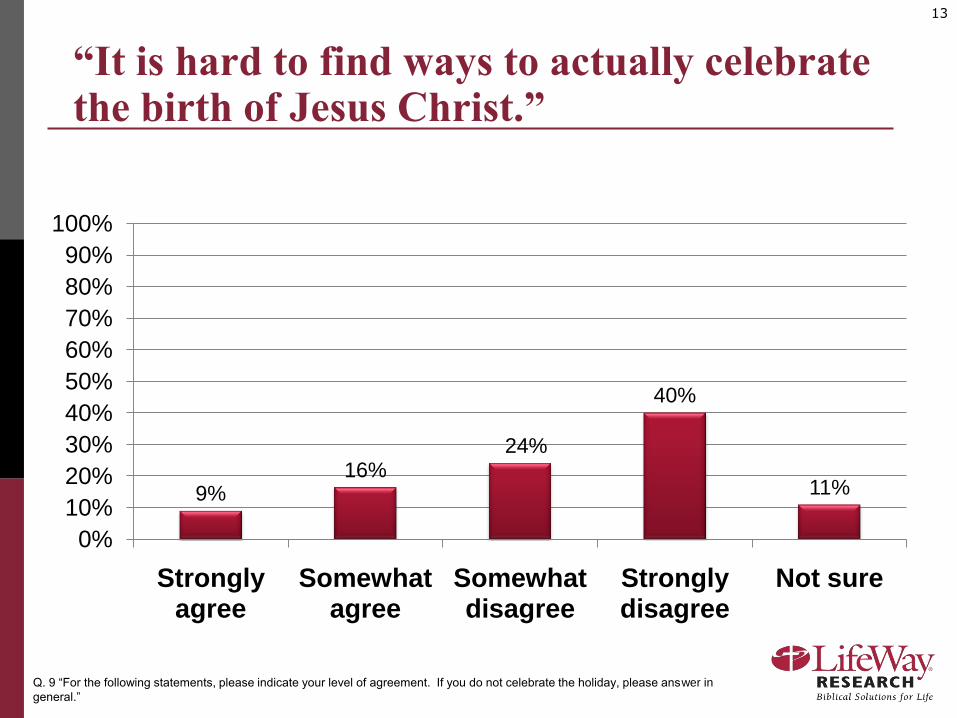
“It is hard to find ways to actually celebrate the birth of Jesus Christ.”
9%16%
24%
40%
11%
0%
10%
20%
30%
40%
50%
60%
70%
80%
90%
100%
Strongly agree
Somewhat agree
Somewhat disagree
Strongly disagree
Not sure
Q. 9 “For the following statements, please indicate your level of agreement. If you do not celebrate the holiday, please answer in
general.”
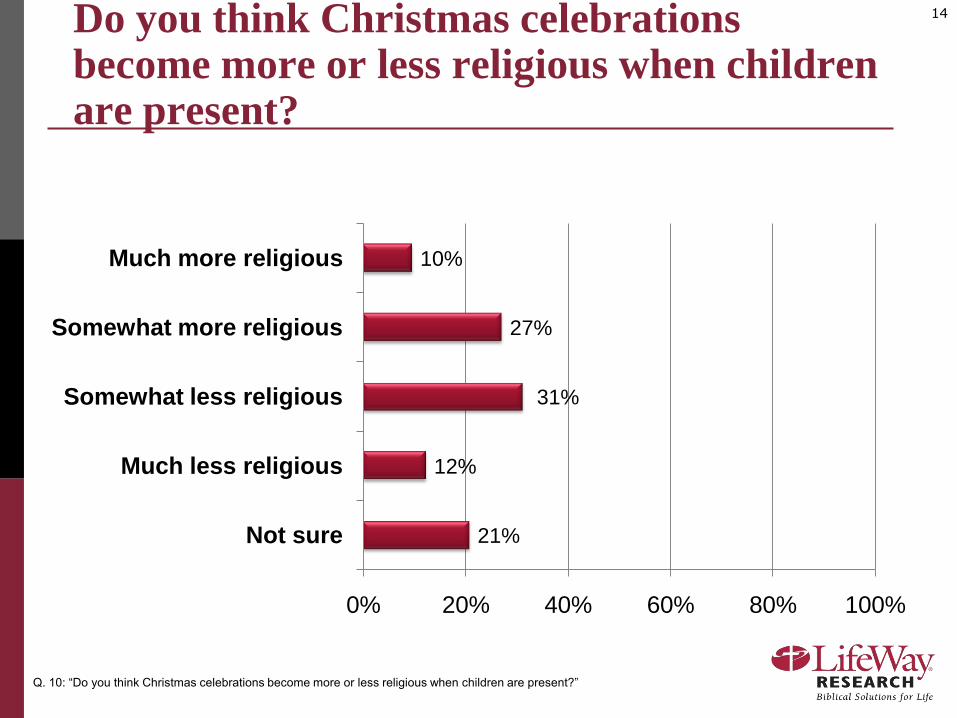
14Do you think Christmas celebrations become more or less religious when children are present?
21%
12%
31%
27%
10%
0% 20% 40% 60% 80% 100%
Not sure
Much less religious
Somewhat less religious
Somewhat more religious
Much more religious
Q. 10: “Do you think Christmas celebrations become more or less religious when children are present?”
15
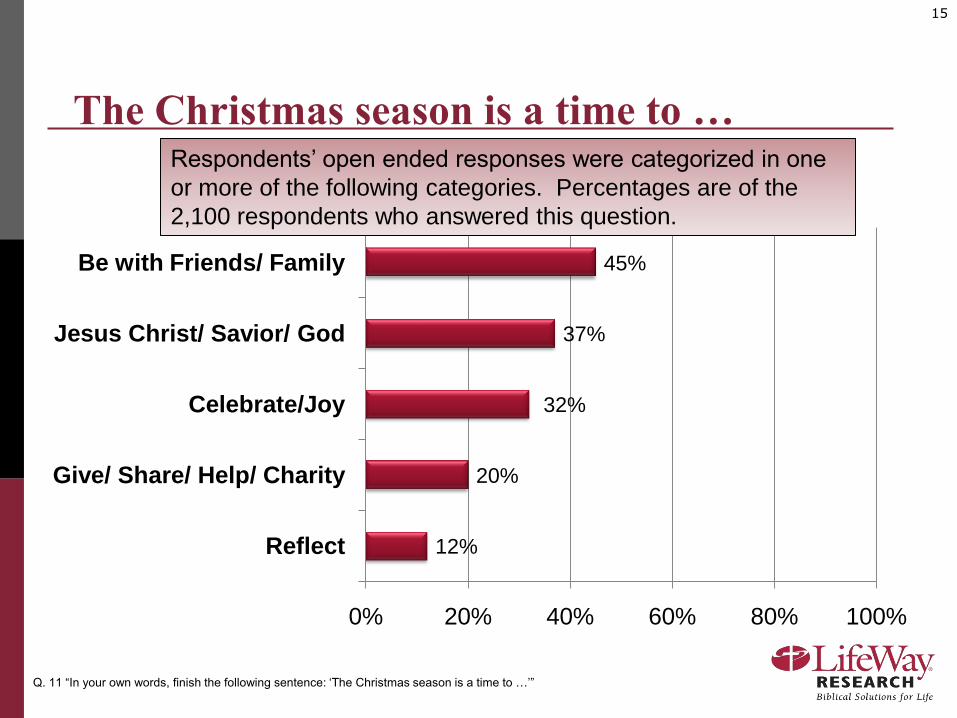
The Christmas season is a time to …
12%
20%
32%
37%
45%
0% 20% 40% 60% 80% 100%
Reflect
Give/ Share/ Help/ Charity
Celebrate/Joy
Jesus Christ/ Savior/ God
Be with Friends/ Family
Q. 11 “In your own words, finish the following sentence: „The Christmas season is a time to …‟”
Respondents‟ open ended responses were categorized in one
or more of the following categories. Percentages are of the
2,100 respondents who answered this question.
16
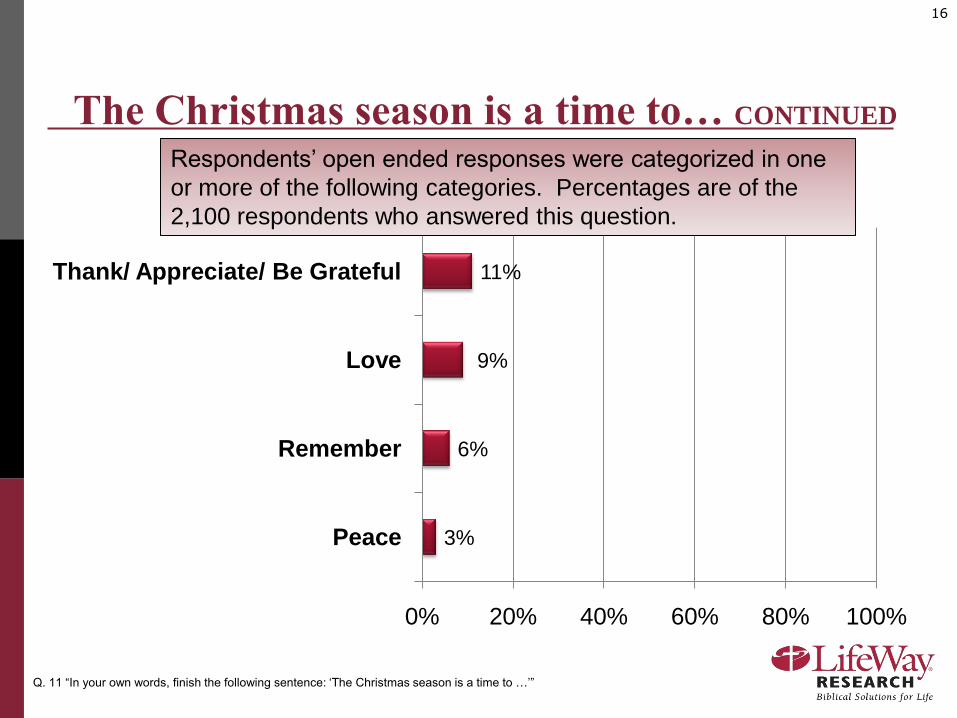
The Christmas season is a time to… CONTINUED
3%
6%
9%
11%
0% 20% 40% 60% 80% 100%
Peace
Remember
Love
Thank/ Appreciate/ Be Grateful
Q. 11 “In your own words, finish the following sentence: „The Christmas season is a time to …‟”
Respondents‟ open ended responses were categorized in one
or more of the following categories. Percentages are of the
2,100 respondents who answered this question.
17
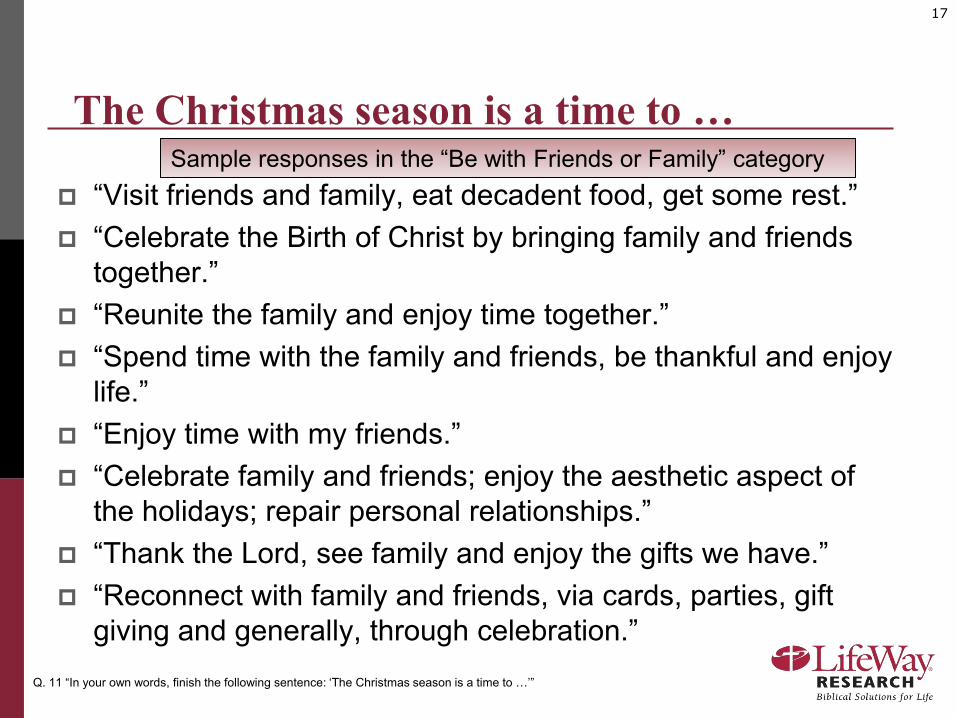
The Christmas season is a time to …
Q. 11 “In your own words, finish the following sentence: „The Christmas season is a time to …‟”
Sample responses in the “Be with Friends or Family” category
“Visit friends and family, eat decadent food, get some rest.”
“Celebrate the Birth of Christ by bringing family and friends
together.”
“Reunite the family and enjoy time together.”
“Spend time with the family and friends, be thankful and enjoy
life.”
“Enjoy time with my friends.”
“Celebrate family and friends; enjoy the aesthetic aspect of
the holidays; repair personal relationships.”
“Thank the Lord, see family and enjoy the gifts we have.”
“Reconnect with family and friends, via cards, parties, gift
giving and generally, through celebration.”
18
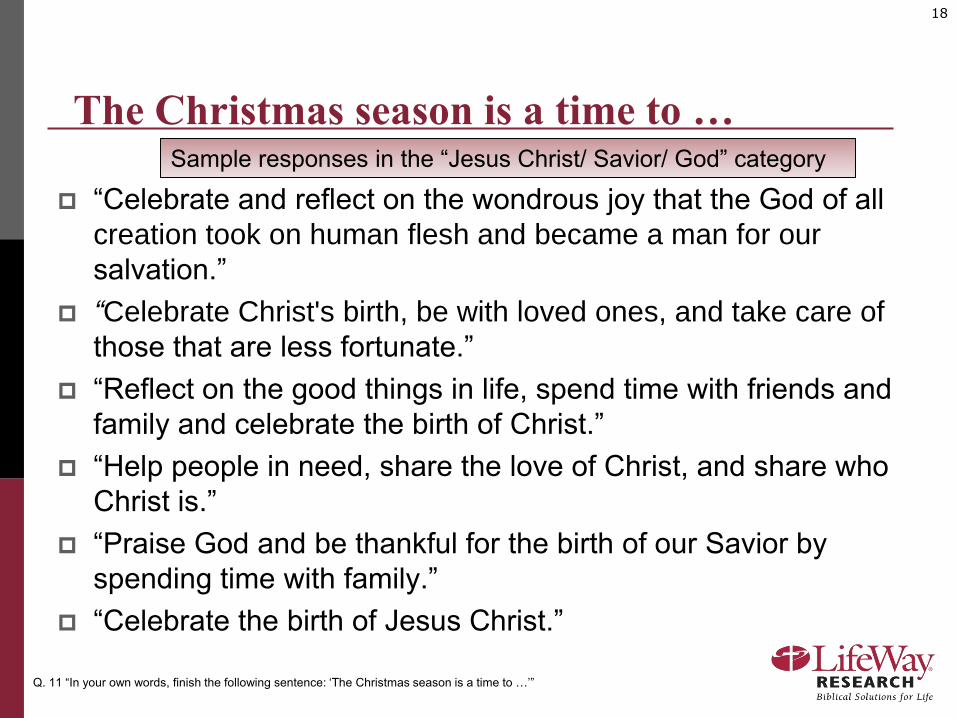
The Christmas season is a time to …
Q. 11 “In your own words, finish the following sentence: „The Christmas season is a time to …‟”
Sample responses in the “Jesus Christ/ Savior/ God” category
“Celebrate and reflect on the wondrous joy that the God of all
creation took on human flesh and became a man for our
salvation.”
“Celebrate Christ's birth, be with loved ones, and take care of
those that are less fortunate.”
“Reflect on the good things in life, spend time with friends and
family and celebrate the birth of Christ.”
“Help people in need, share the love of Christ, and share who
Christ is.”
“Praise God and be thankful for the birth of our Savior by
spending time with family.”
“Celebrate the birth of Jesus Christ.”
19
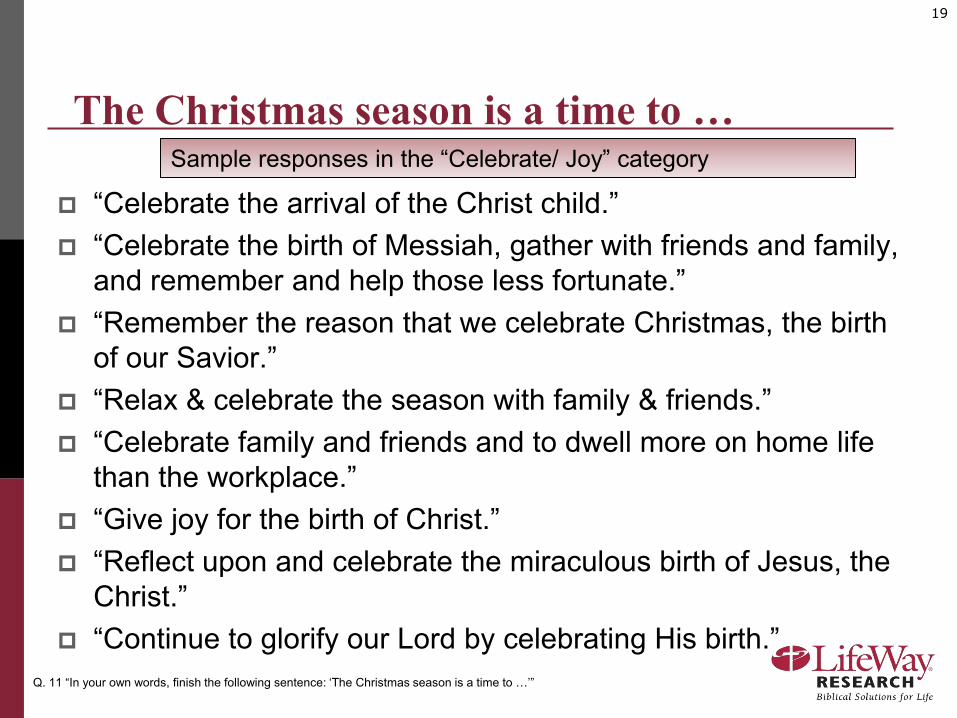
The Christmas season is a time to …
Q. 11 “In your own words, finish the following sentence: „The Christmas season is a time to …‟”
Sample responses in the “Celebrate/ Joy” category
“Celebrate the arrival of the Christ child.”
“Celebrate the birth of Messiah, gather with friends and family,
and remember and help those less fortunate.”
“Remember the reason that we celebrate Christmas, the birth
of our Savior.”
“Relax & celebrate the season with family & friends.”
“Celebrate family and friends and to dwell more on home life
than the workplace.”
“Give joy for the birth of Christ.”
“Reflect upon and celebrate the miraculous birth of Jesus, the
Christ.”
“Continue to glorify our Lord by celebrating His birth.”
20
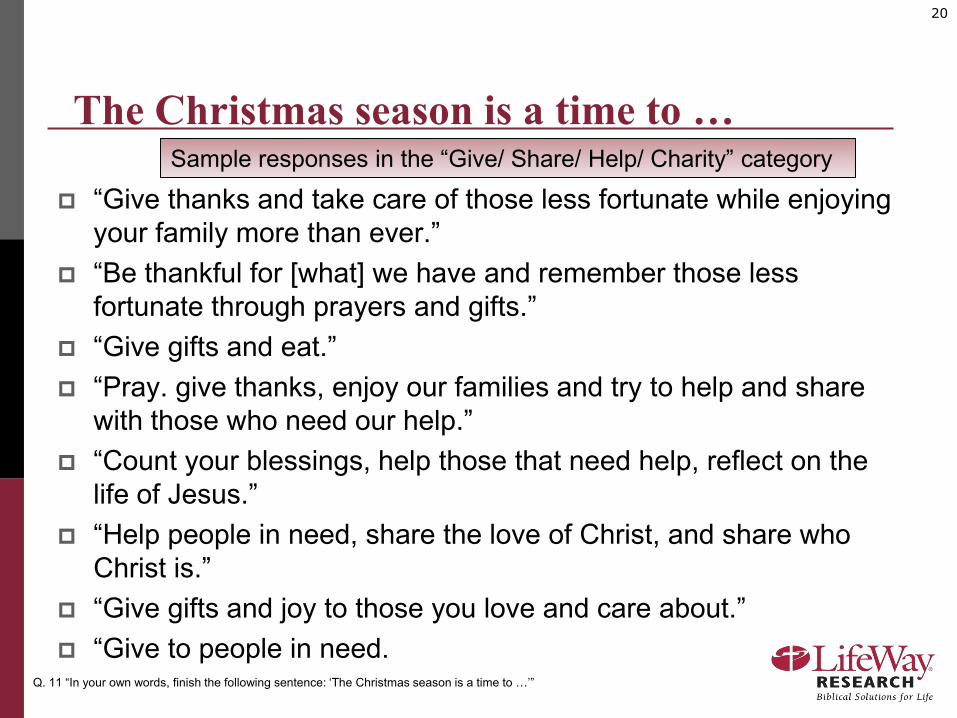
The Christmas season is a time to …
Q. 11 “In your own words, finish the following sentence: „The Christmas season is a time to …‟”
Sample responses in the “Give/ Share/ Help/ Charity” category
“Give thanks and take care of those less fortunate while enjoying
your family more than ever.”
“Be thankful for [what] we have and remember those less
fortunate through prayers and gifts.”
“Give gifts and eat.”
“Pray. give thanks, enjoy our families and try to help and share
with those who need our help.”
“Count your blessings, help those that need help, reflect on the
life of Jesus.”
“Help people in need, share the love of Christ, and share who
Christ is.”
“Give gifts and joy to those you love and care about.”
“Give to people in need.
21
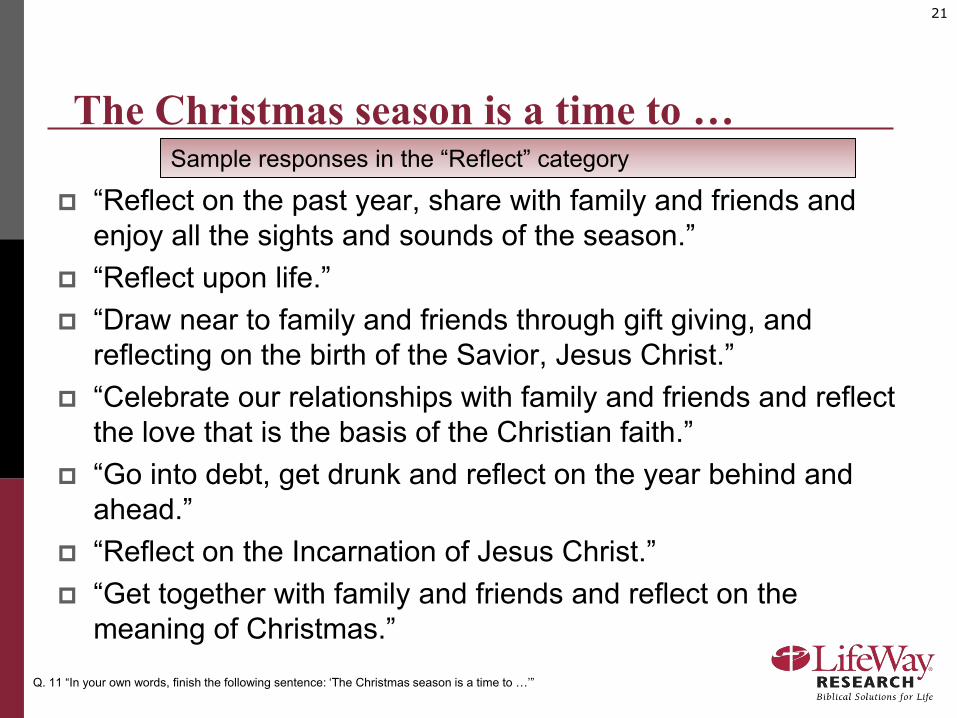
The Christmas season is a time to …
Q. 11 “In your own words, finish the following sentence: „The Christmas season is a time to …‟”
Sample responses in the “Reflect” category
“Reflect on the past year, share with family and friends and
enjoy all the sights and sounds of the season.”
“Reflect upon life.”
“Draw near to family and friends through gift giving, and
reflecting on the birth of the Savior, Jesus Christ.”
“Celebrate our relationships with family and friends and reflect
the love that is the basis of the Christian faith.”
“Go into debt, get drunk and reflect on the year behind and
ahead.”
“Reflect on the Incarnation of Jesus Christ.”
“Get together with family and friends and reflect on the
meaning of Christmas.”
Differences by faith
23
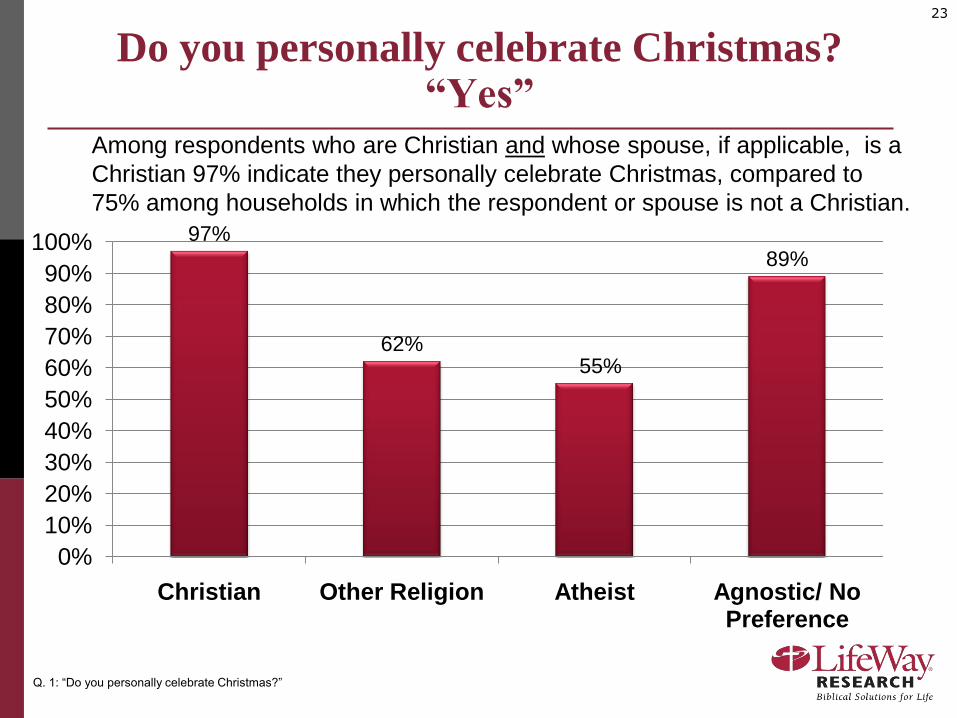
Do you personally celebrate Christmas? “Yes”
97%
62%55%
89%
0%
10%
20%
30%
40%
50%
60%
70%
80%
90%
100%
Christian Other Religion Atheist Agnostic/ No Preference
Q. 1: “Do you personally celebrate Christmas?”
Among respondents who are Christian and whose spouse, if applicable, is a
Christian 97% indicate they personally celebrate Christmas, compared to
75% among households in which the respondent or spouse is not a Christian.
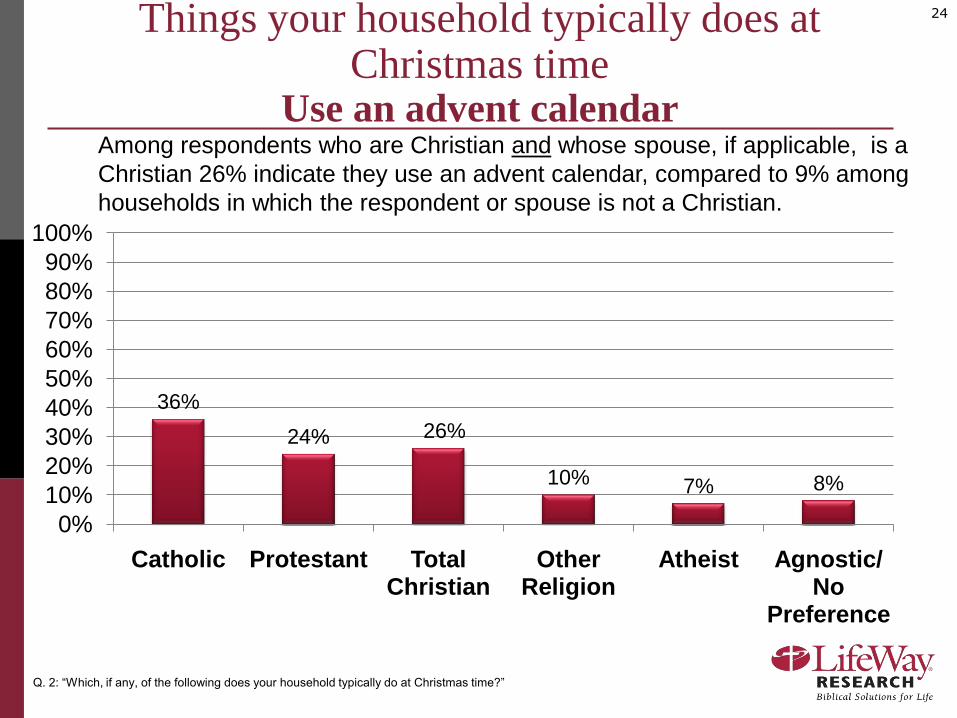
24Things your household typically does at Christmas time
Use an advent calendar
36%
24% 26%
10% 7% 8%
0%
10%
20%
30%
40%
50%
60%
70%
80%
90%
100%
Catholic Protestant Total Christian
Other Religion
Atheist Agnostic/ No
Preference
Q. 2: “Which, if any, of the following does your household typically do at Christmas time?”
Among respondents who are Christian and whose spouse, if applicable, is a
Christian 26% indicate they use an advent calendar, compared to 9% among
households in which the respondent or spouse is not a Christian.
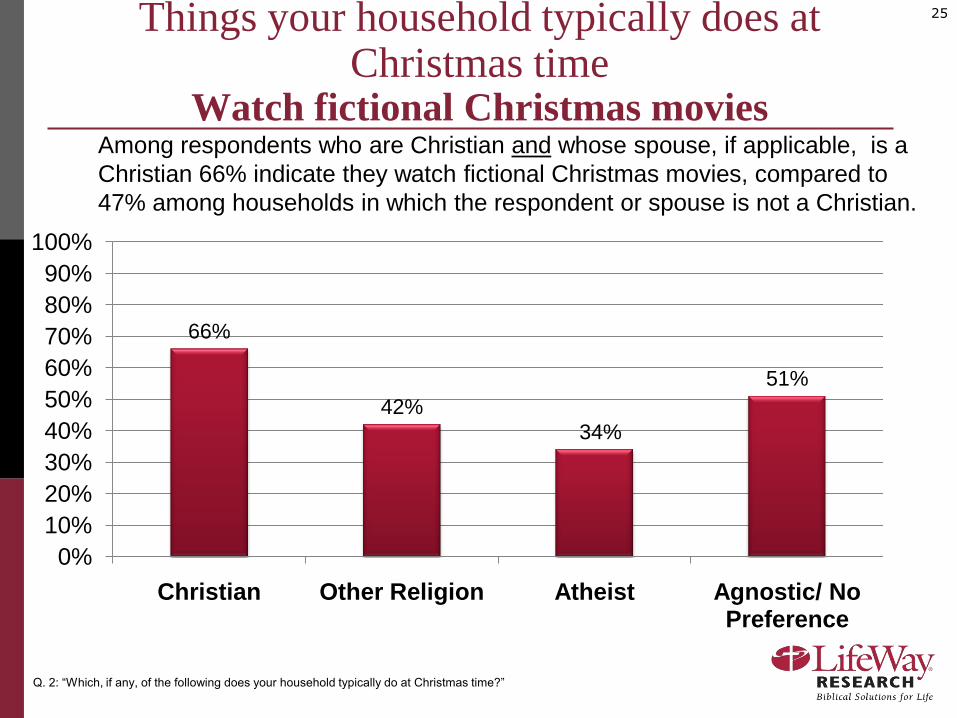
25Things your household typically does at Christmas time
Watch fictional Christmas movies
Q. 2: “Which, if any, of the following does your household typically do at Christmas time?”
66%
42%
34%
51%
0%
10%
20%
30%
40%
50%
60%
70%
80%
90%
100%
Christian Other Religion Atheist Agnostic/ No Preference
Among respondents who are Christian and whose spouse, if applicable, is a
Christian 66% indicate they watch fictional Christmas movies, compared to
47% among households in which the respondent or spouse is not a Christian.
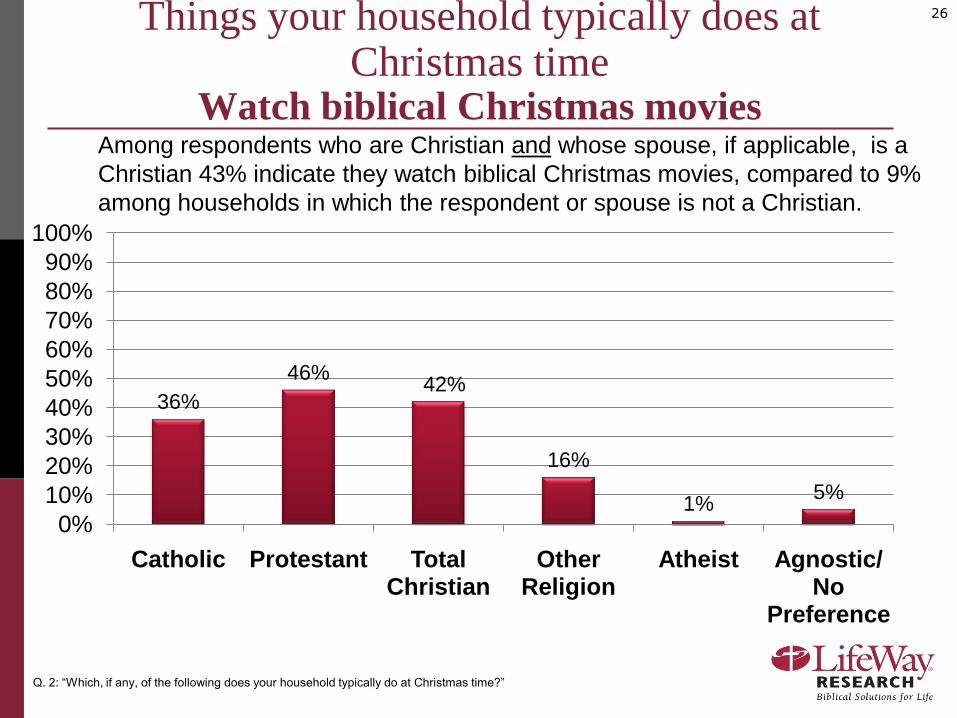
26Things your household typically does at Christmas time
Watch biblical Christmas movies
Q. 2: “Which, if any, of the following does your household typically do at Christmas time?”
36%
46%42%
16%
1%5%
0%
10%
20%
30%
40%
50%
60%
70%
80%
90%
100%
Catholic Protestant Total Christian
Other Religion
Atheist Agnostic/ No
Preference
Among respondents who are Christian and whose spouse, if applicable, is a
Christian 43% indicate they watch biblical Christmas movies, compared to 9%
among households in which the respondent or spouse is not a Christian.
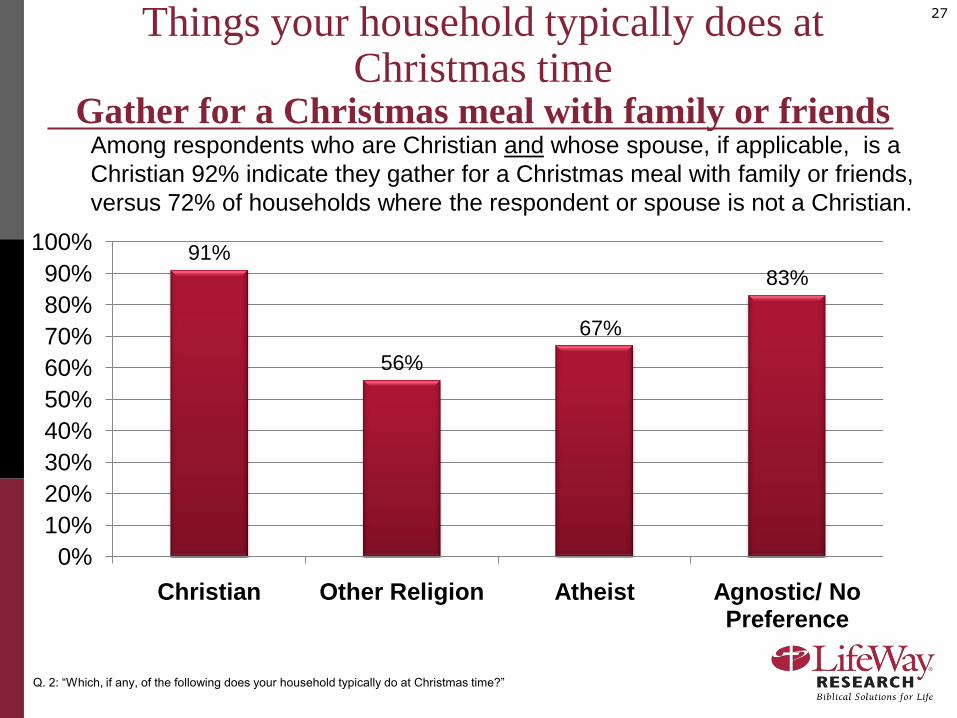
27Things your household typically does at Christmas time
Gather for a Christmas meal with family or friends
Q. 2: “Which, if any, of the following does your household typically do at Christmas time?”
91%
56%
67%
83%
0%
10%
20%
30%
40%
50%
60%
70%
80%
90%
100%
Christian Other Religion Atheist Agnostic/ No Preference
Among respondents who are Christian and whose spouse, if applicable, is a
Christian 92% indicate they gather for a Christmas meal with family or friends,
versus 72% of households where the respondent or spouse is not a Christian.
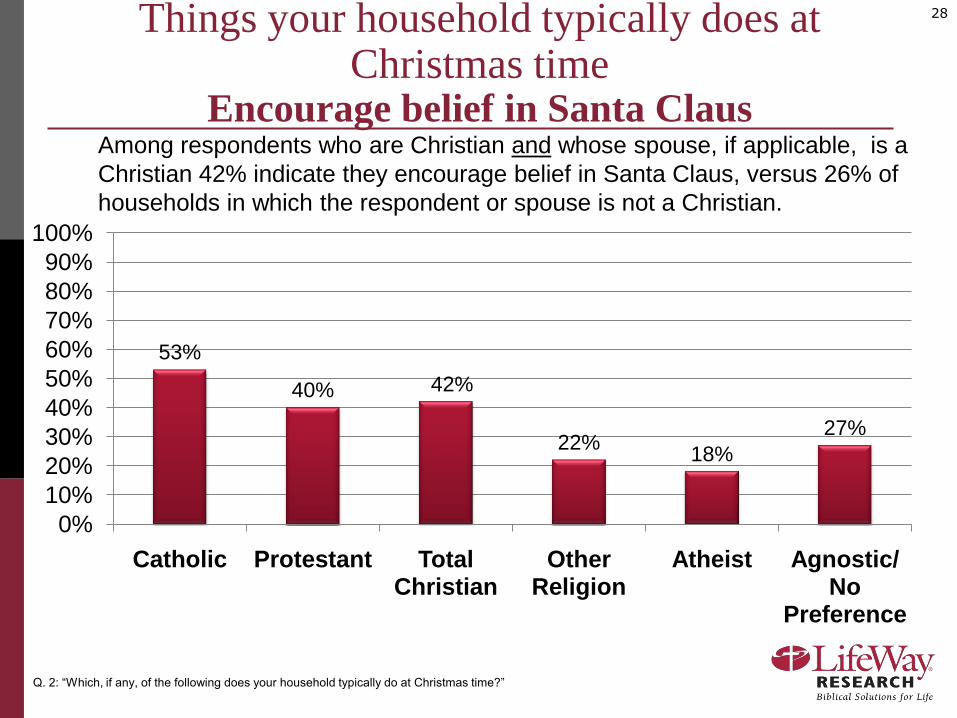
28Things your household typically does at Christmas time
Encourage belief in Santa Claus
Q. 2: “Which, if any, of the following does your household typically do at Christmas time?”
53%
40% 42%
22%18%
27%
0%
10%
20%
30%
40%
50%
60%
70%
80%
90%
100%
Catholic Protestant Total Christian
Other Religion
Atheist Agnostic/ No
Preference
Among respondents who are Christian and whose spouse, if applicable, is a
Christian 42% indicate they encourage belief in Santa Claus, versus 26% of
households in which the respondent or spouse is not a Christian.
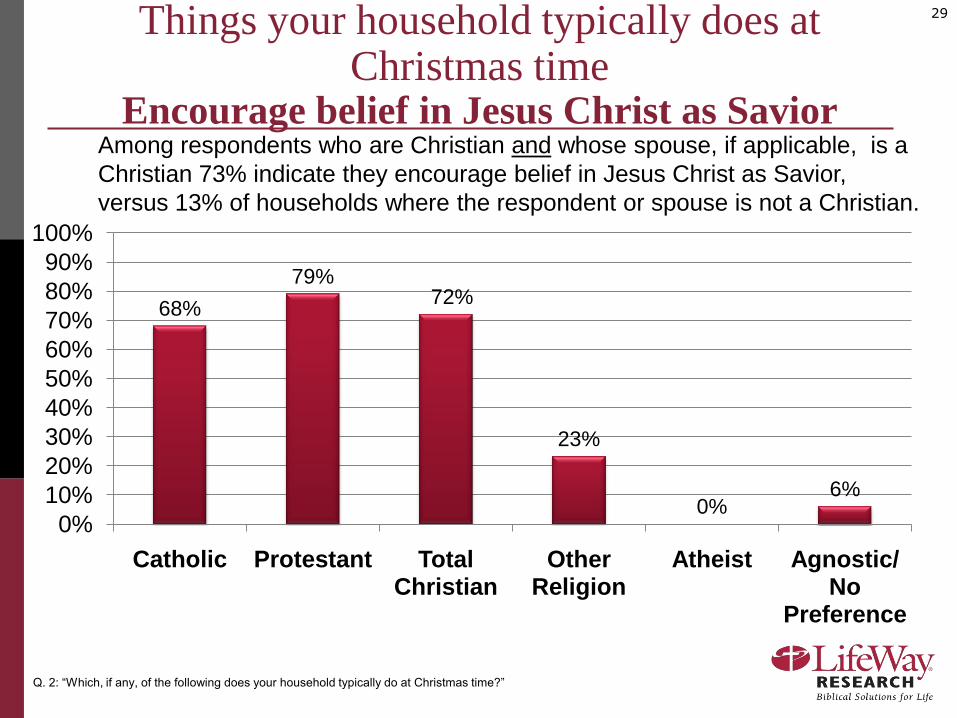
29Things your household typically does at Christmas time
Encourage belief in Jesus Christ as Savior
Q. 2: “Which, if any, of the following does your household typically do at Christmas time?”
68%
79%72%
23%
0%6%
0%
10%
20%
30%
40%
50%
60%
70%
80%
90%
100%
Catholic Protestant Total Christian
Other Religion
Atheist Agnostic/ No
Preference
Among respondents who are Christian and whose spouse, if applicable, is a
Christian 73% indicate they encourage belief in Jesus Christ as Savior,
versus 13% of households where the respondent or spouse is not a Christian.
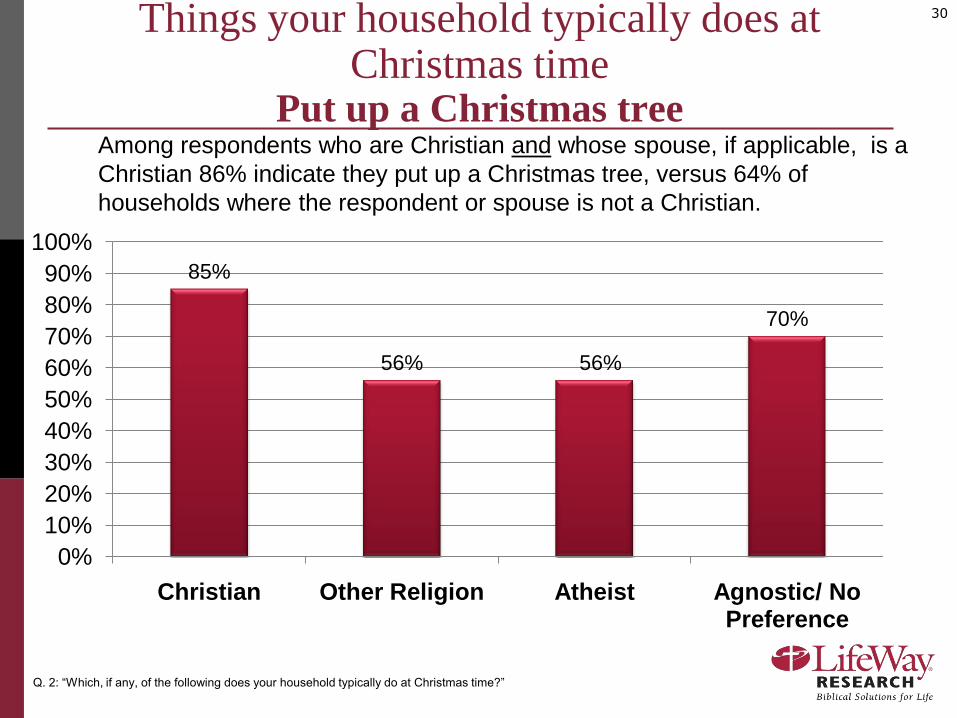
30Things your household typically does at Christmas time
Put up a Christmas tree
Q. 2: “Which, if any, of the following does your household typically do at Christmas time?”
85%
56% 56%
70%
0%
10%
20%
30%
40%
50%
60%
70%
80%
90%
100%
Christian Other Religion Atheist Agnostic/ No Preference
Among respondents who are Christian and whose spouse, if applicable, is a
Christian 86% indicate they put up a Christmas tree, versus 64% of
households where the respondent or spouse is not a Christian.
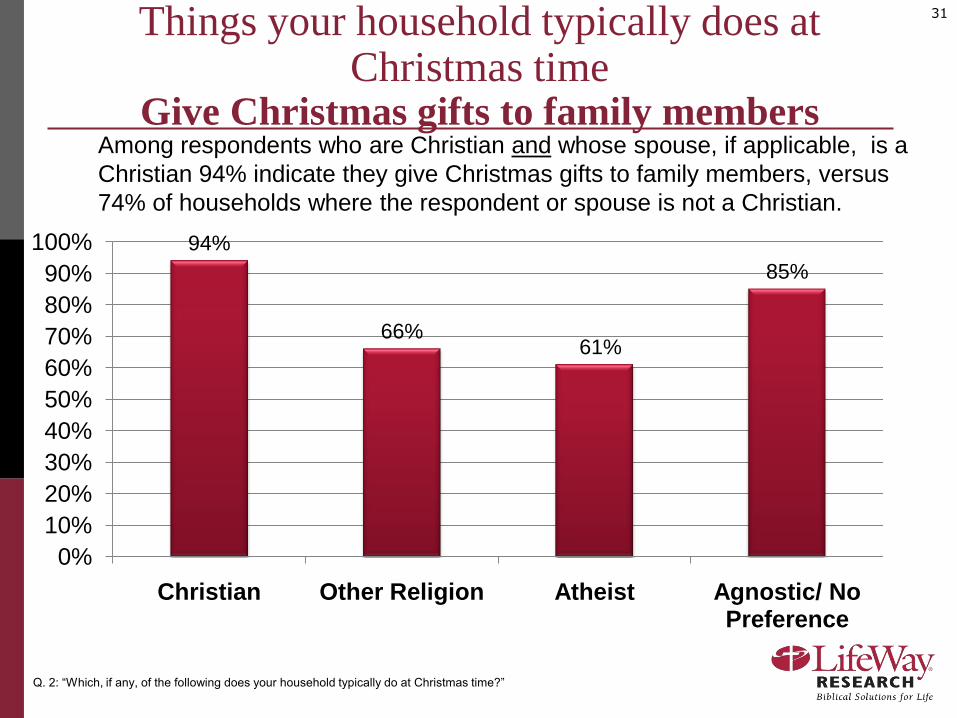
31Things your household typically does at Christmas time
Give Christmas gifts to family members
Q. 2: “Which, if any, of the following does your household typically do at Christmas time?”
94%
66%61%
85%
0%
10%
20%
30%
40%
50%
60%
70%
80%
90%
100%
Christian Other Religion Atheist Agnostic/ No Preference
Among respondents who are Christian and whose spouse, if applicable, is a
Christian 94% indicate they give Christmas gifts to family members, versus
74% of households where the respondent or spouse is not a Christian.
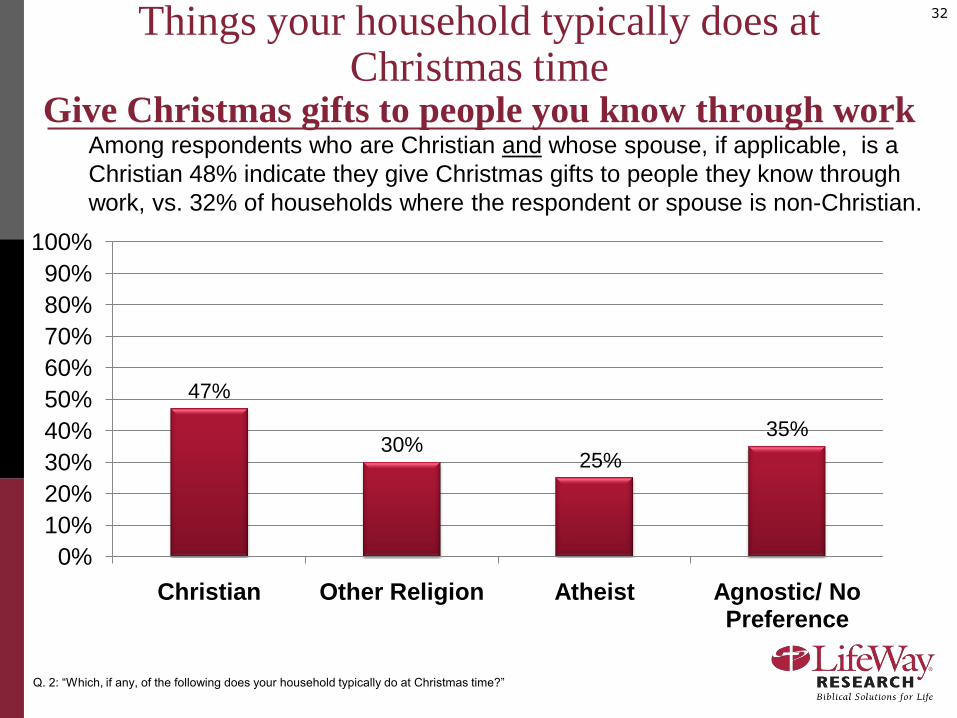
32Things your household typically does at Christmas time
Give Christmas gifts to people you know through work
Q. 2: “Which, if any, of the following does your household typically do at Christmas time?”
47%
30%25%
35%
0%
10%
20%
30%
40%
50%
60%
70%
80%
90%
100%
Christian Other Religion Atheist Agnostic/ No Preference
Among respondents who are Christian and whose spouse, if applicable, is a
Christian 48% indicate they give Christmas gifts to people they know through
work, vs. 32% of households where the respondent or spouse is non-Christian.
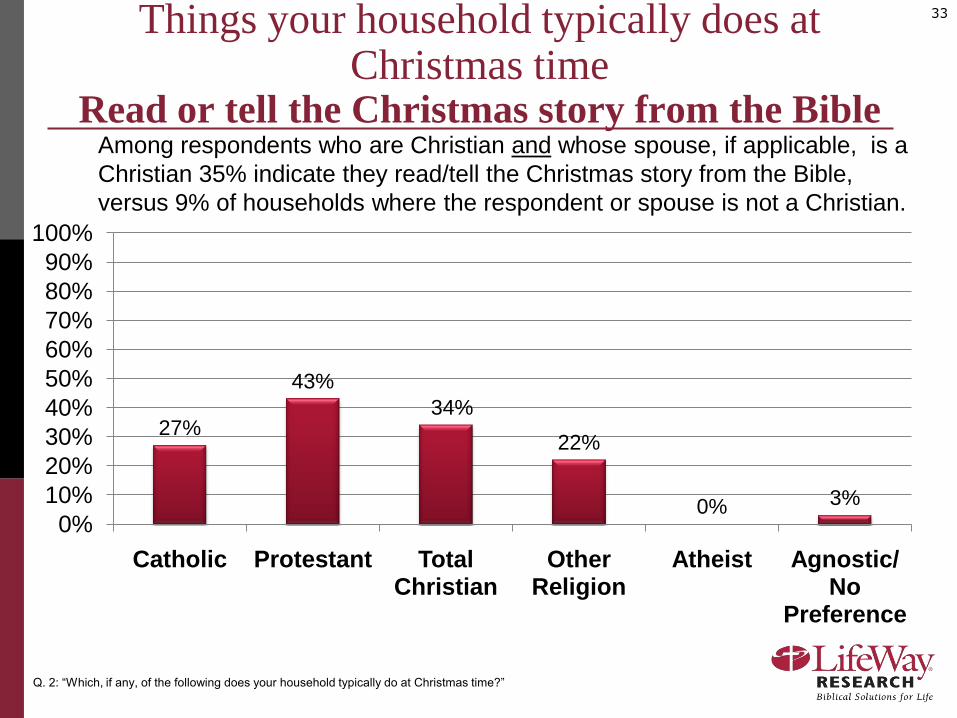
33Things your household typically does at Christmas time
Read or tell the Christmas story from the Bible
Q. 2: “Which, if any, of the following does your household typically do at Christmas time?”
27%
43%
34%
22%
0% 3%
0%
10%
20%
30%
40%
50%
60%
70%
80%
90%
100%
Catholic Protestant Total Christian
Other Religion
Atheist Agnostic/ No
Preference
Among respondents who are Christian and whose spouse, if applicable, is a
Christian 35% indicate they read/tell the Christmas story from the Bible,
versus 9% of households where the respondent or spouse is not a Christian.
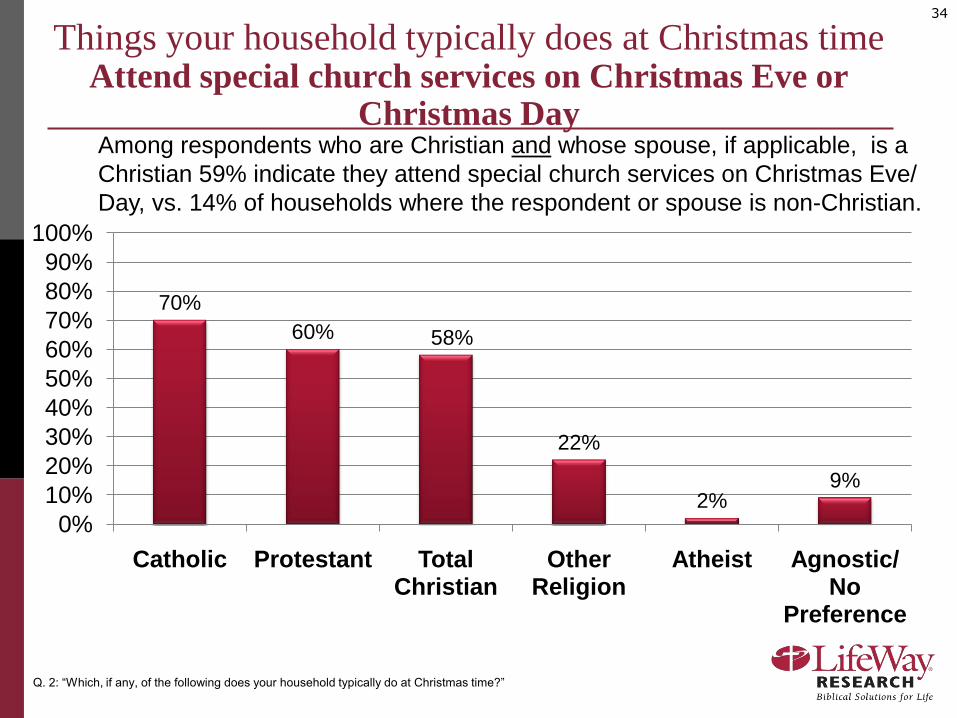
34
Things your household typically does at Christmas time Attend special church services on Christmas Eve or
Christmas Day
Q. 2: “Which, if any, of the following does your household typically do at Christmas time?”
70%
60% 58%
22%
2%9%
0%
10%
20%
30%
40%
50%
60%
70%
80%
90%
100%
Catholic Protestant Total Christian
Other Religion
Atheist Agnostic/ No
Preference
Among respondents who are Christian and whose spouse, if applicable, is a
Christian 59% indicate they attend special church services on Christmas Eve/
Day, vs. 14% of households where the respondent or spouse is non-Christian.
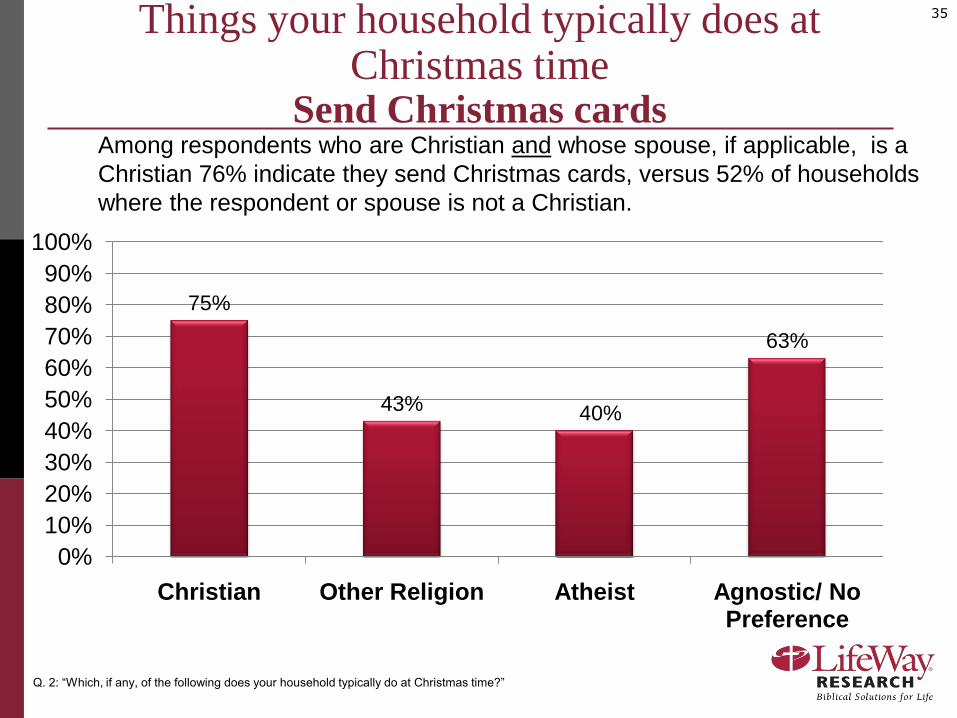
35Things your household typically does at Christmas time
Send Christmas cards
Q. 2: “Which, if any, of the following does your household typically do at Christmas time?”
75%
43% 40%
63%
0%
10%
20%
30%
40%
50%
60%
70%
80%
90%
100%
Christian Other Religion Atheist Agnostic/ No Preference
Among respondents who are Christian and whose spouse, if applicable, is a
Christian 76% indicate they send Christmas cards, versus 52% of households
where the respondent or spouse is not a Christian.
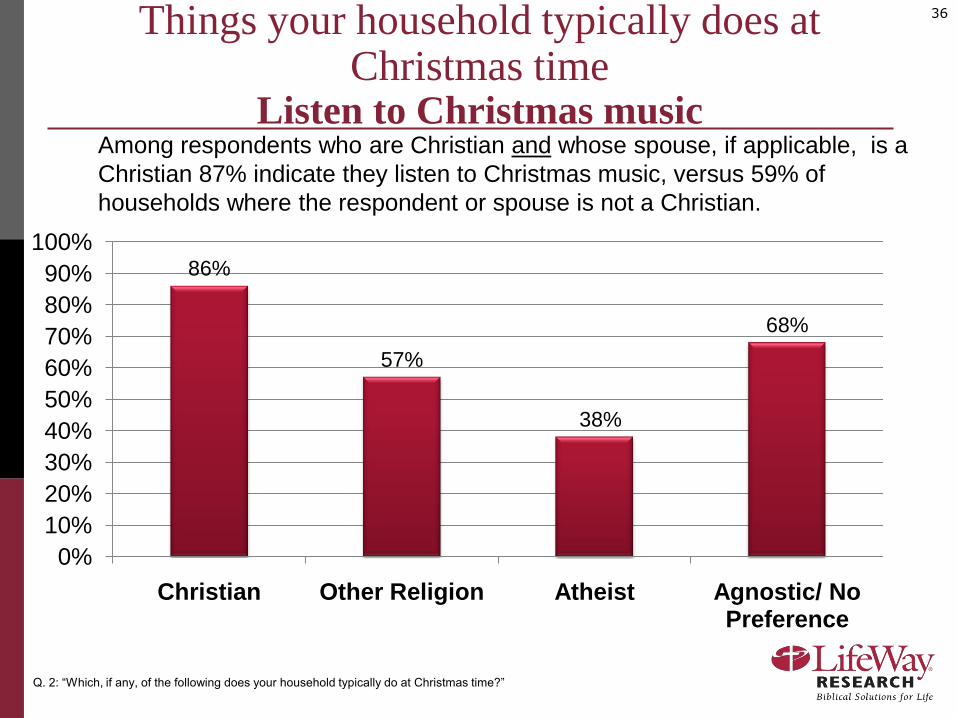
36Things your household typically does at Christmas time
Listen to Christmas music
Q. 2: “Which, if any, of the following does your household typically do at Christmas time?”
86%
57%
38%
68%
0%
10%
20%
30%
40%
50%
60%
70%
80%
90%
100%
Christian Other Religion Atheist Agnostic/ No Preference
Among respondents who are Christian and whose spouse, if applicable, is a
Christian 87% indicate they listen to Christmas music, versus 59% of
households where the respondent or spouse is not a Christian.
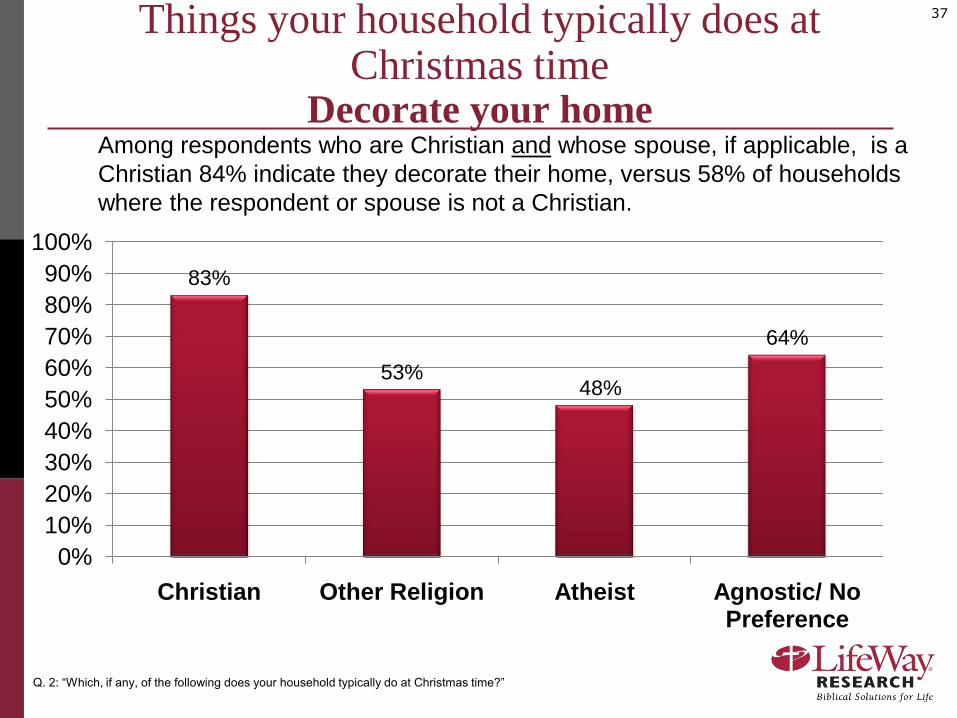
37Things your household typically does at Christmas time
Decorate your home
Q. 2: “Which, if any, of the following does your household typically do at Christmas time?”
83%
53%48%
64%
0%
10%
20%
30%
40%
50%
60%
70%
80%
90%
100%
Christian Other Religion Atheist Agnostic/ No Preference
Among respondents who are Christian and whose spouse, if applicable, is a
Christian 84% indicate they decorate their home, versus 58% of households
where the respondent or spouse is not a Christian.
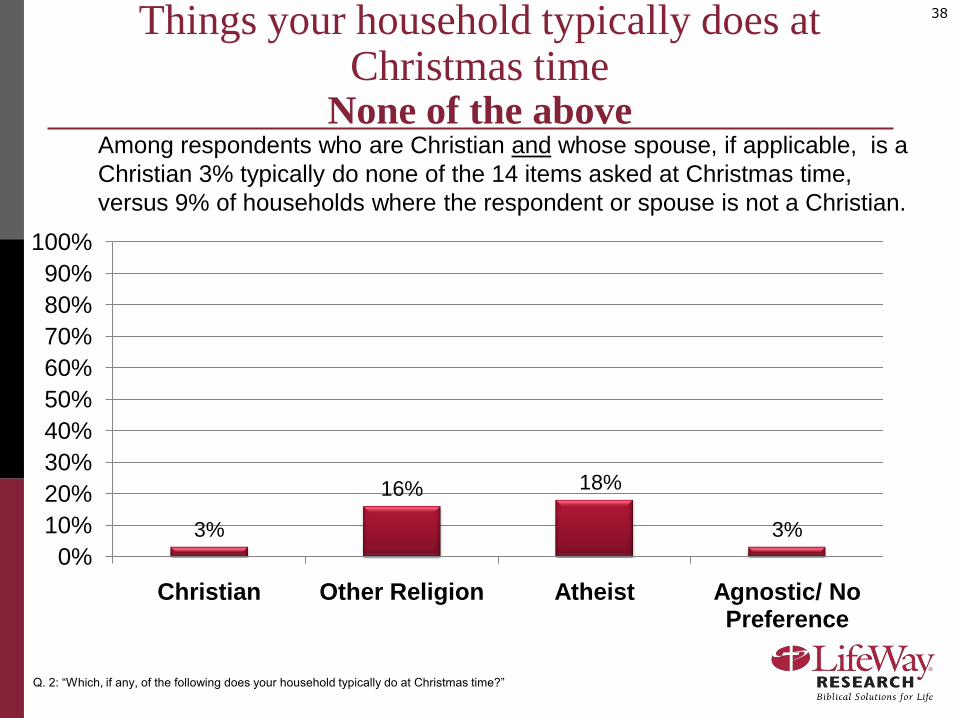
38Things your household typically does at Christmas time
None of the above
Q. 2: “Which, if any, of the following does your household typically do at Christmas time?”
Among respondents who are Christian and whose spouse, if applicable, is a
Christian 3% typically do none of the 14 items asked at Christmas time,
versus 9% of households where the respondent or spouse is not a Christian.
3%
16% 18%
3%
0%
10%
20%
30%
40%
50%
60%
70%
80%
90%
100%
Christian Other Religion Atheist Agnostic/ No Preference
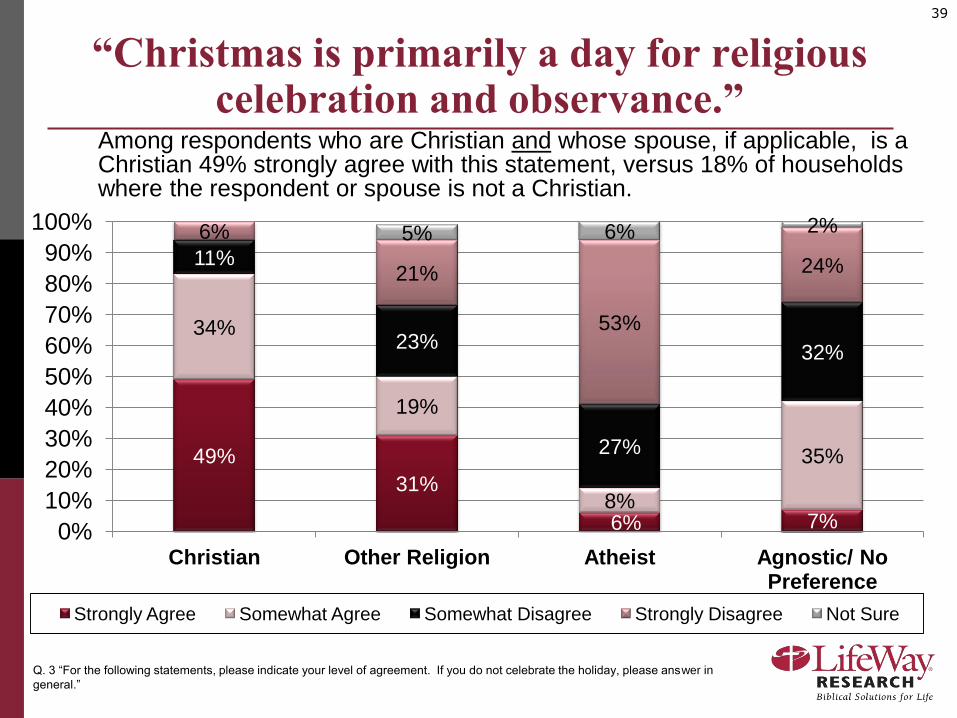
39
“Christmas is primarily a day for religious celebration and observance.”
Q. 3 “For the following statements, please indicate your level of agreement. If you do not celebrate the holiday, please answer in
general.”
49%
31%
6% 7%
34%
19%
8%
35%
11%
23%
27%
32%
6%
21%
53%
24%
5% 6% 2%
0%
10%
20%
30%
40%
50%
60%
70%
80%
90%
100%
Christian Other Religion Atheist Agnostic/ No Preference
Strongly Agree Somewhat Agree Somewhat Disagree Strongly Disagree Not Sure
Among respondents who are Christian and whose spouse, if applicable, is a Christian 49% strongly agree with this statement, versus 18% of households where the respondent or spouse is not a Christian.
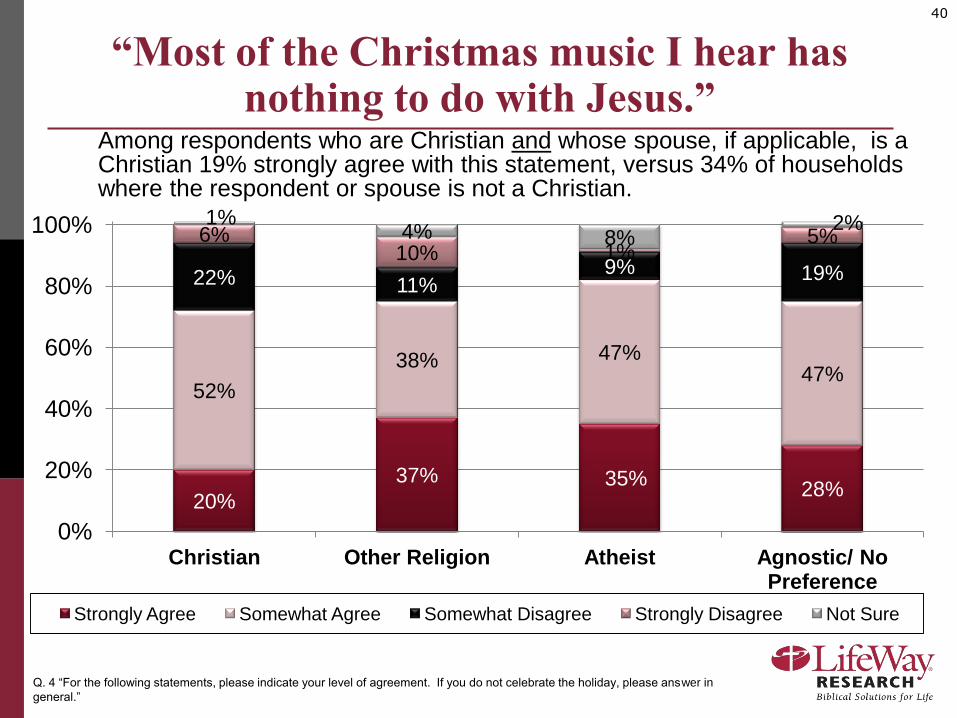
40
“Most of the Christmas music I hear has nothing to do with Jesus.”
Q. 4 “For the following statements, please indicate your level of agreement. If you do not celebrate the holiday, please answer in
general.”
20%
37% 35%28%
52%
38% 47%47%
22% 11%9% 19%
6%10% 1%
5%1%
4% 8%2%
0%
20%
40%
60%
80%
100%
Christian Other Religion Atheist Agnostic/ No Preference
Strongly Agree Somewhat Agree Somewhat Disagree Strongly Disagree Not Sure
Among respondents who are Christian and whose spouse, if applicable, is a Christian 19% strongly agree with this statement, versus 34% of households where the respondent or spouse is not a Christian.
41
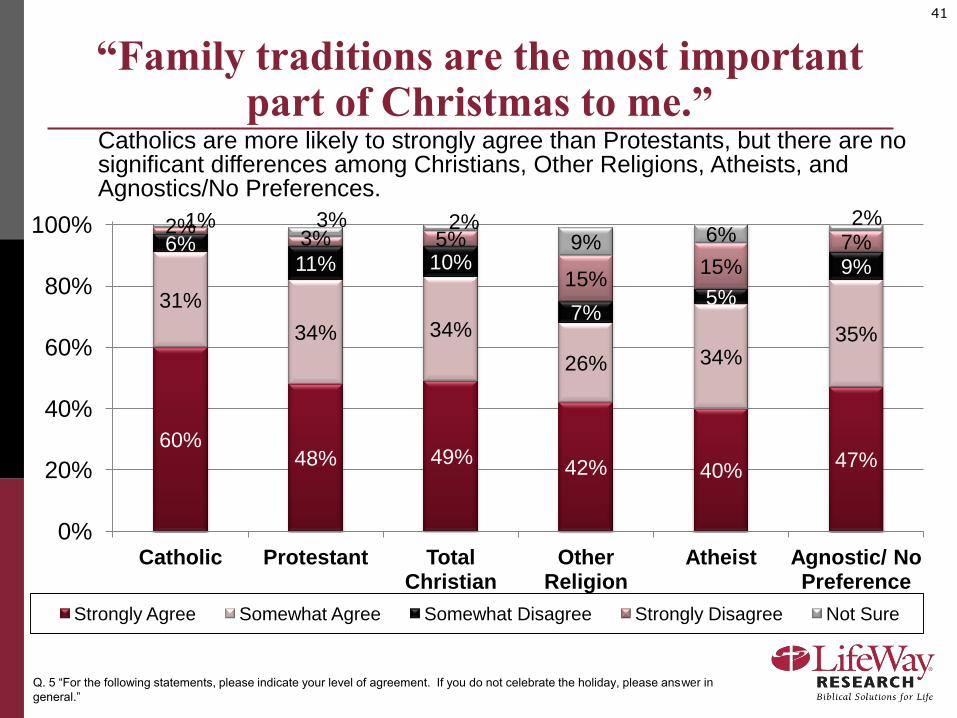
“Family traditions are the most important part of Christmas to me.”
Q. 5 “For the following statements, please indicate your level of agreement. If you do not celebrate the holiday, please answer in
general.”
60%48% 49%
42% 40%47%
31%
34% 34%
26% 34%35%
6%11% 10%
7%5%
9%
2%3% 5%
15%15%
7%1% 3% 2%
9% 6%2%
0%
20%
40%
60%
80%
100%
Catholic Protestant Total Christian
Other Religion
Atheist Agnostic/ No Preference
Strongly Agree Somewhat Agree Somewhat Disagree Strongly Disagree Not Sure
Catholics are more likely to strongly agree than Protestants, but there are no significant differences among Christians, Other Religions, Atheists, and Agnostics/No Preferences.
42
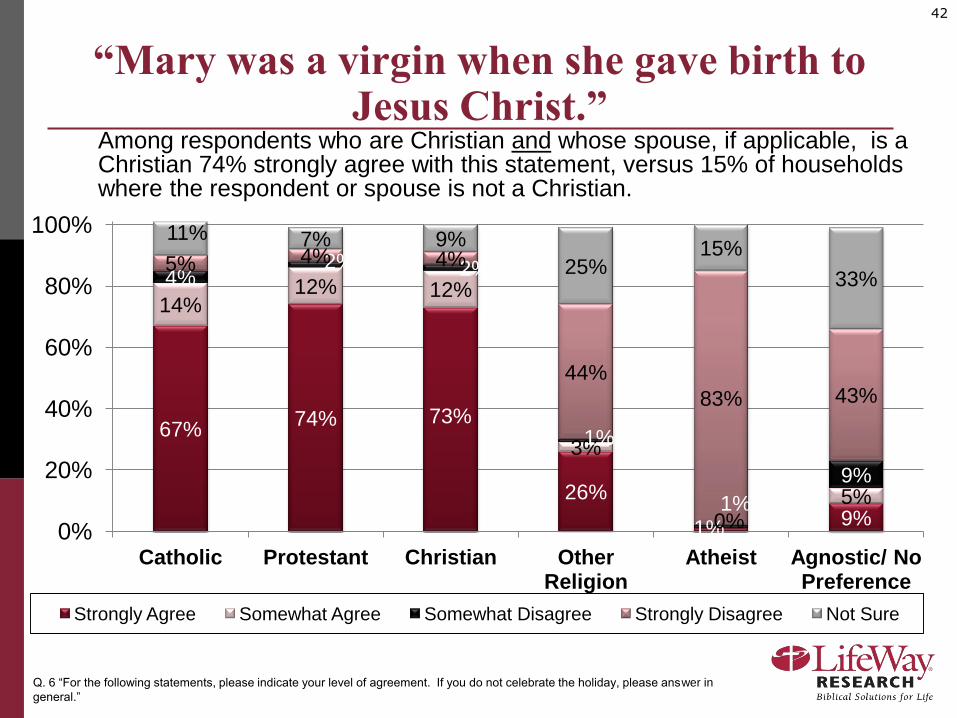
“Mary was a virgin when she gave birth to Jesus Christ.”
Q. 6 “For the following statements, please indicate your level of agreement. If you do not celebrate the holiday, please answer in
general.”
67%74% 73%
26%
1% 9%
14%12% 12%
3%
0%5%
4%2% 2%
1%
1%
9%
5% 4% 4%
44%
83% 43%
11% 7% 9%
25%15%
33%
0%
20%
40%
60%
80%
100%
Catholic Protestant Christian Other Religion
Atheist Agnostic/ No Preference
Strongly Agree Somewhat Agree Somewhat Disagree Strongly Disagree Not Sure
Among respondents who are Christian and whose spouse, if applicable, is a Christian 74% strongly agree with this statement, versus 15% of households where the respondent or spouse is not a Christian.
43
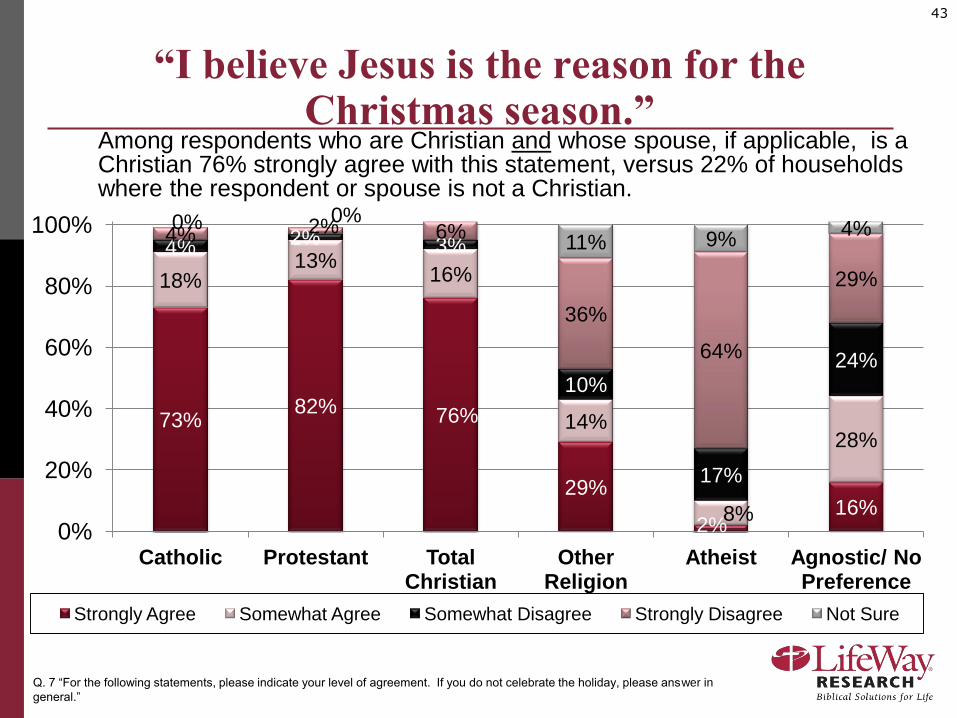
“I believe Jesus is the reason for the Christmas season.”
Q. 7 “For the following statements, please indicate your level of agreement. If you do not celebrate the holiday, please answer in
general.”
73%82% 76%
29%
2%16%
18%13%
16%
14%
8%
28%
4% 2% 3%
10%
17%
24%
4% 2% 6%
36%
64%
29%
0% 0%
11% 9%4%
0%
20%
40%
60%
80%
100%
Catholic Protestant Total Christian
Other Religion
Atheist Agnostic/ No Preference
Strongly Agree Somewhat Agree Somewhat Disagree Strongly Disagree Not Sure
Among respondents who are Christian and whose spouse, if applicable, is a Christian 76% strongly agree with this statement, versus 22% of households where the respondent or spouse is not a Christian.
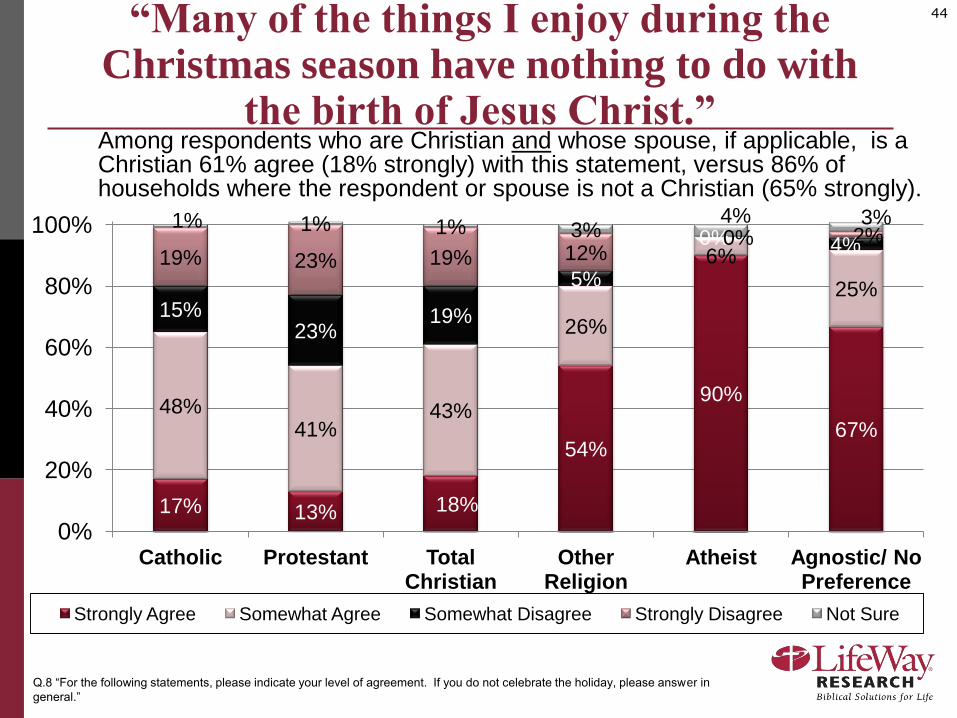
44“Many of the things I enjoy during the Christmas season have nothing to do with
the birth of Jesus Christ.”
Q.8 “For the following statements, please indicate your level of agreement. If you do not celebrate the holiday, please answer in
general.”
17% 13% 18%
54%
90%
67%48%
41%43%
26%
6%
25%15%
23%19%
5%
0% 4%19% 23% 19% 12%
0% 2%1% 1% 1% 3%
4% 3%
0%
20%
40%
60%
80%
100%
Catholic Protestant Total Christian
Other Religion
Atheist Agnostic/ No Preference
Strongly Agree Somewhat Agree Somewhat Disagree Strongly Disagree Not Sure
Among respondents who are Christian and whose spouse, if applicable, is a Christian 61% agree (18% strongly) with this statement, versus 86% of households where the respondent or spouse is not a Christian (65% strongly).
45
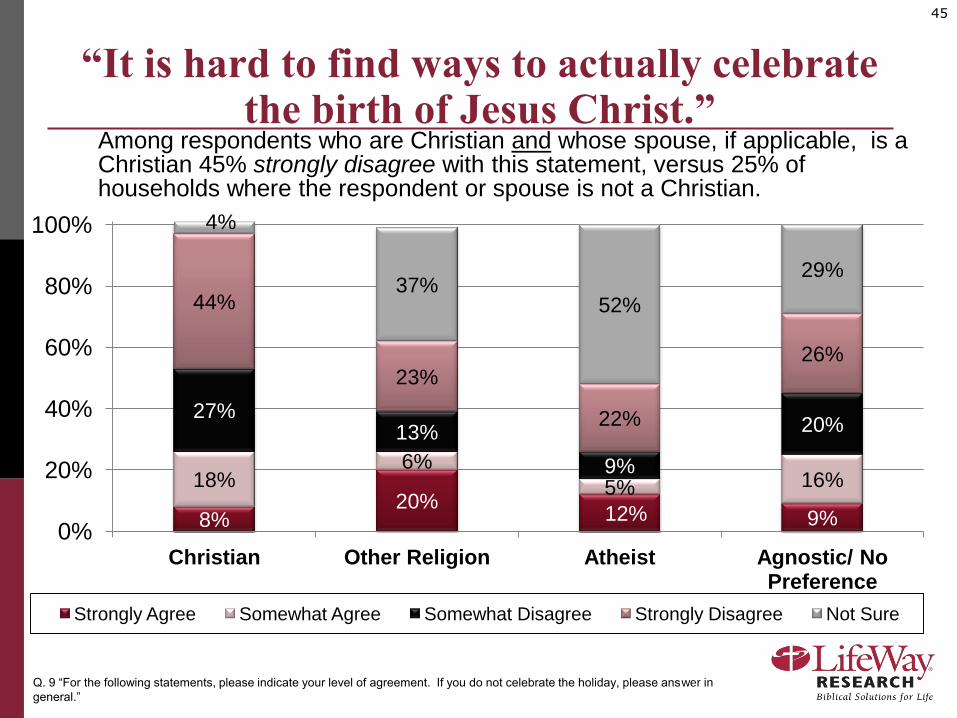
“It is hard to find ways to actually celebrate the birth of Jesus Christ.”
Q. 9 “For the following statements, please indicate your level of agreement. If you do not celebrate the holiday, please answer in
general.”
8%20%
12% 9%
18%6%
5% 16%
27%13%
9%
20%
44%
23%
22%
26%
4%
37%52%
29%
0%
20%
40%
60%
80%
100%
Christian Other Religion Atheist Agnostic/ No Preference
Strongly Agree Somewhat Agree Somewhat Disagree Strongly Disagree Not Sure
Among respondents who are Christian and whose spouse, if applicable, is a Christian 45% strongly disagree with this statement, versus 25% of households where the respondent or spouse is not a Christian.
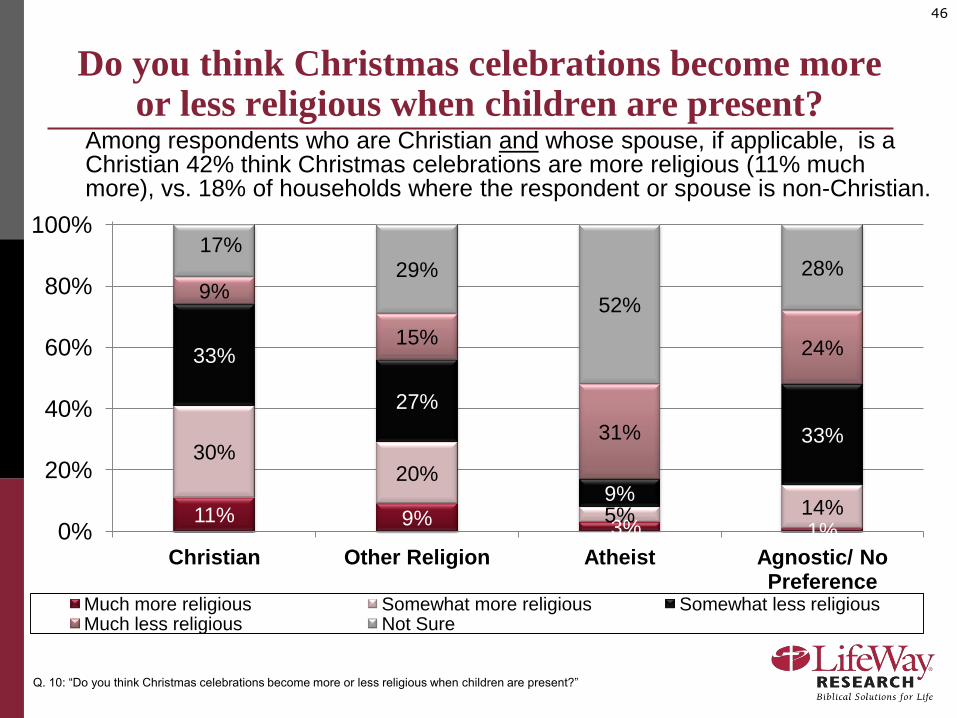
46
Do you think Christmas celebrations become more or less religious when children are present?
Q. 10: “Do you think Christmas celebrations become more or less religious when children are present?”
11% 9% 3% 1%
30%20%
5% 14%
33%
27%
9%
33%
9%
15%
31%
24%
17%
29%
52%
28%
0%
20%
40%
60%
80%
100%
Christian Other Religion Atheist Agnostic/ No Preference
Much more religious Somewhat more religious Somewhat less religiousMuch less religious Not Sure
Among respondents who are Christian and whose spouse, if applicable, is a Christian 42% think Christmas celebrations are more religious (11% much more), vs. 18% of households where the respondent or spouse is non-Christian.
Differences by demographic
characteristics
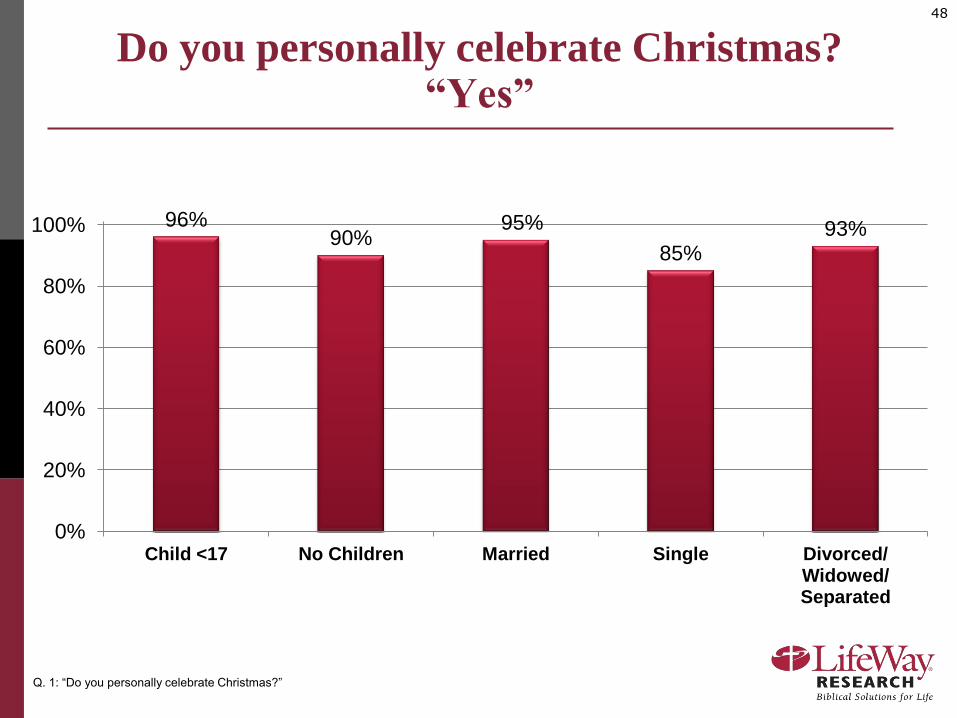
48
Q. 1: “Do you personally celebrate Christmas?”
96%90%
95%
85%93%
0%
20%
40%
60%
80%
100%
Child <17 No Children Married Single Divorced/ Widowed/ Separated
Do you personally celebrate Christmas? “Yes”
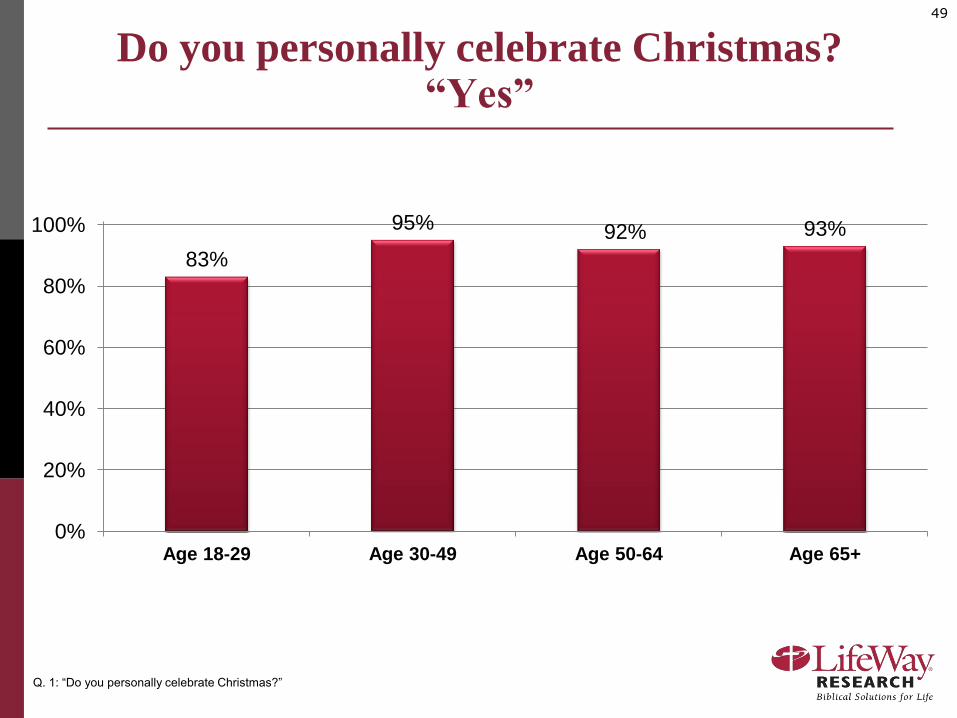
49
Q. 1: “Do you personally celebrate Christmas?”
83%
95% 92% 93%
0%
20%
40%
60%
80%
100%
Age 18-29 Age 30-49 Age 50-64 Age 65+
Do you personally celebrate Christmas? “Yes”
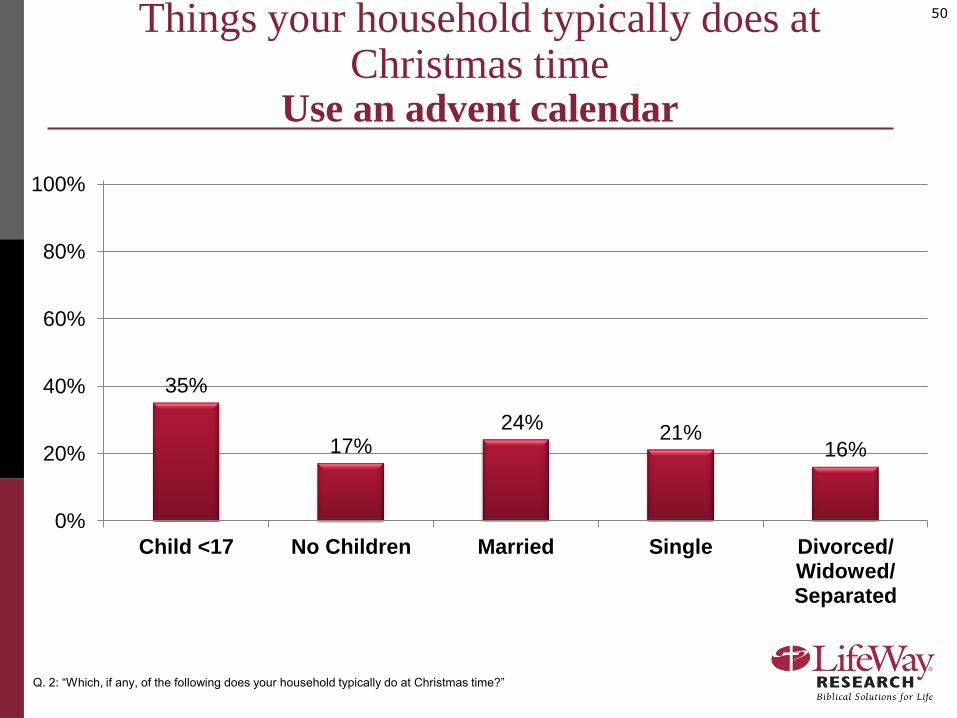
50Things your household typically does at Christmas time
Use an advent calendar
Q. 2: “Which, if any, of the following does your household typically do at Christmas time?”
35%
17%24%
21%16%
0%
20%
40%
60%
80%
100%
Child <17 No Children Married Single Divorced/ Widowed/ Separated
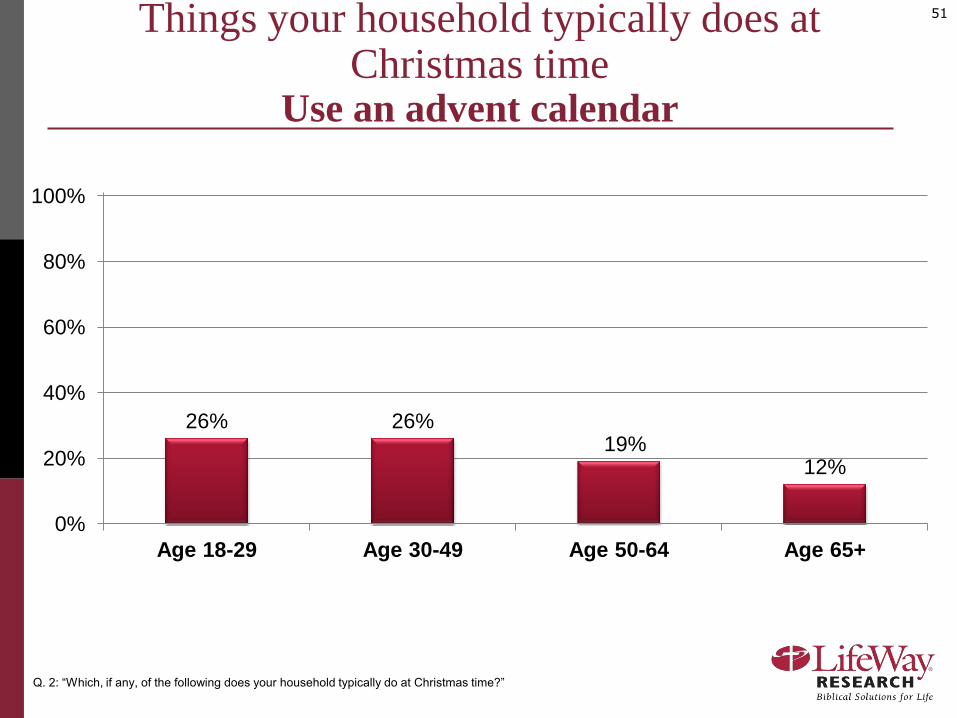
51Things your household typically does at Christmas time
Use an advent calendar
Q. 2: “Which, if any, of the following does your household typically do at Christmas time?”
26% 26%19%
12%
0%
20%
40%
60%
80%
100%
Age 18-29 Age 30-49 Age 50-64 Age 65+
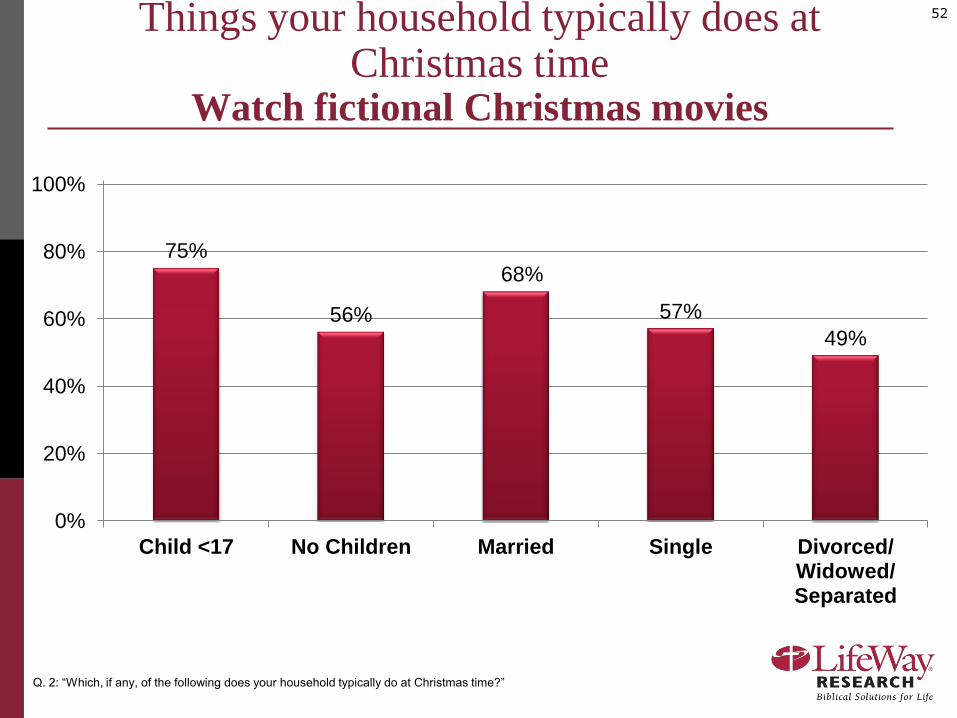
52Things your household typically does at Christmas time
Watch fictional Christmas movies
Q. 2: “Which, if any, of the following does your household typically do at Christmas time?”
75%
56%
68%
57%
49%
0%
20%
40%
60%
80%
100%
Child <17 No Children Married Single Divorced/ Widowed/ Separated
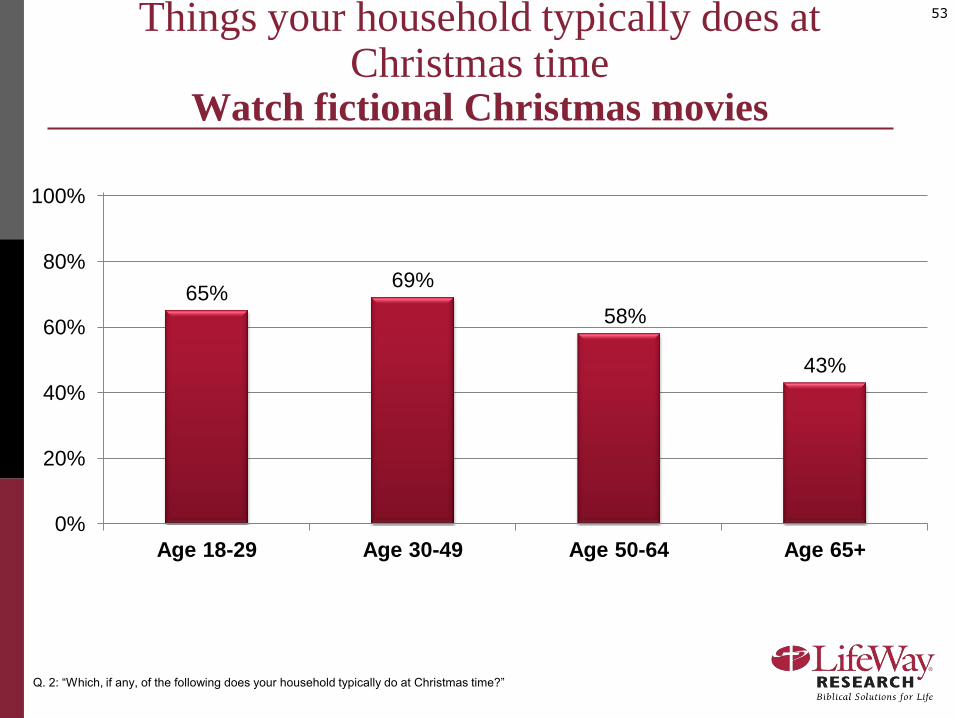
53Things your household typically does at Christmas time
Watch fictional Christmas movies
Q. 2: “Which, if any, of the following does your household typically do at Christmas time?”
65%69%
58%
43%
0%
20%
40%
60%
80%
100%
Age 18-29 Age 30-49 Age 50-64 Age 65+
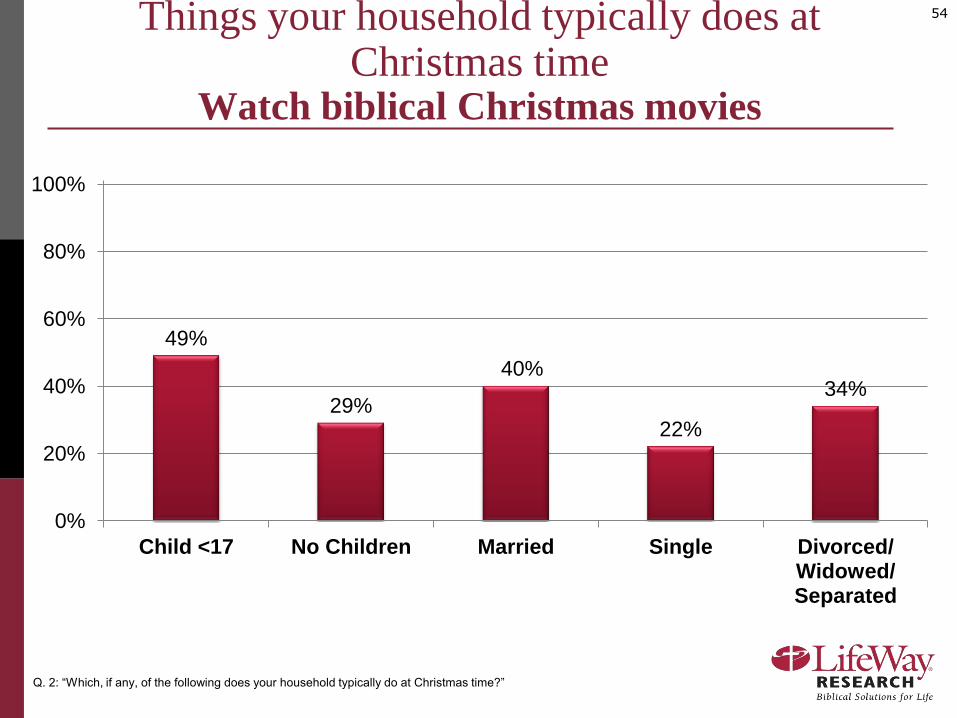
54Things your household typically does at Christmas time
Watch biblical Christmas movies
Q. 2: “Which, if any, of the following does your household typically do at Christmas time?”
49%
29%
40%
22%
34%
0%
20%
40%
60%
80%
100%
Child <17 No Children Married Single Divorced/ Widowed/ Separated
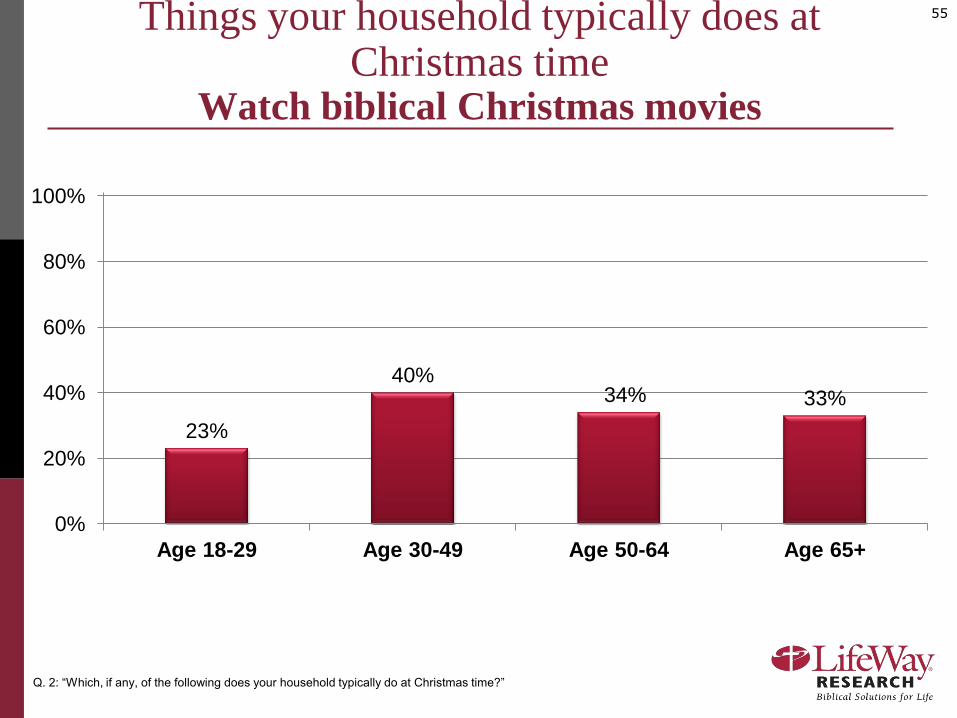
55
Q. 2: “Which, if any, of the following does your household typically do at Christmas time?”
23%
40%34% 33%
0%
20%
40%
60%
80%
100%
Age 18-29 Age 30-49 Age 50-64 Age 65+
Things your household typically does at Christmas time
Watch biblical Christmas movies
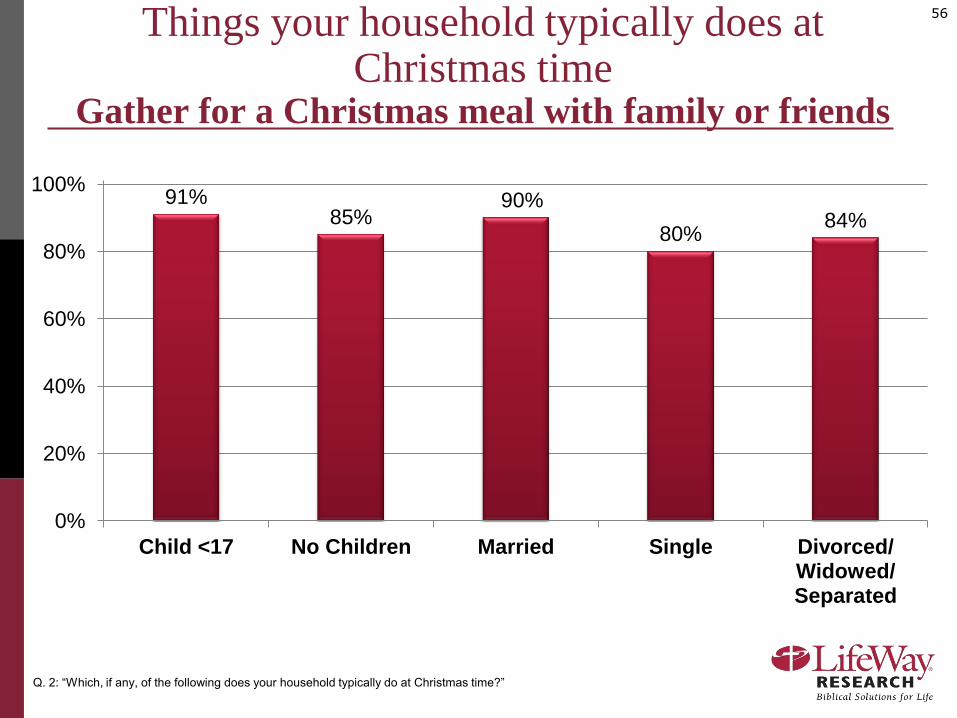
56Things your household typically does at Christmas time
Gather for a Christmas meal with family or friends
Q. 2: “Which, if any, of the following does your household typically do at Christmas time?”
91%85%
90%
80%84%
0%
20%
40%
60%
80%
100%
Child <17 No Children Married Single Divorced/ Widowed/ Separated
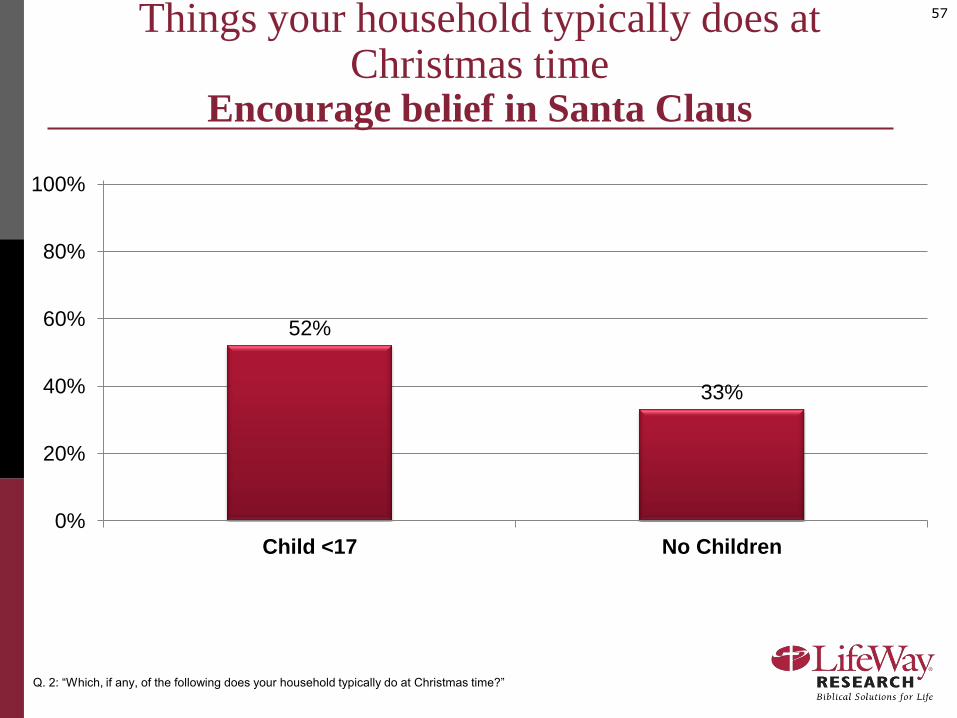
57Things your household typically does at Christmas time
Encourage belief in Santa Claus
Q. 2: “Which, if any, of the following does your household typically do at Christmas time?”
52%
33%
0%
20%
40%
60%
80%
100%
Child <17 No Children
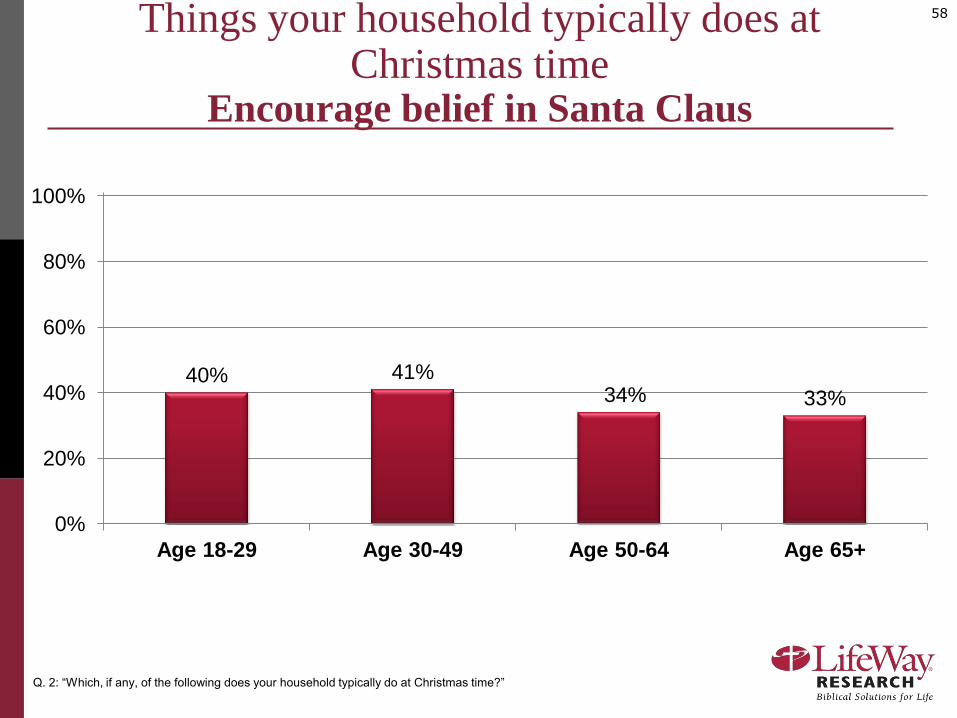
58Things your household typically does at Christmas time
Encourage belief in Santa Claus
Q. 2: “Which, if any, of the following does your household typically do at Christmas time?”
40% 41%34% 33%
0%
20%
40%
60%
80%
100%
Age 18-29 Age 30-49 Age 50-64 Age 65+
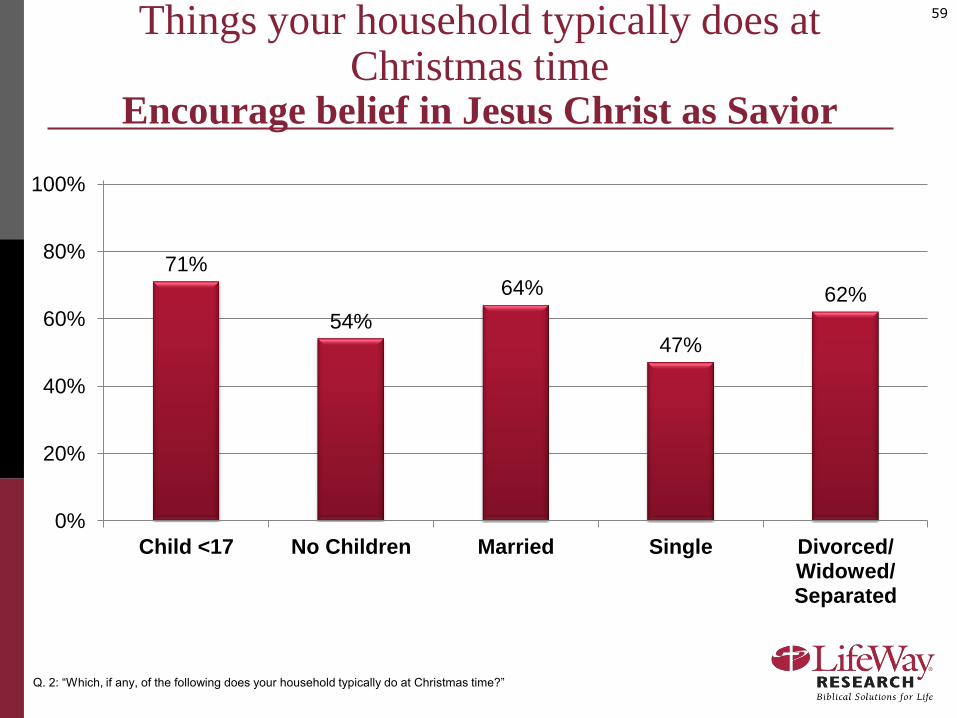
59Things your household typically does at Christmas time
Encourage belief in Jesus Christ as Savior
Q. 2: “Which, if any, of the following does your household typically do at Christmas time?”
71%
54%
64%
47%
62%
0%
20%
40%
60%
80%
100%
Child <17 No Children Married Single Divorced/ Widowed/ Separated
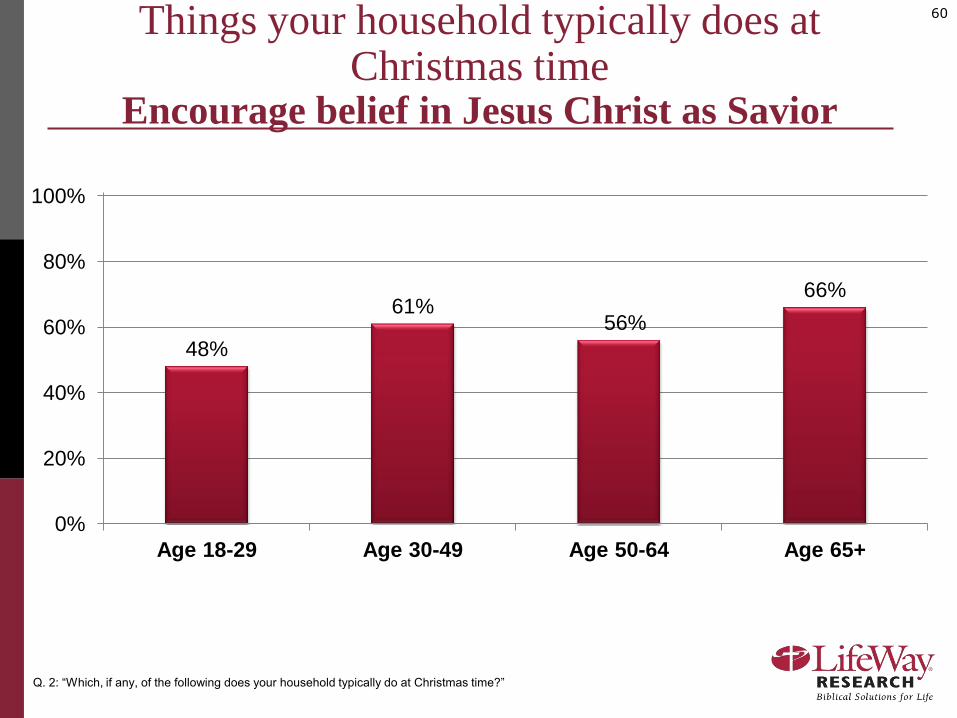
60Things your household typically does at Christmas time
Encourage belief in Jesus Christ as Savior
Q. 2: “Which, if any, of the following does your household typically do at Christmas time?”
48%
61%56%
66%
0%
20%
40%
60%
80%
100%
Age 18-29 Age 30-49 Age 50-64 Age 65+
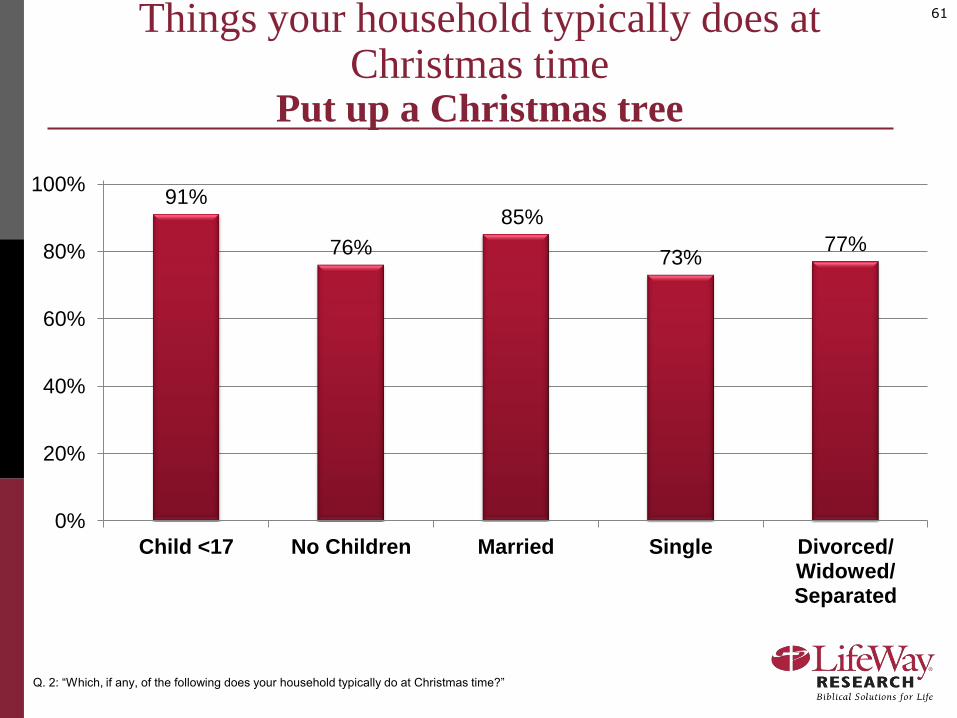
61Things your household typically does at Christmas time
Put up a Christmas tree
Q. 2: “Which, if any, of the following does your household typically do at Christmas time?”
91%
76%
85%
73%77%
0%
20%
40%
60%
80%
100%
Child <17 No Children Married Single Divorced/ Widowed/ Separated
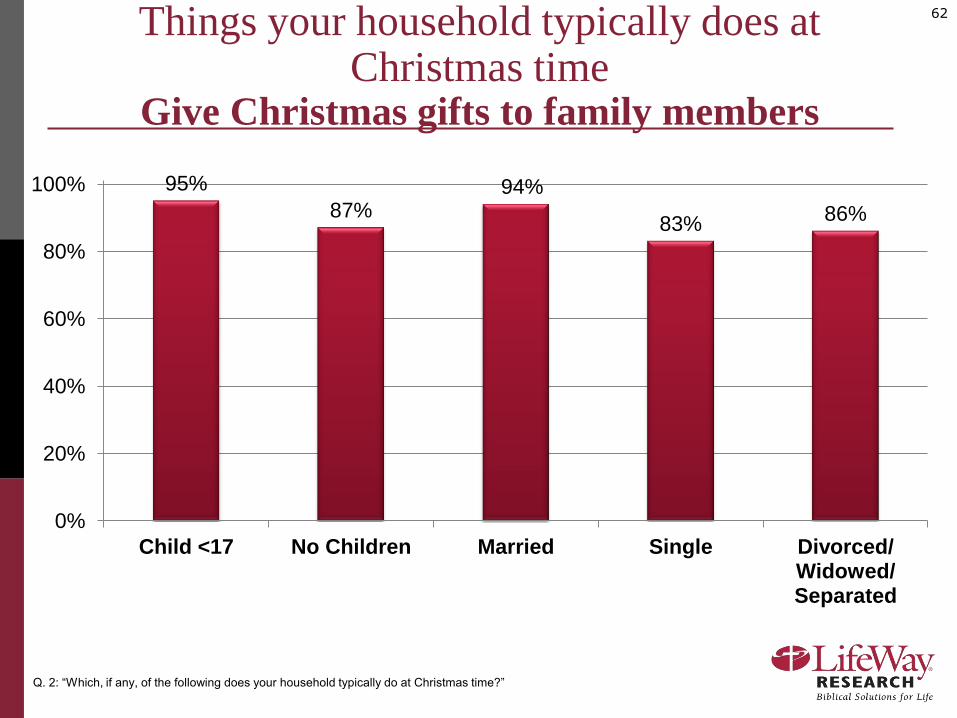
62Things your household typically does at Christmas time
Give Christmas gifts to family members
Q. 2: “Which, if any, of the following does your household typically do at Christmas time?”
95%
87%94%
83%86%
0%
20%
40%
60%
80%
100%
Child <17 No Children Married Single Divorced/ Widowed/ Separated
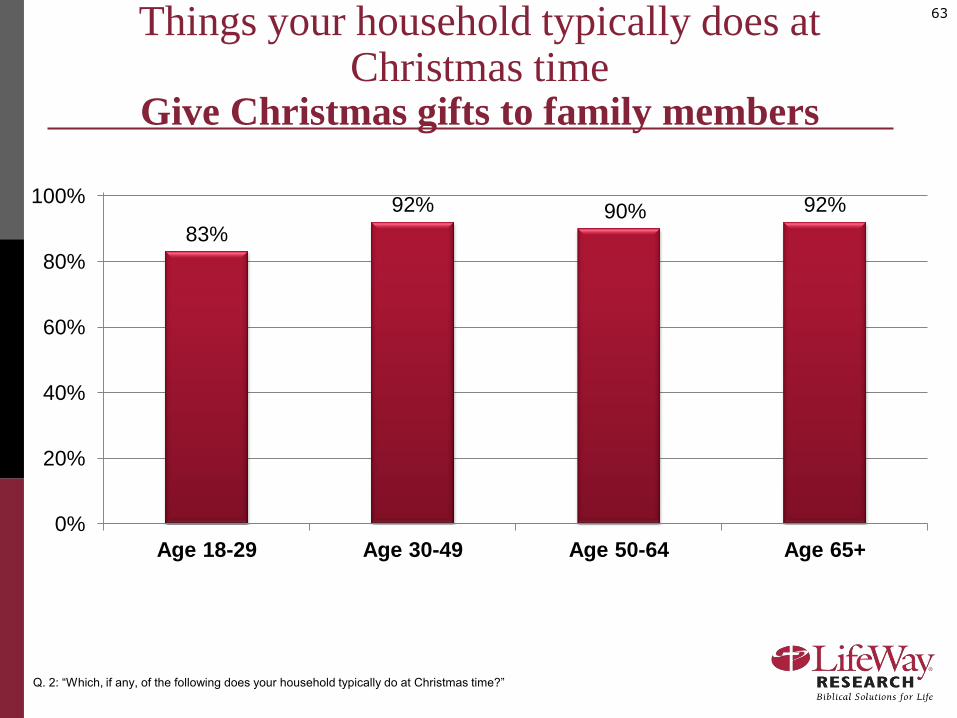
63Things your household typically does at Christmas time
Give Christmas gifts to family members
Q. 2: “Which, if any, of the following does your household typically do at Christmas time?”
83%
92% 90% 92%
0%
20%
40%
60%
80%
100%
Age 18-29 Age 30-49 Age 50-64 Age 65+
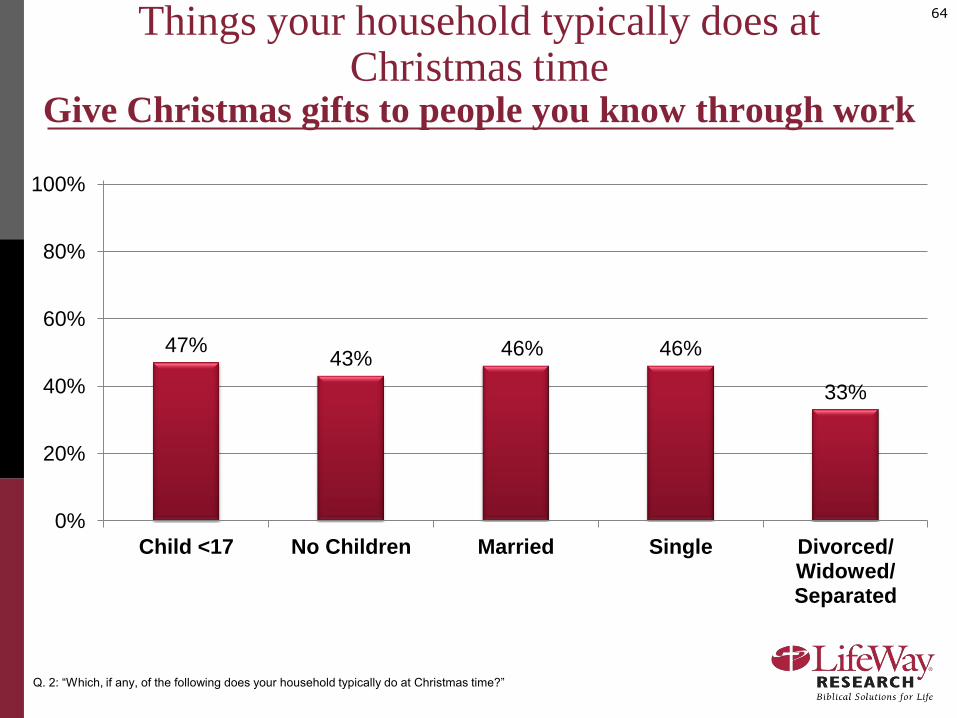
64Things your household typically does at Christmas time
Give Christmas gifts to people you know through work
Q. 2: “Which, if any, of the following does your household typically do at Christmas time?”
47%43%
46% 46%
33%
0%
20%
40%
60%
80%
100%
Child <17 No Children Married Single Divorced/ Widowed/ Separated
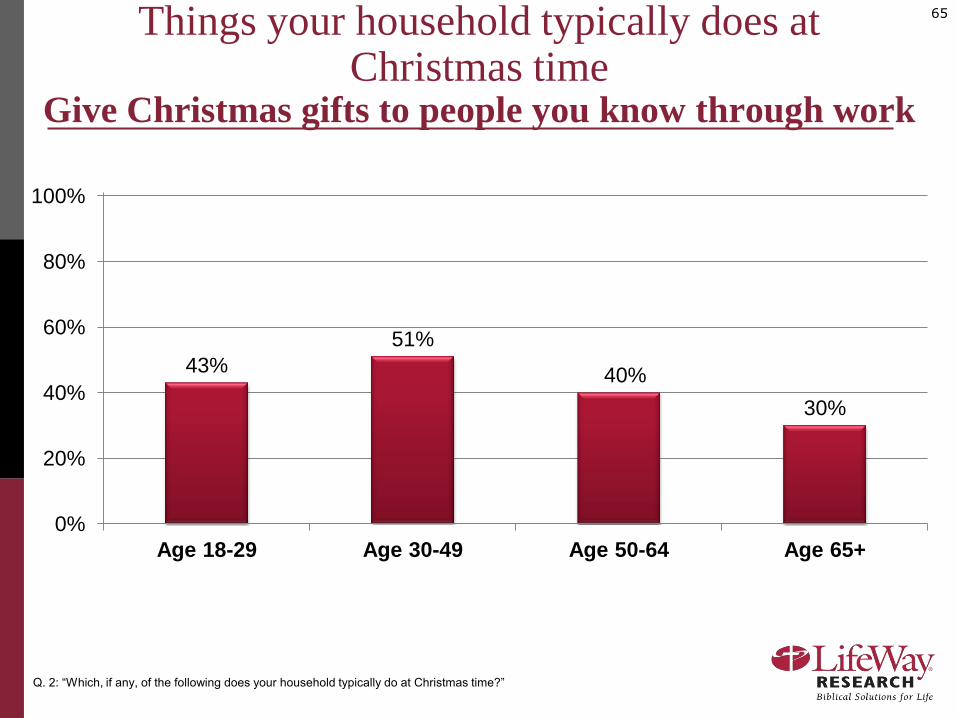
65Things your household typically does at Christmas time
Give Christmas gifts to people you know through work
Q. 2: “Which, if any, of the following does your household typically do at Christmas time?”
43%
51%
40%
30%
0%
20%
40%
60%
80%
100%
Age 18-29 Age 30-49 Age 50-64 Age 65+
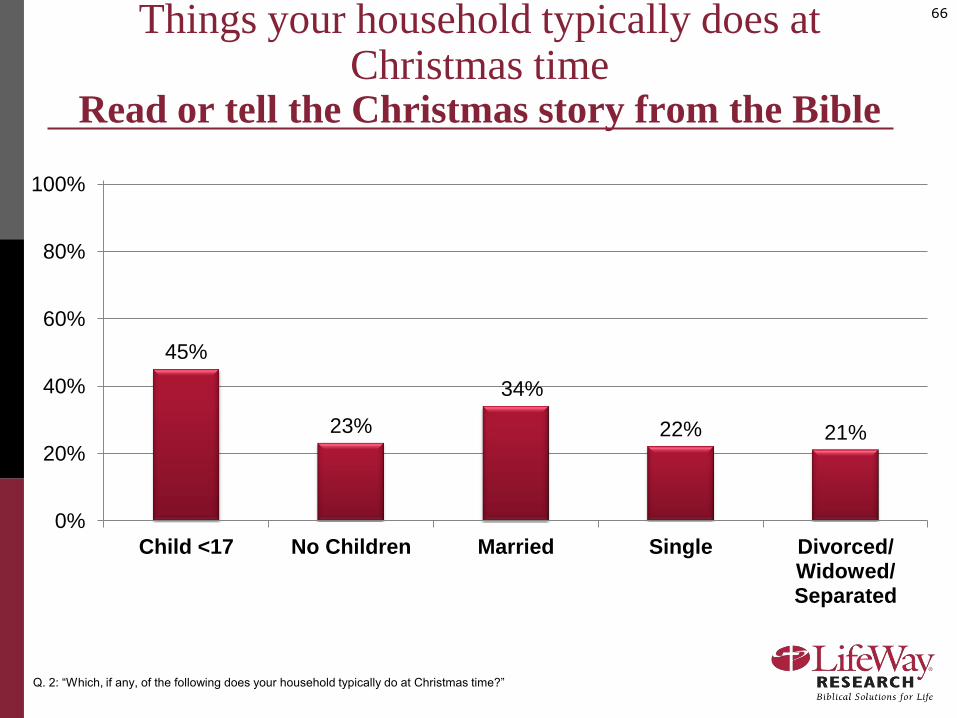
66Things your household typically does at Christmas time
Read or tell the Christmas story from the Bible
Q. 2: “Which, if any, of the following does your household typically do at Christmas time?”
45%
23%
34%
22% 21%
0%
20%
40%
60%
80%
100%
Child <17 No Children Married Single Divorced/ Widowed/ Separated
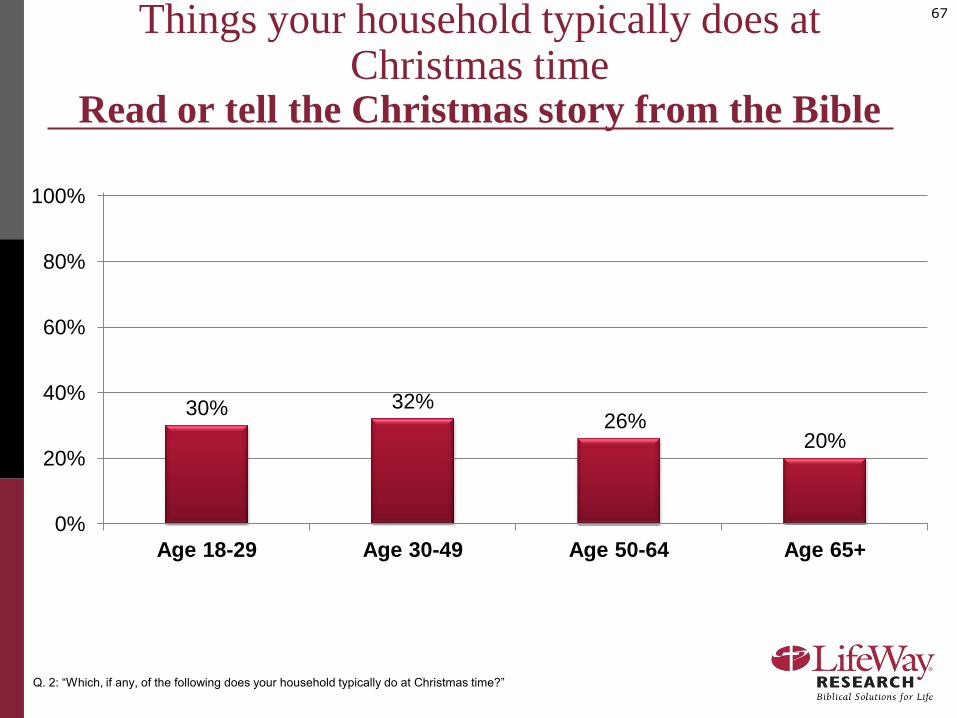
67Things your household typically does at Christmas time
Read or tell the Christmas story from the Bible
Q. 2: “Which, if any, of the following does your household typically do at Christmas time?”
30% 32%26%
20%
0%
20%
40%
60%
80%
100%
Age 18-29 Age 30-49 Age 50-64 Age 65+
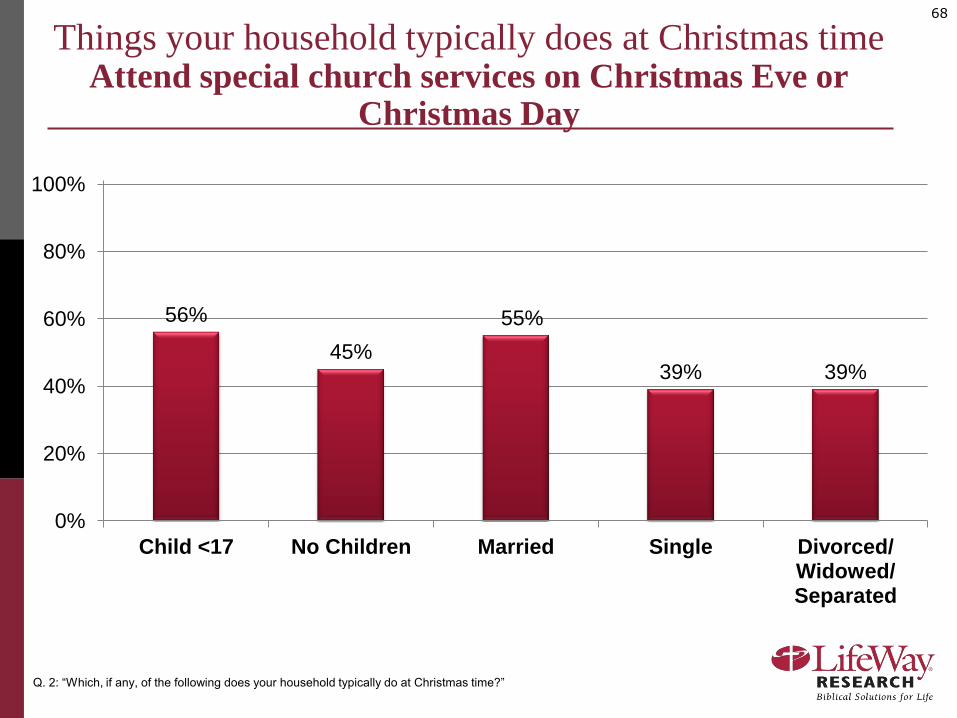
68
Things your household typically does at Christmas time Attend special church services on Christmas Eve or
Christmas Day
Q. 2: “Which, if any, of the following does your household typically do at Christmas time?”
56%
45%
55%
39% 39%
0%
20%
40%
60%
80%
100%
Child <17 No Children Married Single Divorced/ Widowed/ Separated
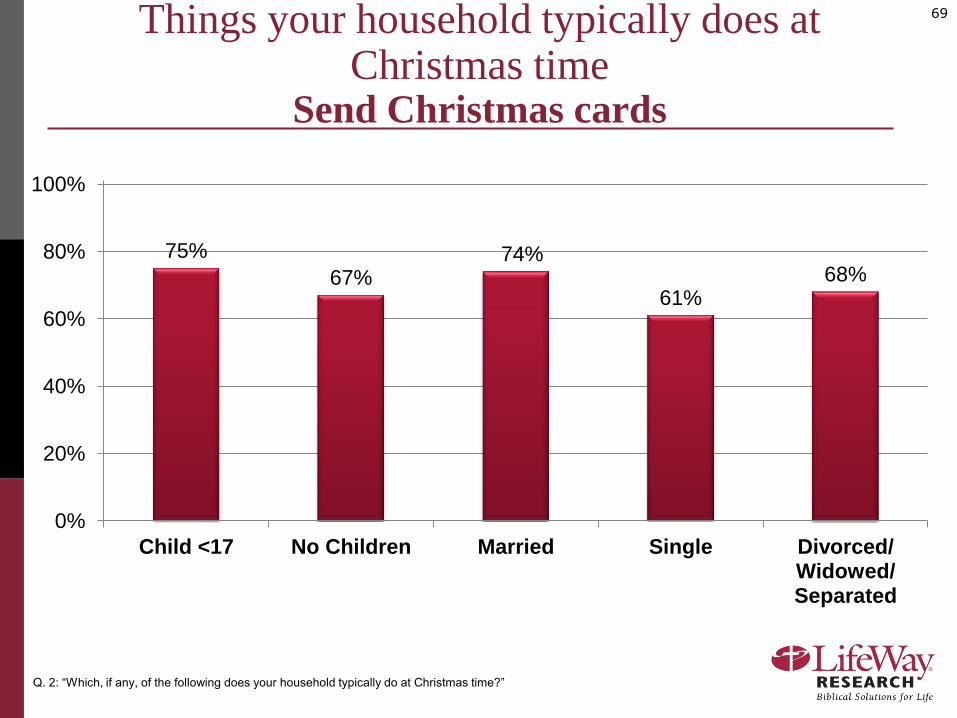
69Things your household typically does at Christmas time
Send Christmas cards
Q. 2: “Which, if any, of the following does your household typically do at Christmas time?”
75%
67%74%
61%68%
0%
20%
40%
60%
80%
100%
Child <17 No Children Married Single Divorced/ Widowed/ Separated
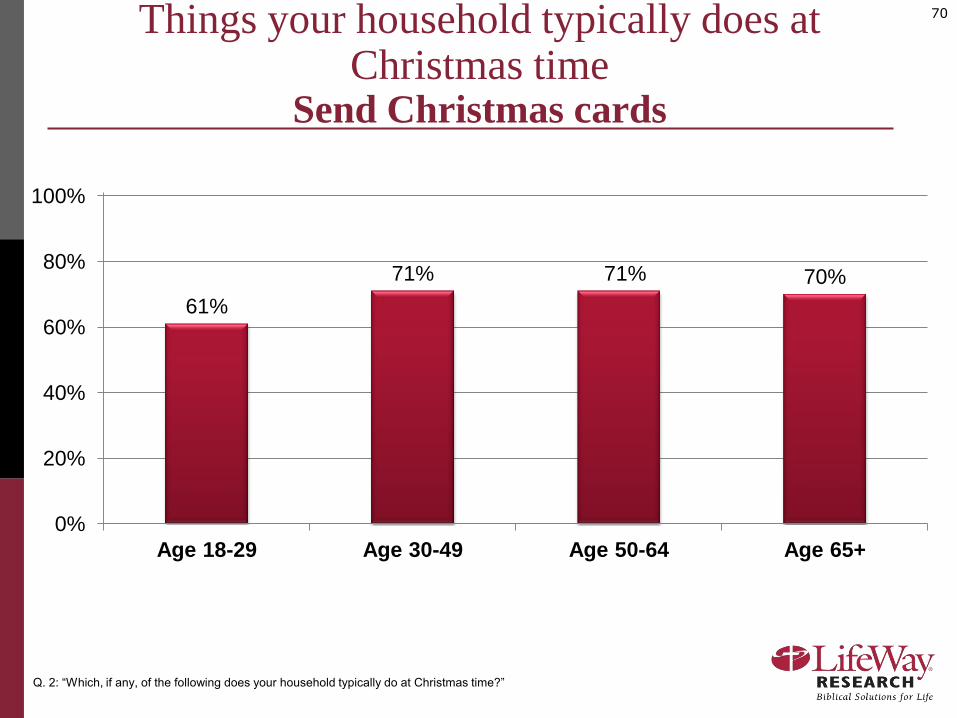
70Things your household typically does at Christmas time
Send Christmas cards
Q. 2: “Which, if any, of the following does your household typically do at Christmas time?”
61%
71% 71% 70%
0%
20%
40%
60%
80%
100%
Age 18-29 Age 30-49 Age 50-64 Age 65+
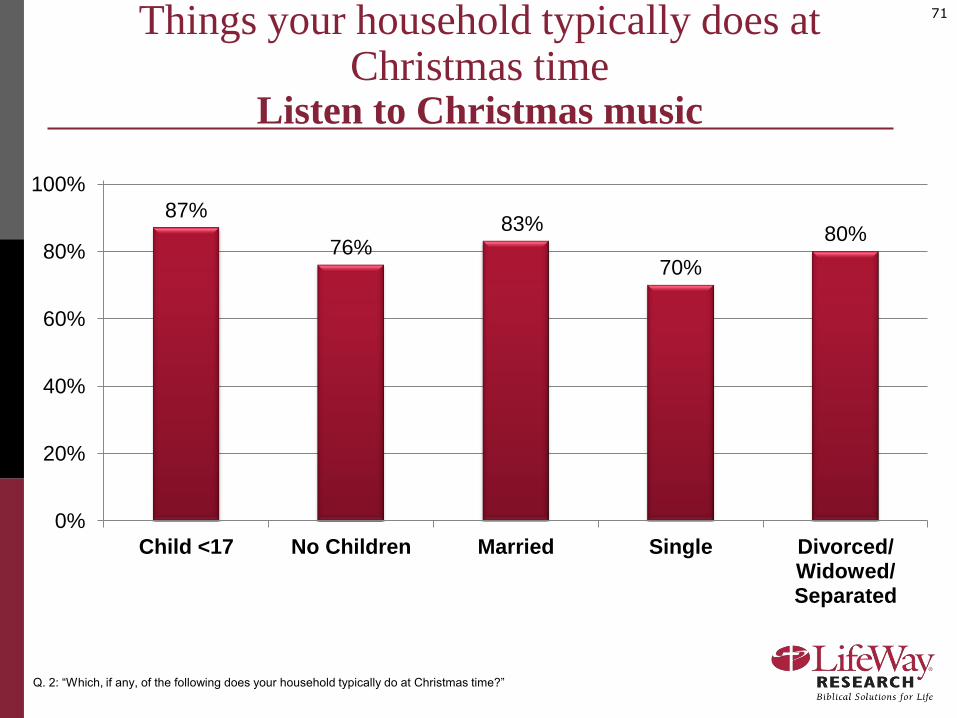
71Things your household typically does at Christmas time
Listen to Christmas music
Q. 2: “Which, if any, of the following does your household typically do at Christmas time?”
87%
76%83%
70%
80%
0%
20%
40%
60%
80%
100%
Child <17 No Children Married Single Divorced/ Widowed/ Separated
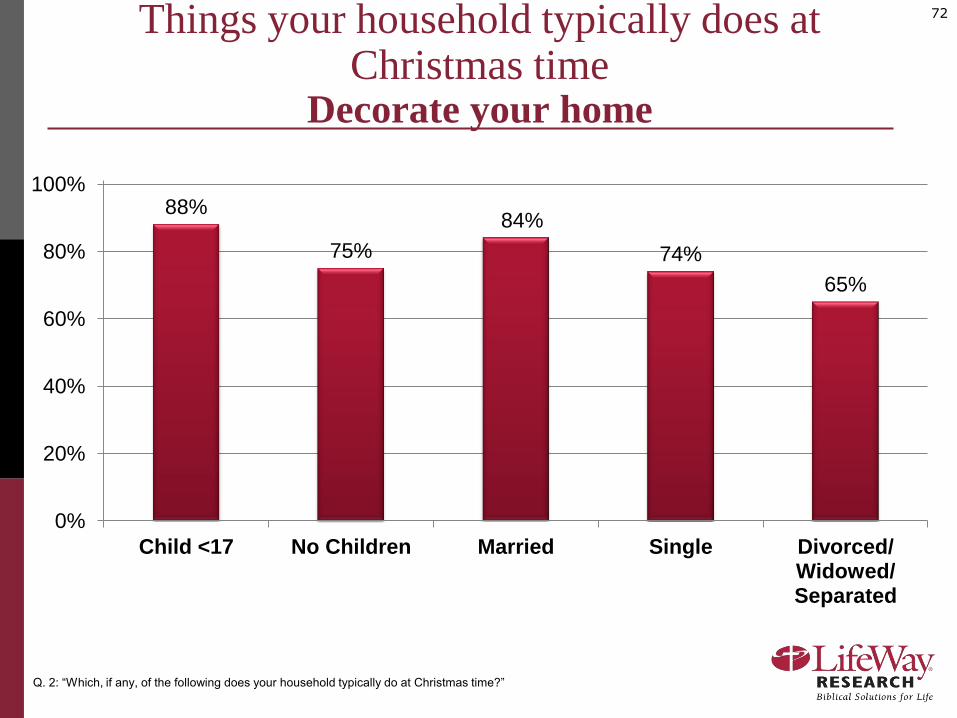
72Things your household typically does at Christmas time
Decorate your home
Q. 2: “Which, if any, of the following does your household typically do at Christmas time?”
88%
75%
84%
74%
65%
0%
20%
40%
60%
80%
100%
Child <17 No Children Married Single Divorced/ Widowed/ Separated
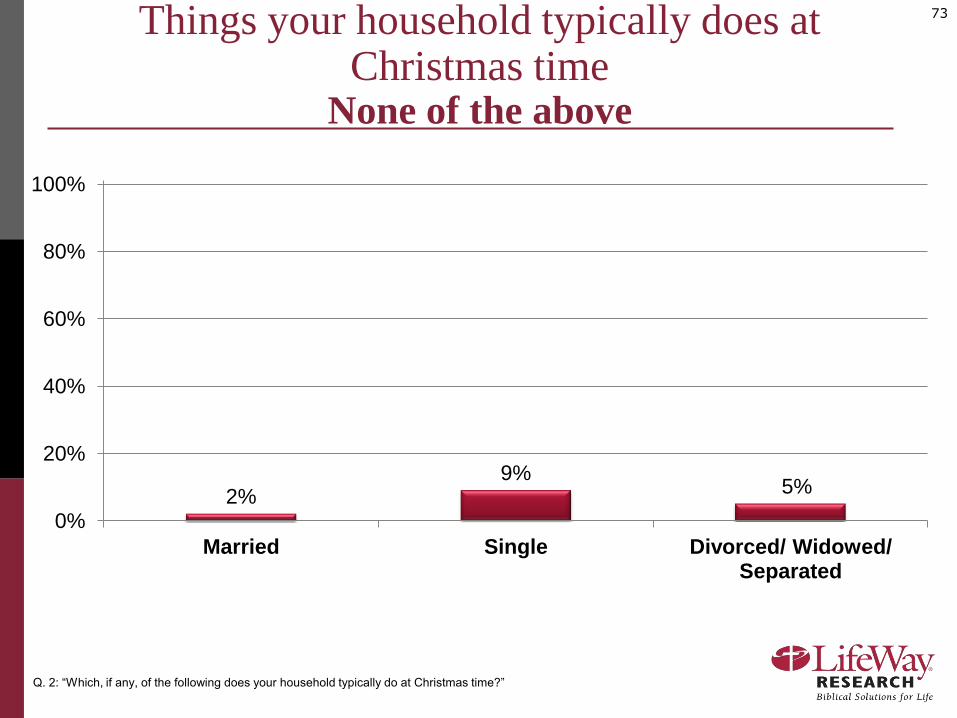
73Things your household typically does at Christmas time
None of the above
Q. 2: “Which, if any, of the following does your household typically do at Christmas time?”
2%9%
5%
0%
20%
40%
60%
80%
100%
Married Single Divorced/ Widowed/ Separated
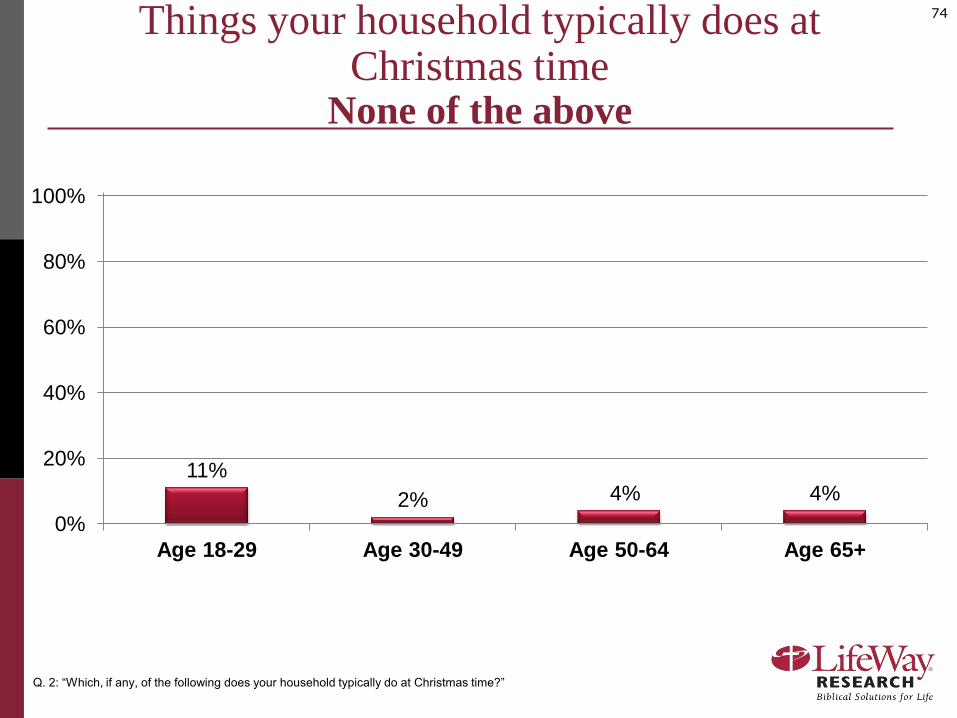
74Things your household typically does at Christmas time
None of the above
Q. 2: “Which, if any, of the following does your household typically do at Christmas time?”
11%
2% 4% 4%
0%
20%
40%
60%
80%
100%
Age 18-29 Age 30-49 Age 50-64 Age 65+
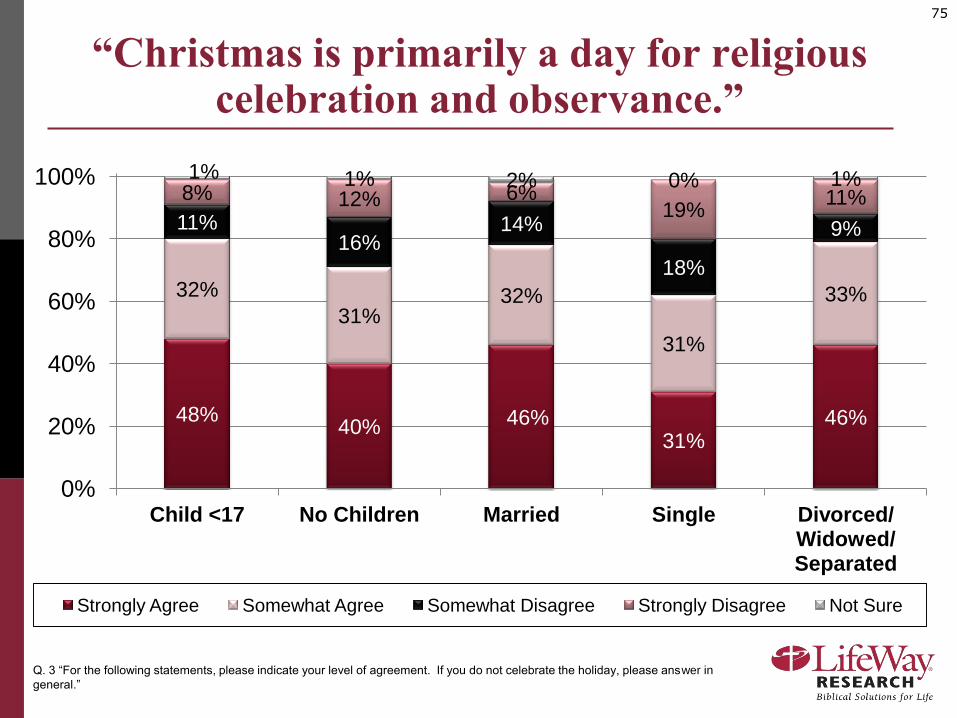
75
“Christmas is primarily a day for religious celebration and observance.”
Q. 3 “For the following statements, please indicate your level of agreement. If you do not celebrate the holiday, please answer in
general.”
48%40% 46%
31%46%
32%
31%32%
31%
33%
11%16%
14%
18%
9%
8% 12% 6%19%
11%
1% 1% 2% 0% 1%
0%
20%
40%
60%
80%
100%
Child <17 No Children Married Single Divorced/ Widowed/ Separated
Strongly Agree Somewhat Agree Somewhat Disagree Strongly Disagree Not Sure
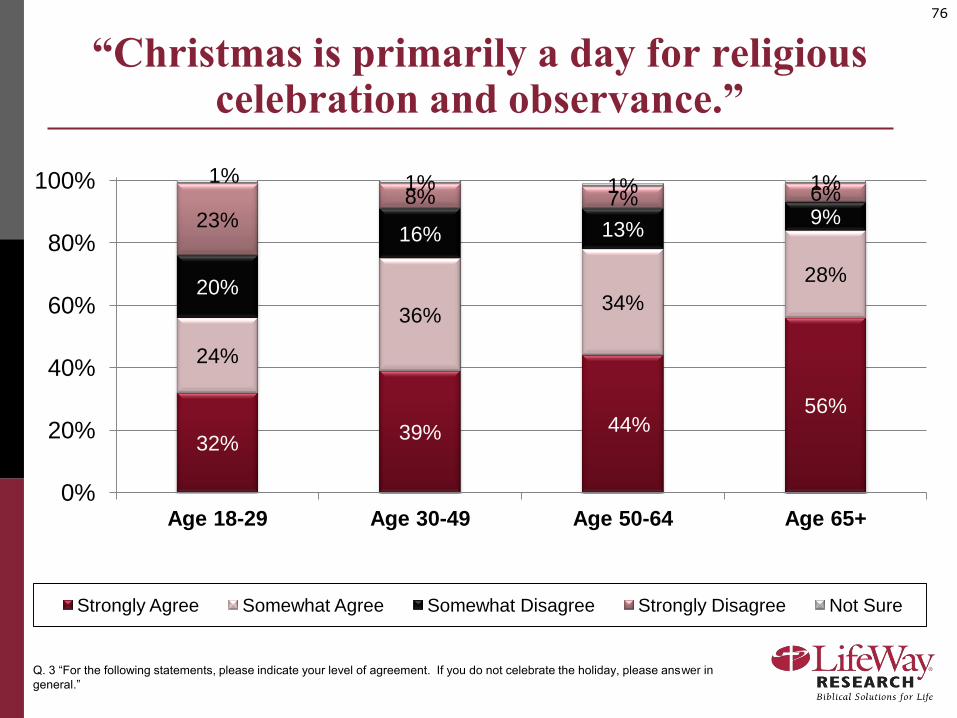
76
“Christmas is primarily a day for religious celebration and observance.”
Q. 3 “For the following statements, please indicate your level of agreement. If you do not celebrate the holiday, please answer in
general.”
32%39% 44%
56%
24%
36%34%
28%20%
16% 13%9%23%
8% 7% 6%1% 1% 1% 1%
0%
20%
40%
60%
80%
100%
Age 18-29 Age 30-49 Age 50-64 Age 65+
Strongly Agree Somewhat Agree Somewhat Disagree Strongly Disagree Not Sure
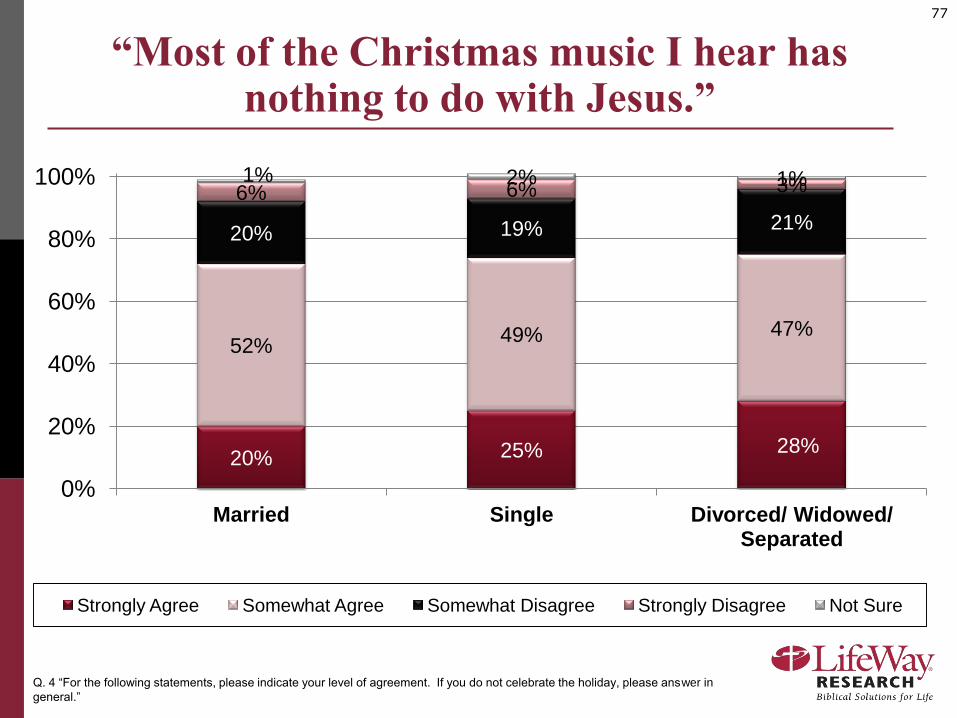
77
“Most of the Christmas music I hear has nothing to do with Jesus.”
Q. 4 “For the following statements, please indicate your level of agreement. If you do not celebrate the holiday, please answer in
general.”
20% 25% 28%
52%49% 47%
20% 19% 21%
6% 6% 3%1% 2% 1%
0%
20%
40%
60%
80%
100%
Married Single Divorced/ Widowed/ Separated
Strongly Agree Somewhat Agree Somewhat Disagree Strongly Disagree Not Sure
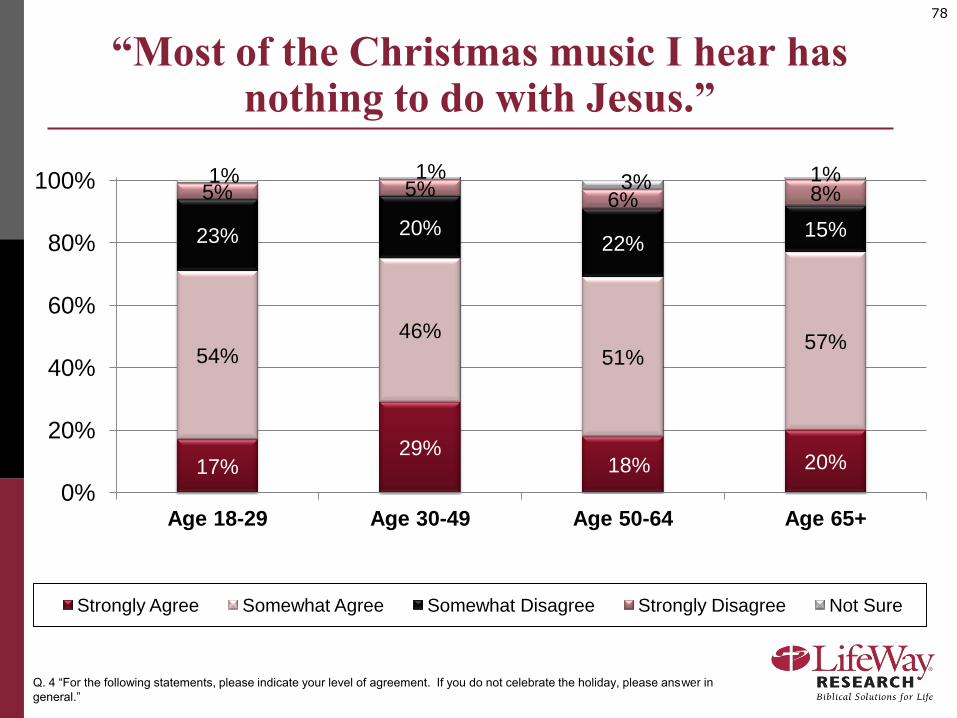
78
“Most of the Christmas music I hear has nothing to do with Jesus.”
Q. 4 “For the following statements, please indicate your level of agreement. If you do not celebrate the holiday, please answer in
general.”
17%29%
18% 20%
54%
46%
51%57%
23% 20%22%
15%
5% 5%6% 8%
1% 1%3% 1%
0%
20%
40%
60%
80%
100%
Age 18-29 Age 30-49 Age 50-64 Age 65+
Strongly Agree Somewhat Agree Somewhat Disagree Strongly Disagree Not Sure
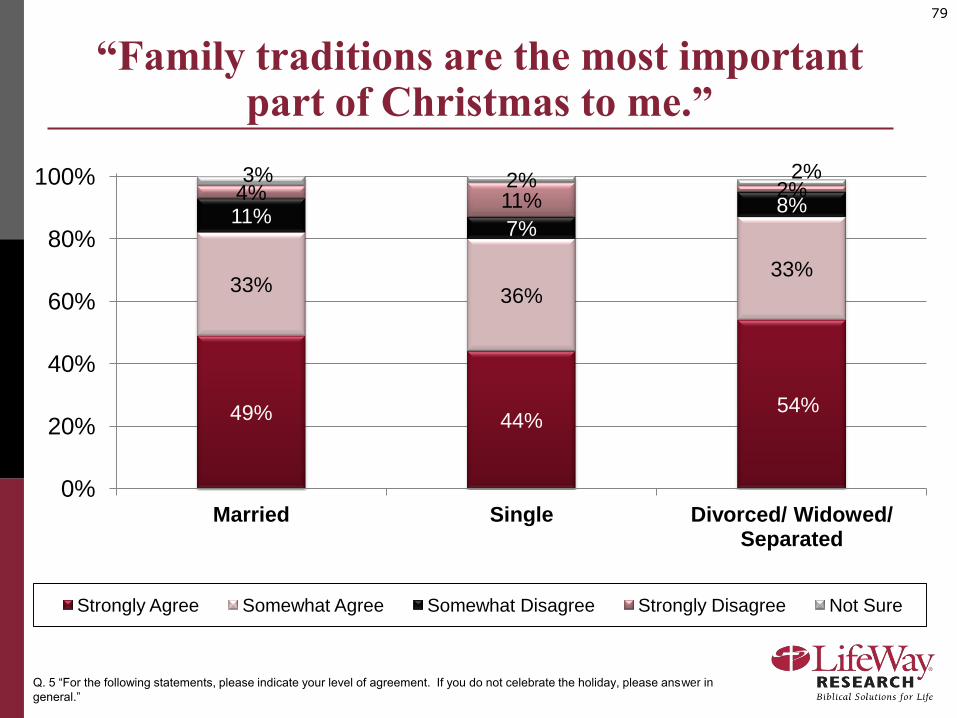
79
“Family traditions are the most important part of Christmas to me.”
Q. 5 “For the following statements, please indicate your level of agreement. If you do not celebrate the holiday, please answer in
general.”
49% 44%54%
33%36%
33%
11%7%
8%4% 11%
2%3% 2% 2%
0%
20%
40%
60%
80%
100%
Married Single Divorced/ Widowed/ Separated
Strongly Agree Somewhat Agree Somewhat Disagree Strongly Disagree Not Sure
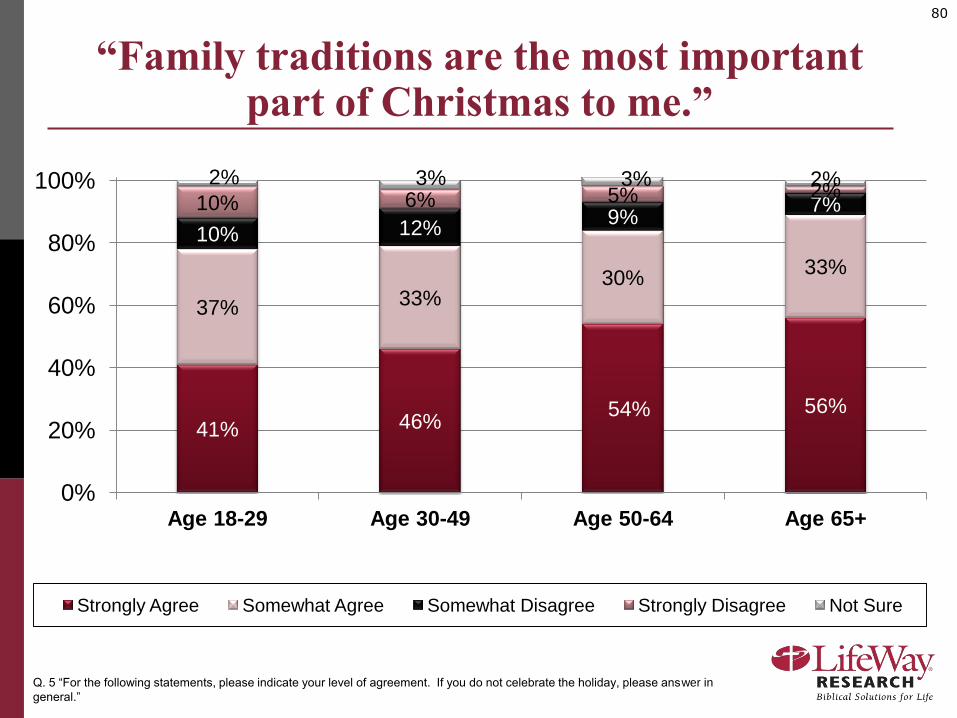
80
“Family traditions are the most important part of Christmas to me.”
Q. 5 “For the following statements, please indicate your level of agreement. If you do not celebrate the holiday, please answer in
general.”
41% 46%54% 56%
37% 33%30%
33%
10% 12%9%
7%10% 6% 5% 2%2% 3% 3% 2%
0%
20%
40%
60%
80%
100%
Age 18-29 Age 30-49 Age 50-64 Age 65+
Strongly Agree Somewhat Agree Somewhat Disagree Strongly Disagree Not Sure
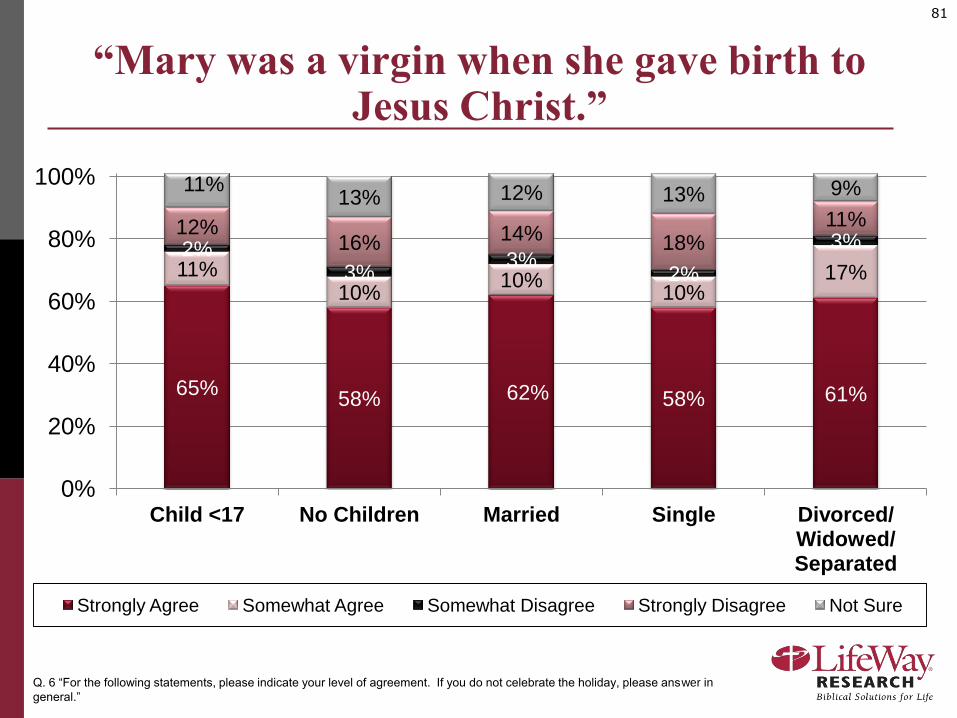
81
“Mary was a virgin when she gave birth to Jesus Christ.”
Q. 6 “For the following statements, please indicate your level of agreement. If you do not celebrate the holiday, please answer in
general.”
65%58% 62% 58% 61%
11%10%
10%10%
17%2%
3%3%
2%
3%12%
16% 14% 18%11%
11%13% 12% 13% 9%
0%
20%
40%
60%
80%
100%
Child <17 No Children Married Single Divorced/ Widowed/ Separated
Strongly Agree Somewhat Agree Somewhat Disagree Strongly Disagree Not Sure
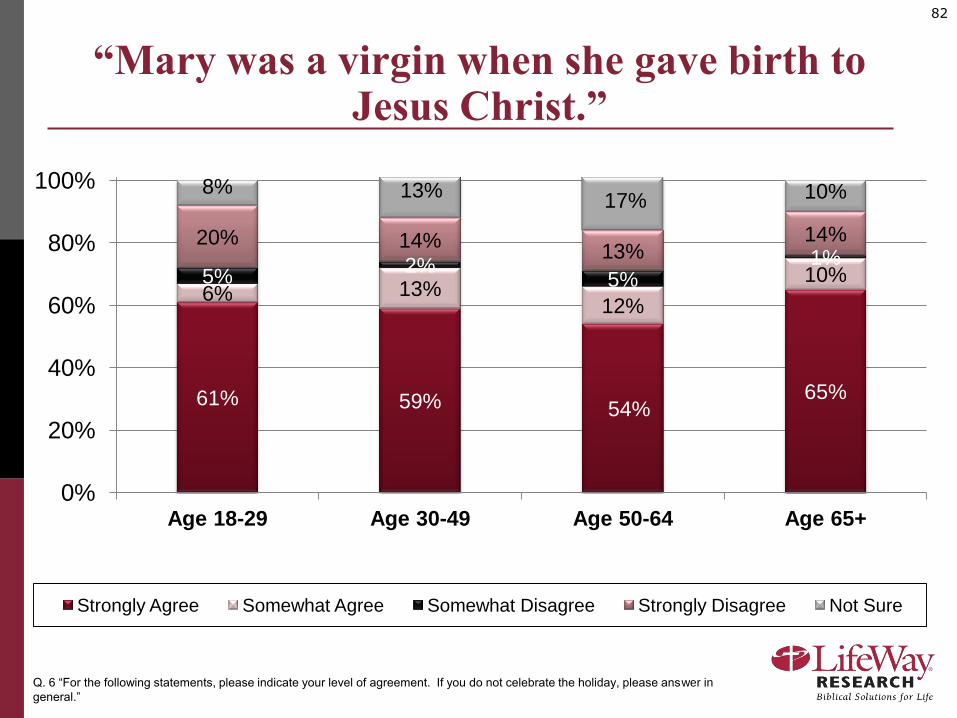
82
“Mary was a virgin when she gave birth to Jesus Christ.”
Q. 6 “For the following statements, please indicate your level of agreement. If you do not celebrate the holiday, please answer in
general.”
61% 59% 54%65%
6% 13%12%
10%5%2%
5%1%
20% 14%13%
14%
8% 13%17% 10%
0%
20%
40%
60%
80%
100%
Age 18-29 Age 30-49 Age 50-64 Age 65+
Strongly Agree Somewhat Agree Somewhat Disagree Strongly Disagree Not Sure
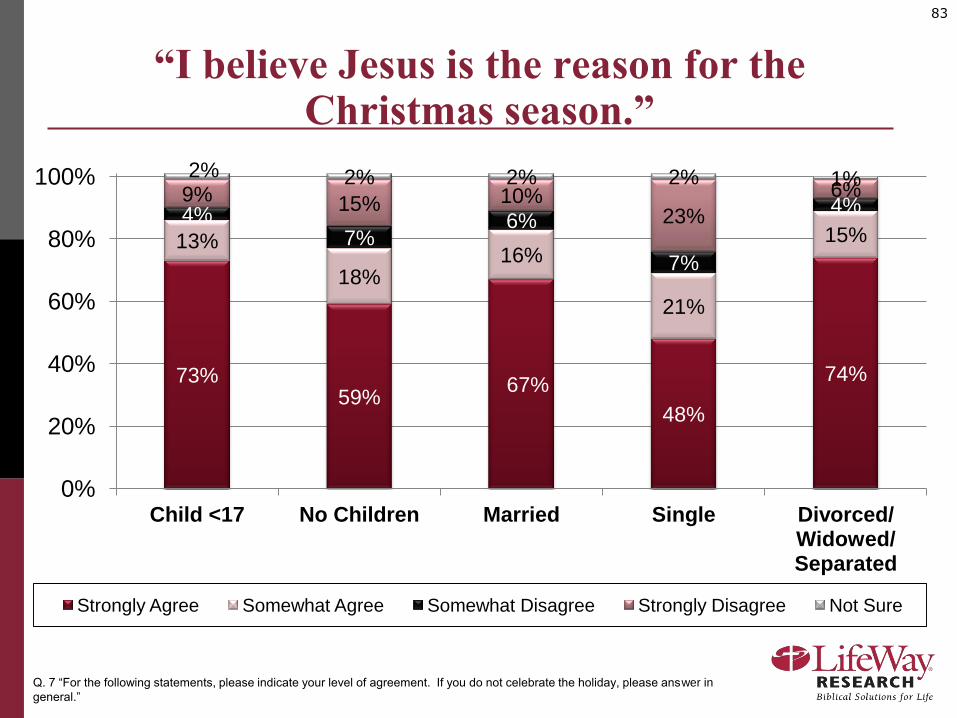
83
“I believe Jesus is the reason for the Christmas season.”
Q. 7 “For the following statements, please indicate your level of agreement. If you do not celebrate the holiday, please answer in
general.”
73%59%
67%
48%
74%
13%
18%16%
21%
15%4%
7%6%
7%
4%9% 15% 10%
23%
6%2% 2% 2% 2% 1%
0%
20%
40%
60%
80%
100%
Child <17 No Children Married Single Divorced/ Widowed/ Separated
Strongly Agree Somewhat Agree Somewhat Disagree Strongly Disagree Not Sure
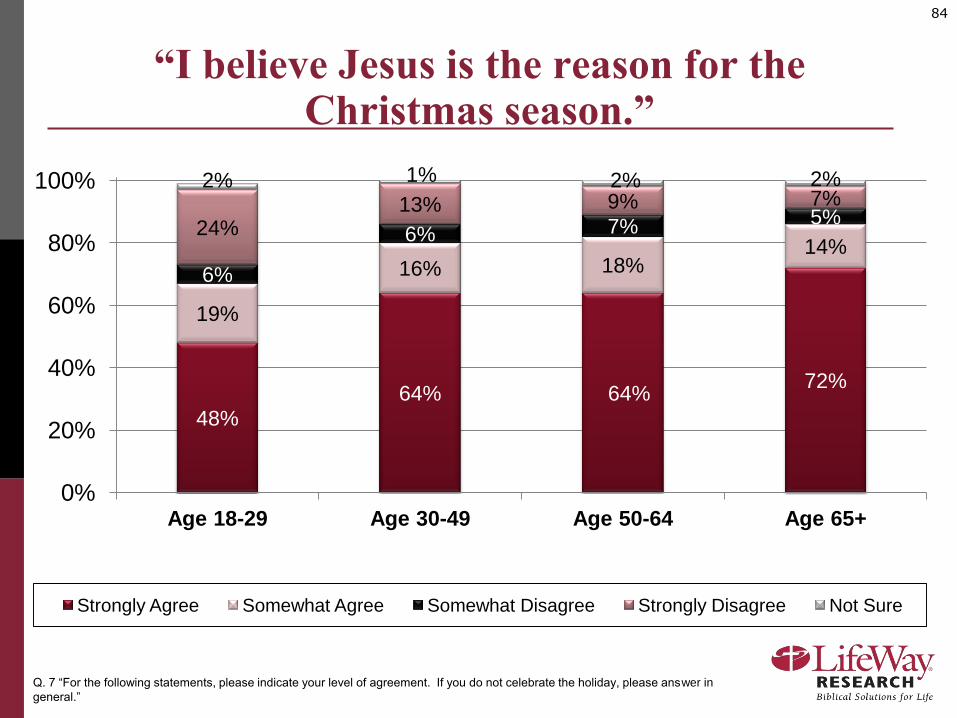
84
“I believe Jesus is the reason for the Christmas season.”
Q. 7 “For the following statements, please indicate your level of agreement. If you do not celebrate the holiday, please answer in
general.”
48%
64% 64%72%
19%
16% 18%14%
6%
6% 7% 5%24%
13% 9% 7%2% 1% 2% 2%
0%
20%
40%
60%
80%
100%
Age 18-29 Age 30-49 Age 50-64 Age 65+
Strongly Agree Somewhat Agree Somewhat Disagree Strongly Disagree Not Sure
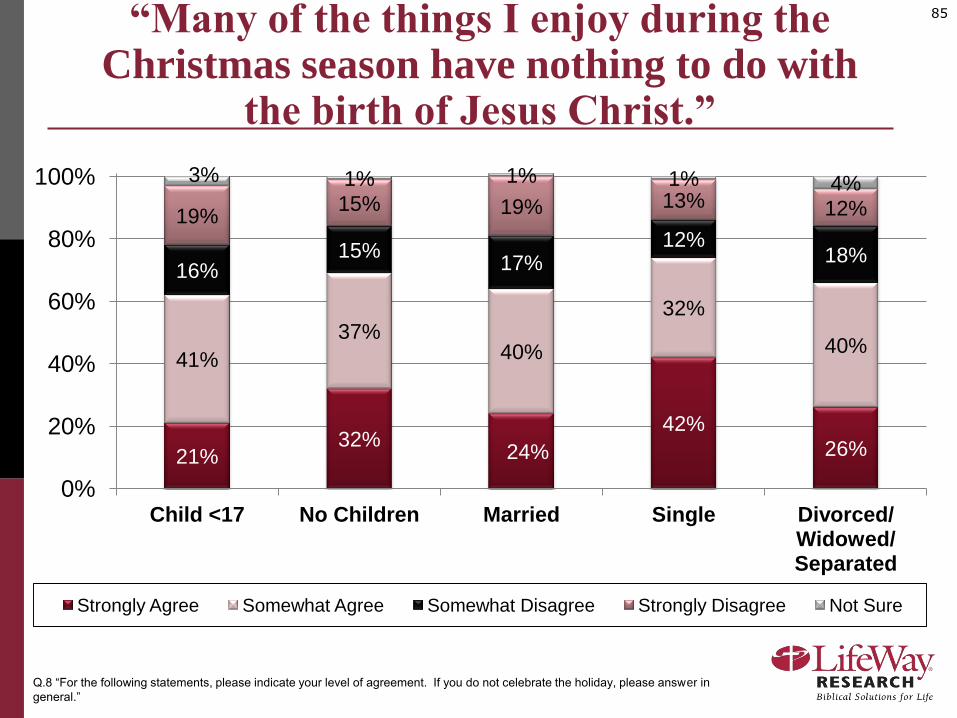
85“Many of the things I enjoy during the Christmas season have nothing to do with
the birth of Jesus Christ.”
Q.8 “For the following statements, please indicate your level of agreement. If you do not celebrate the holiday, please answer in
general.”
21%32%
24%
42%
26%
41%
37%40%
32%
40%
16%15%
17%12%
18%
19%15% 19% 13% 12%
3% 1% 1% 1% 4%
0%
20%
40%
60%
80%
100%
Child <17 No Children Married Single Divorced/ Widowed/ Separated
Strongly Agree Somewhat Agree Somewhat Disagree Strongly Disagree Not Sure
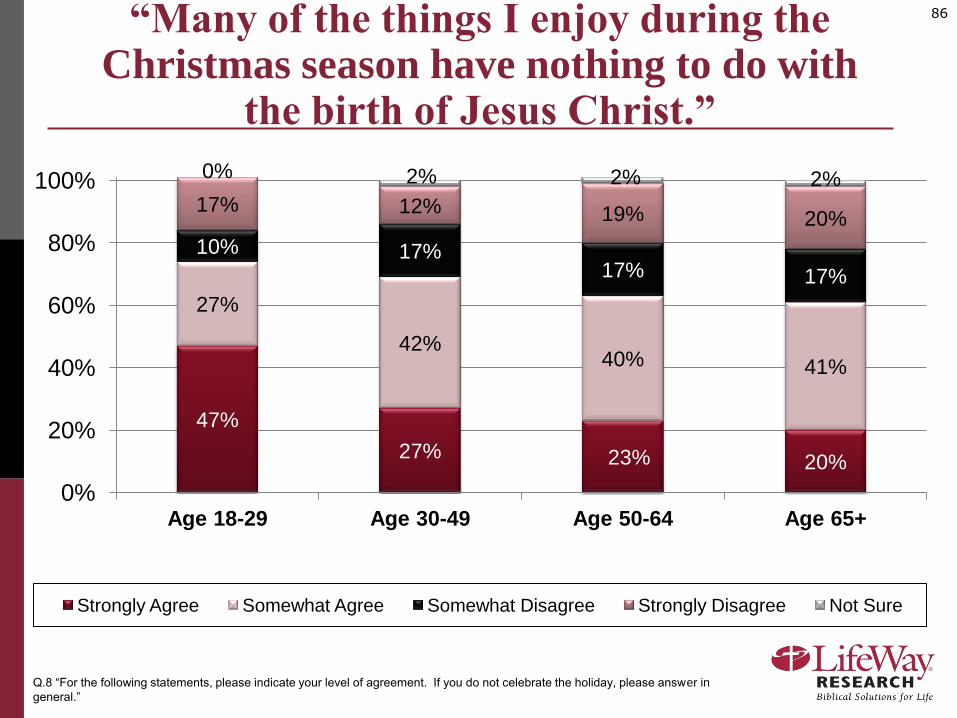
86“Many of the things I enjoy during the Christmas season have nothing to do with
the birth of Jesus Christ.”
Q.8 “For the following statements, please indicate your level of agreement. If you do not celebrate the holiday, please answer in
general.”
47%
27% 23% 20%
27%
42%40% 41%
10% 17%17% 17%
17% 12% 19% 20%
0% 2% 2% 2%
0%
20%
40%
60%
80%
100%
Age 18-29 Age 30-49 Age 50-64 Age 65+
Strongly Agree Somewhat Agree Somewhat Disagree Strongly Disagree Not Sure
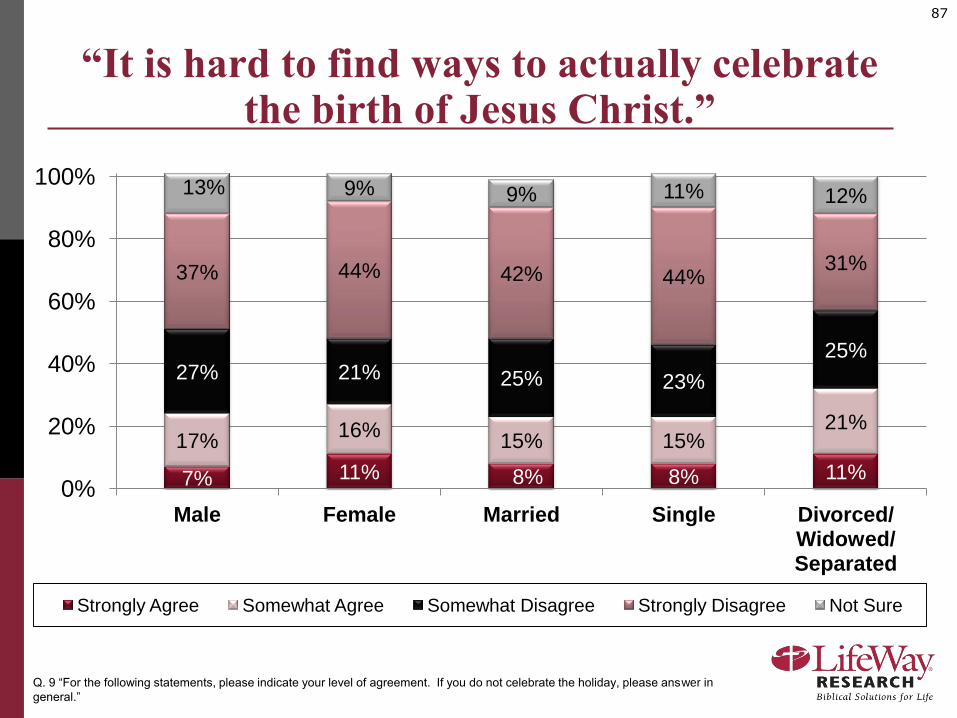
87
“It is hard to find ways to actually celebrate the birth of Jesus Christ.”
Q. 9 “For the following statements, please indicate your level of agreement. If you do not celebrate the holiday, please answer in
general.”
7% 11% 8% 8% 11%
17%16%
15% 15%21%
27% 21% 25% 23%
25%
37% 44% 42% 44%31%
13% 9% 9% 11% 12%
0%
20%
40%
60%
80%
100%
Male Female Married Single Divorced/ Widowed/ Separated
Strongly Agree Somewhat Agree Somewhat Disagree Strongly Disagree Not Sure
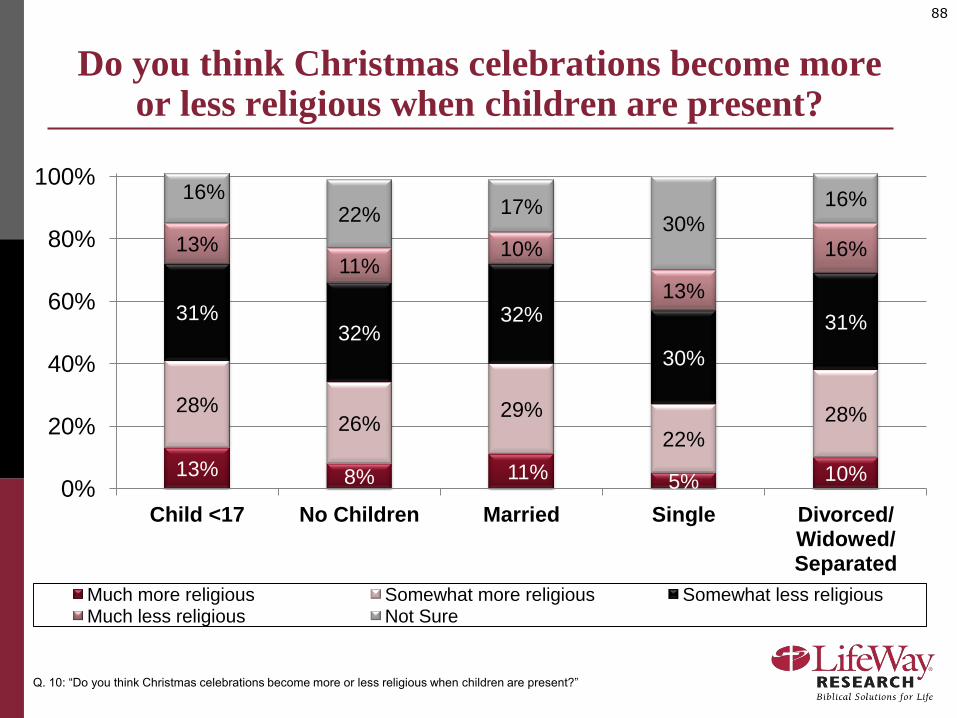
88
Do you think Christmas celebrations become more or less religious when children are present?
Q. 10: “Do you think Christmas celebrations become more or less religious when children are present?”
13% 8% 11% 5% 10%
28%26%
29%
22%
28%
31%32%
32%
30%
31%
13%11%
10%
13%
16%
16%22% 17%
30%
16%
0%
20%
40%
60%
80%
100%
Child <17 No Children Married Single Divorced/ Widowed/ Separated
Much more religious Somewhat more religious Somewhat less religiousMuch less religious Not Sure
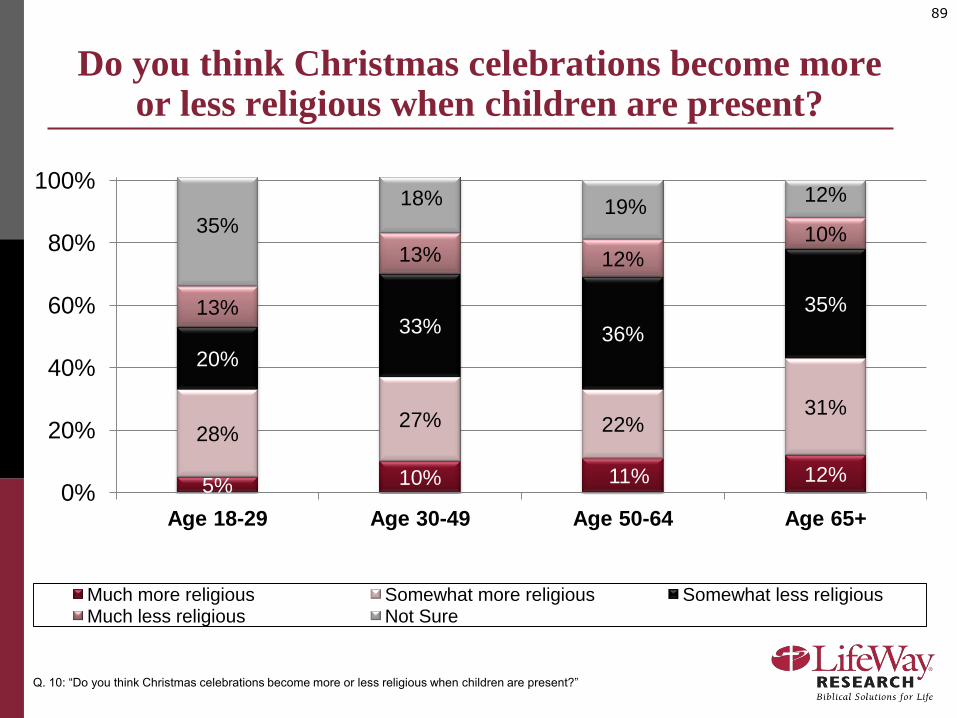
89
Do you think Christmas celebrations become more or less religious when children are present?
Q. 10: “Do you think Christmas celebrations become more or less religious when children are present?”
5% 10% 11% 12%
28%27% 22%
31%
20%
33% 36%
35%13%
13% 12%
10%35%
18% 19%12%
0%
20%
40%
60%
80%
100%
Age 18-29 Age 30-49 Age 50-64 Age 65+
Much more religious Somewhat more religious Somewhat less religiousMuch less religious Not Sure
How AmericansCelebrate Christmas
Survey of 2,110 Adult Americans