Embed Size (px)
Citation preview

1
1
How Brands GrowByron Sharp and Jenni Romaniuk
This chapter quickly ends the debate about whether sales growth comes from penetration (getting more customers) or loyalty (getting
customers to buy more). It documents the law of double jeopardy, with examples from a number of areas:
• emerging markets• industrial (business-to-business, or B2B)• services• durables• across local and global brands• a wide range of loyalty metrics.
We explain why double jeopardy occurs, and describe the conditions under which brands do, and do not, conform to the double jeopardy law.
01_ROM_HBG_96267_TXT_UB.indd 1 28/08/15 8:19 AM
Oxford
Univers
ity P
ress
Sample
Only
How Brands Grow, part 22
How to grow
‘Grow to survive’ is a marketing mantra. Even in high-growth markets, growing market share is necessary to gain scale, to match the marketing budgets of rivals, and to have a positive momentum story to explain to retailers why your product should be on shelves in the face of competition.
It’s easy for managers of small brands to waste time on inconsequential efforts or even damage the brand by unnecessary change. Likewise it is easy for managers of large brands to be lulled into complacency by consistently high metrics and allow a more nimble competitor to erode share. Throughout How Brands Grow Part 2, we highlight the important strategies marketers can use, but also the pitfalls that marketers can face.
In this chapter we’ll show how much penetration matters for growth and how loyalty metrics can be predicted from a brand’s penetration.
Can you engineer your brand loyalty?
A fundamental question of marketing strategy is whether to focus on improving the loyalty of existing customers or to try to win new customers. Logic says that both are ways to grow but logic alone often fails to tell us how the real world works. Are both equally attractive options for growth?
The loyalty path delivers extra sales revenue through existing customers buying more (and therefore less of competitors’ brands). Such a strategy might focus on improving the attractiveness of the brand to these customers: for example, through better service, rewarding loyalty with incentives or points, or offering existing customers related products or services (cross-selling).
Loyalty strategies are thought to lower marketing costs through having a much narrower advertising target, as existing customers are just a fraction of the market. Further, it is thought that, given these customers already buy the brand, they do not need as much encouragement or inducement to buy compared to non-buyers. This makes these additional sales cheaper, and if these buyers are cheaper to reach and cheaper to convert, the loyalty strategy generates a higher return on investment (ROI).
01_ROM_HBG_96267_TXT_UB.indd 2 28/08/15 8:19 AM
Oxford
Univers
ity P
ress
Sample
Only
CHapter 1 How Brands Grow 3
A similar strategy is to focus on customer retention, which offers the promise of increasing the size of the customer base though reducing customer defections. While not focusing on acquisition might sound like an odd way to grow a customer base, it is often claimed that a loyalty strategy will, as a by-product, create brand advocates who generate positive word of mouth that attracts new customers and, at least, maintains acquisition levels. Coupled with greater retention, this strategy should, hypothetically, grow the customer base. This rationale includes accepting the (mythical) claim that focusing on retention rather than acquisition is a cheaper way to maintain a customer base.
It turns out that all this speculation is for naught, and How Brands Grow (2010) presented decades of evidence that renders this question largely moot: brands grow by improving both penetration and loyalty, though typically far more sales growth comes from gains in penetration than improved loyalty. The question of whether strategy should therefore aim for loyalty or penetration has a very clear answer. Brands can enjoy higher loyalty, but only if they very substantially improve their penetration. A loyalty-first approach is simply not a growth strategy. Given how overwhelming the evidence, it is very surprising that many marketing consultants and academics still propose the sort of logic (and hopes) presented in the previous paragraphs.
Having one clear path to growth need not stifle creativity in marketing. Engineers build aeroplanes in different ways but all methods draw on the same scientific evidence as to which materials to use, and all aeroplane designers must work with the laws of motion and gravity. Similarly, marketing choices—about what media to advertise in, who to target, the creative direction of a campaign, the price point, and even the product formulation—need to work with the law-like patterns of competitive markets. All of these choices, if successful, will result in the same underlying pattern of growth. As a brand grows, it gains a predictable amount of penetration and loyalty for its market share. This real-world pattern is known as the law of double jeopardy.
01_ROM_HBG_96267_TXT_UB.indd 3 28/08/15 8:19 AM
Oxford
Univers
ity P
ress
Sample
Only
How Brands Grow, part 24
the law of double jeopardy
Double jeopardy was identified in the 1960s by a sociologist, William McPhee (McPhee, 1963). He noticed this phenomenon in attitudinal data: for example, less well-known radio announcers (the first jeopardy) are also less liked by those who know them (the second jeopardy).
A decade later Andrew Ehrenberg (1972) and Claude Martin (1973) independently documented this same pattern in brand choice: smaller share brands have fewer sales because they have many fewer customers (the first jeopardy) who are slightly less loyal (the second jeopardy).
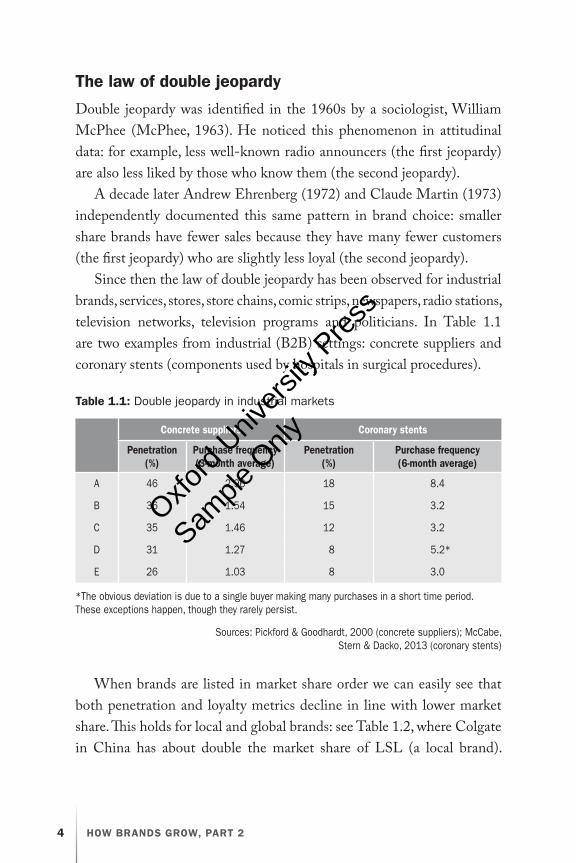
Since then the law of double jeopardy has been observed for industrial brands, services, stores, store chains, comic strips, newspapers, radio stations, television networks, television programs and politicians. In Table 1.1 are two examples from industrial (B2B) settings: concrete suppliers and coronary stents (components used by hospitals in surgical procedures).
table 1.1: double jeopardy in industrial markets
Concrete suppliers Coronary stents
penetration(%)
purchase frequency (3-month average)
penetration(%)
purchase frequency (6-month average)
a 46 2.96 18 8.4
B 36 1.54 15 3.2
C 35 1.46 12 3.2
d 31 1.27 8 5.2*
E 26 1.03 8 3.0
*The obvious deviation is due to a single buyer making many purchases in a short time period. These exceptions happen, though they rarely persist.
sources: Pickford & Goodhardt, 2000 (concrete suppliers); McCabe, stern & dacko, 2013 (coronary stents)
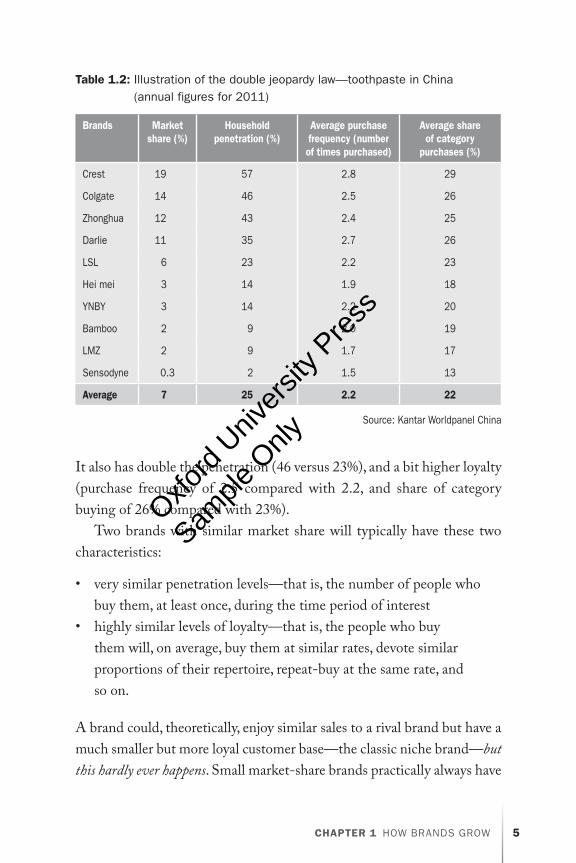
When brands are listed in market share order we can easily see that both penetration and loyalty metrics decline in line with lower market share. This holds for local and global brands: see Table 1.2, where Colgate in China has about double the market share of LSL (a local brand).
01_ROM_HBG_96267_TXT_UB.indd 4 28/08/15 8:19 AM
Oxford
Univers
ity P
ress
Sample
Only
CHapter 1 How Brands Grow 5
It also has double the penetration (46 versus 23%), and a bit higher loyalty (purchase frequency of 2.5 compared with 2.2, and share of category buying of 26% compared with 23%).
Two brands with similar market share will typically have these two characteristics:
• very similar penetration levels—that is, the number of people who buy them, at least once, during the time period of interest
• highly similar levels of loyalty—that is, the people who buy them will, on average, buy them at similar rates, devote similar proportions of their repertoire, repeat-buy at the same rate, and so on.
A brand could, theoretically, enjoy similar sales to a rival brand but have a much smaller but more loyal customer base—the classic niche brand—but this hardly ever happens. Small market-share brands practically always have
table 1.2: Illustration of the double jeopardy law—toothpaste in China (annual figures for 2011)
Brands Market share (%)
Household penetration (%)
average purchase frequency (number of times purchased)
average share of category
purchases (%)
Crest 19 57 2.8 29
Colgate 14 46 2.5 26
Zhonghua 12 43 2.4 25
darlie 11 35 2.7 26
LsL 6 23 2.2 23
Hei mei 3 14 1.9 18
YnBY 3 14 2.2 20
Bamboo 2 9 2.0 19
LMZ 2 9 1.7 17
sensodyne 0.3 2 1.5 13
average 7 25 2.2 22
source: Kantar worldpanel China
01_ROM_HBG_96267_TXT_UB.indd 5 28/08/15 8:19 AM
Oxford
Univers
ity P
ress
Sample
Only
How Brands Grow, part 26
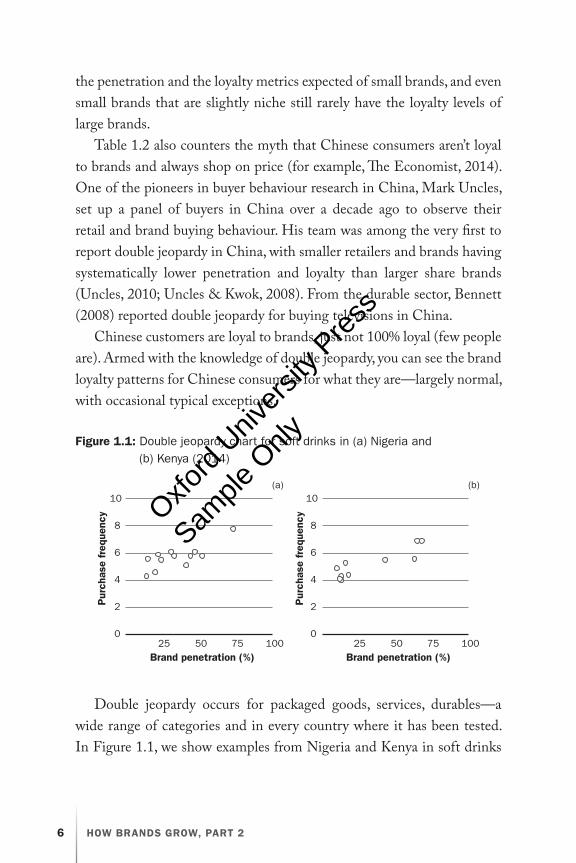
Double jeopardy occurs for packaged goods, services, durables—a wide range of categories and in every country where it has been tested. In Figure 1.1, we show examples from Nigeria and Kenya in soft drinks
the penetration and the loyalty metrics expected of small brands, and even small brands that are slightly niche still rarely have the loyalty levels of large brands.
Table 1.2 also counters the myth that Chinese consumers aren’t loyal to brands and always shop on price (for example, The Economist, 2014). One of the pioneers in buyer behaviour research in China, Mark Uncles, set up a panel of buyers in China over a decade ago to observe their retail and brand buying behaviour. His team was among the very first to report double jeopardy in China, with smaller retailers and brands having systematically lower penetration and loyalty than larger share brands (Uncles, 2010; Uncles & Kwok, 2008). From the durable sector, Bennett (2008) reported double jeopardy for buying televisions in China.
Chinese customers are loyal to brands, just not 100% loyal (few people are). Armed with the knowledge of double jeopardy, you can see the brand loyalty patterns for Chinese consumers for what they are—largely normal, with occasional typical exceptions.
0
2
25 50 75 100 25 50 75 100
4
6
8
10
Brand penetration (%) Brand penetration (%)
Pur
chas
e fr
eque
ncy
0
2
4
6
8
10
Pur
chas
e fr
eque
ncy
(a) (b)
Figure 1.1: double jeopardy chart for soft drinks in (a) nigeria and (b) Kenya (2014)
01_ROM_HBG_96267_TXT_UB.indd 6 28/08/15 8:19 AM
Oxford
Univers
ity P
ress
Sample
Only
CHapter 1 How Brands Grow 7
When brands grow or decline, their movements do not depart from the double jeopardy pattern. Gains (or losses) in market share conform to double jeopardy—so as brands gain (or lose) penetration their loyalty metrics also simultaneously adjust. This means that looking at a single annual or quarterly snapshot of brand performance metrics won’t reveal which brand is growing or declining. Researchers have looked at deviations from double jeopardy to see if this might foretell a brand’s movement and have found that it doesn’t (Kearns, Millar & Lewis, 2000). Brands do not, as commonly asserted, kick off growth with unusually high loyalty for their current size. Nor do we see brands develop unusually low loyalty (for their penetration) before they decline. Another marketing myth dies.
In other words, growing and declining brands look normal for their current market share. This means that in any category, two 10% share brands will each have similar penetrations and very similar loyalty
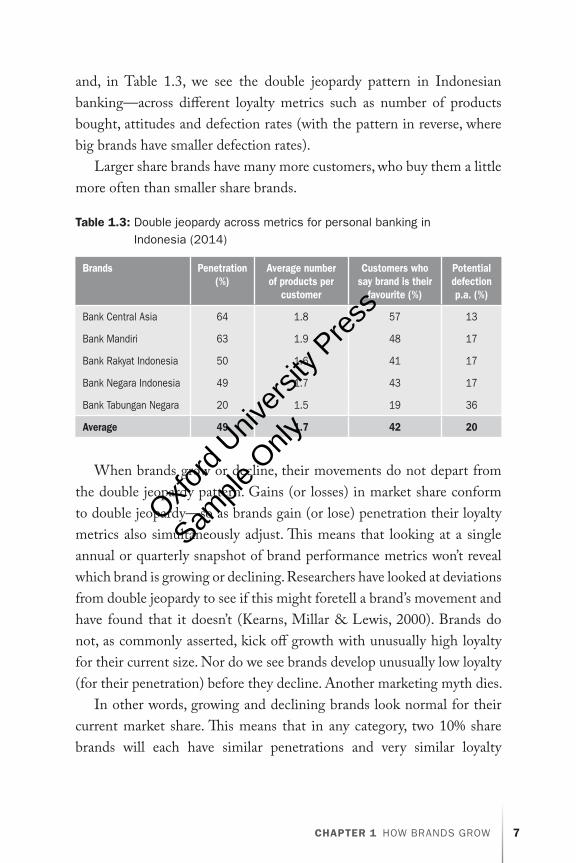
and, in Table 1.3, we see the double jeopardy pattern in Indonesian banking—across different loyalty metrics such as number of products bought, attitudes and defection rates (with the pattern in reverse, where big brands have smaller defection rates).
Larger share brands have many more customers, who buy them a little more often than smaller share brands.
table 1.3: double jeopardy across metrics for personal banking in Indonesia (2014)
Brands penetration (%)
average number of products per
customer
Customers who say brand is their
favourite (%)
potential defection p.a. (%)
Bank Central asia 64 1.8 57 13
Bank Mandiri 63 1.9 48 17
Bank rakyat Indonesia 50 1.6 41 17
Bank negara Indonesia 49 1.7 43 17
Bank Tabungan negara 20 1.5 19 36
average 49 1.7 42 20
01_ROM_HBG_96267_TXT_UB.indd 7 28/08/15 8:19 AM
Oxford
Univers
ity P
ress
Sample
Only

How Brands Grow, part 28
metrics—even if one brand was 11% last year and is headed downwards, and the other was 9% last year and is heading upwards. Currently they are both 10% brands so their metrics look like a 10% brand should. And when they move to a new level of market share, they look normal for that new level. This is another nail in the coffin for loyalty-focused growth strategies. If they did work, we would surely by now have evidence of a brand having excess loyalty that it parlayed into market-share growth.
What we have is clear evidence that the growth and decline in the size of a brand’s customer base (penetration) is due largely to unusual acquisition levels. Both growing and declining brands lose customers essentially in line with expected defection rates (as dictated by their respective market shares). It’s the level of acquisition that largely determines if brands grow or decline. If acquisition is higher than expected, the brand will grow; if it is lower than expected, the brand will decline (Riebe et al., 2014). Detroit’s loss of US market share to Japanese and then Korean brands was not due to collapsing retention rates, but rather because US car brands failed to win their usual share of customer acquisition (Sharp, 2009). You can only control one lever to grow penetration, and that is your acquisition rate.
We see double jeopardy in every category we explore, such as banking, insurance, retailers, social media sites, mobile phones, and B2B, and in every country from China to Russia, from Nigeria to South Africa, from Turkey to Indonesia. Indeed, testing has only been limited by data availability. But don’t just take our word for it: look in your own data—all you need to do is organise the brands by market share.
penetration rules!
Most changes in market share will show up as larger movements in penetration and smaller increases in loyalty metrics. This is the way double jeopardy says it has to be because most brands are a long way from owning most of the market (that is, more than 70% market share) and so have modest levels of penetration even if the metric is calculated
01_ROM_HBG_96267_TXT_UB.indd 8 28/08/15 8:19 AM
Oxford
Univers
ity P
ress
Sample
Only
CHapter 1 How Brands Grow 9
for a whole year1. It’s been shown many times that most brands sit on the low to middle part of the double jeopardy line (Allsopp, Sharp & Dawes, 2004; Ehrenberg, Goodhardt & Barwise, 1990; Uncles et al., 1994). A move from one position to another on the double jeopardy line then typically means large changes in penetration accompanied by small changes in loyalty.
Supporting this are studies of small market-share changes (such as from one year to the next) that have shown growth and decline reveal changes much more in penetration than brand loyalty (Anschuetz, 2002; Baldinger, Blair & Echambadi, 2002; McDonald & Ehrenberg, 2003; Romaniuk, Dawes & Nenycz-Thiel, 2014a, b; Sylvester, McQueen & Moore, 1994).
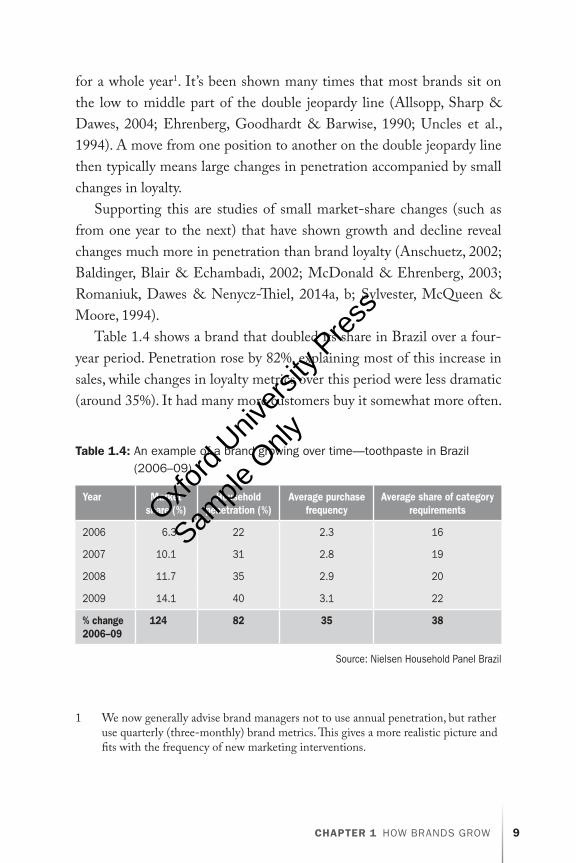
Table 1.4 shows a brand that doubled its share in Brazil over a four-year period. Penetration rose by 82%, explaining most of this increase in sales, while changes in loyalty metrics over this period were less dramatic (around 35%). It had many more customers buy it somewhat more often.
1 We now generally advise brand managers not to use annual penetration, but rather use quarterly (three-monthly) brand metrics. This gives a more realistic picture and fits with the frequency of new marketing interventions.
table 1.4: an example of a brand growing over time—toothpaste in Brazil (2006–09)
Year Market share (%)
Household penetration (%)
average purchase frequency
average share of category requirements
2006 6.3 22 2.3 16
2007 10.1 31 2.8 19
2008 11.7 35 2.9 20
2009 14.1 40 3.1 22
% change 2006–09
124 82 35 38
source: nielsen Household Panel Brazil
01_ROM_HBG_96267_TXT_UB.indd 9 28/08/15 8:19 AM
Oxford
Univers
ity P
ress
Sample
Only
How Brands Grow, part 210
The exceptions to double jeopardy can occur when brands have extremely high penetration, or are genuinely trapped in a niche, with a very high penetration of a very limited market (for example, brands that have only been able to secure regional distribution). In these circumstances brands will see their growth (or decline) reflected mostly in loyalty metrics simply because of the ceiling on penetration.
A niche brand simply has restricted growth potential. This makes large marketing investments unwise unless these limitations can be dealt with (such as securing more distribution). Niche brands should be pitied for their lack of potential, rather than celebrated. Small brands are better than niche brands—they can become big.
why does double jeopardy occur?
In competitive choice situations, where buyers have a range of not-too-dissimilar options to buy, brands still have large differences:
• mental availability—which is the propensity for the brand to be thought of in buying situations; and
• physical availability—which is how easy the brand is to buy and find.
We explore the underpinnings of mental and physical availability throughout How Brands Grow Part 2.
Large popular brands will have excellent mental and physical availability amongst the buying population. This means more people will buy them (higher penetration). Small brands will have far less mental and physical availability. Indeed some people don’t even know these brands exist, and many potential buyers seldom, if ever, notice them. Therefore fewer people buy them (lower penetration) in any time period.
But why do brands also vary in their loyalty scores, and vary systematically in line with their size? Again the answer lies in mental and physical availability and the fact that these combine to be the dominant driver of a brand’s market share. It means that very popular brands are
01_ROM_HBG_96267_TXT_UB.indd 10 28/08/15 8:19 AM
Oxford
Univers
ity P
ress
Sample
Only
CHapter 1 How Brands Grow 11
thought of by more people across more category-buying occasions, and are available to buy in some places where they are the sole brand (or one of very few). Similarly many light or infrequent buyers of the category don’t know of many brands, and the few brands these buyers do know are much more likely to be the larger brands.
Small brands unenviably find themselves in the opposite position. Fewer people know them and fewer know them well, while the people who do know them tend to be heavier category buyers—and these people also buy many other brands, including the big brands. Small brands are available in fewer outlets and these tend to be common locations (such as the largest supermarkets) where they are displayed alongside many other (larger) competitors.
The higher competition faced by small brands is illustrated in Figure 1.2 for fast food brands in Russia and South Korea. In both cases, a small brand’s customers buy many more other brands than the customers of big brands do. For example in Russia, customers of the biggest brand, McDonald’s, also buy from 2.6 other quick-service food brands; while in the same time period, customers of the much smaller Sbarro’s buy from more than twice as many brands (5.6). This law-like pattern is known as the natural monopoly law, a title that refers to the fact that larger share brands have a greater proportion of their customer base made up of light category buyers (and therefore monopolise the light category buyers).
These differences mean that the customers of smaller brands know about and buy many more options. Even if you a small brand for the first time and really like it, its competitive conditions make it a bit harder to remember that brand (mental availability) and, even if you do, a bit harder to find it (physical availability). Likewise if, sitting in McDonald’s, you decide that you really didn’t like the burger you just ate, the odds are you’ll still probably eat there again one day because it’s just so easy—McDonald’s is in your head, and it is widely physically available.
If the big difference (in terms of what drives choice) between the brands is their availability (mental and physical) then we have to have
01_ROM_HBG_96267_TXT_UB.indd 11 28/08/15 8:19 AM
Oxford
Univers
ity P
ress
Sample
Only

How Brands Grow, part 212
double jeopardy, where high penetration brands also enjoy slightly higher loyalty metrics.
If we refer back to our Indonesian banking example in Table 1.3 Bank Tabungan Negara (BTN) has a defection rate much higher than the other Indonesian banks listed. This is not because BTN’s customers are particularly unhappy or its service is bad—but simply a function of two factors:
• a limited product range focusing on loans for subsidised housing, rather than the more traditional product mix aiming towards transaction account customers, which constrains mental availability; and
• fewer branches (only 100 branches), compared to Bank Mandiri (around 2000 branches) and Bank Rakyat Indonesia (around 4000 branches), which constrains physical availability.
Much of the defection in financial services is driven by customers changing their circumstances—they move, get married, have children—and smaller brands with fewer locations, fewer branches and less well-known product ranges are particularly vulnerable to these changes, so they get higher defection (lower loyalty).
0
2
25 50 75 100 25 50 75 100
4
6
8
10
Brand penetration (%) Brand penetration (%)
0
2
4
6
8
10(a) (b)
Num
ber
of o
ther
bra
nds
boug
ht b
y cu
stom
ers
Num
ber
of o
ther
bra
nds
boug
ht b
y cu
stom
ers
Sbarro5%; 5.6
KFC73%; 4.6
Es Teler 7720%; 6.4
McDonald’s49%; 2.6
Figure 1.2: smaller share brands attract heavy category buyers for fast food in (a) russia and (b) south Korea (2014)
01_ROM_HBG_96267_TXT_UB.indd 12 28/08/15 8:19 AM
Oxford
Univers
ity P
ress
Sample
Only
CHapter 1 How Brands Grow 13
A brand’s loyalty levels relate to its penetration level; both are underpinned by mental and physical availability. This double jeopardy pattern wouldn’t occur if a brand were really differentiated from others, such that it appealed to or locked in a specific type of customer.
Store brands (for example, the brands of particular supermarket chains) are a commonly cited (mild) exception to double jeopardy. These brands have restricted penetration because they are stocked in only one chain. This means that store brand metrics often look like slight outliers to the double jeopardy pattern, with a niche pattern of lower penetration than expected and higher loyalty metrics (see also Dawes, 2013; Pare & Dawes, 2011)—though not if the metrics are calculated for sales within that store chain, within that chain’s shoppers. Then store brands enjoy largely normal levels of loyalty for their share in that chain’s sales.
Truong (2014) documented double jeopardy deviations across six emerging markets (Brazil, China, India, Indonesia, Malaysia and the Philippines). Across more than 450 brands in twenty repeat purchase categories, only 10% of brands deviated substantially from their expected loyalty level. No systematic exceptions existed in any of these categories:
• local brands• global brands• higher priced brands• discount brands• country of origin.
Half of the exceptions were dominant market leaders displaying a little ‘excess loyalty’, similar to that sometimes observed in developed markets (Fader & Schmittlein, 1993; Pare & Dawes, 2011). The remaining exceptions were split, with some having higher and others lower than expected loyalty, with no clear patterns or explanation.
Deviations from double jeopardy are therefore relatively unusual and, when they are present, they are not usually terribly dramatic or insightful. Deviating brands rarely command the sort of super loyalty that marketers
01_ROM_HBG_96267_TXT_UB.indd 13 28/08/15 8:19 AM
Oxford
Univers
ity P
ress
Sample
Only
How Brands Grow, part 214
dream of, unless the brand is already extremely dominant in penetration. In fact, for brands with unusual loyalty levels, the story usually isn’t one of stellar loyalty at all, but rather that the deviation simply reflects restricted penetration. For example, the geography of many emerging markets means that local brands are often regionally based, and lack full distribution across the country; this restricts their total market penetration, so their loyalty level can look high for this (low) penetration, similar to store brands only distributed in a single retail chain. This is often mistaken for strong loyalty.
On rare occasions brands have low loyalty for their level of penetration; this tends to be because they are bought for a particular occasion, need, or time of year. This often reveals an issue with category definition. For example, premium whisky brands, which are typically purchased for special occasions (fiftieth birthdays) or given as gifts, when analysed alongside standard whisky brands, look different. But, when mixed with other premium whisky brands, these brands look normal.
Interestingly, the conditions that would make a category depart from double jeopardy—highly differentiated brands each appealing to particular segments—are widely assumed by marketing theorists to be normal or commonplace. Unfortunately many market research reports fuel this misconception by routinely reporting (tiny) differences in brand customer base demographics, and showing charts that (misleadingly) suggest large perceived differentiation. If this really were the case, we would not have a double jeopardy law—but we do. In the real world, double jeopardy is everywhere and exceptions are usually small. Differentiation turns out to be slight, and of far less consequence than thought (for further evidence, see How Brands Grow). In line with this, substantive deviations from double jeopardy are uncommon and tend to be easily explained.
Double jeopardy is clearly evident in most markets, for most brands. This is not a pattern exclusive to the stable, mature markets that dominate the developed world. It is also evident in dynamic emerging markets, services, durables and even B2B markets. Even in categories with obvious functional differences between brands, we tend to see surprisingly small exceptions to the law of double jeopardy.
01_ROM_HBG_96267_TXT_UB.indd 14 28/08/15 8:19 AM
Oxford
Univers
ity P
ress
Sample
Only
CHapter 1 How Brands Grow 15
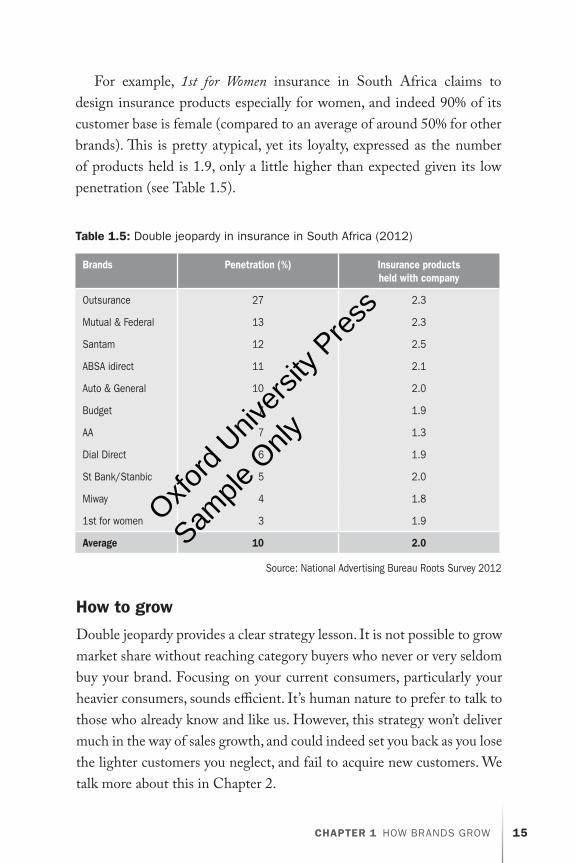
For example, 1st for Women insurance in South Africa claims to design insurance products especially for women, and indeed 90% of its customer base is female (compared to an average of around 50% for other brands). This is pretty atypical, yet its loyalty, expressed as the number of products held is 1.9, only a little higher than expected given its low penetration (see Table 1.5).
table 1.5: double jeopardy in insurance in south africa (2012)
Brands penetration (%) Insurance products held with company
outsurance 27 2.3
Mutual & Federal 13 2.3
santam 12 2.5
aBsa idirect 11 2.1
auto & General 10 2.0
Budget 7 1.9
aa 7 1.3
dial direct 6 1.9
st Bank/stanbic 5 2.0
Miway 4 1.8
1st for women 3 1.9
average 10 2.0
source: national advertising Bureau roots survey 2012
How to grow
Double jeopardy provides a clear strategy lesson. It is not possible to grow market share without reaching category buyers who never or very seldom buy your brand. Focusing on your current consumers, particularly your heavier consumers, sounds efficient. It’s human nature to prefer to talk to those who already know and like us. However, this strategy won’t deliver much in the way of sales growth, and could indeed set you back as you lose the lighter customers you neglect, and fail to acquire new customers. We talk more about this in Chapter 2.
01_ROM_HBG_96267_TXT_UB.indd 15 28/08/15 8:19 AM
Oxford
Univers
ity P
ress
Sample
Only

How Brands Grow, part 216
In emerging markets, a focus on current customers misses a great opportunity to capitalise on category expansion and attract these new category buyers to your brand. Winning a share of these new buyers is essential in order to enjoy the category growth. If a 10% share brand wants to stay a 10% share brand it must continuously win 10% of the new buyers entering the category.
The good news is that if you recruit them, and you have a product that is good enough to do the job it was bought to do, and you keep up mental and physical availability, then you will get repeat purchases. Loyalty will be a natural consequence of effective marketing that builds the customer base and grows penetration. The more effective your marketing is at building the customer base, the more loyalty you will receive.
dismantling barriers to market-share growth
The first step towards an evidence-based growth strategy is to remove any self-inflicted barriers. The organic growth occurring in some categories or markets can blind you to faults in your own strategy: sales are rising, revenue is looking good, but competitors may in effect be pushing you out of the market by reaching places or buyers you are ignoring. A growth-oriented strategy has to be a market penetration-oriented strategy. And tactics aimed at reaching out to new customers usually can’t help to also reach existing customers, who have a heightened tendency to notice the brand’s marketing activities (Harrison, 2013). Reaching out to non-customers and light customers does not neglect your current customer base, but strategies only aimed at your brand’s existing customer base can easily exclude non-buyers.
Beware of consultants selling you loyalty initiatives that promise to deliver growth by targeting your existing customers, or worse, your heaviest existing customers. One fad that was popular in developed economies was to sell loyalty programs and customer relationship management (CRM) software and staff training on the basis that it would stem defection and result in existing customers buying many more services. But both before and after this all started, cross-selling metrics obeyed the double jeopardy law.
01_ROM_HBG_96267_TXT_UB.indd 16 28/08/15 8:19 AM
Oxford
Univers
ity P
ress
Sample
Only
CHapter 1 How Brands Grow 17
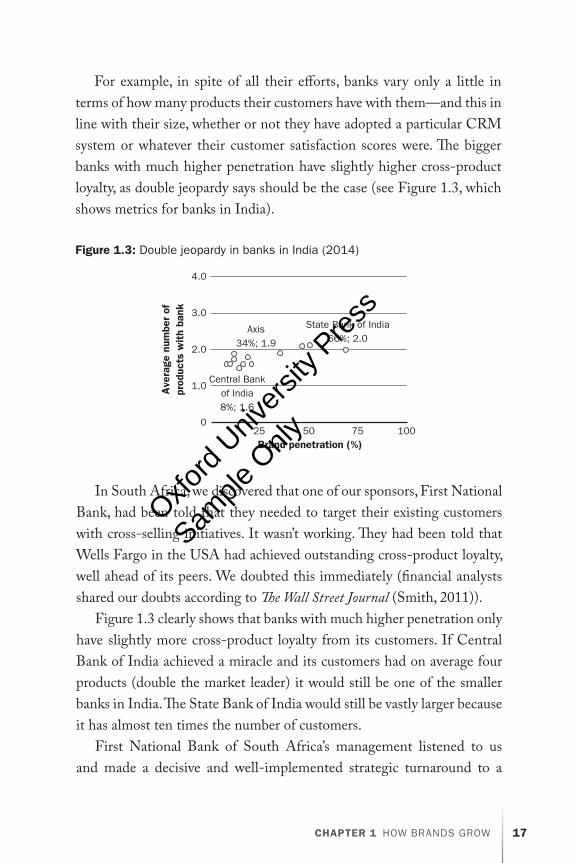
For example, in spite of all their efforts, banks vary only a little in terms of how many products their customers have with them—and this in line with their size, whether or not they have adopted a particular CRM system or whatever their customer satisfaction scores were. The bigger banks with much higher penetration have slightly higher cross-product loyalty, as double jeopardy says should be the case (see Figure 1.3, which shows metrics for banks in India).
0
1.0
25 50 75 100
2.0
3.0
4.0
Brand penetration (%)
Ave
rage
num
ber
ofpr
oduc
ts w
ith
bank
Central Bankof India8%; 1.6
Axis34%; 1.9
State Bank of India66%; 2.0
Figure 1.3: double jeopardy in banks in India (2014)
In South Africa, we discovered that one of our sponsors, First National Bank, had been told that they needed to target their existing customers with cross-selling initiatives. It wasn’t working. They had been told that Wells Fargo in the USA had achieved outstanding cross-product loyalty, well ahead of its peers. We doubted this immediately (financial analysts shared our doubts according to The Wall Street Journal (Smith, 2011)).
Figure 1.3 clearly shows that banks with much higher penetration only have slightly more cross-product loyalty from its customers. If Central Bank of India achieved a miracle and its customers had on average four products (double the market leader) it would still be one of the smaller banks in India. The State Bank of India would still be vastly larger because it has almost ten times the number of customers.
First National Bank of South Africa’s management listened to us and made a decisive and well-implemented strategic turnaround to a
01_ROM_HBG_96267_TXT_UB.indd 17 28/08/15 8:19 AM
Oxford
Univers
ity P
ress
Sample
Only

How Brands Grow, part 218
penetration strategy. They are now the second-largest and fastest-growing bank in South Africa. Over the past five years, a very difficult time for banks, FNB has grown its customer base from 5.8 to 7.5 million (a rise of 29%); meanwhile the number of products per customer has increased from just 2.03 to 2.1 (a rise of 3%) in line with double jeopardy. FNB is the market leader in mobile banking with a 33% share of the market despite its 23% share of all banking and it has added 1.3 million customers to its online banking offer, a rise of 27% in the twelve months ending September 2012. FNB was also voted the most innovative bank in the world (Finance Global Banking Awards, Washington DC, 2012), while Bernice Samuels, the chief marketing officer, was recognised as Marketing Personality of the Year. (See Bayne, Samuels & Sharp, 2014 for the full story.)
The conclusion is clear. The first place to look for growth barriers is your own marketing strategy—it may be holding you back. Another place to look for penetration barriers are impediments to purchase. Is anything making it difficult to buy or use your brand? Do you have varieties to suit most buyers? Are you too expensive for the mainstream customer?
In the USA people live in houses and drive cars that are very large by emerging market standards. This allows them to buy large packages and in quantities that are impractical in other countries (where in the house could they be stored?)—these are barriers to penetration in some countries. In Thailand, a great market for haircare products, premium Western brands are desirable, but large bottles were beyond the weekly budget of many households. Companies like L’Oréal, Unilever and Procter & Gamble found success in offering much smaller packages of their brands. This might seem slightly counter-intuitive from a developed market perspective, as smaller packages mean that the product is more expensive per gram. Why would you market a more expensive product to people who weren’t wealthy? But the smaller product lowers the overall price of purchase, the entry cost, which was a key barrier to penetration. Now millions could buy it, as an occasional treat, and it could be bought more regularly by hair-conscious teenagers, who were never going to save up for a large pricey bottle.
01_ROM_HBG_96267_TXT_UB.indd 18 28/08/15 8:19 AM
Oxford
Univers
ity P
ress
Sample
Only

CHapter 1 How Brands Grow 19
Our colleague Johan Bruwer has studied barriers to wine consumption in both developed and emerging markets. The biggest barrier in all markets is the perceived complexity in purchasing and consuming wine, compared to other alcoholic beverages. If buyers don’t know brands or grape varieties this makes purchase difficult, even intimidating. The need for (and potential return from) wine education, for retailers and consumers, is obvious (Ovington et al., 2014), though not to all wine marketers. In India, amongst the population who drink alcohol, wine is perceived as a beverage for particular consumption situations—social and celebratory situations—and this limits purchase opportunities. For wine consumption to rise, consumers need to see people drinking wine in other situations, ideally more everyday situations.
Someone once predicted that wine would not move beyond its perception as drink for a ‘special occasions’ in the USA until wine was made in all fifty states. Today that is true (though it did take almost 300 years of wine production), and the USA is now the world’s largest market for wine.
Interestingly the similarities of potential wine drinkers in a country like India far outweigh the differences with potential wine drinkers in Australia, the USA and the UK. The only clear difference is Indian consumers’ fear of encountering fake wine, currently a real problem in this market (as in other alcohol categories such as whisky), and a barrier to penetration.
Meaningful loyalty metrics
Knowing about double jeopardy has the added practical value of giving loyalty metrics context and meaning. For example, it reveals if you have a niche or change-of-pace brand: both are deviations you may need to try to fix. If these deviations can’t be fixed, then investment can be structured to reflect the brand’s limited potential for growth.
01_ROM_HBG_96267_TXT_UB.indd 19 28/08/15 8:19 AM
Oxford
Univers
ity P
ress
Sample
Only
How Brands Grow, part 220
Conclusion
The law of double jeopardy holds in emerging and developed markets, for services and products, in consumer and industrial categories. It has held for decades and continues to do so even as the markets globalise, and digital and mobile offerings change how we engage with and buy brands. Even in categories such as financial services, with state ownership of banks and much regulation, we see double jeopardy.
Consequently, for a brand to grow it needs to grow its market penetration, through broadening mental and physical availability. Targeted strategies to build loyalty without simultaneously having a much larger effect on the brand’s penetration are unlikely to succeed. Focusing too much on loyalty, either by trying to build it or imagining it doesn’t exist and thinking that you therefore need to ‘buy’ customers every time with price promotions or loyalty incentives, are costly distractions that brands can ill afford.
Double jeopardy exists because consumers are naturally loyal and because they are choosing between competitive (similar) offerings that vary a great deal in mental and physical availability from person to person and across the whole market.
Don’t assume that any special characteristics about a brand will confer on it a loyalty advantage. If the brand does deviate from double jeopardy, search for impediments to penetration (such as lack of distribution in key regions or channels) as these may be what makes the loyalty metrics look high. And these impediments will limit growth potential.
The double jeopardy law tells us that brand growth depends on reaching non-customers and light customers. In Chapter 2, we’ll look at these buyers. We’ll discuss their strategic importance and the marketing challenges of reaching and refreshing the mental structures of many low-value customers.
01_ROM_HBG_96267_TXT_UB.indd 20 28/08/15 8:19 AM
Oxford
Univers
ity P
ress
Sample
Only
CHapter 1 How Brands Grow 21
FurtHer readInG on tHe douBle jeopardY law
Important claims require serious evidence, hence the many data sets in this
chapter. Those interested in delving deeper or simply seeing the wide range
of conditions under which the double jeopardy law has been documented (for
example, attitudes, behaviour, industrial, services, durables, retail stores, voting,
media) may wish to read the following peer-reviewed journal articles.
Bennett, dag & Graham, Charles 2010, ‘Is loyalty driving growth for the brand in
front? a two-purchase analysis of car category dynamics in Thailand’, Journal
of Strategic Marketing, vol. 18, no. 7, pp. 573–85.
Bhat, s & Fox, r 1996, ‘an investigation of jeopardy effects in store choice’,
Journal of Retailing and Consumer Services, vol 3, no. 3, pp. 129–33.
donthu, n 1994, ‘double jeopardy in television program choice’, Journal of the
Academy of Marketing Science, vol. 22, no. 2, pp. 180–5.
Ehrenberg, andrew 1972, Repeat Buying: Theory and Applications, american
Elsevier, new York.
Ehrenberg, andrew 1991, ‘Politicians’ double jeopardy: a pattern and exceptions’,
Journal of the Market Research Society, vol. 33, no. 1, pp. 347–53.
Ehrenberg, andrew & Goodhardt, Gerald 2002, ‘double jeopardy revisited, again’,
Marketing Insights, Marketing Research, spring, pp. 40–2.
Ehrenberg, andrew, Goodhardt, Gerald & Barwise, Patrick 1990, ‘double jeopardy
revisited’, Journal of Marketing, vol. 54 (July), pp. 82–91.
Mcdowell, ws & dick, sJ 2001, ‘Using TV daypart double jeopardy effects to
boost advertising efficiency’, Journal of Advertising Research, vol. 41, no. 6,
pp. 43–51.
Mcdowell, ws & dick, sJ 2005, ‘revealing a double jeopardy effect in radio
station audience behavior’, Journal of Media Economics, vol. 18, no. 4,
pp. 271–84.
Martin, C., Jr 1973 ‘The theory of double jeopardy’, Journal of the Academy of
Marketing Science, vol. 1, no. 2, pp. 148–56.
Michael, JH & smith, PM 1999, ‘The theory of double jeopardy: an example from
a forest products industry’, Forest Products Journal, vol. 49, no. 3, pp. 21–6.
01_ROM_HBG_96267_TXT_UB.indd 21 28/08/15 8:19 AM
Oxford
Univers
ity P
ress
Sample
Only

How Brands Grow, part 222
sharp, Byron & riebe, Erica 2005, ‘does triple jeopardy exist for retail
chains?’, Journal of Empirical Generalisations in Marketing Science, vol. 9,
<www.empgens.com/articlesHome/articles.html>, viewed 7 July 2015.
solgaard, H, smith, d & schmidt, M 1998, ‘double jeopardy patterns for political
parties’, International Journal of Public Opinion Research, vol. 10, no. 2,
pp. 109–20.
Uncles, Mark & Lee, d 2006, ‘Brand purchasing by older consumers: an
investigation using the Juster scale and the dirichlet model’, Marketing
Letters, vol. 17, no. 1, pp. 17–29.
wright, Malcolm, sharp, anne & sharp, Byron 1998, ‘are australasian brands
different?’, Journal of Brand and Product Management, vol. 7, no. 6,
pp. 465–80.
(a full reference list is at the end of this book.)
01_ROM_HBG_96267_TXT_UB.indd 22 28/08/15 8:19 AM
Oxford
Univers
ity P
ress
Sample
Only